Article

Evaluating the Role of Next-Generation Productive Forces in Mitigating Carbon Lock-In: Evidence from Regional Disparities in China

1
Business School, Beijing Information Science and Technology University, Beijing 100192, China
2
Department of Building Environment and Energy Engineering, The Hong Kong Polytechnic University, Hong Kong, China
3
School of Economics, Northwest University of Political Science and Law, Xi’an 710122, China
4
Faculty of Social Sciences, Tsinghua University, Beijing 100084, China
5
Department of Chemical Engineering, School of Engineering, The University of Manchester, Manchester M13 9PL, UK
*
Author to whom correspondence should be addressed.
Sustainability 2025, 17(9), 4241; https://doi.org/10.3390/su17094241
Submission received: 17 February 2025 / Revised: 15 April 2025 / Accepted: 25 April 2025 / Published: 7 May 2025

Abstract

:
Carbon lock-in (CLI), defined as the structural persistence of fossil-fuel-based systems, poses a significant barrier to decarbonization. As CLI continues to impede China’s progress toward carbon neutrality, understanding the role of next-generation productive forces (NGPFs) in breaking this path dependence has become increasingly urgent; however, it remains underexplored in empirical research. This study examines the impact of NGPFs on CLI using provincial panel data from 2012 to 2022. Composite indices for NGPFs and CLI are constructed using the entropy weight method. The analysis applies instrumental variable estimation (IV-GMM) to address potential endogeneity, feasible generalized least squares (FGLS) to account for heteroskedasticity, and spatial Durbin models (SDMs) to capture spatial dependence. In addition, quantile regression is used to explore distributional effects, and subsample regressions are conducted to assess regional heterogeneity. The results show that (1) a 1% increase in NGPFs leads to approximately a 0.9643% reduction in CLI, effectively mitigating CLI. (2) NGPF levels are high in Beijing, Shanghai, and Guangdong, while being constrained in Heilongjiang, Gansu, and Qinghai. Provinces like Jiangsu, Zhejiang, and Shandong are rapidly catching up. (3) Shanxi, Inner Mongolia, and Shandong struggle with high comprehensive CLI from carbon-heavy industries; in contrast, Beijing, Shanghai, and Hainan show low CLI. (4) As CLI levels increase (90th percentile), the effectiveness of NGPFs in reducing CLI gradually diminishes (−0.2724). (5) The impact of NGPFs on CLI is not significant in the Eastern region, while in the Central and Western regions, the effects are −1.1365 and −1.0137, respectively. This study offers vital insights for shaping policies that promote sustainable growth and mitigate CLI in China.

1. Introduction

The escalating emissions of greenhouse gases are incrementally increasing global average temperatures, leading to the melting of polar glaciers and rising sea levels. This phenomenon poses significant threats to coastal areas and ecosystems worldwide [1]. Furthermore, the frequency of extreme weather events is intensifying, exacerbating the damage caused by droughts, floods, and hurricanes. These environmental changes have exacerbated air pollution, reduced food production, and increased risk of infectious diseases, thus jeopardizing human health [2]. Global warming has become one of the most pressing issues in the world today. Carbon dioxide, as the most dominant greenhouse gas, is considered to be the breakthrough point to curb warming. Among nations, China stands out as the largest emitter of carbon dioxide [3]. In 2023, China’s CO2 emissions increased by 565 million tons, reaching 12.6 billion tons, representing a 4.7% rise, primarily driven by its continued reliance on coal and the industrial sector. Additionally, with the continuous development of urbanization, the number of motor vehicles in China reached 435 million in 2023. This has exacerbated air pollution and the greenhouse effect, with vehicle pollutant emissions totaling 14.662 million tons [4].
Carbon lock-in (CLI) refers to the structural rigidity of high-carbon systems that emerge from entrenched dependencies on fossil-fuel-based technologies, institutions, and social behaviors [5]. In China, this lock-in is manifested through carbon-intensive industries, outdated technologies, and a path-dependent industrial structure. Overcoming CLI has become a key hurdle in China’s pathway toward achieving its dual carbon goals: peak carbon by 2030 and carbon neutrality by 2060. In 2023, China’s total energy consumption reached approximately 5.72 billion tons of standard coal, reflecting a 5.7% increase compared to 2022, and marking the highest growth rate since 2012 [6]. Fossil fuels dominate China’s energy consumption, accounting for over 80% of the total. Specifically, fossil energy consumption in 2023 amounted to 4.71 billion tons of standard coal, a 5.6% increase from the previous year [7]. Coal, in particular, holds the largest share within China’s energy structure, a persistent challenge in the nation’s development trajectory [8]. In 2023, coal consumption alone was 3.17 billion tons of standard coal, contributing 43.1% to the overall growth in energy consumption. Coal-fired power generation accounts for approximately 60% of China’s total electricity production, and new coal-fired power plants are still under construction [9]. These figures indicate that China’s self-reinforcing cycle of carbon-intensive outputs may become increasingly difficult to break.
In response to these challenges, China has placed the development of next-generation productive forces (NGPFs) at the core of its national strategy in September 2023. The term “next-generation productive forces” (NGPFs), used throughout this paper, corresponds to the original Chinese concept “新质生产力”. While it is sometimes translated as “new quality productive forces,” we adopt “next-generation” to better convey the concept’s dynamic, forward-looking nature and to align with the international discourse on technological and industrial transformation. NGPFs emphasize technological innovation, digital transformation, and the integration of green, efficient, and high-quality productive elements, reflecting a shift toward a deep structural reform in pursuit of sustainable industrial modernization. To support this strategic direction, the Ministry of Science and Technology underwent a major reorganization in June 2024, establishing three specialized institutions: the Center for the Promotion of NGPFs, the New Technology Center, and the International Science and Technology Cooperation Center. This restructuring is aimed at catalyzing the development of NGPFs, fostering technological innovations that reduce emissions and pollution and bolstering international scientific cooperation. These institutions signal China’s heightened commitment to reducing emissions, advancing renewable energy, and fostering green innovation.
Despite the strategic importance of NGPFs, academic exploration of their role in mitigating CLI remains limited. This study addresses this gap by evaluating the empirical relationship between NGPFs and CLI, focusing on regional disparities and nonlinear effects across Chinese provinces. The structure of this paper is as follows: Section 2 reviews the relevant literature; Section 3 describes the methods and data sources used in the study; Section 4 presents a comprehensive model to assess the level of NGPFs across Chinese provinces and applies the entropy method to calculate the values of industrial lock-in, institutional lock-in, technological lock-in, social behavior lock-in, and overall CLI values for 30 administrative regions in China from 2012 to 2022. Additionally, this section explores the impact of NGPFs on CLI through various regression models. Section 5 further analyzes the quantile effects and regional heterogeneity across eastern, central, and western China. Finally, Section 6 summarizes the main findings and contributions of this study.

2. Literature Review

2.1. Literature on Carbon Lock-In

The concept of carbon lock-in (CLI), first introduced by Unruh (2000) [10], describes the persistent technological, institutional, and behavioral inertia rooted in fossil-fuel-based systems. Since 2013, research interest in CLI has expanded significantly. To map its intellectual landscape, a keyword co-occurrence analysis was conducted using VOSviewer (version 1.6.19), based on international publications. As shown in Figure 1, this analysis reveals multiple thematic clusters derived from the co-occurrence frequency of keywords. The key research domains represented by each cluster are detailed in the figure caption, including topics such as institutional transition, regional emissions (notably in China), technological innovation, and material diagnostics.
From a technological perspective, CLI is closely tied to infrastructural inertia and the entrenchment of fossil-fuel-based systems. Agbonifo [11] notes that fossil fuel dependency reinforces technological inertia, severely hindering the diffusion of renewable energy technologies. Similarly, Janipour et al. [12] highlight that legacy investments in carbon-intensive industries have created structural disincentives to low-carbon transitions, further exacerbated by sunk costs in outdated capacity. Moreover, the green financial system often fails to support industrial decarbonization—particularly for the eight high-energy-consuming sectors—due to regulatory risks and the high cost of technical verification [13].
Economically, CLI is maintained by the substantial upfront investment required to replace fossil fuel infrastructure and the socioeconomic disruption such a transition may cause, particularly in regions heavily reliant on traditional energy sectors [14,15]. From a policy perspective, while most governments formally support sustainable development, many still provide short-term subsidies that reinforce carbon-intensive practices, thus creating contradictions between stated environmental goals and actual policy instruments [16].
To effectively dismantle CLI, a multidimensional strategy combining policy reform, technological innovation, and market-based incentives is essential [17]. For instance, countries such as France and Germany have implemented financial subsidies, preferential tax treatments, R&D support, and strict environmental regulations which, together, have spurred green technology development and accelerated the decarbonization of traditional industries [18].
Beyond national efforts, international cooperation plays a vital role in mitigating CLI globally. Multilateral frameworks that promote the sharing of clean technologies, environmental policy coordination, and institutional learning can help accelerate emission reduction worldwide [15,19]. Moreover, differentiated strategies tailored to the economic and environmental conditions of developed and developing countries are necessary to overcome context-specific barriers [20].

2.2. Literature on Next-Generation Productive Forces

Using keywords such as “new productive forces”, “green productivity”, “next productive forces”, and “advanced productivity”, a total of 27,856 relevant international peer-reviewed publications were identified [21,22]. The volume of research began to grow rapidly after 2013, reflecting rising academic attention to sustainable and innovation-driven productivity models. The conceptual foundation of NGPFs emphasizes technological advancement, environmental efficiency, and systemic transformation. As shown in Figure 2, the co-occurrence analysis reveals several core research themes, including green total factor productivity measurement, environmental regulation, green finance, and agricultural efficiency, each representing key dimensions of the evolving productivity paradigm.
In September 2023, President Xi Jinping of China first mentioned the concept of “new quality productivity” during a research trip to Heilongjiang. By placing the development of NGPFs at the core of its strategy for the future, the Chinese government has made a major commitment to the modernization of the country and the transformation and upgrade of its industries. NGPFs represent a leap in productivity, one in which science and technology innovation play a leading role [23]. NGPFs are characterized by the qualitative transformation and optimized combination of laborers, means of production, and production inputs (i.e., materials, energy sources, and environmental elements involved in the labor process).
Studies in different countries have recognized the role of NGPFs as an engine for environmental sustainability, technological innovation, and industrial upgrading, although different countries and regions may use different terms to describe it, such as “green productivity”, “advanced productivity”, or “next-generation productivity”. By upgrading the quality of productivity, countries seek to promote the green transformation of their economies and the sustainable development of their societies while maintaining competitiveness [24].
Green productivity refers to the integration of environmentally sustainable factors into the industrial production process to achieve the dual objectives of ecological protection and economic efficiency [25]. For example, traditional manufacturing enterprises use efficient and green production processes and technical equipment to transform traditional manufacturing processes, improving resource efficiency to enhance the long-term financial stability of enterprises [26]. In supply chain management, logistics routes are optimized and renewable energy-driven transportation modes adopted to reduce energy waste and carbon emissions, promoting the harmonious coexistence of economic activities and environmental protection through green technology innovation and system optimization [27].
Advanced productivity, or “high productivity”, encompasses a wide range of technologies, innovative practices, and advanced industrial methods. The development of advanced productivity is highlighted by the development of artificial intelligence, automation, and the Internet of Things (IoT) in traditional manufacturing and service industries [28]. These technologies form a connected and efficient production and management system that can fundamentally change the structure of industries and the way they work [29]. For example, the application of AI enables production lines to respond more intelligently to market changes through real-time data analysis, improving production efficiency and quality [30,31]. Agricultural IoT and big data service technologies derived from precision agriculture can dramatically improve crop yields and resource use efficiency by precisely controlling planting conditions [32].
The complex dynamics between technological progress and sustainable development suggest that future economic growth will be closely linked to environmental management. Against this backdrop, it is particularly important to explore how to effectively utilize NGPFs to combat current and future environmental challenges. An in-depth examination of these advanced technologies will deepen the understanding of their potential and limitations, while offering practical guidance on integrating such innovations into sustainable economic strategies that balance economic growth with environmental protection.

2.3. Theoretical Framework of the Impact of NGPFs on Carbon Lock-In

NGPFs are defined by the qualitative transformation and optimized coordination of laborers, production materials, and labor objects, with total factor productivity as the core criterion of their development [33]. As an advanced form of productive forces, NGPFs embody features such as high technology, high efficiency, high quality, environmental friendliness, and sustainability. These characteristics position NGPFs as a potential breakthrough mechanism to resolve carbon lock-in (CLI), which stems from persistent dependence on fossil fuel technologies, institutional inertia, and high-carbon industrial structures.
Technological innovation serves as a primary mechanism through which NGPFs can mitigate CLI. By advancing and deploying renewable and low-carbon technologies—such as solar and wind power, smart grids, and carbon capture and storage—NGPFs help replace carbon-intensive infrastructure and improve energy efficiency, thus directly reducing emissions. In parallel, production organization optimization plays a vital role. Intelligent manufacturing systems, the industrial internet, and data-driven process management significantly enhance resource utilization and minimize energy waste. For instance, digital platforms under Industry 4.0 enable real-time monitoring and verification of carbon footprints throughout production cycles.
Human capital is another pillar of NGPFs. The cultivation of a workforce equipped with green awareness and low-carbon technical skills promotes both the implementation and the dissemination of low-carbon practices across sectors. These laborers not only operate clean technologies, but also embed low-carbon thinking into production routines, accelerating structural transformation at the grassroots level.
Data-driven governance further strengthens the impact of NGPFs. By leveraging big data analytics and artificial intelligence, real-time carbon emissions can be monitored and modeled, enabling local governments and firms to design targeted emission-reduction strategies [34]. These capabilities enhance responsiveness and precision in managing energy and environmental risks.
Institutional innovation complements these effects. Policy tools such as carbon taxes, emission trading schemes, and regulatory frameworks incentivize enterprises to upgrade technologies and shift toward low-carbon alternatives [35]. Simultaneously, reforming environmental governance structures helps phase out outdated high-emission assets and fosters an enabling environment for green technologies to diffuse [36].
In sum, NGPFs contribute to breaking CLI through multiple, interrelated mechanisms, including technological, organizational, human capital, data governance, and institutional pathways. These pathways not only target the physical sources of emissions, but also address the systemic inertia embedded in China’s industrial structure. The following empirical analysis tests these theoretical linkages by evaluating how NGPFs influence CLI across regions with different developmental profiles.

2.4. Literature Gap and Analytical Framework

The concept of NGPFs has been around for less than a year since it was first proposed, but it has already become a focus of great attention for Chinese industry and policy makers. A large number of studies have focused on the construction of the theoretical framework, exploring the concept of NGPFs and its influencing factors. However, there is relatively little literature on specific quantitative and empirical analysis of NGPF levels. There are even fewer quantitative studies on how to accurately measure and assess the actual effects of NGPFs, especially their economic and environmental impacts. This study addresses this oversight by developing a comprehensive model that assesses NGPF levels across various regions in China, introducing a new dimension to the discourse that has not been thoroughly explored in existing research.
In addition, current literature has mainly studied CLI and NGPFs as independent phenomena. While the existing body of literature has individually explored the implications of CLI and the potentials of NGPFs, it rarely examines their interdependencies in a detailed and structured manner. Most studies tend to focus on singular aspects, such as technological innovations, policy interventions, or financial mechanisms, in addressing CLI. This study fills this gap by using multiple evaluation methods to systematically explore the multifaceted impact of various aspects of NGPFs (technology, organizational practices, workforce development, and institutional frameworks) on mitigating CLI.
Therefore, to address the abovementioned gaps, this study achieves the following key objectives and analytical framework:
(1)
To construct a systematic evaluation model for measuring the level of NGPFs across Chinese provinces from 2012 to 2022, filling a notable empirical void in the current literature;
(2)
To explore the impact of NGPFs on carbon lock-in (CLI) from a holistic perspective, moving beyond the existing research that tends to focus on singular aspects such as technology, policy, or finance;
(3)
To systematically test the relationship between NGPFs and CLI using a range of econometric techniques, including ordinary least squares (OLS), fixed effects (FE), random effects (RE), feasible generalized least squares (FGLS), and instrumental variables generalized method of moments (IV-GMM);
(4)
To examine the asymmetric and heterogeneous effects of NGPFs by applying quantile regression and regional subsample analyses, thereby providing empirical support for region-specific and mechanism-sensitive low-carbon development strategies.

3. Methodology and Data

3.1. Methodology

(1)
Entropy method
In this study, both CLI and NGPFs are complex indices composed of multiple variables. To quantify these indices effectively, the entropy method is employed. The entropy method, a quantitative analysis technique rooted in information theory, is utilized to weigh and normalize the components of each index [37].
Firstly, each indicator is standardized to ensure comparability across different scales and units. The specific model is presented in Equation (1).
x i j = x i j m i n ( x j ) m a x ( x j ) m i n ( x j )
where xij is the original value of the j indicator for the i-th unit, and min (x, j) and max (x, j) are the minimum and maximum values of the j indicator, respectively.
Next, the proportion of each indicator’s value relative to the total across all units is calculated. The specific model is shown in Equation (2):
p i j = x i j i = 1 n x i j
where n is the number of units and xij is the normalized value of the j indicator for the i unit.
The entropy for each indicator is then computed to measure the amount of information it contributes, as shown in Equation (3).
E j   = k i = 1 n p i j l o g ( p i j )
where k is a constant, typically set to 1/log (n), and pij is the proportion calculated in the previous step.
Subsequently, the weights for each indicator are derived based on their corresponding entropy values, as shown in Equation (4).
w j   = 1 E j   m j = 1 n E j  
where m is the total number of indicators.
Finally, the composite score for each unit is computed by aggregating the weighted values of the indicators. This is shown in Equation (5):
s i   = j = 1 n w j × x i j  
These steps comprehensively outline the application of the entropy method for assessing the indices of CLI and NGPFs, ensuring a systematic approach to the quantification that accounts for the informational value of each indicator within the complex frameworks of CLI and innovative productive capabilities.
(2)
Econometric Model
This study explores the impact of NGPFs on CLI by constructing an estimation model, as shown in Equation (6). In this model, NGPFs serve as the explanatory variable, while CLI is the dependent variable. In addition to the core explanatory variable of NGPFs, the model incorporates several control variables that have been widely recognized in the literature as key factors influencing carbon lock-in. These include industrial structure (IND), foreign investment (FIN), environmental regulation (GRE), technological innovation and R&D (TRD), environmental awareness (EAW), and marketization level (MAR). The selection of these variables is grounded in the theoretical framework of carbon lock-in proposed by Unruh (2000) [10] and subsequent extensions by Naradda et al. (2020) [20], emphasizing the co-evolution of technology, institutions, and behavior in reinforcing high-carbon trajectories.
Environmental regulation and innovation capacity are often cited as critical institutional and technological levers to counteract lock-in inertia [38,39]. Foreign investment and marketization represent external and systemic forces that may either reinforce or disrupt existing high-carbon infrastructures, depending on the nature of capital and governance mechanisms. Environmental awareness captures the societal dimension, reflecting the extent to which behavioral norms align with low-carbon transitions [40]. Together, these control variables allow for a more comprehensive analysis of the structural, institutional, and social factors that may moderate or mediate the relationship between NGPFs and CLI.
C L I i t = f ( N G P F i t , I N D i t , F I N i t , G R E i t , T R D i t   , E A W i t , M A R i t )
To obtain smoother data and reduce the risk of heteroskedasticity, the logarithmic transformation is applied to the relevant variables, resulting in Equation (7).
ln C L I i t = β 0 + β 1 ln N G P F i t + β 2 ln I N D i i t + β 3 ln F I N i t + β 4 ln G R E i t + β 5 ln T R D i t + β 6 ln E A W i t + β 7 ln M A R i t + α i t + γ i t + ϵ i t
Equation (7) also incorporates individual fixed effects and time fixed effects, with the error term denoted by γ i t , ϵ i t .

3.2. Variables and Data

(1)
NGPF index system
The “newness” of NGPFs is reflected at two levels: on the one hand, the newness of the basic constituent elements is manifested in the new groups of workers who have mastered new technologies, in the new types of means of labor such as intelligent equipment, and in the new types of objects of labor such as new energies and materials; on the other hand, it is manifested in the brand-new forms of production that are based on new technologies, industries, forms of industry, and new elements. The index system for NGPFs offers a multifaceted approach to evaluate the transformative impact of advanced technologies across various sectors, as shown in Table 1.
This comprehensive framework includes main indicators like the new labor force, new means of labor, new labor objects, new materials, new technology, innovation output, new production organization, and data elements, each tailored to capture distinct aspects of technological and economic progress. Four core dimensions are included in the composite indicator of NGPFs. A new, highly qualified workforce is the most dynamic element of NGPFs. New labor materials with higher technological content are the important driving force for the development of NGPFs. New labor objects with ever-expanding scope are the material basis for the development of new productivity. Revolutionary new technologies are the core driving force of NGPFs.
As a leap in productivity, NGPFs emphasize breaking away from the traditional growth path of relying on large amounts of resource inputs and highly consuming resources and energy and realizing sustainable development with low consumption and high efficiency. This, in itself, implies profound ecological thinking, namely that the ecological environment itself is a productive force, that protecting the environment is protecting productive forces, and that improving the environment is developing productive forces. NGPFs emphasize the harmonious coexistence of man and nature, with ecological protection as the basic principle and calls for the formation of a healthy economic ecology.
(2)
CLI index system
This study develops a comprehensive CLI indicator system by integrating four key dimensions (industrial lock-in, institutional lock-in, technology lock-in, and social behavior lock-in) that influence the transition toward a less carbon-intensive economy [19]. The system includes industrial lock-in, captured by the proportion of secondary industry value added and fixed asset investment in GDP; institutional lock-in, measured through employment in the mining industry and fiscal science and technology expenditures; technological lock-in, assessed by carbon emission efficiency and the proportion of R&D funds in GDP; and social behavior lock-in, reflected in indicators such as population density and total passenger turnover. This multifaceted approach ensures that each dimension’s specific contribution to inhibiting or delaying economic decarbonization is thoroughly addressed.
To synthesize these indicators into a composite CLI index, we employ the entropy weight method. This method calculates indicator weights based on the variability and information entropy of each variable, enabling an objective assessment of their contribution to the overall CLI index. Indicators with greater dispersion and more informative content receive higher weights, thereby reducing subjectivity and enhancing the robustness of the index.
The first dimension, industrial lock-in, examines the entrenchment within traditional, heavy industries known for high carbon outputs. The reliance on the secondary sector is quantified by assessing the value added by these industries as a percentage of GDP [64]. This indicator not only reflects the economic dependence on carbon-intensive sectors, but also the potential challenges in diversifying the economic base. Additionally, the fixed asset investment relative to GDP indicates how capital allocation might perpetuate existing carbon-heavy infrastructures, rather than supporting new, cleaner technologies. These investments are a proxy for the economy’s inertia, showing how past investments can create path dependencies that complicate shifts toward green technologies.
Institutional lock-in is captured through the employment figures in the mining sector, often including coal, oil, and natural gas extraction [65]. These jobs not only signify economic dependence on fossil fuels, but also involve political and social dimensions, as significant changes in employment figures can have widespread socioeconomic implications. Additionally, the measure of fiscal expenditure on science and technology, specifically within carbon-intensive sectors, further underscores the institutional commitments that either perpetuate or mitigate against CLI. It reflects the government’s role in either perpetuating the status quo or incentivizing innovation toward sustainability.
Technological lock-in is assessed using two key indicators: the efficiency of carbon emissions and the proportion of R&D expenditure in GDP. The efficiency of carbon emissions is calculated as the ratio of GDP to total CO2 emissions, reflecting how much economic output is generated per unit of carbon emitted. A lower value indicates greater dependence on carbon-intensive technologies, signaling deeper technological lock-in [12]. The proportion of R&D spending in GDP reflects the level of commitment to innovation and the potential to develop alternative technologies. Higher R&D intensity suggests a more proactive approach to overcoming fossil fuel dependence and promoting technological shifts.
Finally, the social behavior dimension of lock-in addresses the societal practices that contribute to carbon emissions [66]. Population density provides insights into urban planning and energy use patterns, where higher densities can lead to both increased energy use and opportunities for energy efficiency improvements. Passenger turnover, representing the volume of travel, directly relates to transportation’s carbon emissions. High levels of turnover indicate a heavy reliance on transportation modes that are likely carbon-intensive, highlighting areas where interventions can reduce carbon footprints, such as improving public transit systems or encouraging non-motorized transport.
Together, these dimensions form a holistic CLI index that not only reflects the current state of CLI, but also guides policymakers on the multifaceted approaches required to effectively reduce carbon dependencies.
(3)
Data
Serving as the independent variable in this study, NGPFs represent a composite index that measures the integration and effectiveness of cutting-edge technologies and sustainable practices within economic systems. The data for NGPFs are sourced from the Ministry of Science and Technology and the National Bureau of Statistics of China, both of which track advancements in sectors critical to innovation and ecological sustainability.
CLI is the dependent variable, and is comprehensively measured through four distinct dimensions: institutional lock-in, technological lock-in, industrial lock-in, and social behavior lock-in. These aspects collectively capture the entrenched carbon-intensive practices and infrastructures within the economy. The data for these measurements are meticulously sourced from various official reports and databases maintained by the National Bureau of Statistics of China and the Ministry of Ecology and Environment, both of which provide detailed information on industry practices, technology adoption rates, regulatory impacts, and societal behaviors related to energy consumption and carbon emissions.
This study employs six control variables to assess the influence of NGPFs on carbon lock-in. Industrial structure (IND) is measured by the value of the tertiary industry/secondary industry. The scale of foreign investment, denoted by FIN and measured as the total amount of foreign direct investment relative to GDP, reflects the influence of external economic forces, which can either bolster existing carbon-intensive practices or introduce cleaner technologies. Government environmental regulation, denoted as GRE, measures the investment in pollution control relative to industrial added value, evaluating the rigor of initiatives aimed at reducing carbon emissions. Technological innovation and research and development, represented by the abbreviation TRD, are quantified by the ratio of expenditures in these fields to GDP. This measure underscores the significance of innovation in promoting industrial practices that are less reliant on carbon. Lastly, environmental awareness, represented by EAW and measured by the average educational attainment, gauges societal engagement and understanding of environmental issues, which can influence public and corporate policies toward sustainability, and marketization (MAR), which also significantly influences CLI. The data for these variables are sourced from official government websites and the China Statistical Yearbook, providing reliable and authoritative statistics that enhance the robustness and credibility of the analysis. Table 2 presents the descriptive statistics for the independent variable, dependent variable, and control variables used in this study.

4. Results

4.1. Next-Generation Productive Forces Level

Figure 3 shows regional development differences in NGPF levels and trends in the adoption of advanced production technologies in China’s 31 provinces from 2012 to 2022.
Regions such as Beijing, Shanghai, and Guangdong have consistently high levels of NGPFs. These regions have robust economies with large investments in technology and infrastructure and have access to a large number of favorable local government policies that promote innovation and high-tech industry development. At the same time, NGPF growth rates in these regions have been consistently high due to the agglomeration effect of urbanization and the support of significant international business and R&D funding. These regions have a much higher number of established high-tech parks and demonstration bases than any other region, as well as strong digital infrastructure and an environment for industry–university–research collaboration.
In contrast, Heilongjiang, Gansu, and Qinghai provinces have the lowest levels of NGPFs. These regions are geographically isolated, have poor natural climates, have relatively limited access to cutting-edge research facilities or investment, and are overly dependent on traditional industries. Therefore, there is an urgent need for local governments in these provinces to take targeted interventions to narrow the technology gap and ultimately lead to local economic development.
It is worth noting that emerging provinces such as Jiangsu, Zhejiang, and Shandong are growing rapidly and their NGPFs are approaching the level of first-tier cities. The most common feature of these regions is their favorable geographic location and active, sustained local policies. The eastern seaboard location has contributed to the growth of trade and technology transfer in these provinces. There are a large number of incentives and investments targeted at SMEs in the technology sector each year to develop and attract technology talent. Moreover, most regions are actively modernizing their traditional manufacturing industries through automation and digital technologies.
A closer look at temporal trends indicates a general increase in NGPF levels across most provinces, suggesting a nationwide shift toward embracing NGPFs. However, the rate of increase varies, underscoring the uneven pace of development and the potential for increasing regional disparities if not addressed by coherent and inclusive policy measures.
The significant variation in NGPFs across China necessitates a nuanced approach to policymaking, where regional strengths and weaknesses are recognized and strategies are tailored accordingly. Enhancing connectivity between lower-performing regions and technological hubs, fostering local centers of innovation, and improving educational and training programs to build a skilled workforce are essential steps toward leveling the playing field.

4.2. Spatiotemporal Characteristics of Carbon Lock-In

The entropy method is utilized to compute the values of industrial, institutional, technological, and social behavior lock-in, as well as comprehensive CLI, across 30 administrative regions in China from 2012 to 2022. Figure 4 illustrates the spatial distribution of the mean values of various types of CLI and the comprehensive CLI over the past decade. This examination sheds light on significant regional disparities within China that stem from variations in economic structures, technological adoption, and policy frameworks. Analyzing the average values over this period provides a nuanced understanding of the evolving trends and persistent challenges in transitioning toward a lower carbon economy.
Figure 4a reveals that industrial lock-in is particularly high in Ningxia (0.5367), Qinghai (0.4821), and Shandong (0.4403), where traditional manufacturing and heavy industries dominate the economic landscape. These regions rely heavily on sectors that are inherently carbon-intensive, such as petrochemicals and metallurgy, which embeds substantial carbon lock-in due to existing infrastructure and technology. In stark contrast, Beijing (0.0739), Shanghai (0.1489), and Tianjin (0.1504) exhibit notably lower levels of industrial lock-in, likely due to their advanced economic structure that leans heavily toward services and high-tech industries, which are less carbon-reliant.
Institutional lock-in, as shown in Figure 4b, is most pronounced in Shanxi (0.7739), Ningxia (0.6076), and Xinjiang (0.4633). These areas might suffer from rigid regulatory frameworks and slow policy responsiveness which can delay the adoption of greener policies and technologies. On the other end of the spectrum, Shanghai (0.0937), Hainan (0.1272), and Zhejiang (0.1296) show the lowest levels of institutional lock-in, possibly benefiting from more agile and progressive governmental actions that promote environmental sustainability and economic modernization.
Figure 4c points to high technical lock-in in Inner Mongolia (1.0454), Hebei (0.8992), and Heilongjiang (0.8945). This could be due to the prevalence of outdated technologies and a slower rate of adoption of new technologies. Conversely, Beijing (0.0069), Beijing (0.0069), and Guangdong (0.3305) report lower technical lock-in, which correlates with their investment in and adoption of cutting-edge technologies, aiding in the rapid decarbonization of industrial operations.
Social behavior lock-in, illustrated in Figure 4d, is significantly higher in economically vibrant provinces like Guangdong (0.9904), Henan (0.7443), and Jiangsu (0.7443). This might reflect the high urban population density and greater consumer lifestyle demands that contribute to higher energy consumption and carbon emissions. In contrast, Qinghai (0.0007) and Ningxia (0.0108) show lower levels due to their sparse populations and lesser industrial activity, which naturally results in lower social behavior lock-in.
Finally, Figure 4e synthesizes the comprehensive CLI, showing the highest averages in Shandong (0.5052), Shanxi (0.4942), and Inner Mongolia (0.3947). These regions, rich in natural resources and heavy industries, face significant challenges in transitioning to a low-carbon economy. Conversely, Hainan (0.1615) and Shanghai (0.1197) exhibit the lowest comprehensive CLI, likely due to their smaller industrial bases and more aggressive environmental policies. This disparity underscores the necessity for region-specific strategies that leverage local strengths and address particular vulnerabilities to effectively reduce carbon lock-in and foster sustainable development.

4.3. The Impact of Next-Generation Productive Forces on Carbon Lock-In

(1)
The results of benchmark regression
As shown in Table 3, traditional methods such as OLS, FE, and RE are employed alongside advanced techniques including FGLS and IV-GMM to address complexities such as heteroskedasticity and endogeneity, thereby enhancing the robustness of the regression analysis results. It confirmed the absence of multicollinearity through Variance Inflation Factor (VIF) checks, with all values below 10, ensuring reliable regression inputs. FGLS effectively addressed heteroskedasticity and autocorrelation, improving the accuracy of its estimates, while IV-GMM, using past values as instruments, offered more efficient estimates by overcoming residual complications.
In this study, the regression results from the IV-GMM method are reinforced by rigorous diagnostic tests, specifically the LM and F statistics. The LM statistic of 18.682 with a p-value of zero robustly confirms that the model does not suffer from underidentification, ensuring that the instrumental variables are both relevant and valid. Furthermore, the F statistic of 16.868 significantly exceeds the threshold of 10, which indicates strong instruments and mitigates concerns about potential endogeneity leading to biased estimates. These results confirm the robustness of the IV-GMM estimations, supporting the study’s findings that NGPFs significantly mitigate CLI.
In this study, the impact of new quality productive forces (NGPFs) on carbon lock-in (CLI) was explored through five different regression models: OLS, FE, RE, FGLS, and IV-GMM. The results indicate that NGPFs significantly reduce CLI with a notable negative effect [67,68,69]. The coefficients across these five methods range from −0.2465 in the OLS model to −0.9643 in the IV-GMM model, suggesting that approaches addressing potential endogeneity, such as instrumental variable techniques, amplify the perceived impact of NGPFs on reducing CLI [70,71]. Specifically, the coefficients for NGPFs are consistently negative across the OLS (column 1), FE (column 2), and RE (column 3) models. In particular, the fixed effects model in column 2 exhibits a more pronounced effect (coefficient of −0.4617), highlighting the importance of considering inherent individual characteristics in the relationship between the explanatory variables and CLI. The FGLS (column 4) and IV-GMM (column 5) models further consider issues of heteroskedasticity, autocorrelation, and endogeneity, emphasizing the potential of new productive forces to mitigate carbon lock-in when controlling for endogeneity bias [72]. In the IV-GMM model, the coefficient for NGPFs is −0.9643, the most significant negative impact, indicating that a 1% increase in NGPFs is expected to reduce CLI by approximately 0.9643%. This negative relationship underscores the effectiveness of new quality productive forces in reducing carbon lock-in, showcasing the potential benefits of new technologies and productivity improvements for environmental protection [73,74].
Regarding control variables, insights into the complex impacts of economic structure, foreign investment inflows, government environmental policies, technological R&D, and the degree of marketization on CLI are revealed. Notably, foreign direct investment shows a positive correlation in several models, particularly pronounced in the IV-GMM model with a coefficient of 3.3414, suggesting that higher financial investment in carbon-intensive industries may exacerbate carbon lock-in [23,75,76]. Conversely, industrial structure and marketization exhibit negative associations in most models, suggesting that transitions toward service-oriented or more market-driven economies could help alleviate CLI [77,78,79]. These findings not only emphasize the crucial role of new productive forces in regional carbon reduction strategies but also illustrate that implementing adaptive regional policies and innovations is vital for effectively reducing carbon lock-in [14,80]. Variables such as government regulation and environmental awareness show mixed results across different models, indicating that the effects of governmental policies and societal awareness on CLI are less clear and potentially dependent on other regional-specific factors [81,82,83]. This nuanced understanding of regional differences underscores the need for tailored strategies that consider local economic conditions and institutional capacities to combat carbon lock-in effectively.
(2)
Robustness test
This study conducted a series of robustness checks by employing various methods such as replacing the dependent variable, adding instrumental variables, substituting control variables, and excluding specific samples. The results of these robustness tests are presented in Table 4, Table 5 and Table 6, demonstrating the reliability and consistency of the findings across different model specifications and analytical approaches.
The robustness tests presented in the regression analysis methodically probe the resilience of the model’s findings under varied conditions, as shown in Table 4. The first column introduces a reassessment of the dependent variable by applying principal component analysis (PCA) to redefine provincial lnCLI levels. By selecting principal components with eigenvalues greater than 1, four factors were extracted, cumulatively accounting for 70% of the variance, thereby providing a comprehensive yet distinct measure of lnCLI. This new composite variable still exhibits a consistent, albeit slightly reduced, negative association with lnNGPFs. The minor variance in effect size accentuates the sensitivity of the results to the choice of the dependent variable but reaffirms the fundamental negative relationship between lnNGPFs and lnCLI.
In columns (2) and (3) of the robustness test table, new control variables, namely transportation infrastructure level (TIL), urbanization level (URL), and technology market development level (TMD), are added, and the model is re-evaluated by excluding data from the four major municipalities (Beijing, Tianjin, Shanghai, Chongqing). The inclusion of these additional controls results in a more pronounced negative coefficient for lnNGPFs, suggesting that these factors capture crucial aspects influencing lnCLI, perhaps previously unaccounted for. Moreover, the exclusion of major municipalities intensifies the negative impact of lnNGPFs, highlighting that urban dynamics in these areas might obscure broader provincial trends. These adaptations in the model’s setup rigorously confirm the negative contribution of lnNGPFs to mitigating lnCLI, showcasing the robustness of the original findings across diverse analytical scenarios and data configurations.
In addition, a second robustness test was conducted using a dynamic econometric model, as shown in Table 5, employing Generalized Method of Moments (GMM) estimators to account for temporal dependencies introduced by lagged dependent variables. The difference GMM (DIF-GMM) and the system GMM (SYS-GMM) are used here to address the potential endogeneity concerns arising from the lagged effects of CLI on itself, with traditional methods like OLS or FE unable to handle them appropriately.
The robustness tests employing DIF-GMM and SYS-GMM illustrate the dynamic interplay between lnNGPFs and lnCLI, capturing the lagged effects and addressing endogeneity concerns inherent in the model. Both GMM methods validate the time-dependency of lnCLI, with DIF-GMM showing a mild negative impact of NGPFs on lnCLI, suggesting that technological advancements in productive forces can potentially mitigate lnCLI. The SYS-GMM results indicate a lesser effect of NGPFs but highlight the significant role of financial development in potentially exacerbating lnCLI. Crucially, both models passed autocorrelation checks and the Hansen overidentification test, affirming the validity of the instruments and the reliability of the findings. These results underscore the nuanced impact of economic and institutional factors on lnCLI and emphasize the need for targeted policy interventions to harness productive forces for environmental sustainability.
As shown in Table 6, undertaking this third robustness test is essential for enhancing the reliability of the results, as it demonstrates the consistency of the estimated effects of lnNGPFs on lnCLI across various econometric specifications. In this test, two-stage least squares (2SLS) estimation is employed, using terrain ruggedness as an instrumental variable. The rationale for this choice lies in the established evidence that terrain ruggedness affects long-term patterns of economic development, urbanization, and infrastructure expansion [84,85]. Regions with more rugged terrain tend to experience lower levels of industrial agglomeration and slower diffusion of productivity-enhancing technologies, indirectly influencing the development of next-generation productive forces (NGPFs). At the same time, terrain ruggedness is exogenous to current carbon lock-in outcomes and is unaffected by short-term policy or market fluctuations, satisfying the exclusion restriction. This geographic feature is thus considered a theoretically sound and historically stable predictor for isolating the causal effect of lnNGPFs on lnCLI.
In the first stage of the analysis, terrain ruggedness significantly influenced the model, as reflected by a high F-statistic, demonstrating its relevance as an instrument. The second stage reveals a consistent negative effect of lnNGPFs on lnCLI, as previously observed, with this stage of analysis affirming the directional consistency and magnitude of the impact. These stages collectively ensure the examination of the causal relationships is grounded in empirical evidence, reinforcing the reliability of the findings concerning the role of lnNGPFs in mitigating lnCLI.

5. Further Discussion

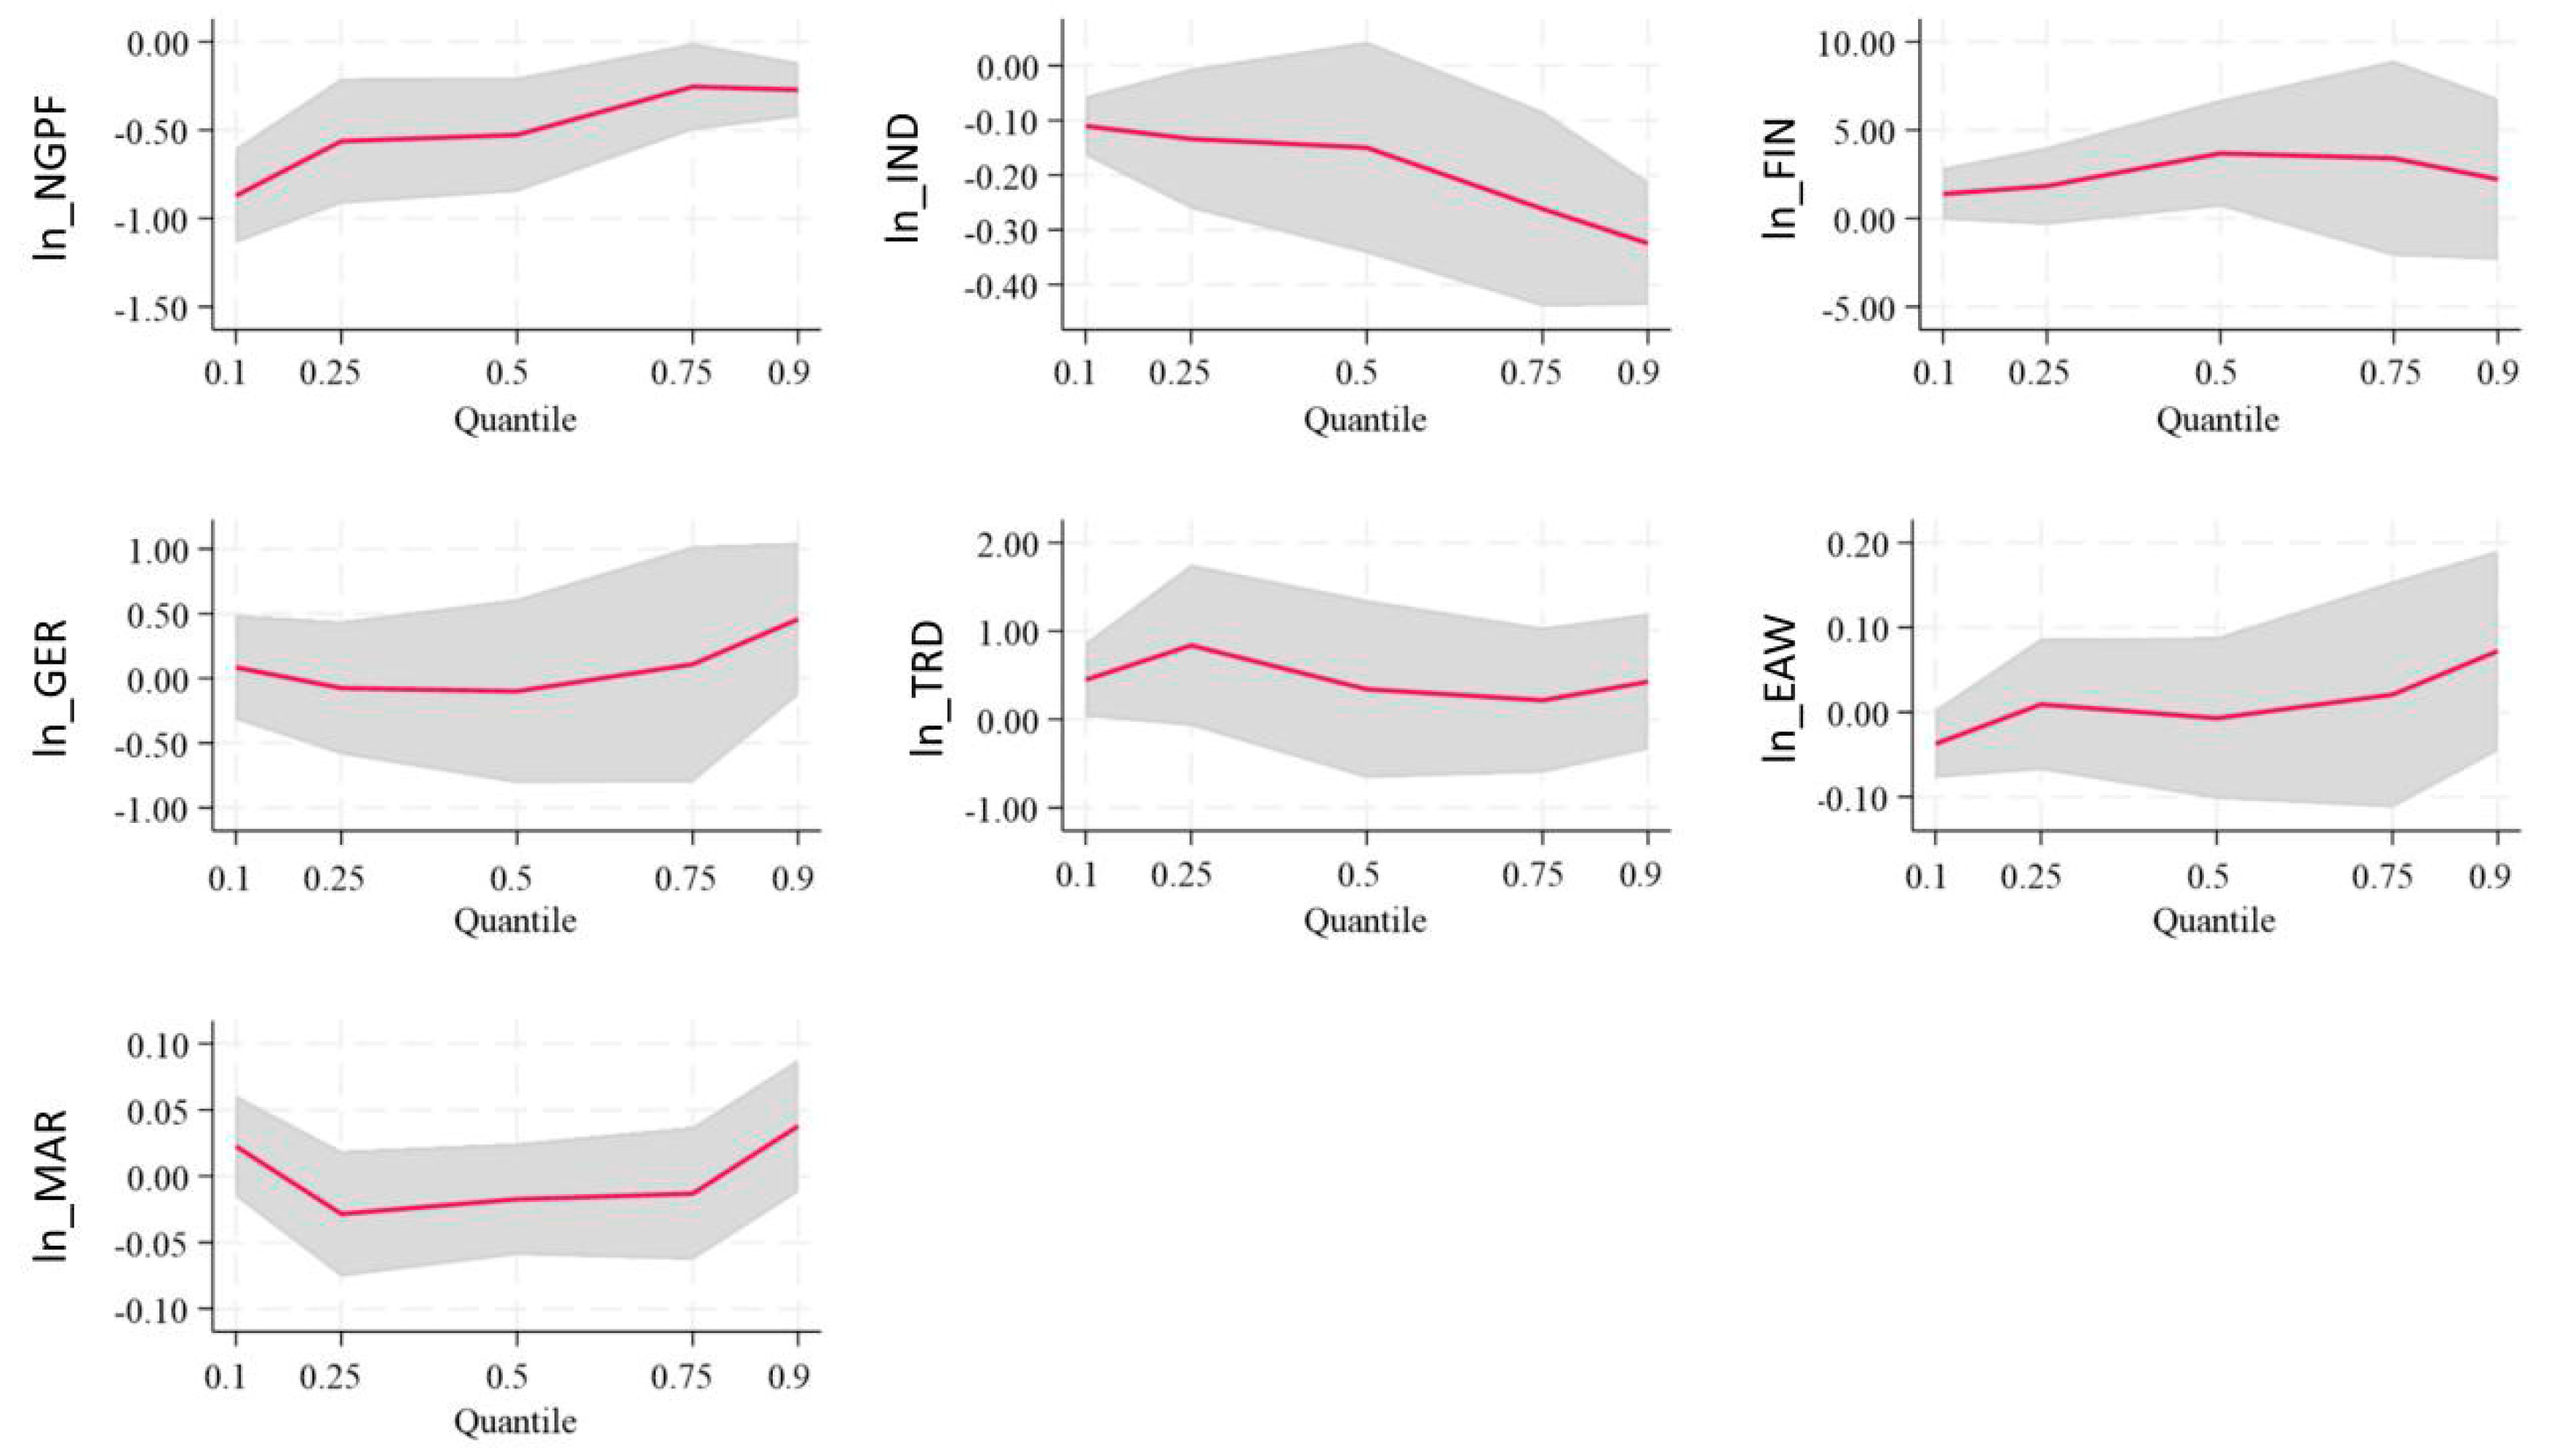
5.1. Asymmetric Analysis

This study establishes a negative linear relationship between NGPFs and CLI; however, it also aims to further explore whether there is a nonlinear relationship between them. Panel quantile regression is a widely used method in academia that helps identify the quantile relationships between variables [86,87]. Accordingly, a panel quantile regression model was employed to examine the marginal impacts of NGPFs on various quantiles of CLI (namely the 10th, 25th, 50th, 75th, and 90th percentiles), as shown in Table 7. The results are displayed in Figure 4, accompanied by panel quantile regression plots that visually represent the relationships between the independent and dependent variables across different quantiles.
As shown in Table 7 and visualized in Figure 5, the panel quantile regression reveals a decreasing trend in the absolute value of the NGPFs coefficient across higher quantiles. Specifically, the inhibitory effect weakens from −0.8712 at the 10th quantile to −0.2724 at the 90th quantile. This indicates that the marginal effect of NGPFs in mitigating CLI diminishes as CLI levels increase, suggesting that in more carbon-locked regions, the same level of productive force improvement may result in a comparatively smaller reduction in CLI. However, this reflects a statistical trend in effect size, rather than a direct measure of systemic inertia or behavioral resistance.
Figure 5 also presents the quantile regression results for the control variables across different levels of lnCLI. The coefficient of lnIND remains negative across all quantiles and reaches its largest magnitude at the 90th quantile (−0.3247), suggesting that optimization of industrial structure, such as the expansion of service and knowledge-intensive industries, is statistically associated with lower levels of CLI [38]. In contrast, lnFIN shows a positive correlation with CLI, most notably at the 50th quantile (3.6860), which may reflect the tendency for foreign capital to concentrate in carbon-intensive industries [30,88,89,90]. The coefficient estimates for lnGRE, which captures government environmental regulation, fluctuate across quantiles without a clear pattern, indicating varying degrees of regulatory effectiveness. Technological R&D exhibits positive and significant effects in certain quantiles, such as the 25th (0.8379), implying that innovation-related efforts may contribute to reducing CLI, depending on the carbon intensity level [91,92,93]. Meanwhile, environmental awareness and marketization show weaker and mixed associations with CLI across quantiles.

5.2. Heterogeneity Analysis

The analysis presented in Table 8 demonstrates the heterogeneous impact of lnNGPFs on lnCLI across different regions of China—eastern, central, and western. The statistically insignificant impact of lnNGPFs on lnCLI in the eastern region, with a coefficient of −13.4020, suggests that while there may be a trend toward reducing carbon lock-in, the influence of new quality productive forces is not substantial in this area. This could be attributed to the region’s already advanced economic development and saturated market conditions, where the incremental benefits of additional innovative practices are less pronounced compared to less developed regions [94].
In contrast, the impact in central and western China shows a significant negative correlation, with coefficients of −1.1365 and −1.0137, respectively, both at different levels of significance. This indicates that in these areas, an increase in NGPFs leads to a notable decrease in CLI, reflecting effective integration and utilization of new productive technologies that potentially disrupt traditional carbon-intensive practices [95,96]. The central region, marked by a coefficient significant at the 1% level, suggests a stronger and more consistent application of innovative productive forces, likely due to a focused policy drive toward modernizing the industrial base, which is more pronounced than in the eastern region [97].
The coefficients for industrial development, financial input, and government regulation reveal complex regional dynamics. In the eastern region, the large positive coefficient for lnFIN (57.8997) suggests that financial resources may be reinforcing carbon lock-in, likely due to their concentration in energy-intensive sectors [98,99]. This aligns with findings from countries like India and Brazil, where finance often flows toward high-emission industries due to short-term profit incentives [100,101].
By contrast, financial input has a weaker or insignificant effect in central and western regions, possibly due to less developed industrial bases. Environmental regulation also varies considerably: it has a significant negative effect in central China (−1.1301), indicating stronger enforcement, but a positive effect in western China (0.5722), suggesting regulatory inefficiencies or misalignment. Similar patterns are observed internationally, where uneven governance capacity reduces the effectiveness of environmental policies [102,103]. These results underscore the need to better align financial flows and regulatory enforcement with decarbonization goals, a challenge common to many transitioning economies.

6. Conclusions and Policy Implications

6.1. Conclusions

Based on the above analysis, the main conclusions of this study are as follows:
(1)
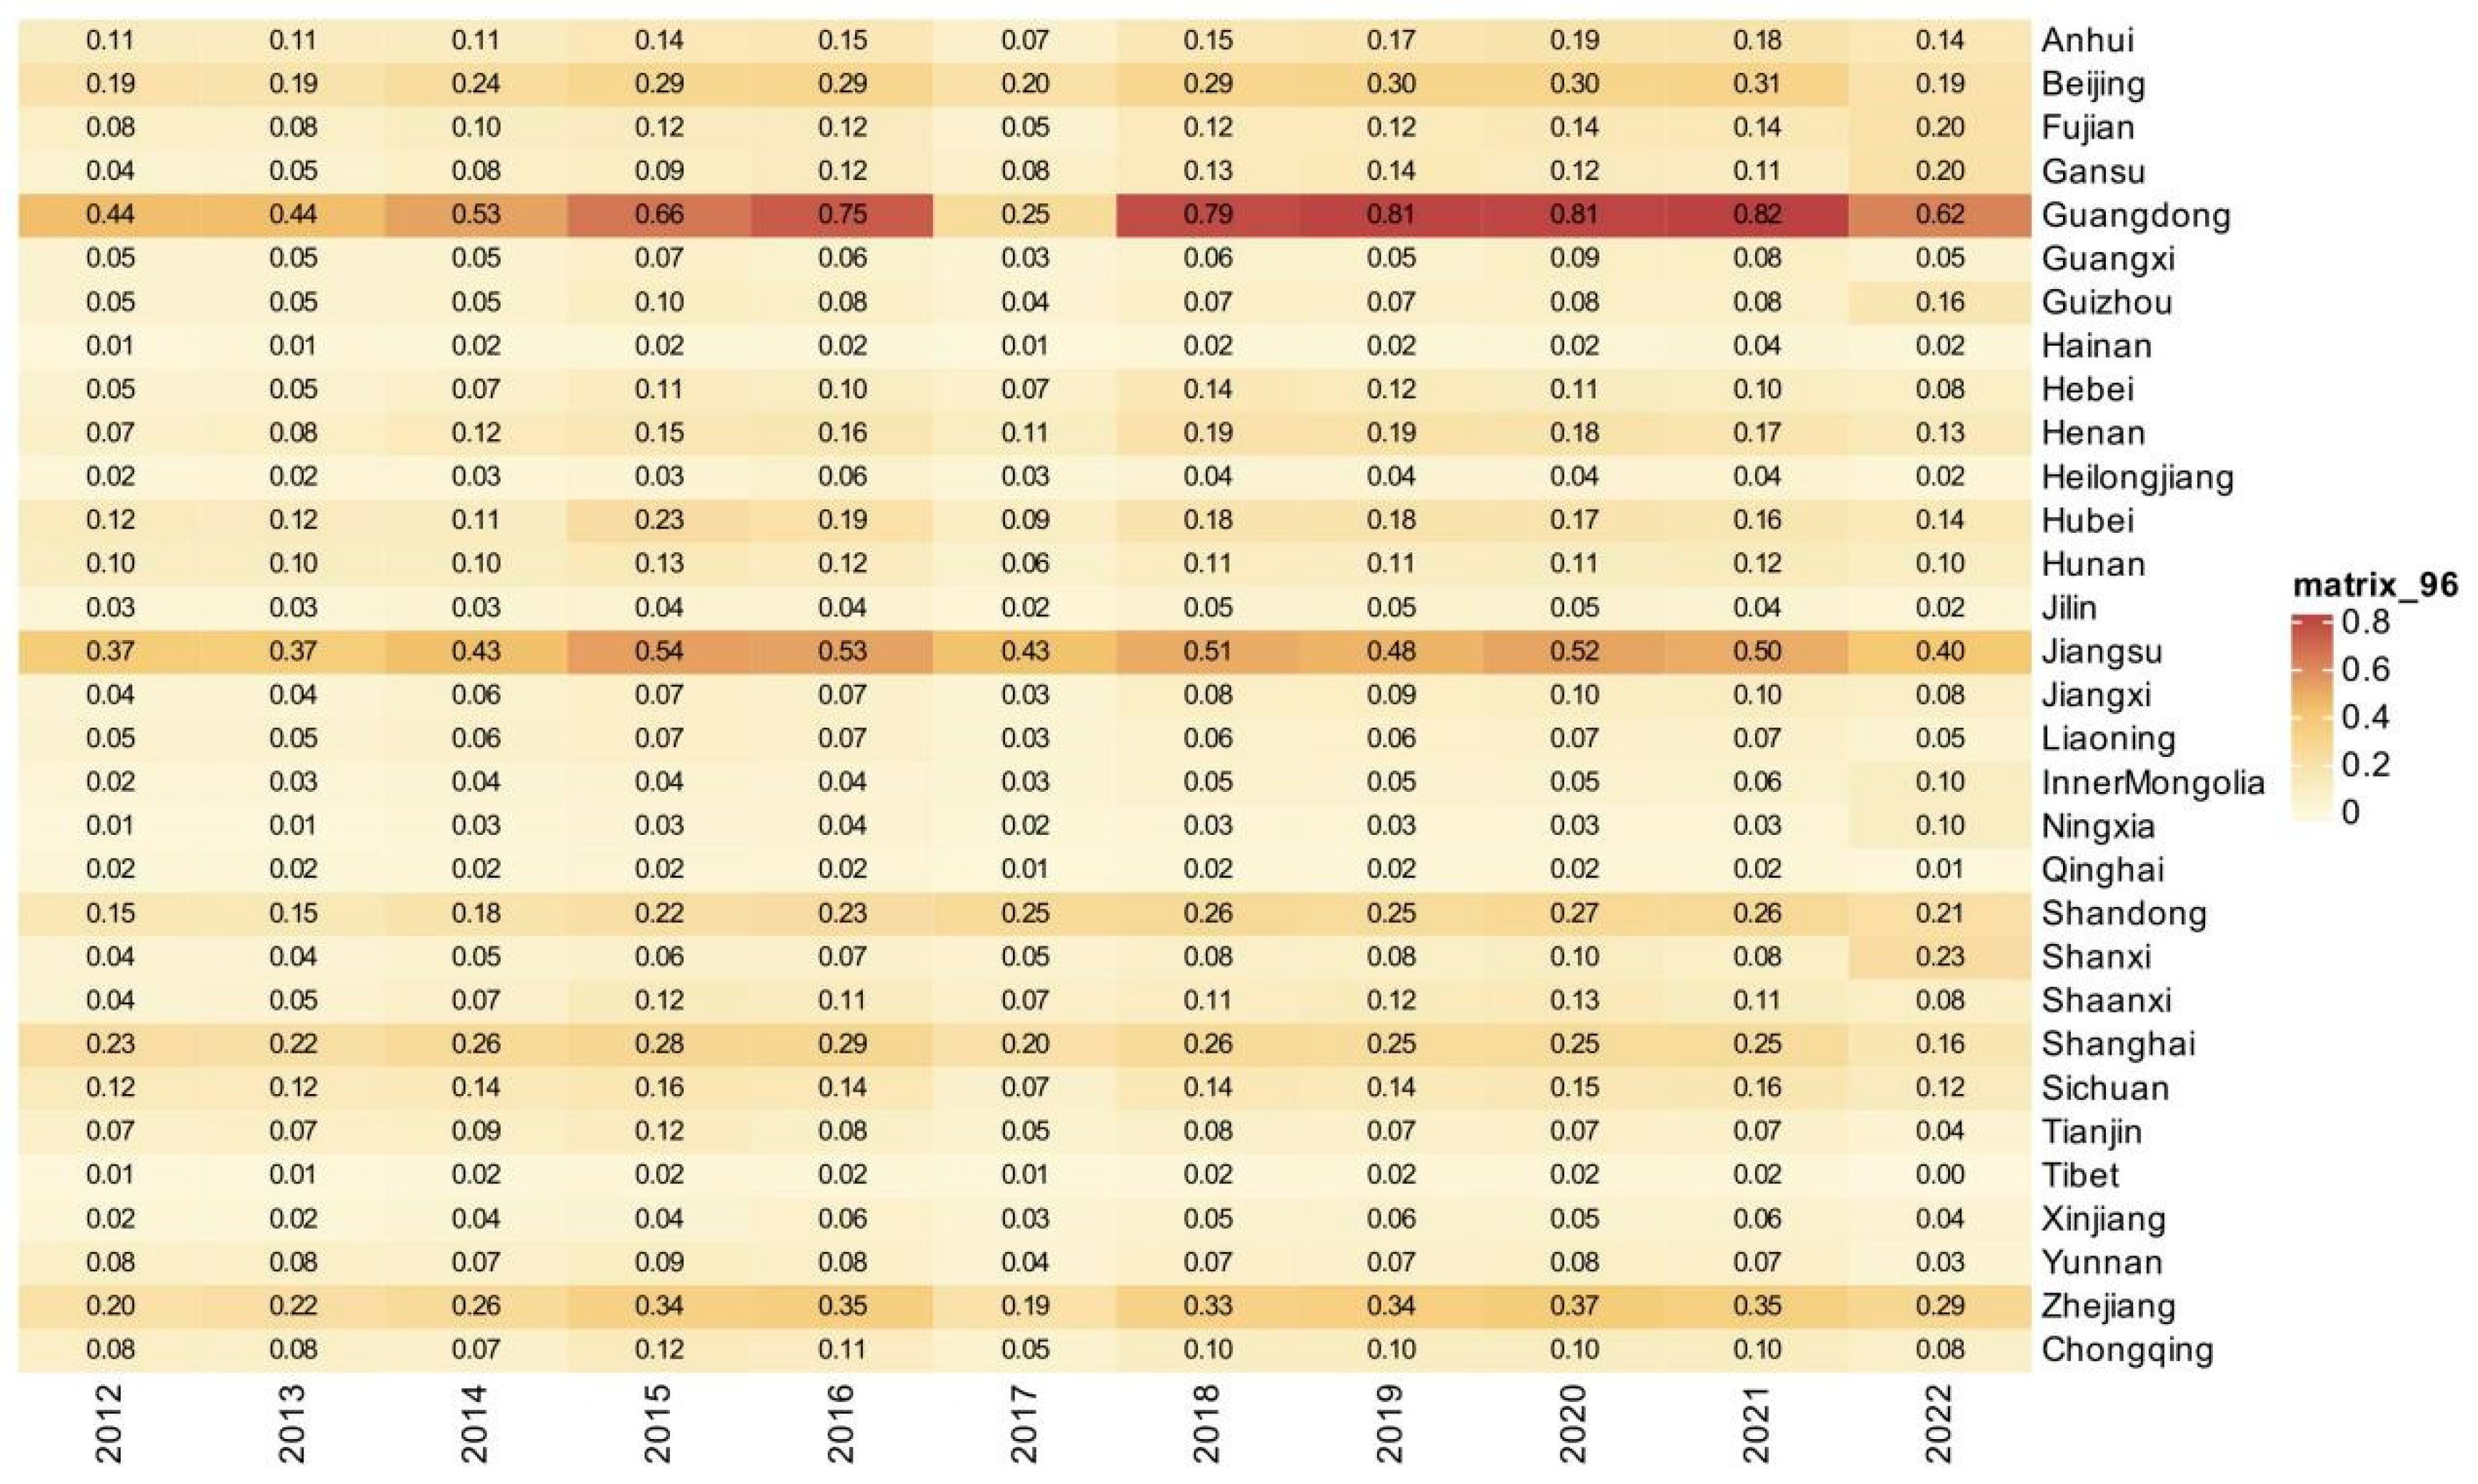
Urban centers such as Beijing, Shanghai, and Guangdong exhibit high levels of NGPFs due to strong economies and investments in high-tech industries, contrasting with regions like Heilongjiang, Gansu, and Qinghai where NGPFs are limited by geographic and industrial constraints. Provinces like Jiangsu, Zhejiang, and Shandong are rapidly developing, with investments aligning them closely with leading cities. Overall, NGPFs across China are increasing, indicating a shift toward advanced technologies. However, the uneven pace of this growth highlights the need for tailored policies to prevent widening regional disparities.
(2)
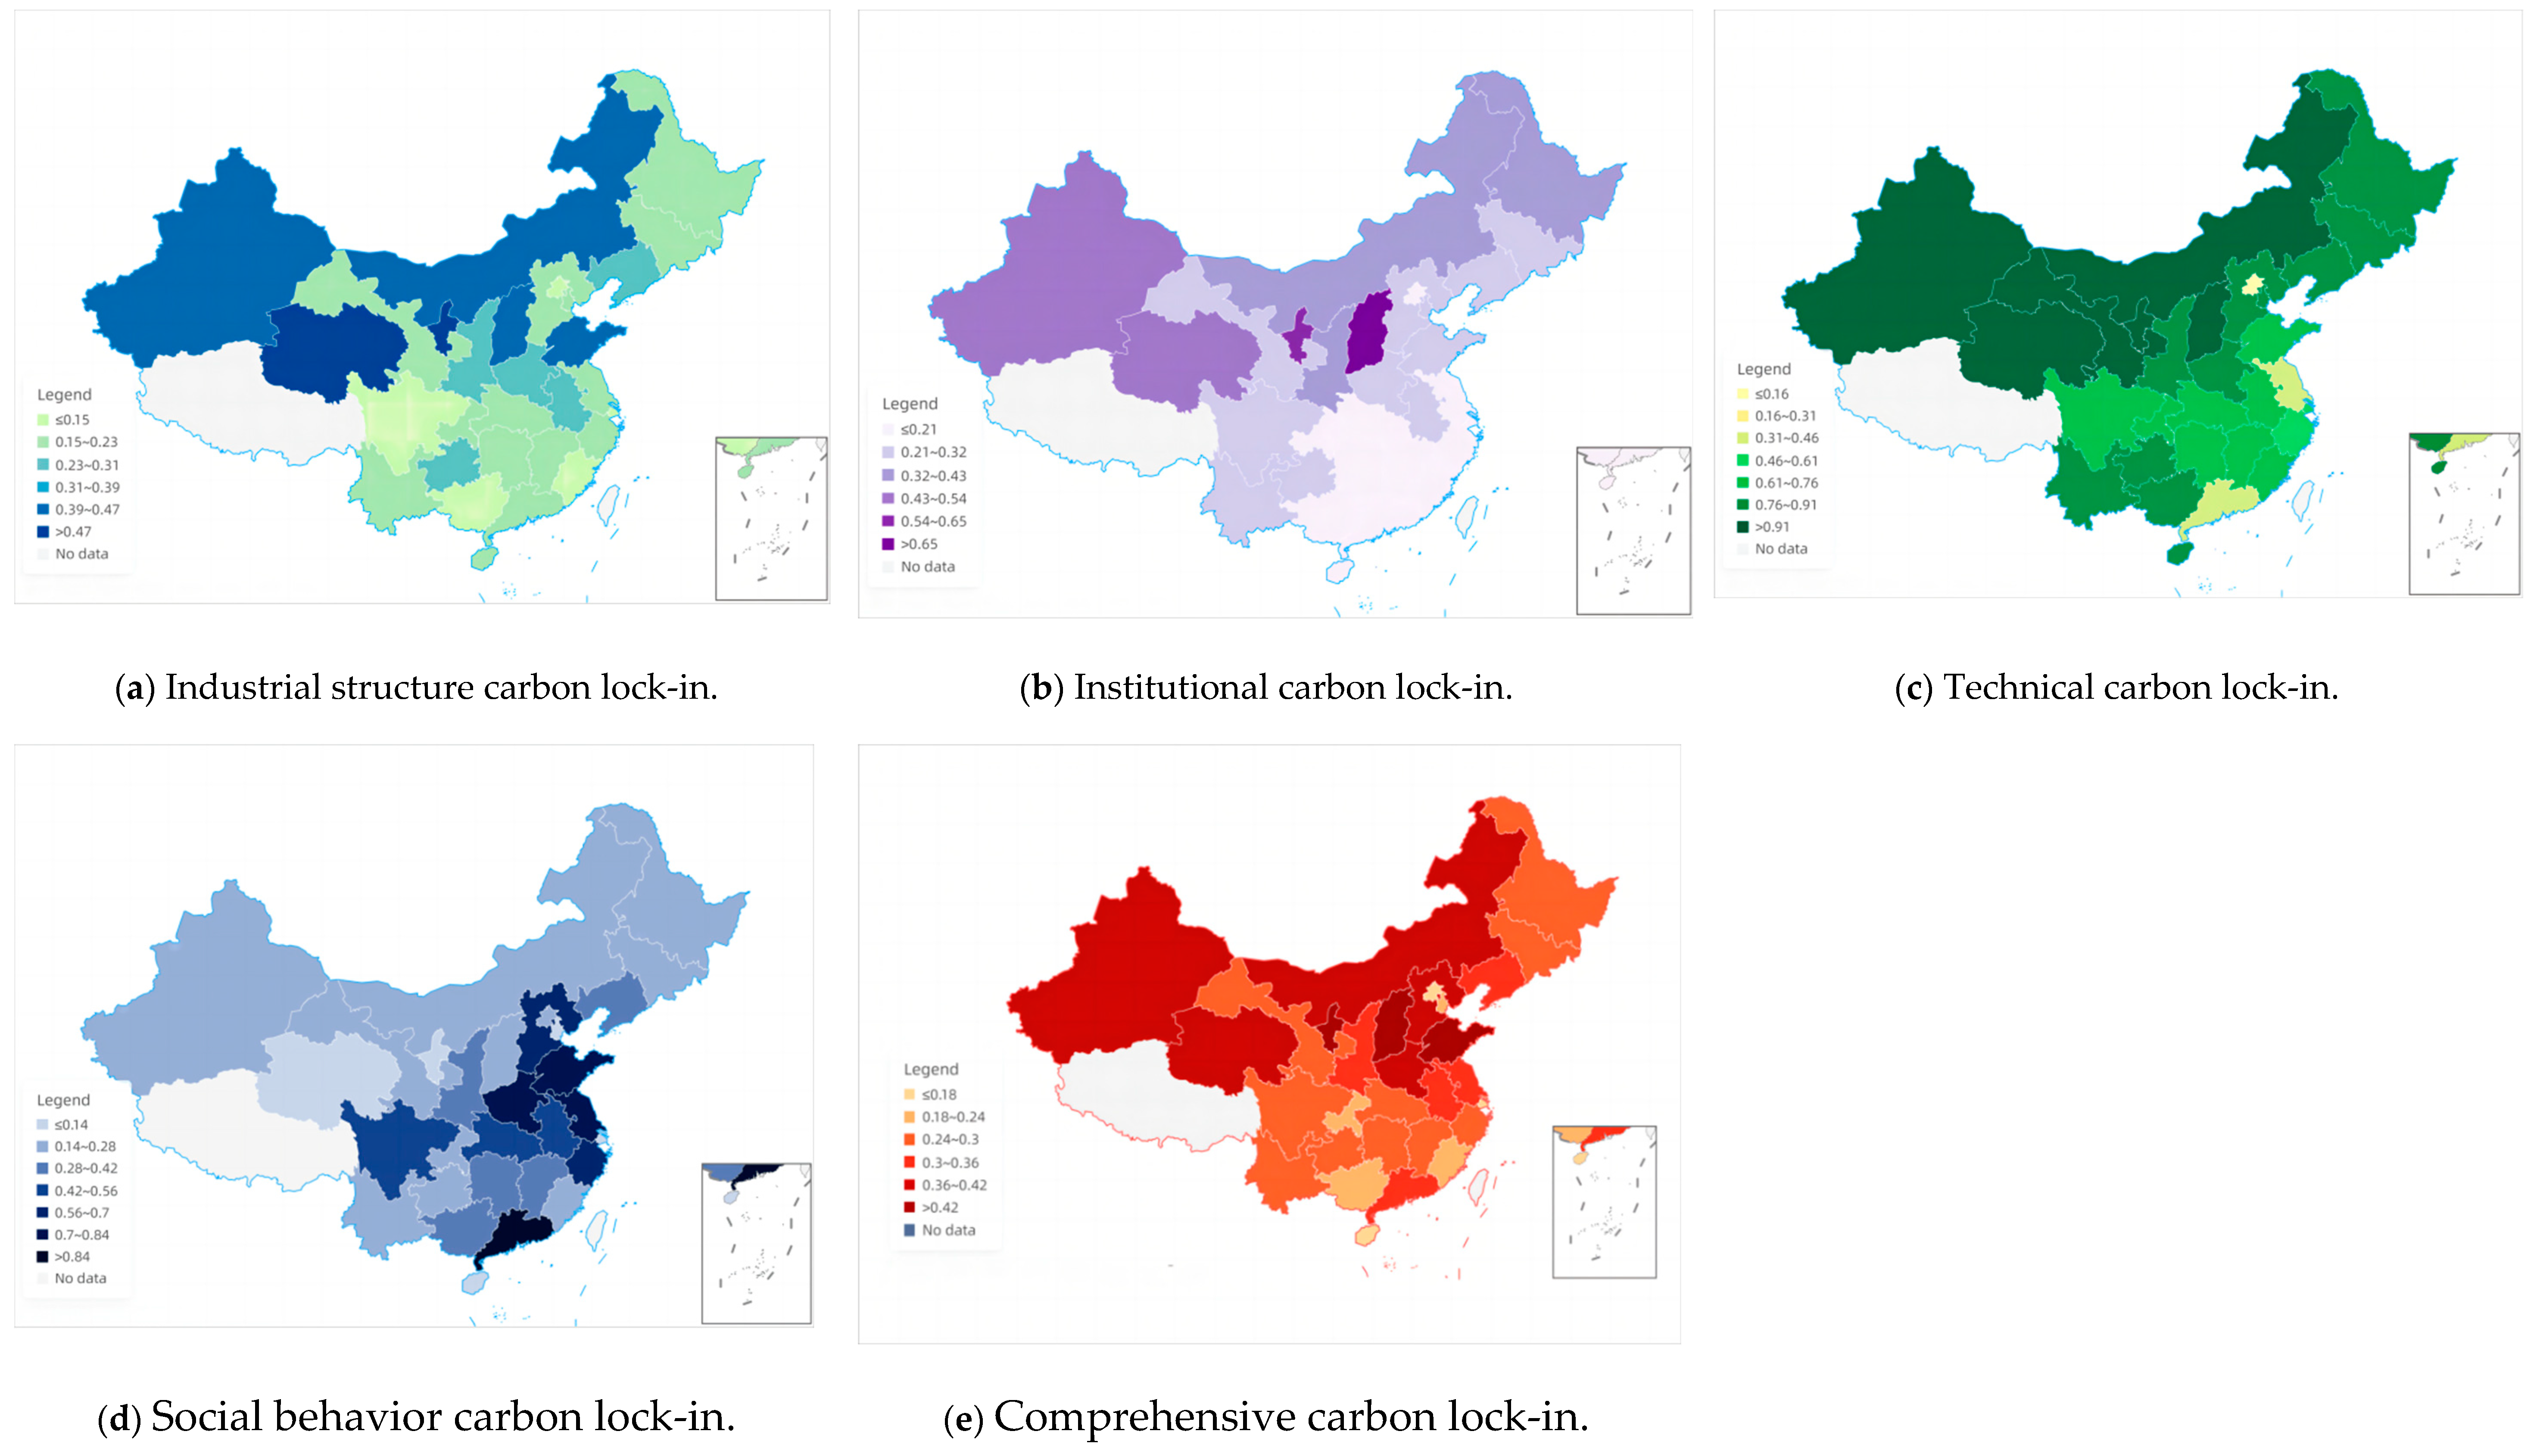
Shanxi (0.4943), Inner Mongolia (0.3947), and Shandong (0.5053) face significant challenges due to high comprehensive CLI, reflecting their dependency on carbon-intensive industries. In contrast, regions like Ningxia, Qinghai, and Xinjiang, despite high levels of CLI across multiple dimensions, show minimal social behavior lock-in due to geographic isolation and sparse populations. Conversely, urban centers such as Beijing, Shanghai, and Hainan exhibit low CLI levels across all categories, benefiting from advanced economies, strong environmental policies, and investments in technology and services that support a low-carbon footprint.
(3)
The analysis across multiple regression models consistently reveals that NGPF significantly mitigates CLI, with the IV-GMM model showing that a 1% increase in NGPFs leads to approximately a 0.9643% decrease in CLI. This underscores NGPFs’ role in reducing carbon dependency. Additionally, while foreign investment can aggravate CLI, particularly in carbon-intensive industries, transitions toward service-oriented economies and increased marketization typically help reduce CLI.
(4)
The asymmetrical relationship between NGPFs and CLI indicates that the impact of NGPFs on CLI consistently exhibits a negative trend across all quantiles; however, the magnitude of this effect diminishes from the lower (10th percentile) to the higher (90th percentile) levels of CLI, decreasing from −0.8712 to −0.2724. This pattern suggests that, while NGPFs effectively reduce CLI across the board, their relative impact lessens as CLI increases.
(5)
The heterogeneity of results across China’s regions indicates that the impact of NGPFs on CLI varies significantly. In the eastern region, the effect of NGPFs is minimal (−13.4020), such that despite a declining trend in CLI, the region’s advanced economic development diminishes the relative effectiveness of further innovations. In contrast, the central and western regions exhibit significant reductions in CLI, with coefficients of −1.1365 and −1.0137, respectively, highlighting the varying regional responses to NGPF interventions.

6.2. Policy Implications

Based on the above research results, three corresponding policy recommendations are proposed.
Firstly, to enhance the role of NGPFs in reducing CLI, targeted strategies are essential. Investment in cutting-edge sustainable technologies, such as renewable energy and smart manufacturing processes, should be increased through tax incentives and subsidies for green patents. Strengthening human capital through specialized STEM education and professional development in emerging technologies is crucial. Modernizing infrastructure to support efficient technology use, coupled with supportive regulatory frameworks and financial incentives for green technology businesses, will facilitate the adoption of NGPFs. These measures will collectively foster a conducive environment for technological innovation and sustainability, aligning with broader efforts to mitigate CLI.
Secondly, enhancing the disincentive effect of NGPFs on CLI requires addressing the conflicting interests and policy lags associated with it. Traditional energy firms may resist the adoption of innovative technologies due to the potential loss of financial benefits from new technologies. Moreover, technological innovation often outpaces policy development, resulting in existing regulations and incentives not being able to adapt to new technological and market developments in a timely manner. Therefore, the timeliness and foresight of policy formulation regarding investment, employment, industry, and region are very important in the context of rapid technology iteration and changing ecological and environmental influences. The point of policy force should be in the early intervention, do not wait until the environmental problems become serious before adopting a series of measures, otherwise the effect of intervention will be greatly reduced. Governments should strengthen monitoring and forecasting of emerging technology trends and implement more flexible policy frameworks. In addition, specific institutions are needed to manage and mediate potential conflicts of interest, thus ensuring that environmental policies are not unduly influenced by existing economic interests.
Third, targeted investments in digital technology, quality infrastructure and innovation should be directed to central and western China, especially to rural areas, to narrow the NGPF gap between urban and rural areas, and between developed cities in the east and poor cities in central and western China. For example, developing centers of excellence and innovation parks in underdeveloped provinces such as Heilongjiang, Gansu, and Qinghai to reduce reliance on traditional industries. For regions with high combined CLIs, such as Shanxi, Inner Mongolia, and Shandong, it is important to capitalize on location advantages and encourage the transition to low-carbon intensive industries by promoting cleaner technologies and restructuring industrial activities. In addition, in regions with the lowest social behavior lock-in, such as Ningxia, Qinghai, and Xinjiang, educational activities and community involvement should be strengthened to increase awareness and support for carbon reduction and environmental protection.

6.3. Global Relevance and Future Research

This study provides empirical evidence that the development of next-generation productive forces (NGPFs) contributes to mitigating CLI in China, with effects that vary across regions and levels of CLI severity. While rooted in the Chinese context, these findings may hold broader implications. Many emerging economies—such as India, Indonesia, and South Africa—are similarly grappling with the challenge of transitioning away from carbon-intensive growth models while striving for technological upgrading and green transformation. In such contexts, the conceptual framework of NGPFs, which integrates technological innovation, industrial restructuring, institutional reform, and talent development, may offer a useful reference for exploring locally adapted decarbonization strategies. Although NGPFs remain a policy-specific concept originating in China, its underlying principles align with global efforts toward building green, inclusive, and innovation-driven economies. Future research may benefit from comparative studies to assess how similar mechanisms operate in different political, economic, and institutional environments, thereby enriching the global discourse on climate transition and sustainable productivity.
While this study provides empirical insights into the role of NGPFs in mitigating CLI, several promising avenues remain for future research. First, future studies could incorporate dynamic modeling approaches, such as structural vector autoregression (SVAR) or system dynamics, to better capture time-lag effects and feedback loops between NGPF development and CLI reduction. Second, utilizing micro-level data (e.g., firm-level innovation behavior or sector-specific carbon intensity) may help uncover more granular mechanisms and heterogeneity in policy effectiveness. Third, comparative studies across emerging economies could explore the contextual transferability of China’s NGPF-oriented decarbonization strategies, contributing to a broader understanding of how productive transformation can support global climate goals under different institutional and developmental conditions.

Author Contributions

Conceptualization, C.S. and J.H.; methodology, X.M., J.H. and Z.L.; software, C.S., Z.G., X.M. and Z.L.; validation, X.M. and Z.L.; formal analysis, C.S. and Z.G.; investigation, J.H.; resources, C.S.; data curation, Z.G.; writing—original draft preparation, C.S., X.M., J.H. and Z.L.; writing—review and editing, Z.G., J.H. and Z.L.; visualization, C.S.; supervision, J.H. and Z.L.; project administration, X.M.; funding acquisition, C.S. All authors have read and agreed to the published version of the manuscript.

Funding

This research was funded by the Beijing Municipal Social Science Foundation (Grant No. 24GLC046).

Institutional Review Board Statement

Not applicable.

Informed Consent Statement

Not applicable.

Data Availability Statement

The data presented in this study are available on request from the corresponding author. The data are not publicly available due to institutional restrictions or proprietary reasons.

Conflicts of Interest

The authors declare no conflict of interest.

References

  1. Upreti, G. Climate Change and Its Threat to Humanity in the Anthropocene. In Ecosociocentrism: The Earth First Paradigm for Sustainable Living; Springer: Berlin/Heidelberg, Germany, 2023; pp. 137–162. [Google Scholar]
  2. Ahmed, R.; Tamim, M.T.R. Marine and Coastal Environments: Challenges, Impacts, and Strategies for a Sustainable Future. Int. J. Sci. Educ. Sci. 2025, 2, 53–60. [Google Scholar] [CrossRef]
  3. Kongkuah, M.; Yao, H.; Yilanci, V. The relationship between energy consumption, economic growth, and CO2 emissions in China: The role of urbanisation and international trade. Environ. Dev. Sustain. 2022, 24, 4684–4708. [Google Scholar] [CrossRef]
  4. Yu, L.; Wang, Y.; Wei, X.; Zeng, C. Towards low-carbon development: The role of industrial robots in decarbonization in Chinese cities. J. Environ. Manag. 2023, 330, 117216. [Google Scholar] [CrossRef] [PubMed]
  5. Li, T.; Shi, Z.; Han, D. Does renewable energy consumption contribute to the development of low-carbon economy? Evidence from China. Environ. Sci. Pollut. Res. 2021, 28, 54891–54908. [Google Scholar] [CrossRef]
  6. Biniek-Poskart, A.; Sajdak, M.; Skrzyniarz, M.; Rzącki, J.; Skibiński, A.; Zajemska, M. The Application of Lignocellulosic Biomass Waste in the Iron and Steel Industry in the Context of Challenges Related to the Energy Crisis. Energies 2023, 16, 6662. [Google Scholar] [CrossRef]
  7. Wang, Y.; Pan, W. The contribution of cleaner production in the material industry to reducing embodied energy and emissions in China’s building sector. Build. Environ. 2023, 242, 110555. [Google Scholar] [CrossRef]
  8. Zhang, L.; Ponomarenko, T. Directions for sustainable development of china’s coal industry in the post-epidemic era. Sustainability 2023, 15, 6518. [Google Scholar] [CrossRef]
  9. Xiang, C.; Zheng, X.; Xie, L. How can China’s power sector reform reduce carbon emissions? A long-term competition perspective. China Econ. Rev. 2023, 80, 102000. [Google Scholar] [CrossRef]
  10. Unruh, G.C. Understanding carbon lock-in. Energy Policy 2000, 28, 817–830. [Google Scholar] [CrossRef]
  11. Agbonifo, P.E. Renewable energy development: Opportunities and barriers within the context of global energy politics. Int. J. Energy Econ. Policy 2021, 11, 141–148. [Google Scholar] [CrossRef]
  12. Janipour, Z.; de Nooij, R.; Scholten, P.; Huijbregts, M.A.; de Coninck, H. What are sources of carbon lock-in in energy-intensive industry? A case study into Dutch chemicals production. Energy Res. Soc. Sci. 2020, 60, 101320. [Google Scholar] [CrossRef]
  13. Shang, W.-L.; Lv, Z. Low carbon technology for carbon neutrality in sustainable cities: A survey. Sustain. Cities Soc. 2023, 92, 104489. [Google Scholar] [CrossRef]
  14. Gong, X.; Wong, W.-K.; Peng, Y.; Khamdamov, S.-J.; Albasher, G.; Hoa, V.T.; Nhan, N.T.T. Exploring an interdisciplinary approach to sustainable economic development in resource-rich regions: An investigation of resource productivity, technological innovation, and ecosystem resilience. Resour. Policy 2023, 87, 104294. [Google Scholar] [CrossRef]
  15. Hassan, Q.; Viktor, P.; Al-Musawi, T.J.; Ali, B.M.; Algburi, S.; Alzoubi, H.M.; Al-Jiboory, A.K.; Sameen, A.Z.; Salman, H.M.; Jaszczur, M. The renewable energy role in the global energy Transformations. Renew. Energy Focus 2024, 48, 100545. [Google Scholar] [CrossRef]
  16. Kivimaa, P.; Laakso, S.; Lonkila, A.; Kaljonen, M. Moving beyond disruptive innovation: A review of disruption in sustainability transitions. Environ. Innov. Soc. Transit. 2021, 38, 110–126. [Google Scholar] [CrossRef]
  17. Davidson, M.; Karplus, V.J.; Zhang, D.; Zhang, X. Policies and institutions to support carbon neutrality in China by 2060. Econ. Energy Environ. Policy 2021, 10, 7–24. [Google Scholar] [CrossRef]
  18. Salma, A.; Fryda, L.; Djelal, H. Biochar: A Key Player in Carbon Credits and Climate Mitigation. Resources 2024, 13, 31. [Google Scholar] [CrossRef]
  19. Zhao, C.; Ma, X.; Che, S.; Liu, Z.; Song, C. Does climate aid alleviate carbon lock-in? A global perspective. J. Clean. Prod. 2024, 449, 141782. [Google Scholar] [CrossRef]
  20. Naradda Gamage, S.K.; Ekanayake, E.; Abeyrathne, G.; Prasanna, R.; Jayasundara, J.; Rajapakshe, P. A review of global challenges and survival strategies of small and medium enterprises (SMEs). Economies 2020, 8, 79. [Google Scholar] [CrossRef]
  21. Luna-Nemecio, J.; Tobón, S.; Juárez-Hernández, L.G. Sustainability-based on socioformation and complex thought or sustainable social development. Resour. Environ. Sustain. 2020, 2, 100007. [Google Scholar] [CrossRef]
  22. Peng, X. Strategic interaction of environmental regulation and green productivity growth in China: Green innovation or pollution refuge? Sci. Total Environ. 2020, 732, 139200. [Google Scholar] [CrossRef] [PubMed]
  23. Zhao, C.; Wang, J.; Dong, K.; Wang, K. How does renewable energy encourage carbon unlocking? A global case for decarbonization. Resour. Policy 2023, 83, 103622. [Google Scholar] [CrossRef]
  24. Khan, M.A.-A.; Cárdenas-Barrón, L.E.; Treviño-Garza, G.; Céspedes-Mota, A. Optimal circular economy index policy in a production system with carbon emissions. Expert Syst. Appl. 2023, 212, 118684. [Google Scholar] [CrossRef]
  25. Krishnan, R.; Perumal, E.; Govindaraj, M.; Kandasamy, L. Enhancing Logistics Operations Through Technological Advancements for Superior Service Efficiency. In Innovative Technologies for Increasing Service Productivity; IGI Global: Hershey, PA, USA, 2024; pp. 61–82. [Google Scholar]
  26. Akter, S.; Wamba, S.F.; Mariani, M.; Hani, U. How to build an AI climate-driven service analytics capability for innovation and performance in industrial markets? Ind. Mark. Manag. 2021, 97, 258–273. [Google Scholar] [CrossRef]
  27. Karunathilake, E.; Le, A.T.; Heo, S.; Chung, Y.S.; Mansoor, S. The path to smart farming: Innovations and opportunities in precision agriculture. Agriculture 2023, 13, 1593. [Google Scholar] [CrossRef]
  28. Bradford, A. The False Choice Between Digital Regulation and Innovation. Northwestern Univ. Law Rev. 2024, 118, 377. [Google Scholar] [CrossRef]
  29. Songwe, V.; Stern, N.; Bhattacharya, A. Finance for Climate Action: Scaling Up Investment for Climate and Development; Grantham Research Institute on Climate Change and the Environment, London School of Economics and Political Science: London, UK, 2022. [Google Scholar]
  30. Li, D.; Zhou, Z.; Cao, L.; Zhao, K.; Li, B.; Ding, C. What drives the change in China’s provincial industrial carbon unlocking efficiency? Evidence from a geographically and temporally weighted regression model. Sci. Total Environ. 2023, 856, 158971. [Google Scholar] [CrossRef]
  31. Lim, W.M. The workforce revolution: Reimagining work, workers, and workplaces for the future. Glob. Bus. Organ. Excell. 2023, 42, 5–10. [Google Scholar] [CrossRef]
  32. Dong, F.; Hu, M.; Gao, Y.; Liu, Y.; Zhu, J.; Pan, Y. How does digital economy affect carbon emissions? Evidence from global 60 countries. Sci. Total Environ. 2022, 852, 158401. [Google Scholar] [CrossRef]
  33. Cumming, D.; Filatotchev, I.; Reinecke, J.; Wood, G. New investor categories, agility and HRM: The case of Sovereign Wealth Funds. Hum. Resour. Manag. Rev. 2020, 30, 100694. [Google Scholar] [CrossRef]
  34. Ahsan, F.; Dana, N.H.; Sarker, S.K.; Li, L.; Muyeen, S.; Ali, M.F.; Tasneem, Z.; Hasan, M.M.; Abhi, S.H.; Islam, M.R. Data-driven next-generation smart grid towards sustainable energy evolution: Techniques and technology review. Prot. Control Mod. Power Syst. 2023, 8, 43. [Google Scholar] [CrossRef]
  35. Xuan, D.; Ma, X.; Shang, Y. Can China’s policy of carbon emission trading promote carbon emission reduction? J. Clean. Prod. 2020, 270, 122383. [Google Scholar] [CrossRef]
  36. Wang, B.; Wang, J.; Dong, K.; Dong, X. Is the digital economy conducive to the development of renewable energy in Asia? Energy Policy 2023, 173, 113381. [Google Scholar] [CrossRef]
  37. Cui, X.; Zhao, T.; Wang, J. Allocation of carbon emission quotas in China’s provincial power sector based on entropy method and ZSG-DEA. J. Clean. Prod. 2021, 284, 124683. [Google Scholar] [CrossRef]
  38. Wang, J.; Liu, Y.; Wang, W.; Wu, H. How does digital transformation drive green total factor productivity? Evidence from Chinese listed enterprises. J. Clean. Prod. 2023, 406, 136954. [Google Scholar] [CrossRef]
  39. Zhao, C.; Taghizadeh-Hesary, F.; Dong, K.; Dong, X. Breaking carbon lock-in: The role of green financial inclusion for China. J. Environ. Plan. Manag. 2024, 67, 564–593. [Google Scholar] [CrossRef]
  40. Schroeder, K.; Lampietti, J.; Elabed, G. What’s Cooking: Digital Transformation of the Agrifood System; World Bank Publications: Washington, DC, USA, 2021. [Google Scholar]
  41. Juhász, R.; Lane, N.; Rodrik, D. The new economics of industrial policy. Annu. Rev. Econ. 2023, 16, 213–242. [Google Scholar] [CrossRef]
  42. Karnik, N.; Bora, U.; Bhadri, K.; Kadambi, P.; Dhatrak, P. A comprehensive study on current and future trends towards the characteristics and enablers of industry 4.0. J. Ind. Inf. Integr. 2022, 27, 100294. [Google Scholar] [CrossRef]
  43. Israr, A.; Yang, Q.; Li, W.; Zomaya, A.Y. Renewable energy powered sustainable 5G network infrastructure: Opportunities, challenges and perspectives. J. Netw. Comput. Appl. 2021, 175, 102910. [Google Scholar] [CrossRef]
  44. Guo, Q.; Wang, Y.; Dong, X. Effects of smart city construction on energy saving and CO2 emission reduction: Evidence from China. Appl. Energy 2022, 313, 118879. [Google Scholar] [CrossRef]
  45. Mamirkulova, G.; Mi, J.; Abbas, J.; Mahmood, S.; Mubeen, R.; Ziapour, A. New Silk Road infrastructure opportunities in developing tourism environment for residents better quality of life. Glob. Ecol. Conserv. 2020, 24, e01194. [Google Scholar] [CrossRef]
  46. Tang, C.; Xu, Y.; Hao, Y.; Wu, H.; Xue, Y. What is the role of telecommunications infrastructure construction in green technology innovation? A firm-level analysis for China. Energy Econ. 2021, 103, 105576. [Google Scholar] [CrossRef]
  47. Potrč, S.; Čuček, L.; Martin, M.; Kravanja, Z. Sustainable renewable energy supply networks optimization–The gradual transition to a renewable energy system within the European Union by 2050. Renew. Sustain. Energy Rev. 2021, 146, 111186. [Google Scholar] [CrossRef]
  48. Wu, J.; Li, Q.; Chen, Q.; Peng, G.; Wang, J.; Fu, Q.; Yang, B. Evaluation, analysis and diagnosis for HVDC transmission system faults via knowledge graph under new energy systems construction: A critical review. Energies 2022, 15, 8031. [Google Scholar] [CrossRef]
  49. Dong, F.; Li, Y.; Gao, Y.; Zhu, J.; Qin, C.; Zhang, X. Energy transition and carbon neutrality: Exploring the non-linear impact of renewable energy development on carbon emission efficiency in developed countries. Resour. Conserv. Recycl. 2022, 177, 106002. [Google Scholar] [CrossRef]
  50. Rymarczyk, J. Technologies, opportunities and challenges of the industrial revolution 4.0: Theoretical considerations. Entrep. Bus. Econ. Rev. 2020, 8, 185–198. [Google Scholar] [CrossRef]
  51. Ammar, M.; Haleem, A.; Javaid, M.; Walia, R.; Bahl, S. Improving material quality management and manufacturing organizations system through Industry 4.0 technologies. Mater. Today Proc. 2021, 45, 5089–5096. [Google Scholar] [CrossRef]
  52. Wan, Q.; Chen, J.; Yao, Z.; Yuan, L. Preferential tax policy and R&D personnel flow for technological innovation efficiency of China’s high-tech industry in an emerging economy. Technol. Forecast. Soc. Change 2022, 174, 121228. [Google Scholar]
  53. Yang, B.; Zhu, S. Public funds in high-tech industries: A blessing or a curse. Socio-Econ. Plan. Sci. 2022, 83, 101037. [Google Scholar] [CrossRef]
  54. Parmentola, A.; Ferretti, M.; Panetti, E. Exploring the university-industry cooperation in a low innovative region. What differences between low tech and high tech industries? Int. Entrep. Manag. J. 2021, 17, 1469–1496. [Google Scholar] [CrossRef]
  55. Chen, Z.; Zhang, J.; Zi, Y. A cost-benefit analysis of R&D and patents: Firm-level evidence from China. Eur. Econ. Rev. 2021, 133, 103633. [Google Scholar]
  56. Taques, F.H.; López, M.G.; Basso, L.F.; Areal, N. Indicators used to measure service innovation and manufacturing innovation. J. Innov. Knowl. 2021, 6, 11–26. [Google Scholar] [CrossRef]
  57. Cao, X.; Deng, M.; Li, H. How does e-commerce city pilot improve green total factor productivity? Evidence from 230 cities in China. J. Environ. Manag. 2021, 289, 112520. [Google Scholar] [CrossRef]
  58. Cioffi, R.; Travaglioni, M.; Piscitelli, G.; Petrillo, A.; De Felice, F. Artificial intelligence and machine learning applications in smart production: Progress, trends, and directions. Sustainability 2020, 12, 492. [Google Scholar] [CrossRef]
  59. Zhou, L.; Tang, L. Environmental regulation and the growth of the total-factor carbon productivity of China’s industries: Evidence from the implementation of action plan of air pollution prevention and control. J. Environ. Manag. 2021, 296, 113078. [Google Scholar] [CrossRef] [PubMed]
  60. Jabbour, C.J.C.; Fiorini, P.D.C.; Ndubisi, N.O.; Queiroz, M.M.; Piato, É.L. Digitally-enabled sustainable supply chains in the 21st century: A review and a research agenda. Sci. Total Environ. 2020, 725, 138177. [Google Scholar] [CrossRef]
  61. Wang, W.; Kumar, N.; Chen, J.; Gong, Z.; Kong, X.; Wei, W.; Gao, H. Realizing the potential of the internet of things for smart tourism with 5G and AI. IEEE Netw. 2020, 34, 295–301. [Google Scholar] [CrossRef]
  62. Ciampi, F.; Demi, S.; Magrini, A.; Marzi, G.; Papa, A. Exploring the impact of big data analytics capabilities on business model innovation: The mediating role of entrepreneurial orientation. J. Bus. Res. 2021, 123, 1–13. [Google Scholar] [CrossRef]
  63. Cappa, F.; Oriani, R.; Peruffo, E.; McCarthy, I. Big data for creating and capturing value in the digitalized environment: Unpacking the effects of volume, variety, and veracity on firm performance. J. Prod. Innov. Manag. 2021, 38, 49–67. [Google Scholar] [CrossRef]
  64. Zhang, H.; Xu, L.; Zhou, P.; Zhu, X.; Cudjoe, D. Coordination between economic growth and carbon emissions: Evidence from 178 cities in China. Econ. Anal. Policy 2024, 81, 164–180. [Google Scholar] [CrossRef]
  65. Bang, G.; Rosendahl, K.E.; Böhringer, C. Balancing cost and justice concerns in the energy transition: Comparing coal phase-out policies in Germany and the UK. Clim. Policy 2022, 22, 1000–1015. [Google Scholar] [CrossRef]
  66. Sovacool, B.K.; Newell, P.; Carley, S.; Fanzo, J. Equity, technological innovation and sustainable behaviour in a low-carbon future. Nat. Hum. Behav. 2022, 6, 326–337. [Google Scholar] [CrossRef]
  67. Rehan, H. The Future of Electric Vehicles: Navigating the Intersection of AI, Cloud Technology, and Cybersecurity. Val. Int. J. Digit. Libr. 2024, 12, 1127–1143. [Google Scholar] [CrossRef]
  68. Shayegh, S.; Dasgupta, S. Climate change, labour availability and the future of gender inequality in South Africa. Clim. Dev. 2024, 16, 209–226. [Google Scholar] [CrossRef]
  69. Tittensor, D.P.; Novaglio, C.; Harrison, C.S.; Heneghan, R.F.; Barrier, N.; Bianchi, D.; Bopp, L.; Bryndum-Buchholz, A.; Britten, G.L.; Büchner, M. Next-generation ensemble projections reveal higher climate risks for marine ecosystems. Nat. Clim. Change 2021, 11, 973–981. [Google Scholar] [CrossRef]
  70. Borozan, D.; Pirgaip, B. Climate policy uncertainty and firm-level carbon dioxide emissions: Assessing the impact in the US market. Bus. Strategy Environ. 2024, 33, 5920–5938. [Google Scholar] [CrossRef]
  71. Sen, S.; Nayak, N.C.; Mohanty, W.K. Impact of tropical cyclones on sustainable development through loops and cycles: Evidence from select developing countries of Asia. Empir. Econ. 2023, 65, 2467–2498. [Google Scholar] [CrossRef]
  72. Sun, H. What are the roles of green technology innovation and ICT employment in lowering carbon intensity in China? A city-level analysis of the spatial effects. Resour. Conserv. Recycl. 2022, 186, 106550. [Google Scholar] [CrossRef]
  73. Ekins, P.; Zenghelis, D. The costs and benefits of environmental sustainability. Sustain. Sci. 2021, 16, 949–965. [Google Scholar] [CrossRef]
  74. Zhang, S.; Lin, S.; Wang, C.; Shahbaz, P. Towards energy sustainability: Exploring the nexus between global value chain participation and energy security in developing and developed countries. PLoS ONE 2024, 19, e0296705. [Google Scholar] [CrossRef]
  75. Semieniuk, G.; Campiglio, E.; Mercure, J.F.; Volz, U.; Edwards, N.R. Low-carbon transition risks for finance. Wiley Interdiscip. Rev. Clim. Change 2021, 12, e678. [Google Scholar] [CrossRef]
  76. Tcvetkov, P. Climate policy imbalance in the energy sector: Time to focus on the value of CO2 utilization. Energies 2021, 14, 411. [Google Scholar] [CrossRef]
  77. Boys, J.; Ford, P. The E-Revolution and Post-Compulsory Education: Using E-Business Models to Deliver Quality Education; Taylor & Francis: Abingdon, UK, 2023. [Google Scholar]
  78. Firdausy, D.R. A Service-Oriented Business Collaboration Reference Architecture for Rural Business Ecosystem. Master’s Thesis, University of Twente, Enschede, The Netherlands, 2021. [Google Scholar]
  79. Jones, J.M. Strategies to overcome constraints for Small Business Sustainability. Ph.D. Thesis, Walden University, Minneapolis, MN, USA, 2021. [Google Scholar]
  80. Elavarasan, R.M.; Pugazhendhi, R.; Irfan, M.; Mihet-Popa, L.; Khan, I.A.; Campana, P.E. State-of-the-art sustainable approaches for deeper decarbonization in Europe–An endowment to climate neutral vision. Renew. Sustain. Energy Rev. 2022, 159, 112204. [Google Scholar] [CrossRef]
  81. Ahmad, D.; Afzal, M. Climate change adaptation impact on cash crop productivity and income in Punjab province of Pakistan. Environ. Sci. Pollut. Res. 2020, 27, 30767–30777. [Google Scholar] [CrossRef]
  82. SHoppe, T.; Miedema, M. A governance approach to regional energy transition: Meaning, conceptualization and practice. Sustainability 2020, 12, 915. [Google Scholar] [CrossRef]
  83. Lv, Y.; Liu, J.; Cheng, J.; Andreoni, V. The persistent and transient total factor carbon emission performance and its economic determinants: Evidence from China’s province-level panel data. J. Clean. Prod. 2021, 316, 128198. [Google Scholar] [CrossRef]
  84. Dell, M.; Jones, B.F.; Olken, B.A. Temperature shocks and economic growth: Evidence from the last half century. Am. Econ. J. Macroecon. 2012, 4, 66–95. [Google Scholar] [CrossRef]
  85. Nunn, N.; Puga, D. Ruggedness: The blessing of bad geography in Africa. Rev. Econ. Stat. 2012, 94, 20–36. [Google Scholar] [CrossRef]
  86. Anser, M.K.; Ahmad, M.; Khan, M.A.; Zaman, K.; Nassani, A.A.; Askar, S.E.; Abro, M.M.Q.; Kabbani, A. The role of information and communication technologies in mitigating carbon emissions: Evidence from panel quantile regression. Environ. Sci. Pollut. Res. 2021, 28, 21065–21084. [Google Scholar] [CrossRef]
  87. Cheng, C.; Ren, X.; Dong, K.; Dong, X.; Wang, Z. How does technological innovation mitigate CO2 emissions in OECD countries? Heterogeneous analysis using panel quantile regression. J. Environ. Manag. 2021, 280, 111818. [Google Scholar] [CrossRef]
  88. Xie, Z.; Wu, R.; Wang, S. How technological progress affects the carbon emission efficiency? Evidence from national panel quantile regression. J. Clean. Prod. 2021, 307, 127133. [Google Scholar] [CrossRef]
  89. Bessi, A.; Guidolin, M.; Manfredi, P. The role of gas on future perspectives of renewable energy diffusion: Bridging technology or lock-in? Renew. Sustain. Energy Rev. 2021, 152, 111673. [Google Scholar] [CrossRef]
  90. Trencher, G.; Rinscheid, A.; Duygan, M.; Truong, N.; Asuka, J. Revisiting carbon lock-in in energy systems: Explaining the perpetuation of coal power in Japan. Energy Res. Soc. Sci. 2020, 69, 101770. [Google Scholar] [CrossRef]
  91. Hao, L.-N.; Umar, M.; Khan, Z.; Ali, W. Green growth and low carbon emission in G7 countries: How critical the network of environmental taxes, renewable energy and human capital is? Sci. Total Environ. 2021, 752, 141853. [Google Scholar] [CrossRef]
  92. Wang, C.A.; Lin, K.; Liu, X. Can the low-carbon city pilot policy promote the upgrading of high-carbon emitting enterprises? Evidence from China. Chin. J. Popul. Resour. Environ. 2022, 20, 217–226. [Google Scholar] [CrossRef]
  93. Wang, Y.; Zhao, Z.; Shi, M.; Liu, J.; Tan, Z. Public environmental concern, government environmental regulation and urban carbon emission reduction—Analyzing the regulating role of green finance and industrial agglomeration. Sci. Total Environ. 2024, 924, 171549. [Google Scholar] [CrossRef]
  94. Zhou, Q.; Cheng, C.; Fang, Z.; Zhang, H.; Xu, Y. How does the development of the digital economy affect innovation output? Exploring mechanisms from the perspective of regional innovation systems. Struct. Change Econ. Dyn. 2024, 70, 1–17. [Google Scholar] [CrossRef]
  95. Ghorbani, Y.; Zhang, S.E.; Nwaila, G.T.; Bourdeau, J.E.; Rose, D.H. Embracing a diverse approach to a globally inclusive green energy transition: Moving beyond decarbonisation and recognising realistic carbon reduction strategies. J. Clean. Prod. 2023, 434, 140414. [Google Scholar] [CrossRef]
  96. Rowan, N.J.; Galanakis, C.M. Unlocking challenges and opportunities presented by COVID-19 pandemic for cross-cutting disruption in agri-food and green deal innovations: Quo Vadis? Sci. Total Environ. 2020, 748, 141362. [Google Scholar] [CrossRef]
  97. Yin, K.; Miao, Y.; Huang, C. Environmental regulation, technological innovation, and industrial structure upgrading. Energy Environ. 2024, 35, 207–227. [Google Scholar] [CrossRef]
  98. Chaobo, Z.; Qi, S. Can carbon emission trading policy break China’s urban carbon lock-in? J. Environ. Manag. 2024, 353, 120129. [Google Scholar] [CrossRef] [PubMed]
  99. Chen, Y.; Liu, K.; Ni, L.; Chen, M. Impact of carbon lock-in on green economic efficiency: Evidence from Chinese provincial data. Sci. Total Environ. 2023, 892, 164581. [Google Scholar] [CrossRef] [PubMed]
  100. Pueyo, A. What constrains renewable energy investment in Sub-Saharan Africa? A comparison of Kenya and Ghana. World Dev. 2018, 109, 85–100. [Google Scholar] [CrossRef]
  101. Sovacool, B.K.; Griffiths, S.; Kim, J.; Bazilian, M. Climate change and industrial decarbonization: A critical and systematic review of developments, socio-technical systems and policy options. Energy Res. Soc. Sci. 2021, 80, 102212. [Google Scholar] [CrossRef]
  102. Den Uyl, R.M.; Russel, D.J. Climate adaptation in fragmented governance settings: The consequences of reform in public administration. Environ. Politics 2017, 27, 341–361. [Google Scholar] [CrossRef]
  103. Doda, B.; Taschini, L. Carbon dating: When is it beneficial to link ETSs? J. Assoc. Environ. Resour. Econ. 2017, 4, 701–730. [Google Scholar] [CrossRef]
Figure 1. Keyword co-occurrence network of carbon lock-in literature (VOSviewer 1.6.19). Note that the clusters represent major thematic domains: (1) policy and institutional transition (purple), (2) regional energy systems and emissions (blue), (3) innovation and system dynamics (yellow), (4) carbon-based nanotechnologies (red), and (5) diagnostic and monitoring technologies (green).
Sustainability 17 04241 g001
Figure 2. Keyword co-occurrence network of green total factor productivity (GTFP) literature (VOSviewer 1.6.19). Note: the network visualization is based on keyword co-occurrence frequencies in international academic publications. The clusters represent major research themes: (1) measurement and modeling of green productivity and efficiency (green); (2) policy, finance, and innovation-driven mechanisms (blue); (3) empirical determinants and trade openness (orange); (4) agricultural and ecological productivity systems (red); and (5) digital economy, infrastructure, and structural upgrading (yellow).
Sustainability 17 04241 g002
Figure 3. NGPF levels in various provinces of China from 2012 to 2022 (Python).
Sustainability 17 04241 g003
Figure 4. Spatial distribution of the mean values of the raw CLI indicators (four types and comprehensive) in China from 2012 to 2022.
Sustainability 17 04241 g004
Figure 5. Panel quantile regression results.(The red line indicates the estimated coefficients across quantiles, and the gray shaded area represents the 95% confidence interval.)
Sustainability 17 04241 g005
Table 1. Index system for measuring the level of China’s NGPFs.
Index CategoryMain IndicatorsSub-IndicatorsIndicator Description
New labor forceNumber of new workersNumber of new industry employeesThe number of employees of listed companies in strategic emerging industries and future industries is summarized, at the provincial level, according to the place of registration [38].
New labor structureNew industry employee education structureProportion of employees with a bachelor’s degree or above in listed companies in strategic emerging industries and future industries [41].
New industry employee skill structureProportion of employees in technology departments of listed companies in strategic emerging industries and future industries [30].
New means of laborNew tool of productionIndustrial robot penetrationReferences: [4,31].
Integrated circuit outputData originating from industrial information technology [42].
New infrastructureNumber of 5G mobile usersData originating from industrial information technology [43].
Major national science and technology infrastructure constructionData originating from [44,45].
New labor objectsNew energyProportion of new energy power generationNew energy power generation/total power generation [46].
Number of uhv transmission linesMeasurable new energy consumption levels [47].
New energy utilization efficiencyGdp/new energy power generation [48].
New materialsOutput value of the new materials industryOperating income of new materials-related listed companies [49,50].
Number of newly listed material companiesNumber of listed companies related to new materials [51].
New technologyTechnology R&DHigh-tech R&D personnelNumber of R&D personnel in high-tech enterprises [52].
Investment in high-tech R&D fundsR&D investment by high-tech enterprises [53].
Number of high-tech R&D institutionsNumber of R&D institutions of high-tech enterprises [54].
Number of high-tech invention patent applicationsNumber of invention patent applications by high-tech enterprises [55].
Innovation outputHigh-tech new product sales revenueNew product sales revenue of high-tech enterprises [56].
Number of e-commerce companiesNumber of enterprises with e-commerce transaction activities [57].
New production organizationIntelligentNumber of artificial intelligence companiesData originating from Tianyancha [58].
GreeningCompleted investment in industrial pollution controlMeasuring the level of integrated development of informatization and industrialization [59].
Integration Level of integration of informatizationThe data originate from the statistical yearbooks of each province [60].
Data elementsBig data generationData traffic from mobile internet accessMeasuring the scale of big data generation [61].
Big data processingData processing and operational service revenueMeasuring the scale of big data processing [62].
Big data transactionNumber of data exchangesMeasuring the size of big data transactions [63].
Table 2. Descriptive statistic.
VariableObs.MeanSDMin.MedianMax.
lnCLI330−1.15580.3778−2.6205−1.0925−0.4858
lnNGPFs3301.26510.52260.00070.12890.8229
lnIND3301.30130.72780.54931.13585.2968
lnFIN3300.01880.01900.00000.01630.1142
lnGRE3300.24920.10190.10660.22630.6430
lnTRD3300.38180.06880.18270.38840.6030
lnEAW3309.34870.91367.47399.258012.7820
lnMAR3308.24981.91503.35908.337012.8640
Table 3. Benchmark regression.
(1)(2)(3)(4)(5)
VariableOLSFEREFGLSIV-GMM
lnNGPFs−0.2465 ***−0.4617 ***−0.4573 ***−0.4793 ***−0.9643 ***
(−5.24)(−12.89)(−13.63)(−13.70)(−5.28)
lnIND−0.2440 ***−0.0767 **−0.0942 ***−0.0726 ***−0.1283 ***
(−6.64)(−2.43)(−3.27)(−2.99)(−2.91)
lnFIN2.7955 ***1.7708 ***1.7694 ***1.0492 ***3.3414 ***
(3.19)(4.49)(4.51)(3.68)(4.21)
lnGRE−0.1756−0.1134−0.14030.0626−0.1067
(−0.73)(−0.48)(−0.64)(0.40)(−0.34)
lnTRD0.6064 **0.2562 *0.2605 *0.1942 *0.1312
(2.44)(1.74)(1.81)(1.95)(0.69)
lnEAW−0.0161−0.0147−0.03160.0040−0.0098
(−0.56)(−0.42)(−1.04)(0.17)(−0.22)
lnMAR−0.0325 **0.0199 *0.0183 *0.0266 ***0.0074
(−2.10)(1.73)(1.70)(3.59)(0.46)
Constant−0.3475−0.6196 *−0.4394−1.1309 ***0.2306
(−1.10)(−1.79)(−1.47)(−3.85)(0.33)
LM18.682
p-value0.0000
F16.868
Notes: LM refers to Anderson (1951) canonical correlation test statistic; p-value refers to the corresponding significance. F refers to the Wald test statistic by Cragg and Donald (1993). t-statistics are in parentheses. ***, **, and * indicate that the coefficients are significant at the 1%, 5%, and 10% level, respectively. “—” indicates that no estimation result is reported for the corresponding stage.
Table 4. Robustness test 1.
(1)(2)(3)
VariableReplacement of Dependent VariableAddition of Alternative Control VariablesExclusion of Municipalities
lnNGPFs−0.3989 *−0.9793 ***−1.0112 ***
(−1.70)(−5.12)(−4.57)
lnIND0.1454 **−0.1362 ***−0.1647 **
(2.56)(−2.58)(−2.28)
lnFIN−0.72463.3351 ***3.7903 ***
(−0.71)(4.05)(3.89)
lnGRE−0.7266 *−0.05210.0691
(−1.82)(−0.16)(0.17)
lnTRD−0.6743 ***0.12220.2691
(−2.75)(0.60)(1.15)
lnEAW0.0052−0.0100−0.0053
(0.09)(−0.22)(−0.09)
lnMAR−0.00870.00730.0010
(−0.42)(0.44)(0.05)
lnTIL−0.0452
(−0.71)
lnURL−0.0630
(−0.10)
lnTMD0.1951
(0.23)
Constant−0.29870.8250−0.1334
(−0.33)(0.66)(−0.23)
LM18.58817.54414.180
p-value0.00000.00000.0002
F16.77115.59012.575
Notes: LM refers to Anderson (1951) canonical correlation test statistic; p-value refers to the corresponding significance. F refers to the Wald test statistic by Cragg and Donald (1993). t-statistics are in parentheses. ***, **, and * indicate that the coefficients are significant at the 1%, 5%, and 10% level, respectively. “—” indicates that no estimation result is reported for the corresponding stage.
Table 5. Robustness test 2.
(1)(2)
VariableDIF-GMMSYS-GMM
L.lnCLI0.3947 ***0.7279 ***
(5.04)(5.83)
lnNGPFs−0.2253 **−0.0933 *
(−2.56)(−1.79)
lnIND−0.0781 **−0.0679 **
(−2.25)(−2.10)
lnFIN−0.51370.7013 **
(−0.27)(2.16)
lnGRE0.73470.1147
(1.48)(0.91)
lnTRD0.5530 **0.1056
(2.52)(1.27)
lnEAW−0.0145−0.0045
(−0.67)(−0.42)
lnMAR0.0239 *0.0030
(1.79)(0.42)
AR(1)0.0010.003
AR(2)0.4010.311
Hansen0.9991.000
Notes: AR(1) and AR(2) refer to p-values for Arellano–Bond (1991) tests in terms of the autocorrelation at the first and the second order of the first-differenced error terms. Hansen refers to the p-value of the Hansen J test for overidentifying restrictions. t-statistics are in parentheses. ***, **, and * indicate that the coefficients are significant at the 1%, 5%, and 10% level, respectively.
Table 6. Robustness test 3.
(1)(2)
VariableFirst StageSecond Stage
IV2.2372 ***
(10.62)
lnNGPFs−0.1922 ***
(−2.82)
lnIND−0.0257−0.0526
(−0.58)(−1.62)
lnFIN2.4920 ***0.8149 *
(4.68)(1.81)
lnGRE−0.0902−0.1666
(−0.27)(−0.69)
lnTRD−0.3425 *0.3314 **
(−1.66)(2.20)
lnEAW−0.0094−0.0071
(−0.19)(−0.20)
lnMAR−0.0495 ***0.0280 **
(−3.07)(2.38)
Constant2.6734 ***−1.6195 ***
(4.63)(−3.57)
LM94.027
p-value 0.000
F112.765
Notes: LM refers to Anderson (1951) canonical correlation test statistic; p-value refers to the corresponding significance. F refers to the Wald test statistic by Cragg and Donald (1993). t-statistics are in parentheses. ***, **, and * indicate that the coefficients are significant at the 1%, 5%, and 10% level, respectively. “—” indicates that no estimation result is reported for the corresponding stage.
Table 7. Results of the asymmetric nexus between NGPFs and CLI.
(1)(2)(3)(4)(5)
Variable10th25th50th75th90th
lnNGPFs−0.8712 ***−0.5629 ***−0.5270 ***−0.2548 **−0.2724 ***
(−6.79)(−3.76)(−3.74)(−2.08)(−3.82)
lnIND−0.1103 ***−0.1338 *−0.1498 *−0.2617 ***−0.3247 ***
(−2.93)(−1.91)(−1.79)(−3.43)(−5.46)
lnFIN1.38601.83283.6860 *3.40532.2180
(1.56)(1.42)(1.90)(1.22)(1.05)
lnGRE0.0852−0.0745−0.09930.10980.4575 *
(0.42)(−0.19)(−0.30)(0.29)(1.71)
lnTRD0.4485 *0.8379 **0.34220.21660.4262
(1.79)(2.19)(0.92)(0.53)(1.06)
lnEAW−0.03750.0092−0.00710.02070.0723
(−1.25)(0.25)(−0.18)(0.34)(1.26)
lnMAR0.0227−0.0284−0.0174−0.01310.0379
(1.08)(−1.10)(−0.76)(−0.41)(1.51)
Constant−0.2673−0.6488−0.2932−0.5782−1.3568 **
(−0.86)(−1.25)(−0.71)(−0.84)(−2.23)
Notes: ***, **, and * indicate that the coefficients are significant at the 1%, 5%, and 10% level, respectively.
Table 8. The effect of lnNGPFs on lnCLI is heterogeneous in eastern, central, and western China.
(1)(2)(3)
VariableEasternCentralWestern
lnNGPFs−13.4020−1.1365 ***−1.0137 ***
(−0.03)(−4.30)(−13.51)
lnIND−1.2423−0.1487 *−0.0460
(−0.04)(−1.76)(−0.80)
lnFIN57.89970.53712.0310
(0.03)(0.41)(1.50)
lnGRE−21.0627−1.1301 *0.5722 **
(−0.03)(−1.66)(1.99)
lnTRD−4.00850.20000.0993
(−0.03)(0.59)(0.58)
lnEAW0.22070.0725−0.0580
(0.03)(0.85)(−1.44)
lnMAR−0.3574−0.04410.0171
(−0.03)(−1.19)(1.31)
Constant29.1359−0.21050.0549
(0.03)(−0.20)(0.16)
Notes: ***, **, and * indicate that the coefficients are significant at the 1%, 5%, and 10% level, respectively.
Disclaimer/Publisher’s Note: The statements, opinions and data contained in all publications are solely those of the individual author(s) and contributor(s) and not of MDPI and/or the editor(s). MDPI and/or the editor(s) disclaim responsibility for any injury to people or property resulting from any ideas, methods, instructions or products referred to in the content.

