


Application of Modern Low-Cost Sensors for Monitoring of Particle Matter in Temperate Latitudes: An Example from the Southern Baikal Region

 , , , and
Abstract
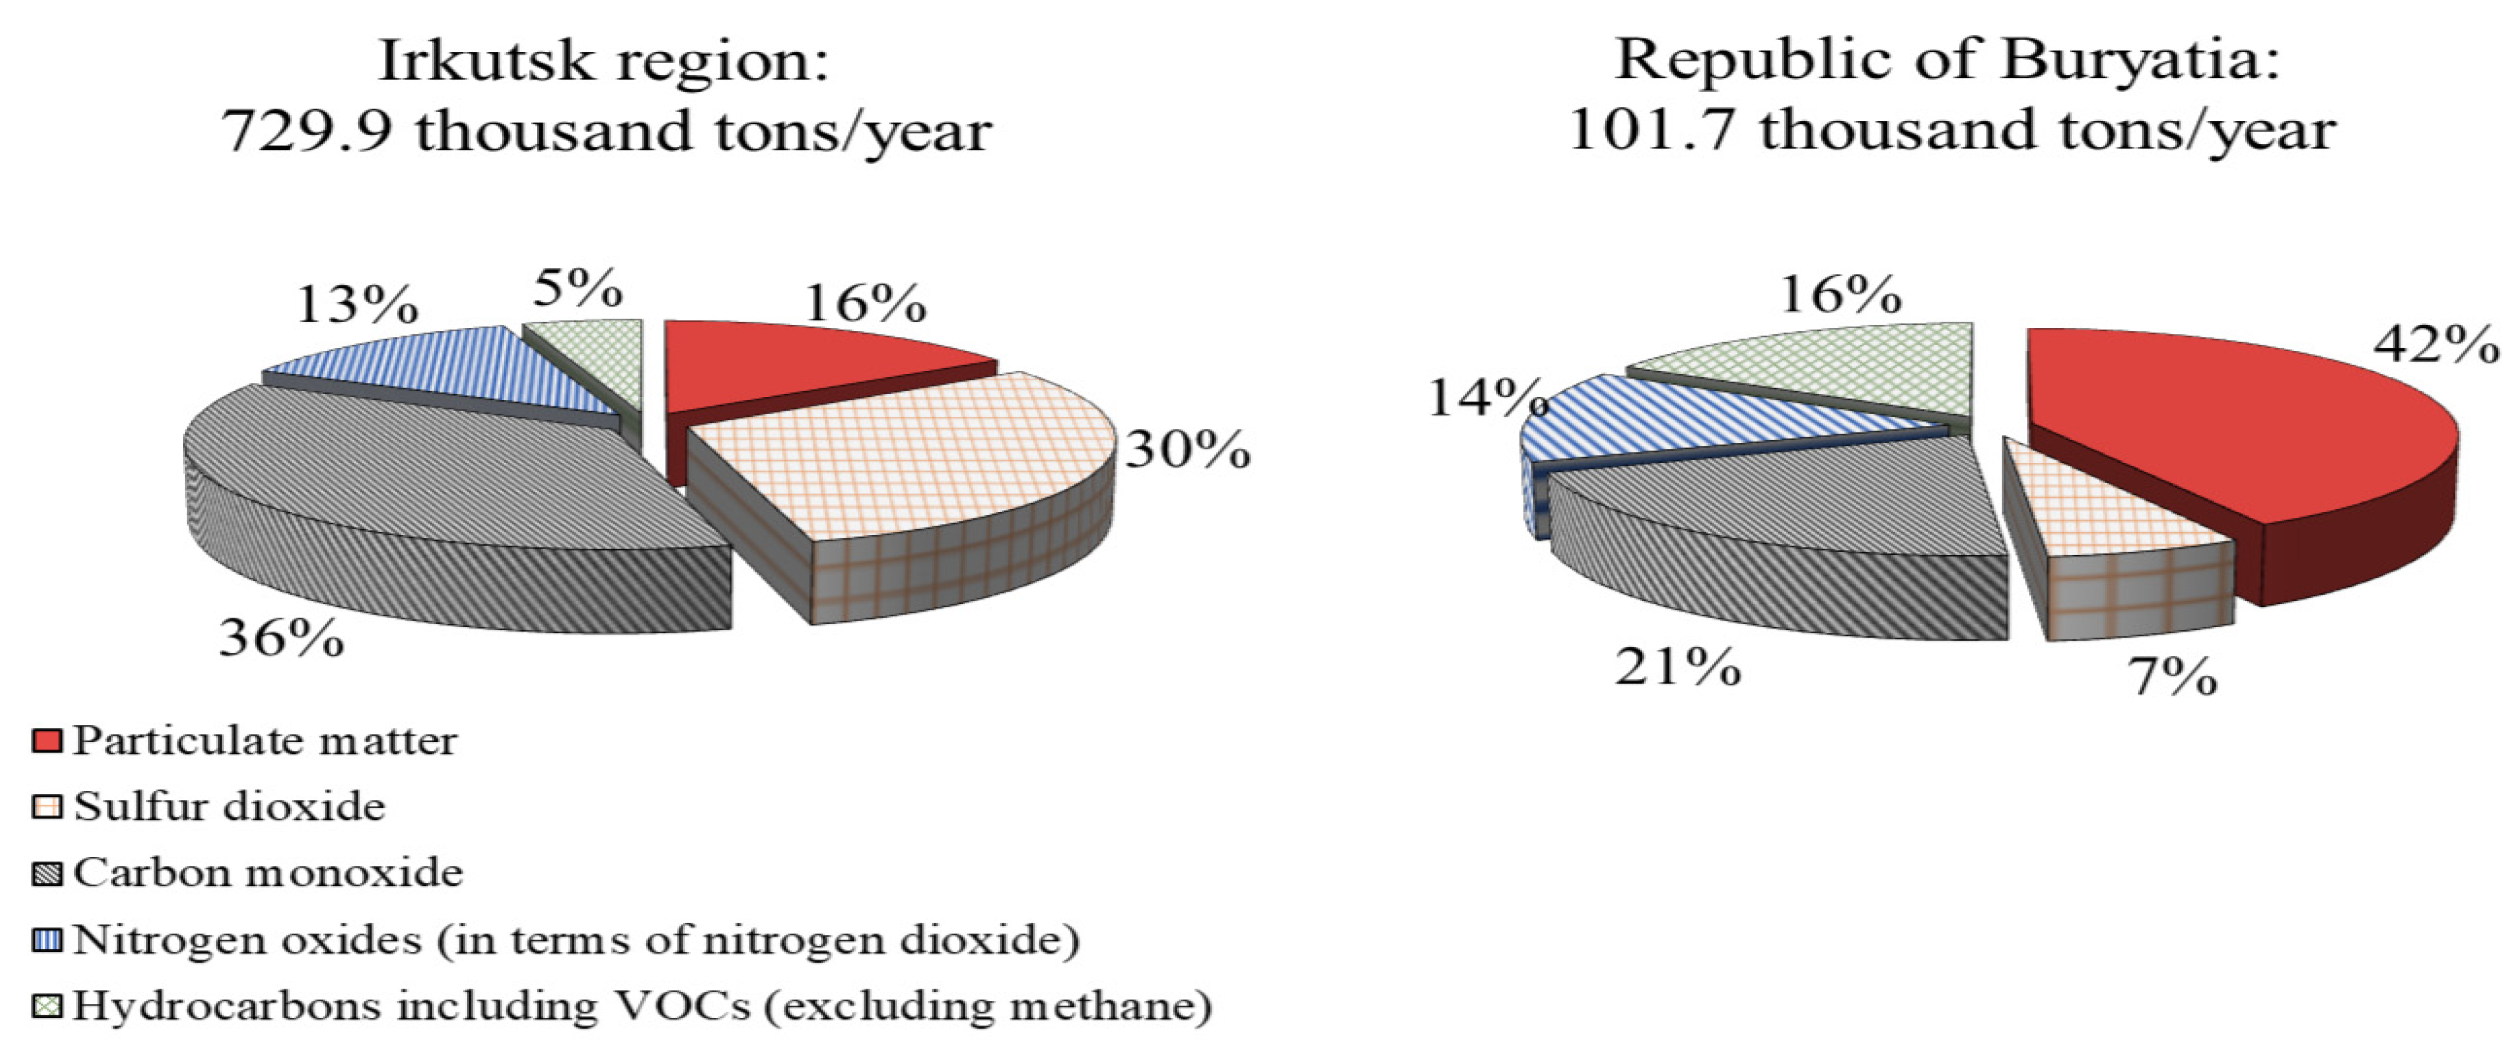
1. Introduction
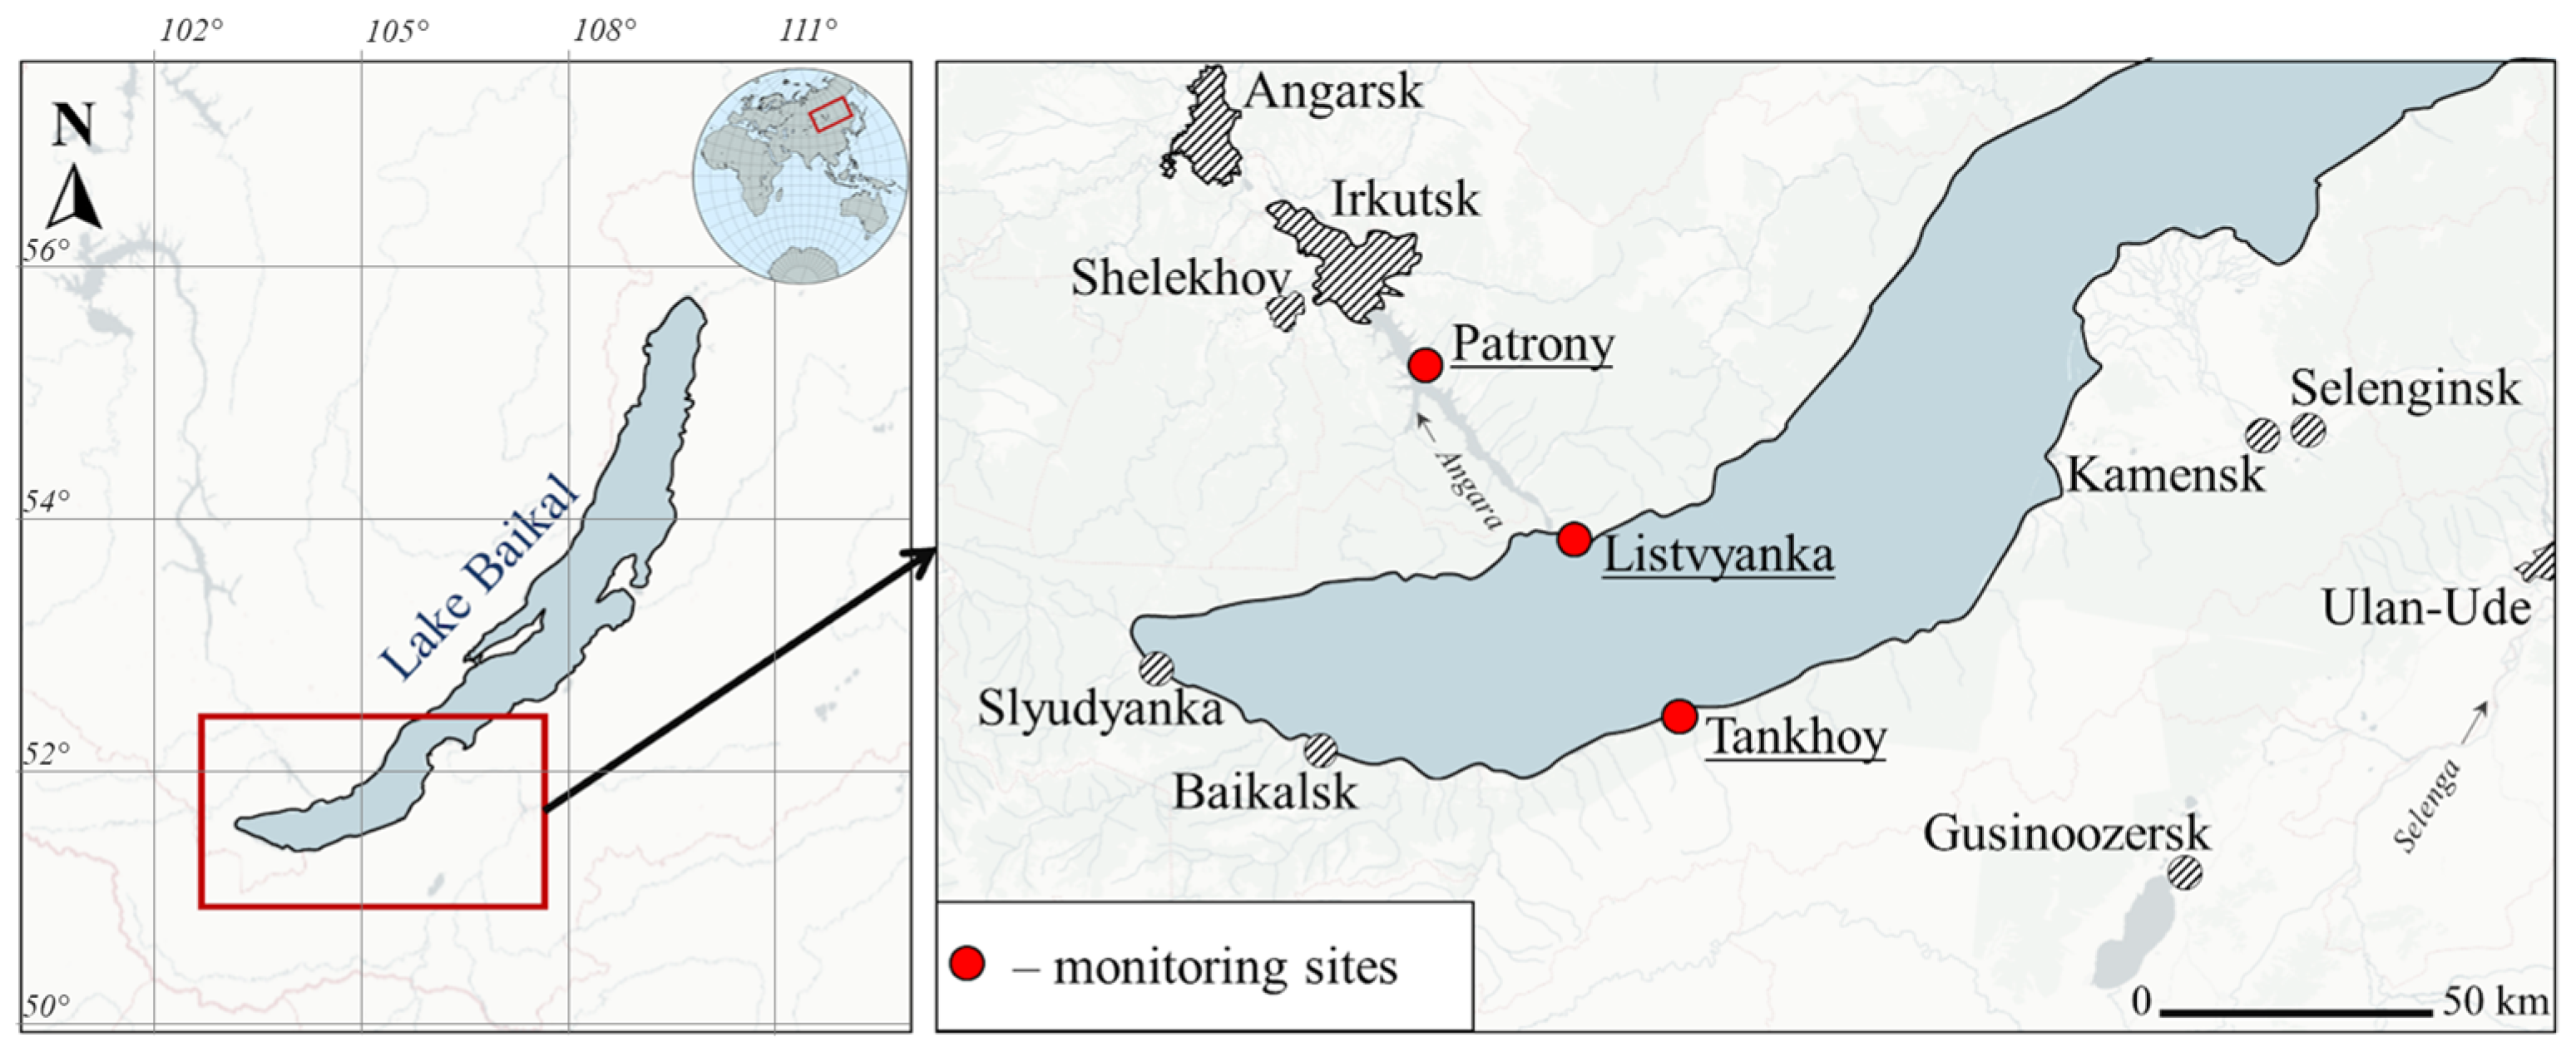
2. Sampling and Analysis Methods
3. Results and Discussions
3.1. Comparison of WoMaster ES-104 and DustTrak 8533 Measurements
3.2. Spatial Calibration of Aerosol Particle Counters
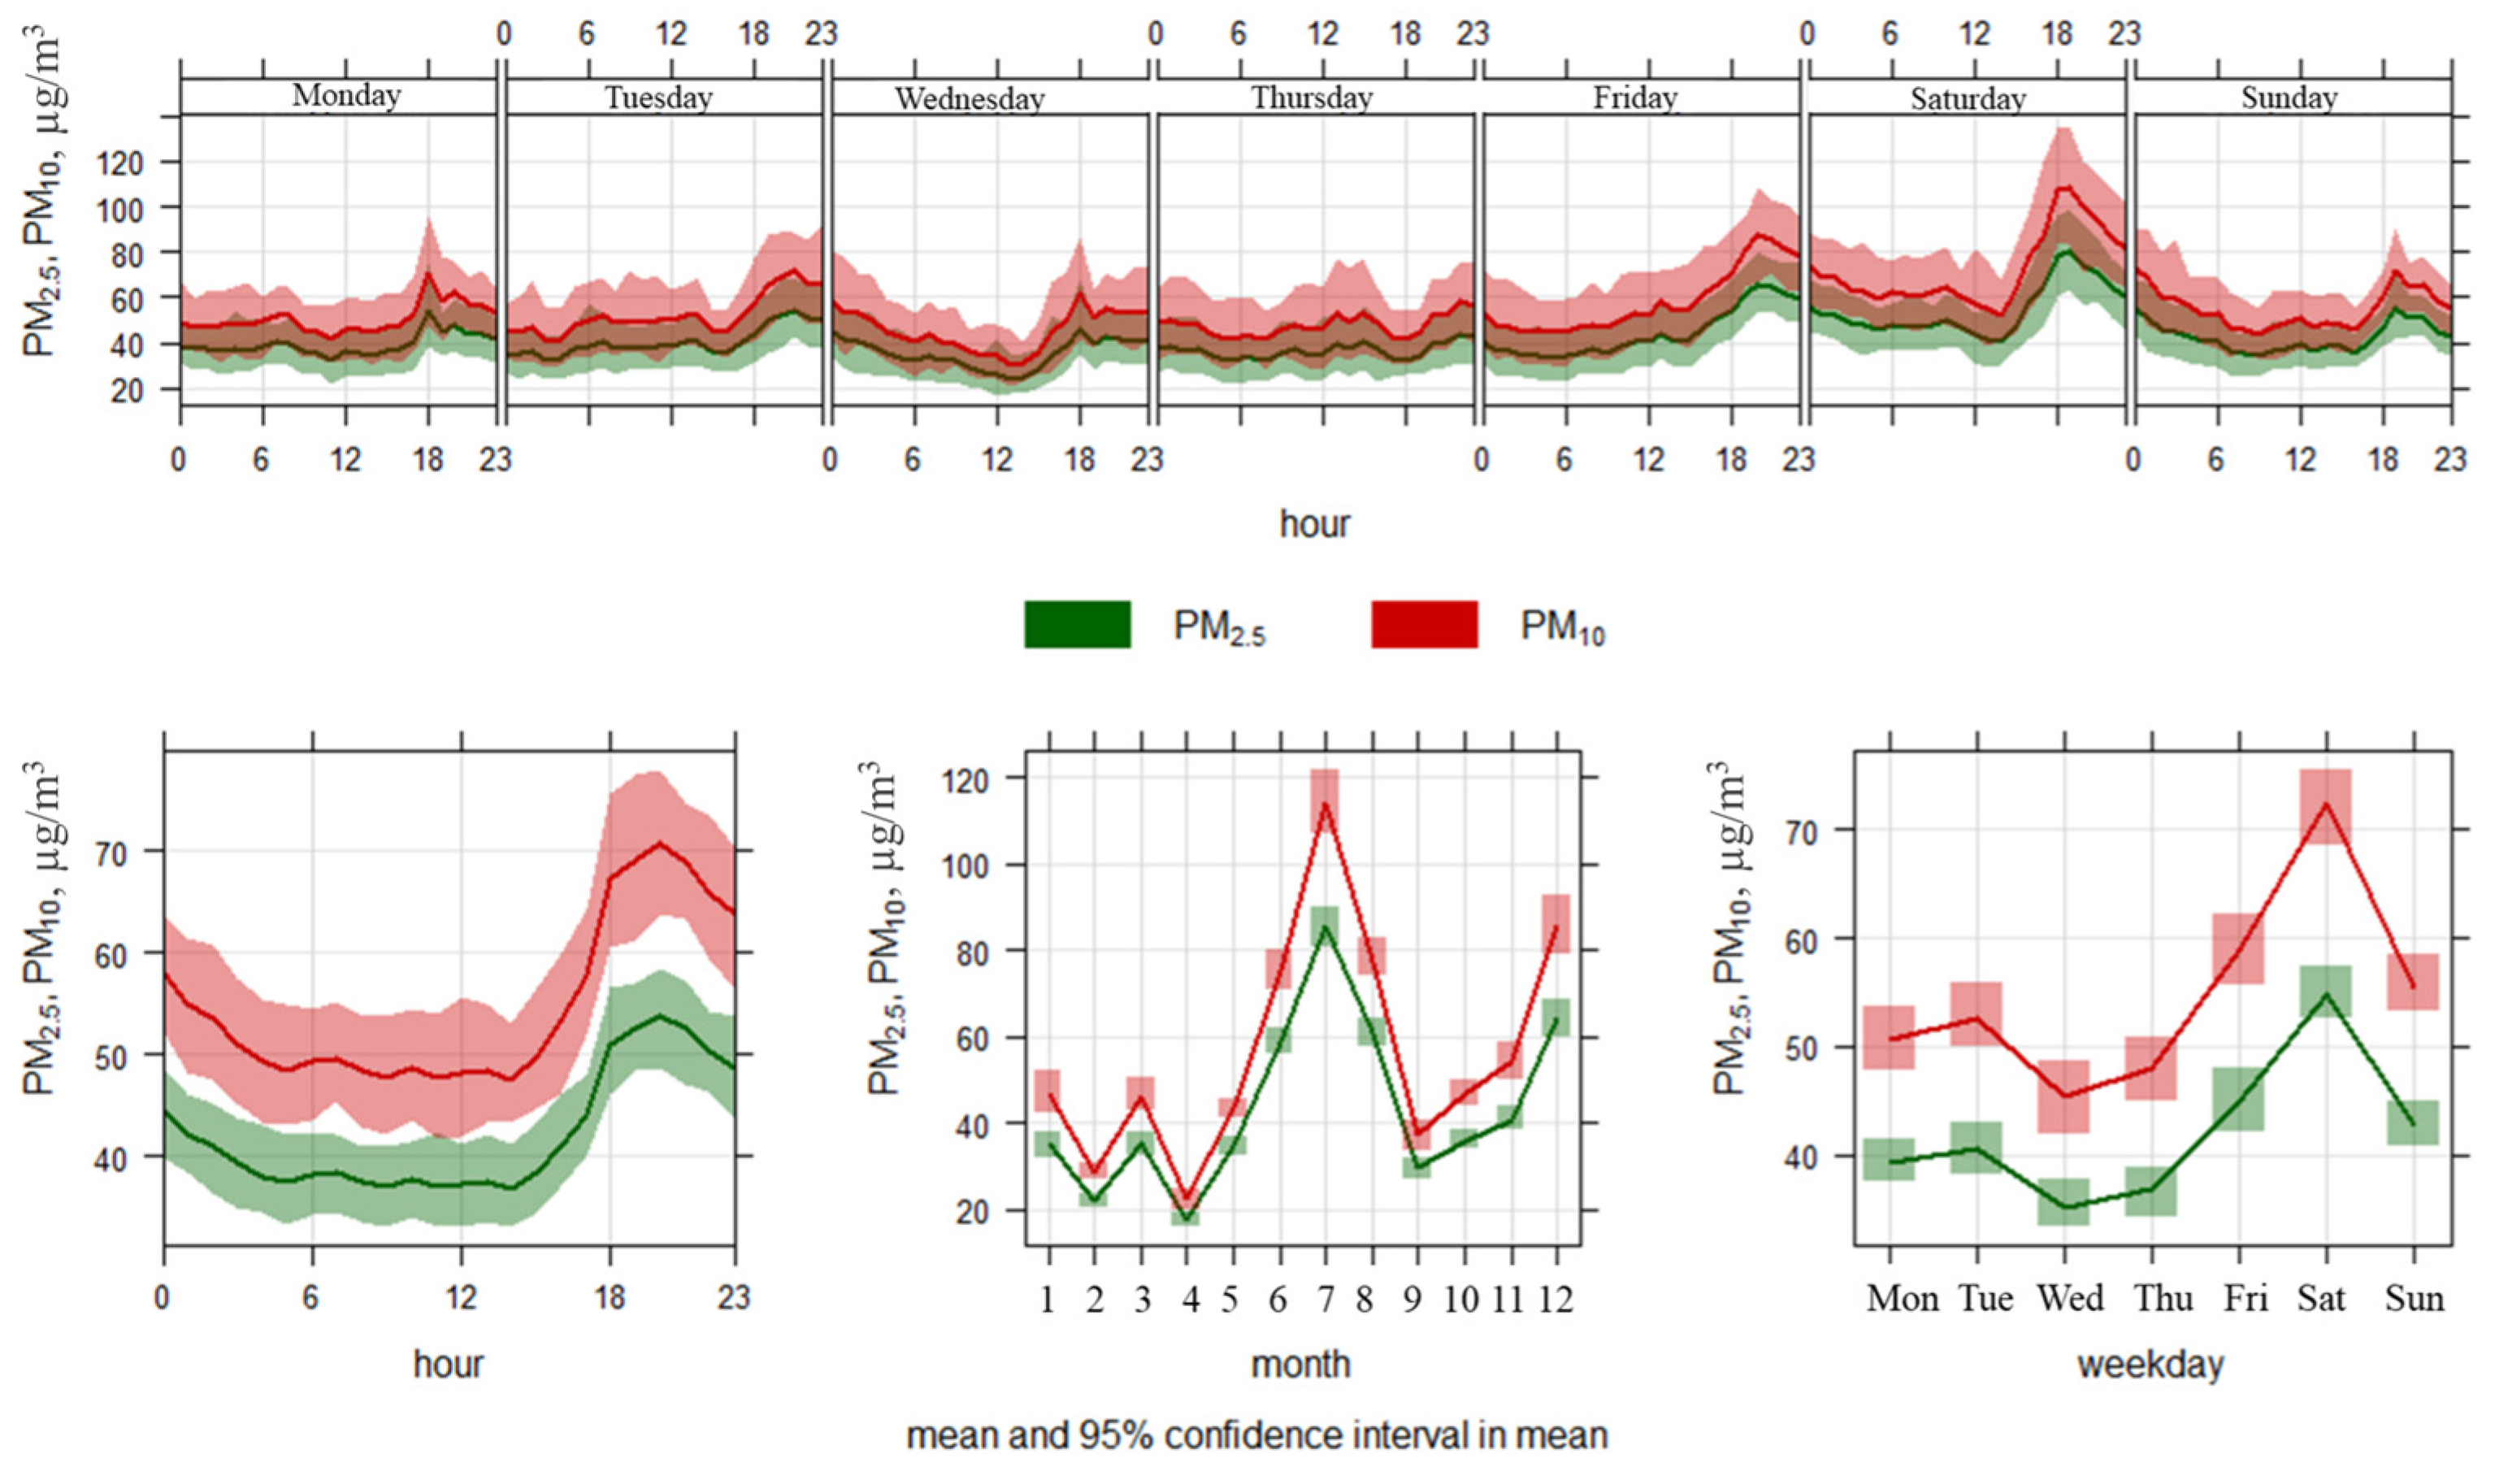
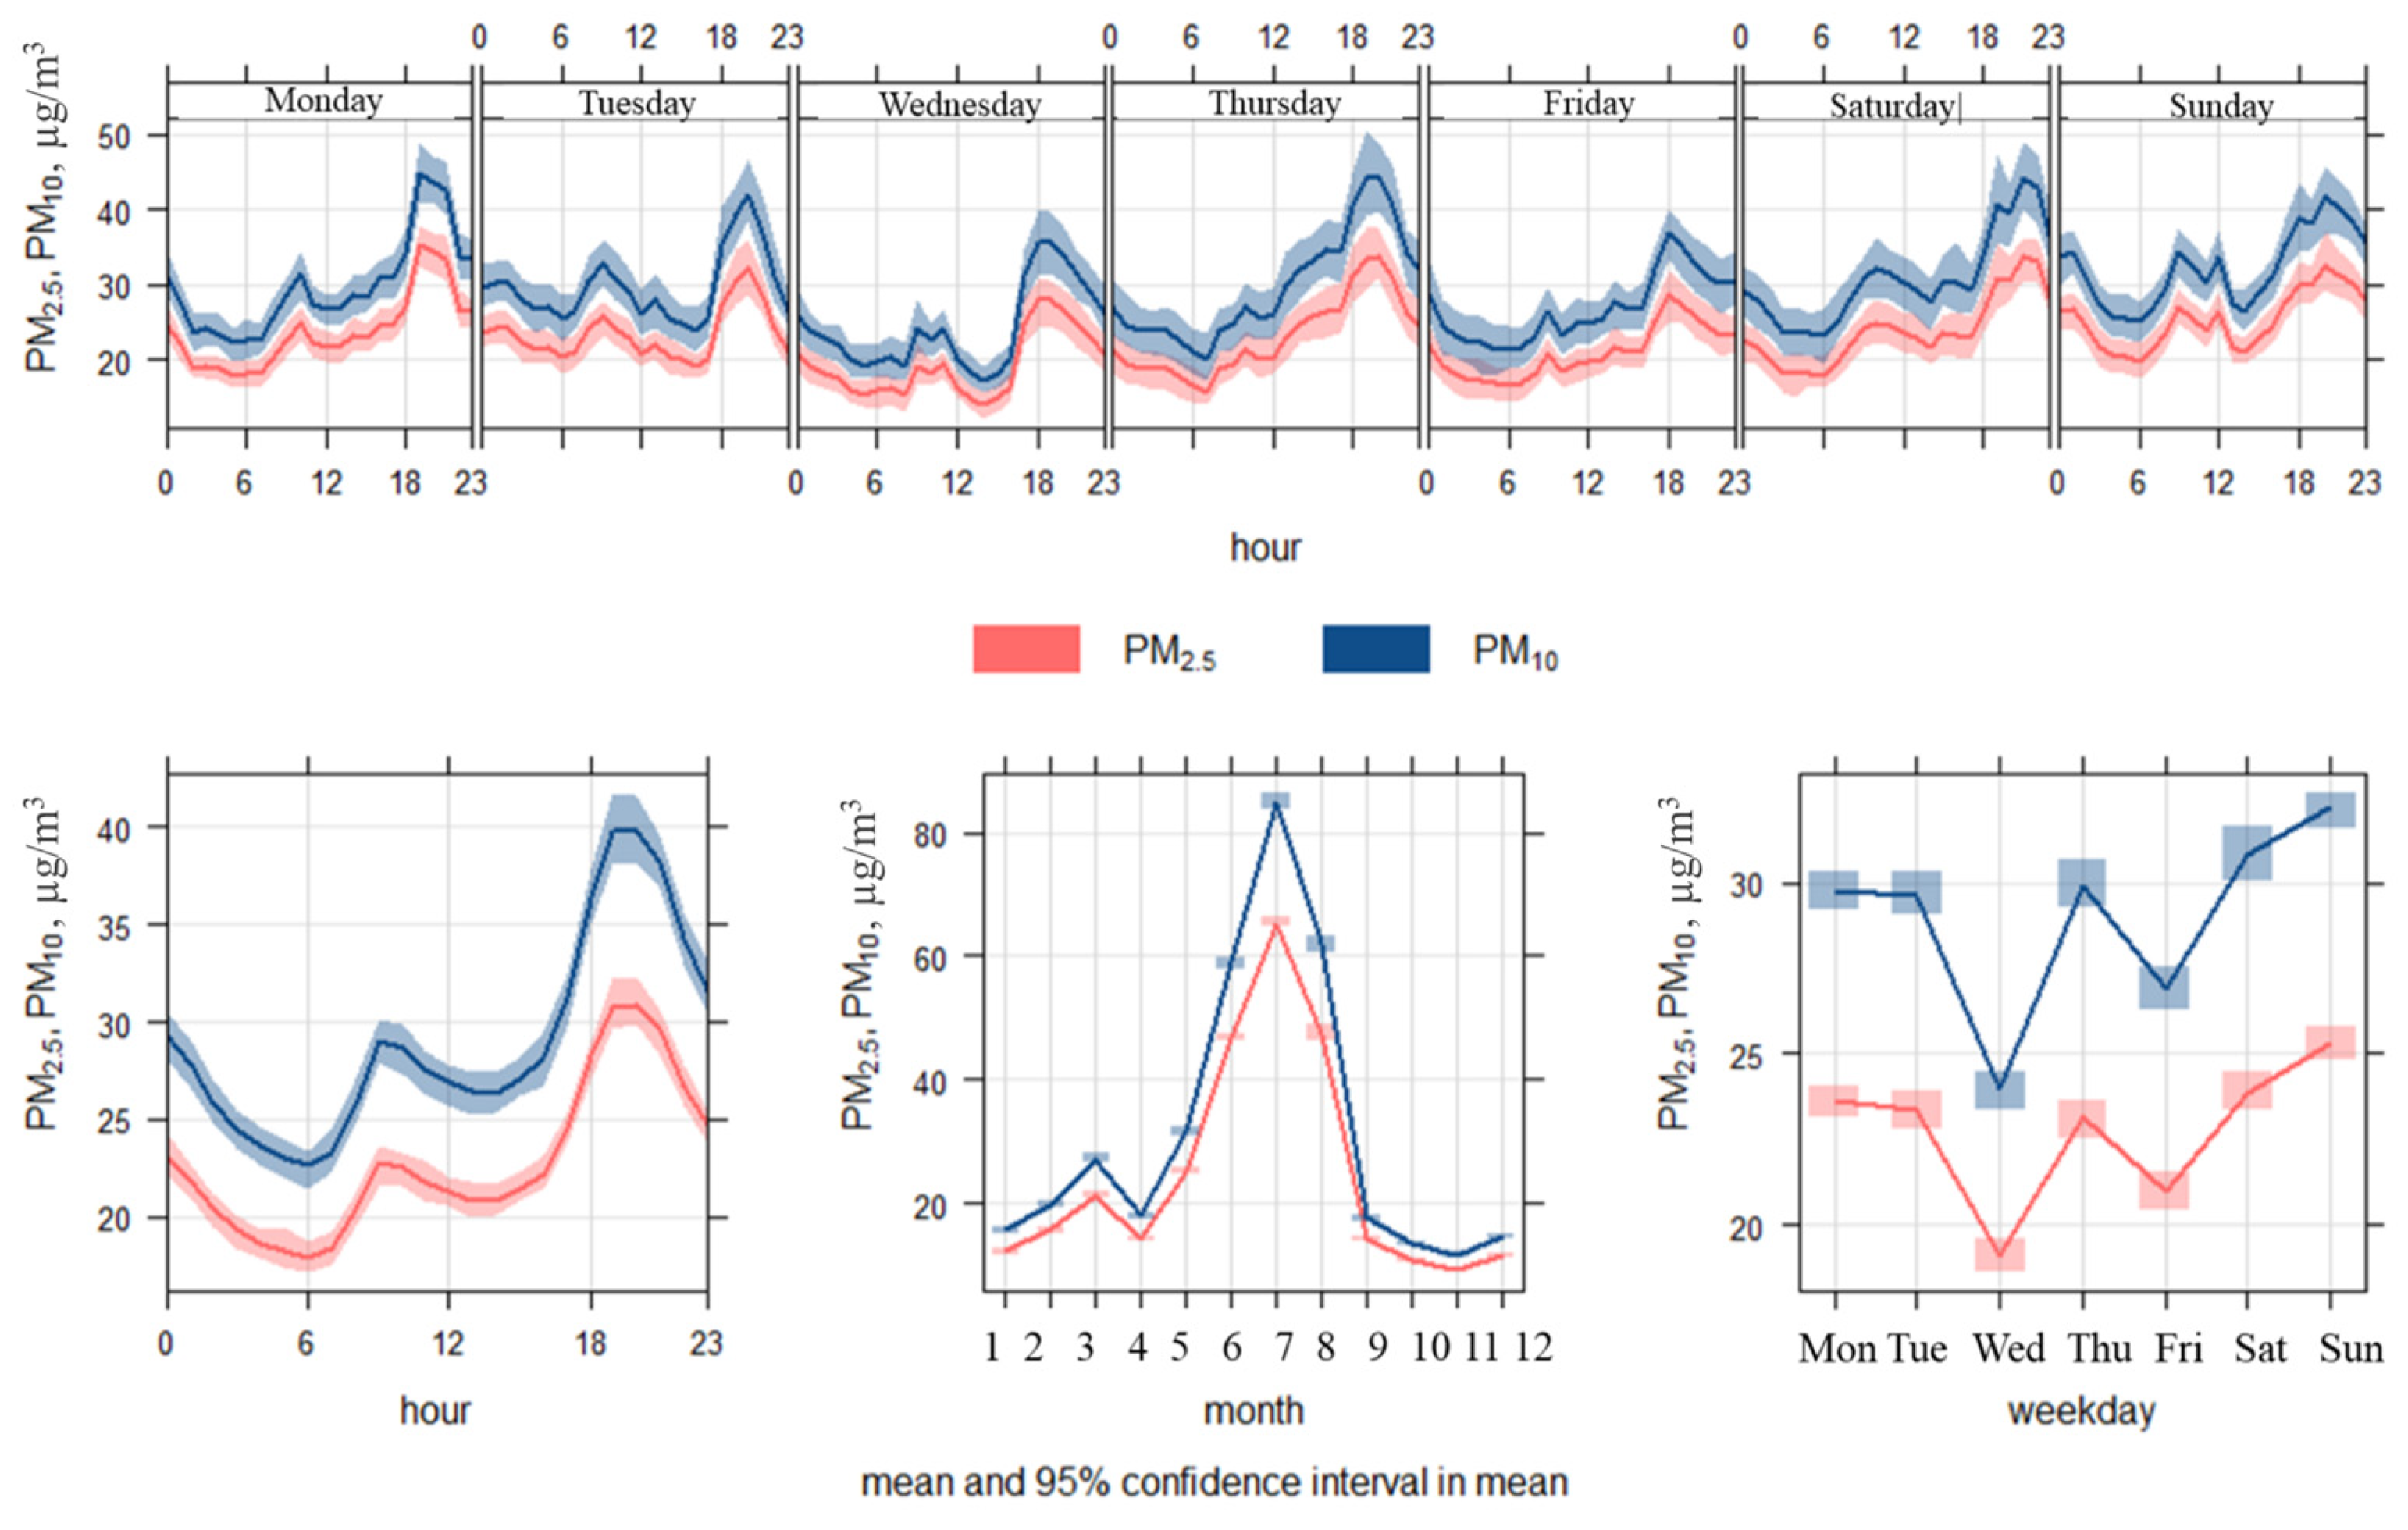
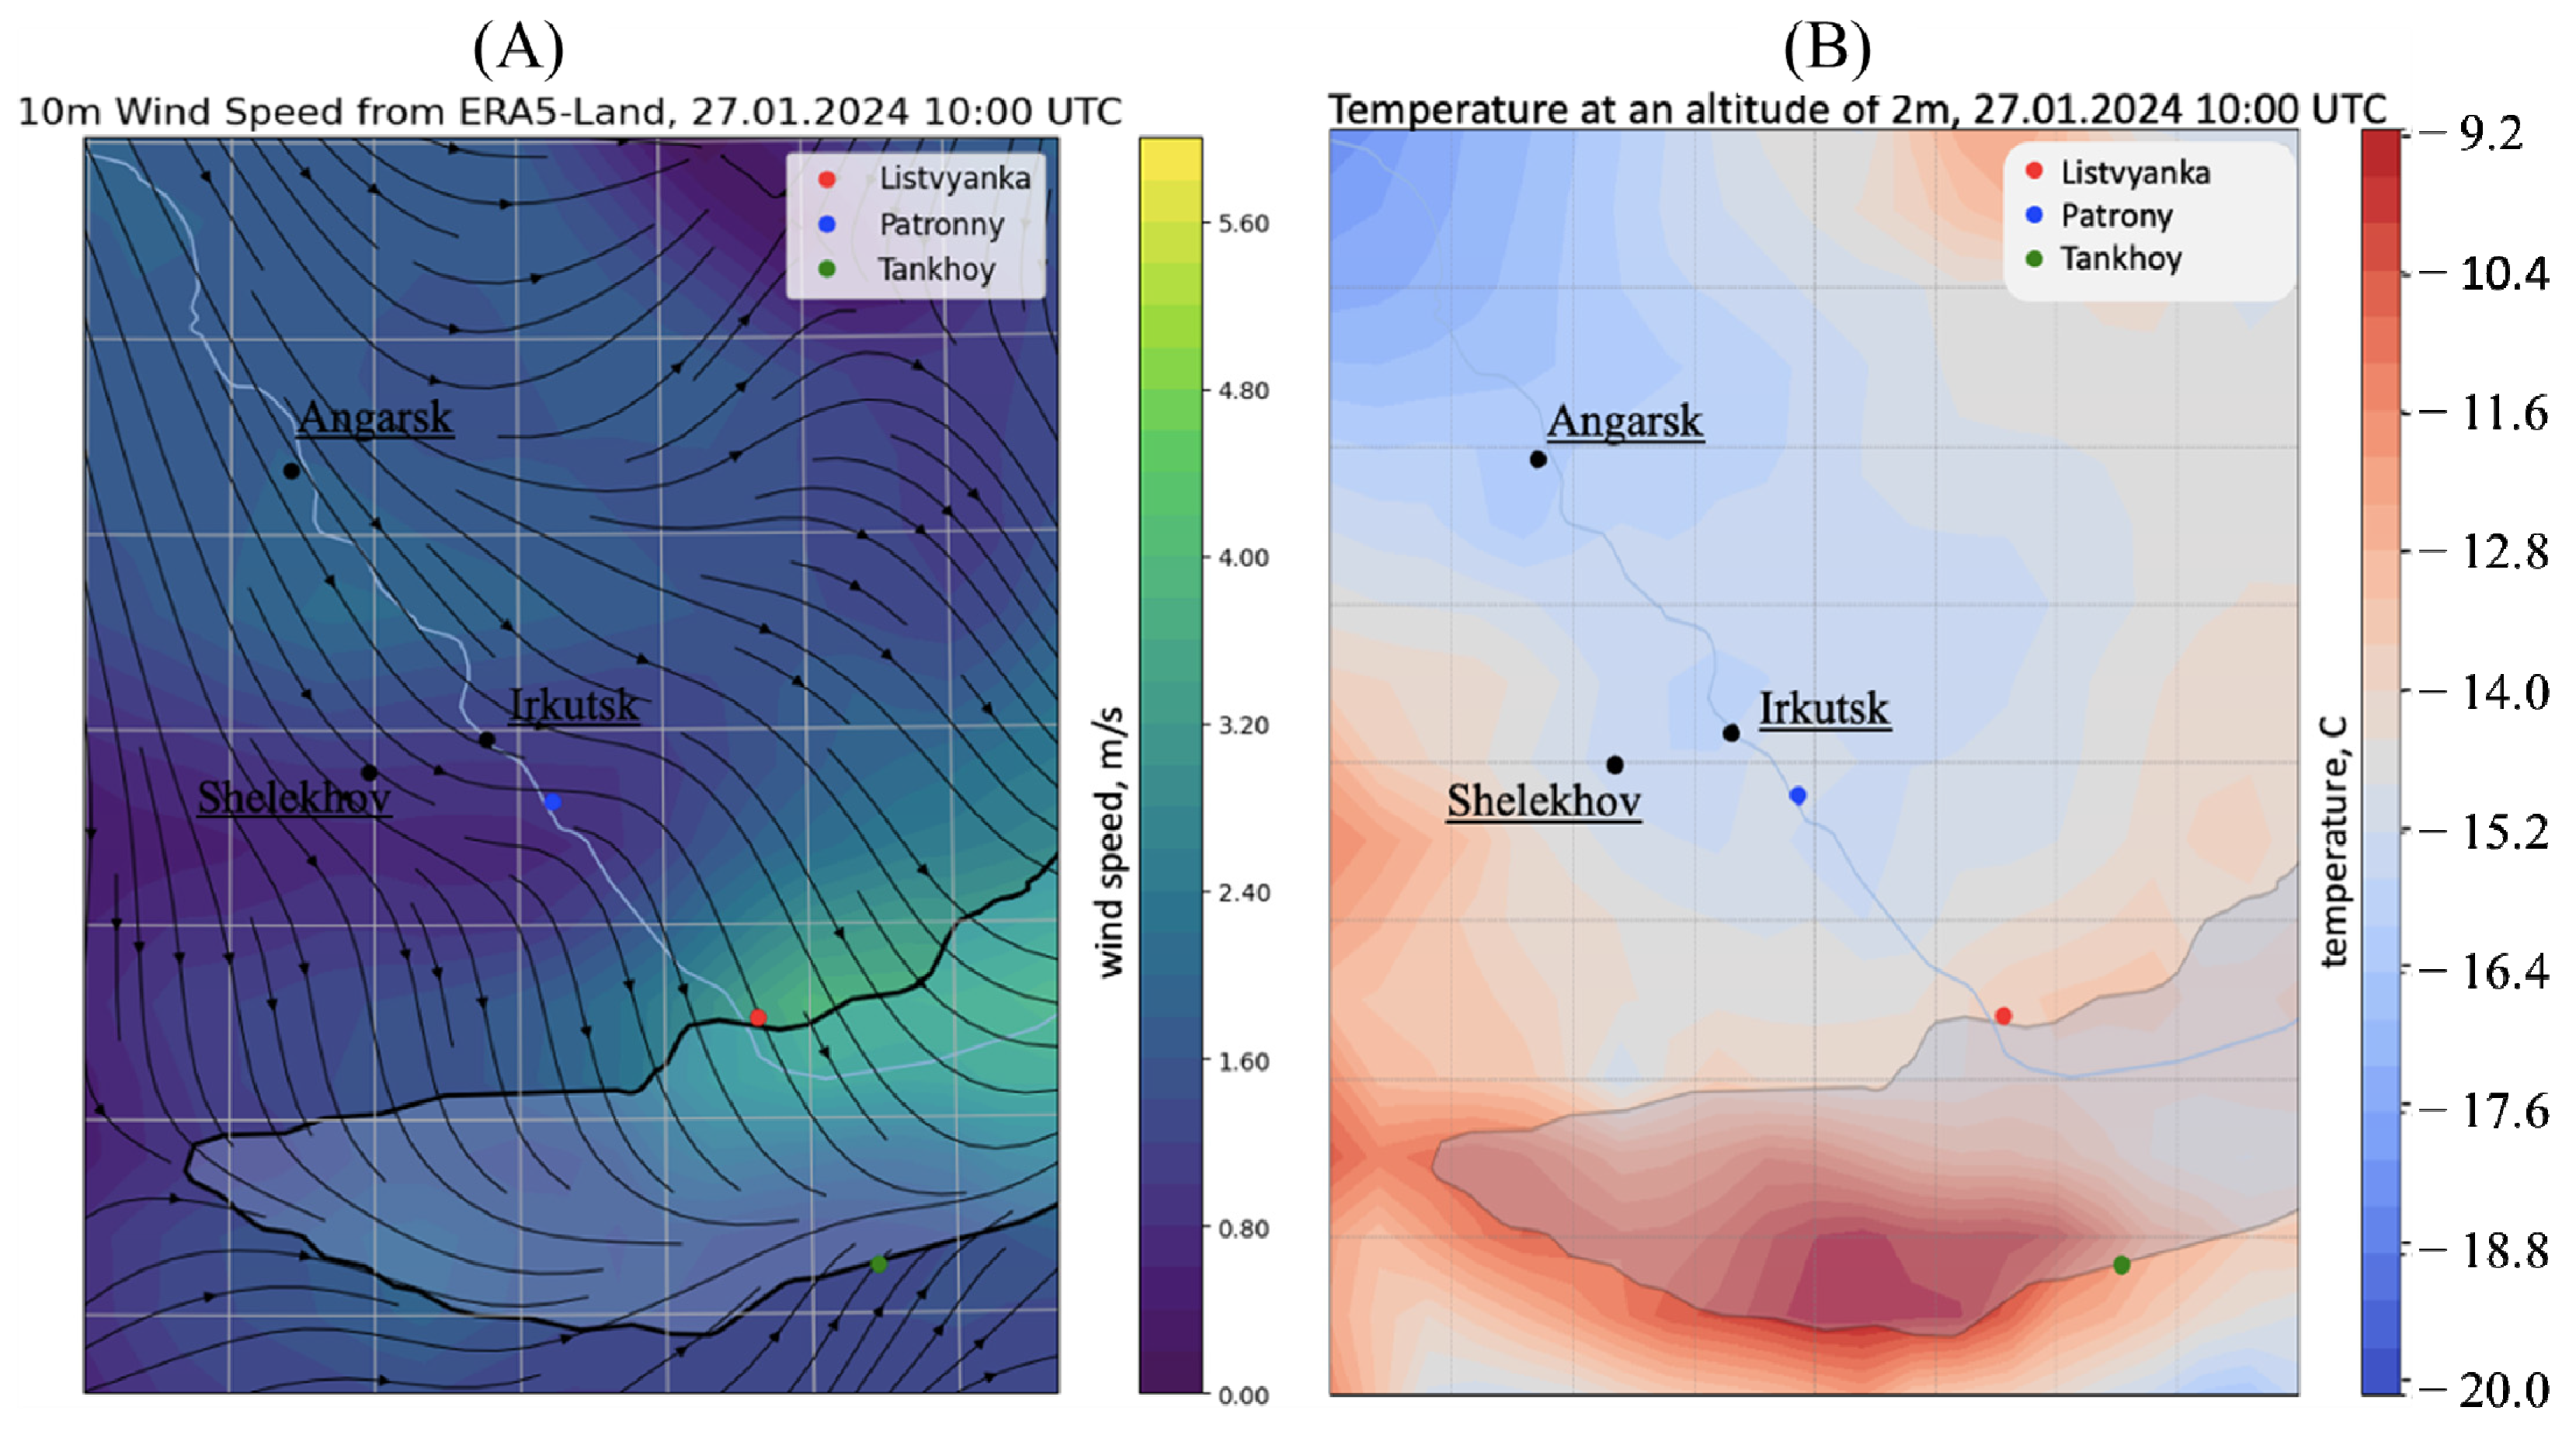
3.3. Assessment of PMx Content Under Conditions of Extreme Atmospheric Pollution
- (1)
- 27 January 2024 (00 UTC)—580 m AGL;
- (2)
- 27 January 2024 (12 UTC)—401 m AGL;
- (3)
- 28 January 2024 (00 UTC)—437 m AGL;
- (4)
- 28 January 2024 (12 UTC)—175 m AGL.
4. Conclusions
Author Contributions
Funding
Institutional Review Board Statement
Informed Consent Statement
Data Availability Statement
Conflicts of Interest
References
- Wang, P.; Xu, F.; Gui, H.; Wang, H.; Chen, D.R. Effect of relative humidity on the performance of five cost-effective PM sensors. Aerosol Sci. Technol. 2021, 55, 957–974. [Google Scholar] [CrossRef]
- Yang, M.; Chu, C.; Bloom, M.S.; Li, S.; Chen, G.; Heinrich, J.; Dong, G.H. Is smaller worse? New insights about associations of PM1 and respiratory health in children and adolescents. Environ. Int. 2018, 120, 516–524. [Google Scholar] [CrossRef] [PubMed]
- Wang, Y.C. Carbon sequestration and foliar dust retention by woody plants in the greenbelts along two major Taiwan highways. Ann. Appl. Biol. 2011, 159, 244–251. [Google Scholar] [CrossRef]
- Krupnova, T.G.; Rakova, O.V.; Bondarenko, K.A.; Saifullin, A.F.; Popova, D.A.; Potgieter-Vermaak, S.; Godoi, R.H. Elemental composition of PM2.5 and PM10 and health risks assessment in the industrial districts of Chelyabinsk, South Ural region, Russia. Int. J. Environ. Res. Public Health 2021, 18, 12354. [Google Scholar] [CrossRef]
- Wang, B.; Liu, Z.; Li, Z.; Sun, Y.; Wang, C.; Zhu, C.; Yan, G. Characteristics, chemical transformation and source apportionment of volatile organic compounds (VOCs) during wintertime at a suburban site in a provincial capital city, east China. Atmos. Environ. 2023, 298, 119621. [Google Scholar] [CrossRef]
- Fu, S.; Liu, P.; He, X.; Song, Y.; Liu, J.; Zhang, C.; Mu, Y. Significantly mitigating PM2.5 pollution level via reduction of NOx emission during wintertime. Sci. Total Environ. 2023, 898, 165350. [Google Scholar] [CrossRef]
- Gubanova, D.P.; Vinogradova, A.A.; Iordanskii, M.A.; Skorokhod, A.I. Variability of near-surface aerosol composition in Moscow in 2020–2021: Episodes of extreme air pollution of different genesis. Atmosphere 2022, 13, 574. [Google Scholar] [CrossRef]
- Glazkova, A.A.; Kuznetsova, I.N.; Shalygina, I.Y.; Semutnikova, E.G. The diurnal variation of aerosol concentration (PM10) in summer in the Moscow region. Atmos. Ocean. Opt. 2012, 25, 495–500. [Google Scholar]
- Vinogradova, A.A.; Gubanova, D.P.; Kopeikin, V.M. Variability of Black Carbon, PM10 and PM2.5 in the Near-Surface Aerosol in Moscow Megalopolis. Izvestiya. Atmos. Ocean. Phys. 2024, 60, 272–285. [Google Scholar] [CrossRef]
- Vasilyeva, D.E.; Gulyaev, E.A.; Imasu, R.; Markelov, Y.I.; Matsumi, Y.; Talovskaya, A.V.; Shchelkanov, A.A.; Gadelshin, V.M. A Measuring System for PM2.5 Concentration and Meteorological Parameters for a Multipoint Aerosol Monitoring Network in Yekaterinburg. Atmos. Ocean. Opt. 2023, 36, 790–797. [Google Scholar] [CrossRef]
- Panchenko, M.V.; Pol’kin, V.V.; Pol’kin, V.V.; Kozlov, V.S.; Yausheva, E.P.; Shmargunov, V.P. Size distribution of dry matter of particles in the surface atmospheric layer in the suburban region of Tomsk within the empirical classification of aerosol weather types. Atmos. Ocean. Opt. 2019, 32, 655–662. [Google Scholar] [CrossRef]
- Mead, M.I.; Popoola, O.A.M.; Stewart, G.B.; Landshoff, P.; Calleja, M.; Hayes, M.; Jones, R.L. The use of electrochemical sensors for monitoring urban air quality in low-cost, high-density networks. Atmos. Environ. 2013, 70, 186–203. [Google Scholar] [CrossRef]
- Blaga, R.; Gautam, S. Improving PM10 sensor accuracy in urban areas through calibration in Timișoara. npj Clim. Atmos. Sci. 2024, 7, 268. [Google Scholar] [CrossRef]
- McFarlane, C. First measurements of ambient PM2.5 in Kinshasa, democratic republic of Congo and Brazzaville, republic of Congo using field-calibrated low-cost sensors. Aerosol Air Qual. Res. 2021, 21, 7. [Google Scholar] [CrossRef]
- Correia, C. A Low-Cost Sensor System Installed in Buses to Monitor Air Quality in Cities. Int. J. Environ. Res. Public Health 2023, 20, 4073. [Google Scholar] [CrossRef]
- Kumar, P.; Morawska, L.; Martani, C.; Biskos, G.; Neophytou, M.; Di Sabatino, S.; Bell, M.; Norford, L.; Britter, R. The rise of low-cost sensing for managing air pollution in cities. Environ. Int. 2015, 75, 199–205. [Google Scholar] [CrossRef]
- Bulot, F.M.J.; Russell, H.S.; Rezaei, M.; Johnson, M.S.; Ossont, S.J.J.; Morris, A.K.R.; Basford, P.J.; Easton, N.H.C.; Foster, G.L.; Loxham, M.; et al. Laboratory comparison of low-cost particulate matter sensors to measure transient events of pollution. Sensors 2020, 20, 2219. [Google Scholar] [CrossRef]
- Amegah, A.K. Proliferation of low-cost sensors. What prospects for air pollution epidemiologic research in Sub-Saharan Africa? Environ. Pollut. 2018, 241, 1132–1137. [Google Scholar] [CrossRef]
- Stojanović, D.B.; Kleut, D.; Davidović, M.; Živković, M.; Ramadani, U.; Jovanović, M.; Jovašević-Stojanović, M. Data Evaluation of a Low-Cost Sensor Network for Atmospheric Particulate Matter Monitoring in 15 Municipalities in Serbia. Sensors 2024, 24, 4052. [Google Scholar] [CrossRef]
- Kortoçi, P.; Motlagh, N.H.; Zaidan, M.A.; Fung, P.L.; Varjonen, S.; Rebeiro-Hargrave, A.; Niemi, J.V.; Nurmi, P.; Hussein, T.; Petäjä, T.; et al. Air Pollution Exposure Monitoring Using Portable Low-Cost Air Quality Sensors. Smart Health 2022, 23, 100241. [Google Scholar] [CrossRef]
- Crilley, L.R.; Shaw, M.; Pound, R.; Kramer, L.J.; Price, R.; Young, S.; Lewis, A.C.; Pope, F.D. Evaluation of a Low-Cost Optical Particle Counter (Alphasense OPC-N2) for Ambient Air Monitoring. Atmos. Meas. Tech. 2018, 11, 709–720. [Google Scholar] [CrossRef]
- Zheng, T.; Bergin, M.H.; Johnson, K.K.; Tripathi, S.N.; Shirodkar, S.; Landis, M.S.; Carlson, D.E. Field evaluation of low-cost par-ticulate matter sensors in high-and low-concentration environments. Atmos. Meas. Tech. 2018, 11, 4823–4846. [Google Scholar] [CrossRef]
- Obolkin, V.A.; Potemkin, V.L.; Makukhin, V.L.; Chipanina, Y.V.; Marinayte, I.I. Low-level atmospheric jets as main mechanism of long-range transport of power plant plumes in the Lake Baikal Region. Int. J. Environ. Stud. 2014, 71, 391–397. [Google Scholar]
- Obolkin, V.A.; Potemkin, V.L.; Makukhin, V.L.; Khodzher, T.V.; Chipanina, E.V. Long-Range Transport of Plumes of Atmospheric Emissions from Regional Coal Power Plants to the South Baikal Water Basin. Atmos. Ocean. Opt. 2017, 30, 360–365. [Google Scholar] [CrossRef]
- Popovicheva, O.; Molozhnikova, E.; Nasonov, S.; Potemkin, V.; Penner, I.; Klemasheva, M.; Marinaite, I.; Golobokova, L.; Vratolis, S.; Eleftheriadis, K.; et al. Industrial and wildfire aerosol pollution over world heritage Lake Baikal. J. Environ. Sci. 2021, 107, 49–64. [Google Scholar] [CrossRef]
- Berdashkinova, O.I.; Obolkin, V.A.; Golobokova, L.P.; Khodzher, T.V. Monitoring of Atmospheric Trace Gases in Urban and Rural Areas of the Baikal Natural Territory during 2019–2021. Russ. Meteorol. Hydrol. 2023, 48, 324–333. [Google Scholar]
- Khodzher, T.V.; Yausheva, E.P.; Shikhovtsev, M.Y.; Zhamsueva, G.S.; Zayakhanov, A.S.; Golobokova, L.P. Black Carbon in the Air of the Baikal Region, (Russia): Sources and Spatiotemporal Variations. Appl. Sci. 2024, 14, 6996. [Google Scholar] [CrossRef]
- Smetanina, A.M.; Gromov, S.A.; Obolkin, V.A.; Khodzher, T.V.; Khuriganova, O.I. Assessment of Atmospheric Ozone from Reanalysis and Ground-based Measurements in the Baikal Region. Russ. Meteorol. Hydrol. 2024, 49, 370–374. [Google Scholar] [CrossRef]
- Shikhovtsev, A.Y.; Kovadlo, P.G.; Lezhenin, A.A.; Gradov, V.S.; Zaiko, P.O.; Khitrykau, M.A.; Kirichenko, K.E.; Driga, M.B.; Kiselev, A.V.; Russkikh, I.V.; et al. Simulating atmospheric characteristics and daytime astronomical seeing using Weather Research and Forecasting Model. Appl. Sci. 2023, 13, 6354. [Google Scholar] [CrossRef]
- Zayakhanov, A.S.; Zhamsueva, G.S.; Tsydypov, V.V. Specific features of transportation and transformation of atmospheric aerosol and gas admixtures in the coastal zone of Lake Baikal. Atmos. Ocean. Opt. 2019, 32, 158–164. [Google Scholar] [CrossRef]
- Nasonov, S.V.; Balin, Y.S.; Klemasheva, M.G.; Kokhanenko, G.P.; Nasonova, A.S.; Novoselov, M.M.; Penner, I.E. Summer daily dynamics of the vertical structure of atmospheric aerosol over Baikal coastal area from ground-based lidar measurements. Int. J. Remote Sens. 2024, 45, 8576–8593. [Google Scholar] [CrossRef]
- Balzhanov, T.S.; Zayakhanov, A.S.; Zhamsueva, G.S.; Tcydypov, V.V.; Dementeva, A.L. Assessment of Atmospheric Particles Flux Variation on the Different Underlying Surfaces (Grasslands and Forest) in the Lake Baikal Region. Atmosphere 2024, 15, 737. [Google Scholar] [CrossRef]
- Zhamsueva, G.S.; Khodzher, T.V.; Balin, Y.S.; Zayakhanov, A.S.; Tsydypov, V.V.; Penner, I.E.; Marinayte, I.I. Experimental studies of aerosol and gas admixtures in the near-water layer of the atmosphere of Lake Baikal (Ship-based expedition, September 2021). Atmos. Ocean. Opt. 2022, 35, 48–57. [Google Scholar] [CrossRef]
- Khodzher, T.V. Ship-based studies of aerosol-gas admixtures over Lake Baikal basin in summer 2018. Atmos. Ocean. Opt. 2019, 32, 434–441. [Google Scholar] [CrossRef]
- Nasonov, S.; Balin, Y.; Klemasheva, M.; Kokhanenko, G.; Novoselov, M.; Penner, I.; Khodzher, T. Mobile aerosol Raman polarizing lidar LOSA-A2 for atmospheric sounding. Atmosphere 2020, 11, 1032. [Google Scholar] [CrossRef]
- Marinaite, I.I.; Khodzher, T.V.; Obolkin, V.A.; Potyomkin, V.L. Polycyclic Aromatic Hydrocarbons and PM10, PM2.5, PM1.0 Particles in the Atmosphere over the Southern Baikal Region. Russ. Meteorol. Hydrol. 2023, 48, 300–308. [Google Scholar] [CrossRef]
- Shikhovtsev, M.Y.; Obolkin, V.A.; Khodzher, T.V.; Molozhnikova, Y.V. Variability of the Ground Concentration of Particulate Matter PM1–PM10 in the Air Basin of the Southern Baikal Region. Atmos. Ocean. Opt. 2023, 36, 655–662. [Google Scholar] [CrossRef]
- Molozhnikova, Y.V.; Shikhovtsev, M.Y.; Netsvetaeva, O.G.; Khodzher, T.V. Ecological Zoning of the Baikal Basin Based on the Results of Chemical Analysis of the Composition of Atmospheric Precipitation Accumulated in the Snow Cover. Appl. Sci. 2023, 13, 8171. [Google Scholar] [CrossRef]
- Shikhovtsev, M.Y.; Molozhnikova, E.V.; Khodzher, T.V.; Zhamsueva, G.S.; Tsydypov, V.V.; Tyurnev, I.N. Results of synchronous measurements of the content of nitrogen and sulfur oxides in the atmosphere of Southern Baikal in July 2023. Limnol. Freshw. Biol. 2024, 5, 1284–1301. [Google Scholar] [CrossRef]
- Safarov, A.S.; Verkhozina, V.A.; Makukhin, V.L. Modeling of the transfer of emissions from the Novo-Irkutsk TPP to the water area of Lake Baikal. L. Modeling of the transfer of emissions from the Novo-Irkutsk TPP to the water area of Lake Baikal. Bull. Irkutsk. State Tech. Univ. 2013, 11, 115–120. [Google Scholar]
- Makukhin, V.L.; Obolkin, V.A.; Potemkin, V.L.; Latysheva, I.V.; Khodzher, T.V. Estimates of spatial distribution of small gas impurities over the water area of Lake Baikal in summer using field measurements and results of mathematical modeling. Izv. Irkutsk. State Univ. Ser. Earth Sci. 2016, 18, 69–80. [Google Scholar]
- Golubtsov, V.A.; Vanteeva, Y.V.; Voropai, N.N. Influence of moisture availability on the composition of stable carbon isotopes of organic matter of soils of the Baikal region. Soil Sci. 2021, 10, 1182–1194. [Google Scholar]
- Obolkin, V.A.; Netsvetayeva, O.G.; Golobokova, L.P.; Potemkin, V.L.; Zimnik, E.A.; Filippova, U.G.; Khodger, T.V. Results of long-term studies of acid deposition in the area of South Baikal. Geogr. Nat. Resour. 2013, 2, 66–73. [Google Scholar]
- Mikhailova, T.A.; Berezhnaya, N.S.; Afanasyeva, L.V.; Ignatyeva, O.V.; Shergina, O.V. Impact of fluorine-containing compounds on the state of coniferous forests of Predbaikalia. Lesovedenie 2005, 2, 38–45. [Google Scholar]
- Mikhailova, T.A.; Pleshanov, A.S.; Afanasyeva, L.V. Cartographic assessment of forest ecosystems pollution of the Baikal natural territory by technogenic emissions. Geogr. Nat. Resour. 2008, 4, 18–23. [Google Scholar] [CrossRef]
- Tomberg, I.V.; Sorokovikova, L.M.; Netsvetayeva, O.G.; Sezko, N.P.; Zhuchenko, N.A. Chemical composition and acidification trend of snow and tributary waters of South Baikal. Atmos. Ocean. Opt. 2016, 29, 516–520. [Google Scholar]
- Chi, N.D. Calibration of DustTrak and Low-Cost Sensors and Their Application for Assessment of Inhalation Exposures to Traf-fic-Related PM2.5 and PM1 in Ho Chi Minh City. Atmosphere 2023, 14, 1504. [Google Scholar] [CrossRef]
- Li, Z.; Che, W.; Lau, A.K.H.; Fung, J.C.H.; Lin, C.; Lu, X. A feasible experimental framework for field calibration of portable light-scattering aerosol monitors: Case of TSI DustTrak. Environ. Pollut. 2019, 255, 113136. [Google Scholar] [CrossRef]
- Javed, W.; Guo, B. Performance Evaluation of Real-time DustTrak Monitors for Outdoor Particulate Mass Measurements in a Desert Environment. Aerosol Air Qual. Res. 2021, 21, 200631. [Google Scholar] [CrossRef]
- Giordano, M.R.; Malings, C.; Pandis, S.N.; Presto, A.A.; McNeill, V.F.; Westervelt, D.M.; Subramanian, R. From low-cost sensors to high-quality data: A summary of challenges and best practices for effectively calibrating low-cost particulate matter mass sensors. J. Aerosol Sci. 2021, 158, 105833. [Google Scholar] [CrossRef]
- Castell, N.; Dauge, F.R.; Schneider, P.; Vogt, M.; Lerner, U.; Fishbain, B.; Bartonova, A. Can commercial low-cost sensor platform’s contribute to air quality monitoring and exposure estimates? Environ. Int. 2017, 99, 293–302. [Google Scholar] [CrossRef] [PubMed]
- Draxler, R.R.; Hess, G.D. An overview of the HYSPLIT_4 modeling system for trajectories, dispersion, and deposition. Aust. Meteorol. Mag. 1998, 47, 295–308. [Google Scholar]
- Obolkin, V.A.; Shamansky, Y.V.; Khodzher, T.V.; Falits, A.V. Mesoscale processes of atmospheric pollution transfer in the area of Southern Baikal. Ocean. Res. 2019, 47, 104–113. [Google Scholar]
- Muñoz-Sabater, J.; Dutra, E.; Agustí-Panareda, A.; Albergel, C.; Arduini, G.; Balsamo, G.; Thépaut, J.N. ERA5-Land: A state-of-the-art global reanalysis dataset for land applications. Earth Syst. Sci. Data 2021, 13, 4349–4383. [Google Scholar] [CrossRef]
- Wang, Z.; Chen, P.; Wang, R.; An, Z.; Qiu, L. Estimation of PM2.5 concentrations with high spatiotemporal resolution in Beijing using the ERA5 dataset and machine learning models. Adv. Space Res. 2023, 71, 3150–3165. [Google Scholar] [CrossRef]
- Romanov, A.A.; Tamarovskaya, A.N.; Gusev, B.A.; Leonenko, E.V.; Vasiliev, A.S.; Krikunov, E.E. Catastrophic PM2.5 emissions from Siberian forest fires: Impacting factors analysis. Environ. Pollut. 2022, 306, 119324. [Google Scholar] [CrossRef]
- Podlesnyi, S.V.; Devyatova, E.V.; Saunkin, A.V.; Vasilyev, R.V. Comparing methods to estimate cloud cover over the Baikal natural territory in December 2020. Sol.-Terr. Phys. 2022, 8, 95–102. [Google Scholar]
- Shikhovtsev, A.Y.; Kovadlo, P.G.; Khaikin, V.B.; Kiselev, A.V. Precipitable Water Vapor and Fractional Clear Sky Statistics within the Big Telescope Alt-Azimuthal Region. Remote Sens. 2022, 14, 6221. [Google Scholar] [CrossRef]
- Gadal, C.; Delorme, P.; Narteau, C.; Wiggs, G.F.; Baddock, M.; Nield, J.M.; Claudin, P. Local wind regime induced by giant linear dunes: Comparison of ERA5-land reanalysis with surface measurements. Bound.-Layer Meteorol. 2022, 185, 309–332. [Google Scholar] [CrossRef]
- Shikhovtsev, M.Y.; Molozhnikova, Y.V.; Obolkin, V.A.; Potemkin, V.L.; Lutskin, E.S.; Khodzher, T.V. Features of Temporal Variability of the Concentrations of Gaseous Trace Pollutants in the Air of the Urban and Rural Areas in the Southern Baikal Region (East Siberia, Russia). Appl. Sci. 2024, 14, 8327. [Google Scholar] [CrossRef]
- Tian, G.; Jiang, J.; Yang, Z.; Zhang, Y. The urban growth, size distribution and spatio-temporal dynamic pattern of the Yangtze River Delta megalopolitan region, China. Ecol. Model. 2011, 222, 865–878. [Google Scholar] [CrossRef]
- Huang, C.; Chen, C.H.; Li, L.; Cheng, Z.; Wang, H.L.; Huang, H.Y.; Streets, D.G.; Wang, Y.J.; Zhang, G.F.; Chen, Y.R. Emission inventory of anthropogenic air pollutants and VOC species in the Yangtze River Delta region, China. Atmos. Chem. Phys. 2011, 11, 4105–4120. [Google Scholar] [CrossRef]
- Shikhovtsev, A.Y. Reference optical turbulence characteristics at the Large Solar Vacuum Telescope site. Publ. Astron. Soc. Jpn. 2024, 31, 538–549. [Google Scholar] [CrossRef]
- Potemkina, T.; Potemkin, V. Extreme phenomena in the Lake Baikal basin: Tropical nights and hot days as indicators of climate warming (Eastern Siberia, Russia). Theor. Appl. Climatol. 2024, 155, 6581–6590. [Google Scholar] [CrossRef]
- Bolbasova, L.A. Daytime optical turbulence and wind speed distributions at the Baikal Astrophysical Observatory. Mon. Not. R. Astron. Soc. 2019, 482, 2619–2626. [Google Scholar] [CrossRef]
- Du, W.; Shen, G.; Chen, Y.; Zhuo, S.; Xu, Y.; Li, X.; Tao, S. Wintertime pollution levels, size distribution and personal daily exposure to particulate matter in the northern and southern rural Chinese homes and variation in different household fuels. Environ. Pollut. 2017, 231, 497–508. [Google Scholar] [CrossRef]
- Shikhovtsev, A.Y. A method of determining optical turbulence characteristics by the line of sight of an astronomical telescope. Atmos. Ocean. Opt. 2022, 35, 303–309. [Google Scholar] [CrossRef]


| Location | PM2.5 | PM10 |
|---|---|---|
| Patrony | 656/10% | 1063/16% |
| Listvyanka | 401/5% | 455/6% |
| Tankhoy | 291/4% | 514/7% |
Disclaimer/Publisher’s Note: The statements, opinions and data contained in all publications are solely those of the individual author(s) and contributor(s) and not of MDPI and/or the editor(s). MDPI and/or the editor(s) disclaim responsibility for any injury to people or property resulting from any ideas, methods, instructions or products referred to in the content. |
© 2025 by the authors. Licensee MDPI, Basel, Switzerland. This article is an open access article distributed under the terms and conditions of the Creative Commons Attribution (CC BY) license (https://creativecommons.org/licenses/by/4.0/).
Share and Cite
Shikhovtsev, M.Y.; Makarov, M.M.; Aslamov, I.A.; Tyurnev, I.N.; Molozhnikova, Y.V. Application of Modern Low-Cost Sensors for Monitoring of Particle Matter in Temperate Latitudes: An Example from the Southern Baikal Region. Sustainability 2025, 17, 3585. https://doi.org/10.3390/su17083585
Shikhovtsev MY, Makarov MM, Aslamov IA, Tyurnev IN, Molozhnikova YV. Application of Modern Low-Cost Sensors for Monitoring of Particle Matter in Temperate Latitudes: An Example from the Southern Baikal Region. Sustainability. 2025; 17(8):3585. https://doi.org/10.3390/su17083585
Chicago/Turabian StyleShikhovtsev, Maxim Yu., Mikhail M. Makarov, Ilya A. Aslamov, Ivan N. Tyurnev, and Yelena V. Molozhnikova. 2025. "Application of Modern Low-Cost Sensors for Monitoring of Particle Matter in Temperate Latitudes: An Example from the Southern Baikal Region" Sustainability 17, no. 8: 3585. https://doi.org/10.3390/su17083585
APA StyleShikhovtsev, M. Y., Makarov, M. M., Aslamov, I. A., Tyurnev, I. N., & Molozhnikova, Y. V. (2025). Application of Modern Low-Cost Sensors for Monitoring of Particle Matter in Temperate Latitudes: An Example from the Southern Baikal Region. Sustainability, 17(8), 3585. https://doi.org/10.3390/su17083585