Article

Analysis of the Sources of Soil Heavy Metals in Geological High-Background Areas at a Large Spatial Scale

1
School of Soil and Water Conservation, Beijing Forestry University, Beijing 100091, China
2
Rural Ecological Environment Monitoring Technology Department, Technical Centre for Soil, Agriculture and RuraI Ecology and Environment, Ministry of Ecology and Environment, Beijing 100012, China
3
Department of Agricultural Land Ecological Environment Supervision Technology, Technical Centre for Soil, Agriculture and RuraI Ecology and Environment, Ministry of Ecology and Environment, Beijing 100012, China
*
Author to whom correspondence should be addressed.
Sustainability 2025, 17(8), 3518; https://doi.org/10.3390/su17083518
Submission received: 6 March 2025 / Revised: 5 April 2025 / Accepted: 11 April 2025 / Published: 14 April 2025

Abstract

:
Determining the sources of heavy metals in soil on a large scale is of great significance for improving soil environmental management, especially in regions where the sources of soil heavy metals are complex. We analyzed the sources and correlations of soil heavy metals in southwestern China and counted the content of five typical heavy metal elements by collecting soil samples from 309 typical locations. The risk of soil heavy metal pollution in the study area is relatively high, with cadmium posing the highest risk. The risk of soil heavy metal pollution in areas with high and medium development levels of carbonate rocks is significantly higher than that in low development-level carbonate rock areas and non-carbonate regions. In medium-carbonate development regions, the intensity of human activities exceeds that in high-carbonate development regions, resulting in a more consistent risk of soil heavy metal pollution between the two zones. In high-carbonate regions, the main sources of heavy metals in soil are predominantly natural, while in moderate regions, there is a mixed influence of both anthropogenic and natural sources. In low regions, both sources are minimal. There are also notable differences within the non-carbonate region, with the southeastern area exhibiting much higher values than the other regions, which is related to the intensity of human activity being significantly greater than in other areas. Among these, polluting enterprises that discharge heavy metals are the most significant contributors. This provides support for understanding the spatial differences in soil heavy metals and their main influencing factors at the national or regional level.

1. Introduction

Globally, carbonate rocks constitute 12% of the Earth’s rocks [1], primarily distributed between 30° N and 30° S [2]. Compared to other rock types, carbonate rocks exhibit more intense chemical exchanges with water bodies and soils [3]. This is determined by the inherent properties of carbonates, particularly in low-latitude regions [4], where carbonates are influenced by a combination of factors such as climate [5], topography [6], groundwater [7], and human activities [8]. As a result, many substances within the rocks can easily migrate into other systems, and some studies have shown that the concentration of heavy metals in soils in carbonate regions is relatively high [9]. This is due to the fact that heavy metals in carbonates can easily form complexes in mildly acidic environments, leading to their incorporation into surface soils, which is harmful to plants [10], crops [11], and animals [12]. However, it remains unclear which types of carbonates have a more significant impact on soil heavy metals, and whether there is a certain correlation between human activities and geological sources. Therefore, determining the distribution and source allocation of soil heavy metals on a larger scale is of great importance for ecological protection and restoration.
Distinguishing between geological and anthropogenic sources of heavy metals in soil is crucial for the sustainable protection of the soil environment. Understanding the contribution of human activities to soil heavy metals is of great significance for sustainable environmental governance. Identifying the large-scale distribution of heavy metals in soil aids in the formulation of sustainable environmental policies.
Soil heavy metals are caused by a series of interactions between various factors, including natural and societal influences [13,14,15]. The lithology of the subsurface soils determines the degree of weathering, which, in turn, controls the geochemical behavior of the soils and affects the accumulation of heavy metals within them [16]. However, this distribution of soil heavy metals does not represent the final concentrations. Secondary human activities can also influence the final content of soil heavy metals through changes in point source pollution distribution due to external inputs, such as metal mining [17], tailings [10], factories with heavy metal emissions [18], and agricultural production [19,20]. The sources of soil heavy metals in carbonate regions are more complex. Xia compared the soil Cd content in two types of carbonate bedrock areas and found that the total Cd content and the proportion of mobile Cd in soils developed from alluvial layers were higher than those in soils developed from mountain alluvial layers [21]. A similar characteristic, related to the material exchange intensity of different types of carbonates, was observed in crop plants. Jia et al. [22] conducted a comprehensive analysis in a small carbonate watershed and estimated that geological and weathering sources of soil heavy metals accounted for approximately 26%, while industrial activities, agricultural production, and traffic emissions contributed around 36% [23]. These studies have analyzed the sources of soil heavy metals in carbonate regions and their ecological hazards; however, they mainly focus on a medium to small scale and emphasize specific sources of soil heavy metals, such as analyzing the contributions of several mines to the regional soil heavy metal levels [24]. Xia et al. [25] conducted an analysis in a province and concluded that lithology is an important factor contributing to the spatial variation in soil cadmium (Cd). Rock types such as limestone, basalt, diabase, and carbonaceous shale are significant contributors to the high Cd background in soils. Compared to the parent rock types, the influence of the geological age of the rock strata on the soil Cd background is not very significant. Qu et al. [26] analyzed a river in a carbonate region and its surrounding areas, finding that the entire watershed is affected by the rapid weathering and release of heavy metal elements from carbonate rocks. Basalt and black shale, which are exposed in the watershed and have higher heavy metal content, serve as important sources of soil heavy metal elements.
To some extent, these studies supplement the understanding of the contributions of different degrees of formation and rock types in carbonate regions to soil heavy metals [27]; however, they remain limited to natural background conditions without incorporating analyses of human activities. There is no clear distinction regarding whether the soil heavy metals in the region are primarily influenced by carbonate types or human activities. Additionally, it is currently unknown whether there are differences in the extent and impact of these two factors. In response, this study involved a larger research scale, focusing on the entire southwestern region of China. By selecting typical representative areas to collect soil samples, the spatial distribution patterns of five typical heavy metal elements were analyzed, the differences in soil heavy metals among various carbonate types were examined, and data on human activity intensity were combined to determine whether there were significant differences between natural sources and human contributions on a large scale. The core aim of this study was to ascertain the contributions of different carbonate types and human activities to the sources of soil heavy metals, which provides strong support for the establishment of soil heavy metal prevention and control policies at the national or regional level.

2. Materials and Methods

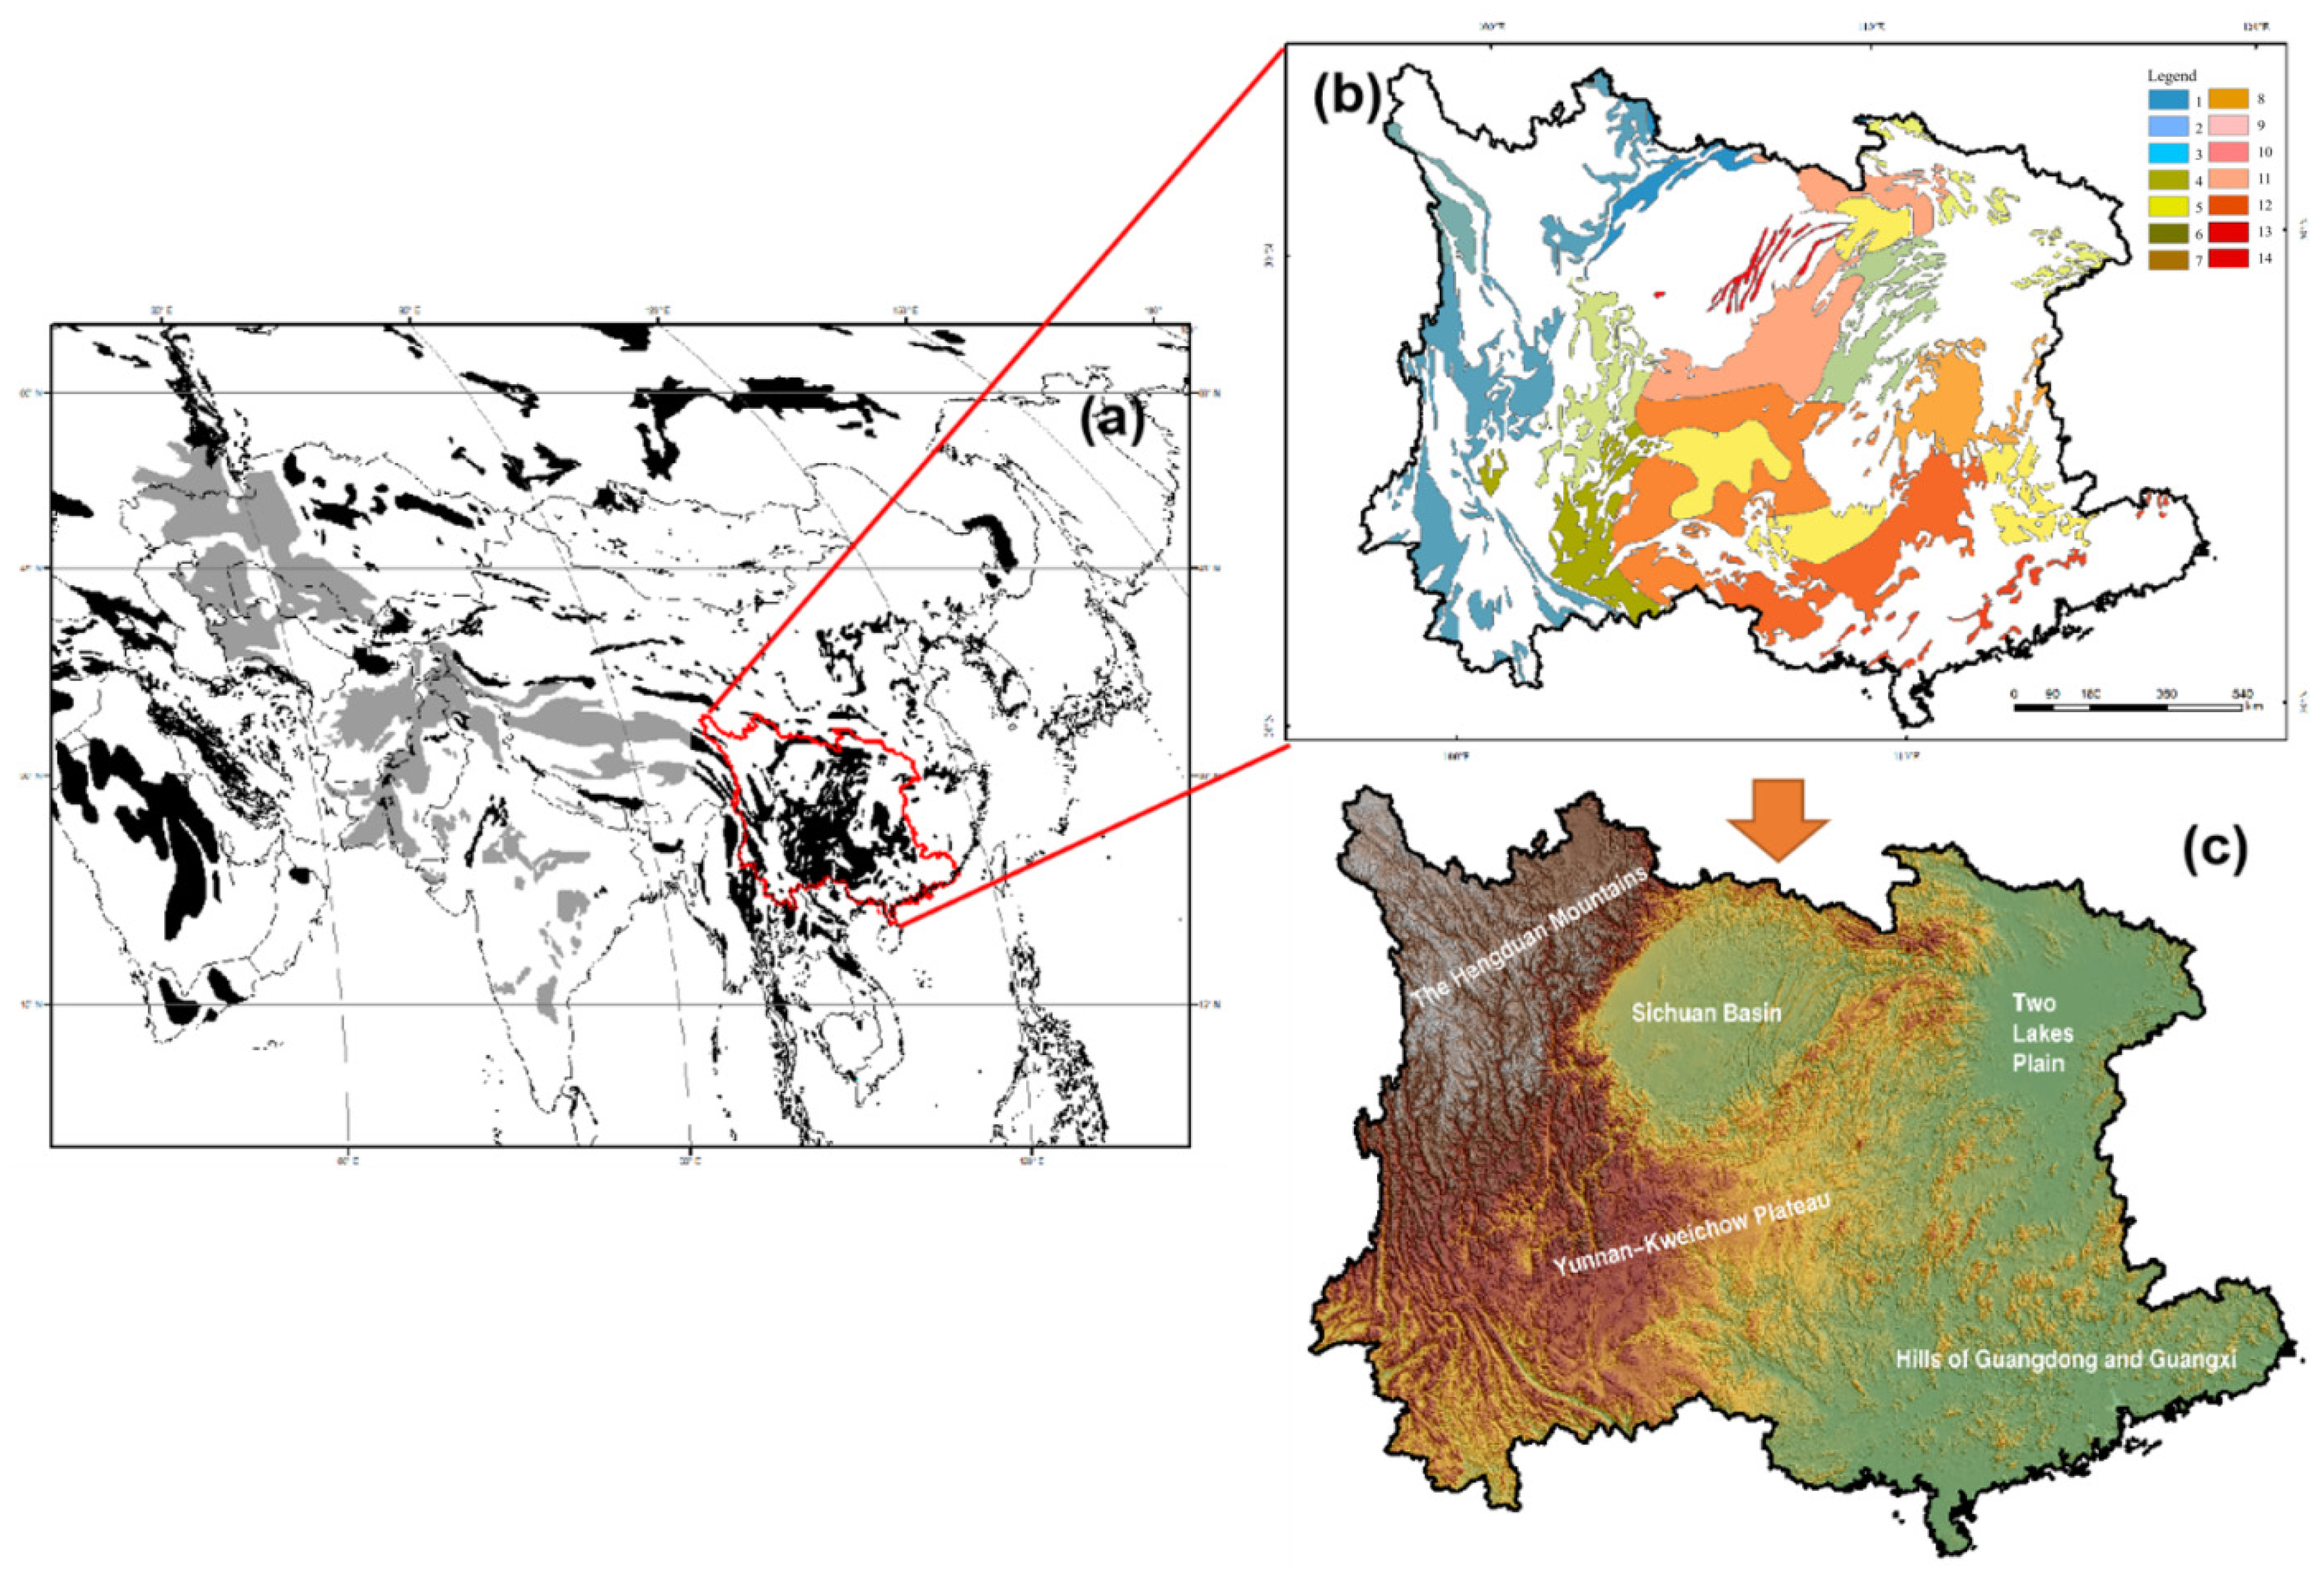
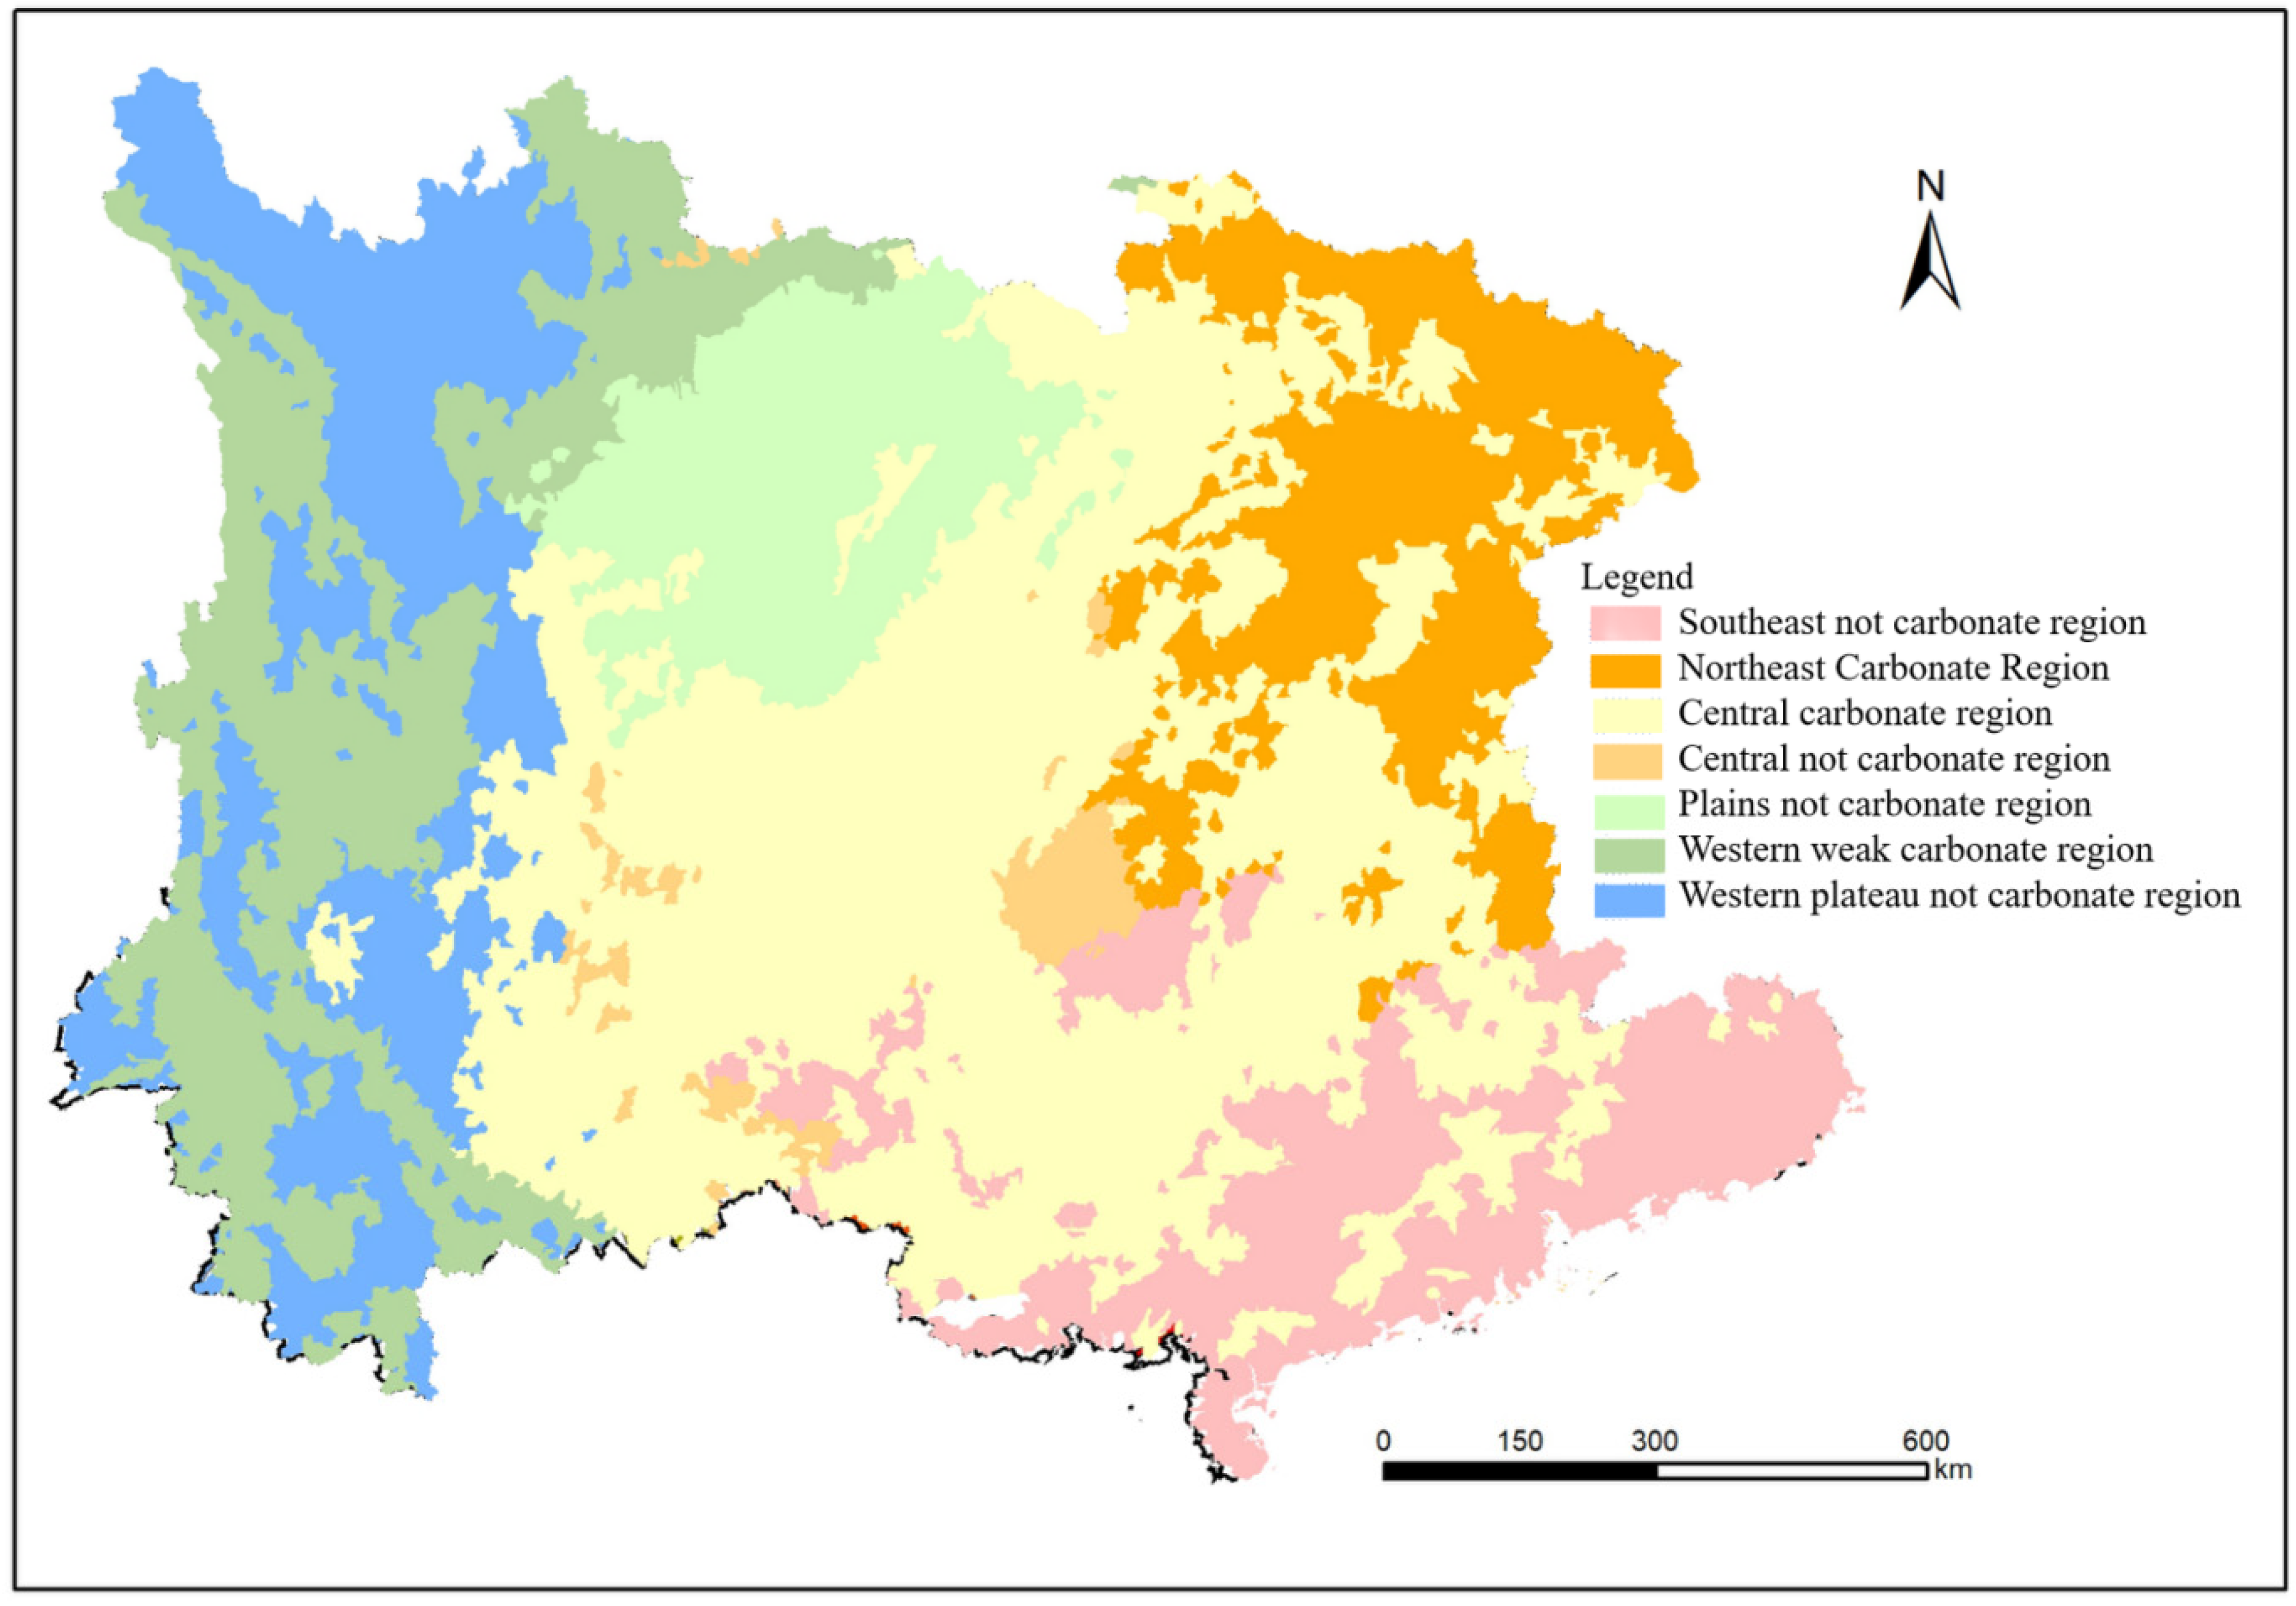
2.1. Description of the Study Area

The research area is situated in the southwest of China, encompassing an overall area of 18,617 square kilometers. It features karst topography and has a population of nearly 4 million. Apart from the central urban area located on flat river terraces, the remaining approximately 2 million people live in dispersed rural areas in the mountainous hills. There are various types of carbonates and levels of development. According to the classification of carbonate development, the western part of the study area exhibits relatively low carbonate development, while the remaining regions show a relatively complete level of carbonate development [28]. This is mainly due to the combined effects of topography, geomorphology, and natural climate, leading to significant differences in the types of karst development within the study area. Based on the regional topographic and geomorphological characteristics (Figure 1c), the karst types in the study area are classified into 14 categories (Figure 1b), which are primarily divided into three types: fully developed karst landforms, moderately developed karst landforms, and poorly developed karst landforms; different color schemes are used to distinguish the three types. We chose this region because the southwestern part of the country has played a unique role in soil quality assessment in several national soil quality surveys conducted in China [18,29,30]. The soil heavy metal content in the region is generally high, but its sources are complex, influenced by the interplay of human activities and natural factors, with notable differences observed [31].

2.2. Soil Sampling and Analysis

Considering the large scale of the study, how to represent the overall situation of the region through a limited number of points is the focus of the point samples. Soil spot samples were collected from September to December 2022 during our survey of desertification in the southwestern karst region (Figure 2). Soil heavy metal background value sampling points were selected using the multi-level grid method for point placement, taking into account the following conditions: (1) Considering the pollution diffusion range of the enterprise, the sampling points should be located outside a 5 km radius around the enterprise. (2) To reduce the impact of traffic sources, the sampling points should be located at least 1 km away from major roads. (3) Sampling points should minimize the impact of point sources from human activities and be located at least 500 m away from major buildings. (4) The land use type should be naturally formed woodland and grassland. (5) Considering the accessibility of the sampling points, if a location is difficult to reach, it should be relocated to an area with less human activity where the soil type, geological type, and vegetation type are the same for sampling. (6) The different types of karst in Figure 1b should have evenly distributed sampling points across different regions.
A mixed-sample collection scheme was adopted in this study. This collection method is based on the diagonal method, in which the diagonal area is divided into five equal parts, and the surface soil (0–20 cm) is collected, with the five aliquots as sampling sub-points. The soil from these aliquots was mixed, representing the soil sample at that point. A total of 309 sampling points were selected. The soil samples were air-dried in the laboratory to remove non-soil impurities (plant residues, stones, etc.). Then, 50 g of the samples were passed through a 20-mesh sieve for pH analysis. The remaining 80 g was air-dried and sieved through a 200-mesh sieve to determine the content of eight heavy metals: Cd, Hg, As, Pb, Cr, Cu, Zn, and Ni. Cr, Pb, and Zn were determined via X-ray fluorescence spectrometry (XRF); Cd, Ni, and Cu via inductively coupled plasma mass spectrometry (ICP-MS); and As and Hg through atomic fluorescence spectrometry (AFS).

2.3. Analysis of Cumulative Risks

Soil samples are point data, representing only the conditions around the sampling points. Due to the high variability in soil, there may be significant differences between individual points and the overall conditions of the region. Therefore, effective statistical analysis is necessary to determine the common analytical methods for assessing regional soil heavy metal content. In this study, conventional statistical measures are employed to reflect the heavy metal content in the regional soil, including mean, standard deviation, variation coefficient, skewness, and kurtosis [32]. Among these, standard deviation and variation coefficient reflect the variability in soil heavy metals on a large scale, while skewness and kurtosis provide insights into the overall characteristics of the collected soil heavy metal samples.
For the evaluation of soil heavy metal content, the Nemerow Comprehensive Pollution Index is used to reflect the overall condition of heavy metal content in the regional soil [33]. The Nemerow index comprehensively represents the overall status of heavy metal content in the soil of the region, meeting the environmental assessment needs for heavy metals in soil on a large scale [34], with the calculation formula as follows:
P N = P ave + P m a x 2 1 2
where PN is the comprehensive pollution index, used to reflect the different impacts of various pollutants on regional soil. Pave is the average value of all individual pollution indices. Pmax is the maximum value among the individual pollution indices in the soil environment.

2.4. Quantification of the Intensity of Human Activities Related to Soil Heavy Metal Content

The anthropogenic factors affecting soil heavy metal content are diverse, and it is challenging to accurately determine the contribution rate of a specific factor to soil heavy metals on a large scale. This requires vast amounts of data for verification, which is difficult to achieve. Therefore, this study summarizes the anthropogenic factors related to soil heavy metals as a quantitative measure of human activity intensity for overall characterization and analysis. The study uses county-level data as the minimum unit for data collection, including the following categories: GDP, primary industry GDP, secondary industry GDP, industrial land area, agricultural production land area, the length of transportation roads, population size, and the number of mines. These data reflect the intensity of human activities in the region. Among them, GDP and population size primarily reflect the overall economic situation of the region, while primary industry GDP and agricultural production land area indicate the potential total pollution from agricultural non-point sources. Secondary industry GDP, industrial land area, the length of transportation roads, and the number of mines reflect the risk of soil heavy metal pollution potentially caused by industrial production in the region [35]. The above data were collected from https://www.mnr.gov.cn/sj/sjfw/ (accessed on 31 December 2022).
After determining the indicators, the analytic hierarchy process (AHP) was used to establish the weights of the various factors [36]. AHP combines qualitative and quantitative analysis, allowing the decision-maker’s experiential judgments to be translated into specific weights, making it suitable for decision-making in multi-objective complex problems. To prevent bias in individual judgments, this study utilized the average judgments of nine researchers to determine the importance of different factors.
I = λ n n 1
I = C I 1 + C I 2 + + C I n n
C R = C I R I
S h = i = 1 n   S L i · Z i
The consistency index is calculated using CI, where a smaller CI indicates greater consistency. The random consistency index (RI) is related to the order of the judgment matrix; generally, as the order of the matrix increases, the likelihood of random inconsistency also increases. Considering that deviations in consistency may be caused by random factors, it is necessary to compare CI with the random consistency index RI when testing whether the judgment matrix has satisfactory consistency. From this comparison, we derive the consistency ratio (CR). If CR < 0.1, the judgment matrix is considered to have passed the consistency test; otherwise, it does not have satisfactory consistency. Sh represents the final calculation results of human activities, SLi represents the indicator values calculated using AHP, and Zi denotes the normalized values of each indicator.

3. Results

3.1. Temporal Changes in Sampling Content

From the perspective of the entire study area, in conjunction with relevant evaluation criteria, cadmium (Cd) poses the highest soil environmental risk (with an exceedance rate of 53.9%), followed by arsenic (As), lead (Pb), and chromium (Cr). Mercury (Hg) does not pose widespread soil environmental risk. In terms of variability, Cd, As, and Pb exhibit high variability, indicating significant differences in the soil concentrations of these elements across the study area, necessitating a comparative analysis of these differences by sub-region (Table 1). Although Hg presents a low soil environmental risk overall, it shows some local accumulation. The soil Cr content remains relatively consistent throughout the study area. The skewness values for the five heavy metal elements are all greater than 0, indicating that many sampling points have low heavy metal concentrations, while points with high concentrations are widely dispersed and exhibit significant differences, particularly for Hg, which aligns with the characteristics of variance. The kurtosis values are all greater than 3, suggesting that the distribution has a sharper peak than a normal distribution, with local heavy metal concentrations significantly higher than those in other areas. The evaluation results from the Nemerow index are consistent with the statistical characteristics of the Cd element, indicating the widespread impact of Cd on regional soil heavy metals, whereas the other heavy metal elements are concentrated in specific areas.

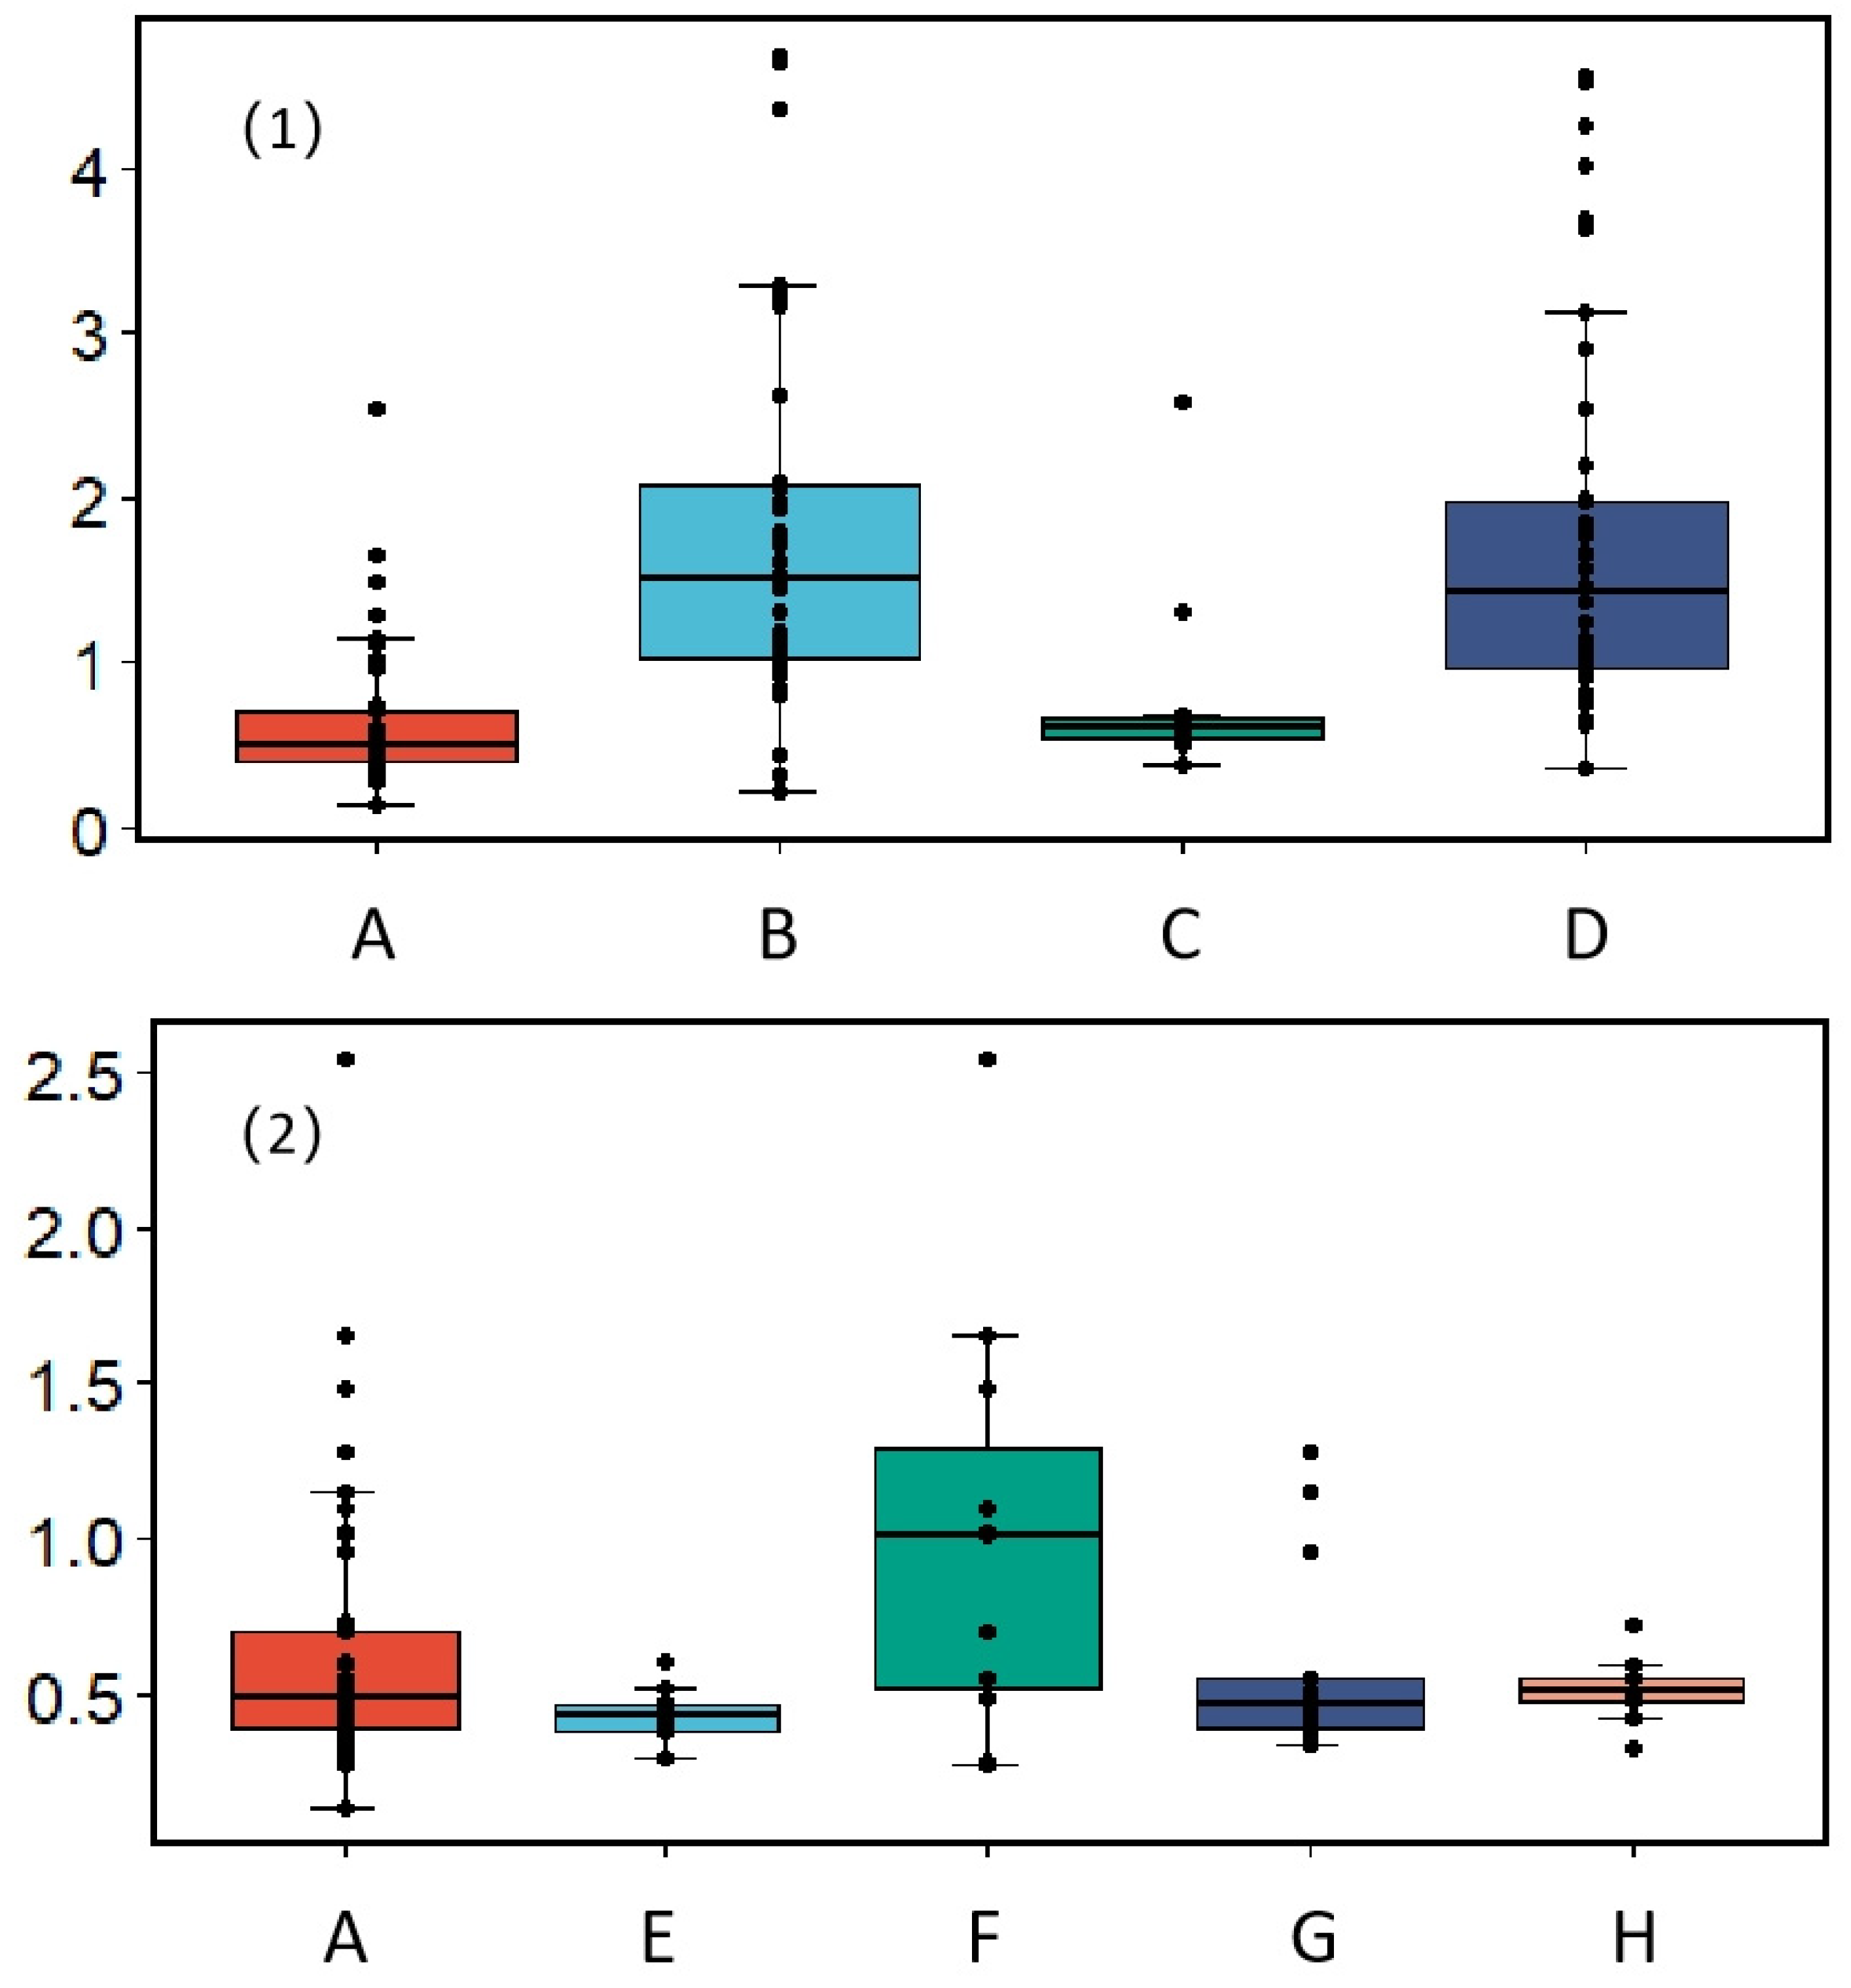
3.2. Statistical Analysis of Heavy Metal Concentrations Across Distinct Regions

Due to the fact that large-scale studies may overlook regional differences, the aim of this study is to analyze the differences among various carbonate regions (Figure 3). In conjunction with the different types of carbonates and topography discussed in Section 2.1, the study area is divided into seven units, including the Southeast Non-Carbonate Region, Northeast Carbonate Region, Central Carbonate Region, Central Non-Carbonate Region, Plains Non-Carbonate Region, Western Weak Carbonate Region, and Western Plateau Non-Carbonate Region. The boundaries of each area are aligned with county-level administrative boundaries to facilitate the integration and analysis of human activity intensity data, as discussed in Section 2.4. There are overlaps in the regional divisions, primarily due to the varying types of carbonate. The plateau region in the west is divided into two areas based on the distribution of carbonates, while the northern part of the Sichuan Basin in the central region is separated due to its topography and population density. The delineation between the Northeast Carbonate Region and the Central Carbonate Region mainly takes into account the differing types of carbonate.
Based on the regional divisions outlined in Section 3.1, a comparative analysis of different areas is conducted. For the soil heavy metal sampling points in various regions, the Nemerow Comprehensive Pollution Index is employed to analyze the comprehensive pollution risk of five heavy metal elements (Figure 4). A boxplot is used to compare the statistical results across different regions. “A” represents the overall results of the Non-Carbonate Region, reflecting areas that are not influenced by natural background levels, thereby better isolating the impact of carbonates on soil heavy metals on a larger scale. “B” represents the Central Carbonate Region, which is a strong karst area. “C” denotes the Western Weak Carbonate Region, categorized as a weak karst area. “D” represents the remaining moderate carbonate regions, while “E” indicates the Western Plateau Non-Carbonate Region. “F” is the Southeast Non-Carbonate Region, “G” represents the Central Non-Carbonate Region, and “H” represents the Plains Non-Carbonate Region. A t-test was conducted on the partitioned sample data, and the p-value was less than 0.05, indicating that there are significant differences between the different type groups.
The statistical patterns of soil heavy metals in well-developed strong karst areas and moderately developed karst areas within carbonate regions are generally consistent. The 75th percentile of region B is slightly higher than that of region D, and the soil heavy metal pollution risk in regions B and D is significantly higher than that of the entire Non-Carbonate Region in southwest China. This indicates that geological factors in areas where carbonates are developed beyond a moderate level contribute significantly to soil heavy metal content. However, the risk in the weak karst area is comparable to that of the Non-Carbonate Region. Considering the regional topography shown in Figure 1, region C is primarily concentrated in the plateau area of the west, where the degree of carbonate development is low, the climate tends towards cold and humid conditions, and the interaction between bedrock and soil is lower than that in other carbonate areas. A comparative analysis of the different non-carbonate regions reveals that region E, corresponding to the Western Plateau Non-Carbonate Region, is essentially consistent with region C, indicating that, in plateau areas, both non-carbonate regions and carbonate regions have a lower impact on soil heavy metal risk. Regions G and H display relatively similar conditions, with the soil heavy metal content in region H being more uniform because its topography includes a basin, making it more geographically enclosed. Region F is characterized as the area with the highest intensity of human activity in the entire study area; however, its 50th percentile Nemerow index is 17% lower than that of regions B and D.

3.3. Variation in Heavy Metal Vertical Content

The results of human activity intensity calculations were spatially clustered using the natural neighbor method, resulting in three levels (Figure 5). The blue region indicates areas with low human activity intensity, characterized by lower population numbers, economic activities, and agricultural production, where the soil heavy metal content is minimally affected by human activities. The red region, with a human activity intensity greater than 0.25, exhibits a concentrated distribution of agriculture, industry, and population, making the soil more susceptible to human influence through natural pathways such as the atmosphere and surface groundwater. The yellow region lies between the two, where human activities are prominent in specific aspects, typically representing concentrated agricultural or industrial production areas. Ejza et al. [37] also employed a similar methodology.
Based on the analysis in Section 3.2, the human activity intensity in regions C and E is generally below 0.1; however, region C has individual points with relatively high soil heavy metal pollution risks, while region E does not exhibit such cases. The human activity intensity in regions B and D is relatively high, particularly in region D, where the number of county-level administrative regions exceeding 0.25 is 2.17 times that of region B. The contribution of human activity intensity to soil heavy metals in region D is significantly greater than that in region B. As the area with the highest human activity, region F is classified as a non-carbonate region, yet it has the highest number of county-level administrative regions exceeding 0.25 and the highest degree of clustering.
A separate analysis was conducted on the factor contributing most significantly to the calculation of human activity intensity—the number of enterprises emitting heavy metals (Figure 6), with classification criteria consistent with those in Figure 5. The distribution of the number of relevant enterprises further confirms that the high soil heavy metal pollution levels in regions D and F are influenced by polluting enterprises. This can be substantiated by comparing regions G and F, where the number of high human activity intensity indicators (in red) is similar for both regions; however, the number of relevant polluting enterprises in region F significantly exceeds that in region G.

4. Discussion

4.1. Sources and Impacts of Soil Heavy Metal

Exploring the sources of soil heavy metals on a large scale is crucial for regional environmental management, as it plays a key role in formulating regional soil environmental protection and remediation strategies. For example, in carbonate regions where soil heavy metal concentrations are relatively high, a greater degree of tolerance is required. However, such policies cannot be implemented in non-carbonate regions, even if they fall within the same larger administrative division spatially.
The Nemerow Comprehensive Pollution Index indicates that, in the study area, the highly developed carbonate regions contribute the most to soil heavy metal pollution. The stronger material exchange between rocks and soil allows the soil to inherit more heavy metals from the bedrock. In Carbonate Regions, the main components of the bedrock include calcite, dolomite, marl, and mudstone dolomite. Under the processes of weathering and leaching, major elements such as calcium and magnesium are largely leached out and lost, while heavy metal elements with very low mobility accumulate in the insoluble residues. These elements can easily enter the surrounding or upper layers of soil, resulting in a higher concentration of heavy metals in the well-developed Carbonate Regions derived from the bedrock [38]. In moderately developed carbonate regions, the intensity of human activities exceeds that in the highly developed carbonate regions, leading to a relatively consistent risk of soil heavy metal pollution between the two regions. The contribution of human activities to soil pollution is lower compared to the geological contribution of the region. This is primarily due to the large-scale mining and smelting activities in areas with high geological background, which increase the accumulation of heavy metals. Additionally, factors such as the reclamation of farmland, irrigation, and fertilization in high geological background areas alter the original topography, soil properties, and biological types, making the processes and mechanisms of soil element accumulation and differentiation in these areas more complex.
It is important to note that the risk of soil heavy metal pollution in non-carbonate regions is significantly higher in the southeastern part of the study area [39]. Although the soil heavy metal risk is lower compared to the highly developed carbonate regions, the variability in soil pollution caused by non-carbonate regions is greater, resulting in lower accuracy in spatial difference analysis. This is because the southeastern area of the Non-Carbonate Regions has the highest number of relevant polluting enterprises and the greatest intensity of agricultural land use. Activities such as the irrigation of agricultural land with wastewater discharged by enterprises and the unreasonable use of chemical fertilizers in agriculture and livestock farming contribute to the accumulation of heavy metals in the soil. Additionally, phosphate fertilizers, pesticides, and organic fertilizers are also considered important sources of Pb, Cd, Cu, and As in agricultural soils [40].

4.2. Correlation Analysis Between Carbonate Regions and Mineralization Belts

The study area is large and contains three significant mineralization belts [41]. The strata in Area M1 are rich in mercury, lead, antimony, zinc, gold, silver, copper, iron, rare-earth elements, and other associated elements. The strata in Area M2 are rich in copper, lead, and zinc, while the strata in Area M3 are rich in tungsten, tin, bismuth, lead, zinc, gold, and rare-earth elements [42]. Areas M1 and M3 spatially overlap with the highly developed carbonate regions, while Area M2 overlaps spatially with the less developed carbonate regions (Figure 7).
This may lead to intensified mining activities that further increase the entry of heavy metals into the soil, particularly in Area M1, where the carbonate rock development is high and the topographical structure is complex, with diverse rainfall and weathering. Although the intensity of human activities is lower compared to in non-carbonate regions, the impact range of point source mining activities far exceeds that of other regions, as validated by HU’s research [43]. In Area M2, although the mining of lead–zinc ores is more likely to cause soil heavy metal pollution, it is constrained by the higher altitude, lower intensity of human activities, and lower degree of carbonate rock development, resulting in greater stability and lower material exchange between rocks and soil. Consequently, the risk of soil heavy metal pollution is far lower than in other regions. For example, soils developed from carbonate limestone have higher Cd concentrations compared to other soils developed from Quaternary river sediments. Moreover, the deeper the weathering and leaching process, the greater the secondary enrichment, which, in turn, leads to higher concentrations of heavy metals in the soil. Additionally, primary soil components such as iron-manganese oxides, clay minerals, and organic matter also play important roles in the distribution of heavy metals. This indicates that, when analyzing the sources of soil heavy metals on a large scale, geological type, human activities, and climate all play significant roles that cannot be ignored.

4.3. Limitations and Improvement

Large-scale analysis is constrained by the availability of data, particularly by the dataset of soil samples. Determining the representativeness of sampling locations is critical to this study. Therefore, extensive efforts were made in the collection of samples to better represent the characteristics of the sampling areas. However, this still needs to accurately reflect the overall conditions of the region, and further validation studies are necessary in the future. Due to the lack of deep soil samples and bedrock samples, the correlation analysis in Section 4.2 could only be inferred through GIS spatial overlap. However, in future research, we will supplement the samples to establish their quantitative relationship. At the same time, in analyzing the intensity of human activities in the study area, the selection of indicators is also crucial. It is essential to consider how to overlook regional influencing factors and better focus on the impact of human activities on soil heavy metal pollution. In particular, mining has a dual impact on geological types and human activities. It is worth exploring how agricultural production and related pollution enterprises can quantify and analyze their contribution rates based on regional differences.

5. Conclusions

The large-scale analysis of heavy metals in soil has always been a focus and challenge in soil environment research. In the southwestern region of China, the spatial distribution and sources of soil heavy metals and variations among them are even more complex. In this study, the Nemerow index and statistical analysis were employed, with two factors selected—the development degree of carbonate rocks and human activities—in order to create differentiated zones. The main conclusions are as follows.
Based on the spatial distribution characteristics of hydrochloric salt at different developmental levels in the study area and the statistical evaluation results of soil heavy metals, there are significant differences in the risk of soil heavy metal pollution in the southwestern region of China. According to the zoning results, the areas with high and the base image is Figure 1b.
Medium levels of carbonate rock development have a much higher risk of soil heavy metal pollution compared to those with low development levels and non-carbonate regions. Regions with a high degree of carbonate development contribute the most to soil heavy metal content, with stronger material exchange between rocks and soil resulting in more heavy metals inherited from the bedrock. In medium development regions, the intensity of human activity exceeds that of high-carbonate development regions, leading to a more consistent risk of soil heavy metal pollution between the two zones. The contribution of human activity is comparatively lower than that of regional lithology. The risk of soil heavy metals in areas with low levels of carbonate development is low, being influenced by topography and climate. There are also significant differences within the non-carbonate region, with the southeastern area exhibiting much higher values than other regions. This is related to the intensity of human activities being far greater than in other areas. Among these, polluting enterprises discharging heavy metals are the most significant contributors. This provides support for understanding the spatial differences in soil heavy metals and their main influencing factors at the national or regional level.

Author Contributions

Conceptualization, Z.Q.; Methodology, Z.Q. and L.L.; Software, Z.Q.; Validation, Z.Q. and L.L.; Resources, Z.Q.; Data curation, L.L.; Writing—original draft, Z.Q.; Supervision, X.W. All authors have read and agreed to the published version of the manuscript.

Funding

This research received no external funding.

Institutional Review Board Statement

Not applicable.

Informed Consent Statement

Not applicable.

Data Availability Statement

The data that support the findings of this study are available from the corresponding author Zhiheng Qin upon reasonable request.

Conflicts of Interest

The authors declare no conflict of interest.

References

  1. Soja, C. Island-arc carbonates: Characterization and recognition in the ancient geologic record. Earth-Sci. Rev. 1996, 41, 31–65. [Google Scholar] [CrossRef]
  2. Yin, S.; Xie, Y.; Hou, Z.; Qu, Y.; Institute of Geology, Chinese Academy of Geological Sciences. A Review of Research Advances on Carbonatite. Acta Petrol. Sin. 2024, 40, 1003–1022. [Google Scholar] [CrossRef]
  3. Anenburg, M.; Broom-Fendley, S.; Chen, W. Formation of Rare Earth Deposits in Carbonatites. Elements 2021, 17, 327–332. [Google Scholar] [CrossRef]
  4. Yaxley, G.M.; Kjarsgaard, B.A.; Jaques, A.L. Evolution of Carbonatite Magmas in the Upper Mantle and Crust. Elements 2021, 17, 315–320. [Google Scholar] [CrossRef]
  5. Xia, X.; Ji, J.; Zhang, C.; Huang, C.; Lu, X.; Yang, Z. The degree of soil arsenic background enrichment by carbonate weathering is mainly controlled by climate in large spatial scale. Sci. Total Environ. 2024, 951, 175868. [Google Scholar] [CrossRef]
  6. Chen, M.; Li, X.; Cao, X.; Yang, W.; Wu, P.; Hao, H.; Fei, Z.; Gao, Y. Soil-forming accumulation of heavy metals in geological high background areas: Constraints of structure, lithology, and overlying soil geochemistry. J. Geochem. Explor. 2024, 263, 107518. [Google Scholar] [CrossRef]
  7. Yadav, S.K.; Attry, B.; Shukla, S.; Dutta, S.; Sharma, K.; Rajak, R.; Gupta, A.; Baruah, B.; Ranjan, R.K. Distribution, toxicity load and risk assessment of heavy metals in the groundwater of Dhemaji, Assam, India. Chemosphere 2024, 358, 141979. [Google Scholar] [CrossRef]
  8. Hu, Z.; Wu, Z.; Luo, W.; Liu, S.; Tu, C. Spatial distribution, risk assessment, and source apportionment of soil heavy metals in a karst county based on grid survey. Sci. Total Environ. 2024, 953, 176049. [Google Scholar] [CrossRef]
  9. Lin, K.; Yu, T.; Ji, W.; Li, B.; Wu, Z.; Liu, X.; Li, C.; Yang, Z. Carbonate rocks as natural buffers: Exploring their environmental impact on heavy metals in sulfide deposits. Environ. Pollut. 2023, 336, 122506. [Google Scholar] [CrossRef]
  10. Daldoul, G.; Souissi, R.; Souissi, F.; Jemmali, N.; Chakroun, H.K. Assessment and mobility of heavy metals in carbonated soils contaminated by old mine tailings in North Tunisia. J. Afr. Earth Sci. 2015, 110, 150–159. [Google Scholar] [CrossRef]
  11. Cui, J.-L.; Zhao, Y.-P.; Lu, Y.-J.; Chan, T.-S.; Zhang, L.-L.; Tsang, D.C.W.; Li, X.-D. Distribution and speciation of copper in rice (Oryza sativa L.) from mining-impacted paddy soil: Implications for copper uptake mechanisms. Environ. Int. 2019, 126, 717–726. [Google Scholar] [CrossRef] [PubMed]
  12. Crespo-Toledo, T.; Avelar-González, F.; Guerrero-Barrera, A.; Mitchell, K.; Yamamoto-Flores, L.; Flores-Amaro, O. Integrative assessment of heavy metal risks in mining polluted sediments and soils of Aguascalientes, Mexico. Case Stud. Chem. Environ. Eng. 2025, 11, 101130. [Google Scholar] [CrossRef]
  13. Hou, Y.; Ding, W.; Xie, T.; Chen, W. Prediction of soil heavy metal contents in urban residential areas and the strength of deep learning: A case study of Beijing. Sci. Total Environ. 2024, 950, 175133. [Google Scholar] [CrossRef]
  14. Rahmati, O.; Falah, F.; Dayal, K.S.; Deo, R.C.; Mohammadi, F.; Biggs, T.; Moghaddam, D.D.; Naghibi, S.A.; Bui, D.T. Machine learning approaches for spatial modeling of agricultural droughts in the south-east region of Queensland Australia. Sci. Total Environ. 2019, 699, 134230. [Google Scholar] [CrossRef] [PubMed]
  15. Negahban, S.; Mokarram, M.; Pourghasemi, H.R.; Zhang, H. Ecological risk potential assessment of heavy metal contaminated soils in Ophiolitic formations. Environ. Res. 2020, 192, 110305. [Google Scholar] [CrossRef]
  16. Zhang, L.; Qin, X.; Tang, J.; Liu, W.; Yang, H. Review of arsenic geochemical characteristics and its significance on arsenic pollution studies in karst groundwater, Southwest China. Appl. Geochem. 2017, 77, 80–88. [Google Scholar] [CrossRef]
  17. Chen, L.; Zhou, M.; Wang, J.; Zhang, Z.; Duan, C.; Wang, X.; Zhao, S.; Bai, X.; Li, Z.; Li, Z.; et al. A global meta-analysis of heavy metal(loid)s pollution in soils near copper mines: Evaluation of pollution level and probabilistic health risks. Sci. Total Environ. 2022, 835, 155441. [Google Scholar] [CrossRef]
  18. Peng, J.-Y.; Zhang, S.; Han, Y.; Bate, B.; Ke, H.; Chen, Y. Soil heavy metal pollution of industrial legacies in China and health risk assessment. Sci. Total Environ. 2021, 816, 151632. [Google Scholar] [CrossRef]
  19. Yang, Y.; Christakos, G.; Guo, M.; Xiao, L.; Huang, W. Space-time quantitative source apportionment of soil heavy metal concentration increments. Environ. Pollut. 2017, 223, 560–566. [Google Scholar] [CrossRef]
  20. Haney, R.L.; Haney, E.B.; Smith, D.R.; Harmel, R.D.; White, M.J. The soil health tool—Theory and initial broad-scale application. Appl. Soil Ecol. 2018, 125, 162–168. [Google Scholar] [CrossRef]
  21. Xia, X.; Yang, Z.; Yu, T.; Hou, Q.; Mutelo, A.M. Detecting changes of soil environmental parameters by statistics and GIS: A case from the lower Changjiang plain, China. J. Geochem. Explor. 2017, 181, 116–128. [Google Scholar] [CrossRef]
  22. Jia, Z.; Wang, J.; Zhou, X.; Zhou, Y.; Li, Y.; Li, B.; Zhou, S. Identification of the sources and influencing factors of potentially toxic elements accumulation in the soil from a typical karst region in Guangxi, Southwest China. Environ. Pollut. 2020, 256, 113505. [Google Scholar] [CrossRef] [PubMed]
  23. Jiang, Z.; Yang, S.; Luo, S. Source analysis and health risk assessment of heavy metals in agricultural land of multi-mineral mining and smelting area in the Karst region—A case study of Jichangpo Town, Southwest China. Heliyon 2023, 9, e17246. [Google Scholar] [CrossRef] [PubMed]
  24. He, Y.; Zhang, Q.; Wang, W.; Hua, J.; Li, H. The multi-media environmental behavior of heavy metals around tailings under the influence of precipitation. Ecotoxicol. Environ. Saf. 2023, 266, 115541. [Google Scholar] [CrossRef]
  25. Xia, X.; Yang, Z.; Yu, T.; Zhang, C.; Hou, Q. Predicting spatial and temporal variation of Cd concentration in rice grains in the Lower Changjiang Plain during 2004–2014 based on soil geochemical survey data with GIS. J. Geochem. Explor. 2019, 200, 276–283. [Google Scholar] [CrossRef]
  26. Qu, S.; Wu, W.; Nel, W.; Ji, J. The behavior of metals/metalloids during natural weathering: A systematic study of the mono-lithological watersheds in the upper Pearl River Basin, China. Sci. Total Environ. 2019, 708, 134572. [Google Scholar] [CrossRef]
  27. Qin, W.; Han, D.; Song, X.; Liu, S. Sources and migration of heavy metals in a karst water system under the threats of an abandoned Pb-Zn mine, Southwest China. Environ. Pollut. 2021, 277, 116774. [Google Scholar] [CrossRef]
  28. Mendes, P.R.; Salavati, S.; Linares, O.C.; Gonçalves, M.M.; Zampieri, M.F.; de Sousa Ferreira, V.H.; Castro, M.; de Oliveira Werneck, R.; Moura, R.; Morais, E.; et al. Rock-type classification: A (critical) machine-learning perspective. Comput. Geosci. 2024, 193, 105730. [Google Scholar]
  29. Wu, Y.; Li, X.; Yu, L.; Wang, T.; Wang, J.; Liu, T. Review of soil heavy metal pollution in China: Spatial distribution, primary sources, and remediation alternatives. Resour. Conserv. Recycl. 2022, 181, 106261. [Google Scholar] [CrossRef]
  30. Shi, J.; Zhao, D.; Ren, F.; Huang, L. Spatiotemporal variation of soil heavy metals in China: The pollution status and risk assessment. Sci. Total Environ. 2023, 871, 161768. [Google Scholar] [CrossRef]
  31. Qin, G.; Niu, Z.; Yu, J.; Li, Z.; Ma, J.; Xiang, P. Soil heavy metal pollution and food safety in China: Effects, sources and removing technology. Chemosphere 2020, 267, 129205. [Google Scholar] [CrossRef] [PubMed]
  32. Shi, T.; He, L.; Wang, R.; Li, Z.; Hu, Z.; Wu, G. Digital mapping of heavy metals in urban soils: A review and research challenges. Catena 2023, 228, 107183. [Google Scholar] [CrossRef]
  33. Kowalska, J.; Mazurek, R.; Gąsiorek, M.; Setlak, M.; Zaleski, T.; Waroszewski, J. Soil pollution indices conditioned by medieval metallurgical activity—A case study from Krakow (Poland). Environ. Pollut. 2016, 218, 1023–1036. [Google Scholar] [CrossRef]
  34. Xu, L.; Dai, H.; Skuza, L.; Wei, S. Comprehensive exploration of heavy metal contamination and risk assessment at two common smelter sites. Chemosphere 2021, 285, 131350. [Google Scholar] [CrossRef]
  35. Cao, Y.; Zhang, J.; Zhang, Z.; Tang, H.; Liu, L.; Liu, X.; Ma, R.; Zhang, M.; Zhang, X. The difference in ecological environmental quality impact factors between human activity zone and non-human activity zone in arid regions: A case study of the northern slope of the Tianshan Mountains. Ecol. Indic. 2025, 171, 113226. [Google Scholar] [CrossRef]
  36. Dong, J.; Chi, Y.; Zou, D.; Fu, C.; Huang, Q.; Ni, M. Energy–environment–economy assessment of waste management systems from a life cycle perspective: Model development and case study. Appl. Energy 2014, 114, 400–408. [Google Scholar] [CrossRef]
  37. Ejaz, U.; Khan, S.M.; Shah, S.F.A.; Khalid, N.; Jehangir, S.; Rizvi, Z.F.; Svenning, J.-C. Advanced Integrative Analytics for Data-Driven Risk Assessment of Ecological and Human Health Risks from Heavy Metal Contaminations in Soil. J. Hazard. Mater. Adv. 2025, 17, 100596. [Google Scholar]
  38. Li, C.; Zhang, C.; Yu, T.; Liu, X.; Yang, Y.; Hou, Q.; Yang, Z.; Ma, X.; Wang, L. Use of artificial neural network to evaluate cadmium contamination in farmland soils in a karst area with naturally high background values. Environ. Pollut. 2022, 304, 119234. [Google Scholar] [CrossRef]
  39. Wen, Y.; Li, W.; Yang, Z.; Zhang, Q.; Ji, J. Enrichment and source identification of Cd and other heavy metals in soils with high geochemical background in the karst region, Southwestern China. Chemosphere 2019, 245, 125620. [Google Scholar] [CrossRef]
  40. Yao, C.; Yang, Y.; Li, C.; Shen, Z.; Li, J.; Mei, N.; Luo, C.; Wang, Y.; Zhang, C.; Wang, D. Heavy metal pollution in agricultural soils from surrounding industries with low emissions: Assessing contamination levels and sources. Sci. Total Environ. 2024, 917, 170610. [Google Scholar] [CrossRef]
  41. Jiang, S.; Su, H.; Xiong, Y.; Liu, T.; Zhu, K.; Zhang, L. Spatial-Temporal Distribution, Geological Characteristics and Ore-Formation Controlling Factors of Major Types of Rare Metal Mineral Deposits in China. Acta Geol. Sin.—Engl. Ed. 2020, 94, 1757–1773. [Google Scholar] [CrossRef]
  42. Chen, X.; Han, L.; Ding, W.; Xu, S.; Tong, Y.; Zhang, Y.; Li, B.; Zhou, Q.; Wang, Y. Phanerozoic Tectonic Evolution, Metallogenesis and Formation of Mineral Systems in China. Acta Geol. Sin.—Engl. Ed. 2024, 98, 819–842. [Google Scholar] [CrossRef]
  43. Hu, J.; Yang, X.; Chi, H.; Liu, X.; Lu, N.; Liu, Y.; Yang, S.; Wen, X. Transport, pollution, and health risk of heavy metals in “soil-medicinal and edible plant-human” system: A case study of farmland around the Beiya mining area in Yunnan, China. Microchem. J. 2024, 207, 111958. [Google Scholar] [CrossRef]
Figure 1. Research area location. (a) Location of the study area in East Asia. Gray represents the predominance of exposed karst, while black indicates the predominance of covered karst. (b) Different types of karst development in southwest China: (1) weakly karsted middle and mountain type; (2) weakly karsted high and middle mountain canyon type; (3) weakly karsted plateau lake basin type; (4) middle karst-dominated plateau fault basin; (5) medium karst-dominated ridge-valley-like depressions; (6) medium karst-dominated crested canyon; (7) medium karst-dominated massif type; (8) moderate karstic crest depressions and peaks and forests; (9) strongly karst-dominated clumped mound depressions; (10) strongly karst-dominated low mountain peaks and broad valleys; (11) strongly karst-dominated mountain plain crest depression; (12) strongly karst-dominated peaks and plains; (13) strongly karst-dominated remnant mound basin type; (14) strongly karsted ridge and trough type. (c) Main topography of the study area.
Sustainability 17 03518 g001
Figure 2. Sampling of different land use types.
Sustainability 17 03518 g002
Figure 3. Regional division based on the differences in carbonate.
Sustainability 17 03518 g003
Figure 4. Comparison of Nemerow statistics in different regions. The horizontal axis represents different regions, and the vertical axis denotes the Nemerow Comprehensive Pollution Index. (1) Comparison between different carbonate types and non-karst regions. (2) Comparison between different non-carbonate regions.
Sustainability 17 03518 g004
Figure 5. Intensity of human activities by county statistics.
Sustainability 17 03518 g005
Figure 6. Distribution of aggregated polluting enterprises by county statistics.
Sustainability 17 03518 g006
Figure 7. Spatial distribution of carbonate rocks and mineralization belts, The base map is Figure 1b.
Sustainability 17 03518 g007
Table 1. Sample statistics in southwest China.
ElementMean (mg/kg)Standard Deviation Variation Coefficient (%)SkewnessKurtosisExceeding Rate (%)
Cd1.163.032627.0259.8153.9
Hg0.220.452098.4884.70.65
As26.4837.341413.1611.319.48
Pb58.5166.411143.019.3414.29
Cr97.1363.68662.054.7610.39
Nemerow2.756.992557.4666.854.55
Disclaimer/Publisher’s Note: The statements, opinions and data contained in all publications are solely those of the individual author(s) and contributor(s) and not of MDPI and/or the editor(s). MDPI and/or the editor(s) disclaim responsibility for any injury to people or property resulting from any ideas, methods, instructions or products referred to in the content.

