

Sustainable Stormwater Management: Runoff Impact of Urban Land Layout with Multi-Level Impervious Surface Coverage


Abstract
1. Introduction
2. Materials and Methods
2.1. Extraction and Classification of ISC
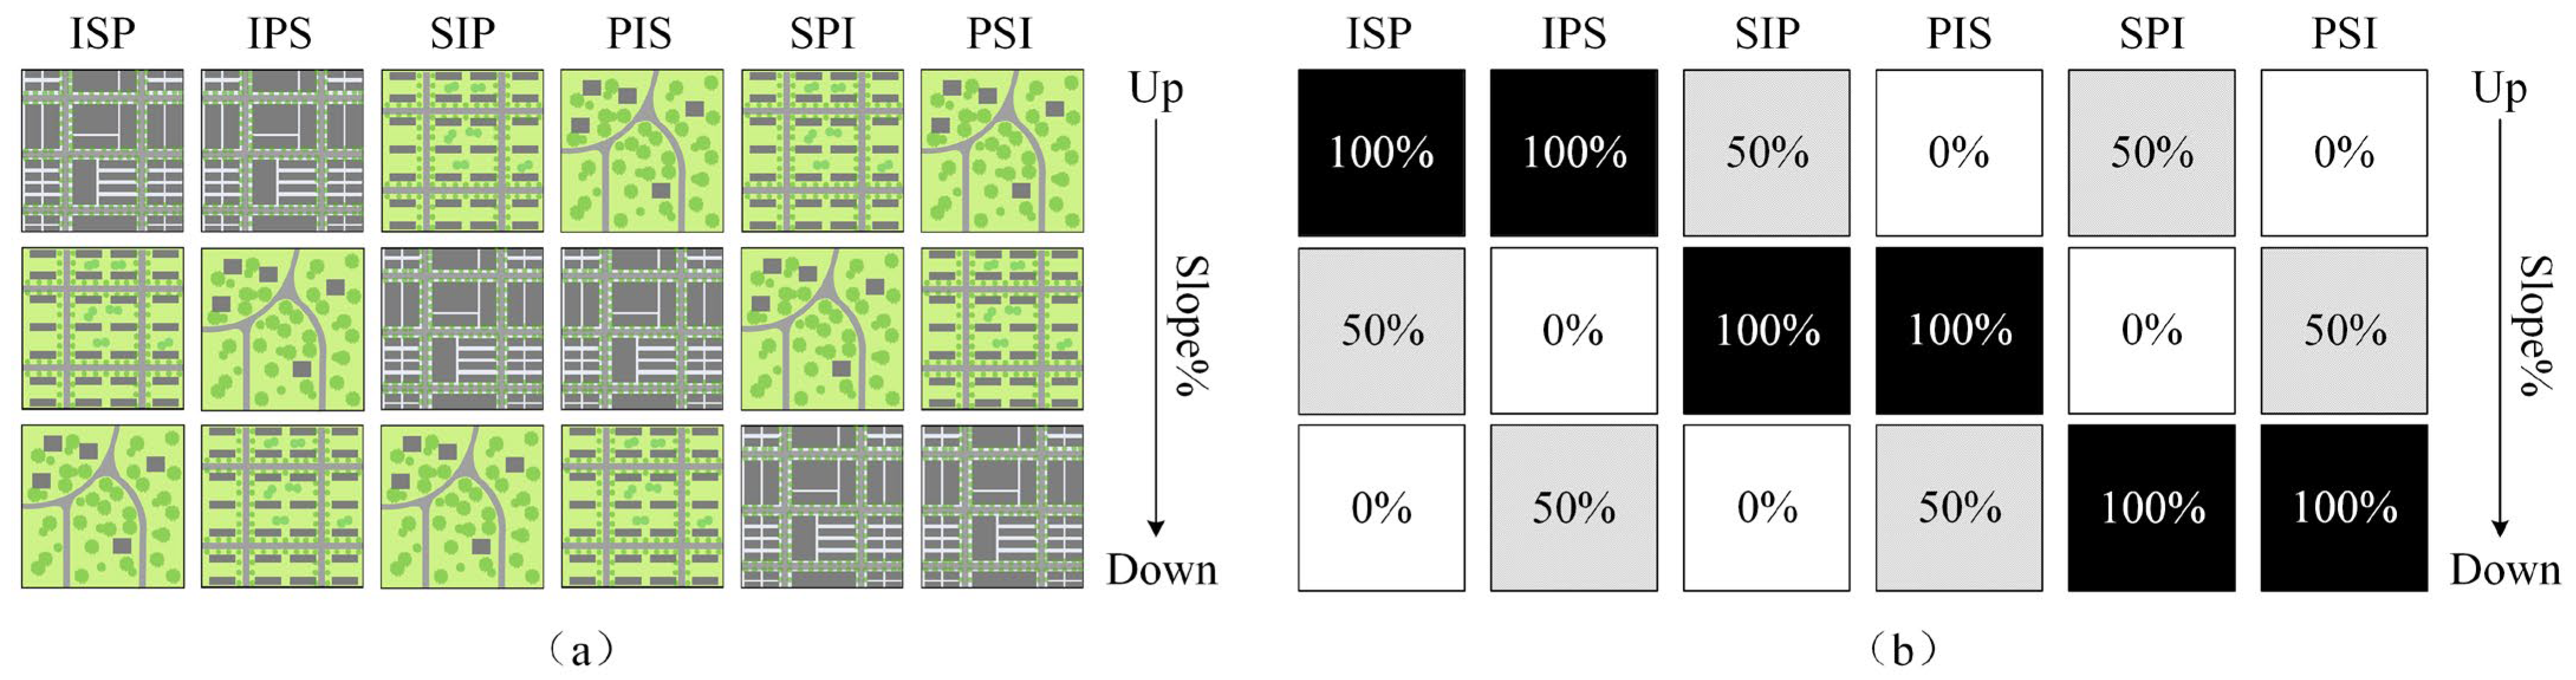
2.2. Land Unit Scale Classification
2.3. Model Construction and Parameter Settings
2.4. Design of Rainfall Scenarios
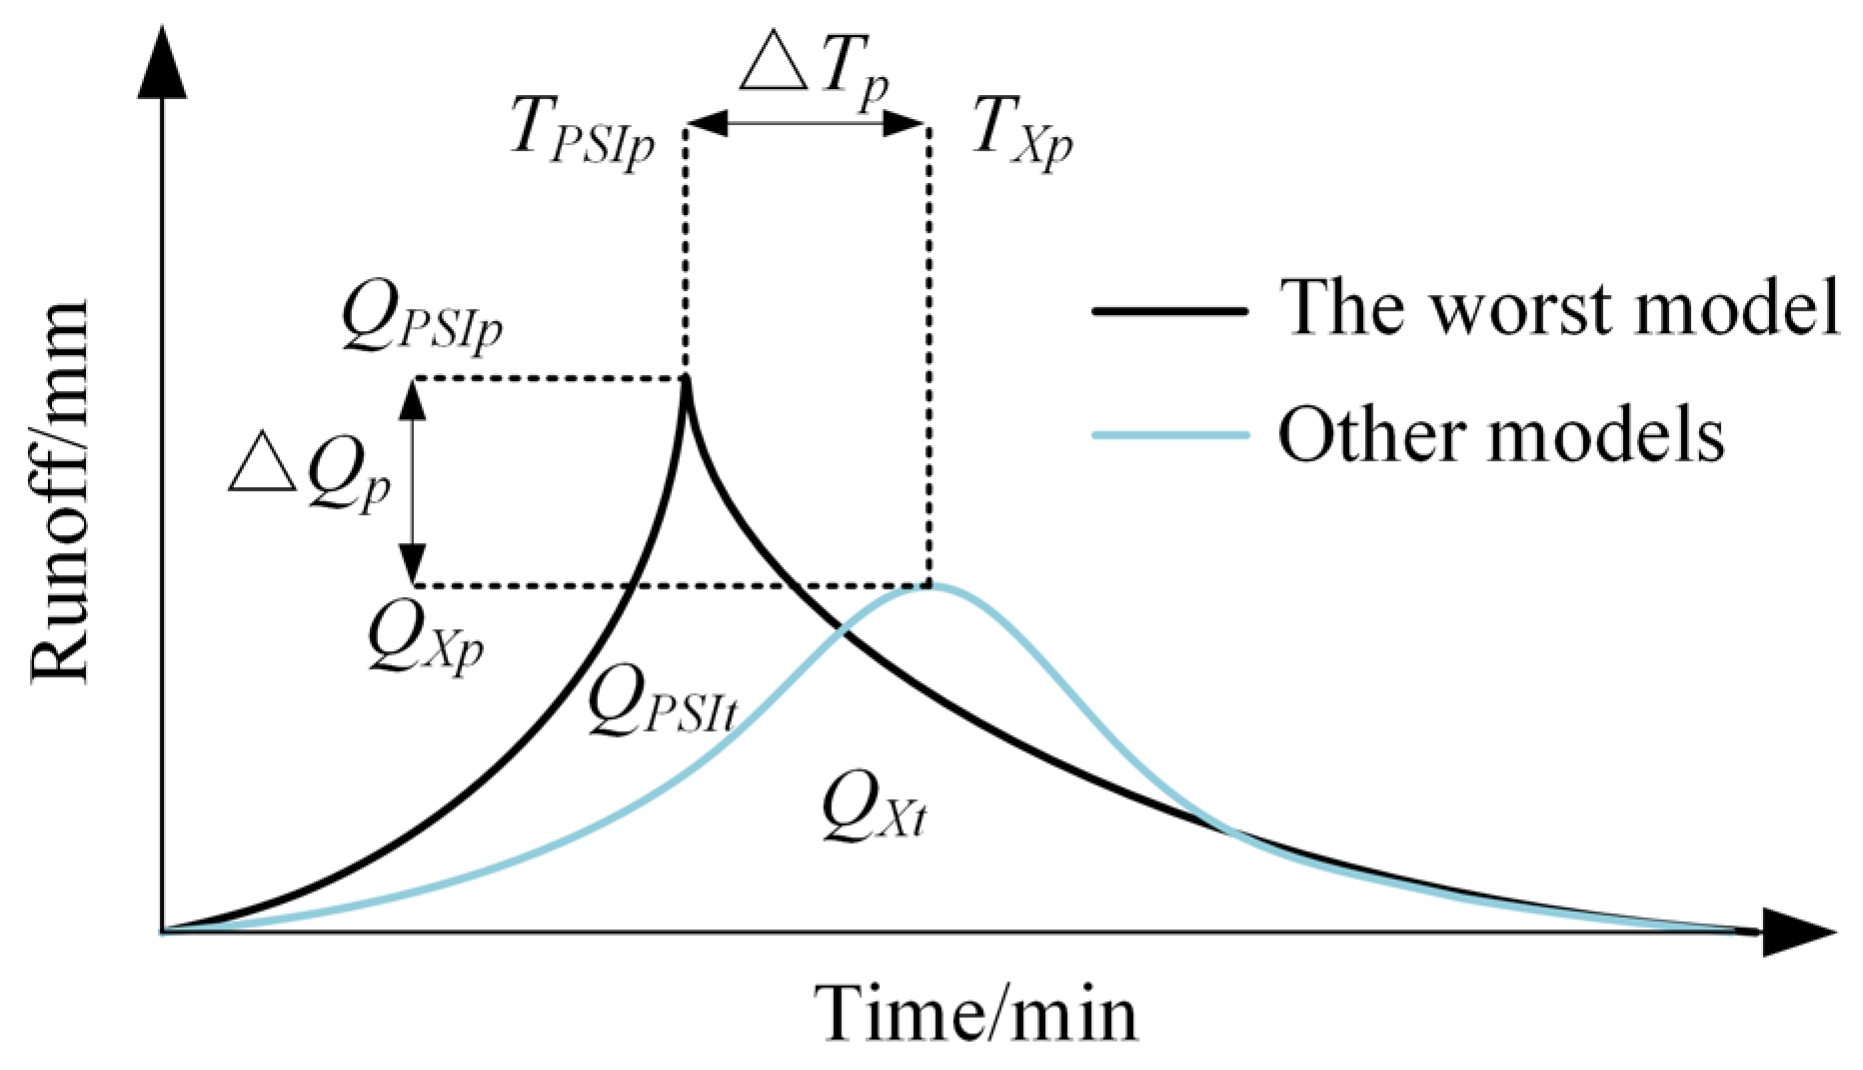
2.5. Data Processing and Analysis
3. Results and Discussion
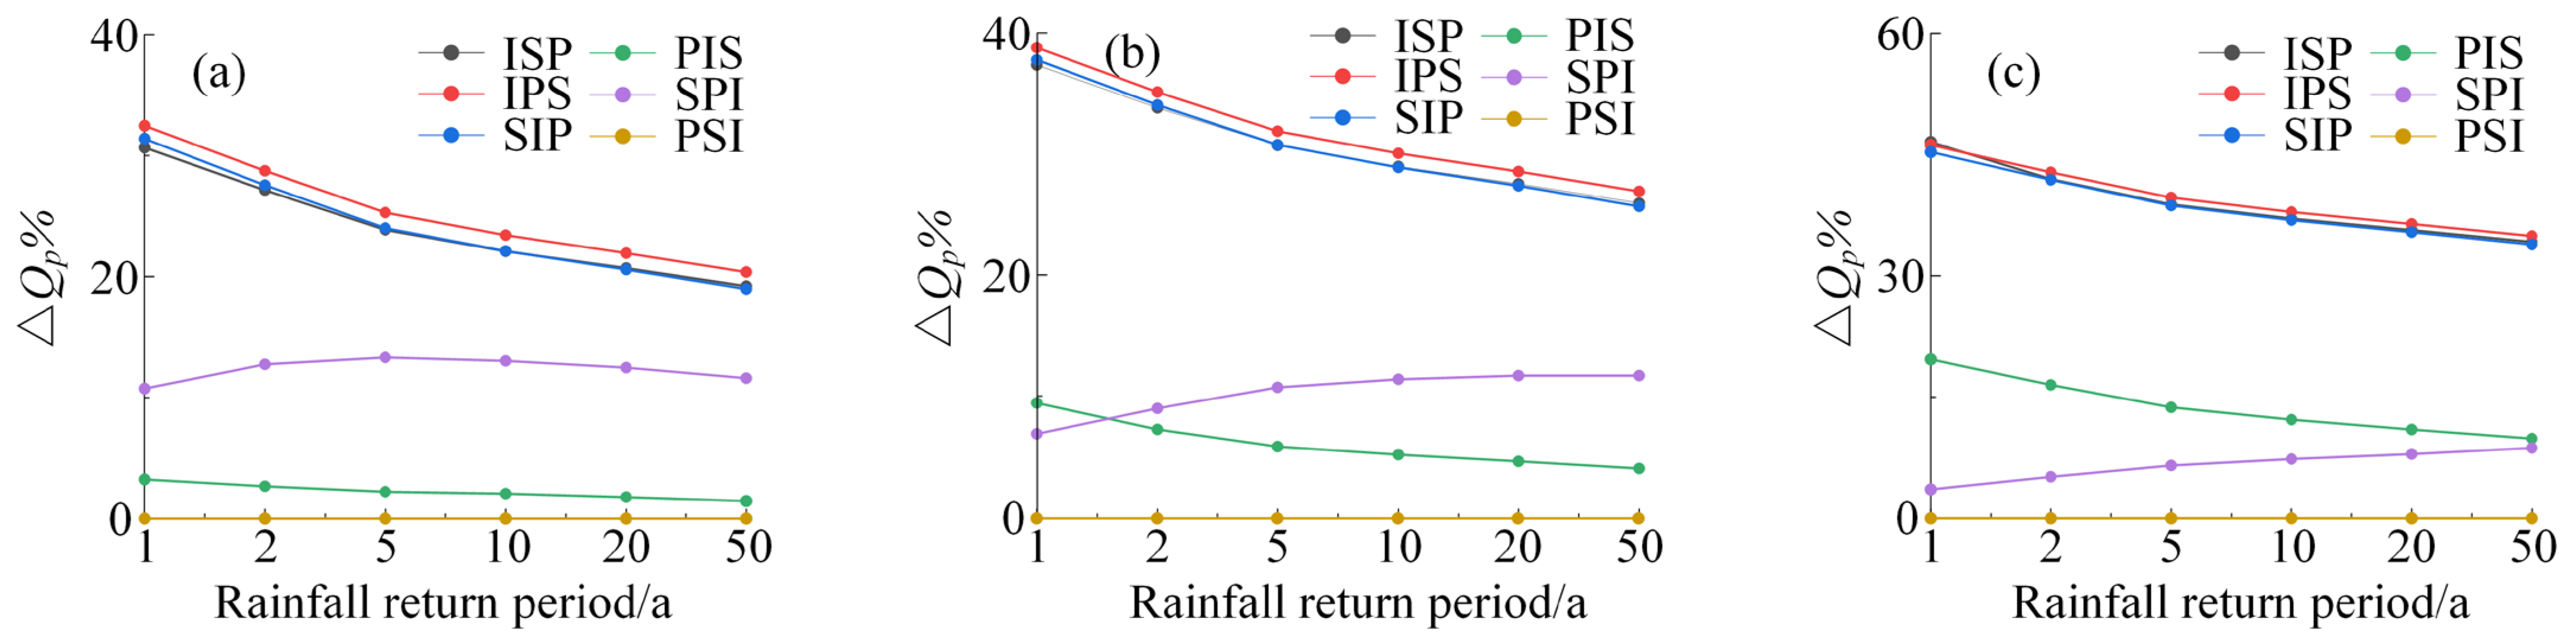
3.1. Peak Flow Reduction Effect
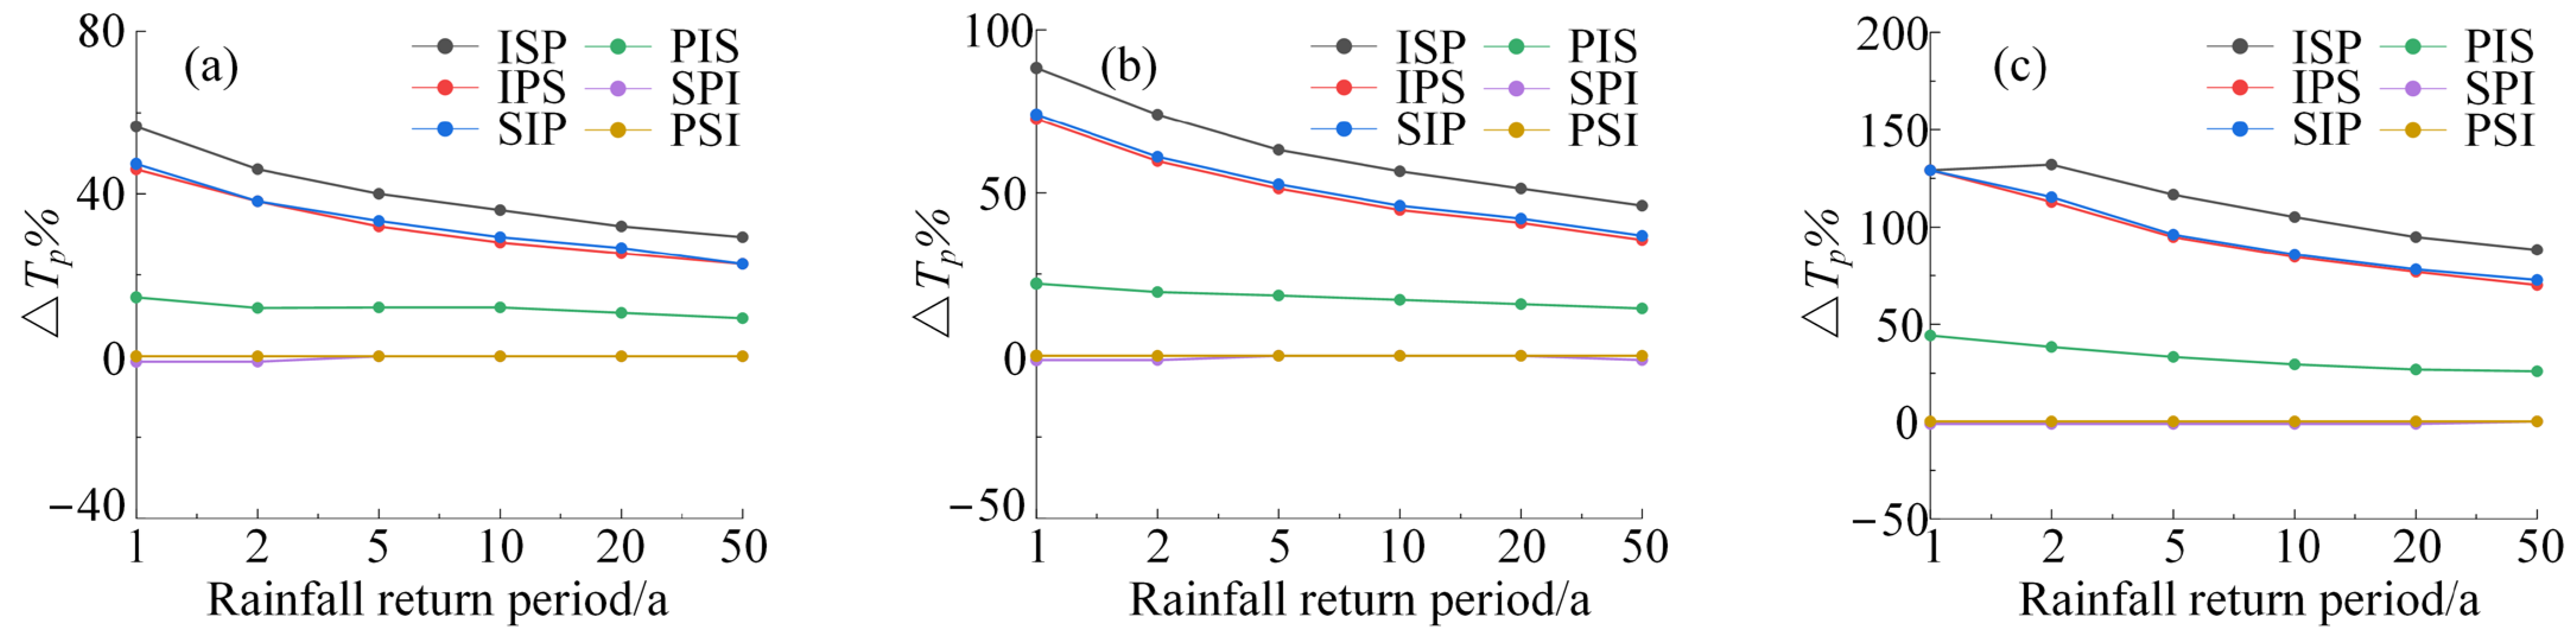
3.2. Peak Time Delay Effect
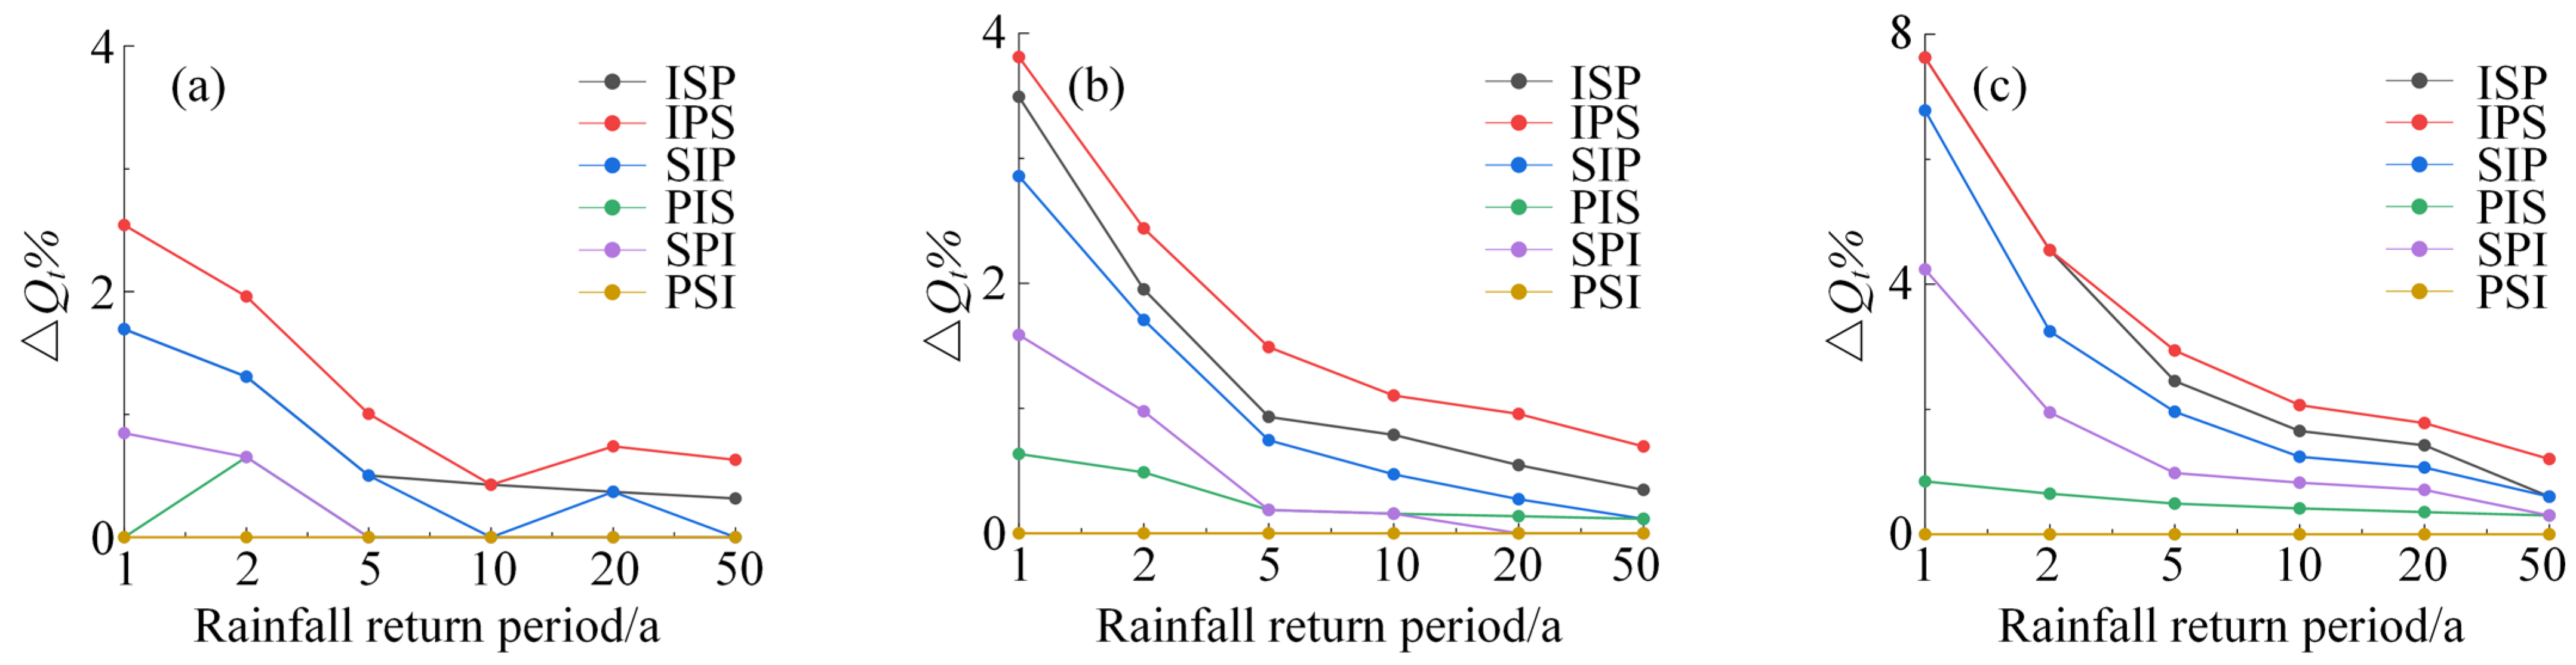
3.3. Total Runoff Reduction Effect
3.4. Runoff Process Optimization Effect Analysis
3.5. Discussion
4. Conclusions
Author Contributions
Funding
Institutional Review Board Statement
Informed Consent Statement
Data Availability Statement
Acknowledgments
Conflicts of Interest
References
- Li, B.; Jiao, S.; Zhou, Y.; Zhou, M. The Causes of Waterlogging in Chinese Southern Hilly Cities Based on Hydrological Processes. Sustainability 2024, 16, 7804. [Google Scholar] [CrossRef]
- Prokesova, R.; Horackova, S.; Snopkova, Z. Surface runoff response to long-term land use changes: Spatial rearrangement of runoff-generating areas reveals a shift in flash flood drivers. Sci. Total Environ. 2022, 815, 51–59. [Google Scholar] [CrossRef] [PubMed]
- Yu, K.; Li, D.; Yuan, H.; Fu, W.; Qiao, Q.; Wang, S. “Sponge City”: Theory and Practice. City Plan. Rev. 2015, 39, 26–36. [Google Scholar]
- Chen, Y.; Zhang, L.; Xu, L.; Zhou, S.; Luo, B.; Ding, K. In-situ investigation on dynamic response of highway transition section with foamed concrete. Earthq. Eng. Eng. Vib. 2025. [CrossRef]
- Ding, X.H.; Luo, B.; Zhou, H.T.; Chen, Y.H. Generalized solutions for advection–dispersion transport equations subject to time-and space-dependent internal and boundary sources. Comput. Geotech. 2025, 178, 106944. [Google Scholar] [CrossRef]
- Mukherjee, S.; Bebremeier, W.; Brigitta, S. An overview of the impacts of land use land cover changes (1980–2014) on urban water security of Kolkata. Land 2018, 7, 91. [Google Scholar] [CrossRef]
- Zhao, J.; Ke, E.; Wang, B.; Zhao, Y. An optimization model for the impervious surface spatial layout considering differences in hydrological unit conditions for urban waterlogging prevention in urban renewal. Ecol. Indic. 2024, 158, 111546. [Google Scholar] [CrossRef]
- Fang, G.; Li, H.; Dong, J.; Teng, H.; Pablo, R.D.A., II; Zhu, Y. Extraction and Spatiotemporal Evolution Analysis of Impervious Surface and Surface Runoff in Main Urban Region of Hefei City, China. Sustainability 2023, 15, 10537. [Google Scholar] [CrossRef]
- Wang, Y.; Zhang, X.; Xu, J.; Pan, G.; Zhao, Y.; Liu, Y.; Liu, H.; Liu, J. Accumulated impacts of imperviousness on surface and subsurface hydrology—Continuous modeling at urban street block scale. J. Hydrol. 2022, 608, 127621. [Google Scholar] [CrossRef]
- Yao, L.; Wei, W.; Chen, L. How does imperviousness impact the urban rainfall-runoff process under various storm cases? Ecol. Indic. 2016, 60, 893–905. [Google Scholar] [CrossRef]
- Hamilton, B.; Coops, N.C.; Lokman, K. Time Series Monitoring of Impervious Surfaces and Runoff Impacts in Metro Vancouver. Sci. Total Environ. 2021, 760, 143873. [Google Scholar] [CrossRef]
- Zhao, C.; Zhang, H.; Wang, H.; Zhao, J. Analysis of changes in the spatiotemporal characteristics of impervious surfaces and their influencing factors in the Central Plains Urban Agglomeration of China from 2000 to 2018. Heliyon 2023, 9, e18849. [Google Scholar] [CrossRef] [PubMed]
- Miller, J.D.; Kim, H.; Kjeldsen, T.R.; Packman, J.; Grebby, S.; Dearden, R. Assessing the impact of urbanization on storm runoff in a peri-urban catchment using historical change in impervious cover. J. Hydrol. 2014, 515, 59–70. [Google Scholar] [CrossRef]
- Mei, C.; Liu, J.; Wang, H.; Wang, J.; Luo, J.; Wang, Z. Comprehensive review on the impact of spatial features of urban underlying surface on runoff processes. Adv. Water Sci. 2021, 32, 791–800. [Google Scholar]
- Zhang, Y.; Hou, J.; Xia, J.; She, D.; Wu, S.; Pan, X. Regulation characteristics of underlying surface on runoff regime metrics and their spatial differences in typical urban communities across China. Sci. Sin. Terrae 2022, 65, 1415–1430. [Google Scholar] [CrossRef]
- Ban, Y.; Kong, F.; Yin, H.; Xu, W.; Du, J.; Xu, J.; Pu, Y. Impacts of land use patterns on the overland flow routing options and simulation outputs of stormwater management models. Acta Ecol. Sin. 2016, 36, 4317–4326. [Google Scholar]
- Ferreira, C.S.S.; Moruzzi, R.; Isidoro, J.M.G.P.; Tudor, M.; Vargas, M.; Ferreira, A.; de Lima, J. Impacts of distinct spatial arrangements of impervious surfaces on runoff and sediment fluxes from laboratory experiments. Anthropocene 2019, 28, 100219. [Google Scholar] [CrossRef]
- Silva, C.d.M.; Silva, G.B.L.d. Cumulative effect of the disconnection of impervious areas within residential lots on runoff generation and temporal patterns in a small urban area. J. Environ. Manag. 2020, 253, 109719. [Google Scholar] [CrossRef]
- Zhou, H.; Liu, J.; Ou, S.; Gao, C.; Zhou, Y.; Shi, L.; Zhou, K. Impact of effective impervious surface disconnection on urban hydrographs: A multi-scenario modeling study at the catchment scale. J. Hydrol. 2024, 630, 130656. [Google Scholar] [CrossRef]
- Mei, C.; Shi, H.; Li, R.; Li, Y.; Liu, J.; Luan, Q.; Wang, H.; Wang, J. Response Analysis of Rainfall Runoff Process to Spatial Distribution of Impervious Area Based on Numerical Experiments. Water Resour. Prot. 2024, 40, 86–92. [Google Scholar]
- Shuster, W.D.; Bonta, J.; Thurston, H.; Warnemuende, E.; Smith, D.R. Impacts of impervious surface on watershed hydrology: A review. Urban Water J. 2005, 2, 263–275. [Google Scholar] [CrossRef]
- Zhou, L.; Shen, G.; Li, C.; Chen, T.; Li, S.; Brown, R. Impacts of land covers on stormwater runoff and urban development: A land use and parcel based regression approach. Land Use Policy 2021, 103, 105280. [Google Scholar] [CrossRef]
- Liu, J.; Shi, H.; Mei, C.; Wang, H.; Song, T.; Luan, Q. Effect of urban subsurface spatial pattern on community-scale flooding processes via numerical simulation. Adv. Water Sci. 2022, 33, 881–893. [Google Scholar]
- Ma, C.; Wen, C. Is coastal urban environment for disaster prevention equitable? Assessing climate justice of shelters in Xiamen, China. Ocean Coast. Manag. 2025, 261, 107546. [Google Scholar] [CrossRef]
- Kim, H.W.; Li, M.H. Sustainable Stormwater Management: Examining the Role of Local Planning Capacity in Mitigating Peak Surface Runoff. Sustainability 2016, 8, 763. [Google Scholar] [CrossRef]
- Li, Q.; Huang, H.; Zhang, J. Study on urban impervious surface restricted by regulatory detailed planning: A case study of typical blocks in Beijing. Urban Dev. Stud. 2019, 26, 1–6. [Google Scholar]
- Yan, W.; Zou, J. Ecological Land Use Planning Towards Water Environment Protection at Urban Watershed: Ecological Practice Approaches, Spatial Planning Strategies and Development Transect Models. Urban Plan. Int. 2019, 34, 45–55. [Google Scholar] [CrossRef]
- Yang, G.; Bowling, L.C.; Cherkauer, K.A.; Pijanowski, B.C. The Impact of Urban Development on Hydrologic Regime from Catchment to Basin Scales. Landsc. Urban Plan. 2011, 103, 237–247. [Google Scholar] [CrossRef]
- Zhuang, Q.; Li, M.; Lu, Z. Assessing Runoff Control of Low Impact Development in Hong Kong’s Dense Community with Reliable SWMM Setup and Calibration. J. Environ. Manag. 2023, 345, 118599. [Google Scholar] [CrossRef]
- Ouyang, W.; Guo, B.; Hao, F.; Huang, H.; Li, J.; Gong, Y. Modeling Urban Storm Rainfall Runoff from Diverse Underlying Surfaces and Application for Control Design in Beijing. J. Environ. Manag. 2012, 113, 467–473. [Google Scholar] [CrossRef]
- Ding, S.; Zeng, J. Waterlogging Prevention and Control Scheme in Waterfront Area Based on SWMM Model—A Case Study of Xinglin Bay in Xiamen. Chin. Landsc. Archit. 2020, 36, 70–75. [Google Scholar]
- Zhou, H.; Lin, M.; Chen, J. Simulation and Benefit Evaluation of Urban Rain Flood Model Based on GIS and SWMM: A Case Study of Maluan Bay Area in Amoy. Mod. Urban Res. 2020, 12, 112–119. [Google Scholar]


| Land Use | Green | Educational | Residential | Industrial | Commercial | ||||||||||
|---|---|---|---|---|---|---|---|---|---|---|---|---|---|---|---|
| Land unit number | 1 | 2 | 3 | 4 | 5 | 6 | 7 | 8 | 9 | 10 | 11 | 12 | 13 | 14 | 15 |
| ISC (%) | 0 | 9 | 20 | 36 | 40 | 53 | 44 | 51 | 62 | 81 | 82 | 86 | 87 | 92 | 96 |
| ISC classification | 0% (P) | 50% (S) | 100% (I) | ||||||||||||
| Representative land unit image | 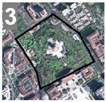 |  | 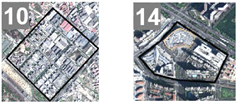 | ||||||||||||
| Land unit diagram |  |  | 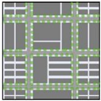 | ||||||||||||
| Parameters | Value | Units |
|---|---|---|
| %Slope | 2 | % |
| N-Imperv (Manning’s N for impervious area) | 0.01 | - |
| N-Perv (Manning’s N for pervious area) | 0.2 | - |
| %Zero-Imperv | 0 | % |
| Subarea Routing | Pervious | - |
| Percent Routed | 100 | % |
| Max. Infil. Rate | 89.3 | mm/h |
| Min. Infil. Rate | 2.5 | mm/h |
| Decay Constant | 8.1 | 1/h |
| Rainfall Return Periods (P) | ||||||
|---|---|---|---|---|---|---|
| 1 a | 2 a | 5 a | 10 a | 20 a | 50 a | |
| Rainfall intensity/(mm/min) | 2.52 | 3.06 | 3.77 | 4.32 | 4.86 | 5.58 |
| Rainfall accumulations/(mm) | 61.74 | 75.05 | 92.64 | 105.95 | 119.26 | 136.85 |
| Scale | 300 m × 300 m | 500 m × 500 m | 1000 m × 1000 m | |||||||||||||||
|---|---|---|---|---|---|---|---|---|---|---|---|---|---|---|---|---|---|---|
| P | 1 a | 2 a | 5 a | 10 a | 20 a | 50 a | 1 a | 2 a | 5 a | 10 a | 20 a | 50 a | 1 a | 2 a | 5 a | 10 a | 20 a | 50 a |
| ISP | 1.54 | 2.13 | 2.98 | 3.67 | 4.38 | 5.36 | 3.22 | 4.44 | 6.22 | 7.67 | 9.19 | 11.30 | 8.52 | 12.02 | 16.81 | 20.71 | 24.82 | 30.56 |
| IPS | 1.50 | 2.09 | 2.93 | 3.60 | 4.31 | 5.29 | 3.14 | 4.36 | 6.12 | 7.55 | 9.06 | 11.15 | 8.58 | 11.84 | 16.58 | 20.44 | 24.52 | 30.22 |
| SIP | 1.53 | 2.12 | 2.98 | 3.67 | 4.39 | 5.38 | 3.20 | 4.43 | 6.22 | 7.67 | 9.21 | 11.34 | 8.72 | 12.03 | 16.84 | 20.77 | 24.92 | 30.71 |
| PIS | 2.15 | 2.85 | 3.83 | 4.61 | 5.42 | 6.54 | 4.65 | 6.23 | 8.46 | 10.24 | 12.10 | 14.65 | 12.81 | 17.28 | 23.71 | 28.89 | 34.33 | 41.85 |
| SPI | 1.99 | 2.55 | 3.39 | 4.09 | 4.83 | 5.87 | 4.79 | 6.11 | 8.02 | 9.57 | 11.20 | 13.47 | 15.37 | 19.64 | 25.68 | 30.50 | 35.50 | 42.39 |
| PSI | 2.22 | 2.93 | 3.92 | 4.71 | 5.52 | 6.64 | 5.15 | 6.73 | 8.99 | 10.81 | 12.69 | 15.28 | 15.94 | 20.70 | 27.48 | 32.91 | 38.56 | 46.43 |
| Scale | 300 m × 300 m | 500 m × 500 m | 1000 m × 1000 m | |||||||||||||||
|---|---|---|---|---|---|---|---|---|---|---|---|---|---|---|---|---|---|---|
| P | 1 a | 2 a | 5 a | 10 a | 20 a | 50 a | 1 a | 2 a | 5 a | 10 a | 20 a | 50 a | 1 a | 2 a | 5 a | 10 a | 20 a | 50 a |
| ISP | 119 | 111 | 105 | 102 | 99 | 97 | 145 | 134 | 124 | 119 | 115 | 111 | 181 | 181 | 169 | 160 | 152 | 145 |
| IPS | 111 | 105 | 99 | 96 | 94 | 92 | 133 | 123 | 115 | 110 | 107 | 103 | 181 | 166 | 152 | 144 | 138 | 131 |
| SIP | 112 | 105 | 100 | 97 | 95 | 92 | 134 | 124 | 116 | 111 | 108 | 104 | 181 | 168 | 153 | 145 | 139 | 133 |
| PIS | 87 | 85 | 84 | 84 | 83 | 82 | 94 | 92 | 90 | 89 | 88 | 87 | 114 | 108 | 104 | 101 | 99 | 97 |
| SPI | 75 | 75 | 75 | 75 | 75 | 75 | 76 | 76 | 76 | 76 | 76 | 75 | 78 | 77 | 77 | 77 | 77 | 77 |
| PSI | 76 | 76 | 75 | 75 | 75 | 75 | 77 | 77 | 76 | 76 | 76 | 76 | 79 | 78 | 78 | 78 | 78 | 77 |
| Scale | 300 m × 300 m | 500 m × 500 m | 1000 m × 1000 m | |||||||||||||||
|---|---|---|---|---|---|---|---|---|---|---|---|---|---|---|---|---|---|---|
| P | 1 a | 2 a | 5 a | 10 a | 20 a | 50 a | 1 a | 2 a | 5 a | 10 a | 20 a | 50 a | 1 a | 2 a | 5 a | 10 a | 20 a | 50 a |
| ISP | 11.6 | 15.1 | 19.8 | 23.3 | 26.9 | 31.6 | 30.4 | 40.2 | 53.2 | 63.0 | 72.9 | 86.0 | 109.0 | 147.0 | 199.0 | 238.0 | 277.0 | 330.0 |
| IPS | 11.5 | 15.0 | 19.7 | 23.3 | 26.8 | 31.5 | 30.3 | 40.0 | 52.9 | 62.8 | 72.6 | 85.7 | 109.0 | 147.0 | 198.0 | 237.0 | 276.0 | 328.0 |
| SIP | 11.6 | 15.1 | 19.8 | 23.4 | 26.9 | 31.7 | 30.6 | 40.3 | 53.3 | 63.2 | 73.1 | 86.2 | 110.0 | 149.0 | 200.0 | 239.0 | 278.0 | 330.0 |
| PIS | 11.8 | 15.2 | 19.9 | 23.4 | 27.0 | 31.7 | 31.3 | 40.8 | 53.6 | 63.4 | 73.2 | 86.2 | 117.0 | 153.0 | 203.0 | 241.0 | 280.0 | 331.0 |
| SPI | 11.7 | 15.2 | 19.9 | 23.4 | 27.0 | 31.7 | 31.0 | 40.6 | 53.6 | 63.4 | 73.3 | 86.3 | 113.0 | 151.0 | 202.0 | 240.0 | 279.0 | 331.0 |
| PSI | 11.8 | 15.3 | 19.9 | 23.4 | 27.0 | 31.7 | 31.5 | 41.0 | 53.7 | 63.5 | 73.3 | 86.3 | 118.0 | 154.0 | 204.0 | 242.0 | 281.0 | 332.0 |
Disclaimer/Publisher’s Note: The statements, opinions and data contained in all publications are solely those of the individual author(s) and contributor(s) and not of MDPI and/or the editor(s). MDPI and/or the editor(s) disclaim responsibility for any injury to people or property resulting from any ideas, methods, instructions or products referred to in the content. |
© 2025 by the authors. Licensee MDPI, Basel, Switzerland. This article is an open access article distributed under the terms and conditions of the Creative Commons Attribution (CC BY) license (https://creativecommons.org/licenses/by/4.0/).
Share and Cite
Yin, Z.; Liu, G.; Zheng, Z.; Li, X. Sustainable Stormwater Management: Runoff Impact of Urban Land Layout with Multi-Level Impervious Surface Coverage. Sustainability 2025, 17, 3511. https://doi.org/10.3390/su17083511
Yin Z, Liu G, Zheng Z, Li X. Sustainable Stormwater Management: Runoff Impact of Urban Land Layout with Multi-Level Impervious Surface Coverage. Sustainability. 2025; 17(8):3511. https://doi.org/10.3390/su17083511
Chicago/Turabian StyleYin, Zheng, Gong Liu, Zhi Zheng, and Xinru Li. 2025. "Sustainable Stormwater Management: Runoff Impact of Urban Land Layout with Multi-Level Impervious Surface Coverage" Sustainability 17, no. 8: 3511. https://doi.org/10.3390/su17083511
APA StyleYin, Z., Liu, G., Zheng, Z., & Li, X. (2025). Sustainable Stormwater Management: Runoff Impact of Urban Land Layout with Multi-Level Impervious Surface Coverage. Sustainability, 17(8), 3511. https://doi.org/10.3390/su17083511