Article

The Impact of Economic Indicators on Renewable Energy Consumption in Southern Africa: Evidence from Residual Augmented Least Squares Cointegration and Method of Moments Quantile Regression Models

Department of Economics, Near East University, Nicosia 99138, Cyprus
*
Author to whom correspondence should be addressed.
Sustainability 2025, 17(8), 3496; https://doi.org/10.3390/su17083496
Submission received: 21 February 2025 / Revised: 3 April 2025 / Accepted: 8 April 2025 / Published: 14 April 2025
(This article belongs to the Special Issue Sustainable Energy: The Path to a Low-Carbon Economy)

Abstract

:
Renewable energy has emerged as a transformative and essential alternative in the global energy sector. Many countries are striving to achieve the Sustainable Development Goals (SDGs) established by the United Nations for 2030, particularly the goal of ensuring that all individuals have access to clean and affordable energy. This paper re-examines the impact of economic growth (EG), trade openness (TO), exchange rates (ER), foreign direct investment (FDI), green finance (GF), and oil prices (OL) on renewable energy consumption (REC) across 14 Southern African countries: South Africa, Botswana, Lesotho, Namibia, Tanzania, Madagascar, Mauritius, Kenya, the Comoros, Zambia, Eswatini, Rwanda, Angola, and Mozambique, during the period of 2000 to 2022. This study employed cointegration and unit root tests, as well as the RALS-EG and MMQR models, to estimate the long-run relationships among the variables. The results reveal that renewable energy consumption is positively and directly related to economic growth, trade openness, exchange rates, green finance, and foreign direct investment across all quantiles (q05–q95), with no evidence of asymmetric effects. These findings suggest that economic growth, green finance, and foreign direct investment are crucial for fostering renewable energy innovation in Southern African countries. Policymakers are encouraged to prioritize strategies that enhance these factors as a foundation for achieving sustainable energy solutions.

1. Introduction

The world is currently facing energy poverty, a significant issue that has garnered the attention of numerous academics, economists, governments, and environmentalists [1]. To address this challenge, many countries have relied on traditional energy sources such as coal, oil, and gas. However, the shift towards clean energy is essential for reducing environmental concerns [2]. Therefore, to set the world on a path toward achieving net-zero emissions, nations must implement and promote strategies that accelerate the transition from traditional to modern energy sources. It is crucial to adopt a carbon-free mode of production [3].
Renewable energy (RE) plays a vital role in this energy transition, as the development of the RE sector is critical for sustainable energy supply and consumption [4]. RE encompasses non-fossil fuel sources generated through innovative technologies, including hydroelectricity, solar, wind, hydrogen, and ocean energy [5,6,7]. Countries have devised strategies to transition from traditional to modern energy sources. However, despite the economic and sustainability benefits of energy evolution, this transition will not occur spontaneously [8]. Policymakers must act decisively to replace the existing energy framework with a more sustainable one. Wealthy economies are leading the change toward a more sustainable economic future by transforming their energy infrastructure. Developing nations are also participating in this initiative, but they are progressing slowly and laboriously through the energy transition. This sluggish pace is not surprising given the accessibility of traditional energy resources and budgetary constraints. The exacerbating RE investments have given rise to the green finance market (GFM) and thereby positively affect the environmental quality of society [9]. Despite all the benefits that RE offers, the authors of [10] argue that RE may be the cause of an increase in security risk and geopolitical conflicts.
The demand for renewable energy consumption (REC) in Southern Africa has surged, prompting countries in the region to enhance their renewable energy production capacity. According to Africa’s Development Dynamics 2030 report on investing in sustainable development, the Southern African region accounts for 60% of Africa’s installed solar energy capacity. As of 2021, it boasted 21.4 GW of the installed renewable electricity capacity, reflecting a 37% increase since 2017. South Africa is at the forefront of the energy transition in the region, making substantial investments in wind, green hydrogen, and solar energy. Other countries, such as Mozambique and Zambia, are expanding their hydropower generation capabilities, while Angola and Botswana are improving solar energy access for their populations. Namibia is also allocating more funds toward investments in wind, green hydrogen, and solar energy. The region is projected to increase its capacity to 908 GW in solar energy and 53 GW in wind energy by 2022 (IRENA). This indicates that the region possesses significant potential to expand its renewable energy production. However, the primary challenge facing these countries is a lack of investment in renewable energy technologies. Additionally, some of their power station equipment is outdated, which has contributed to a decline in REC and public disapproval.
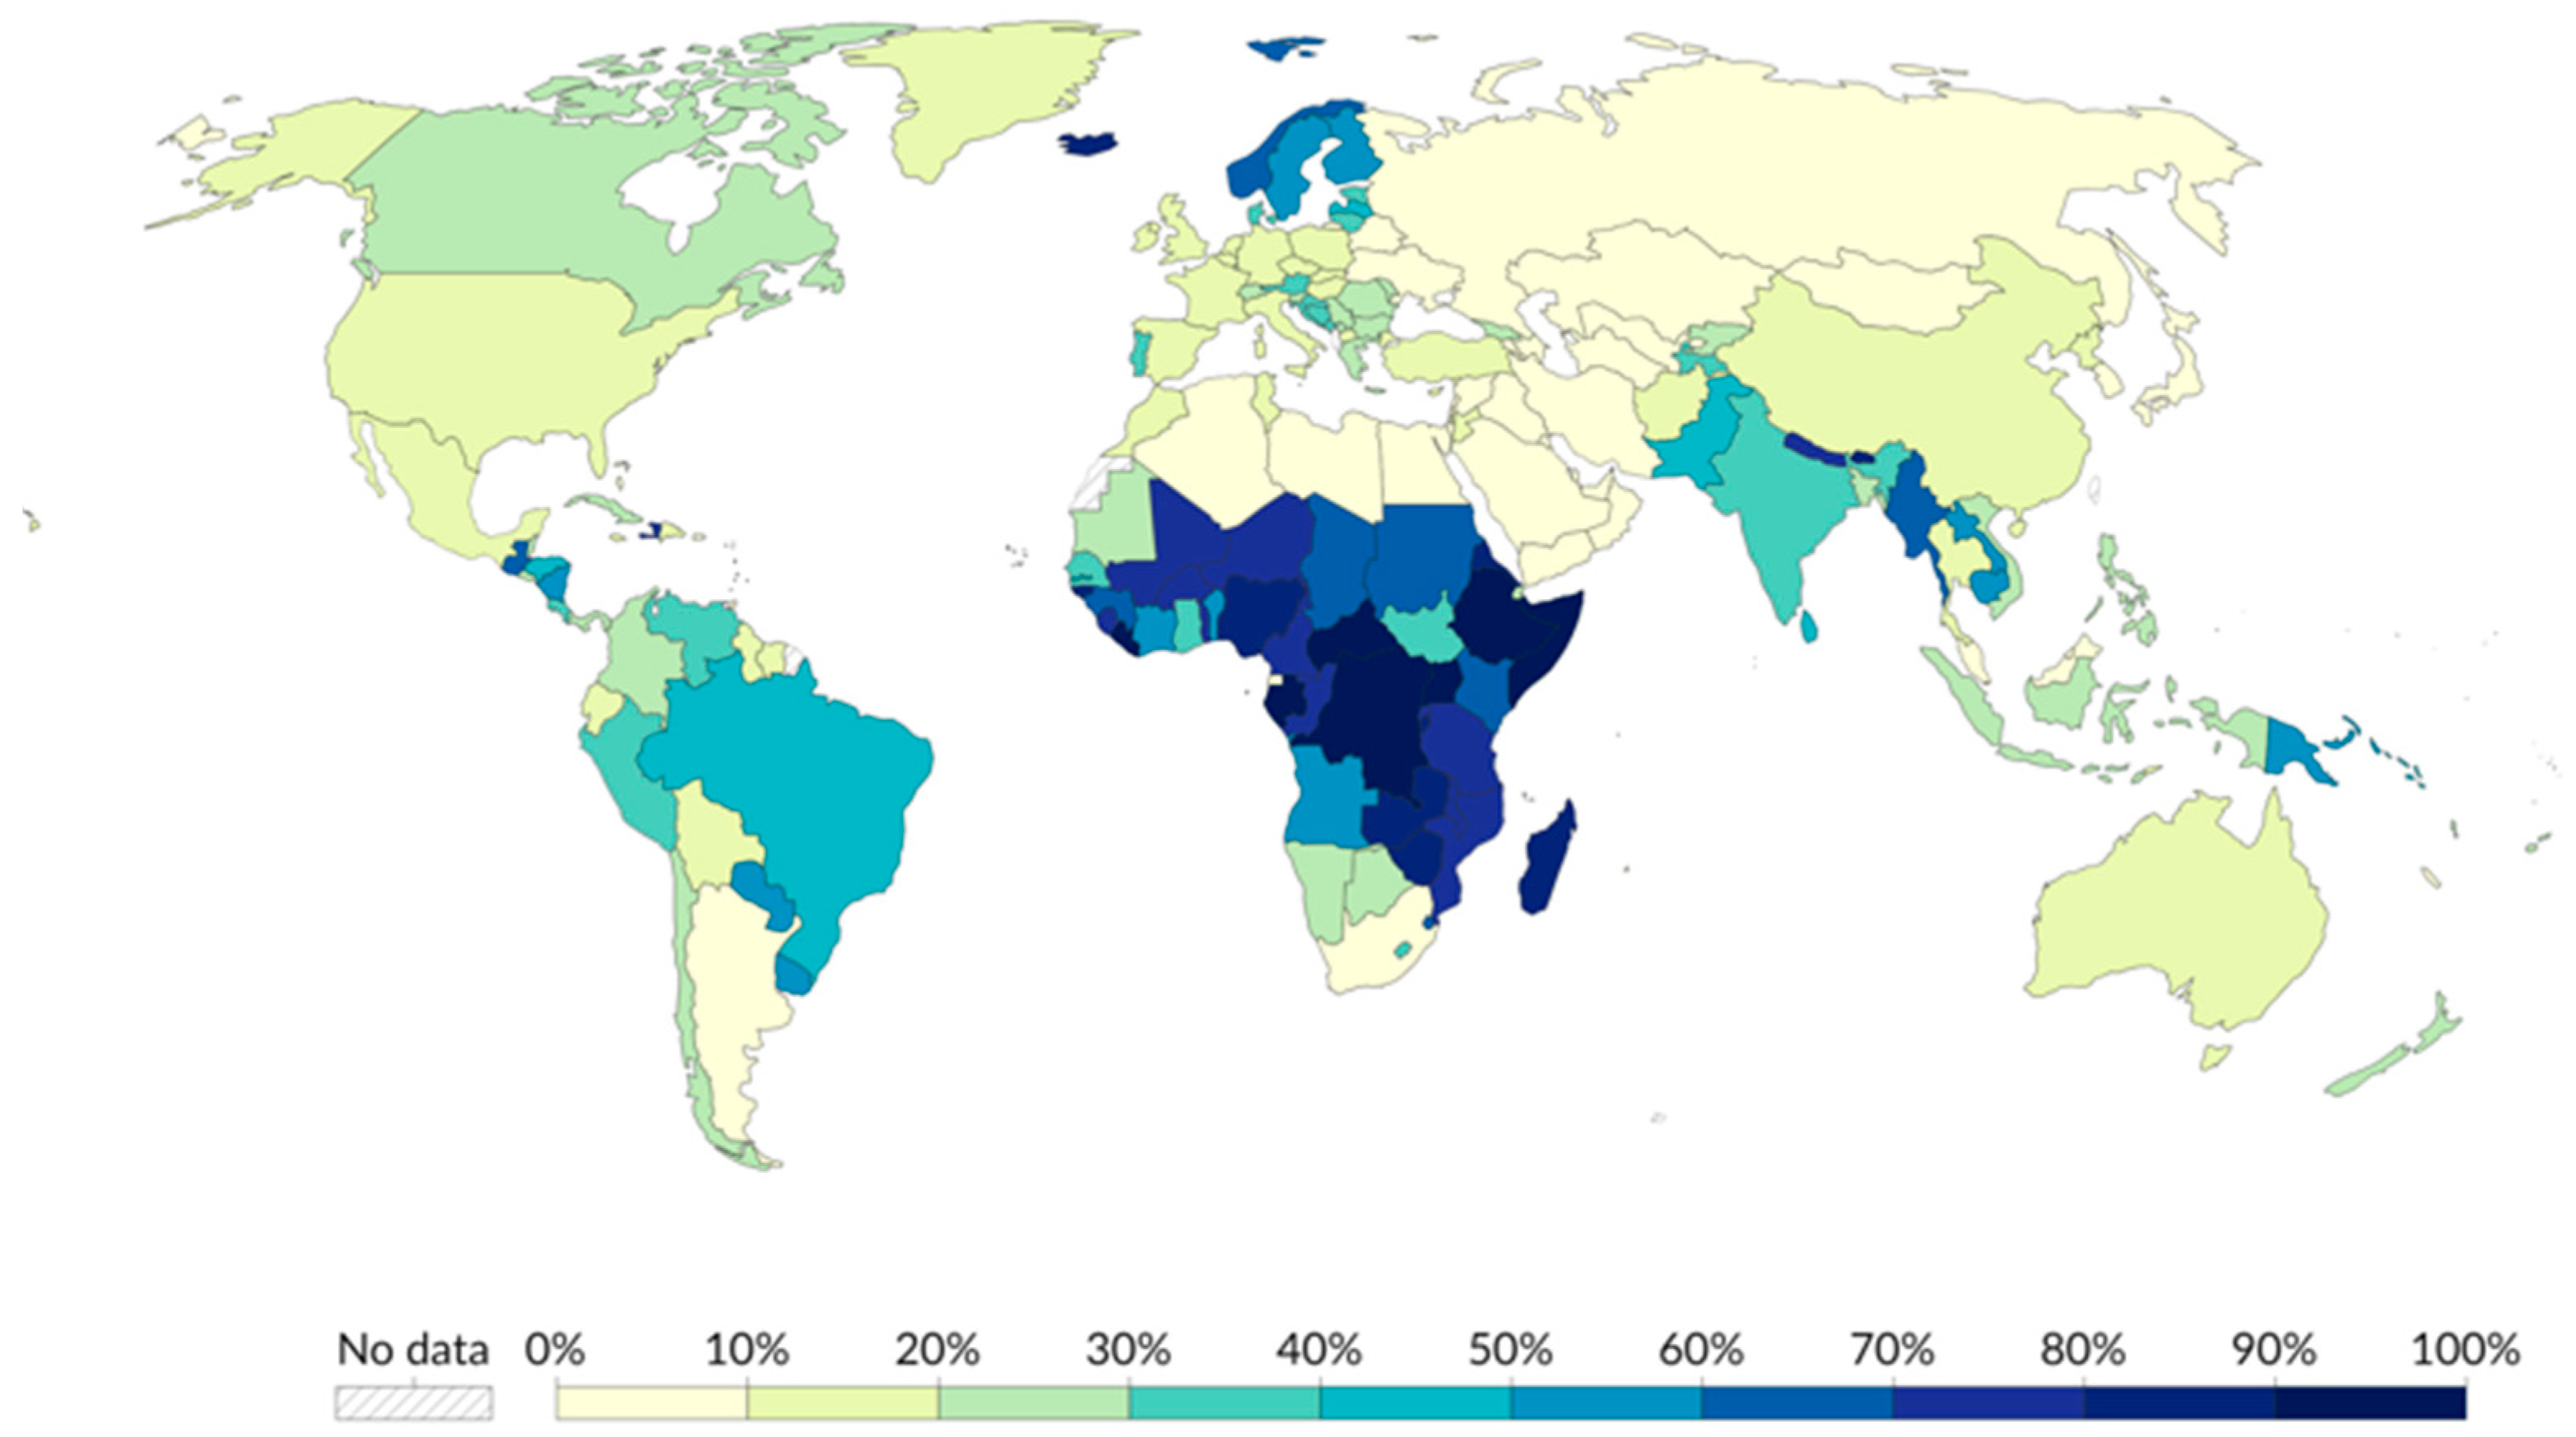
The Figure 1 below illustrates the share of final energy use from renewable sources in various countries for the year 2021. The data include contributions from solar, wind, geothermal, hydropower, bioenergy, and marine energy sources. Most sub-Saharan African countries, along with a few South American and Asian nations, are represented with darker shading, indicating a reliance on renewable energy of 50% or more. This is often attributed to the use of traditional bioenergy and hydropower. In contrast, industrialized countries in North America, Europe, and parts of the Middle East typically exhibit lighter shades, reflecting a lower share of renewable energy use, ranging from 0% to 20%. This is likely due to their dependence on fossil fuels and nuclear energy.
This paper adds to the literature by analyzing the impact of economic development and other macroeconomic factors on renewable energy consumption in 14 Southern African countries. It uses data from 2000 to 2022. The main research gap identified in this research is that little research has been conducted on this topic. Many scholars have focused on the influence of renewable energy consumption on economic growth. Many scholars believe that energy has the ability to sustain an economy as it enables the functionality of all service sectors. The region was selected because of its peculiar economic structure and the plethora of untapped natural resources that have great potential for REC. In spite of all these resources, countries in the region face a chronic lack of investment in renewable energy infrastructure. This paper is organized as follows: Section 2 reviews the literature and analyzes the determinants of REC; Section 3 describes the data and methodology used in the estimation; Section 4 presents the results obtained from the RALS-EG and MMQR models, and discusses the findings in detail; and Section 5 concludes with policy recommendations and suggestions for future research. The results further emphasize that among Southern African countries, economic development is very crucial for the betterment of REC. There is also a two-way relationship in that, as highlighted by the report on Energy in Southern Africa, improved REC contributes to economic growth in the region.

2. Literature Review

The study of the relationship between economic growth (EG) and RE has captivated many scholars and environmental economists. There are a few studies that have been conducted on the impact of economic development on RE. In Organization for Economic Co-operation and Development (OECD) nations, RE has a significant influence on EG [11]. This reviews that OECD nations should advocate for the use of sustainable energy sources as it is a catalyst that encourages the EG of these nations. Ref. [12] postulates that RE in Europe is said to promote EG, thereby resulting in a reduction in global warming. Nations should invest more in renewable energy resources that improve their environment while enhancing the EG of nations. Ref. [13] postulates that a correlation exists between RE and EG, using the asymmetric causality test approach and the auto regressive distributive lag (ARDL).

2.1. Economic Growth and Renewable Energy Production

Several scholars have postulated that renewable energy consumption (REC) positively impacts EG [7,14,15,16,17]. This implies that renewable energy boosts economic growth. A few scholars have focused on the impact of economic growth on renewable energy production. Among the many researchers that have carried out research on this topic, some focused on the growth hypothesis and postulated that there is a significant impact between energy consumption and growth output. Thus, any transposition in energy consumption or policy will significantly affect economic growth. The empirical results pose a strong correlation between renewable energy consumption and economic growth. REC is important for EG; correspondingly, EG promotes the utilization of renewable energy sources [18]. On the effect of renewable energy on EG, ref. [19] carried out a study in Brazil through employing the cointegration test and found that there is a casual relationship between real GDP and the four kinds of energy consumption: non-hydroelectric renewable energy consumption (NHREC), total renewable energy consumption (TREC), non-renewable consumption (NREC), and the total primary energy consumption (TEC). Ref. [19] observed that there is a long-run equilibrium among Brazil’s real GDP, labor, capital, and each of the four types of consumption. The findings postulated that Brazil is an energy-independent economy and that EG is vital in providing the essential resources for sustainable development. Enhancing RE not only promotes Brazil’s EG and deters the destruction of the environment but also creates opportunities for leadership roles in the international system. Ref. [20] concurs that RE, labor, and capital significantly promote EG.
However, other researchers do not concur with the view that RE boosts EG. Ref. [21] state that RE in OECD countries does not strongly impact EG. This may be due to the fact that RE is costly in the short run compared to the long run [22]. Some countries still depend on NRE to promote EG [23]. The empirical findings of Ref. [24] postulated that economic growth negatively impacts RE. Ref. [25] postulated that in the SR, renewable electricity consumption (REC) has a negative effect on EG. The LR REC has a negative impact on EG for South Africa and is insignificant in Zimbabwe. The governments of these countries should revise their energy policies in order to positively affect their economy.

2.2. Exchange Rate (ER) and Renewable Energy Consumption (REC)

The recent literature has explored the interrelated causal relationship of the exchange rate (ER) with renewable energy consumption and other determinants. Among the findings, it is observed that tourism demand and REC are positively related to each other, while the volatility of the exchange rate significantly negatively affects the latter in China [26]. A comparative analysis has also been made regarding emerging economies, indicating that the GDP, the balance of payments, the real interest rate, and renewable energy consumption, in general, give rise to the appreciation of the ER, and this depreciation occurs due to inflation factors [18]. This energy transition factor does differ in the case of the main exchange rate. While USD/EUR and USD/JPY appear insensitive, USD/CNY showed sensitivity regarding energy consumption, REC, and carbon dioxide (CO2) emissions from various sector sources [27]. These results suggest the need to include the energy transition factor in the exchange rate policy and encourage the use of renewable energy for possible economic benefits.

2.3. Green Finance (GF) and Renewable Energy Consumption (REC)

Green finance (GF) encourages RE production [28,29]. Much research has been conducted in support of GF influencing RE. This is because GF fosters scientific investigation and innovation, openness, and economic growth. Given the large investments needed for renewable energy projects, GF is influential in financing these initiatives [30]. The research on RE resource investment and greenhouses in China in the post-COVID-19 era postulates that green finance has a bidirectional relationship with renewable energy investment [31]. GF provides higher-level financial support to renewable energy projects, which is more significant. GF has a structural/geometric effect on RE in surrounding cities and neighboring regions by encouraging it [29,32]. Ref. [33] used theoretical models and case studies for this subject, and the results explain that GF assists in closing the gap of inadequacy of finances to fund renewable energy. A number of scholars have expanded this research, including [9], postulating that GF fosters innovation towards RE and plays a crucial role in mitigating the rise of climate change. GF plays a crucial role in energy transition in E7 through RE dependence [34]. According to [35], “scaling up renewable energy” argues that GF reinforces the management and risk sharing of reshelve, public, and private funding in the energy sector industry of E7 countries have hindered the promotion of economic growth, access to power, and energy security. Therefore, the governments of these countries should address the policy hindrances of GF and RE.

2.4. Foreign Direct Investment (FDI) and Renewable Energy Consumption (REC)

FDI is a crucial factor for RE. FDI is found to increase RE consumption [36]. Therefore, it is beneficial for the government of South Africa and Uganda to promote foreign direct investment so as to enhance renewable energy. Ref. [36] supports the findings above, and the literature intensively examined the relationship between foreign direct investment (FDI), EG, and banking and development in South Africa. It is advisable for the government of South Africa to invest more in RE sources [37]. FDI enhances RE consumption through the promotion of investment in nations where capital is scarce [38]. Foreign direct investment, in as much as it contributes to economic growth, is found to be insignificant when it surpasses the threshold of 95% [39]. This study utilized the dynamic panel threshold model on 62 countries using data from 1987 to 2016. Ref. [24] uncovered the crucial benefits of EG and RE. According to [40], FDI has a significant correlation with RE and EG in nine selected countries, Denmark, Finland, India, Italy, Morocco, Norway, Portugal, and Sweden, as seen when utilizing the climate change performance index (CCPI 18). However, various scholars have discovered that FDI has a disadvantageous effect on renewable resources. The research conducted on South Asian countries postulates that there is a negative correlation between FDI and RE [41]. The governments of these Asian countries should come up with ways to motivate the financial sector to participate in RE.

2.5. Oil Prices (OPs) and Renewable Energy Consumption (REC)

Research carried out on Turkey revealed that OPs have a deleterious effect on RE. The bootstrap ARDL model was utilized in a study to evaluate the impact of US interest rates on oil prices in Turkey [36]. Ref. [42] supports the notation that oil prices do not have a causal relationship with RE. According to [43], OPs have an inverse impact on RE in Iran, as seen when employing a general to specific model. However, research carried out in Norway, the UK, and the US postulates that there is a presence of positivity correlation between OPs and RE in the US and Norway but no correlation with the UK because it is an exporter, and also due to government intervention [44].
In addition, not many scholars have paid much attention to the relationship between oil prices and EG [45,46,47]. Kuznets curves were used to analyze the impact of OP, RE, and CO2. OP and EG do not have a casual correlation [48].

2.6. Trade Openness (TO) and Renewable Energy Consumption (REC)

Ref. [5] postulates that there is a nonlinear correlation between TO and RE, as seen in a study of 35 OECD countries using a panel smooth transition regressive method. It was discovered that TO has some merits on renewable energy at the degree of 40.945% of the GDP; after this, trade openness begins to hinder renewable energy. Trade openness is said to increase the ecological footprint, whilst renewable energy and new technology tend to improve the environment. However, [49] postulates that exacerbating renewable energy leads to a decline in trade openness. Increasing renewable energy will ensure a sustainable economy in long-term decision-making. Non-renewable energy sources were found to foster trade openness. Non-renewable energy exacerbates trade openness [50]. The government should come up with ways of mitigating the negative effects of renewable energy whilst expanding trade. TO, EG, and technological growth foster renewable energy utilization [51].

2.7. Research Gap

The prior literature has expanded this area of research, but not many scholars have capitalized on the impact of renewable electricity output, exchange rates, foreign direct investment, oil prices, trade openness, green finance, and economic growth. Few studies have been carried out on the effects of exchange rates and trade openness on RE. However, much work needs to be conducted on this. Many scholars have not utilized renewable resources or financial development as their proxies, which makes the present research unique from all other past studies carried out. Most of the research was conducted on a particular nation, China, and no research has been conducted on Southern African countries besides South Africa, in which few scholars showed interest. However, this paper evaluates the role of economic development on renewable energy, which is a novelty as we have not found any prior research on this area.

3. Data and Methodology

3.1. Research Model

Several scholars have explored the relationship between EG and energy, and their findings used different techniques and postulated bi-directional causality. This causality is known as the feedback hypothesis [9,12]. The interaction between RE and the ER is crucial, especially when taking into account the short-term high cost of RE that is incurred and also considering the fact that other countries have to import materials to harness RE, for instance, solar photovoltaic (pv) energy, which is required due to poor technology or a lack of innovation, thus research and development (R&D) in this area is needed [13]. This reveals that the ER plays a crucial role, as most of the materials are imported from other countries and this affects RE development. The ER is vital in this study, as countries in Southern Africa have to stabilize their exchange rate in order to be able to import materials with cost-effective value.

3.2. Data

This paper employed panel data of 14 Southern African nations (South Africa, Botswana, Lesotho, Namibia, Tanzania, Madagascar, Mauritius, Kenya, the Comoros, Zambia, Eswatini, Rwanda, Angola, and Mozambique). The time period of the data used in this literature ranges from 2000 to 2022. The data were acquired from the World Bank and the IMF, and the indicators include REC, EG, TO, FDI, ER, OP, and GF. The REC value in this paper is measured as the renewable electricity output. The outcome for the descriptive statistics is provided below in the Table 1.
RE = β0 + β2EG + β3 ER + β4FDI + β5GF + β6OP +β7TO + μ
In Equation (1), REC is the renewable electricity, which is the dependent variable. EG is the economic growth, ER is the exchange rate, FDI is the foreign direct investment, whereas GF is green finance, OP shows the yearly oil price, and TO is trade openness. These are all the independent variables. μ is the error term in the equation. Green finance studies on the relationship between economic growth (EG) and RE has captivated the attention of a lot of scholars and environmental economists.
To ensure that the dataset is complete and reliable, a stringent data preprocessing methodology was employed. Missing values, particularly for foreign direct investment (FDI) in certain years and green finance (GF), were handled by implementing linear interpolation for short gaps and mean imputation based on historical country-level trends for significant gaps. To maintain consistency among the variables, we applied natural logarithmic transformations for the exchange rate (ER) and green finance (GF) to adjust heteroscedasticity and improve normality. Outliers were detected using the interquartile range (IQR) method, and extreme values were winsorized to prevent econometric analysis distortions. Additionally, all the variables were also subjected to stationarity testing using the RALS unit root test so that appropriate transformations could be run before analysis via cointegration and quantile regression. This pre-processing enhances the robustness of the outcome and ensures that the dataset is properly prepared for empirical modeling.

3.3. Method

3.3.1. Model Specification

The data provided aimed to analyze the role of economic development on RE in South African countries. Previous researchers used renewable energy, banking development, and economic growth [6,30], whilst others used the sources of RE such as biomass, fossil fuels, and others [52]. This paper used a different approach from the past research in order to cover the research gap by employing FDI, RE (renewable electricity output), GF, TO, ER, and EG.
The selection of proper econometric approaches matters in the formulation of consistent and reliable empirical findings. Three advanced econometric techniques—the RALS unit root test, the RALS cointegration test, and the MMQR (Method of Moments Quantile Regression) model—were applied here to investigate the relationship between economic development, macroeconomic indicators, and renewable energy consumption (REC) in the Southern African region. These methods were chosen since they possess the merits of handling small sample sizes, structural breaks, and distributional heterogeneity in quantiles.
The Residual Augmented Least Squares (RALS) unit root test is an advanced unit root testing framework that goes beyond the traditional Augmented Dickey–Fuller (ADF) and Phillips–Perron (PP) tests by incorporating additional moment conditions, promoting efficiency, and addressing non-normality of the error terms. This is particularly relevant in macroeconomic studies, where data are subject to structural breaks and non-Gaussian distributions. Classical unit root tests tend to be underpowered when samples are small or distributions are non-normal. The RALS unit root test avoids the precise identification of the stationarity characteristics of the variables that may be mistaken to be long-run relationships.
The RALS cointegration test is a stronger proxy for traditional cointegration tests such as the Johansen and the Engle–Granger methods. It is particularly useful for small sample sizes, structural breaks, and non-normality in error distributions, which are common problems in macroeconomic time series analysis. Traditional cointegration tests may be helpless in detecting long-run relations if observations have non-Gaussian errors or structural breaks. The RALS cointegration test is more efficient in the detection of long-run equilibrium stable relationships between REC, macroeconomic variables, and economic development.
The MMQR model is an advanced quantile regression technique that improves on the traditional quantile regression model through the incorporation of the moments approach. Whilst traditional regression models can estimate only the mean effect, MMQR allows one to examine the way the explanatory variables influence the dependent variable across different quantiles of the distribution. The relationship between macroeconomic variables, economic development, and REC may be heterogeneous across all levels of REC. The MMQR model offers the scope of testing whether the impact of macroeconomic variables, economic development, trade openness, and FDI is heterogeneous across different levels of REC.

3.3.2. Residual Augmented Least Square (RALS)-EG Technique

The Engle Granger (EG) test, a two-step cointegration test, was developed due to its dependency on the residual’s framework and t-statistics. The static level of integration is computed at the first part of the test. The second step involves conducting an ordinary least squares regression estimation when the variables are integrated of order 1 (I(1)).
y t = β z t + μ t
The ADF test is used to analyze the degree of cointegration of the residuals ( u ^ t) which were observed.
Δ u ^ t = Φ 0 + Φ 1 u ^ t 1 + i 1 q Φ i + 1 Δ u ^ t 1 + ϑ t
In the case that the distribution of the test equation errors is non-normal, the RALS produces results that are reliable. For us to implement RALS, Equation (4) was changed:
y ^ t = q u ^ t E ^ u ^ t O ^ t
While ( u ^ t ) indicates white noise, however,
q u ^ t = u ^ t 2 , u ^ t 3 , E ^ = 1 T i = 1 T q u ^ t , O ^ t = 1 T i = 1 T q u ^ t
The RALS, equation as suggested by [53].
y ^ t = [ u ^ t 2 m 2 , u ^ t 2 m 3 3 m 2 u ^ t ]
where mi = T−1  i = 1 T u ^ t . Furthermore, by including w ^ t in Equation (4), the RALS is shown in Equation (5) as follows:
Δ u ^ t = Φ 1 u ^ t 1 + i 1 q Φ i + 1 Δ u ^ t 1 + w ^ t γ + ϑ t
Equation (12) is used to determine the three exponential distributions of the t-statistics.
t * = q · t + 1 q 2 · Ζ
Moreover, the preliminary results reflected that we utilized the MMQR model developed by [54] to capture the conditional heterogeneity of the explained variable. According to [55], this approach provides benefits for managing the impact of certain factors and the presence of endogeneity in the parameters. The quantile model is constructed as follows:
γ i t = δ i + X i t a + B i + Q i t σ ε i t 0.75   e m
The fixed influence of the model and Qit is captured by δ i , and B i , which stand for the differentiable transformation of m vector of X.
S c = S c X , c = 1,2 , 3 , m
Moreover, in the quantile context, estimates are made using the following method.
Q y T X i t = δ i + B i ( q ( T ) + X i t a + Q i t σ q ( T )
Xit is the predictor facets vector in Equation (9), which includes TOR, GF, CO, and FDI; the conditional quantile distribution of the endogenous facet is located on the left. What sets the individual effects estimate approach apart from other LS-fixed effects strategies is that it does not contain an intercept term. The time-invariance of the variables is predicted, meaning that the discrepancies between the units are assumed to stay constant. The following solution was minimized in order to obtain the quantiles of the gathered data.
m i n q i t T ( Z i t ( B i + Q i t σ q ) q )
In addition to this, the feasible generalized least square (FGLS) method was employed in this investigation in order to ascertain the relationships that exist among the variables and to analyze the robustness of the MMQR estimations. Because of its capacity to deal with potential serial correlation, heteroscedasticity, and cross-sectional dependence, FGLS is considered to employ the findings of [56].
The MMQR statistical was postulated as the quantile independent factor depicted Q y ( δ ! X i t ) , as presented in Equation (11) [57].
Y i t = α i + X i t + Λ i + Z i t φ i t
In the equation above Λ i + Z i t is supposed not exceed 0, although it can be less than or equal to 1. α, ∅, and φ. Equation (11) thus presents the statistical MMQR model that was estimated in this study.
Q y ( δ ! X i t = X i t φ + Z i t φ q δ + ( α i + λ i q δ
The MMQR equation in (12) is the statistical equation of Equation (1) of this paper.

4. Results

Table 2 depicts the descriptive statistic data. The number of observations for each variable is 314. The data collected are from 2000 to 2022 in this study. The median, standard deviation, mean, maximum, and minimum for the variables are shown in Table 2 below.
This paper followed a three-stage sequence for the analysis of the data. We started by testing the preliminary test on the variables. In this first stage, we ran the CD test of Pesaran [58] and Fisher to evaluate if the variables depict significant CD. In this research, we found that CD is significant. The second-generation method was employed because of its ability to overcome CD. The second-generation method was utilized for the existence of CD, whilst for the non-existence CD, the first-generation method was utilized. The variables used show no cross-dependency; thus, the second-generation method was employed. See Table 3.
The ADF and the RALS-ADF techniques were employed in this study to test the order of integration of the variables, as shown in Table 4. In addition, another column in the table represents the RALS-ADF test statistic with the adjustment for endogeneity. The ADF test checks for stationarity at all levels. A test statistic smaller (more negative) than the critical values indicates stationarity.
From these results, variables such as EG, FDI, and GF are significant at their different levels (*, **, or ***) and reject the null hypothesis of the unit root and are hence stationary. The rest of the variables, RE, OP, and TO, are not stationary at all levels, as seen by the ADF result. According to the results from the RALS-ADF test, the RALS-ADF test is an improved version of the ADF test as it considers endogeneity and small-sample bias. The results under the RALS-ADF test indicate that most of the series turn stationary once this test is performed. For instance, variables such as ER, GF, FDI, and EG have significant results at 1%*** levels, hence confirming their stationarity. However, some of the variables remain non-stationary, like RE, GR, and TO.
The variables that were not stationary at every level were tested at their first differences for stationarity: ∆RE, ∆OP, and ∆TO. It can be seen that they are all stationary at the first difference; hence, they are integrated of order one, I(1) [59].
Second Stage: Cointegration Results. Table 5 shows the cointegration results. In this second stage, we examined the presence of the long-run (LR) correlation of variables. This study employed the Engle and Granger (EG) and the Residual Augmented Least Squares (RALS-EG) methods for testing cointegration. The EG method utilizes the residuals of the t-statistics in their evaluation. The RALS-EG cointegration was employed to determine the long-run correlation of variables used in this study. The RALS-ADF method was created by [60] by integrating the EG cointegration model and the EG model [61]. Ref. [62] were the first to use the RALS method in their work. In scenarios where the error terms have some uniformity with a non-normal distribution, the RALS method is utilized to give excellent results. The RALS method gives robust results as it employs the second and third classical cointegration residuals to develop new terms [63]. The RALS-EG method has been broadly used in the research because of its preeminence of superior results [64].
Table 5 depicts the cointegration findings. The RALS -EG statistic shows that the critical values of (−4.01), which are less than the critical values (−4.80, −4.19, and −3.88, respectively) at the 10% significant level. The results of the RALS -EG test were also verified with conventional methods, in this case the EG test. It was concluded that there is an LR relationship between the dependent variables and the independent variables. After the verification of cointegration association, the long-run effects were estimated, and the MMQR method was employed to determine the negative effects of the variables.

Interpretation of Findings

Table 6 reviews the results of the MMQR model. The link between EG, OP, ER, TO, GF, and FDI is investigated using the MMQR model after the CD, unit root, and cointegration. Five quantiles were chosen to investigate the variable according to the MMQR model. The panel series of MMQR was analyzed by moving through the quantile of variables. The EG results are statistically and positively significant at all quantiles (q05–q95). If EG increases by 1%, RE increases by 1.794, 1.661, 1.438, 1.279, and 1.193. We conclude that if countries in Southern African desire to increase their EG, then they have to utilize their renewable energy. EG findings do not show an asymmetric effect on REC in Southern African countries. These results agree with those of other scholars who postulate that renewable energy utility has a positive effect on economic growth [11,18,20,65,66,67]. Secondly, the OP results are statistically significant across all quantiles. A 1% increase in oil prices increases the dependent variable by 0.132, 0.104, 0.059, 0.026, and 0.009. These results are different from those of other scholars. This may be because of the different methods used in their research. The results indicate that oil prices have a negative impact on renewable energy. The oil prices are high in Southern Africa, which makes it expensive to operate REC energy sources such as hydro-electricity power plants. These results agree with those of [68]. Thirdly, the exchange rate results are statistically significant across all quantiles (q05–q95). This means that a percentage increase in the ER has a positive effect on REC by 0.011, 0.005, −0.005, 0.012, and −0.015. The ER has an inverse effect on REC. An increase in the ER reduces REC in Southern African countries. These results do not agree with those of [18], who postulated that REC promotes ER appreciation. The explanation of the differences in the findings may also include the countries of study and the high prices being charged for REC in these countries. Therefore, the governments of these nations need to shield customers from high prices by subsidizing REC. It is postulated that interest rates cause the appreciation of currency, and therefore, the currency rate could be used to solve this problem.
The TO findings are significant. An increase of 1% in trade openness will cause an increase in REC. TO promotes REC in Southern African countries. Trade openness in terms of the removal of bans and a reduction in duty tax encourages the sharing of innovative renewable energy technologies with neighboring countries. These results disagree with those of [69], which state that non-renewable resources increase trade openness and renewable energy reduces TO. GF is insignificant. An increase in GF by 1% will not have any effect on REC, as shown by the results in Table 6 (0.000%) from q05 to q95. This may be because of a lack of governmental and private investment in the Southern African region [69]. These results are different from those of that postulate that GF fosters RE investment. The FDI results are significant, and explain that a 1% increase in FDI will cause an increase in REC of 22.245, 1.972, 1.515, 1.190, and 1.014 from q5 to q95. FDI is said to foster innovation in terms of energy efficiency. FDI opens the opportunity for technological advancement.
Table 7 shows the results of the robustness check using the Driscoll–Kraay Standard Errors method, where the dependent variable is renewable energy consumption. In fact, the DKSE method was applied to take care of heteroscedasticity and cross-sectional dependence in data. The results of the DKSE method support the robustness of the original estimations from the MMQR model. Key variables such as economic growth (EG), oil prices (OPs), and foreign direct investment (FDI) retain their significant and positive influence on renewable energy consumption. Variables like the exchange rate and trade openness show marginal significance, reflecting their possible indirect influence.
However, GF does not exhibit a significant relationship, which may indicate that the influence of GF requires further investigation or perhaps other factors. The evidence obtained using the DKSE method further reinforces the results of the MMQR model in establishing positive and significant relationships of economic growth, oil prices, and foreign direct investment with renewable energy consumption. This strengthens the robustness of the initial estimations and highlights the consistent impact of these variables across different econometric techniques. These findings underline the importance of economic and trade policies, oil price dynamics, and FDI in driving renewable energy adoption, supporting the validity of the main results in the article.

5. Conclusions and Future Research Recommendations

5.1. Conclusions

In conclusion, the current literature provides insight into the achievement of sustainable renewable energy consumption in Southern African countries. The literature also provides essential information that is useful in covering the existing gap that is listed above. The impact of economic development and other macroeconomic factors in Southern Africa is significant. In accordance with the research gap presented above, economic development and other macroeconomic factors positively impact REC. The positive effect of EG, OP, ER, TO, GF, and FDI on renewable energy is notable. The presence of positive results across the quantile reviews indicates that there is no asymmetric effect on renewable energy. Therefore, Southern African countries should invest more in renewable energy, considering the role it plays in the development of the economy.
The present research also furthers the growing body of knowledge by showing the importance of GF, ER, OP, TO, and FDI in improving REC in Southern African countries. These policies must also encourage public and private sectors to invest. The findings postulate that EG, OP, ER, TO, GF, and FDI are positively impacted by REC. The governments of Southern African nations should come up with ways to attract more direct investment by encouraging innovation in these countries. The government must be able to link EG and RE for the betterment of the lives of the people. RE will increase if the life expectancy of the people in these countries increases, since several scholars have shown that there is low life expectancy due to the use of non-renewable energy. The governments or the respected decision makers in different countries should put aside financial resources to be used for the innovation of efficient energy technologies and environmentally friendly projects [6]. The increase in foreign direct investment will lead to a positive effect on EG. This will result in a positive effect on the significance of FDI in promoting growth among particular countries, as highlighted by these findings. Additionally, the results of our study provide credence to the endogenous growth model, which holds that FDI fosters economic development by increasing capital accumulation and productivity. Governments must therefore encourage FDI in order to advance technology, improve quality management practices, and gain access to global markets. Doing so will increase the likelihood of economic development by boosting productivity and enhancing efficiency. The most faced limitation was the lack of data for some of the countries that were not included, such as Zimbabwe and Seychelles, and we had to employ data from 2000 as there were no data from the 1990s for some countries. Other scholars can conduct more research on this topic, especially if carried out in other regions or if other methods are employed.

5.2. Future Research Recommendations

The present study provides valuable insight into the impact of economic growth and macroeconomic indicators on driving the consumption of renewable energy (REC) in the countries of Southern Africa. Subsequent studies could utilize alternative econometric techniques, such as panel structural equation modeling (SEM), machine learning-based forecasting models, or dynamic panel data models, to assess the sensitivity of the findings and detect any potential nonlinear effects. While the present research study focused on Southern African countries, future studies would be useful if they could extend the analysis to other geographical regions, e.g., East Africa, West Africa, or inter-continental comparisons, in order to identify regional variations in the impact of macroeconomic variables on REC. Also, future research could examine how different economic sectors (e.g., agriculture, industry, and service sectors) influence the consumption of renewable energy since sectoral trends in energy demand may impact policy attention differently.
Additionally, the relationship between regulatory quality, political stability, and anti-corruption efforts and the impact on REC remains a developing field of research. Much more research must be conducted on the role that governance institutions have in driving green finance, FDI, and the impact of trade openness on renewable energy adoption. Furthermore, future research should examine the socio-economic effects of the transition from fossil fuels to renewable energy, including employment trends, income inequality, and health benefits. A deeper examination of the correlation between REC and life expectancy may provide additional policy implications.
The scope of future technologies, such as smart grids, blockchain for energy trading, and artificial intelligence-based energy optimization, needs to be uncovered to explore how these technologies can further enable REC in emerging economies. Also, future studies need to assess the effectiveness of existing renewable energy policies in Southern Africa using policy impact analysis and the identification of best practices that other developing economies can replicate. In addition, the connection between REC and climate resilience needs to be explored in future studies, with an emphasis on how the ippenncreased use of renewable energy can help Southern African countries mitigate climate-related challenges and adapt to climate change. Finally, more research on the degree to which PPPs and innovative financing instruments (e.g., green bonds, carbon credits, and impact investing) can drive REC growth would provide policymakers with efficient tools to create more resources.

Author Contributions

Conceptualization, M.S.; methodology, M.S.; software, M.S.; validation, M.S.; formal analysis, M.S.; investigation, M.S. and H.O.; resources, M.S.; data curation, A.S.; writing—original draft preparation, A.S.; writing—review and editing, M.S.; visualization, M.S. and A.S.; supervision, M.S. and H.O. All authors have read and agreed to the published version of the manuscript.

Funding

This research received no external funding.

Institutional Review Board Statement

Not applicable.

Informed Consent Statement

Not applicable.

Data Availability Statement

This paper employed panel data of 14 Southern African nations (South Africa, Botswana, Lesotho, Namibia, Tanzania, Madagascar, Mauritius, Kenya, the Comoros, Zambia, Eswatini, Rwanda, Angola, and Mozambique). Data were collected from the World Bank dataset (WB: https://databank.worldbank.org/, accessed on 20 September 2023), the International Monetary Fund (IMF: https://data.imf.org, accessed on 30 October 2024), and Statista (https://www.statista.com/statistics/262858/change-in-opec-crude-oil-prices-since-1960, accessed on 21 November 2024).

Conflicts of Interest

The authors declare no conflicts of interest.

References

  1. Adrangi, B.; Kerr, L. Sustainable development indicators and their relationship to GDP: Evidence from emerging economies. Sustainability 2022, 14, 658. [Google Scholar] [CrossRef]
  2. Adebayo, T.S. Do CO2 emissions, energy consumption and globalization promote economic growth? Empirical evidence from Japan. Environ. Sci. Pollut. Res. 2021, 28, 34714–34729. [Google Scholar] [CrossRef] [PubMed]
  3. Alharbi, S.S.; Al Mamun, M.; Boubaker, S.; Rizvi, S.K.A. Green finance and renewable energy: Worldwide evidence. Energy Econ. 2023, 118, 106499. [Google Scholar] [CrossRef]
  4. Alam, M.M.; Murad, M.W. The impacts of economic growth, trade openness and technological progress on renewable energy use in organization for economic co-operation and development countries. Renew. Energy 2020, 145, 382–390. [Google Scholar] [CrossRef]
  5. Alper, A.; Oguz, O. The role of renewable energy consumption in economic growth: Evidence from asymmetric causality. Renew. Sustain. Energy Rev. 2016, 60, 953–959. [Google Scholar] [CrossRef]
  6. Aslan, A.; Altinoz, B.; Özsolak, B. The nexus between economic growth, tourism development, energy consumption, and CO2 emissions in Mediterranean countries. Environ. Sci. Pollut. Res. 2021, 28, 3243–3252. [Google Scholar] [CrossRef]
  7. Bhattacharya, M.; Paramati, S.R.; Ozturk, I.; Bhattacharya, S. The effect of renewable energy consumption on economic growth: Evidence from top 38 countries. Appl. Energy 2016, 162, 733–741. [Google Scholar] [CrossRef]
  8. Ben Mbarek, M.; Saidi, K.; Rahman, M.M. Renewable and non-renewable energy consumption, environmental degradation and economic growth in Tunisia. Qual. Quant. 2018, 52, 1105–1119. [Google Scholar] [CrossRef]
  9. Can, B.; Ahmed, Z.; Ahmad, M.; Can, M. Do renewable energy consumption and green trade openness matter for human well-being? Empirical evidence from European Union countries. Soc. Indic. Res. 2022, 164, 1043–1059. [Google Scholar] [CrossRef]
  10. Caglar, A.E. The importance of renewable energy consumption and FDI inflows in reducing environmental degradation: Bootstrap ARDL bound test in selected 9 countries. J. Clean. Prod. 2020, 264, 121663. [Google Scholar] [CrossRef]
  11. Xu, Y.; Peng, Z.; Sidra, S. Exploring the impacts of tourism development and exchange rate on renewable energy demand in China: A nonlinear perspective. Energy Environ. 2023, 0958305X231195362. [Google Scholar] [CrossRef]
  12. Chica-Olmo, J.; Sari-Hassoun, S.; Moya-Fernández, P. Spatial relationship between economic growth and renewable energy consumption in 26 European countries. Energy Econ. 2020, 92, 104962. [Google Scholar] [CrossRef]
  13. Deka, A.; Ozdeser, H.; Cavusoglu, B.; Seraj, M.; Tursoy, T. Exchange rate stability in the emerging economies: Does renewable energy play a role—A panel data analysis. Environ. Sci. Pollut. Res. 2023, 30, 23668–23677. [Google Scholar] [CrossRef] [PubMed]
  14. Shahbaz, M.; Khraief, N.; LCzudaj, R. Renewable Energy Consumption-Economic Growth Nexus in G7 Countries: New Evidence from a Nonlinear ARDL Approach. 2020. Available online: https://mpra.ub.uni-muenchen.de/103525/ (accessed on 20 October 2020).
  15. Chen, Y.; Wang, Z.; Zhong, Z. CO2 emissions, economic growth, renewable and non-renewable energy production and foreign trade in China. Renew. Energy 2019, 131, 208–216. [Google Scholar] [CrossRef]
  16. Deka, A.; Bako, S.Y.; Ozdeser, H.; Seraj, M. The impact of energy efficiency in reducing environmental degradation: Does renewable energy and forest resources matter? Environ. Sci. Pollut. Res. 2023, 30, 86957–86972. [Google Scholar] [CrossRef]
  17. Zafar, M.W.; Zaidi, S.A.H.; Sinha, A.; Gedikli, A.; Hou, F. The role of stock market and banking sector development, and renewable energy consumption in carbon emissions: Insights from G-7 and N-11 countries. Resour. Policy 2019, 62, 427–436. [Google Scholar] [CrossRef]
  18. Apergis, N.; Payne, J.E. The causal dynamics between renewable energy, real GDP, emissions and oil prices: Evidence from OECD countries. Appl. Econ. 2014, 46, 4519–4525. [Google Scholar] [CrossRef]
  19. Pao, H.T.; Fu, H.C. Renewable energy, non-renewable energy and economic growth in Brazil. Renew. Sustain. Energy Rev. 2013, 25, 381–392. [Google Scholar] [CrossRef]
  20. Asif, M.; Bashir, S.; Khan, S. Impact of non-renewable and renewable energy consumption on economic growth: Evidence from income and regional groups of countries. Environ. Sci. Pollut. Res. 2021, 28, 38764–38773. [Google Scholar] [CrossRef]
  21. Ivanovski, K.; Hailemariam, A.; Smyth, R. The effect of renewable and non-renewable energy consumption on economic growth: Non-parametric evidence. J. Clean. Prod. 2021, 286, 124956. [Google Scholar] [CrossRef]
  22. Becker, B.; Fischer, D. Promoting renewable electricity generation in emerging economies. Energy Policy 2013, 56, 446–455. [Google Scholar] [CrossRef]
  23. Qin, L.; Hou, Y.; Miao, X.; Zhang, X.; Rahim, S.; Kirikkaleli, D. Revisiting financial development and renewable energy electricity role in attaining China’s carbon neutrality target. J. Environ. Manag. 2021, 297, 113335. [Google Scholar] [CrossRef] [PubMed]
  24. Shahbaz, M.; Topcu, B.A.; Sarıgül, S.S.; Vo, X.V. The effect of financial development on renewable energy demand: The case of developing countries. Renew. Energy 2021, 178, 1370–1380. [Google Scholar] [CrossRef]
  25. Hlongwane, N.W.; Daw, O.D. Renewable electricity consumption and economic growth: A comparative study of South Africa and Zimbabwe. Int. J. Energy Econ. Policy 2023, 13, 197–206. [Google Scholar] [CrossRef]
  26. Hieu, V.M.; Mai, N.H. Impact of renewable energy on economic growth? Novel evidence from developing countries through MMQR estimations. Environ. Sci. Pollut. Res. 2023, 30, 578–593. [Google Scholar] [CrossRef]
  27. Hong, Y.; Luo, K.; Xing, X.; Wang, L.; Huynh, L.D.T. Exchange rate movements and the energy transition. Energy Econ. 2024, 136, 107701. [Google Scholar] [CrossRef]
  28. Im, K.S.; Schmidt, P. More efficient estimation under non-normality when higher moments do not depend on the regressors, using residual augmented least squares. J. Econom. 2008, 144, 219–233. [Google Scholar] [CrossRef]
  29. Kang, X.; Khan, F.U.; Ullah, R.; Arif, M.; Rehman, S.U.; Ullah, F. Does foreign direct investment influence renewable energy consumption? empirical evidence from south Asian countries. Energies 2021, 14, 3470. [Google Scholar] [CrossRef]
  30. Kadir, M.O.; Deka, A.; Ozdeser, H.; Seraj, M.; Turuc, F. The impact of energy efficiency and renewable energy on GDP growth: New evidence from RALS-EG cointegration test and QARDL technique. Energy Effic. 2023, 16, 46. [Google Scholar] [CrossRef]
  31. Kilci, E.N. An investigation on the causality link between renewable energy consumption and economic growth in selected Euro-Area countries. Energy Sources Part B Econ. Plan. Policy 2023, 18, 2250844. [Google Scholar] [CrossRef]
  32. Lee, H.; Lee, J.; Im, K. More powerful cointegration tests with non-normal errors. Stud. Nonlinear Dyn. Econom. 2015, 19, 397–413. [Google Scholar] [CrossRef]
  33. Lee, C.C.; Wang, F.; Chang, Y.F. Does green finance promote renewable energy? Evidence from China. Resour. Policy 2023, 82, 103439. [Google Scholar] [CrossRef]
  34. Lev, Z.; Chen, L.; Ali, S.A.; Muda, I.; Alromaihi, A.; Boltayev, J.Y. Financial technologies, green technologies and natural resource nexus with sustainable development goals: Evidence from resource abundant economies using MMQR estimation. Resour. Policy 2024, 89, 104649. [Google Scholar] [CrossRef]
  35. Liu, Z.; Xu, J.; Wei, Y.; Hatab, A.A.; Lan, J. Nexus between green financing, renewable energy generation, and energy efficiency: Empirical insights through DEA technique. Environ. Sci. Pollut. Res. 2023, 30, 61290–61303. [Google Scholar] [CrossRef]
  36. Maji, I.K.; Sulaiman, C.; Abdul-Rahim, A.S. Renewable energy consumption and economic growth nexus: Fresh evidence from West Africa. Energy Rep. 2019, 5, 384–392. [Google Scholar] [CrossRef]
  37. Meng, M.; Lee, J.; Payne, J.E. RALS-LM unit root test with trend breaks and non-normal errors: Application to the Prebisch-Singer hypothesis. Stud. Nonlinear Dyn. Econom. 2017, 21, 31–45. [Google Scholar] [CrossRef]
  38. Mutumba, G.S.; Odongo, T.; Okurut, F.N.; Bagire, V.; Senyonga, L. Renewable and non-renewable energy consumption and economic growth in Uganda. SN Bus. Econ. 2022, 2, 63. [Google Scholar] [CrossRef]
  39. Mukhtarov, S.; Mikayilov, J.I.; Maharramov, S.; Aliyev, J.; Suleymanov, E. Higher oil prices, are they good or bad for renewable energy consumption: The case of Iran. Renew. Energy 2022, 186, 411–419. [Google Scholar] [CrossRef]
  40. Naimoğlu, M. Impact of renewable and non-renewable energy consumption on economic growth in Mexico: A RALS-EG cointegration test approach. Eskişehir Osman. Üniversitesi İktisadi Ve İdari Bilim. Derg. 2022, 17, 502–518. [Google Scholar]
  41. Ngcobo, R.; De Wet, M.C. The Impact of Financial Development and Economic Growth on Renewable Energy Supply in South Africa. Sustainability 2024, 16, 2533. [Google Scholar] [CrossRef]
  42. Osei, M.J.; Kim, J. Foreign direct investment and economic growth: Is more financial development better. Econ. Model. 2020, 93, 154–161. [Google Scholar] [CrossRef]
  43. Ozcan, B.; Ozturk, I. Renewable energy consumption-economic growth nexus in emerging countries: A bootstrap panel causality test. Renew. Sustain. Energy Rev. 2019, 104, 30–37. [Google Scholar] [CrossRef]
  44. Pesaran, M.H. Testing weak cross-sectional dependence in large panels. Econom. Rev. 2015, 34, 1089–1117. [Google Scholar] [CrossRef]
  45. Pesaran, M.H.; Shin, Y.; Smith, R.J. Bounds testing approaches to the analysis of level relationships. J. Appl. Econom. 2001, 16, 289–326. [Google Scholar] [CrossRef]
  46. Peng, K.; Feng, K.; Chen, B.; Shan, Y.; Zhang, N.; Wang, P.; Fang, K.; Bai, Y.; Zou, X.; Wei, W.; et al. The global power sector’s low-carbon transition may enhance sustainable development goal achievement. Nat. Commun. 2023, 14, 3144. [Google Scholar] [CrossRef]
  47. Payne, J.E. The causal dynamics between US renewable energy consumption, output, emissions, and oil prices. Energy Sources Part B Econ. Plan. Policy 2012, 7, 323–330. [Google Scholar] [CrossRef]
  48. Saboori, B.; Al-Mulali, U.; Bin Baba, M.; Mohammed, A.H. Oil-induced environmental Kuznets curve in organization of petroleum exporting countries (OPEC). Int. J. Green Energy 2016, 13, 408–416. [Google Scholar] [CrossRef]
  49. Samour, A.; Ali, M.; Abdullah, H.; Moyo, D.; Tursoy, T. Testing the effects of banking development, economic growth and foreign direct investment on renewable energy in South Africa. OPEC Energy Rev. 2023, 47, 306–319. [Google Scholar] [CrossRef]
  50. Samour, A.; Baskaya, M.M.; Tursoy, T. The impact of financial development and FDI on renewable energy in the UAE: A path towards sustainable development. Sustainability 2022, 14, 1208. [Google Scholar] [CrossRef]
  51. Sadorsky, P. Renewable energy consumption, CO2 emissions and oil prices in the G7 countries. Energy Econ. 2009, 31, 456–462. [Google Scholar] [CrossRef]
  52. Machado, J.A.; Silva, J.S. Quantiles via moments. J. Econom. 2019, 213, 145–173. [Google Scholar] [CrossRef]
  53. Sebri, M.; Ben-Salha, O. On the causal dynamics between economic growth, renewable energy consumption, CO2 emissions and trade openness: Fresh evidence from BRICS countries. Renew. Sustain. Energy Rev. 2014, 39, 14–23. [Google Scholar] [CrossRef]
  54. Shah, I.H.; Hiles, C.; Morley, B. How do oil prices, macroeconomic factors and policies affect the market for renewable energy. Appl. Energy 2018, 215, 87–97. [Google Scholar] [CrossRef]
  55. Shahbaz, M.; Song, M.; Ahmad, S.; Vo, X.V. Does economic growth stimulate energy consumption? The role of human capital and R&D expenditures in China. Energy Econ. 2022, 105, 105662. [Google Scholar]
  56. Smolović, J.C.; Muhadinović, M.; Radonjić, M.; Đurašković, J. How does renewable energy consumption affect economic growth in the traditional and new member states of the European Union. Energy Rep. 2020, 6, 505–513. [Google Scholar] [CrossRef]
  57. Taghizadeh-Hesary, F.; Yoshino, N. Sustainable solutions for green financing and investment in renewable energy projects. Energies 2020, 13, 788. [Google Scholar] [CrossRef]
  58. Tiwari, A.K.; Nasreen, S.; Anwar, M.A. Impact of equity market development on renewable energy consumption: Do the role of FDI, trade openness and economic growth matter in Asian economies. J. Clean. Prod. 2022, 334, 130244. [Google Scholar] [CrossRef]
  59. Troster, V.; Shahbaz, M.; Uddin, G.S. Renewable energy, oil prices, and economic activity: A Granger-causality in quantiles analysis. Energy Econ. 2018, 70, 440–452. [Google Scholar] [CrossRef]
  60. Usman, O.; Olanipekun, I.O.; Iorember, P.T.; Abu-Goodman, M. Modelling environmental degra-dation in South Africa: The effects of energy consumption, democracy, and globalization using innovation accounting tests. Environ. Sci. Pollut. Res. 2020, 27, 8334–8349. [Google Scholar] [CrossRef]
  61. Vakulchuk, R.; Overland, I.; Scholten, D. Renewable energy and geopolitics: A review. Renew. Sustain. Energy Rev. 2020, 122, 109547. [Google Scholar] [CrossRef]
  62. Wang, Q.; Wang, L. Renewable energy consumption and economic growth in OECD countries: A nonlinear panel data analysis. Energy 2020, 207, 118200. [Google Scholar] [CrossRef]
  63. Wang, Z.; Peng, M.Y.P.; Anser, M.K.; Chen, Z. Research on the impact of green finance and renewable energy on energy efficiency: The case study E− 7 economies. Renew. Energy 2023, 205, 166–173. [Google Scholar] [CrossRef]
  64. Wei, X.; Mohsin, M.; Zhang, Q. Role of foreign direct investment and economic growth in renewable energy development. Renew. Energy 2022, 192, 828–837. [Google Scholar] [CrossRef]
  65. Xu, Z.; Tang, N.; Xu, C.; Cheng, X. Data science: Connotation, methods, technologies, and development. Data Sci. Manag. 2021, 1, 32–37. [Google Scholar] [CrossRef]
  66. Zhao, X.; Shang, Y.; Magazzino, C.; Madaleno, M.; Mallek, S. Multi-step impacts of environmental regulations on green economic growth: Evidence in the lens of natural resource dependence. Resour. Policy 2023, 85, 103919. [Google Scholar] [CrossRef]
  67. Zhang, M.; Zhang, S.; Lee, C.C.; Zhou, D. Effects of trade openness on renewable energy consumption in OECD countries: New insights from panel smooth transition regression modelling. Energy Econ. 2021, 104, 105649. [Google Scholar] [CrossRef]
  68. Zhang, H.; Geng, C.; Wei, J. Coordinated development between green finance and environmental performance in China: The spatial-temporal difference and driving factors. J. Clean. Prod. 2022, 346, 131150. [Google Scholar] [CrossRef]
  69. Zeren, F.; Akkuş, H.T. The relationship between renewable energy consumption and trade open-ness: New evidence from emerging economies. Renew. Energy 2020, 147, 322–329. [Google Scholar] [CrossRef]
Figure 1. Share of final energy use that comes from renewable sources. Source: the International Energy Agency, the International Renewable Energy Agency, and the United Nations Statistics Division. (https://ourworldindata.org/grapher/share-of-final-energy-consumption-from-renewable-sources, accessed on 27 August 2024)).
Sustainability 17 03496 g001
Table 1. Summary of variables.
VariablesMeasurementSource
Renewable electricity output (RE)% of total electricity outputWB
Economic growth (EG)GDP growth (annual %)WB
Exchange rate (ER)Official exchange rateWB
Foreign direct investment (FDI)Net inflows (% of GDP)WB
Green finance (GF)Millions of constant 2020 United States dollars.IMF
Oil prices (OP)US dollars per barrelStatista
Trade openness (TO)% of GDPWB
Table 2. Descriptive statistics.
TestsREEGERFDIGFOPTO
Mean51.814.08400.073.04517.09115.4776.62
Median53.224.2029.312.0653.50106.4866.18
Maximum100.0015.034096.1239.461,770,000,000583.68175.80
Minimum−2.89−14.600.00−10.730.000.0023.98
Std. Dev.37.853.93764.604.94155,000,00064.4535.88
Observations314314314314314314314
Table 3. Cross-sectional dependency tests (null: no cross-dependency).
TestStatisticp-Value
Pesaran47.1380.000
Fisher220.0830.000
Statistics
Frees13.207
Critical values from Frees’ Q distributionα = 10%: 0.214
α = 5%: 0.284
α = 1%: 0.425
Table 4. RALS unit root test results.
VariablesADFRALS-ADF ρ 2
RE0.0410.5140.57
EG−2.641 *−7.649 ***0.71
ER−2.906 *−14.791 ***0.78
FDI−2.776 *−8.165 ***0.69
GF−2.98 **−16.570 ***0.58
GR−3.56 ***−3.072 *0.61
OP0.999−2.6580.53
TO0.0890.0150.64
∆RE−2.75 *−9.340 ***0.74
∆OP−2.61 *−3.12 *0.69
∆TO−2.63 *−12.125 ***0.65
Note: ***, **, and * indicate significance at 1%, 5%, and 10%, respectively. The 1%, 5%, and 10% critical values for the ADF are −3.58, −2.93, and −2.60, respectively. The 1%, 5%, and 10% critical values for the RALS-ADF are −3.75, −3.30, and −3.05, respectively.
Table 5. RALS cointegration test results.
MethodsKTest Statistics ρ 2
EG0−3.99 *-
RALS-EG0−4.01 *0.89
Note: K shows the optimum lag length found using recursive statistics; the 1%, 5%, and 10% critical values for the EG test are −5.02, −4.32, and −3.98, respectively; the 1%, 5%, and 10% critical values for the RALS-EG test are −4.80, −4.19, and −3.88, respectively. Also, * shows the significance level at 1%.
Table 6. MMQR model.
qtile__05qtile__25qtile__50qtile__75qtile__95
Coefficientp-ValueCoefficientp-ValueCoefficientp-ValueCoefficientp-ValueCoefficientp-Value
EG1.7940.0281.6610.0161.4380.0151.2790.0501.1930.099
OP0.1320.0030.1040.0050.0590.0710.0260.4530.0090.821
ER0.0110.0000.0050.019−0.0050.040−0.0120.000−0.0150.000
TO0.3420.0000.3030.0000.2370.0010.1890.0120.1640.051
GF0.0000.2200.0000.2140.0000.3110.0000.5200.0000.656
FDI2.2450.0001.9720.0001.5150.0001.1900.0041.0140.029
_cons64.7970.00032.2630.00122.0970.03760.8250.00081.7900.000
Table 7. DKSE (Driscoll–Kraay Standard Errors) method (dependent variable: RE).
Coefficientp-Value
EG1.4640.033
OP0.0640.016
ER−0.0040.058
TO0.2450.059
GF0.0000.459
FDI1.5700.036
Intercept15.5680.039
Disclaimer/Publisher’s Note: The statements, opinions and data contained in all publications are solely those of the individual author(s) and contributor(s) and not of MDPI and/or the editor(s). MDPI and/or the editor(s) disclaim responsibility for any injury to people or property resulting from any ideas, methods, instructions or products referred to in the content.

