1. Introduction
Data centers have evolved into an essential component of the modern digital age, serving as critical infrastructure for massive amounts of data that must be processed, stored, and managed. Because of their critical significance, they have developed a reputation for excessive energy consumption and considerable carbon footprints, primarily due to cooling requirements. This is evidenced by the fact that cooling systems are exceedingly expensive to operate and cause significant environmental damage, necessitating energy-efficient and sustainable solution approaches in data centers.
The geographical location is an important component in determining the efficiency of data center cooling. Energy usage is heavily influenced by the location’s geography, climate, and temperature. Data centers placed at higher altitudes in colder climes use less energy for cooling, resulting in lower carbon emissions and operating expenses. These findings highlight how site selection is a critical component in ensuring data center sustainability and efficiency.
The main purpose of this research is to solve the problem of data center site selection using MCDM approaches. In this work, q-Rung Orthopair Fuzzy Numbers are used to make decisions while keeping sustainability and energy efficiency in mind. The parameters for consideration include technology infrastructure, safety, manpower availability, altitude, average temperature, accessibility, disaster risk, and land cost. Decision makers (DMs) evaluate these factors in language terms, and the results are transformed into q-ROFNs for analysis.
This study’s options include seven renowned ski resorts in Turkey: Sarıkamış, Kartalkaya, Yedikuyular, Ilgaz, Palandöken, Uludağ, and Erciyes. These locations are examined using the TOPSIS and VIKOR methodologies, two popular MCDM techniques, to rank the possibilities in order of suitability for data center installation.
There are numerous technical solutions available to assist individuals and corporations with their decision-making processes. Examples include decision trees, game theory, linear programming, statistics, artificial intelligence, simulation, and multi-criteria decision-making. Among them, researchers typically prefer the MCDM method because of its broad applicability and simple computation processes. Research has been conducted on a variety of topics, including Green Supplier Selection [
1], Technology Selection [
2], University Ranking [
3], Agricultural Production [
4], Best Enterprise Resource Planning (ERP) Selection [
5], and Sustainable Site Selection [
6].
The following studies have investigated the data center location selection problem: [
7] tackled the sustainable data center location selection problem using the Best–Worst Method (BWM). The authors of [
8] examined the data center location selection problem using a dynamic mathematical modeling technique. The authors of [
9] used the Preference Ranking Organization Method for Enrichment Evaluation (PROMETHEE) approach to study data center location selection in China, taking into account economic, meteorological, and environmental considerations. The authors of [
10] investigated data center location selection in Turkey using the Fuzzy Decision-Making Trial and Evaluation Laboratory (DEMATEL) and Evaluation Based on Distance from Average Solution (EDAS) algorithms. Their study assessed all 81 Turkish provinces using five major criteria: disaster risk, energy availability, accessibility, climate, and quality of life. The authors of [
11] aimed to develop a sustainable evaluation index for large data centers, utilizing the Analytic Network Process (ANP) and TOPSIS methods with a total of 17 criteria.
Studies utilizing q-ROFs for location selection include [
12], who applied q-ROFs to the renewable energy source selection problem using the DEMATEL and TOPSIS methods. The authors of [
13] explored hospital location selection for patients with chronic diseases using the q-ROFs approach. The authors of [
14] examined emergency room facility location selection through the TOPSIS method under the framework of q-ROFs. The authors of [
15] investigated the application of q-ROFs in the education sector using the DEMATEL method. A study by [
16] researched finding the best location for a data center in Egypt. To better handle uncertainty in expert evaluations, the authors adopt the Single-Valued Neutrosophic Set (SVNS) approach and integrate it with Entropy, TOPSIS, and Multi-Attributive Border Approximation Area Comparison (MABAC) methods. Ten cities are ranked on ten attributes, and expert opinions are used to determine the weights of these criteria. The cities are then ranked using both the TOPSIS and MABAC methods, and the consistency of the results is assessed through comparison. This study [
17] proposes a novel dynamic Virtual Machine (VM) consolidation strategy aimed at improving energy regulation and credibility in cloud data centers. The authors introduce a hybrid model that uses Discrete-Time and Continuous-Time Markov Chains (DTMC and CTMC) for predicting server load and reliability. A multi-objective optimization is then performed using an enhanced Artificial Bee Colony (e-MOABC) algorithm to minimize energy consumption, reduce resource wastage, and maximize system reliability. The article by [
18] offers a comprehensive review of high-temperature data center technologies and their potential for improving energy efficiency. The study explores the benefits of operating data centers at elevated temperatures, such as increased free cooling potential, enhanced chiller efficiency, broader site selection, and improved waste heat recovery. It also analyzes the key limitations and challenges—particularly regarding the reliability of server components like HDDs and CPUs under higher thermal conditions. Finally, some recent studies have introduced diverse and robust decision-making frameworks to address complex site selection problems across various domains. The authors of [
19] developed an integrated model combining numerical hydrodynamic simulations, MCDM techniques, and Bayesian Networks extended to Influence Diagrams to determine optimal offshore locations for Wave Energy Converters, emphasizing criteria such as power generation capacity and structural reliability under extreme conditions. Similarly, Ref. [
20] proposed a hybrid methodology incorporating fuzzy logic, AHP, GIS, and the fuzzy information axiom to select suitable solar power plant sites in Turkey, with Mersin emerging as the top candidate after evaluating multiple environmental and economic criteria. Complementing these approaches, Ref. [
21] introduced a simulation-guided decision support model for disaster recovery center selection, utilizing anyLogistix software and a grand scale group decision-making framework that integrates interval-valued semantic information and prospect theory. Collectively, these studies demonstrate the increasing reliance on hybrid, uncertainty-aware MCDM models for strategic infrastructure planning in the energy and logistics sectors.
A review of the literature shows that q-ROFs have been employed within the scope of MCDM since 2020. Moreover, extensive research has been conducted on both ‘site selection’ and ‘q-ROFs.’ While ‘fuzzy’ facility location selection problems have been considered for a long period, q-ROFs have not yet been explored in the context of data center location selection. Therefore, this study represents a pioneering effort in this domain.
In today’s world, data centers are as important as crucial industries like defense and medicine. The timely gathering, protection, and transfer of data are critical issues. Meanwhile, global environmental developments force states to make critical decisions in this area. Data centers, by definition, are networks of continuously working equipment, resulting in a constant demand for energy. One of the most critical concerns in data centers is maintaining adequate and continuous cooling of these equipment to avoid system faults or shutdowns.
In this context, building data centers in strategic locations is required to meet the energy demands for machine operation and cooling. Ski resorts are considered possible candidate locations for data centers because of their high altitude and existing infrastructure, which includes transportation amenities, utilities, and safety. The study intends to contribute to environmental sustainability by proposing energy-efficient data center location selection criteria.
In conclusion, this study presents several innovations and fills a significant gap in the literature. The data center location problem has not previously been examined at the ski resort scale. While data center location selection has been studied in various fuzzy environments, such as Intuitionistic Fuzzy Sets (IFs) and Pythagorean Fuzzy Sets (PFs), it has not yet been explored in the q-ROFs environment. The cold climates of ski resorts can significantly reduce cooling-related energy costs, aligning with the objective of promoting a sustainable environment.
2. Methodology
In this chapter, the fundamental elements of the study will be explained under specific headings. First, fuzzy sets will be present, followed by the weighting of the criteria. Finally, the TOPSIS and VIKOR methods employed for ranking the alternatives will be discussed.
2.1. Fuzzy Sets
At this point, the chronological evolution of fuzzy sets and their fundamental differences will be discussed.
Fuzzy sets (
Fs): A fuzzy set
Λ in the realm of expression
is a collection of ordered combines:
where
is the membership level, Fuzzy sets introduced by [
22].
Intuitionistic Fuzzy Sets (
IFs): An intuitionistic fuzzy set
Λ in
X can be described as follows:
where the functions
and
shows membership level and non-membership level of x, correspondingly, [
23].
Pythagorean Fuzzy Sets (
PFs): Pythagorean fuzzy sets membership level combination of numbers
such that
as come behind:
, where
, membership level of x in
and
the non-membership level of x in
, [
24].
q-Rung Orthopair Fuzzy Sets (
q-ROFs): Fuzzy sets
of
given as
where
shows membership level and
shows a non-membership level of
with the status given:
, [
25].
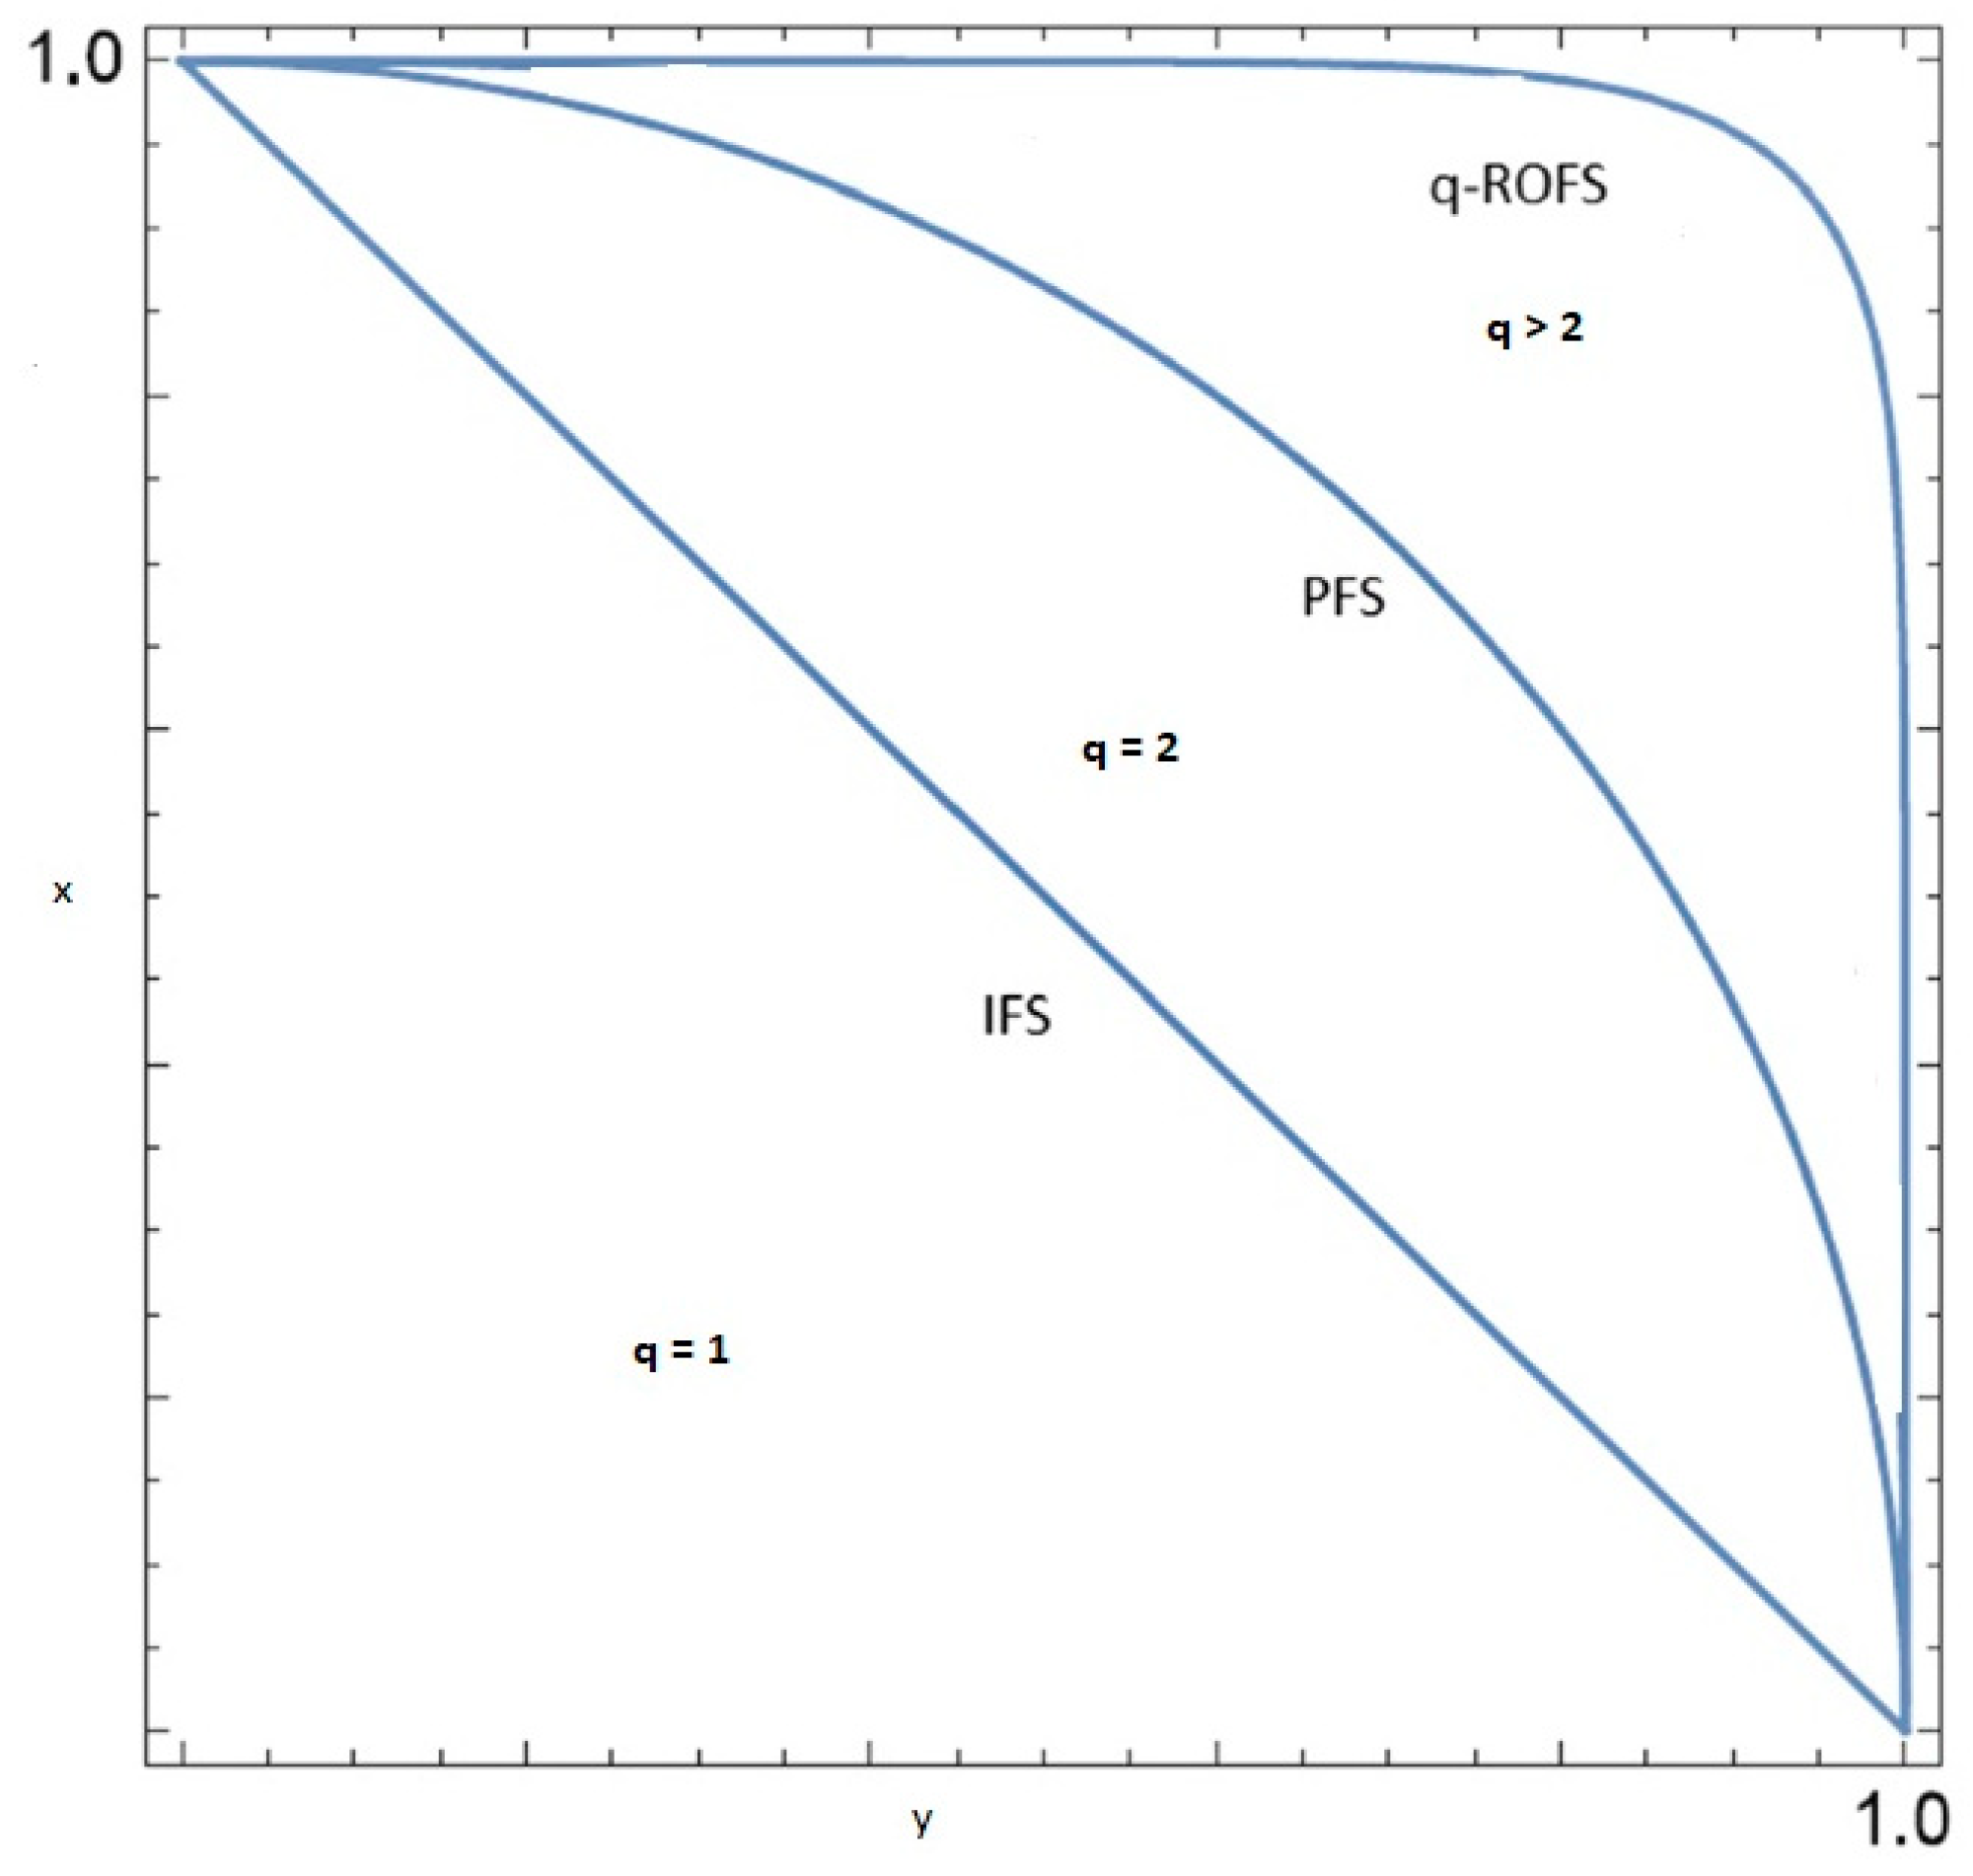
Figure 1 represents the compression of different fuzzy sets.
The visual presented in
Figure 1 illustrates fuzzy sets at different
q levels. It demonstrates that when
q = 1, the sets correspond to IFs. When
q = 2, they represent PFs, and for all values where
q > 2, they are classified as q-ROFs. This figure demonstrates that q-ROFs allow for more flexible decision-making than other fuzzy sets.
2.2. Criteria Weighting
As indicated in the introduction, eight distinct characteristics were identified as being of strategic importance in the data center location selection dilemma, particularly for ski resorts. Interviews were conducted with three separate independent decision makers (DMs) to assess the influence and weight of these factors. The DMs were requested to assess the factors using the linguistic scale table provided in
Table 1 below.
Calculation of criteria weights is provided below:
represents membership level;
represents non-membership level;
, shows set of criteria;
, shows set of decision makers weights, where .
Then, the first three procedures were followed as outlined in the TOPSIS
Section 2.3. below to compute the criteria weights using Equation (1). Following this phase, the TOPSIS and VIKOR procedures will be explained.
2.3. Ranking of Alternatives by TOPSIS
TOPSIS is an MCDM method for finding the best alternative from a given collection of possibilities. It was designed to evaluate and rank options according to their proximity to the ideal answer and distance from the negative solution. This method compares alternatives to both positive and negative ideal solutions in order to estimate their relative proximity. The implementation stages for q-ROF TOPSIS are described in detail below:
Step 1. Create a decision matrix using linguistic data collected from decision makers for alternatives and criteria. The list of alternatives, criteria, and decision makers is provided below.
, represent set of alternatives.
, represent set of criteria.
, shows set of decision makers weights, where .
Table 1 shows the linguistic scale, which is also employed by Alkan and Kahraman 2021, provided below (µ: membership level and ν: non-membership level).
Step 2. Convert linguistic variables as µ and ν pairs to obtain a numerical decision matrix.
Step 3. Calculate the aggregated decision matrix by using Equation (1) provided below.
where q-ROFWG: q-rung orthopair fuzzy weighted geometric operator.
be set of q-ROFNs,
is a value that increases ambiguity and flexibility for decision makers.
Step 4. Calculate the aggregated decision matrix for criteria by using Equation (1).
Step 5. Calculate the weighted aggregated decision matrix by using Equation (2).
where
a set of q-ROFN.
Step 6. Normalize the weighted aggregated decision matrix by using Equation (3).
Let
be normalized q-ROF decision matrix
Step 7. Determine q-ROF positive ideal solution (q-ROFPIS) and q-ROF negative solution (q-ROFNIS) using Equations (4) and (5).
where
is the score function of q-ROFN and
Step 8. To obtain the separation measures, calculate the distances for each alternative based on positive ideal
and negative ideal solutions
. Then, calculate the distances between each alternative by using Euclidean distance functions (6) and (7), provided below.
Step 9. To calculate the relative closeness coefficient
of alternatives use Equation (8).
Step 10. Rank alternatives based on final scores and select an alternative that has the best value.
2.4. Ranking of Alternatives by VIKOR
VIKOR (Vlsekriterijumska Optimizacija I Kompromisno Resenje) is a compromise-ranking method designed to determine the most appropriate alternative by evaluating its closeness to an ideal reference point. It considers the trade-offs between conflicting criteria and provides a ranking that reflects a balance between group utility and individual regret. In this study, VIKOR is integrated with q-ROFs to enhance decision-making under uncertainty, allowing for a more flexible and realistic evaluation of alternatives. Now, the solution steps are provided below:
Step 1. The first four steps used the same approaches to create a weighted decision matrix, similar to the TOPSIS method;
Step 2. Determining best and worst values of criteria. The best and worst criteria are calculated using Equations (9) and (10).
Step 3. Determination of separation measures. Equations (11) and (12) are used to calculate
and
values, respectively.
Step 4. The distances between Q-ROFs are calculated as the Euclidean formula using Equation (13).
Step 5. Computing the merit function. The merit function
of each alternative is computed by using Equation (14).
where
is the strategy of DMs. In this study,
is taken as 0.5.
Step 6. Rank the values from smallest to largest.
3. Case Study
In Turkey, there are more than 20 ski resorts of various sizes. In this study, the ski resorts chosen as alternatives were selected based on Turkey’s population density (and consequently internet usage density), the size of the ski resorts (annual visitor numbers, slope lengths, etc.), and the infrastructure facilities of the cities where the ski resorts are located.
The criteria used in the study consist of the criteria found in the literature on ‘data center site selection’ problems. While some economic and environmental criteria were used by [
8], the criteria of natural disasters, climate, energy, and accessibility were used by [
10]. At the same time, some of these criteria have also been used in studies [
7,
9,
16]. Both the technology infrastructure, average temperature, accessibility, disaster risk, and land cost criteria I have referred to so far, as well as the security, available workforce, and elevation criteria outside of these, have been included in the study based on expert opinion.
The expert weights used in the study (assumed to be equal in this study) were determined by considering the experts’ years of experience and positions in the professional field. On the other hand,
q = 4 was initially accepted randomly, but during the sensitivity analysis phase, the model was run at different
q levels. The linguistic scale used in the study was employed by [
25]. After this stage, the problem and solution steps are explained below.
Table 2 represents DMs’ linguistic ratings between criteria and alternatives. Every single consideration by DM includes a pair of (µ and ν). For instance, INS shows 0.11 and 0.99 values, respectively. After all linguistic terms are converted to numerical values, an aggregated decision matrix is calculated by using Equation (1) and provided in
Table 3.
The independent evaluations acquired from three distinct DMs will be combined in this step of the study using Equation (1). The goal here is to communicate the opinions of DMs with varying experiences in the same field in one evaluation. DM weights have taken 0.33–0.33 and 0.34, respectively, for this problem.
At this stage, the weighted aggregated decision matrix will be obtained by using the criteria weights. The weighted aggregated decision matrix is calculated by using Equation (2) and provided in
Table 4.
Obtaining the normalized decision matrix is possible by keeping the benefit-based criteria as they are and swapping the cost-based criteria pairs (µ and ν). The normalized decision matrix was obtained with the help of Equation (3) and is given in
Table 5.
After this stage, we can illustrate the TOPSIS and VIKOR steps, respectively.
3.1. TOPSIS Solution
Maximizing a benefit-based criterion requires positive ideal solution logic while minimizing a cost-based criterion requires negative ideal solution logic. Positive ideal solutions (PISs) and negative ideal solutions (NISs) were generated using Equations (4) and (5).
Table 6 shows the PIS and NIS results.
Positive and negative distances are computed by using the normalized decision matrix and positive–negative ideal solutions. Then, the closeness coefficient
and rankings are obtained with the help of these distances. Distance measures by Equations (6) and (7), closeness coefficient by Equation (8) and the ranking from biggest to smallest provided in
Table 7.
3.2. VIKOR Solution
The best and worst criteria values are calculated with the same logic as the TOPSIS method. If the criterion is benefit-based, the largest value is selected. If it is cost-based, the smallest value is selected. The best and worst criteria are calculated using Equations (9) and (10). The results are provided in
Table 8.
The distance matrix is calculated by evaluating the best and worst ideal solutions together. Distance measures are calculated by Equation (13) and provided in
Table 9.
Separation measures are calculated by using Equations (11) and (12), merit function by Equation (14), and ranking of alternatives and provided in
Table 10.
5. Conclusions
In this section, the results are thoroughly examined, beginning with the observation that ranking outcomes varied between approaches. In these types of decision-making challenges, data are often gathered using two methods: surveys and expert opinions. Both methodologies imply some degree of subjectivity, which is the first detailed aspect of this examination.
In this study, expert weights were considered to be equal, taking into account their years of experience and present professional positions, with each expert allocated a weight of one-third. However, adjusting these weights could potentially modify the ranking results.
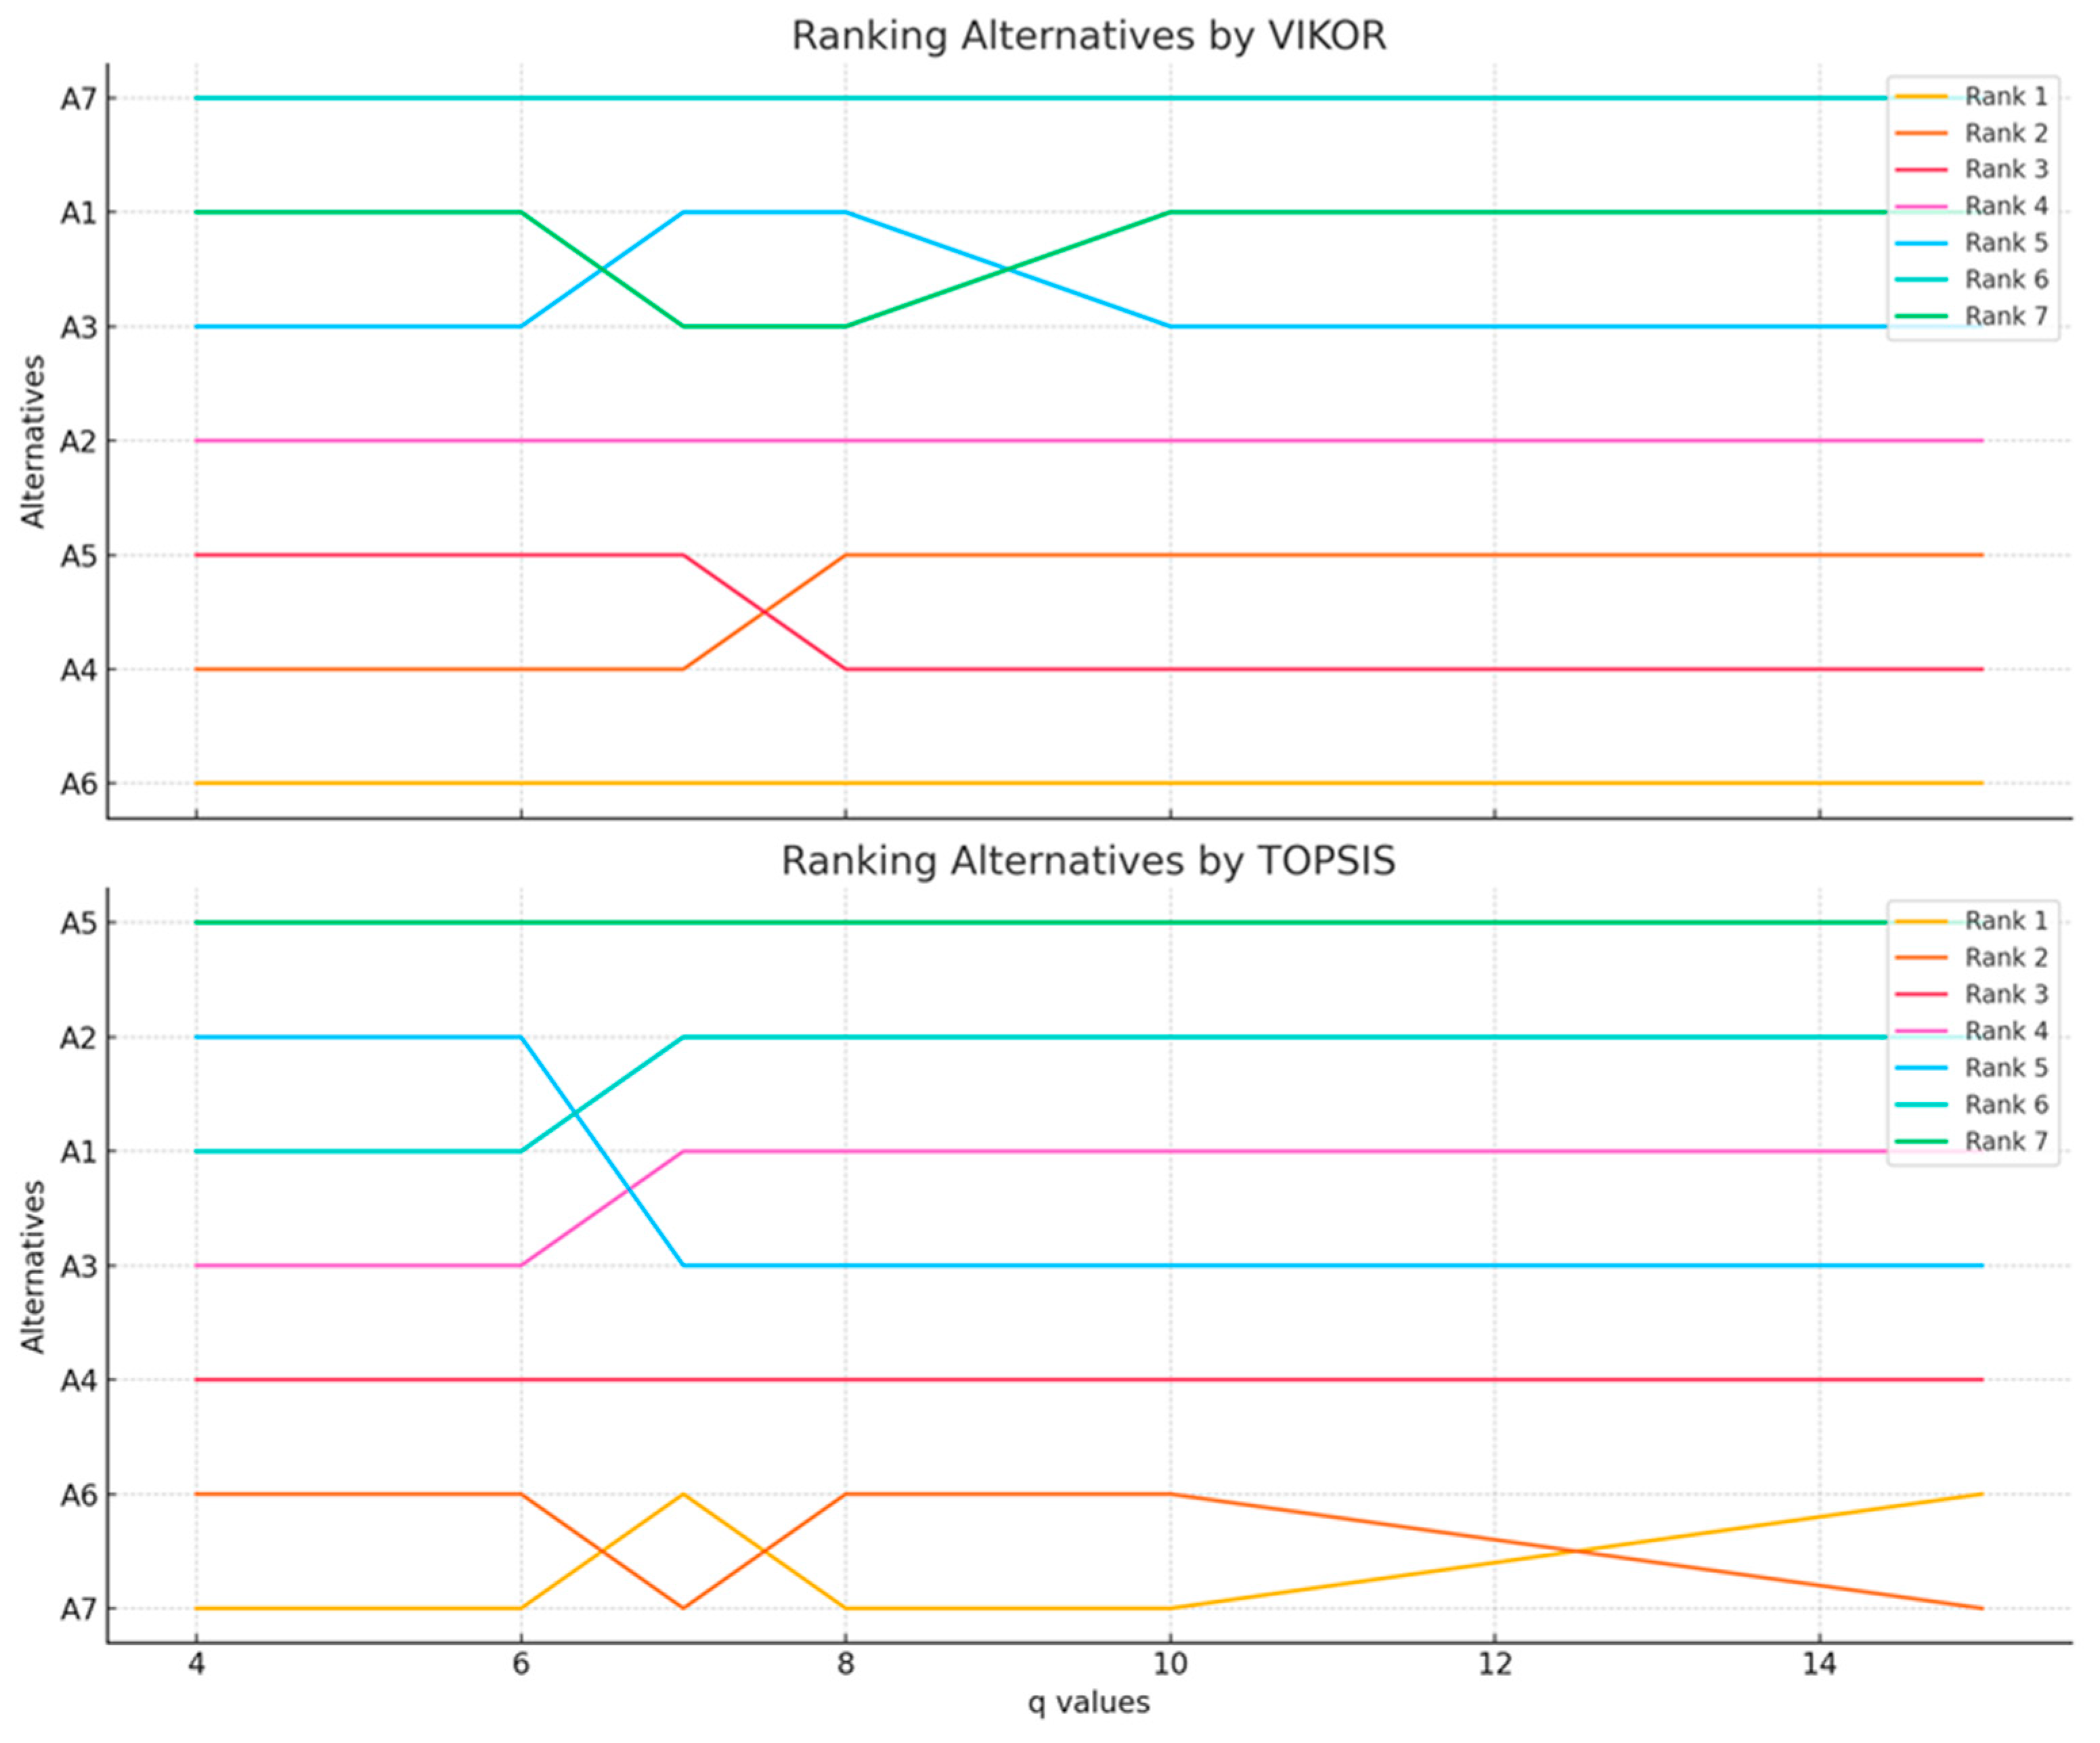
Additionally, the q value utilized in building the aggregated decision matrix for both approaches was set to 4. Modifying this parameter may result in various ranking outcomes. Similarly, with the VIKOR technique, as shown in
Table 10, the v value was set to 0.5. Adjusting this parameter may also have an impact on the final rankings.
Among the evaluated locations, the sites that best meet positive impact criteria—such as infrastructure quality, safety, workforce availability, altitude, and accessibility—are Uludağ, Erciyes, and Palandöken, in that order.
5.1. A Comparative Analysis Across Methods
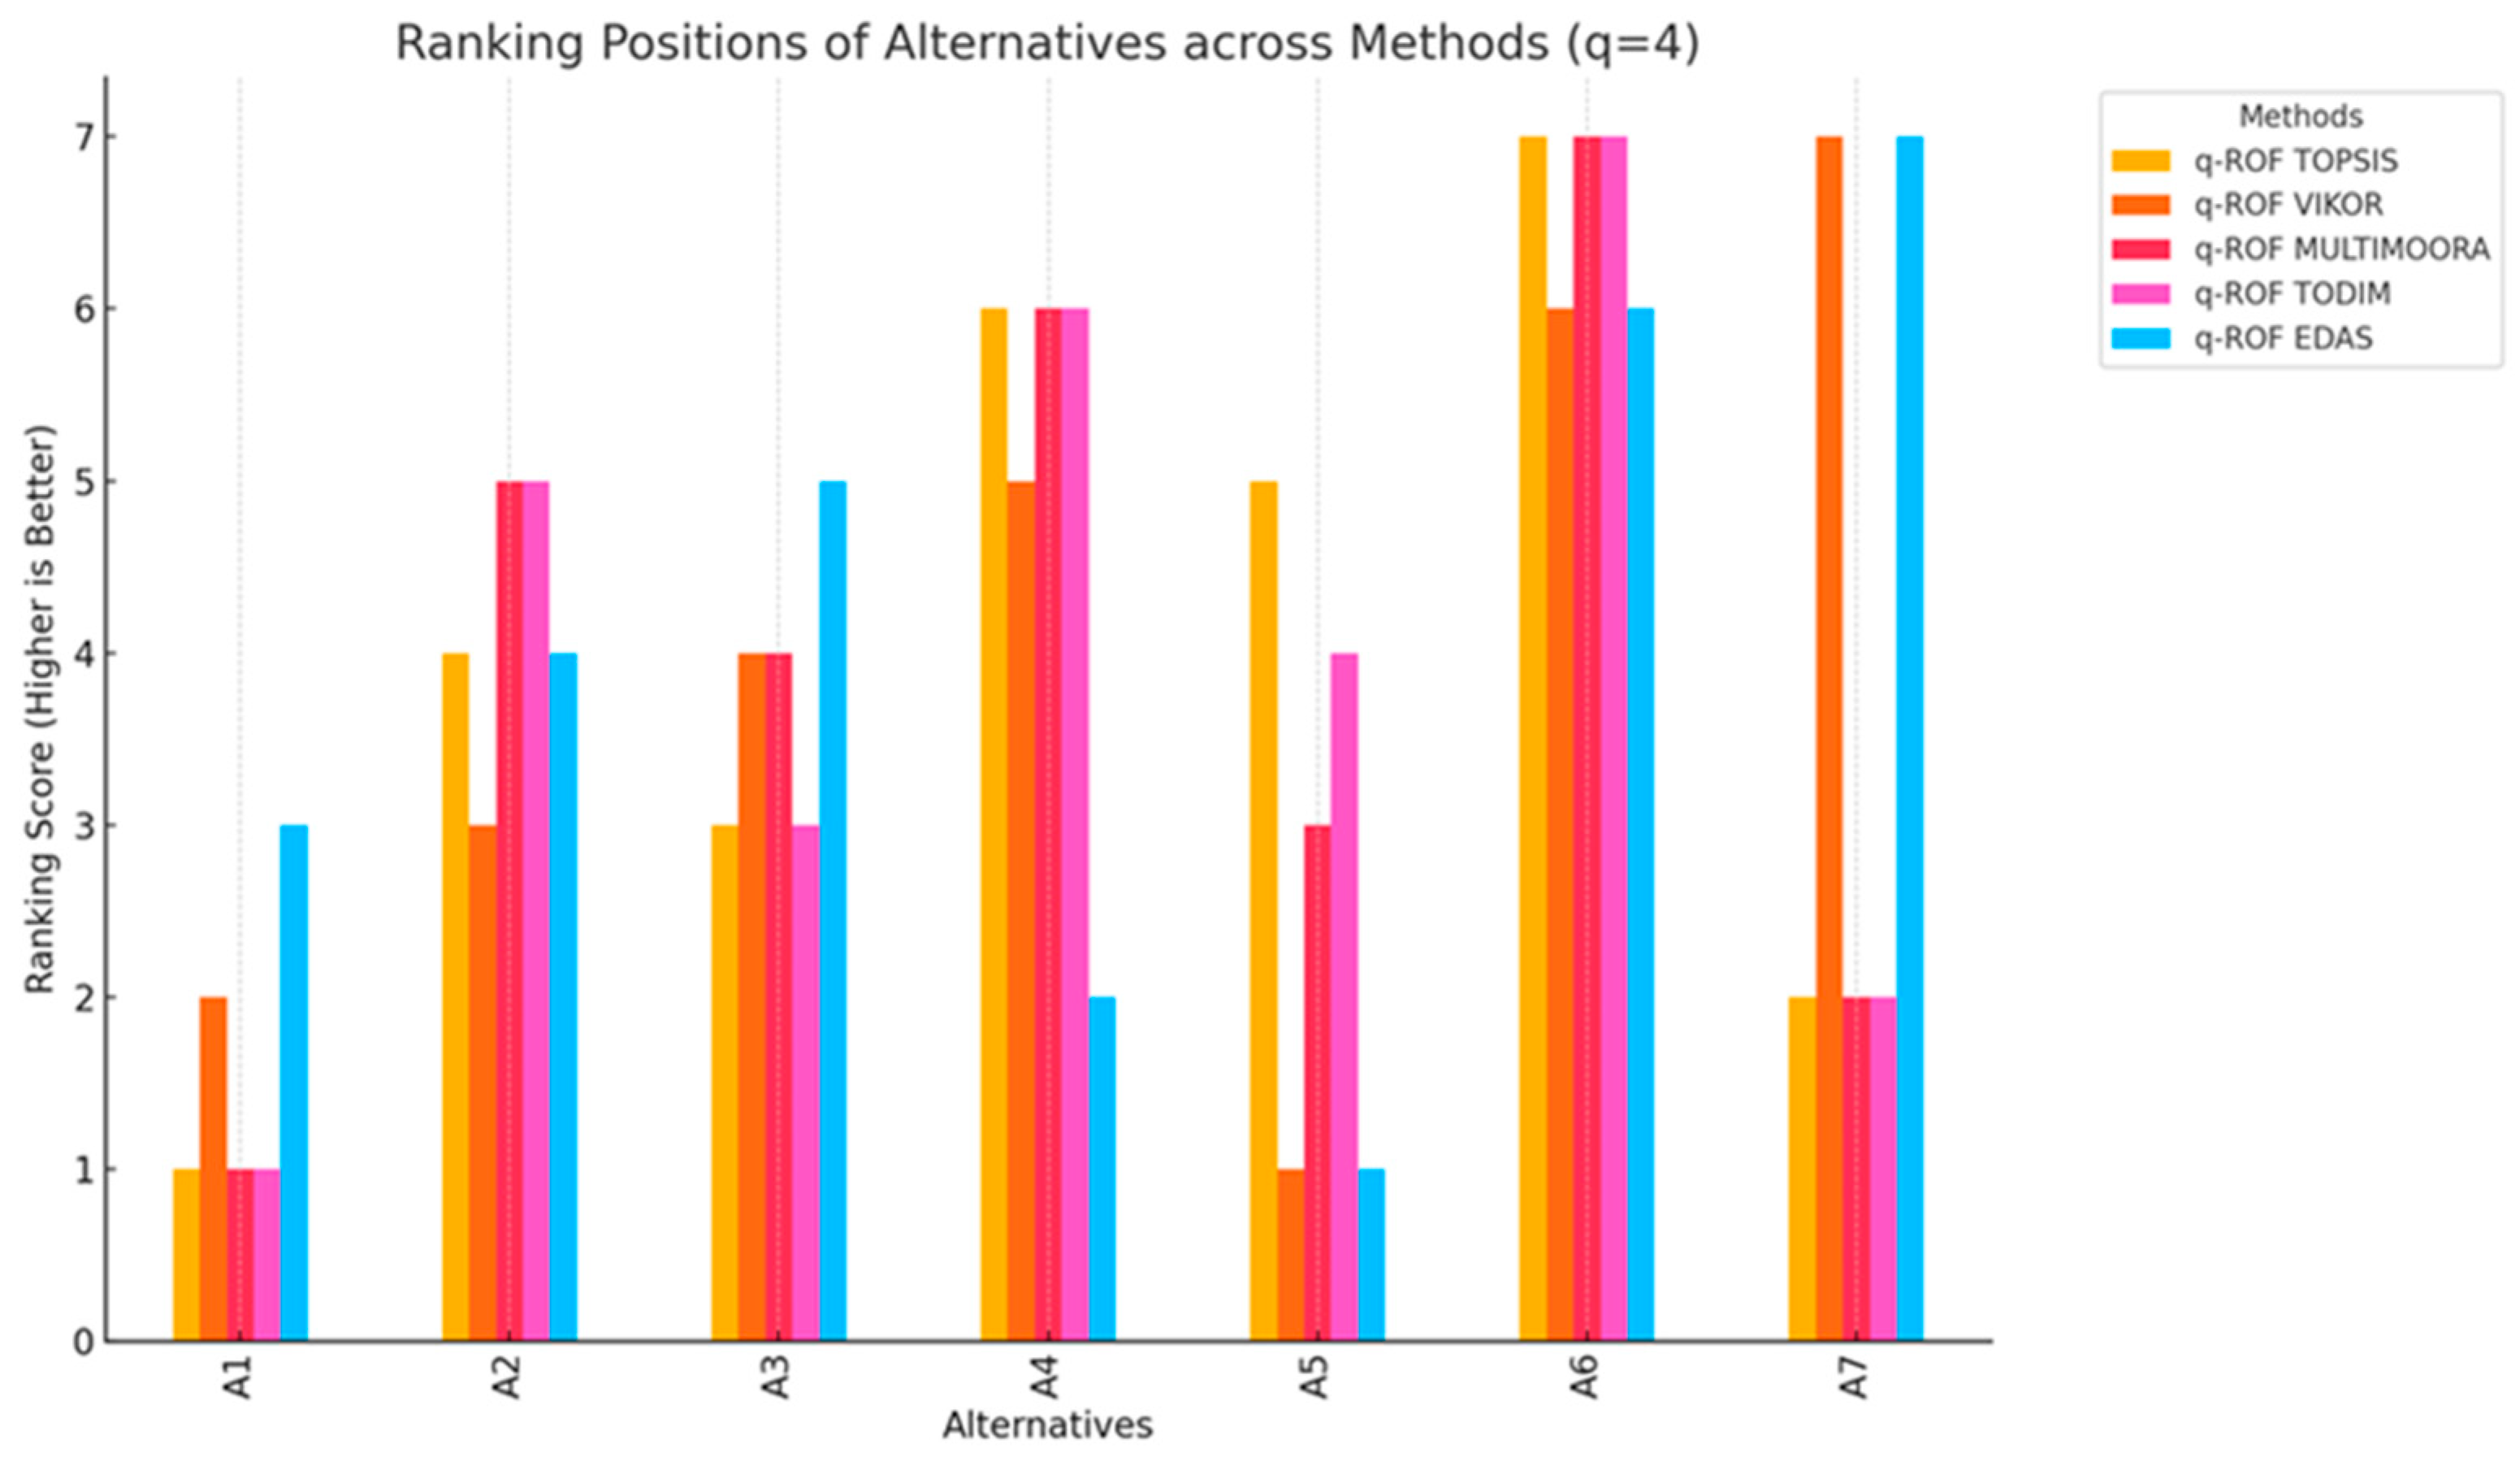
To enrich the decision-making process and improve result reliability, five different q-ROF-based MCDM methods were employed: TOPSIS, VIKOR, MULTIMOORA, TODIM, and EDAS. Each method reflects a different prioritization philosophy, ranging from ideal closeness (TOPSIS) to compromise solutions (VIKOR) and dominance relations (EDAS).
Figure 3 illustrates the ranking scores for each alternative across all five methods. Higher scores reflect more favorable rankings. The results show that Erciyes (A6) consistently receives top scores across all methods, indicating strong consensus on its suitability. Uludağ (A4) and Palandöken (A7) also perform well, though their scores show some variability. In contrast, alternatives such as A1 and A5 received low rankings across the board.
This comparative visualization confirms the robustness of the leading alternatives and supports the use of multiple MCDM techniques to validate decisions under uncertainty.
5.2. Future Directions
This research seeks to locate climatically favorable places that reduce the energy consumption of data centers, which require significant cooling resources. As a result, it contributes to the broader field of sustainability, in line with the United Nations’ aims.
However, none of the criteria used in this study explicitly analyze the ‘energy count’. The precise scientific calculation of energy usage and its net contribution to sustainability is the purview of another study topic. Future studies could be improved by cooperating with academics who specialize in energy studies to provide a more comprehensive assessment of net energy use.
Finally, this work suggests various options for future investigation. Future studies could investigate different expert weighting methods, modify q and v values, incorporate more cost-oriented criteria, or use classic decision-making methodologies to compare with q-ROF-based approaches.


