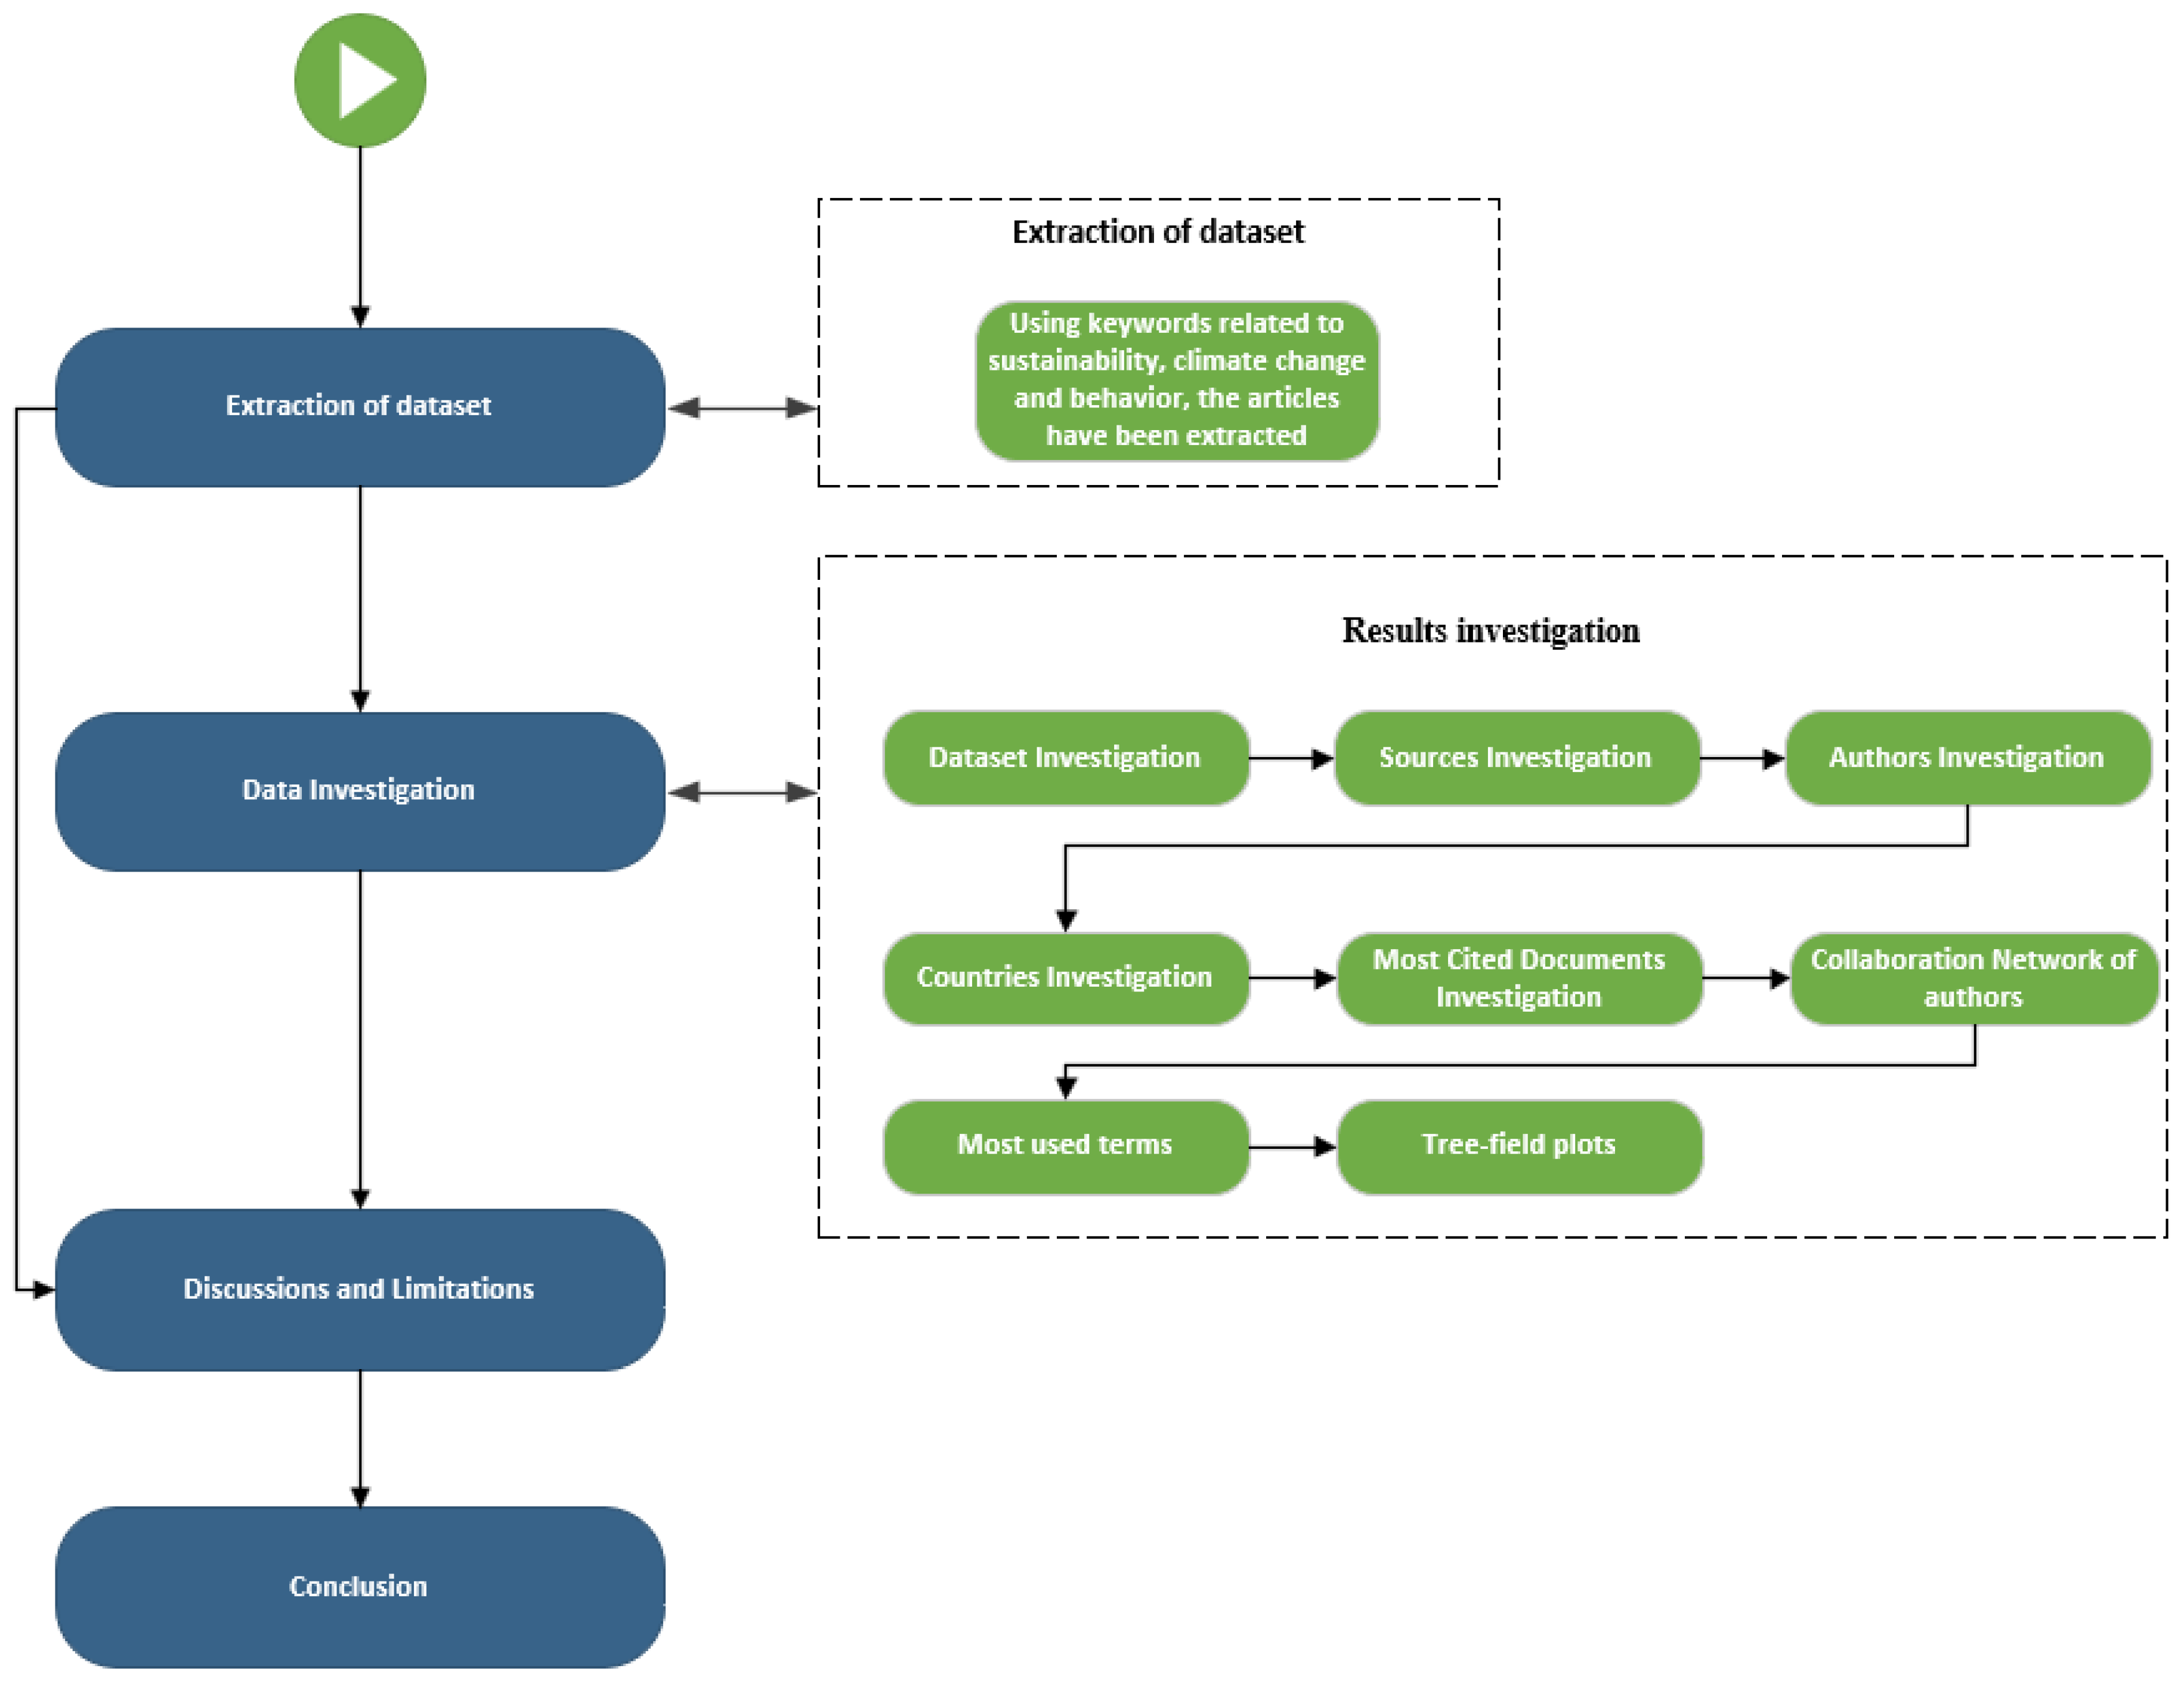
The third section explores the dataset from multiple perspectives: initially, an overview of the papers is the focus, followed by sources, authors, countries, most cited documents, keywords, and collaboration networks.
3.1. Dataset Overview
This section explores the dataset, describing the total number of documents, sources, and references, together with the types of papers, number of keywords plus, or author’s keywords.
Table 2 details the main information of the dataset. The extracted papers are from between 1975 and 2024, with a total of 1321 articles and 608 sources, which shows the interest of the researchers with an annual growth rate of 6.68%, as the Biblioshiny library presented [
53].
The average number of citations per document is very high, 32.86, while the average number of citations per year per document is 2.99, with an average year from publication of 11.
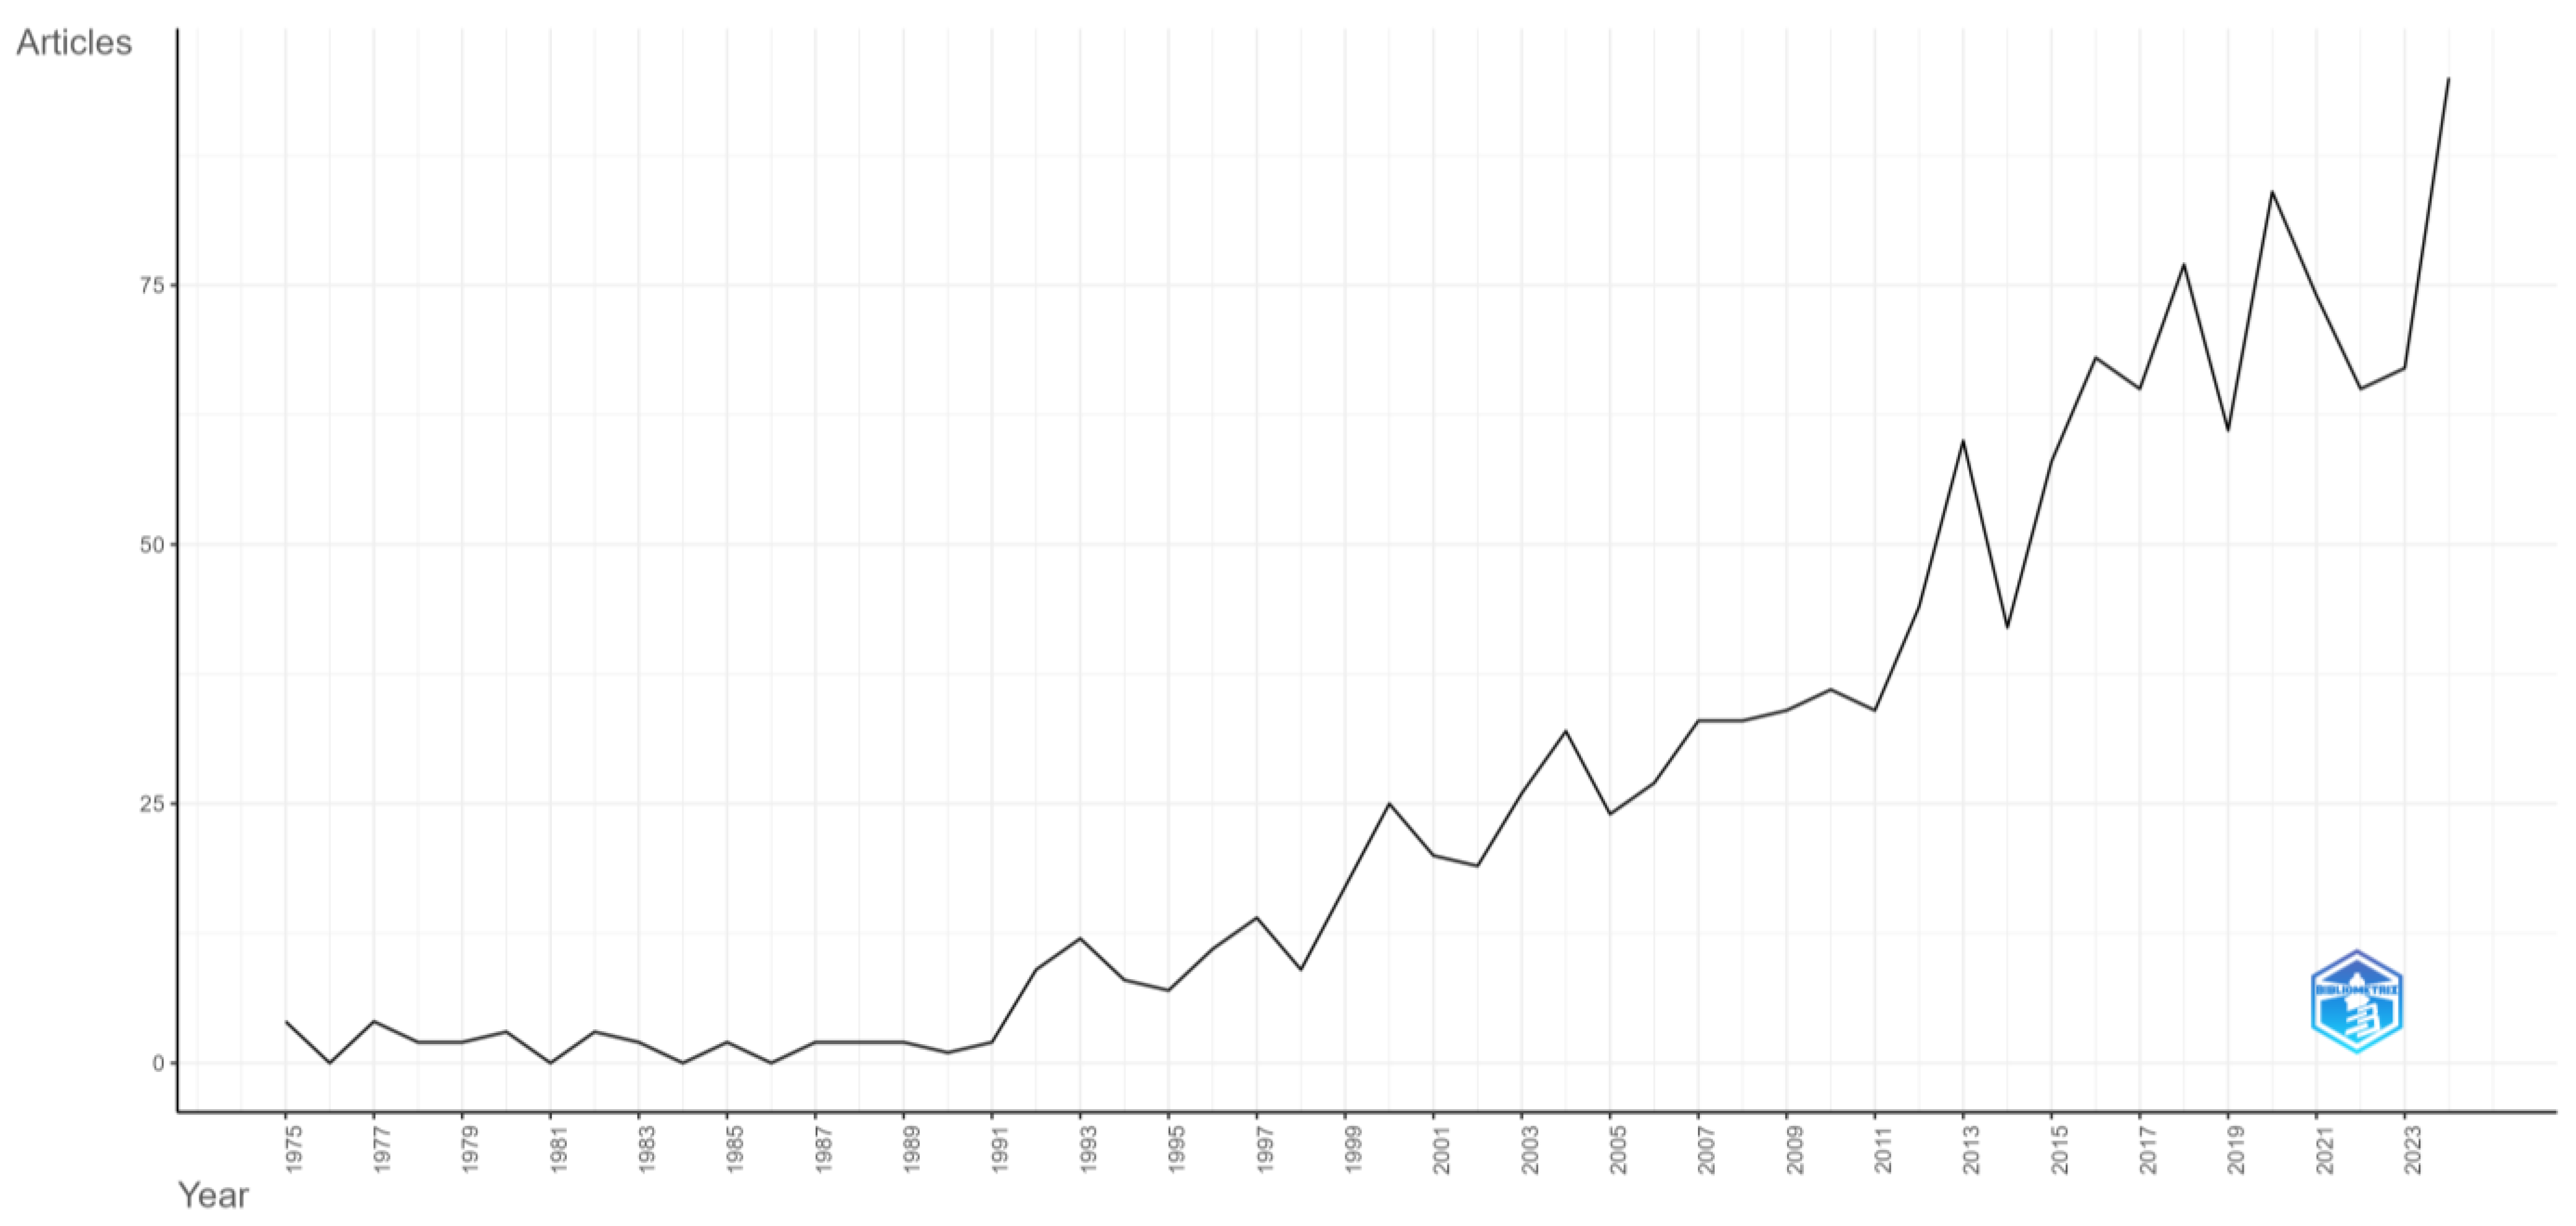
Figure 2 displays the evolution of scientific production in the area of sustainability, decision-making, and behavioral shifts between 1975 and 2024, showing the positive trend regarding the interest of the researchers. The first four papers were published in 1975, while the next papers were released in 1977. Until 1992, production was reduced, with values between 0 and 4. Starting with 1992, the number of articles grew to 9, and in 1993, it was 12. The trend is positive but with spikes in some periods of time when production decreased, such as in 2005 or 2014, when 24 and 42 articles were released. In 2024, the peak was achieved with a total of 95 articles published.
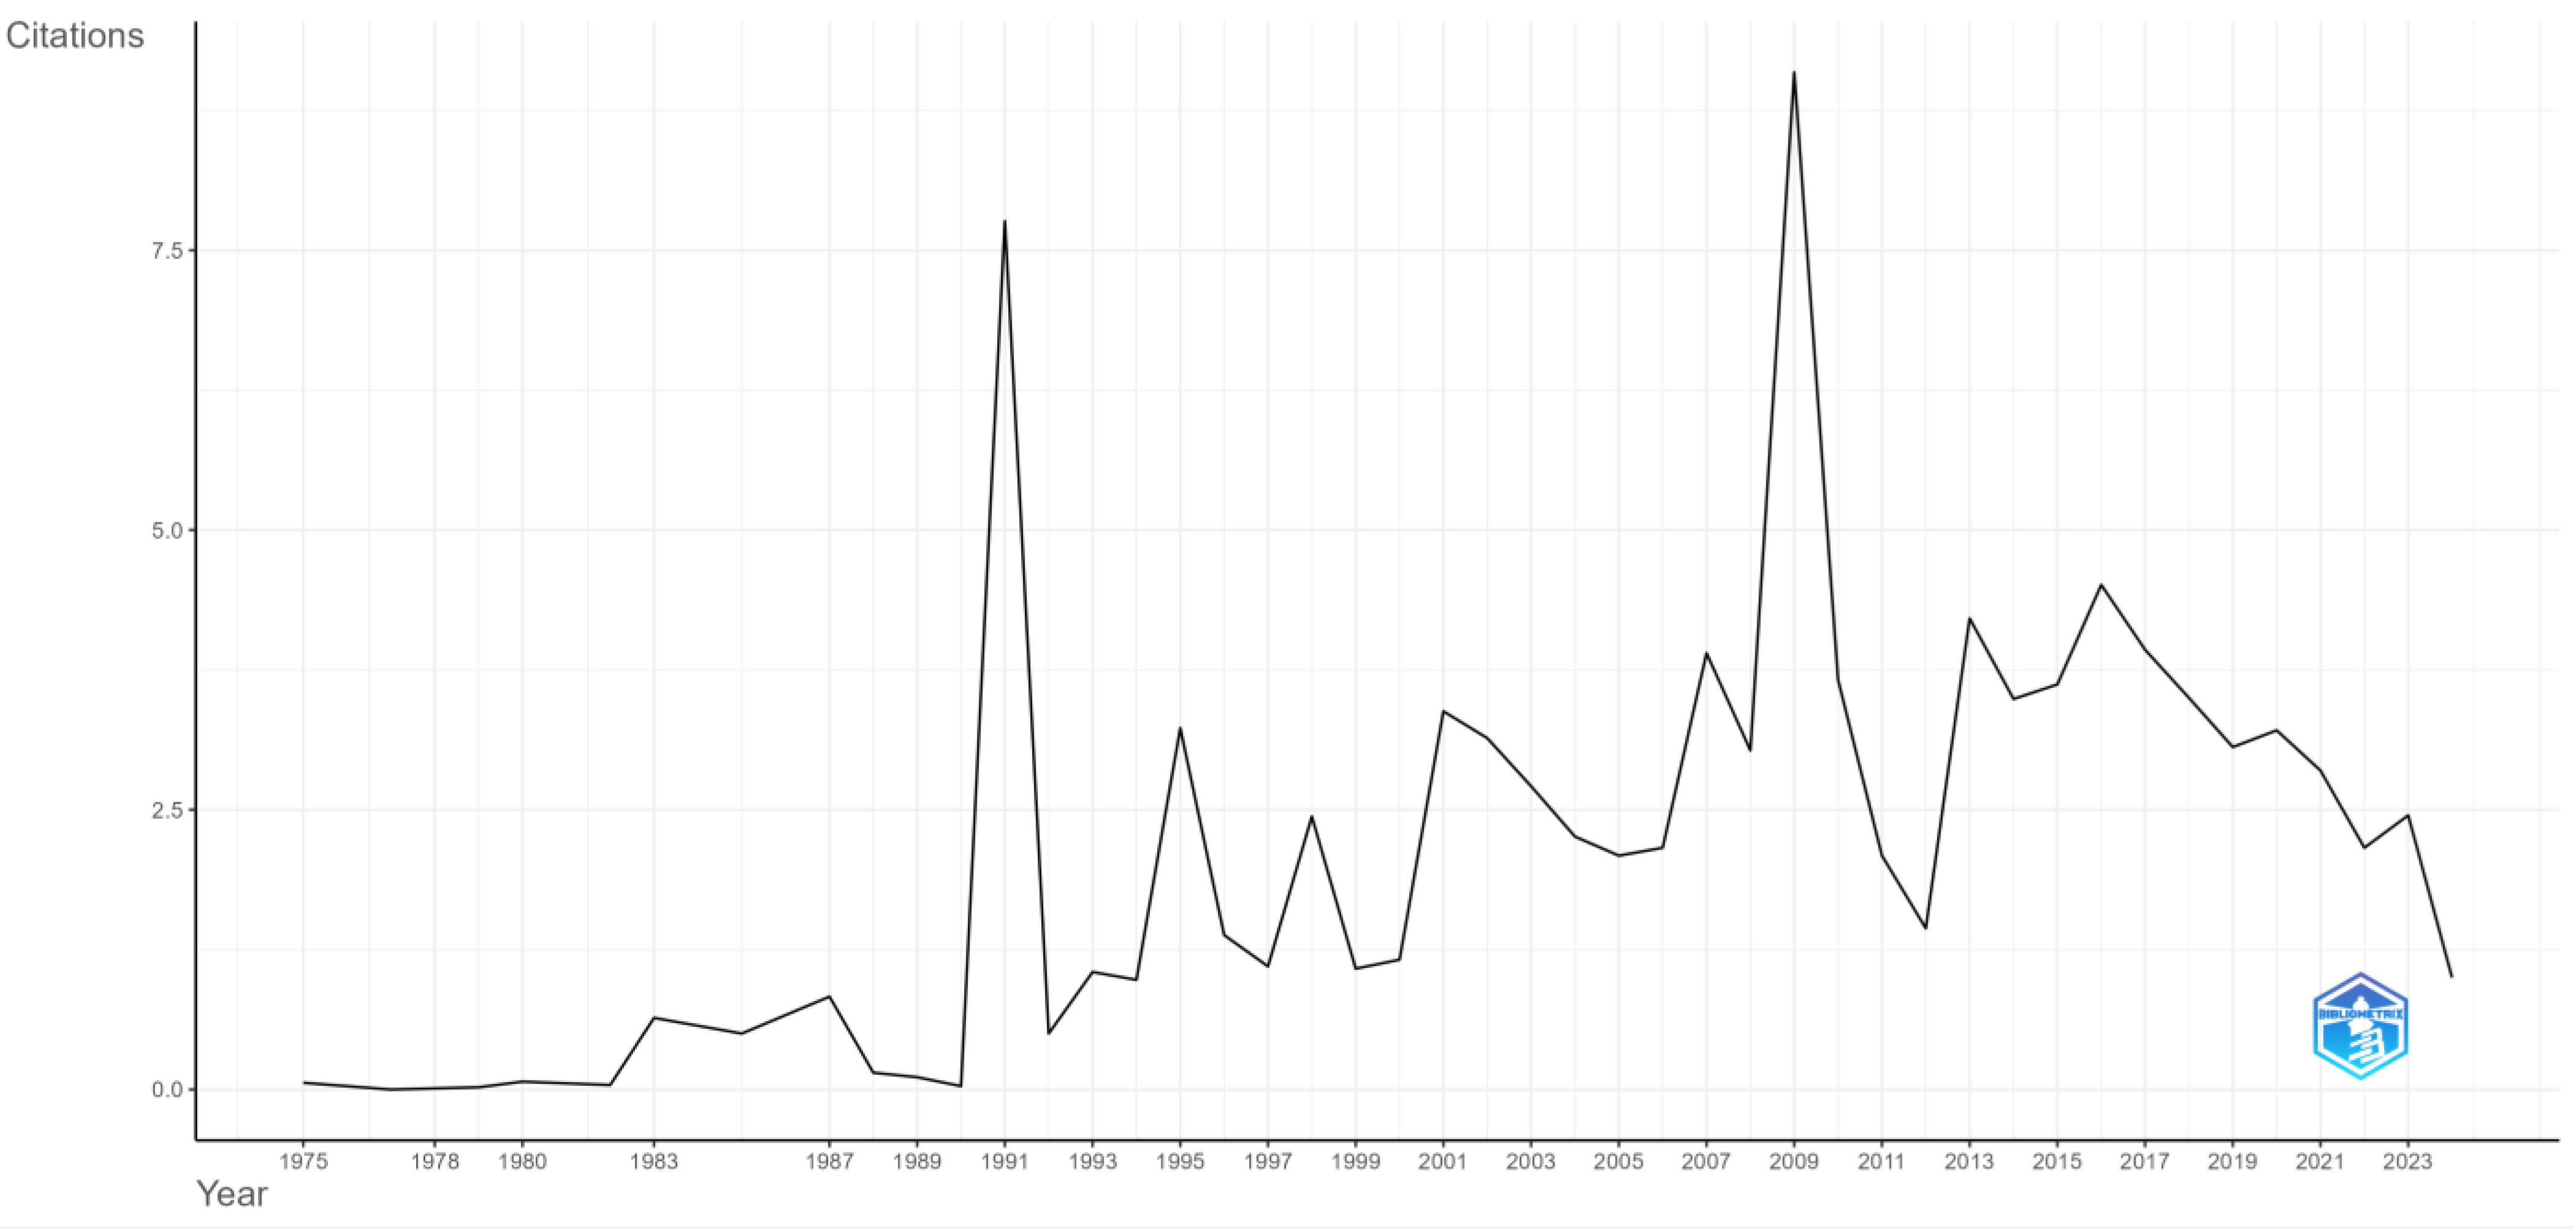
Figure 3 details the yearly average citations. Contrary to the previous figure, the trend is not positive, with numerous spikes that show a high volatility, which could be correlated with the first steps of the research in behavior shifts, sustainability, and decision-making.
The papers published in 1975 have an average citation per year of only 0.1, and until 1983, the value was 0. The second most significant spike appeared in 1991, with an average citation per year of 7.8, when Lubchenco et al. [
54] published their paper, which is also described in
Figure 3 as one of the most cited papers. In the following years, the citations dropped significantly, with a small spike in 1995 and an average value of 3.2 citations.
Until 2009, when the most important spike appeared, the citation values were between 1 and 3, but in 2009, the value was 9.1, the highest of all time, which can be explained by the publication of three of the most cited papers, which were published by Fisher et al. [
55], Prell et al. [
56], and Sachdeva et al. [
57].
Between 2009 and 2013, a strong decrease can be observed, followed by a positive trend until 2016. Starting with 2016, the trend became negative, with the minimum in 2024 having a value of one citation.
Table 3 includes the total number of keywords plus and the author’s keywords that were used by the researchers. In total, there are more author’s keywords (3785) than keywords plus (2435). As Zhang et al. [
58] explained, keywords plus and the author’s keywords are very similar, but keywords plus describes the domain in a broad way, while the author’s keywords are more specific.
Table 4 contains information related to authors, such as the number of authors and the number of single-authored documents and multi-authored documents. In total, there are 3941 authors, and 330 worked on single-authored documents, while 3611 worked on multi-authored documents. The metrics presented in
Table 4 define the nature of the collaboration, and similar papers that evaluated sustainability topics have been investigated, extracting the single-authored documents and multiple-authored documents, together with the number of authors’ keywords and keywords plus sources [
39,
59]. Gorski et al. [
39] extracted a total of 2827 documents from the ISI Web of Science database that are related to education for sustainable development and education for sustainability topics. A bibliometric analysis was conducted, and one of the main steps represented the author’s exploration. On the extracted dataset, a total of 551 authors of single-authored papers, 694 single-authored documents, and 5765 authors highlighting relevant information about researchers on the investigated topics were found. Sing [
59] analyzed sustainable agriculture in the QUAD countries, extracting the papers related to the topic from the Scopus database and using VOSViewer and Biblioshiny as tools. Among the datasets that contain information between 2002 and 2021, some of the main metrics that have been presented are the authors of single-authored documents for each country, authors of multi-authored documents, documents per author, keywords plus, and number of authors.
Table 5 details the authors’ collaboration information, presenting the number of authors per document, which is 2.98, while the co-authors per document are 3.31, and the collaboration index is 3.74. According to Aria and Cuccurullo [
53], the collaboration index is calculated as the division between total authors of multi-authored academic articles (3611 in our case) and total multi-authored documents (965 in our case), resulting in a value of 3.74. Similar papers have been assessed to compare the results. Wang et al. [
45] explored the sustainability transition using a bibliometric approach, obtaining a database with 757 documents, 1514 authors, 2115 author’s keywords, and 1507 keywords plus, with two authors per document and a collaboration network of 2.31. Comparing the results, our dataset has higher collaboration, number of authors, author’s keywords, keywords, and authors per document, most likely due to the dataset size. This is smaller (757) than the one used for this paper (1321).
The collaboration index (3.74), authors per document (2.98), and co-authors per document (3.31) collectively illustrate the interdisciplinary and collaborative nature of sustainability research. These metrics align with broader trends in environmental scholarship, where complex challenges like behavioral shifts and policy design increasingly require cross-disciplinary teams. For instance, Wang et al. [
45] reported a collaboration index of 2.31 in their bibliometric analysis of sustainability transitions, while the higher value presented in this paper reflects intensified integration of behavioral economics, environmental science, and policy expertise in this domain. By quantifying collaboration patterns,
Table 5 enables comparative analysis with prior bibliometric studies.
Table 6 contains the distribution of the articles based on their type. Most of the papers are articles, 1225, while 48 are proceedings papers, 27 are book chapters, and only 21 are early-access articles.
3.3. Authors
The third section focuses on the most relevant authors for the analyzed domains, also presenting the yearly production of the authors, together with the most important affiliations and countries.
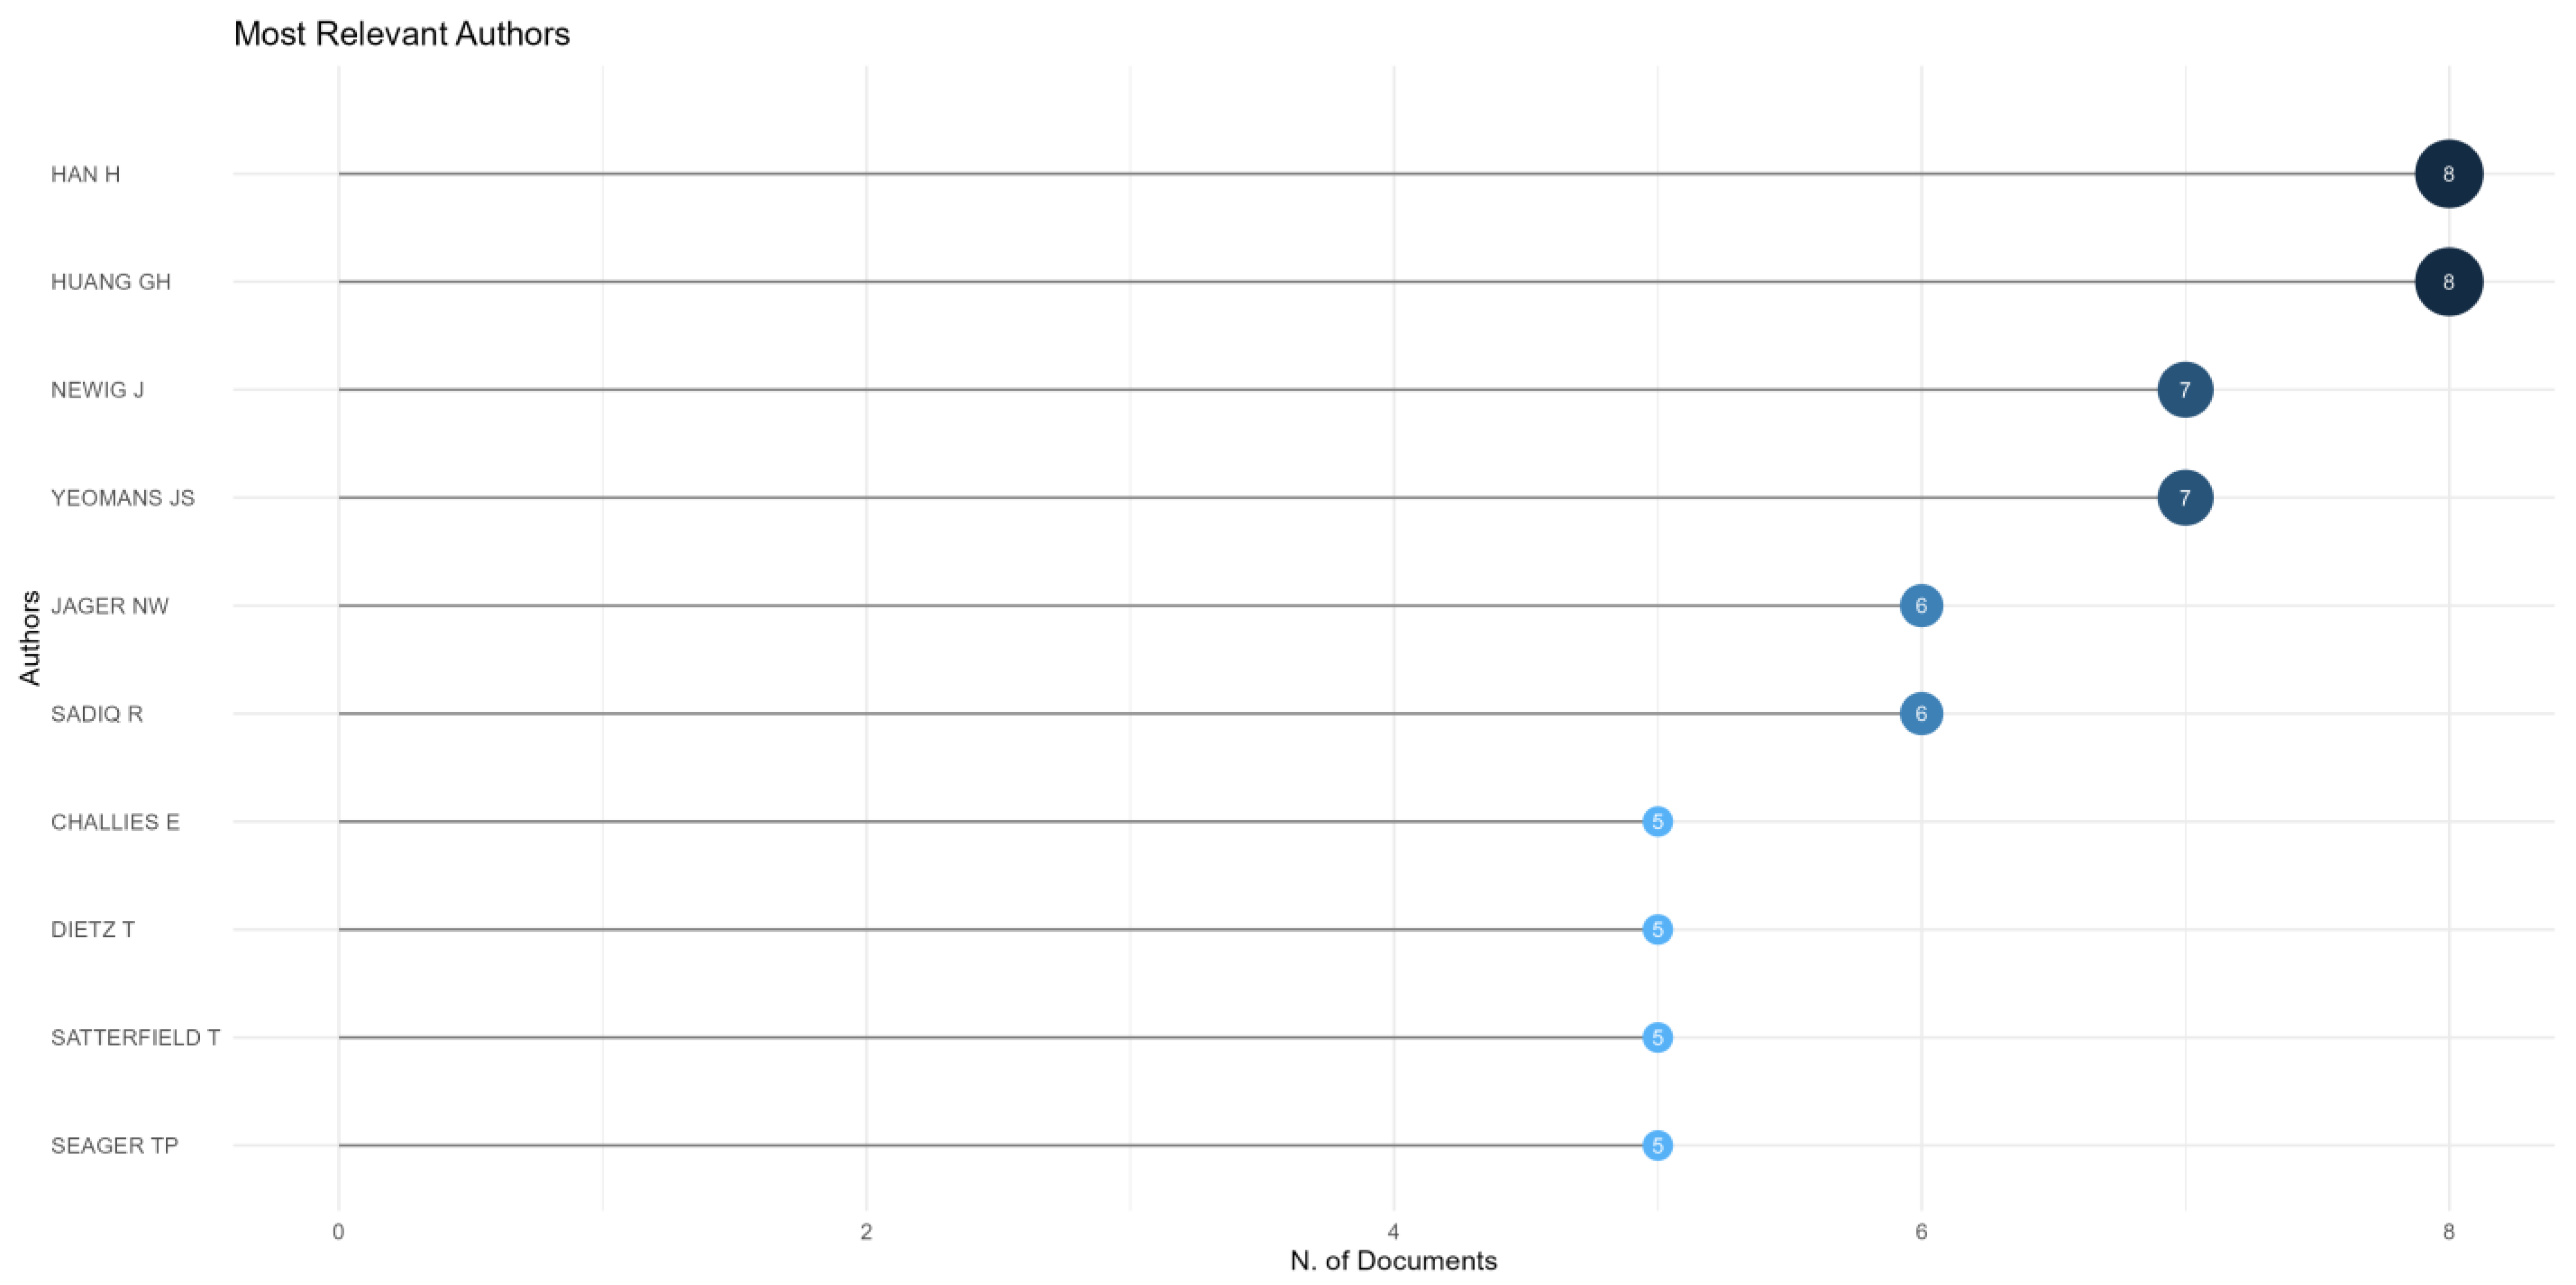
Figure 7 presents the most important authors on the sustainability, behavioral shifts, and environmental decision-making areas. The first two are Han H. and Huang GH. With eight articles, each one having a fractionalized article value of 2.40 and 2.78, Han and Huang are the most representative authors for the analyzed domains. The fractionalized article value explains the contribution of each author by considering the equal implication of each researcher of the paper [
50]. In third place, there are two authors, Newig J and Yeomans JS, with seven articles published, but with a significant difference in fractionalized articles, 1.73 for Newig J, while Yeomans JS has 4.25. Jager NW and Sadiq R each have six articles, with 1.53 and 1.98 fractionalized articles. The last four authors, Challies E., Dietz T., Satterfield T., and Seager TP., have five articles, while the articles’ fractionalized values are 1.20, 2.17, 1.12, and 1.40.
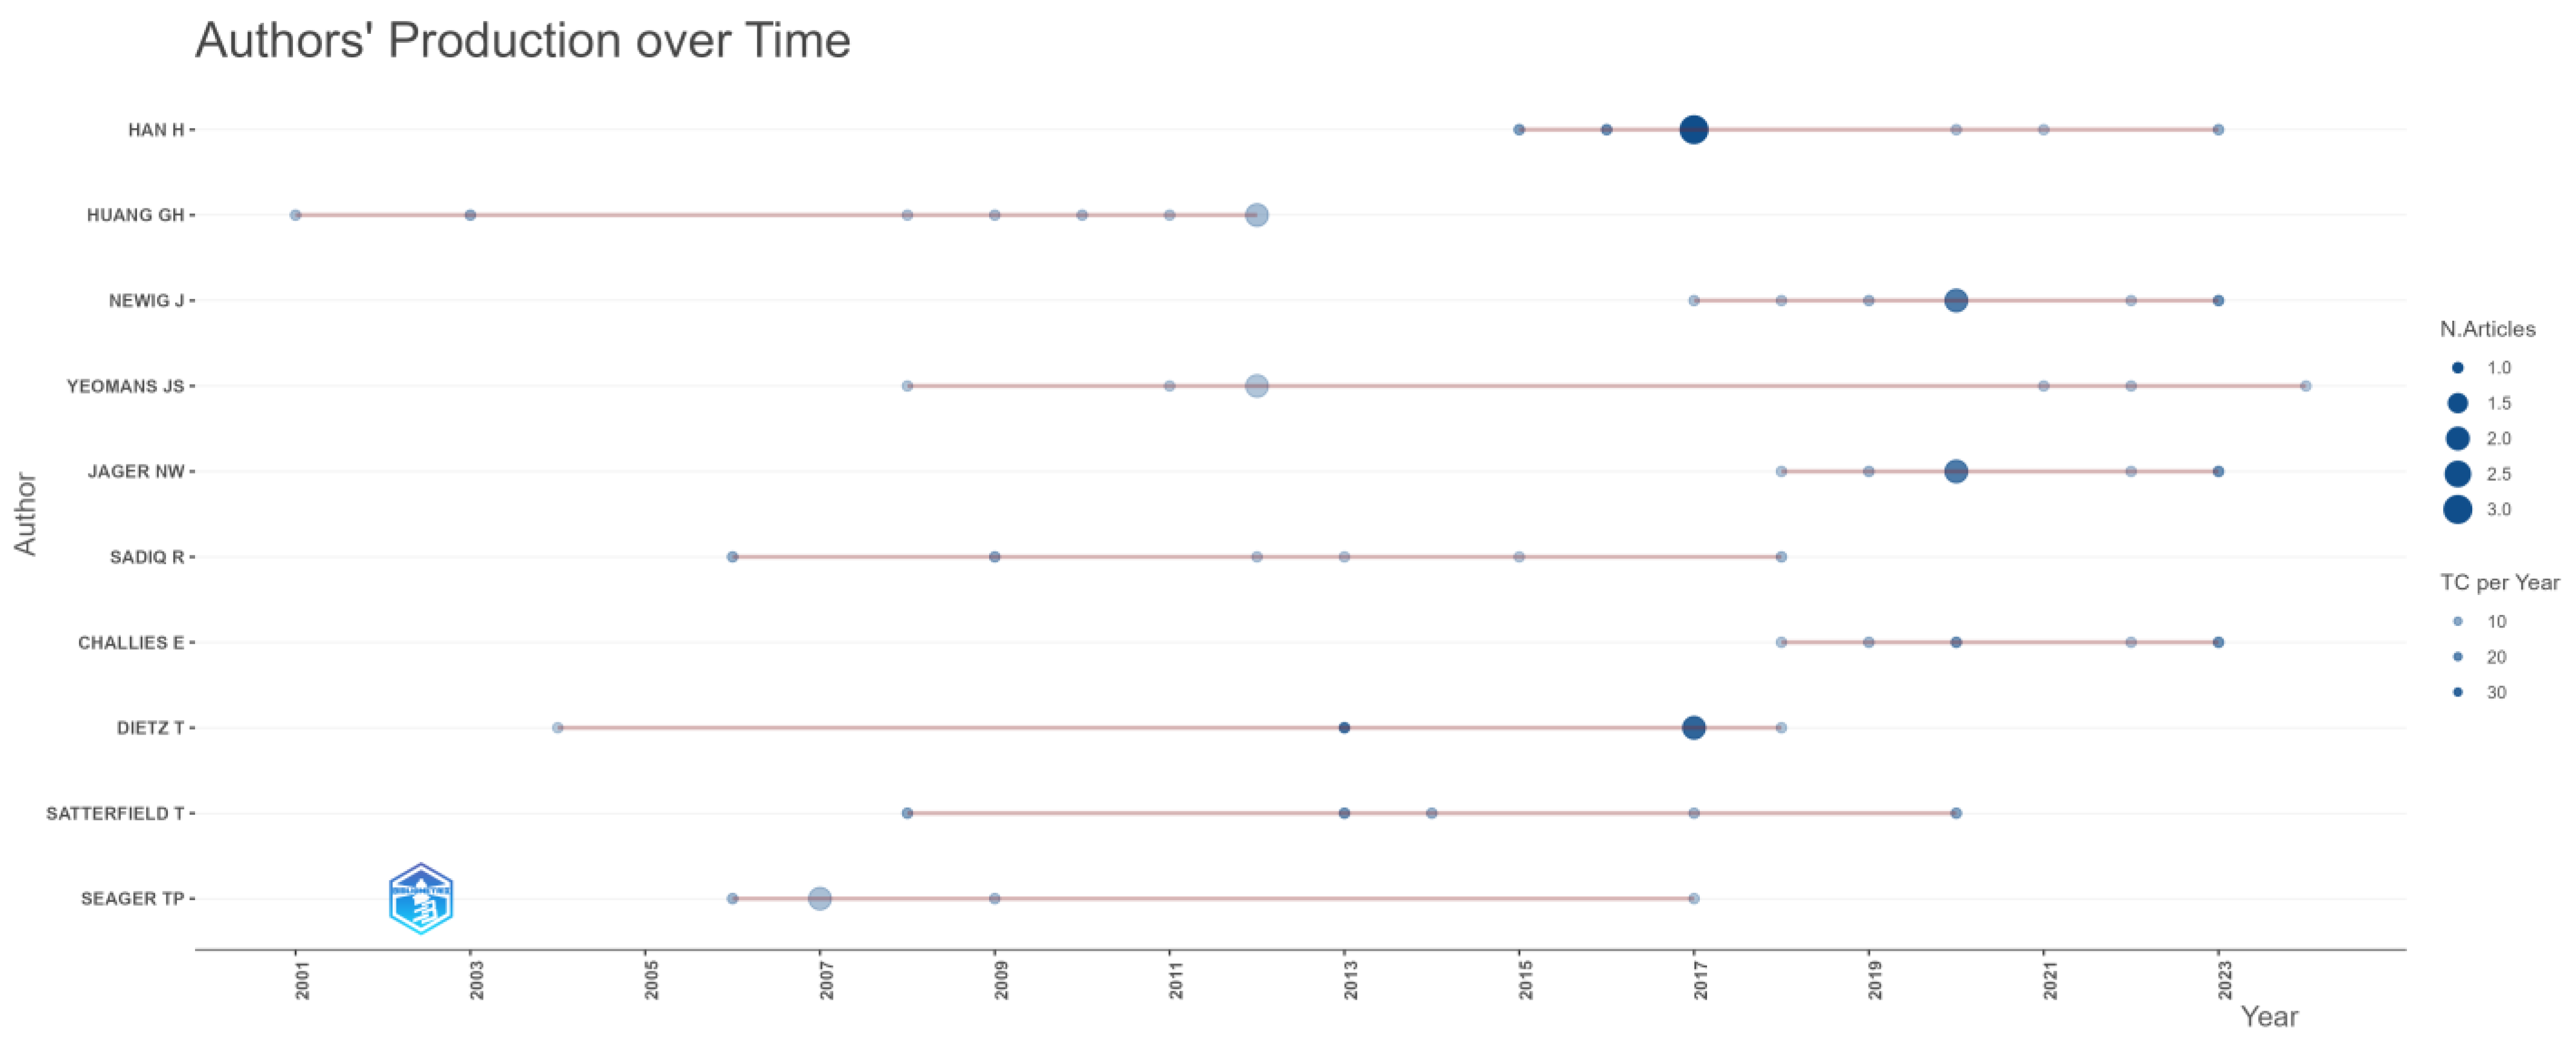
Figure 8 includes the production of the most important 10 authors during the timespan. Han H is the most prolific author based on the number of published papers, with the first article published in 2015 and the total citations per year being 13.1. In 2017, the author published the most papers, three, with the total citations per year being 36.5. Huang GH published his first document in 2001, with the total citations per year being only 3.38, while the second paper was released in 2003, with the total citations per year being 7.45. The peak was in 2012, when two documents were published, with four citations per year. Newig J published the first article in 2017, with the total citations per year being 2.62, while in 2020, he published two papers, with the citations per year being 23.4. Yeomans JS released the first paper in 2008, with the number of citations per year being just 1.29, while in 2012, the author published two papers, with the total citations per year being 1.69. Sadiq R published a total of six articles between 2006 and 2018, with one in each year (2006, 2009, 2012, 2013, 2015, 2018) and the total citations per year being between 0.83 in 2013 and 9.56 in 2009. Challies E released five papers between 2018 and 2023, except 2021, with the total citations per year being between 1.33 and 15.8. Dietz T released five papers, the first one in 2004, with the total citations per year being 0.33, while the peak was in 2017 with two papers and the total citations per year being 29.88. Satterfield T released five documents, with the highest citations per year in 2013 and a total of 15.75. The last author in the top 10 is Seager TP, with five papers, with two documents in 2007, and the total citations per year being 3.39.
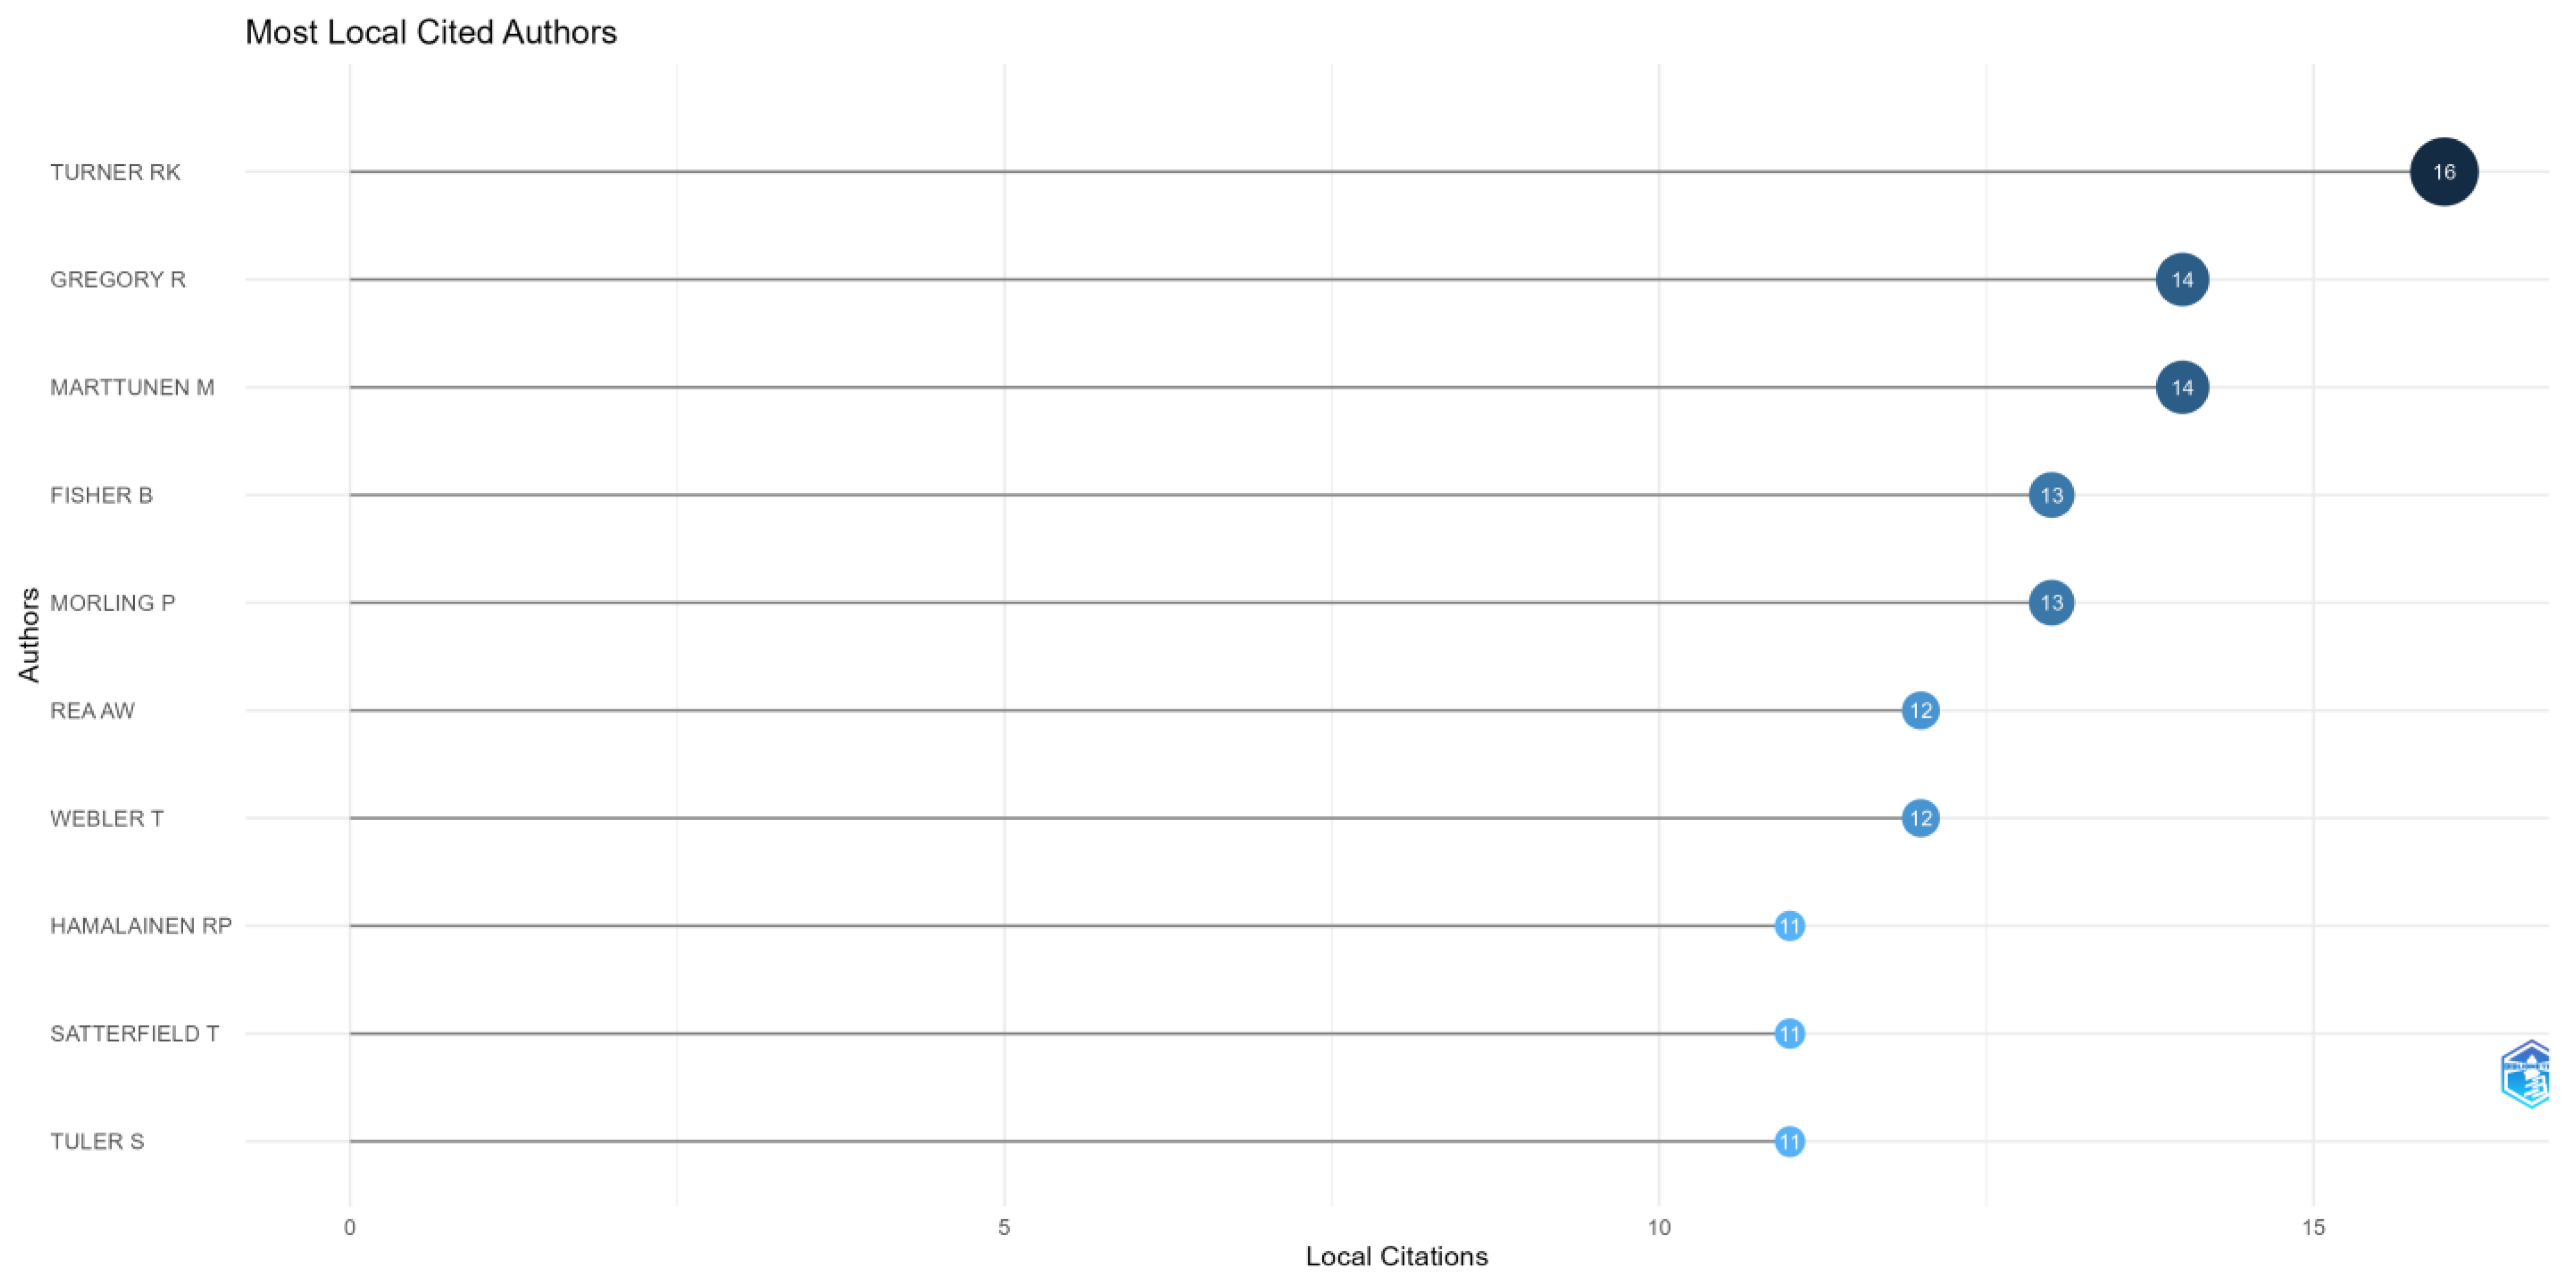
Similar to
Figure 6, the Hirsch index was used in order to identify the most relevant locally cited authors in
Figure 9. In first place, Turner BK has an H-index value of 16, followed by Gregory R and Marttunen M, with each one having an H-index value of 14. The next two authors are Fisher B and Morling P, with an H-index value of 13, while Rea AW and Webler T have an H-index value of 12. The last three authors are Hamalainen RP, Satterfield T, and Tuler S, with an H-index of 11.
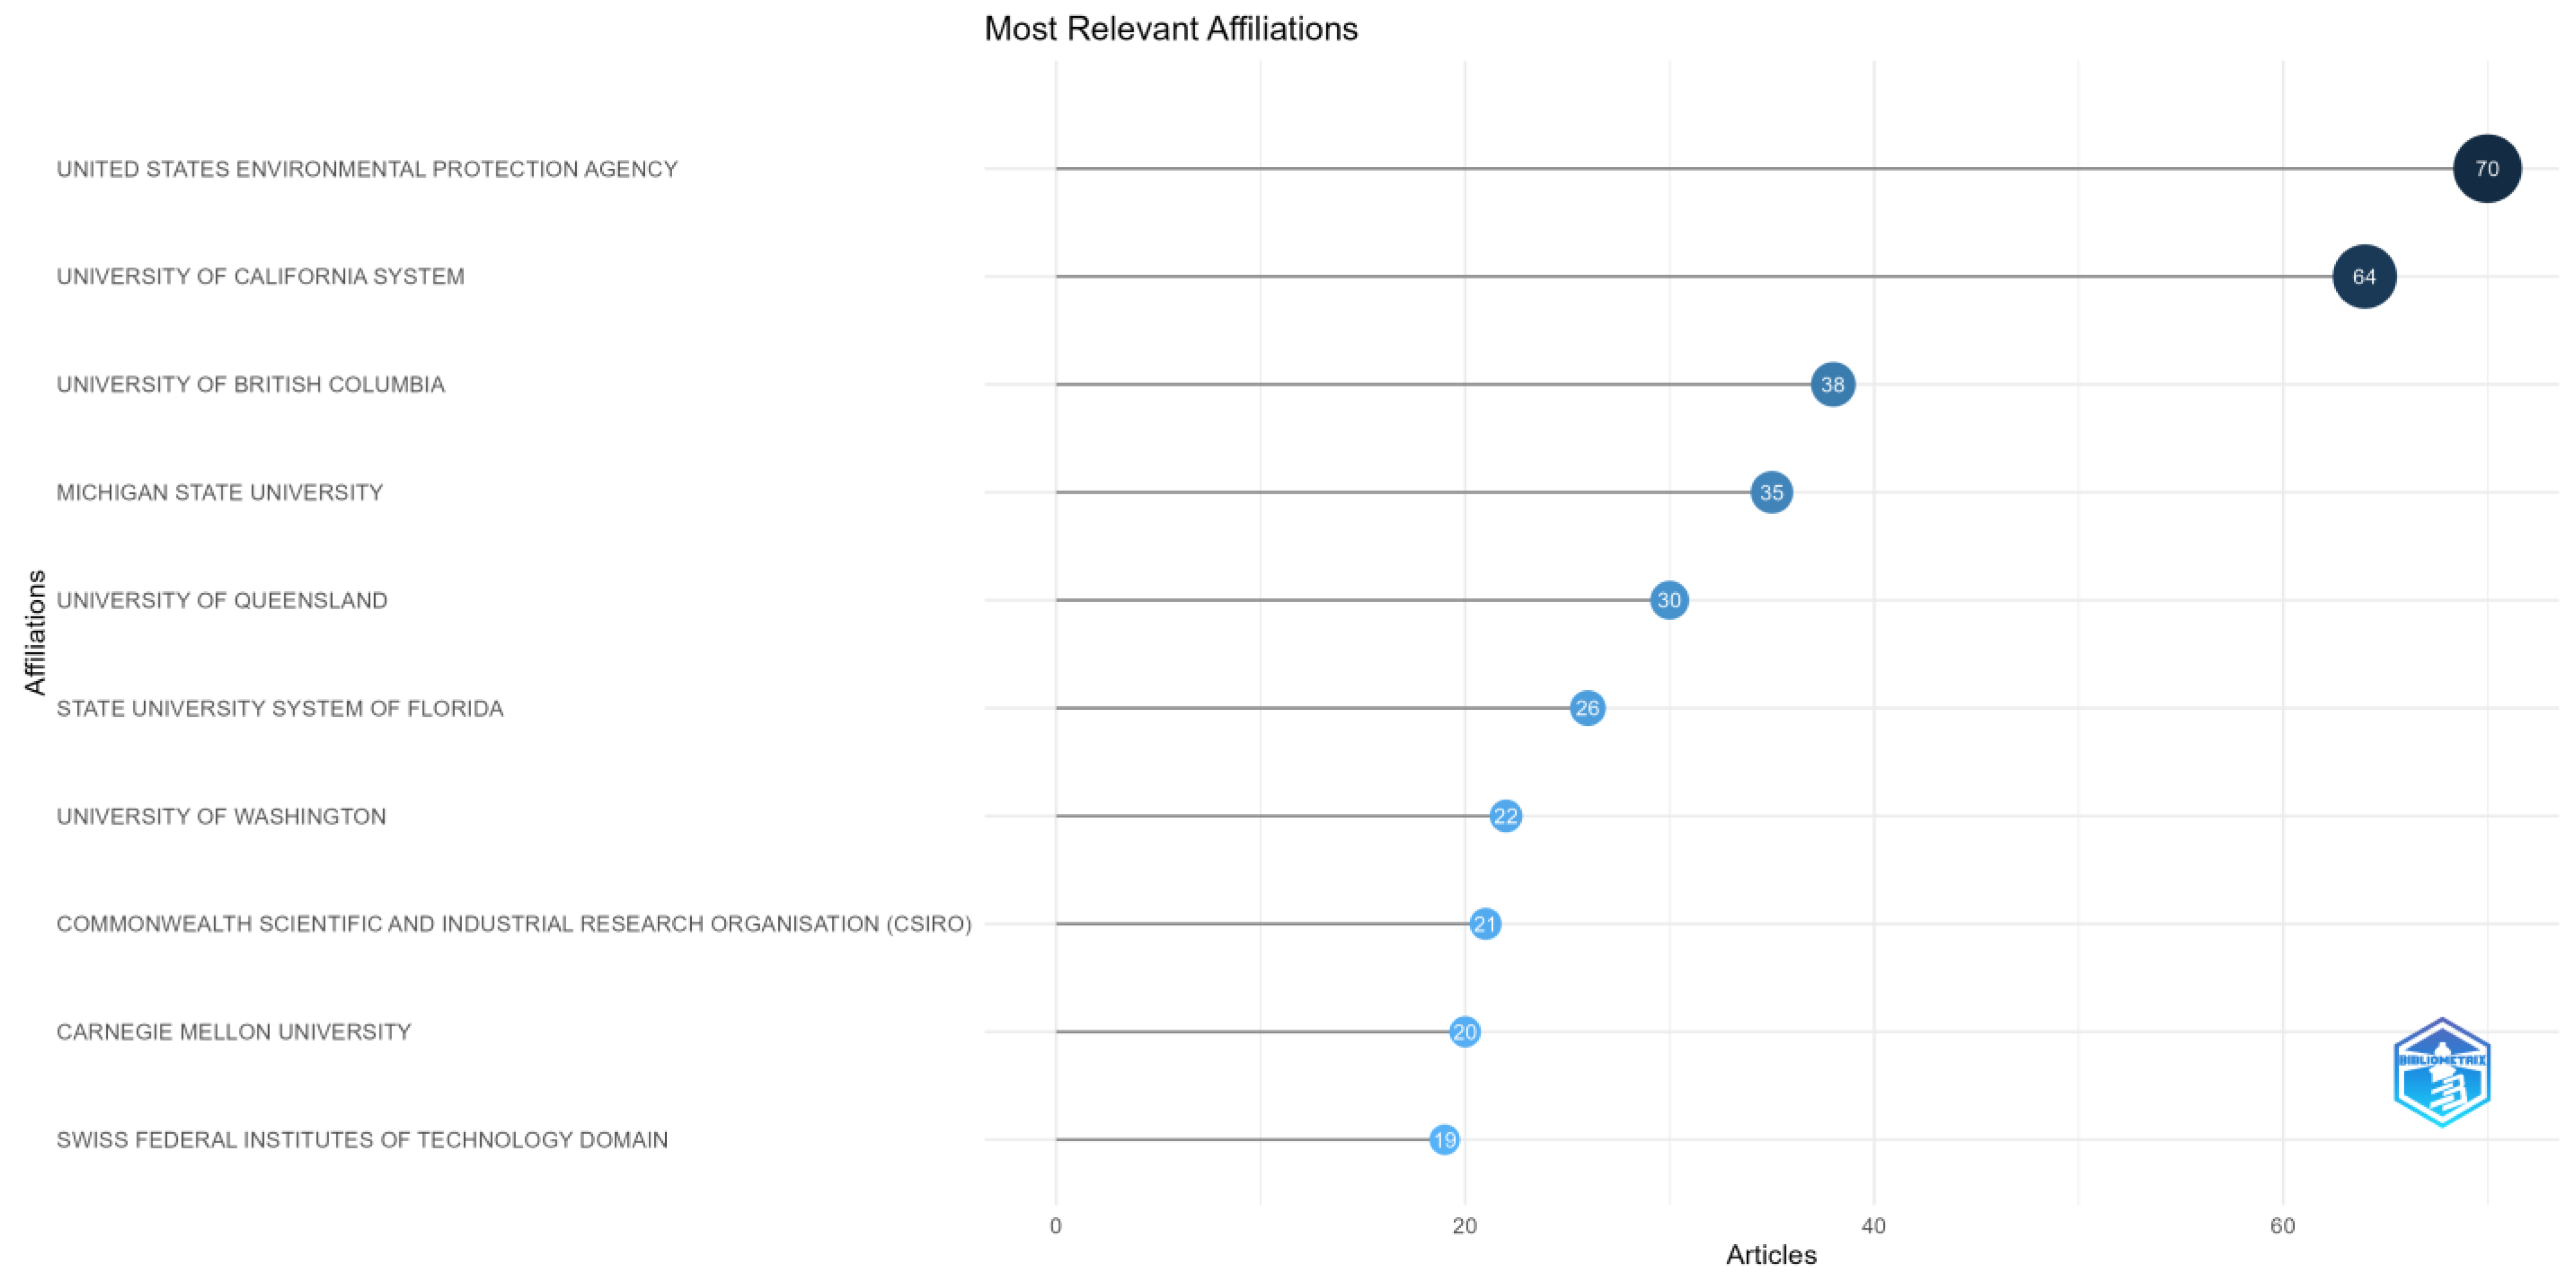
Figure 10 explores the most relevant affiliations in the domains of sustainability, environmental decision-making, and behavioral shifts. In first place is the
United States Environmental Protection Agency (United States of America) with 70 publications, followed by the
University of California System (United States of America) with 64 documents. The rest of the affiliations have a smaller number of articles. For instance, in third place is the
University of British Columbia (Canada) with 38 articles, while
Michigan State University (United States of America) has 35 documents, and the
University of Queensland (Australia) has 30. The
State University System of Florida (United States of America) published 26 papers, while the last four affiliations, the
University of Washington (United States of America),
Commonwealth Scientific and Industrial Research Organization (Australia),
Carnegie Mellon University (United States of America), and
Swiss Federal Institutes of Technology Domain (Switzerland), have 22, 21, 20, and 19 articles. In total, there are six universities from the United States of America, two from Australia, one from Canada, and one from Switzerland, showing the significant implications of the USA in the investigated areas.
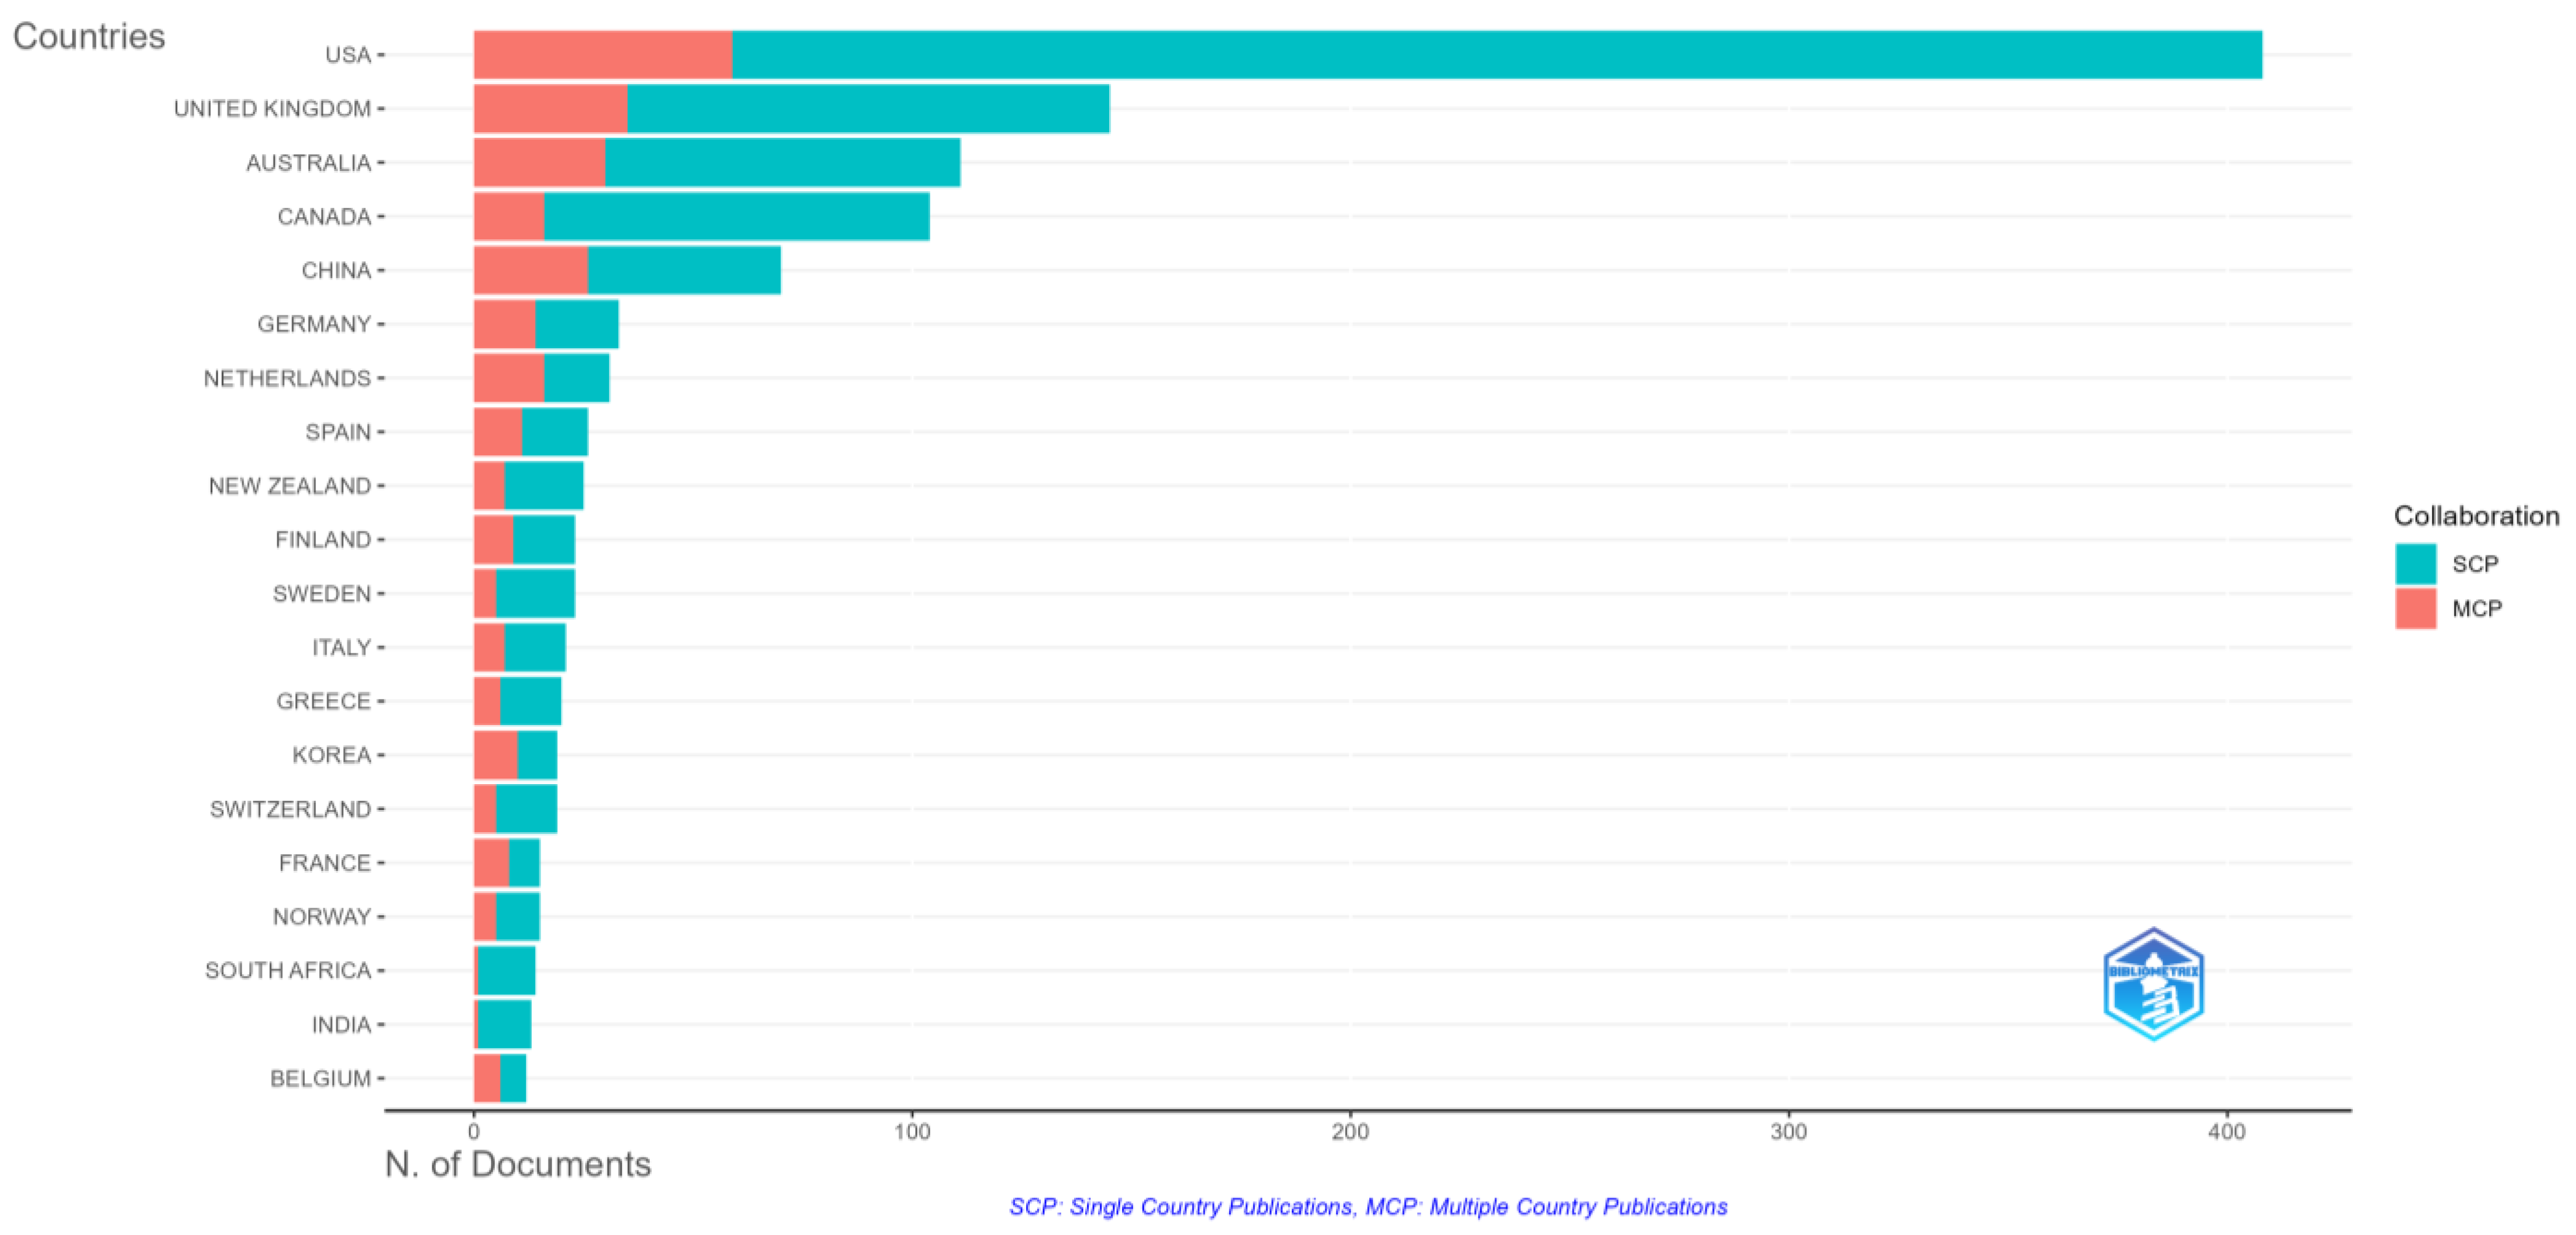
Figure 11 presents the countries with the highest number of publications, dividing the papers into two different categories: single-country publications (SCP) and multiple-country publications (MCP). In first place is the United States of America (USA) with 408 articles, where 349 (85.5%) are SCP and 59 are MCP (14.5%), representing 30.9% of all papers published in the analyzed domains. In second place is the United Kingdom (UK) with only 145 papers, which represents 11% of total papers, 110 SCP (75.9%) and 35 MCP (24.1%), followed by Australia with 111 papers, 81 SCP (73.0%) and 30 MCP (27.0%), with a total contribution of 8.4% in total published documents. Canada released 104 documents, with a contribution of 7.9%, with a total of 88 SCP (84.6%) papers and 16 MCP (15.4%). The rest of the countries have a smaller impact but are worthy to be mentioned: China published 70 documents, with a contribution of 5.3%, with 44 SCP (62.9%) papers and 26 MCP (37.1%); Germany has 33 articles, 19 SCP (57.6%), 14 MCP (42.4%), with a contribution of 2.5%; the Netherlands released 31 documents (2.3%), 15 SCP (48.4%) and 16 MCP (51.6%); Spain released 26 papers (2.0%), 15 SCP (57.7%) and 11 MCP (42.3%); and New Zealand published 25 articles (1.9%), 18 SCP (72.0%) and 7 MCP (28.0%). The last country in the top 10 is Finland, with 23 documents (1.7%), 14 SCP (60.9%) and 9 MCP (39.1%). The USA is the country with the highest impact and also the smallest percentage of MCP publications, showing the interest of local authors, while the Netherlands is the country with the highest number of MCP articles, which expresses the intention of authors to integrate into areas by collaborating with international researchers.
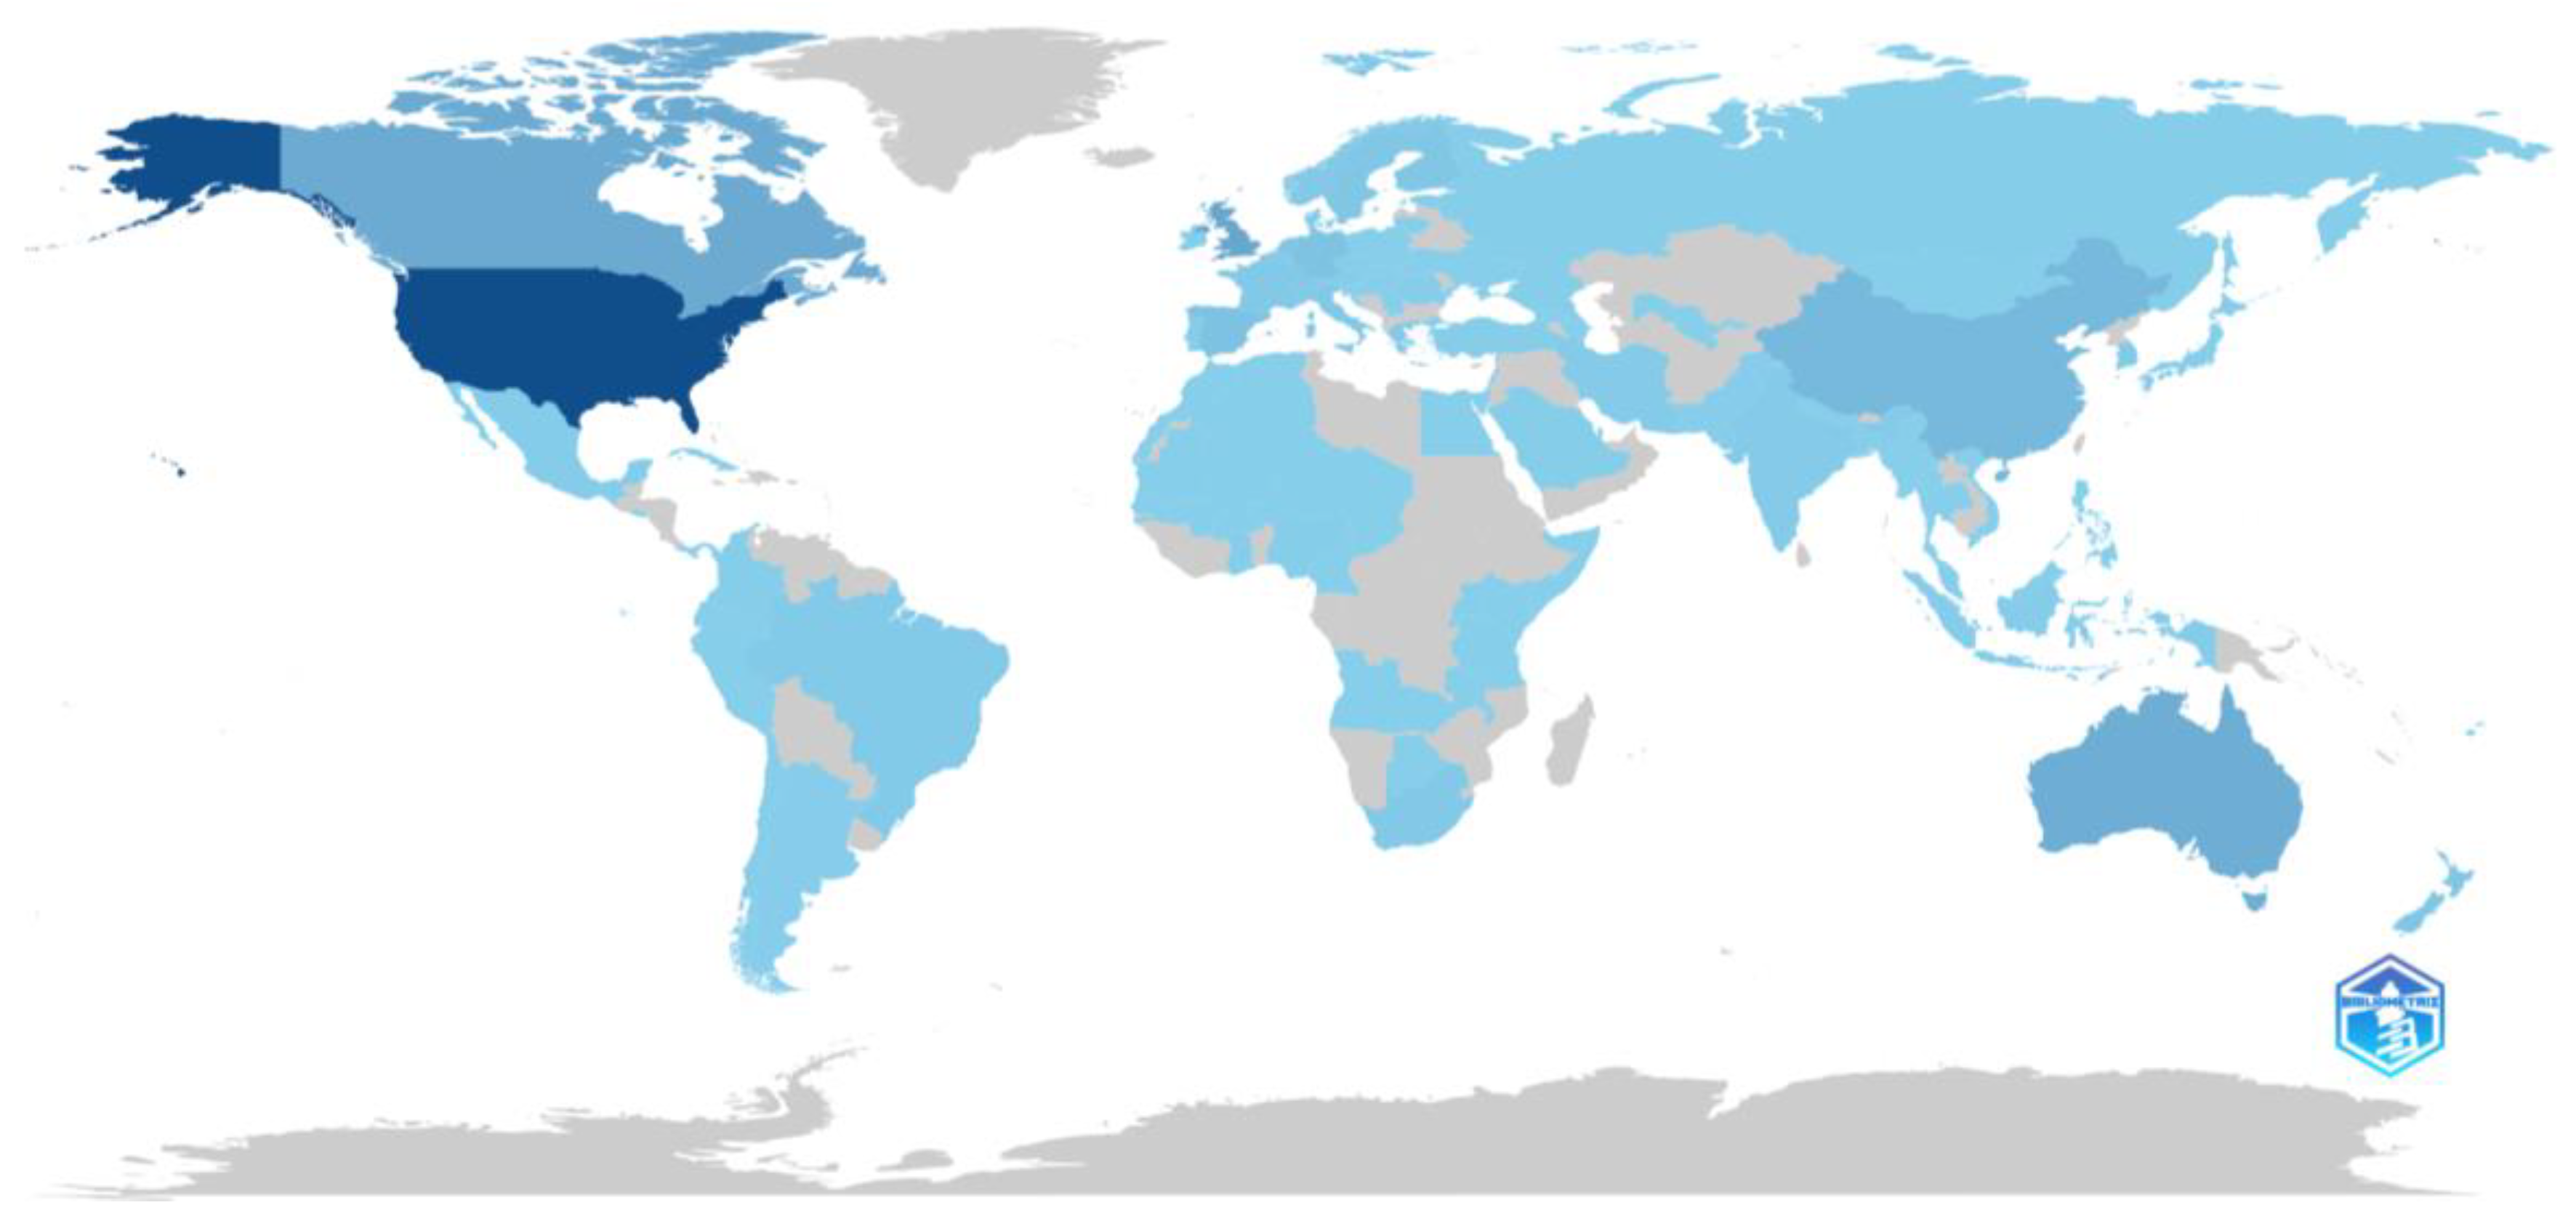
Figure 12 presents the number of scientific publications of each country by various shades of blue, with light blue signifying the countries with the lowest contribution and dark blue signifying the countries with the highest contribution. Furthermore, the countries marked in grey do not have any contribution to the selected field in terms of published papers.
As can be observed, in first place is the USA with a frequency of 1080 appearances, followed by the UK with 321 appearances, Canada with 285 appearances, and Australia with 256 appearances. China is fifth with 164 appearances, while Spain and Germany have 93 and 85 appearances, and the Netherlands, New Zealand, and Finland published a total of 80, 64, and 62 appearances.
Furthermore, by considering the country of the corresponding author and the top 5 greatest contributing countries, the evolution of the number of papers presented in
Figure 13 has been obtained.
Besides the overall contribution provided to the field by each country, it can also be observed that the first four contributors—namely the USA, UK, Canada, and Australia—have had a steady increase over the years and for a longer period of time than China, which presents a rapid growth in the number of papers, in a more limited period of time. Given the rapid ascent of China, particularly emphasized in recent years (as shown in
Figure 13E) and the decline recorded for the USA (
Figure 13A) and Australia (
Figure 13D), it shall be mentioned that there might be a potential shift in the leaders in the near future when considering the number of papers published in this area.
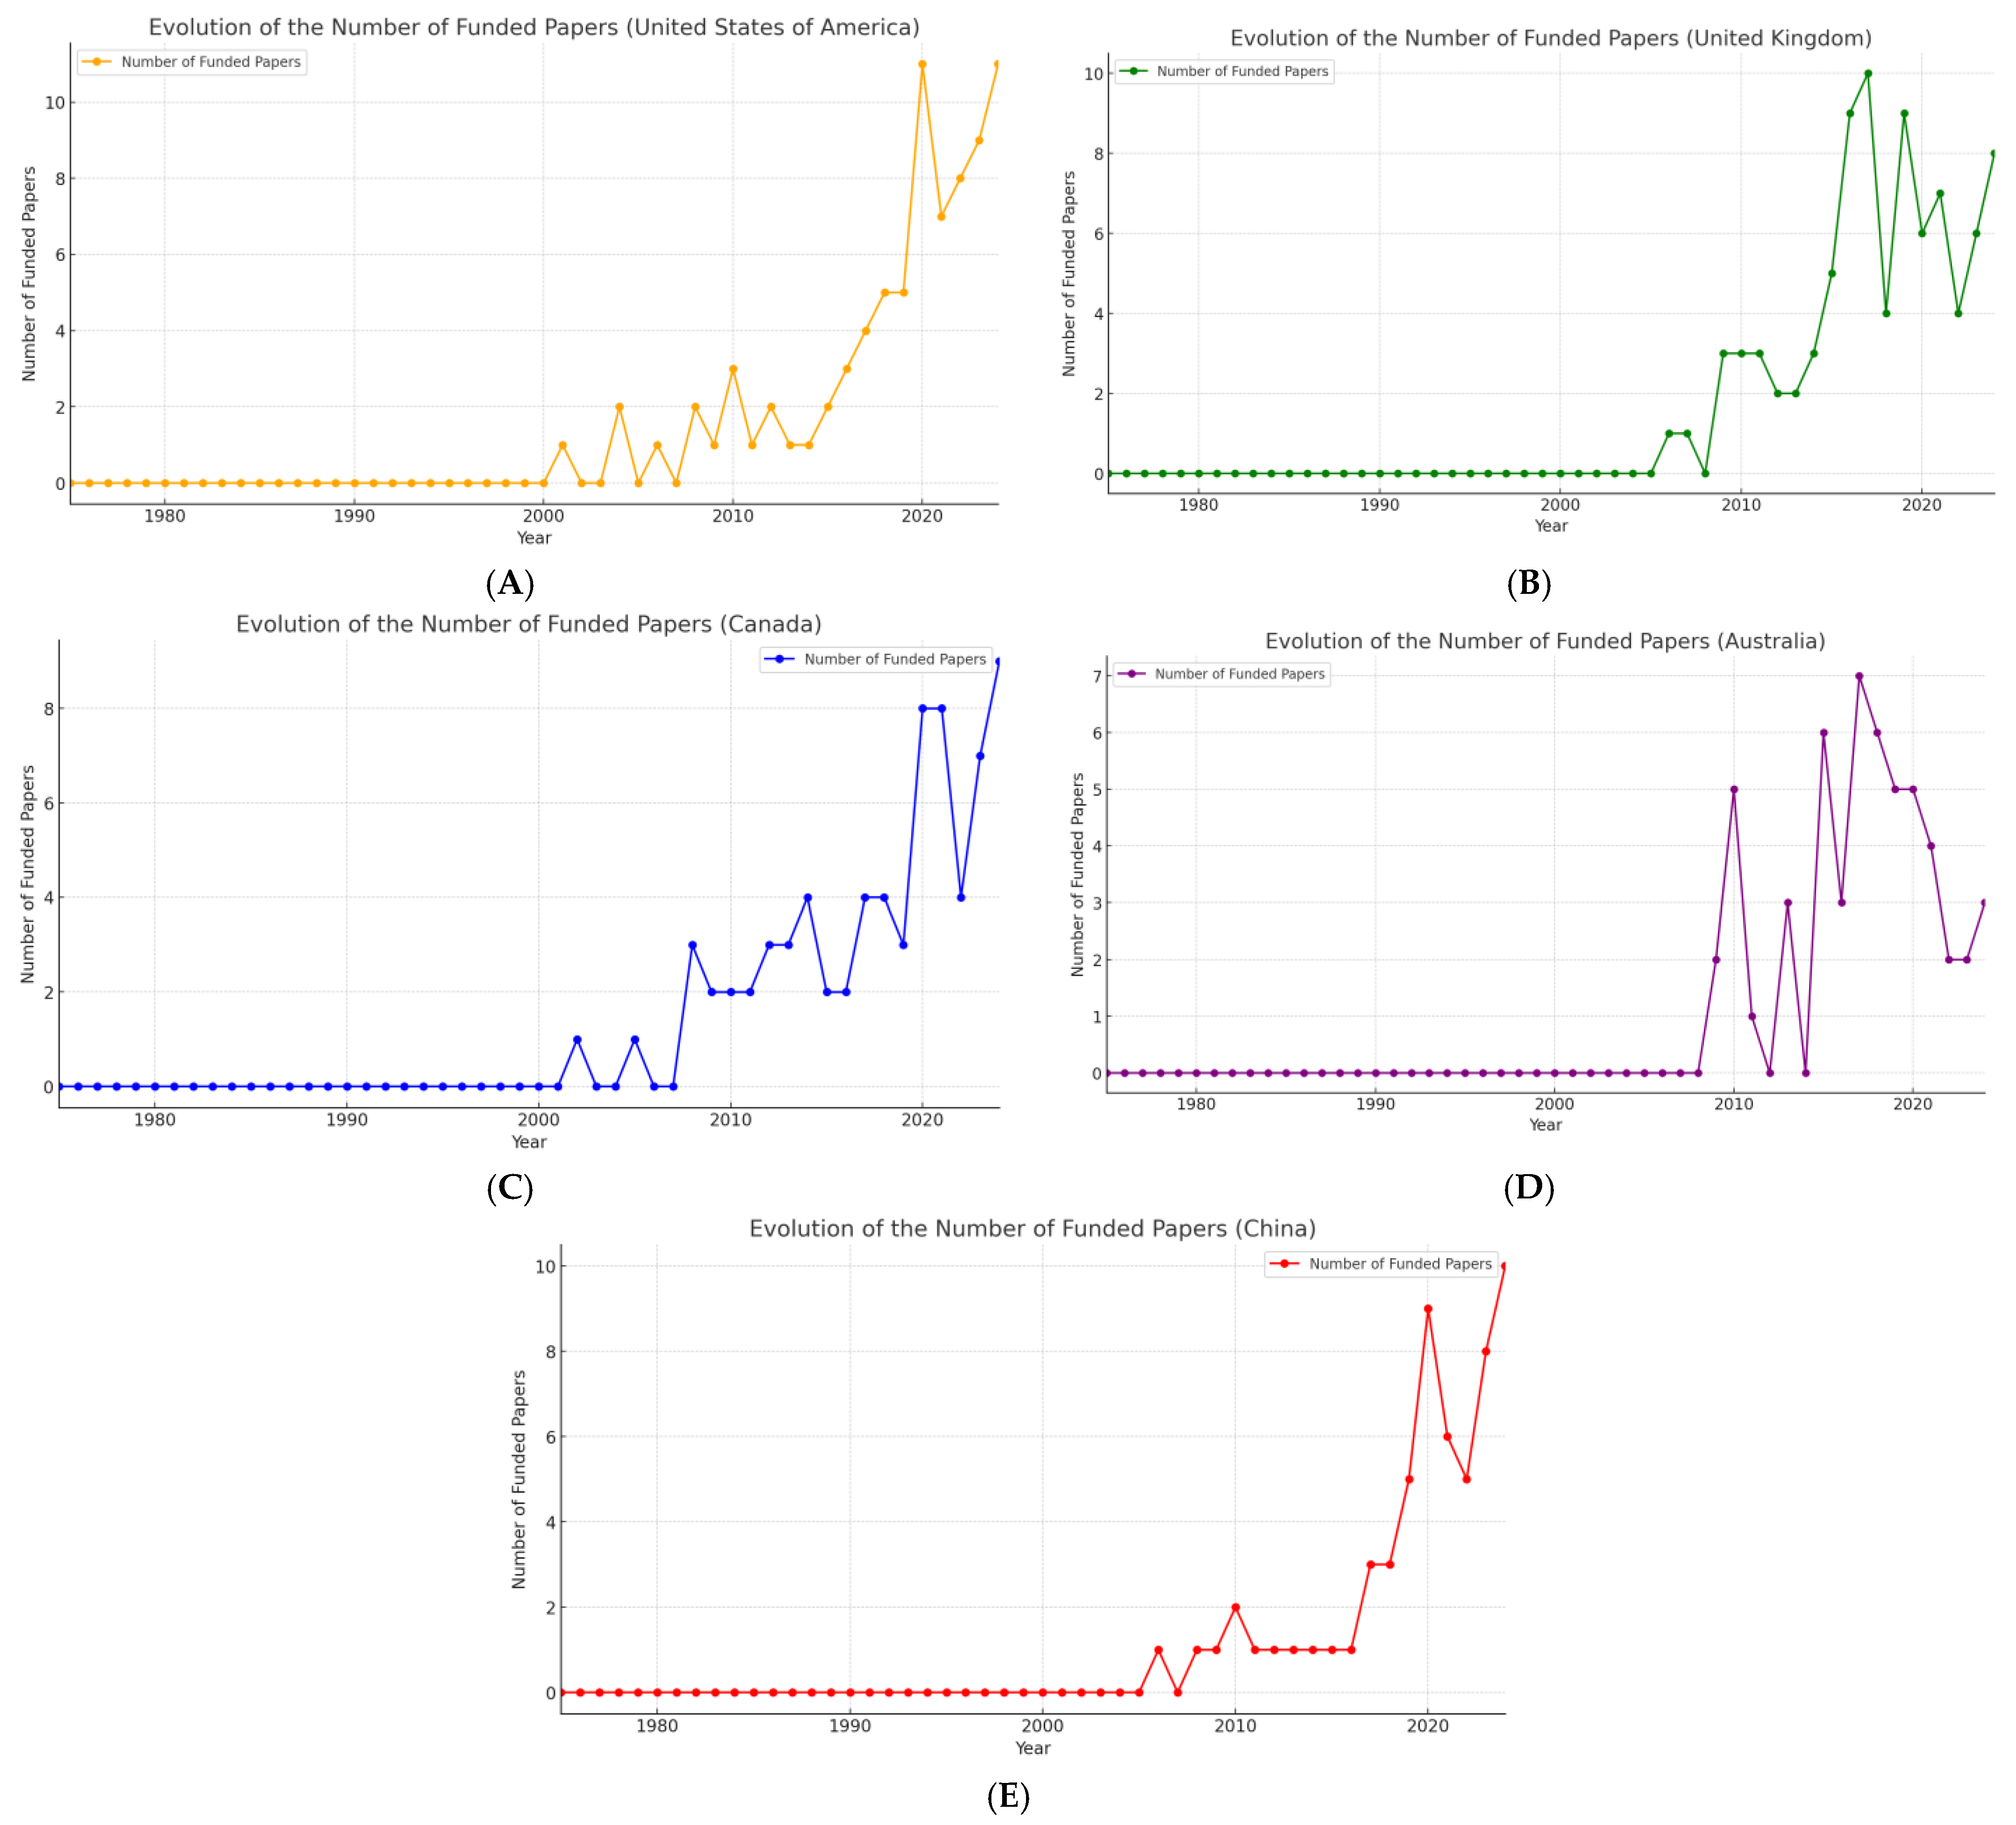
As the change in the number of published papers can have multiple sources, in the following section, the influence of the funding on the number of published papers in the case of the top 5 most prolific countries based on the number of published papers associated with the corresponding author has been analyzed.
Figure 14 highlights this evolution for each of the five countries. As noted in
Figure 14, the fluctuations in the number of papers funded in the case of the USA (
Figure 14A) and China (
Figure 14E) seem very similar, with a peak around the year 2020, marked by the COVID-19 pandemic. On the other hand, the UK’s (
Figure 14B) and Canada’s (
Figure 14C) funded research papers seem to follow a similar path in the evolution of the number of funded papers included in the dataset, following a stable trajectory with a moderate growth in the number of funded research papers. An irregular pattern can be encountered in the case of Australia (
Figure 14D), which might have various causes, such as a competitive funding system or targeted funding for specific areas at various periods of time.
To support these statements, according to a report undertaken by Ernest and Young [
62], the US government allocated significant resources for health and environmental research as part of its COVID-19 response. The report highlights that the Infrastructure Investment and Jobs Act provided USD 1 trillion for sustainability-focused investments, which indirectly could impact environmental decision-making research [
62]. Another paper, titled “
Analyzing and visualizing global research trends on COVID-19 linked to sustainable development goals” [
63], observes a plateau in US publications. This may be reflecting broader trends in funding allocation, where priorities shifted more toward pandemic-related studies during 2020.
Similarly, UK-funded research on climate change has shown consistent investment, according to a UK Collaborative and Development Research (UKCDR) report undertaken between 2015 and 2020 [
64]. The report shows progress in initiatives like the UK Official Development Assistance (UK ODA) and Welcome-funded projects. Between this period, 2015 and 2020, GBP 564.2 million was allocated to over 6901 projects with a focus on sustainability and sustainable development goals (SDGs). This aligns well with the trajectory seen in
Figure 13 [
64].
The trajectory in Canada could be explained through a new strategy employed by the Canadian government, which is backing USD 4 billion to support a transition to clean energy and sustainable development [
65].
Similarly, the irregular change in Australia could be linked to the overall spending on research and development declining as a percentage of GDP. It reached a historic low of 1.68% in 2021–2022. This reduction not only created challenges, but it could directly impact any funded research work focused on environmental decision-making [
66].
Moving further and analyzing the sources of funding, it has been observed that in the case of the USA, the National Science Foundation (NSF) is the main funder of the papers included in the dataset (with 46 papers), followed by the NSF Directorate for Social Behavioral Economic Sciences (SBE) (with 16 papers), the National Aeronautics Space Administration (NASA) with 7 papers, and the United States Department of Energy (DOE) (with 7 papers). The remainder of the funders, in the case of the USA, have funded less than five papers.
For the UK, the main funders were the UK Research Innovation (UKRI—with 31 papers), the Economic Social Research Council (ESRC—with 15 papers), and the Natural Environment Research Council (NERC—with 14 papers).
Two main funders can be identified in the case of Canada: the Natural Sciences and Engineering Research Council of Canada (NSERC—with 22 papers) and the Social Sciences Humanities Research Council of Canada (SSHRC—with 11 papers).
Similarly, in the case of Australia, two main funders have been observed, namely the Australian Research Council—with 12 papers—and the Australian government—with 7 papers.
Analyzing the funding in the case of China, it has been noticed that the National Natural Science Foundation of China (NSFC) has been the most important funder (with 22 papers), which stands as the top funder as the remainder of the funding agencies have had less than 4 papers funded.
Thus, in terms of funders, it can be observed that, in general, the selected countries have two or three main funders, except for the USA, which has had a vaster variety of funders, and China, where a single funder emerged.
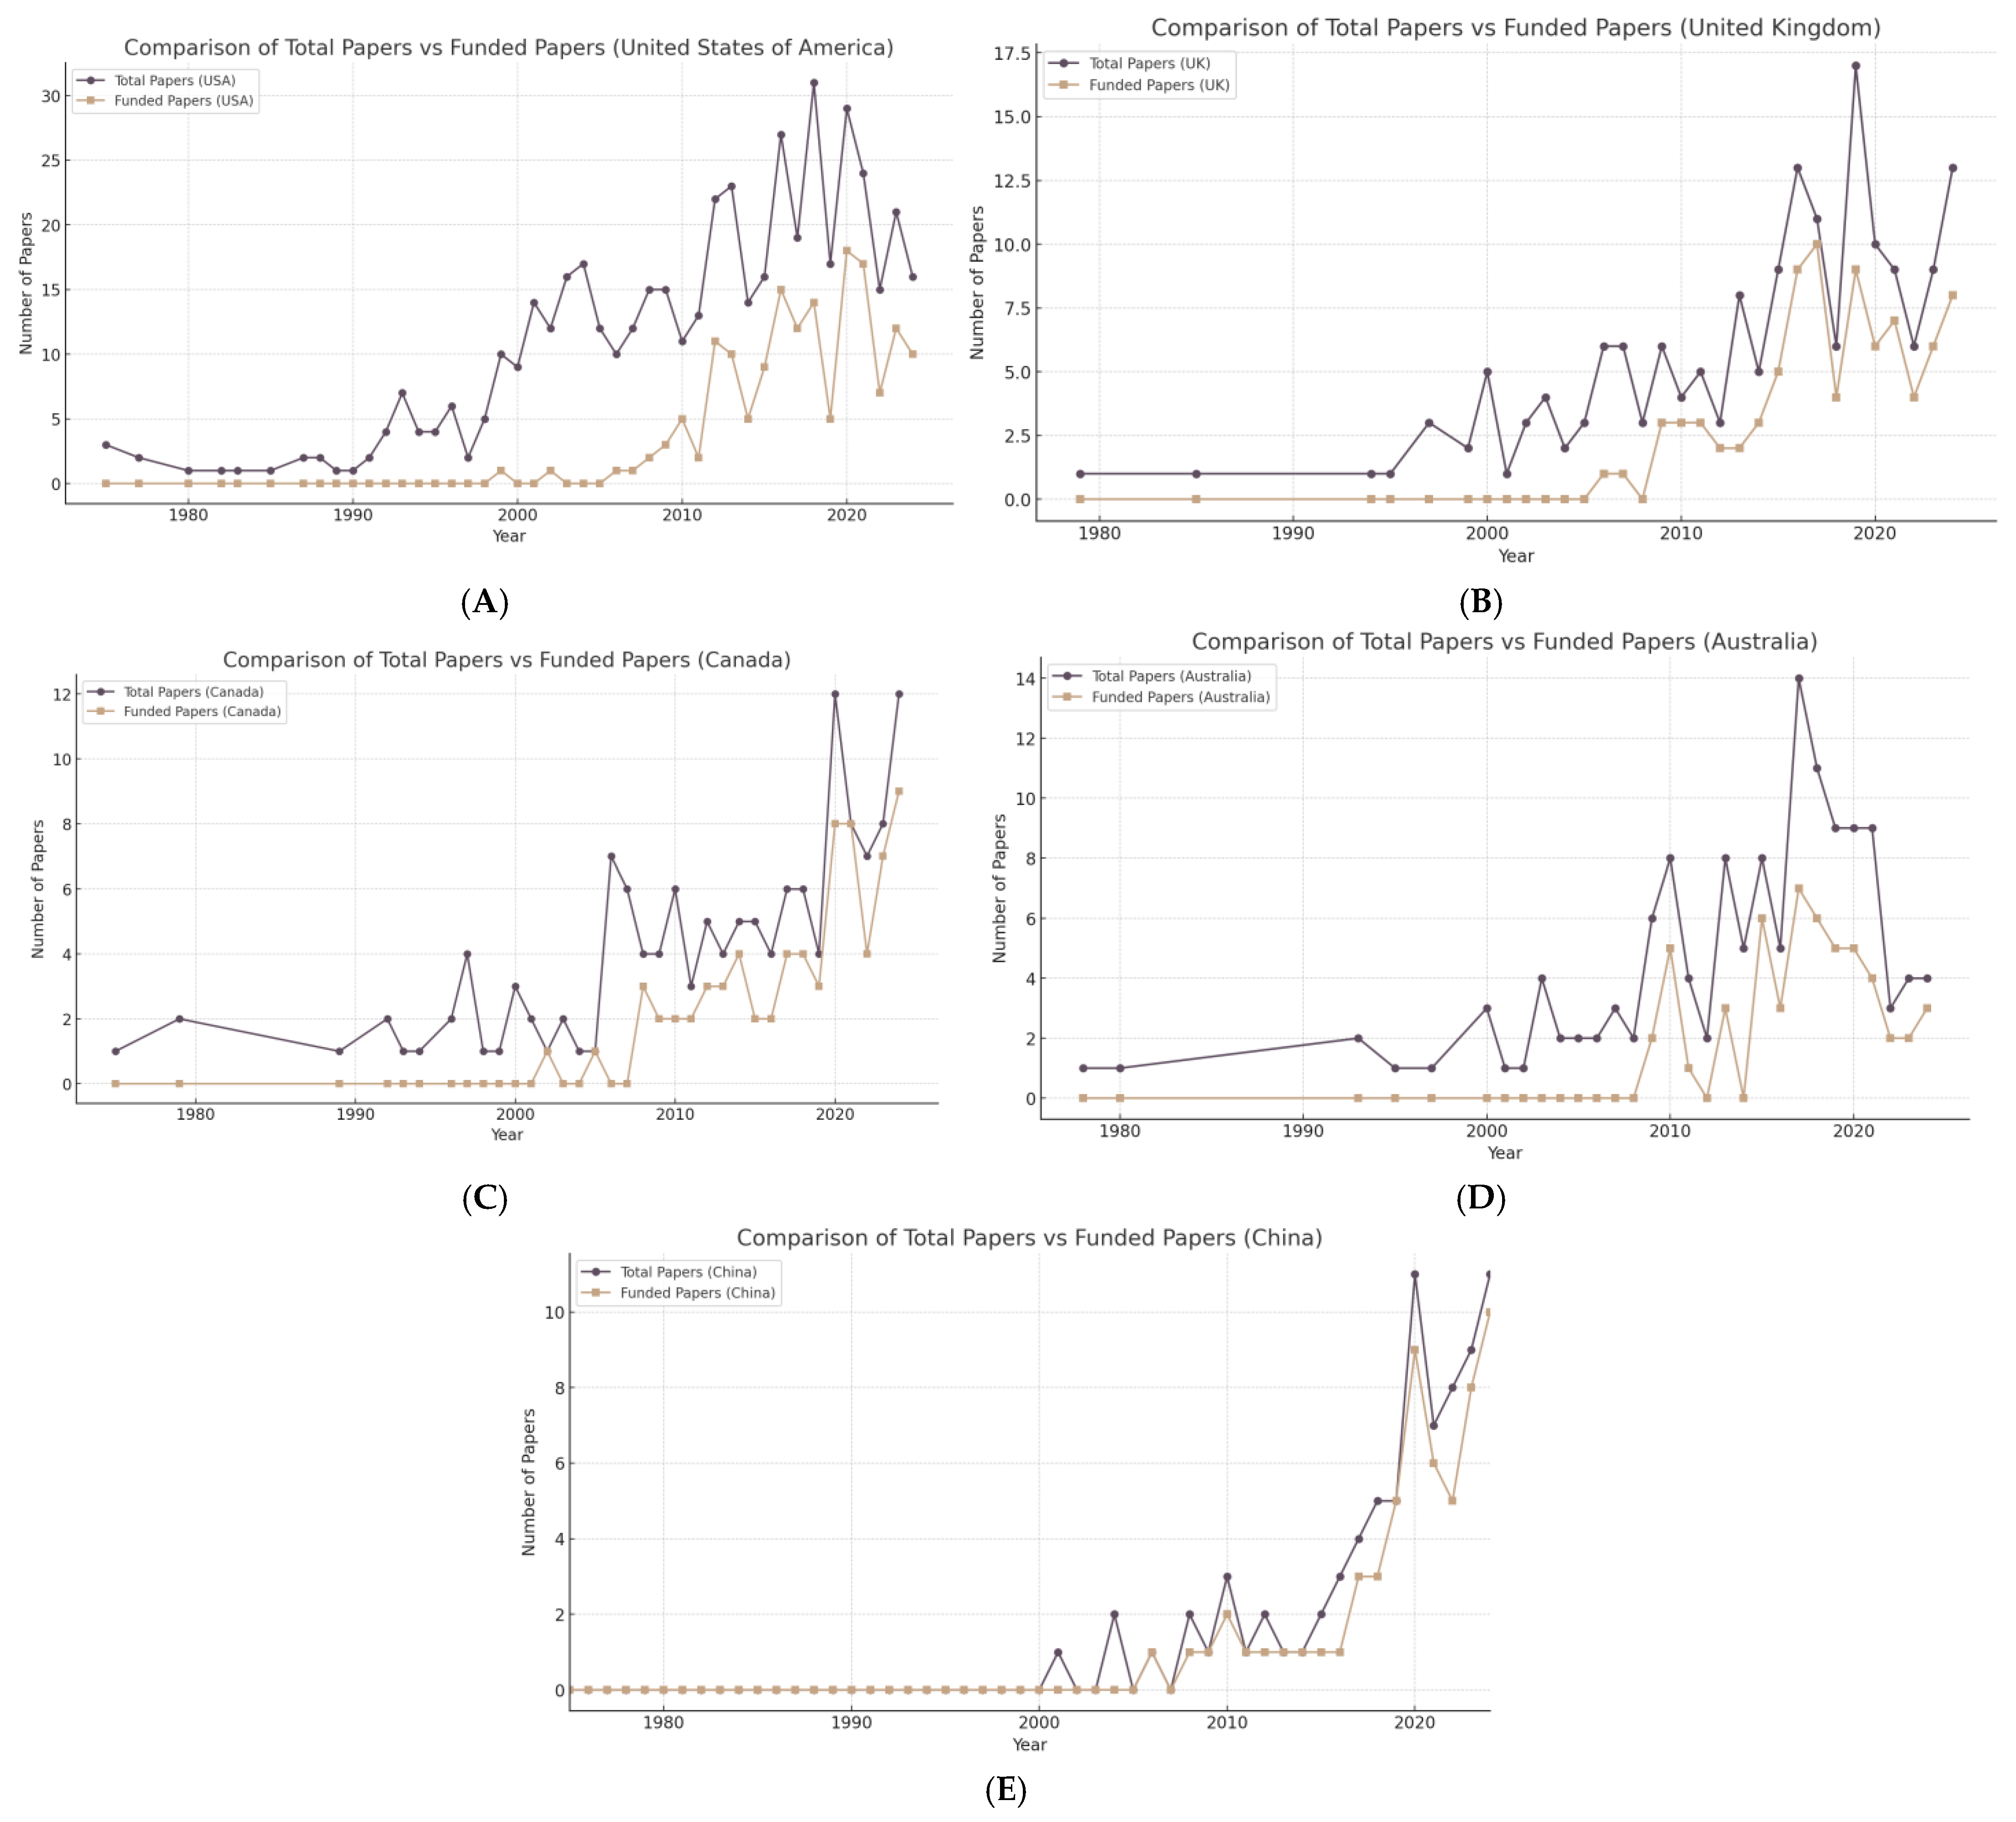
In
Figure 15, the gap between the evolution of the number of papers belonging to the five selected countries and the evolution of the number of funded papers is represented. In the case of the USA (
Figure 15A), one can note the highest overall gap between the two situations, suggesting that a great portion of published papers in the selected area and indexed in ISI WoS are self-founded or supported by alternative sources.
A relatively smaller gap can be encountered in the case of the United Kingdom (
Figure 15B) and Canada (
Figure 15C), suggesting that the funding system supports a moderate part of the total publications of the countries in the selected field.
Australia (
Figure 15D) faces a more pronounced gap starting from 2017 to 2021, while in recent years, the gap has dramatically reduced.
Lastly, China (
Figure 15E) stands out with a high percentage of funded papers in the total number of published papers and a trend that suggests an increase in the interest of the researchers in the selected area.
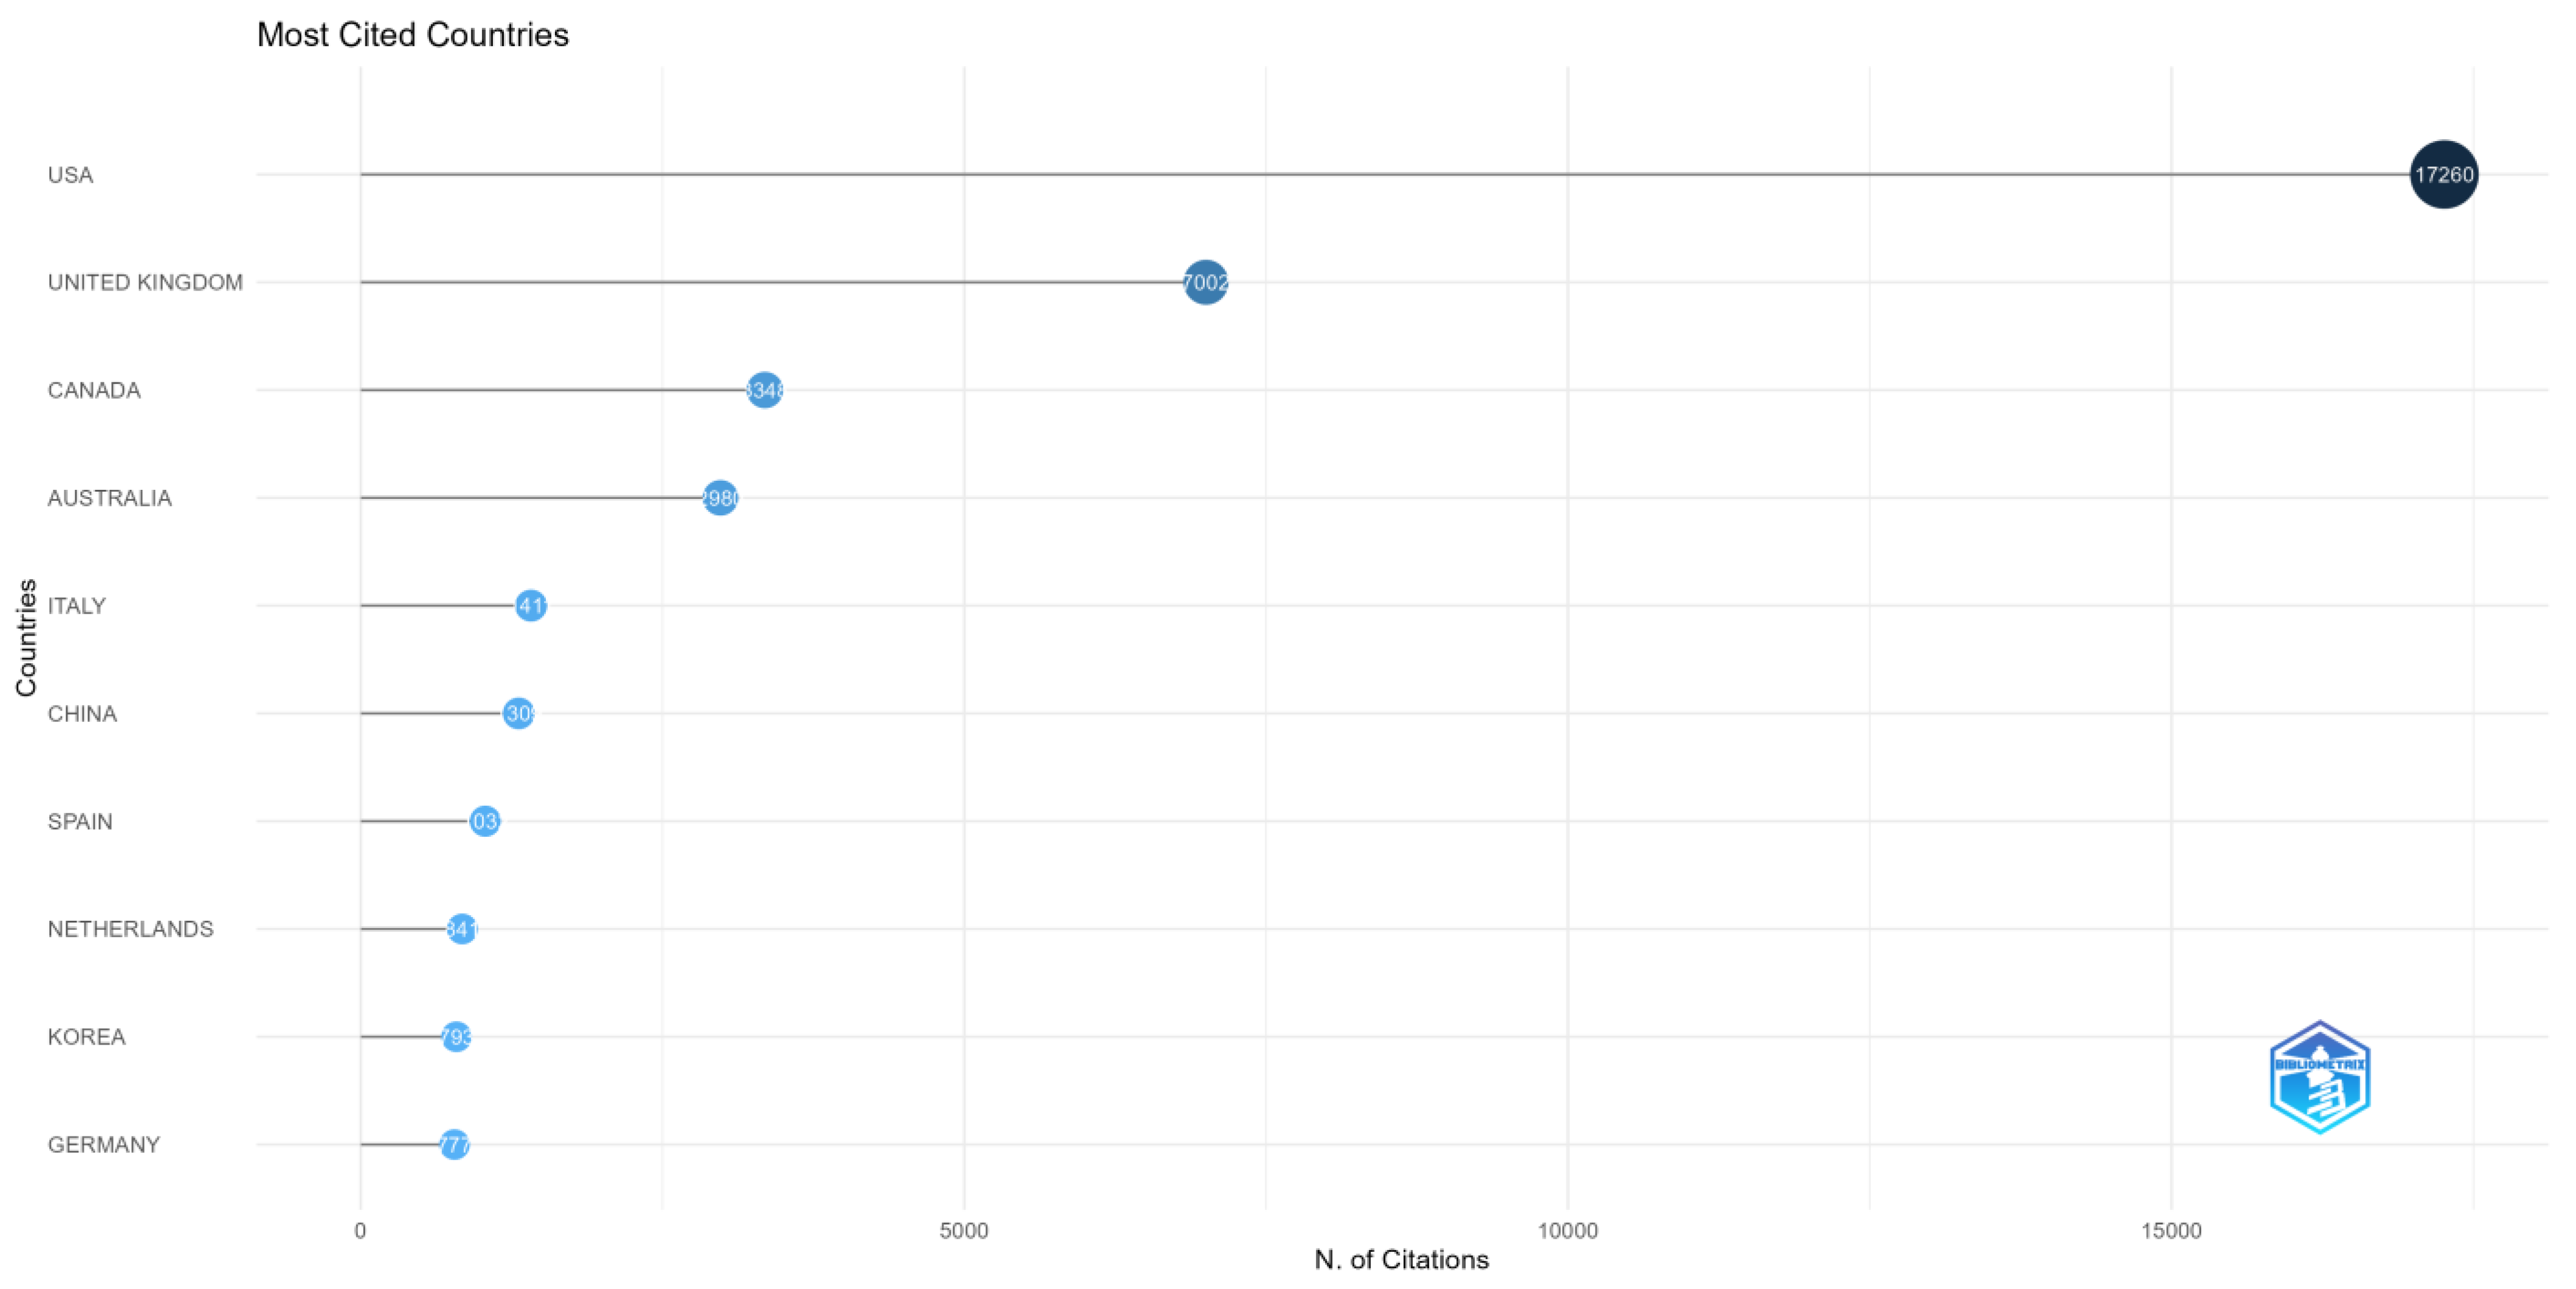
Figure 16 details the most cited countries in the investigated areas. In first place is the USA, with a total citation of 17,260 and an average article citation of 42.30, followed by the UK, with 7002 citations, with over 10,000 differences between first place and second place. The average article citations for the UK are 48.30. In third place is Canada, with 3348 citations, with an average article citation of 32.20, while Australia has 2980 citations, with an average article citation of 26.80, followed by Italy, with 1411 citations and an average article citation of 67.20. China is in sixth place, with a total of 1309 citations, with an average article citation of 18.70, followed by Spain and the Netherlands, with 1032 citations and 841 citations, with an average article citation of 39.70 and 27.10. The last two countries are Korea and Germany, with 793 citations and 777 citations and an average article citation of 41.70 and 23.50.
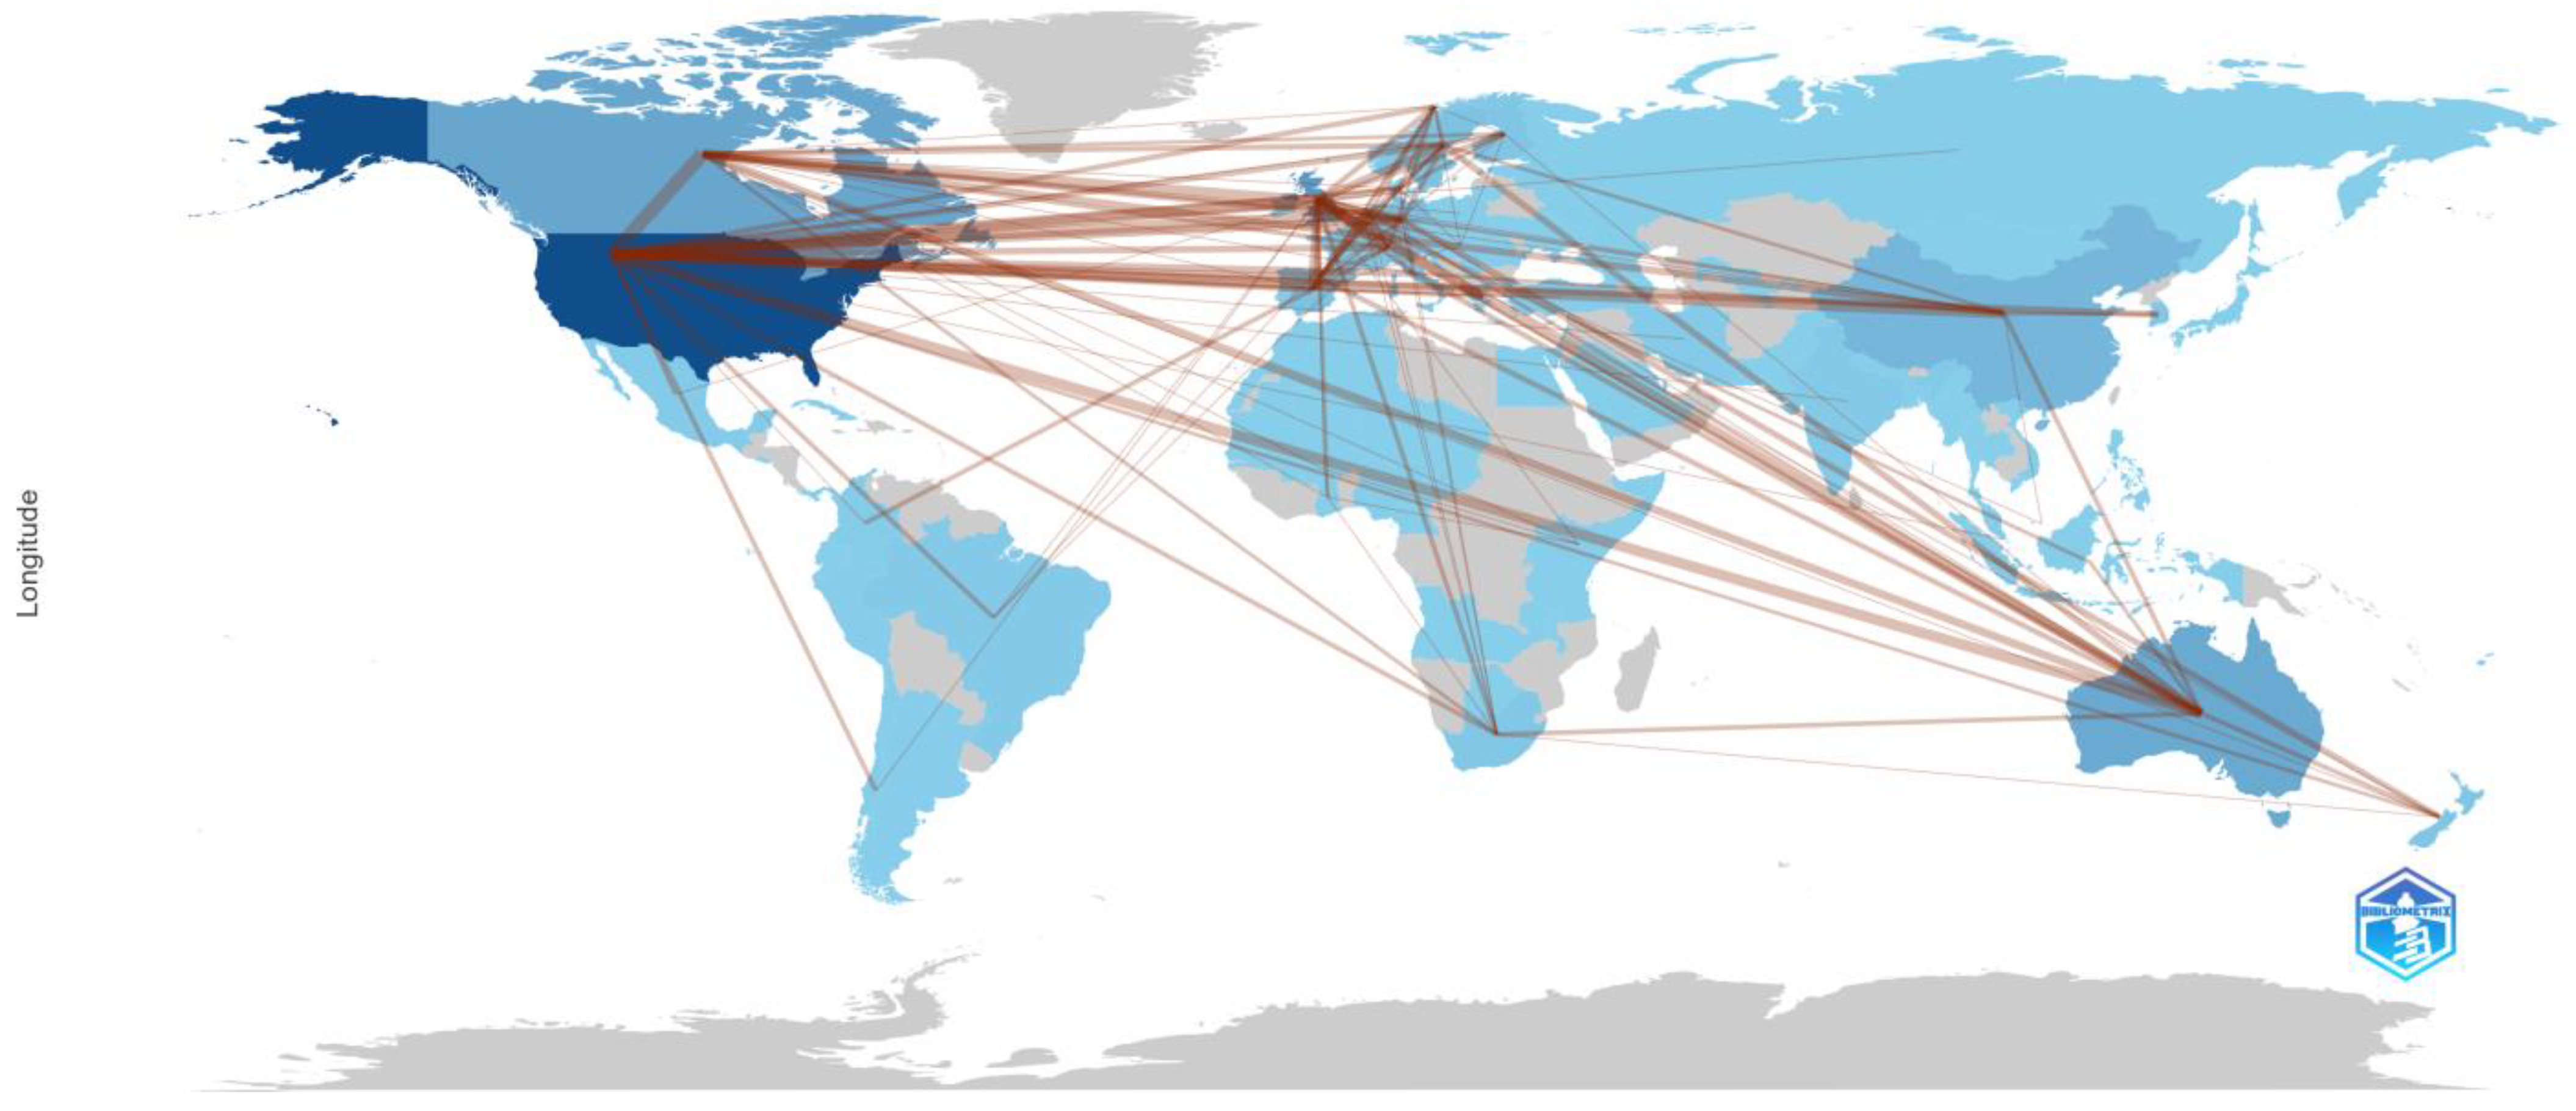
Figure 17 details the collaboration among countries on sustainability, environmental decision-making, and behavioral shifts. The significance of different shades of blue is the same as in
Figure 12, while the width of red lines represents the intensity of the collaboration within a pair of two countries located at each end of the line.
The most fruitful collaboration is between the USA and Canada, with a total of 31 articles, followed by the USA–UK with 26 articles and the USA–Australia with 18 documents. The UK–Australia is the fourth most important collaboration, publishing 17 articles altogether, while the USA–China, the UK–Canada, and the USA–Netherlands published 16, 15, and 15 papers. The last three collaborations are between the USA and Germany (13 documents), the UK and the Netherlands (11 documents), and Canada and Australia (10 documents).
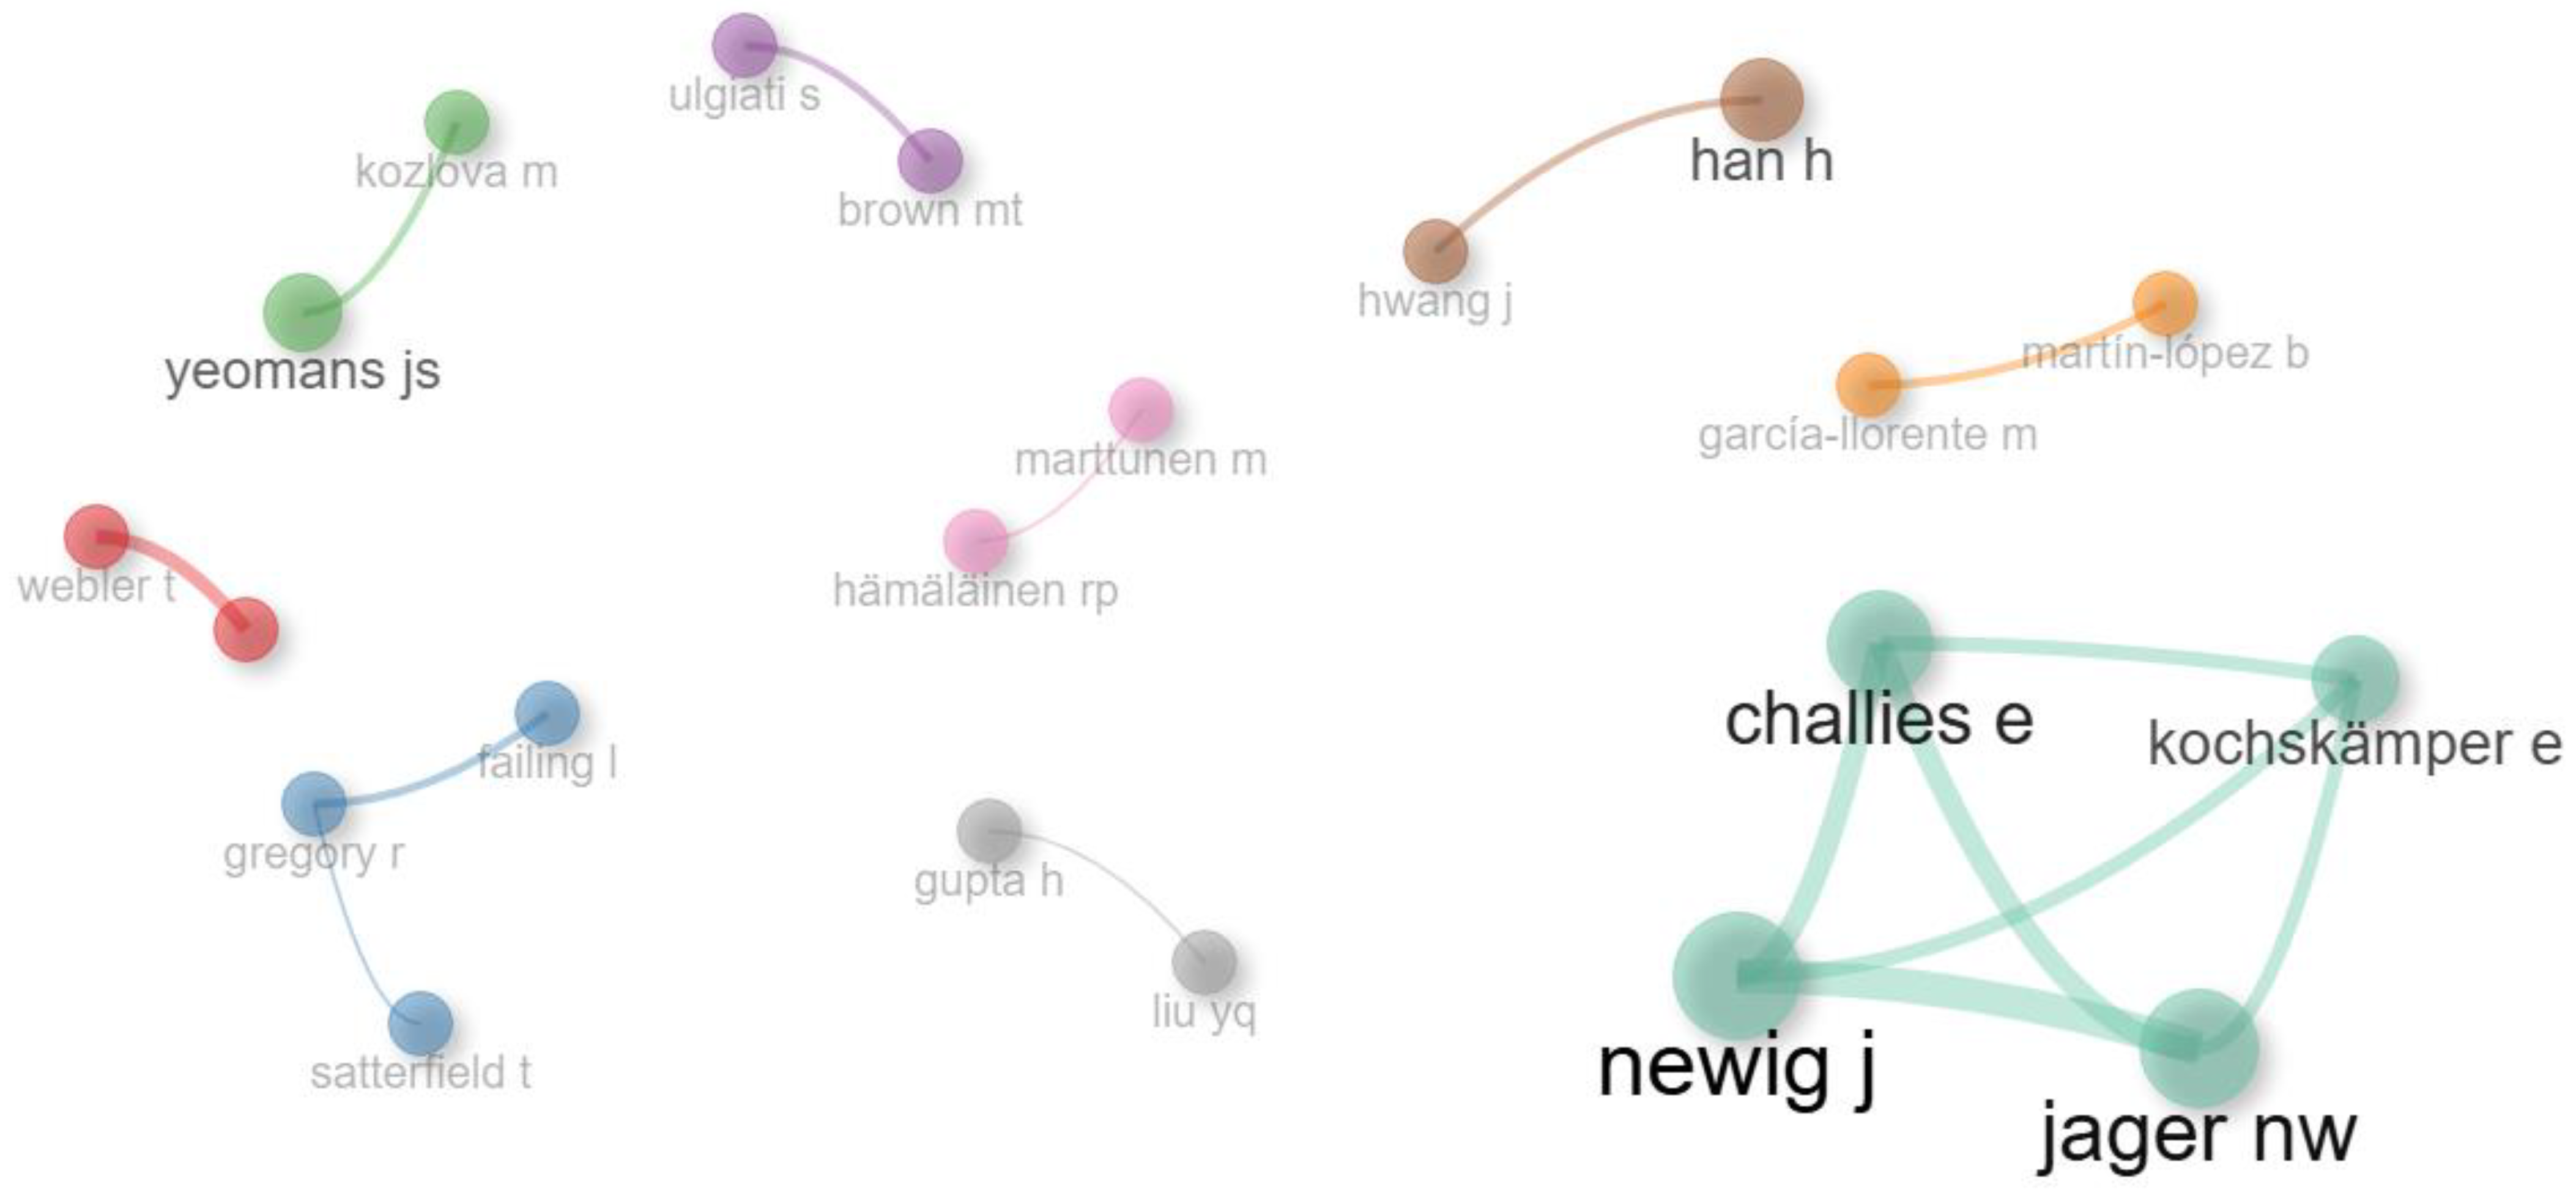
Figure 18 clustered the most important 50 authors in nine clusters. The number of edges is two in this case, with a repulsion force of 0.2. To better represent this cluster, the analysis uses a visualization generated by Biblioshiny, an R package, as a primary method of data visualization [
53]. The identified clusters are discussed below.
The cluster with the highest contribution to the field is formed by four authors, colored in turquoise, containing the following researchers: Challies E., Kochskamper E., Newig J., and Jager NW. The focus of the authors was to explain the applicability of environmental governance decision-making methods, their impact, and their findings using surveys and meta-analysis [
67,
68,
69,
70];
The second cluster, colored in yellow, is formed by two authors, Garcia-Llorente M. and Martin-Lopez B., who detail the importance of integrated valuation and biodiversity conservation in Europe, exploring the collaboration among ecosystem domain in order to define a profile for the stakeholders [
71,
72,
73,
74];
The third cluster, represented using brown, contains two authors, Hwang J. and Han H., who explore the possibility of integrating a goal for behavior and norm activation strategies into a framework and investigating the behavior of customers using value-belief–emotion–norm model [
75,
76,
77];
The fourth cluster, illustrated using purple, is formed by two researchers, Ulgiati S. and Brown MT., who describe the geobiosphere energy (available energy), investigating the patterns for a sustainable ecosystem and electricity production [
78,
79,
80];
The fifth cluster, colored in green, contains two authors, Yeomans JS. and Kozlova M., who explored the decision-making for carbon footprint by simulating decomposition and the impact for environmental sustainability, together with the investigation of technical evolution in aviation, the investments in simulation decomposition and the effects of sustainable decision-making [
81,
82,
83];
The sixth cluster, illustrated using red, has only two authors, Tuler S. and Webler T., who focused on public participation by using focus groups, Q method, or surveys and local governmental expectations from experts’ perspectives [
84,
85,
86,
87];
The seventh cluster, colored in blue, is formed by three researchers, Gregory R., Satterfield T., and Failing I., who provided an overview of the metrics in environmental management, discussing policies, cultural values, and environmental decision-making [
88,
89];
The eighth cluster, represented using gray, is formed by two authors, Gupta H. and Liu YQ., who explored the hydrologic implementation by integrating a data framework, connecting environmental decision-making with science in order to provide sustainable water resources or to develop a framework for environmental decision-making [
90,
91,
92];
The last cluster, illustrated using pink, contains two researchers, Marttunen M. and Hamalainen RP., who focused on multicriteria decision analysis using interview datasets, measuring the potential impact of the measures and creating a web decision support for participation in decision-making processes on environmental area [
93,
94,
95].
3.5. Mixed Analysis
This section explores how the keywords are grouped based on their topics and what is the correlation between universities, authors, countries, journals, and keywords.
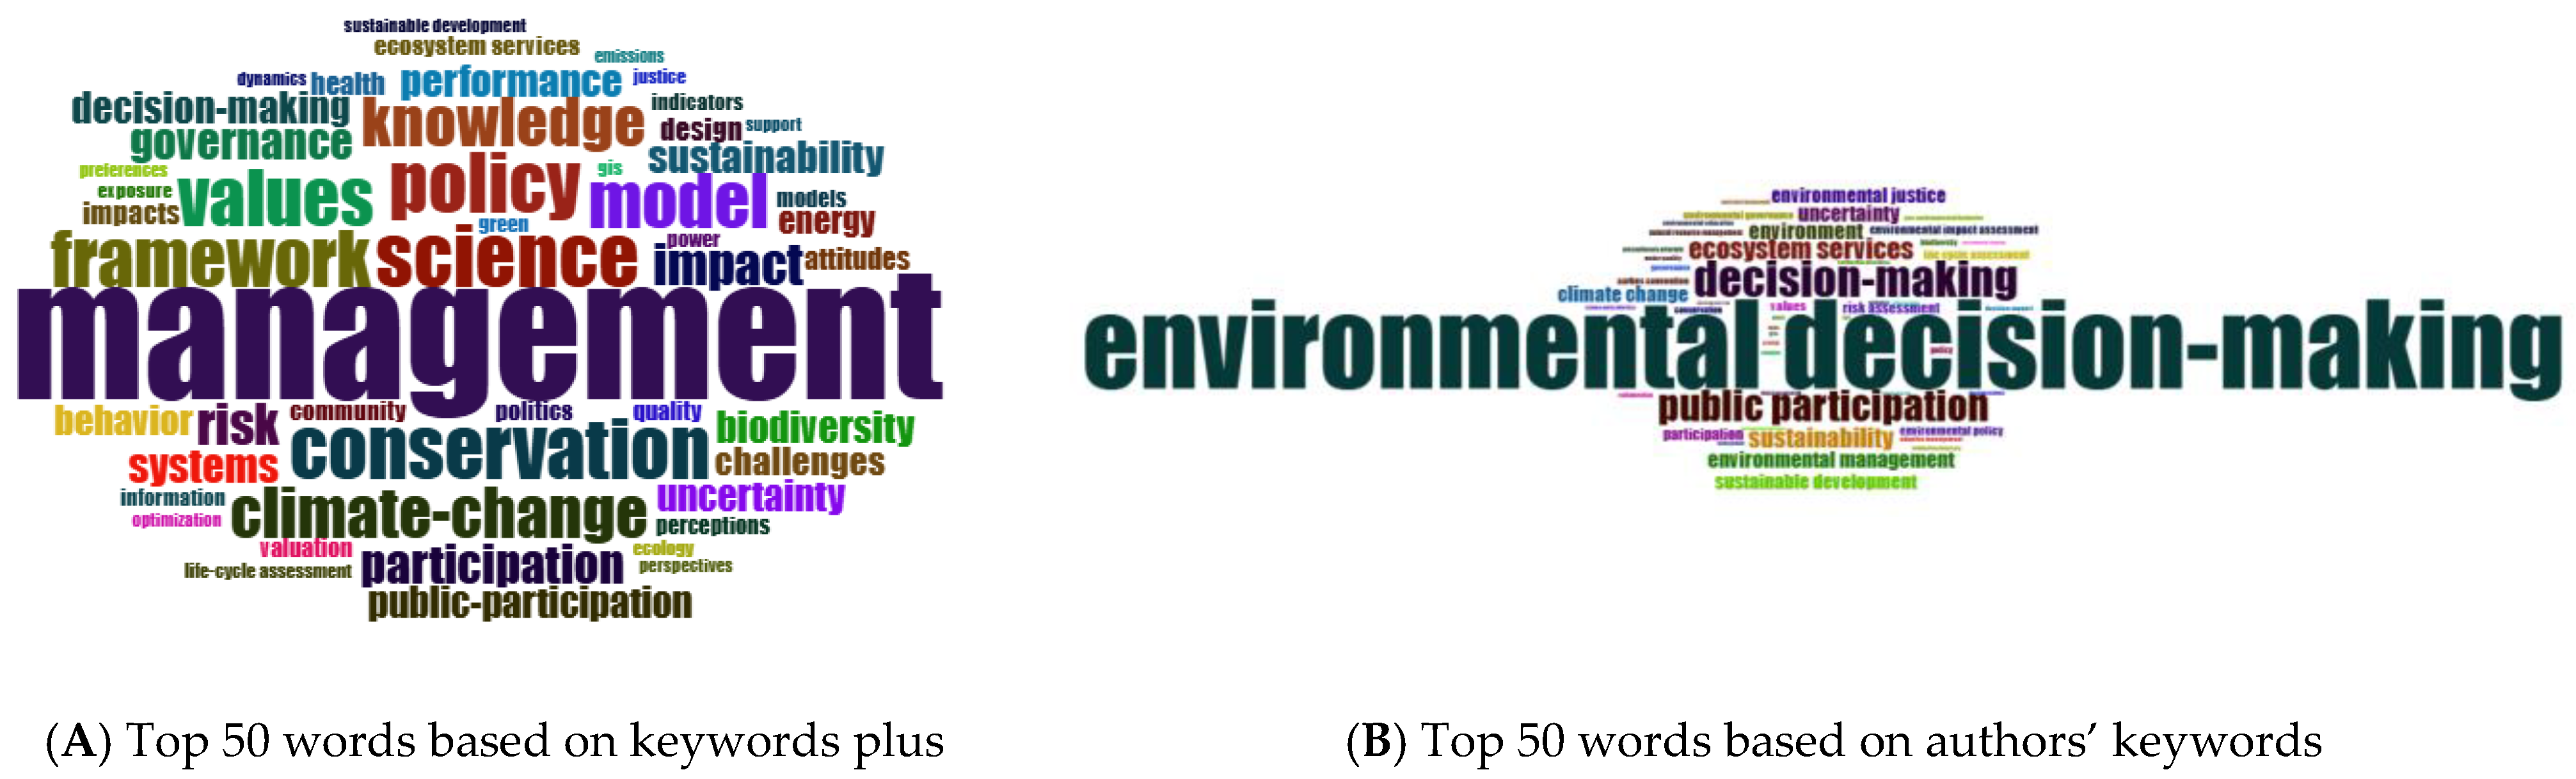
Figure 20 grouped the most used 250 keywords plus in different topics, with a label size of 0.3, a minimum cluster frequency per thousand documents of 15, and 3 for the number of labels. The most representative cluster is colored in red and focuses on developing a framework that is designed to include the impact, biodiversity, conservation, and management of environmental areas. The most important terms are “
management” (157 occurrences), “
conservation” (71 occurrences), “
framework” (66 occurrences), “
systems” (40 occurrences), “
sustainability” (38 occurrences), “
biodiversity” (37 occurrences), “
uncertainty” (36 occurrences), “
challenges” (34 occurrences), “
design” (27 occurrences), and “
impacts” (27 occurrences). The second cluster, represented by blue, explores the policies, politics, and governance of science and public participation. The most frequently used keyword is “
science” (74 appearances), followed by “
policy” (70 appearances), “
knowledge” (58 appearances), “
participation” (45 appearances), “
governance” (42 appearances), “
public-participation” (36 appearances), “
community” (23 appearances), “
politics” (23 appearances), “
information” (20 appearances), and “
power” (19 appearances). On the top left part of the graph is the third most relevant cluster, colored light blue, explaining the attitudes, behavior, perceptions, and values of the green environmental and ecological methods. The most used keywords are “
values” (56 occurrences), “
behavior” (35 occurrences), “
attitudes” (26 occurrences), “
perceptions” (21 occurrences), and “
green” (19 occurrences). In the bottom part of the graphical representation is the fourth cluster, colored in green, which includes terms related to the impact, performance, and risks of the used models. The terms existing in the green cluster are “
model” (64 appearances), “
impact” (48 appearances), “
risk” (48 appearances), and “
performance” (38 appearances). The last two clusters, light brown and pink clusters, each contain two terms and explore the terms “
climate-change” (59 occurrences) and “
climate-change” (37 occurrences), respectively, and “
energy” (31 appearances) and “
indicators” (20 appearances).
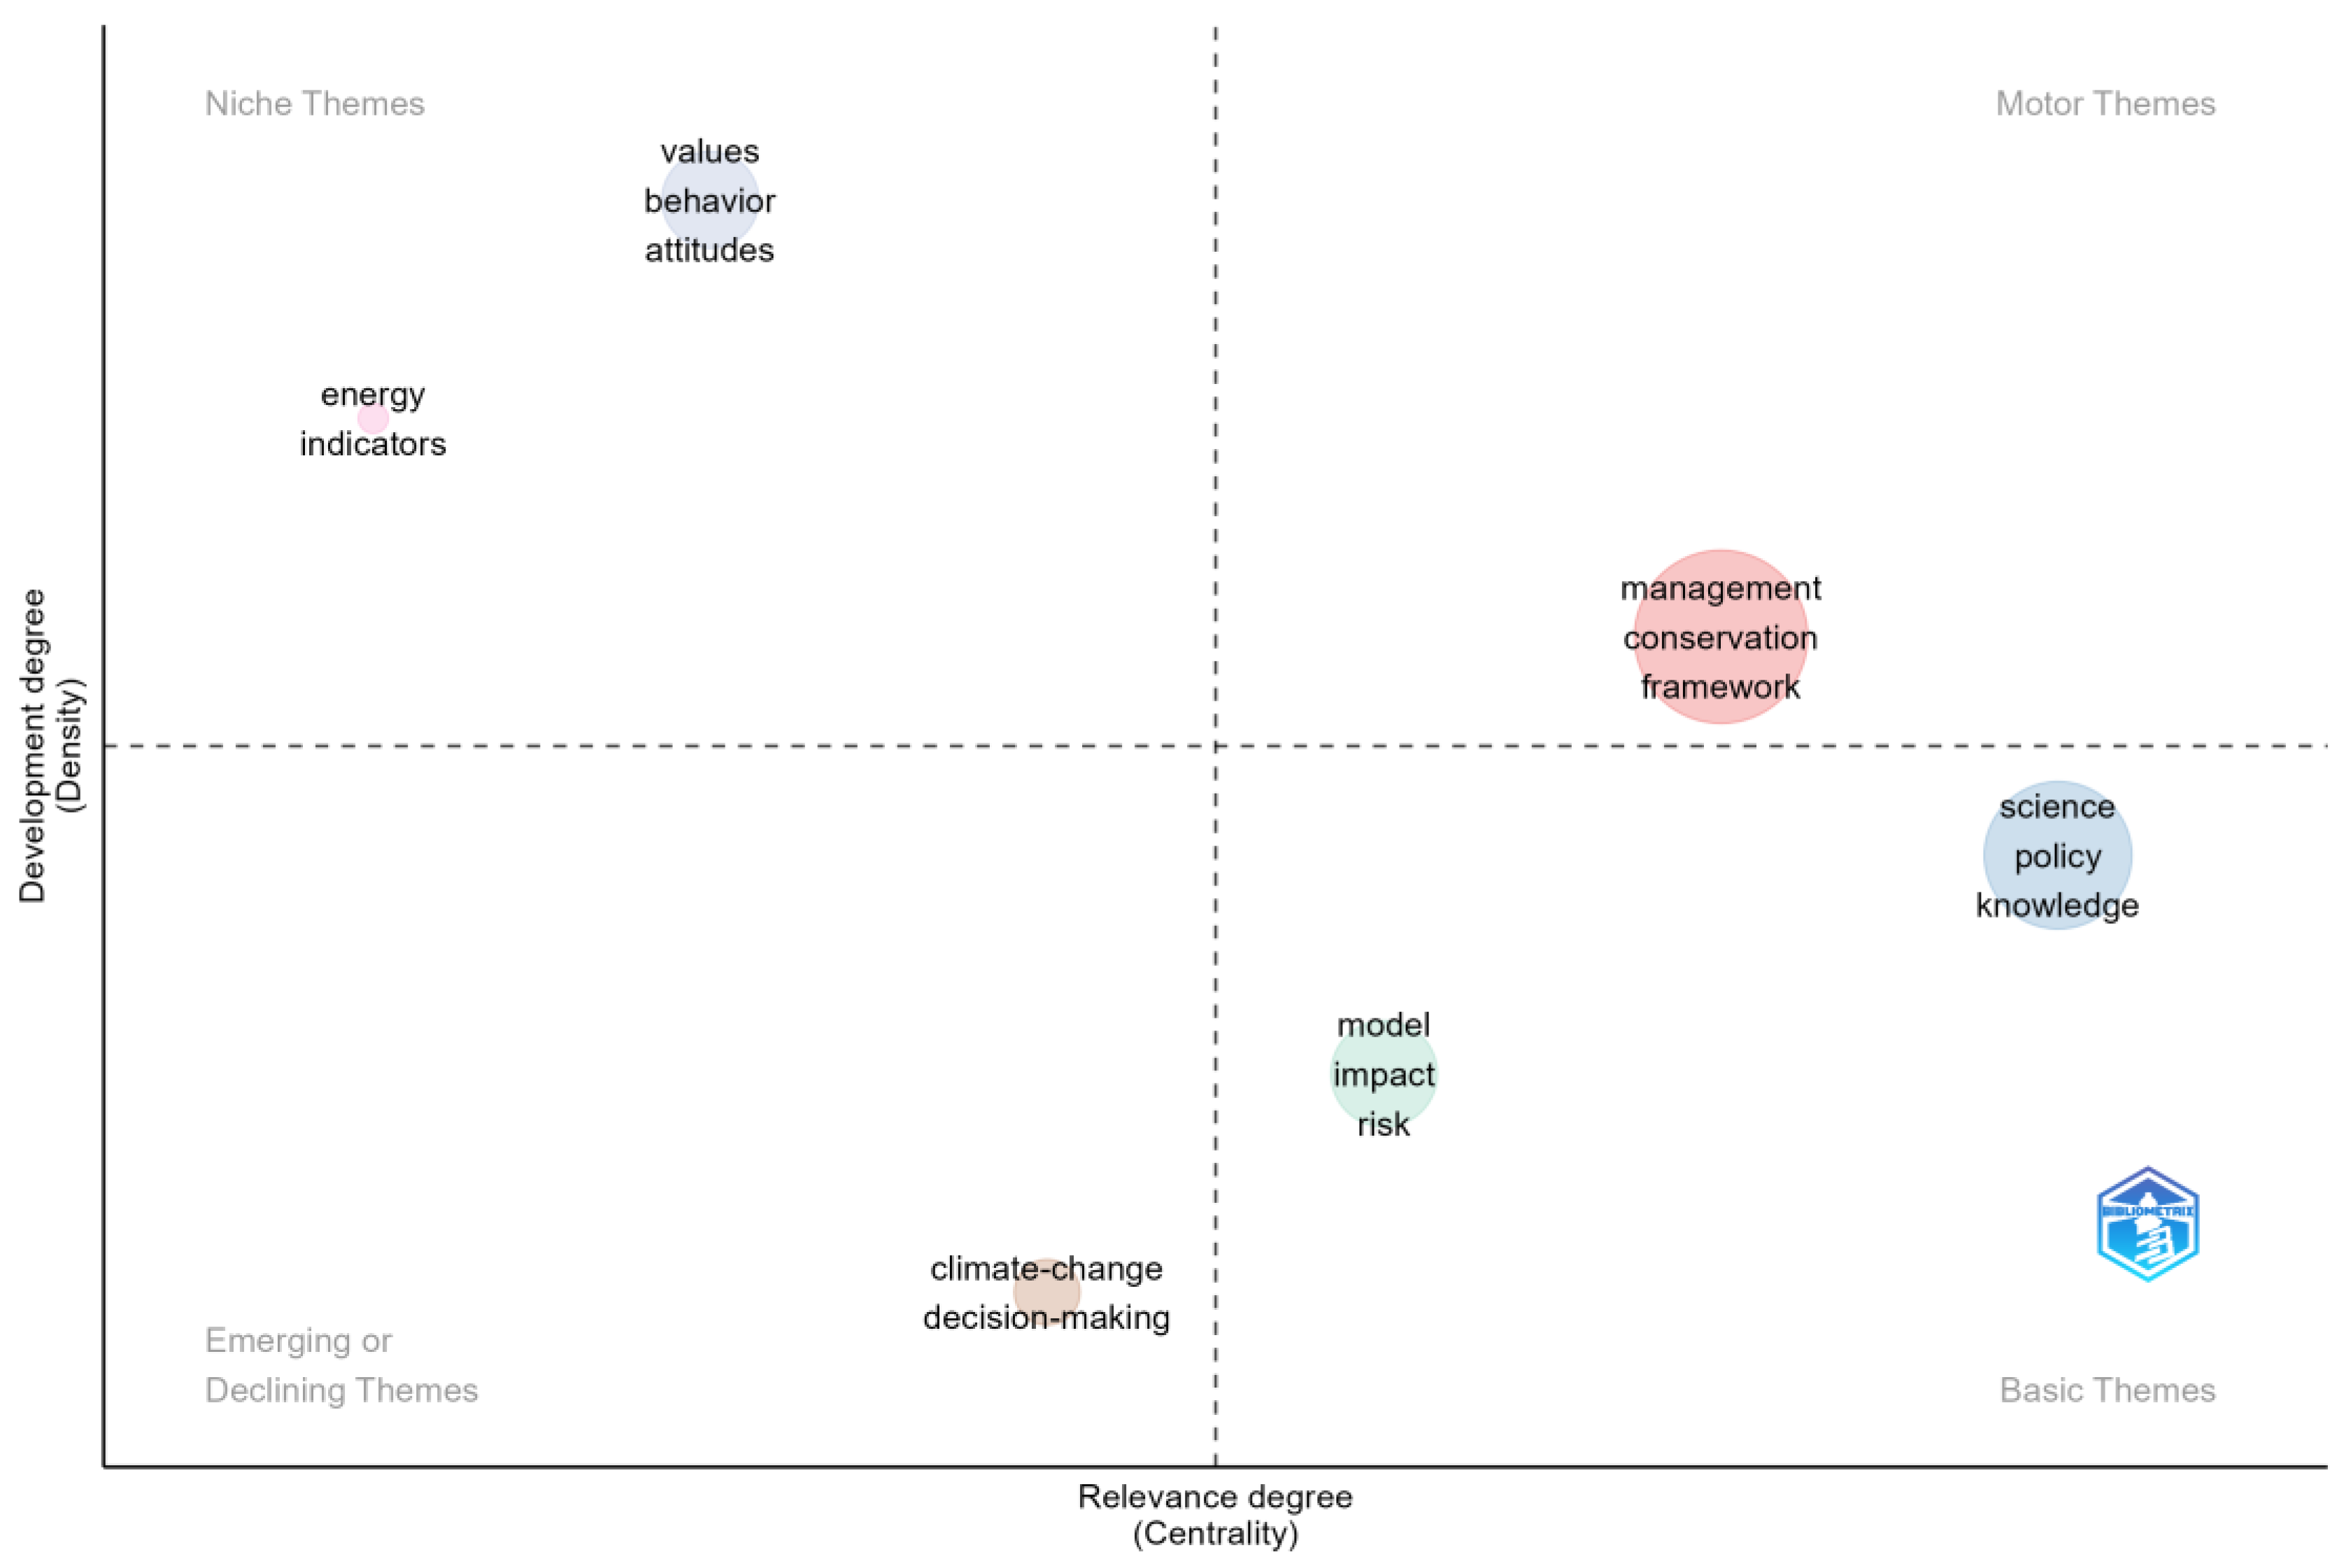
Based on this analysis, the authors can observe different values for centrality and density. The centrality metric highlights the relevance of keywords in the aforementioned analyzed themes. The density metric calculates the degree to which the research has developed by exploring internal associations of the keywords with the actual topics of the paper. This clustering of the 250 most frequently used keywords provides valuable insights into the focus areas of the academic literature. The findings reveal six different clusters, each defined by a specific keyword, thematic focus, and various levels of centrality and density. These clusters also signal an interconnection between these subfields of research.
The red cluster reflects the importance of developing frameworks for environmental management, the conservation of biodiversity, as well as sustainability. In turn, this also suggests the need to create a more structural approach to address environmental challenges. The blue cluster focuses on policies, governance, and public participation, reflecting keywords such as “science”, “policy”, and “participation”. This signals a reliance on stakeholder engagement and public participation at a policy level.
The light blue cluster focuses on attitudes, behaviors, perceptions, and consumer values. Words such as “values”, “behavior”, and “attitudes” emphasize the psychological aspect of driving an environmental change. Its low centrality but high density suggests that this is a specialized area with well-developed internal associations but limited external connections to the other terms.
The green cluster explores models, performance, and risks, underscoring the technical and analytical aspects of environmental research. Keywords such as “model”, “impact”, and risk point to academic research assessing the effectiveness of various frameworks and methodologies. This cluster has a medium centrality, which signals a moderate relevance across themes and a much less developed internal structure.
The light brown and pink clusters address climate change and energy indicators. The repetition of “climate change” as a term in both clusters shows its critical importance in research, while “energy” and “indicators” signal more specialized academic studies focused on sustainability metrics.
In conclusion, the distribution of centrality and density across these clusters provides a more nuanced understanding of the current state of research. Clusters with high centrality, such as red and blue, are guiding toward broad and impactful themes that connect multiple areas of academic research. In turn, clusters with high density but low centrality, like blue and pink, reflect more specialized yet really well-established subfields.
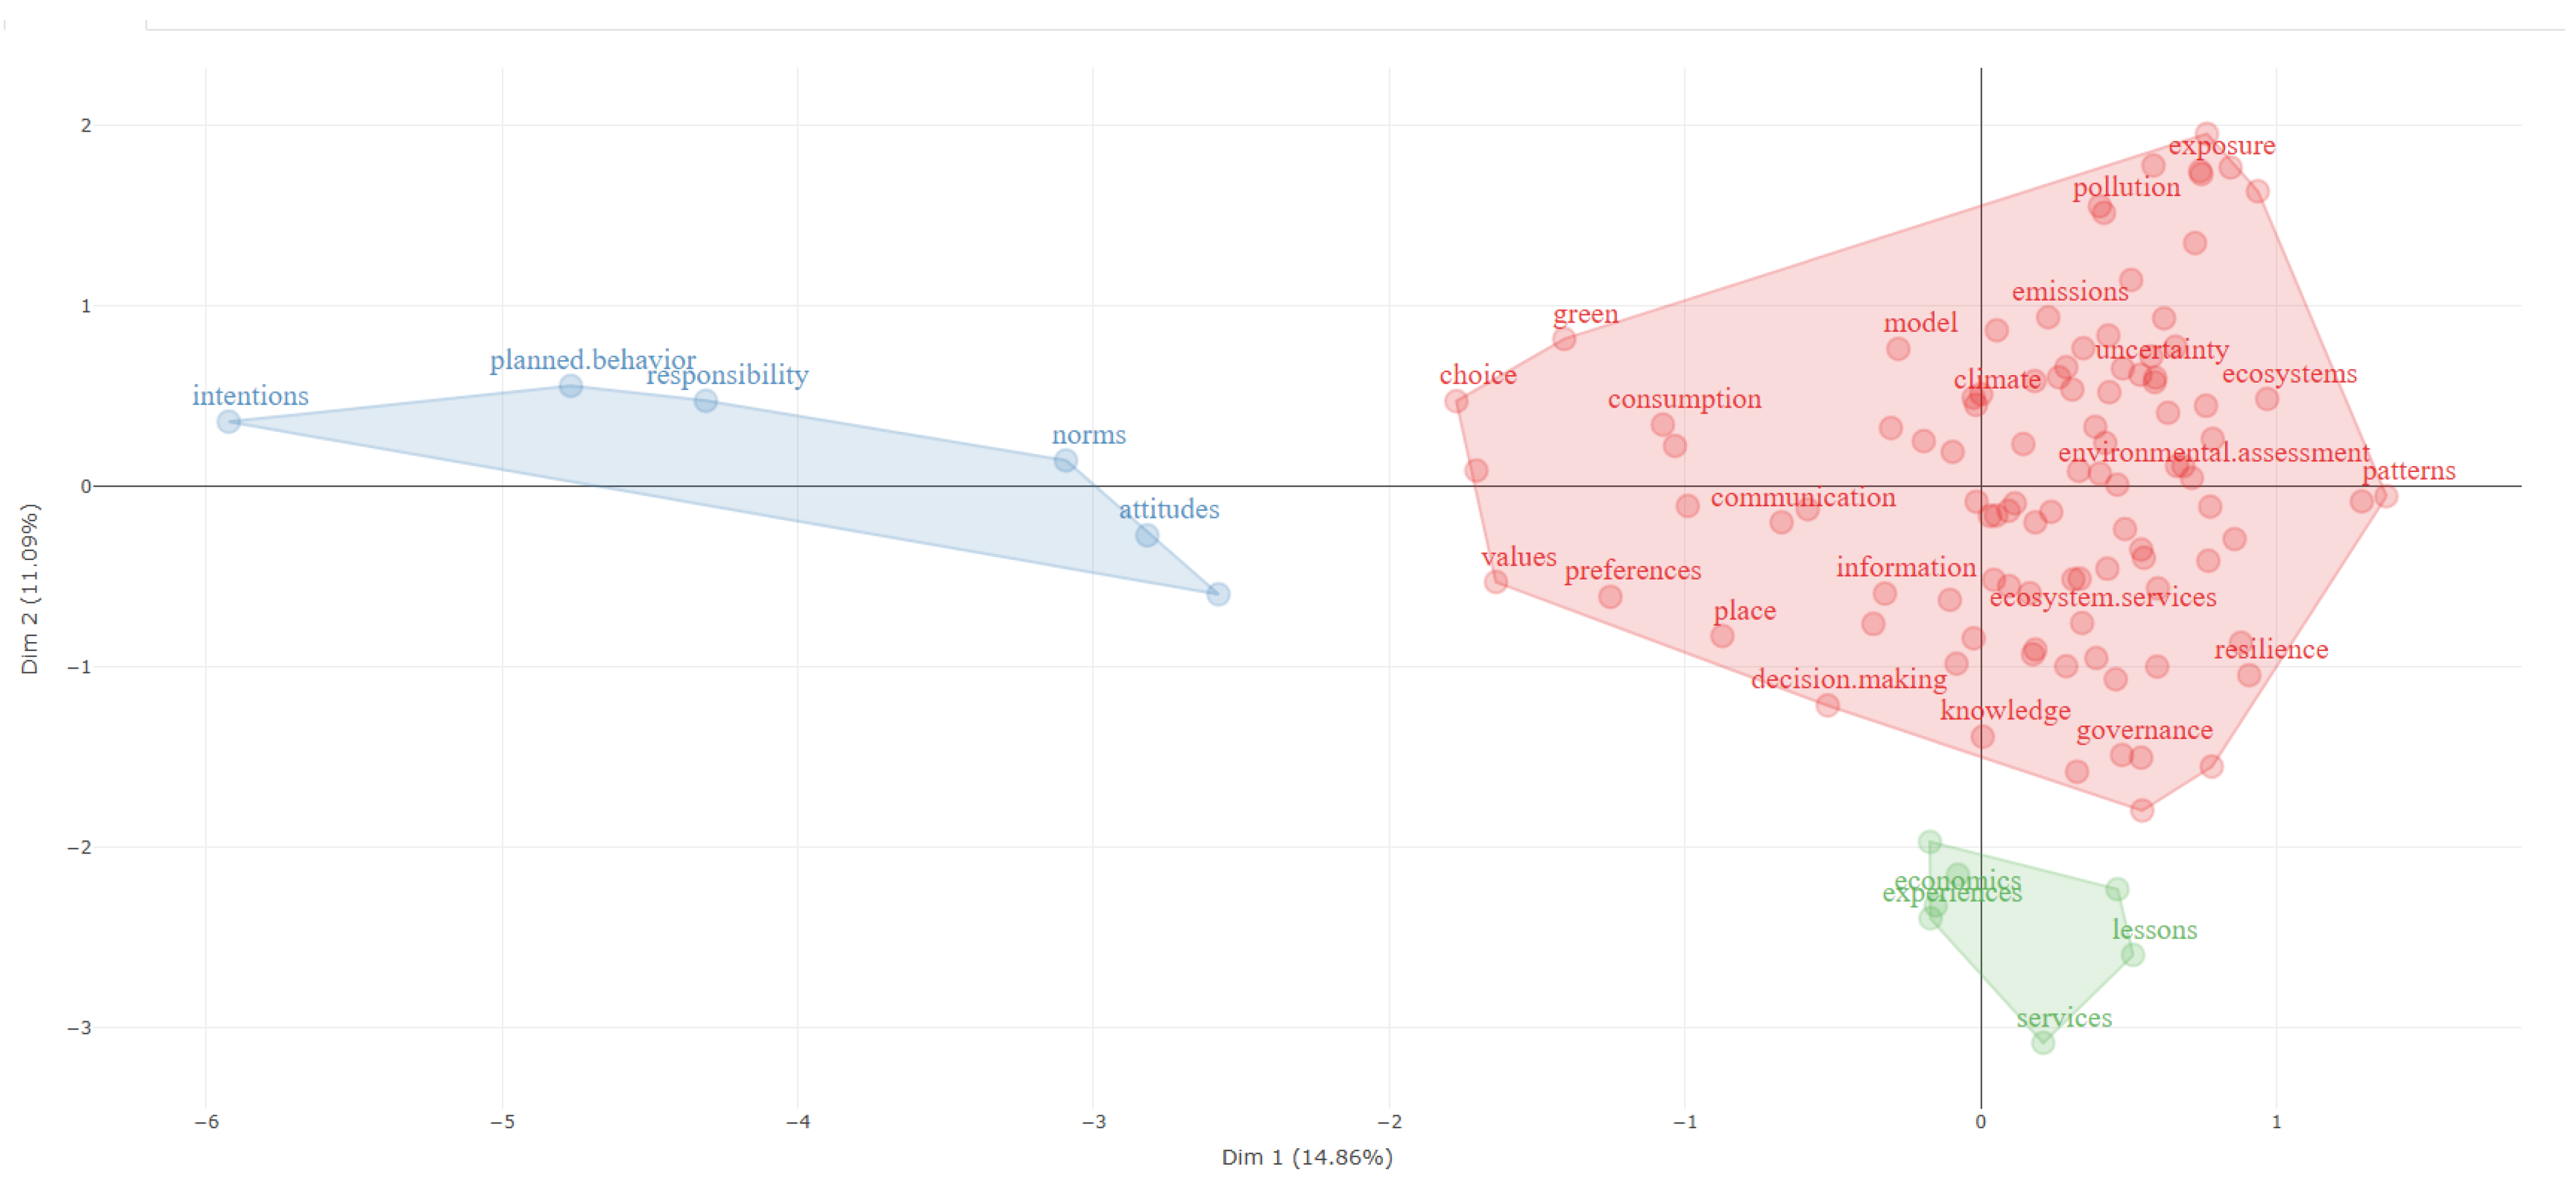
Figure 21 represents a factorial analysis of the 100 most used authors’ keywords using the multiple correspondence analysis method. The terms were grouped into three different clusters. The most representative is the red one, containing terms referring to “
governance”, “
resilience”, “
decision-making”, “
environment”, and “
ecosystems”. The second cluster is colored in blue and focuses on the “
responsibility”, “
intentions”, “
planned behavior”, “
norms”, and “
attitudes” of each member of the society, while the last cluster, represented using green, explores the “
lessons”, “
experiences”, and “
services” of the “
economics” area.
From this factorial analysis, the authors can observe that the red cluster is the most representative, focusing on terms such as “governance”, “resilience”, “decision making”, “environment”, and “ecosystems”. This demonstrates the integration of policy frameworks and decision-making processes and methodologies in managing environmental systems as well as building resilience within ecosystems.
The blue cluster focuses on societal and behavioral aspects, noticeable from keywords such as “responsibility”, “intentions”, “planned behaviors”, and “norms”. This reflects research that explores individual as well as collective behavior, values, and norms that can influence environmental and sustainability outcomes. From this, it can be inferred that behavioral and psychological theories, such as the nudge theory mentioned in the Introduction, play a big role in understanding how individuals shape sustainable practices and decision-making processes.
The green cluster addresses the economic dimensions of environmental research with keywords such as “experiences”, “services”, and “economics”. This suggests a focus on economic emulation, cost–benefit analysis, and the application of economic principles to environmental challenges. This cluster also points to an emphasis on using economic insights to guide decision-making and policy development in environmental management.
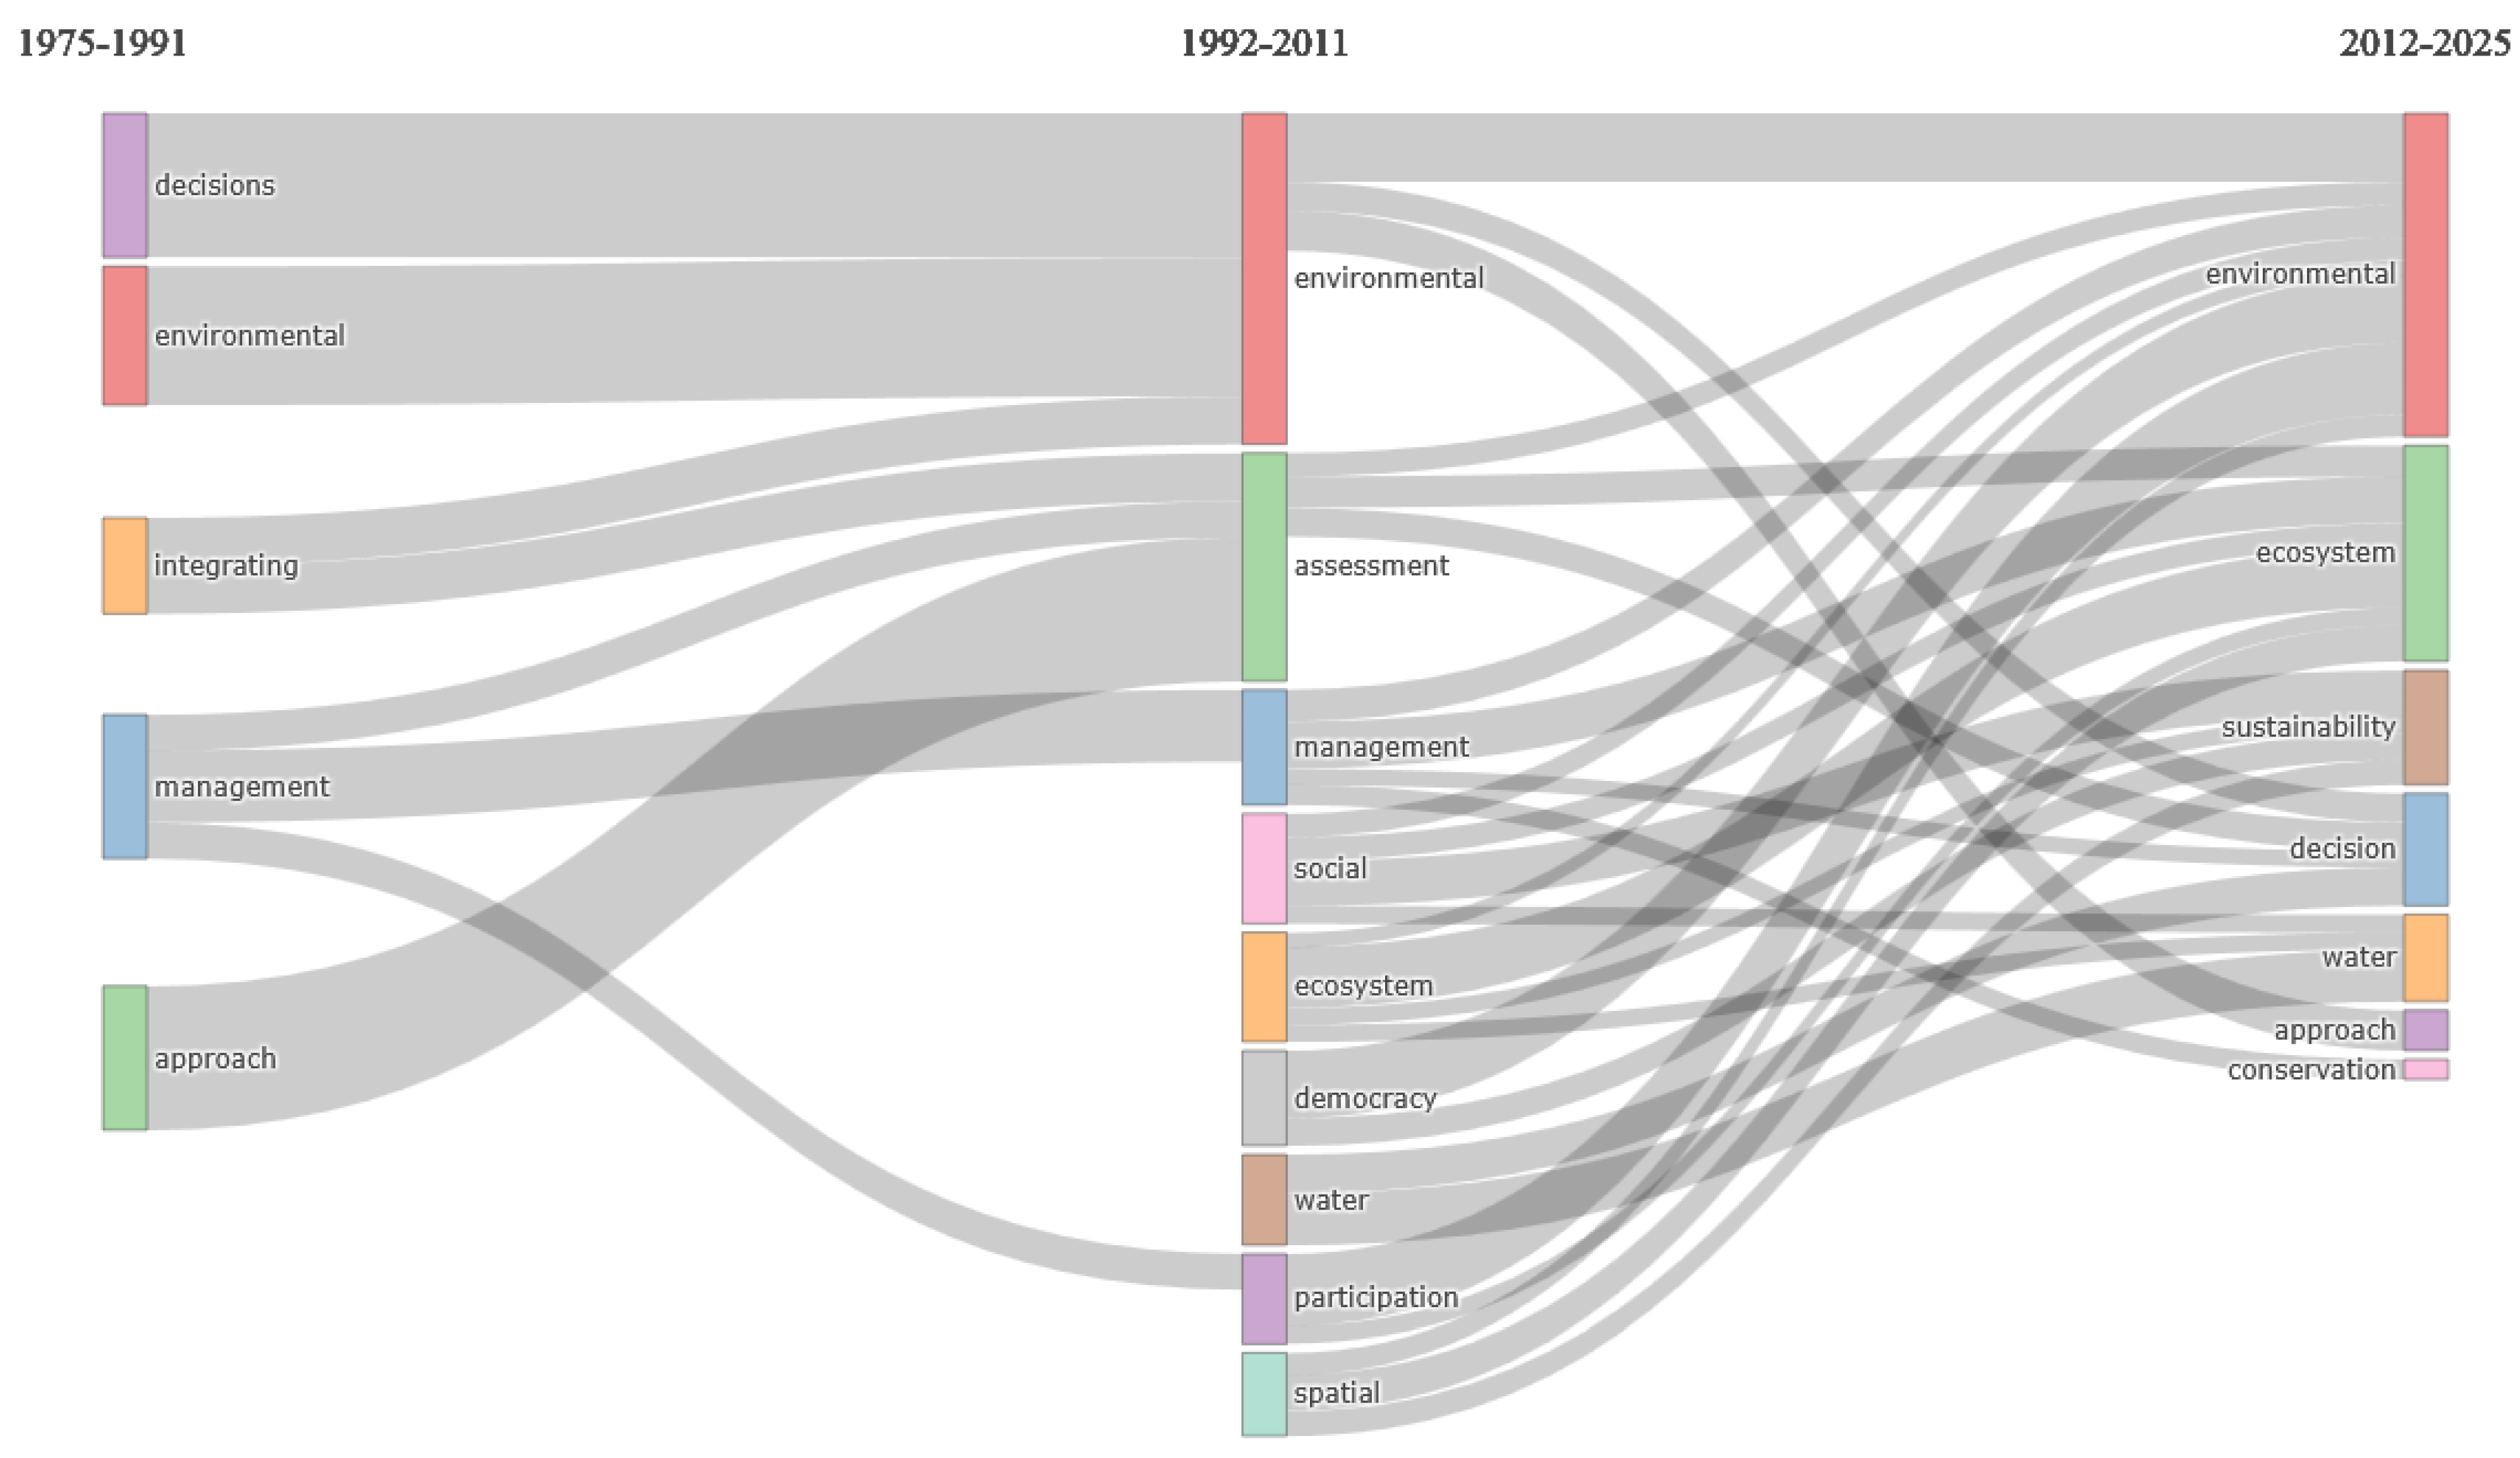
The thematic evolution, visualized in
Figure 22, highlights the trajectory of research themes related to environmental decision-making in three different periods through the use of unigrams extracted from the titles of the papers included in the database.
The 1975–1991 period captures foundational themes, especially in the field of decision-making. During this period, as seen in the graph, the research predominantly revolved around foundational concepts, such as “decision making”, “environmental”, “management”, and “approach”. These thematic titles are reflective of the efforts of integrating decision-making into environment-related fields. Behavioral economics was emerging as a research field, and so its core principles—such as bounded rationality and cognitive biases—were beginning to influence how decisions were conceptualized [
102].
The second period, 1992–2011, saw a thematic expansion of the titles in areas such as “assessment”, “ecosystem”, “social”, and “participation”. This shift can be indirectly related to the growth of behavioral economics research, including the recognition of the social and ecological dimensions of environmental decision-making. The field of behavioral economics contributed a large amount to this by examining how cognitive biases, such as optimism bias and present bias, influenced environmental policy design. Some key insights from behavioral economics in this phase are social norms, which play a role in social influences in driving eco-conscious behavior, such as participation in conservation efforts or adopting sustainable practices [
103].
In the third period, from 2012 onwards, title themes such as “sustainability”, “decisions”, “conservation”, and “water” also appeared. This could reflect a more integrated approach that combines both behavioral insights with sustainability goals. In line with the evolution of behavioral economics, nudges, and defaults emerged as a framework to shape decision-making. This perspective has been key in designing policies that are in line with behavior and drive conservation efforts [
104].
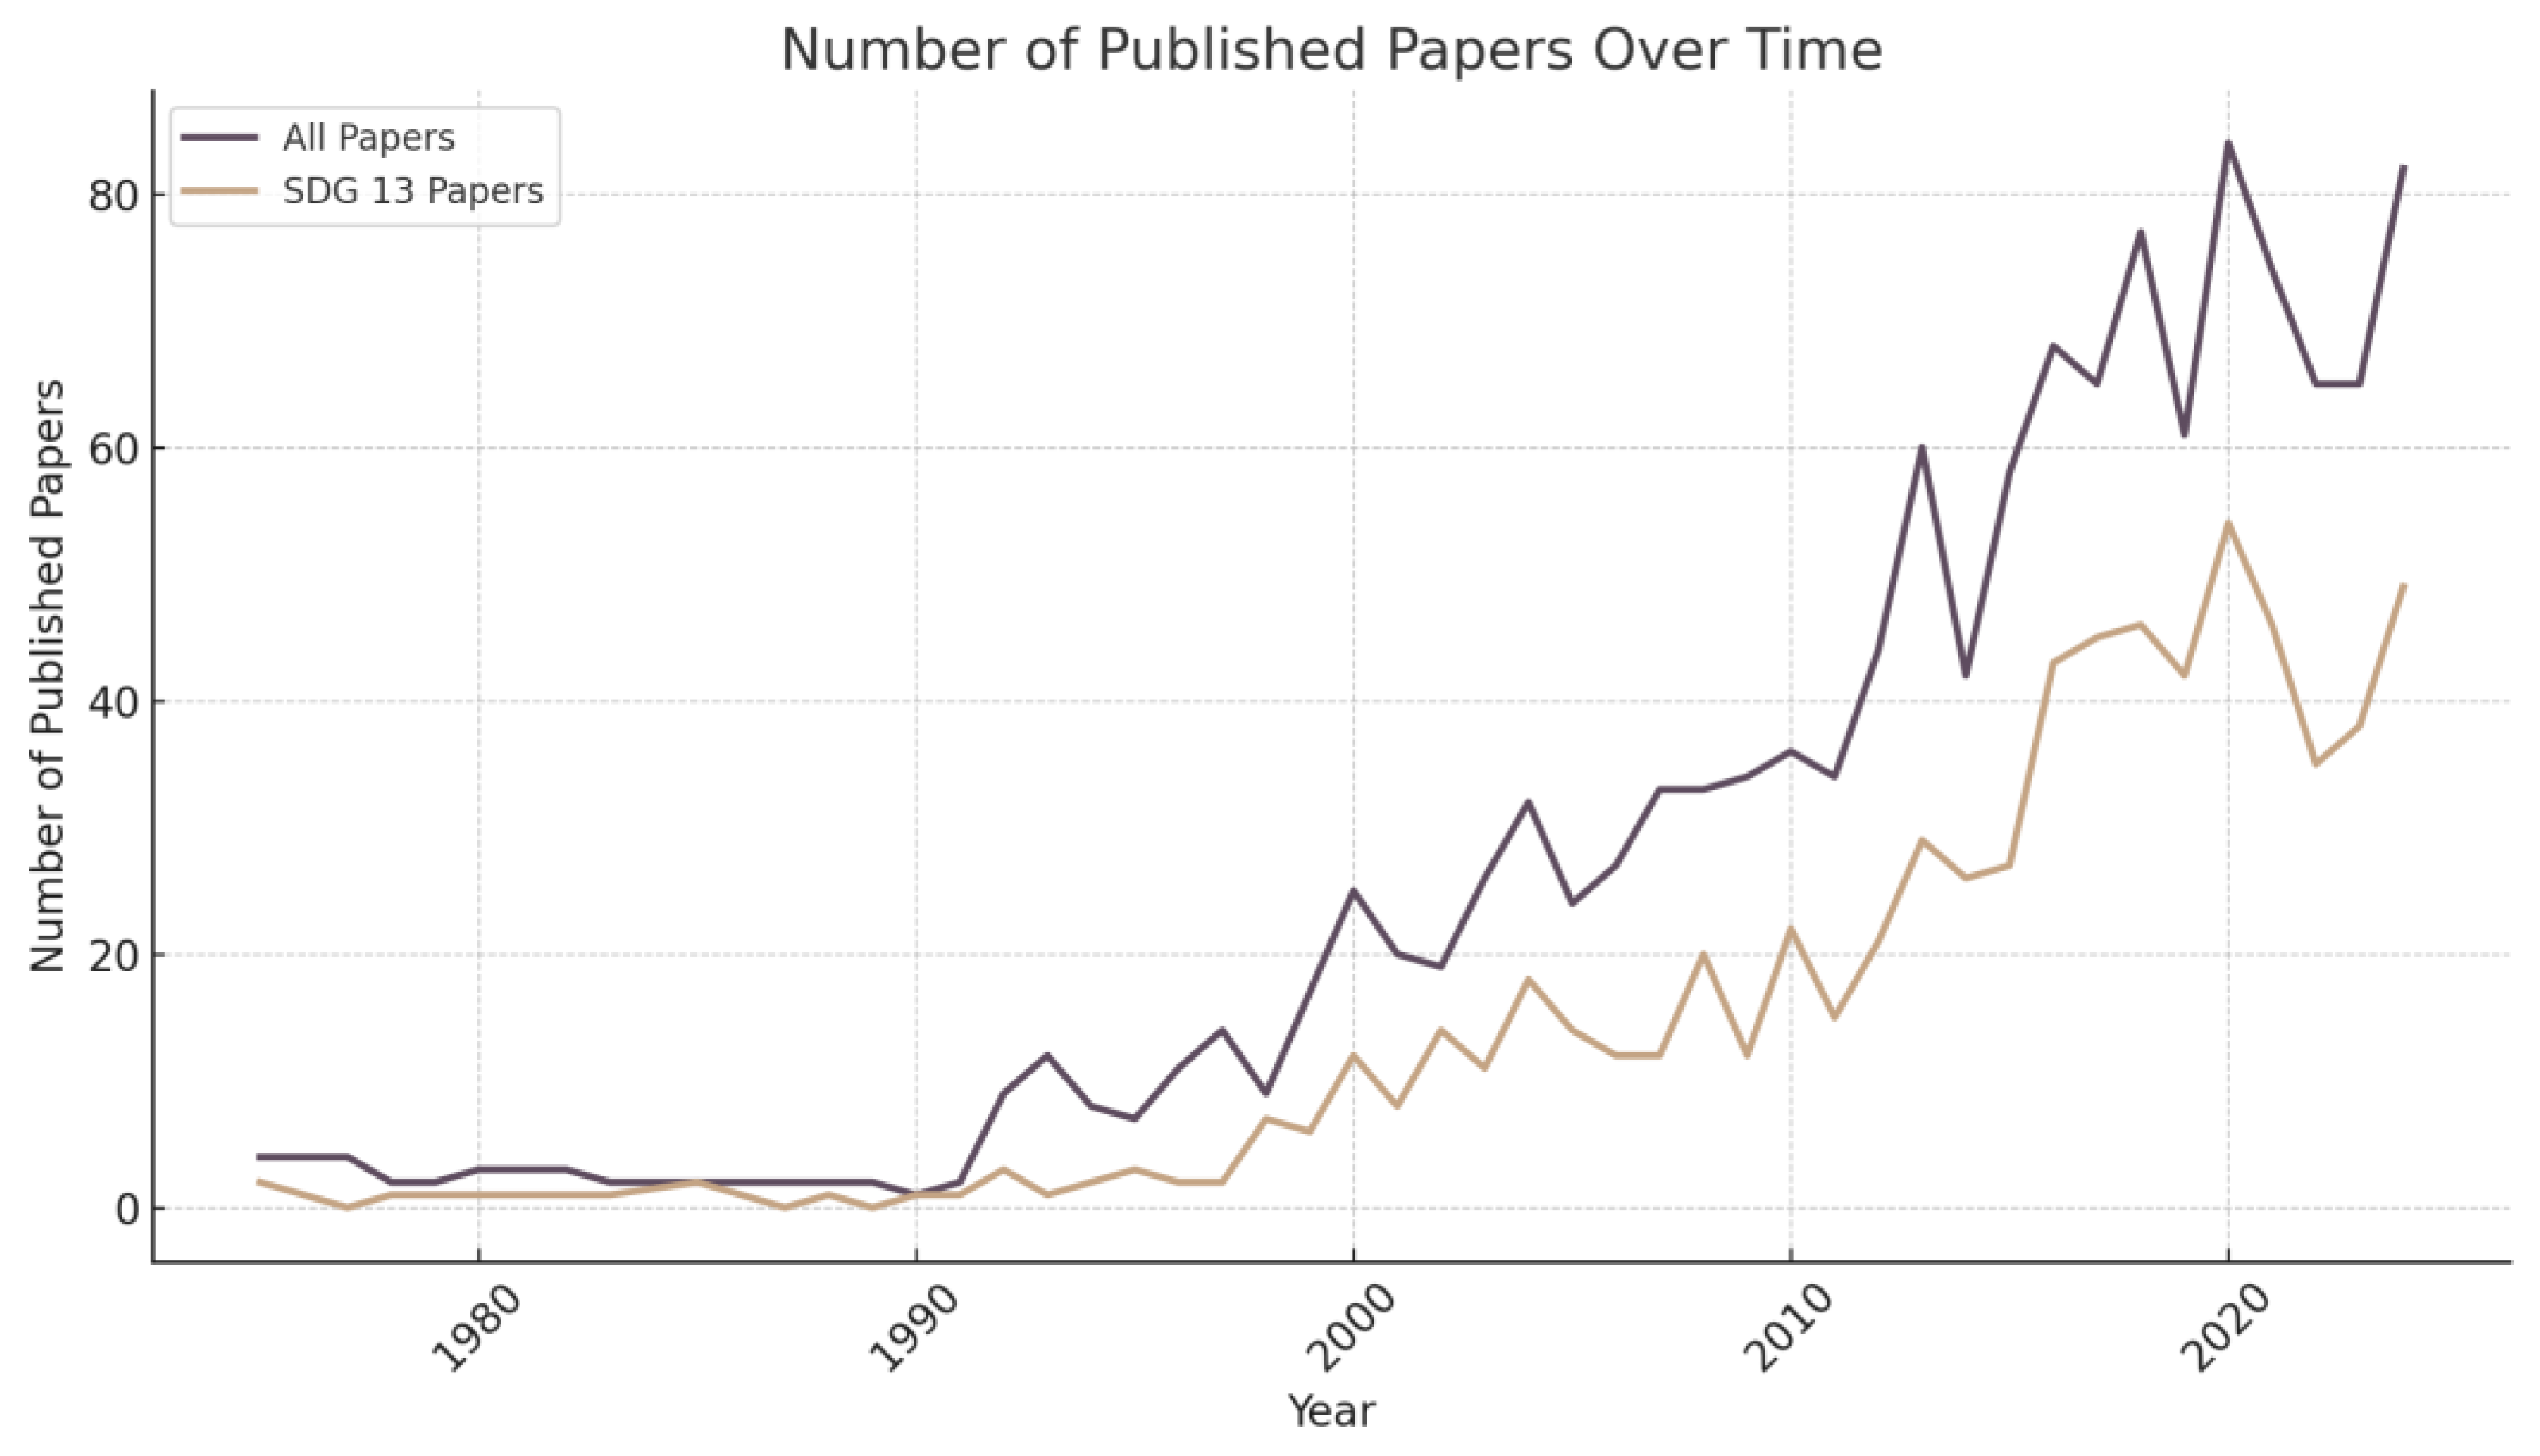
In order to have a more faceted analysis of the selected domain and due to the fact that the selected keywords for extracting the dataset are mainly related to Sustainable Development Goal (SDG) 13: Climate Action, the number of papers connected to this SDG has been extracted from ISI WoS, and a comparative evolution between the overall number of papers and the papers associated with SDG 13 has been conducted.
Figure 23 presents the evolution of the two-mentioned indicators. From
Figure 23, a particularly significant increase in the number of papers can be observed after 2015, when the Paris Agreement raised the overall awareness of climate change and sustainability. This was also the year in which international policy efforts started to be seen at a global level. As previously noted, the number of publications has continued to increase in the period analyzed. Interestingly, it can be observed that the number of papers associated with SDG 13 has followed the same trajectory, with a significant number of papers being related to this SDG from the total number of papers, highlighting once more the interest of the academic community toward the SDGs remaining strong.
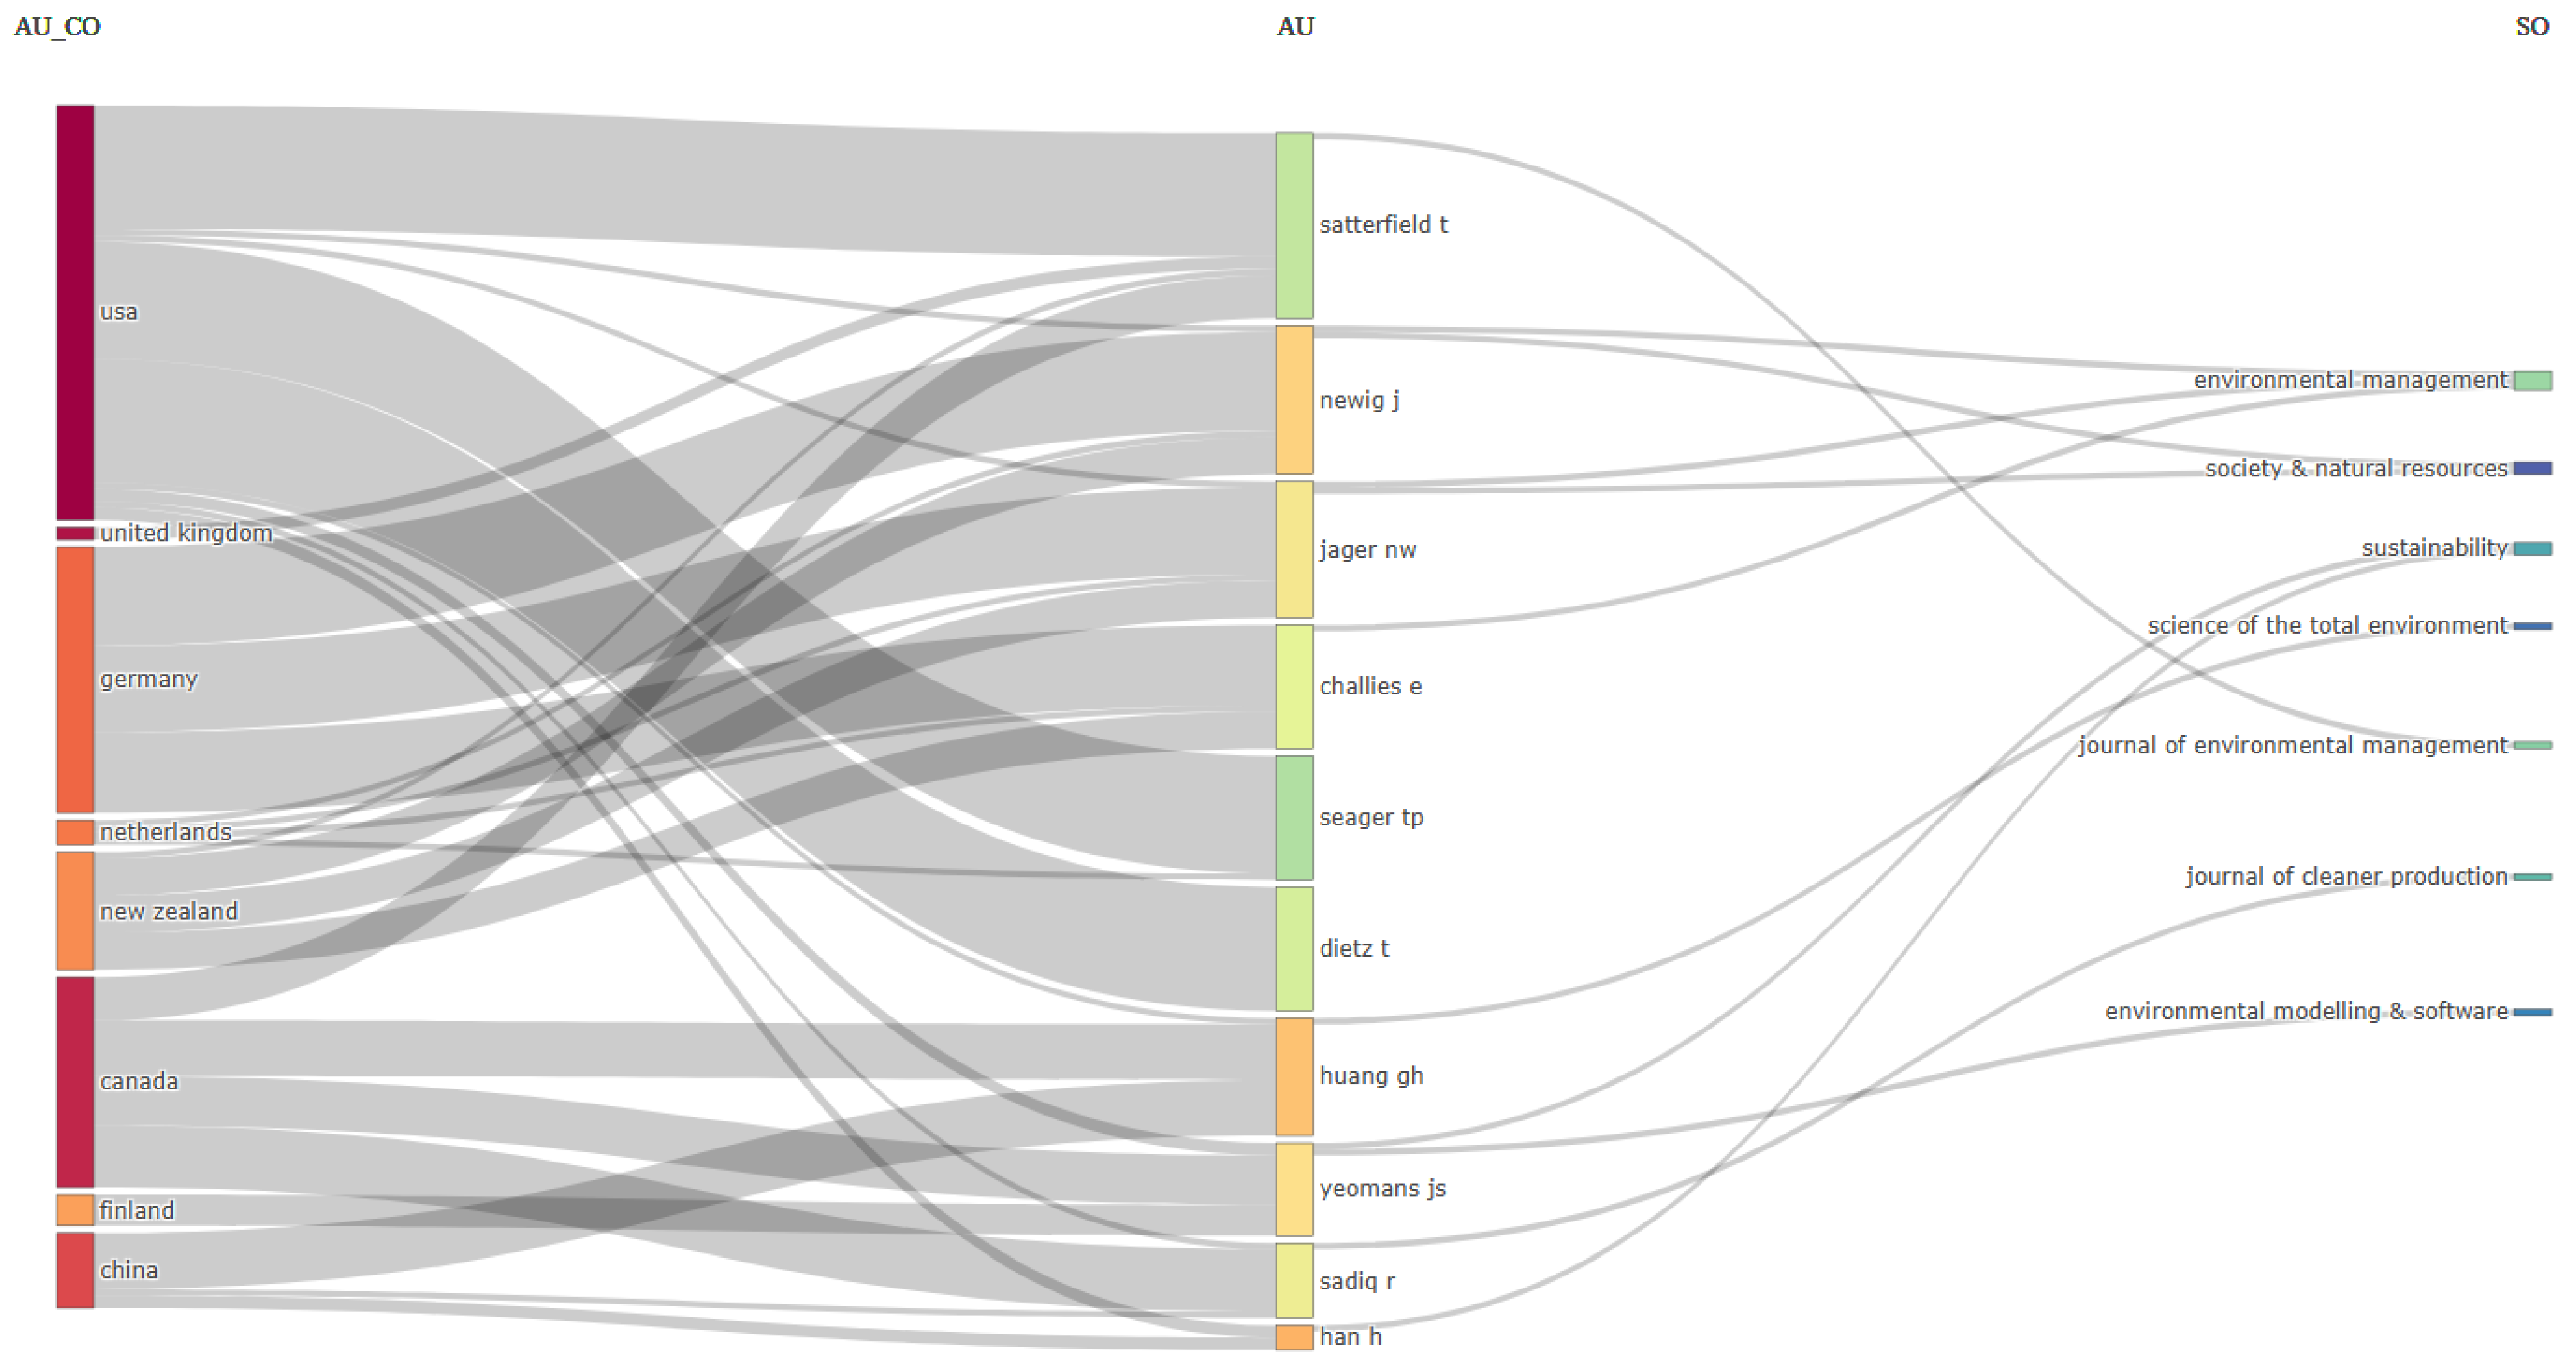
Figure 24 combines the countries, authors, and sources to provide an overview of all three elements. The most important countries from the perspective of the number of publications are the USA, Germany, and Canada. At the same time, Satterfield T., Newig J., and Jager NW. are the primary authors who published in
Environmental Management,
Society & Natural Resources, and
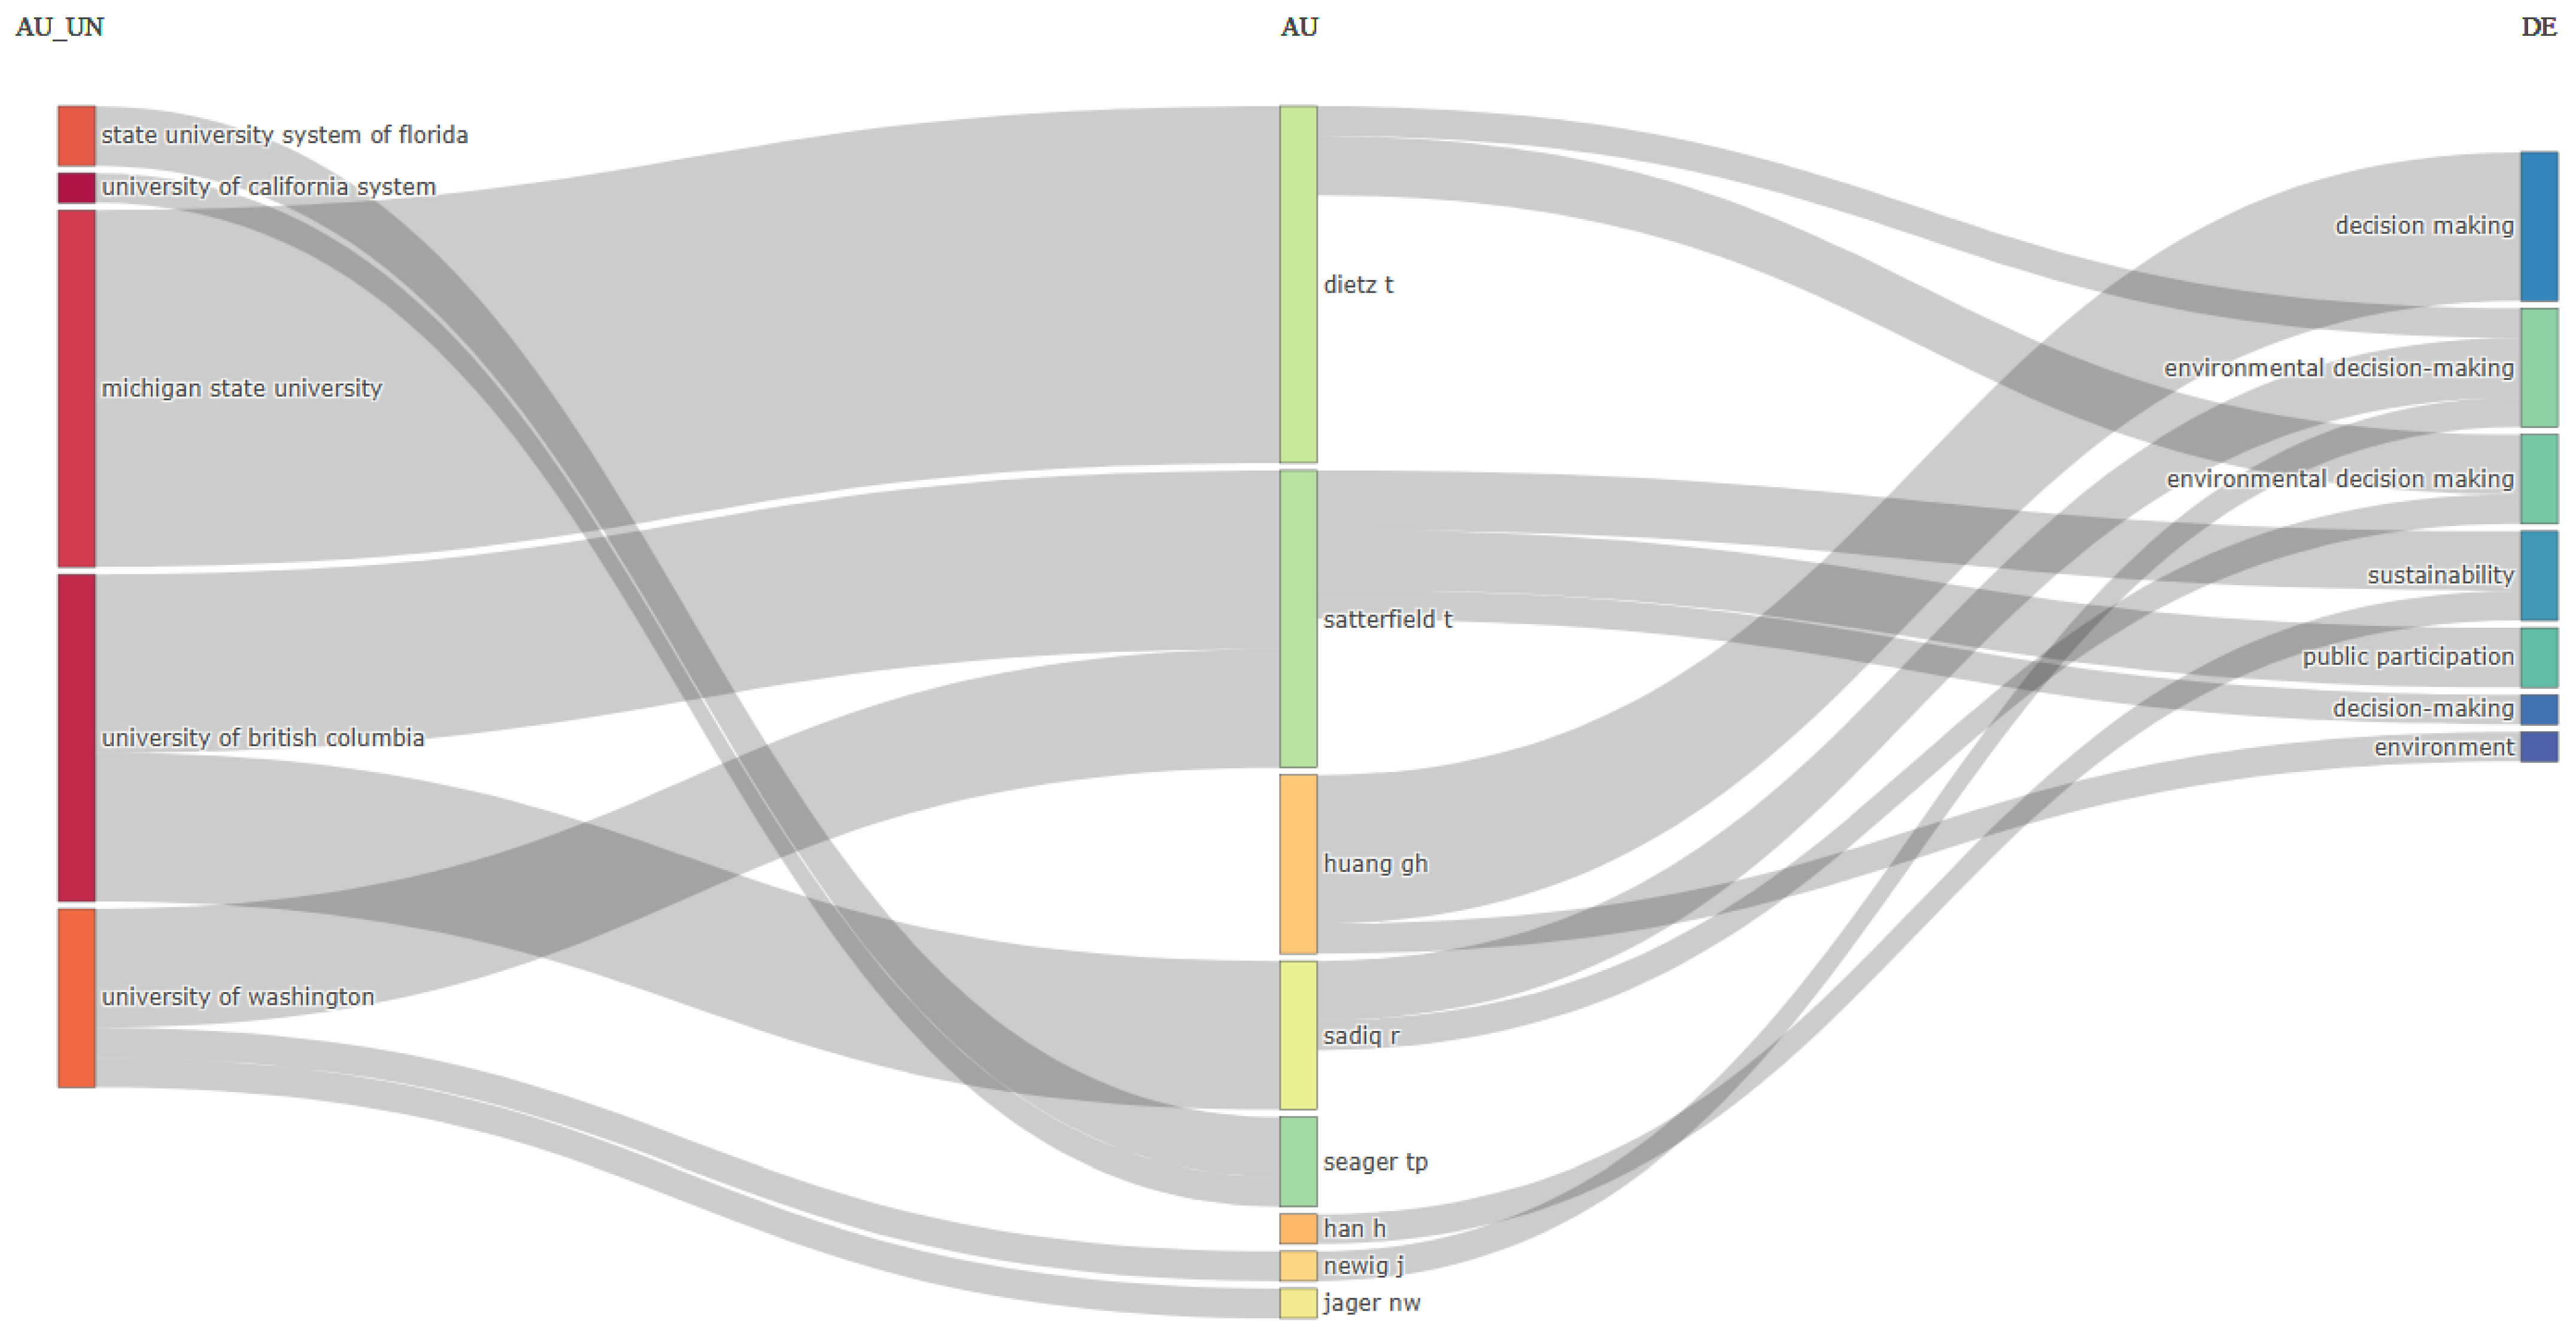
Sustainability. Figure 25 defines the combination of universities, authors, and keywords. The most representative affiliations are
Michigan State University,
the University of British Columbia, and the
University of Washington. At the same time, the most significant authors who contributed to the analyzed areas are
Dietz T.,
Satterfield T., and
Huang GH, who explored
decision-making,
sustainability, and
public participation.


