


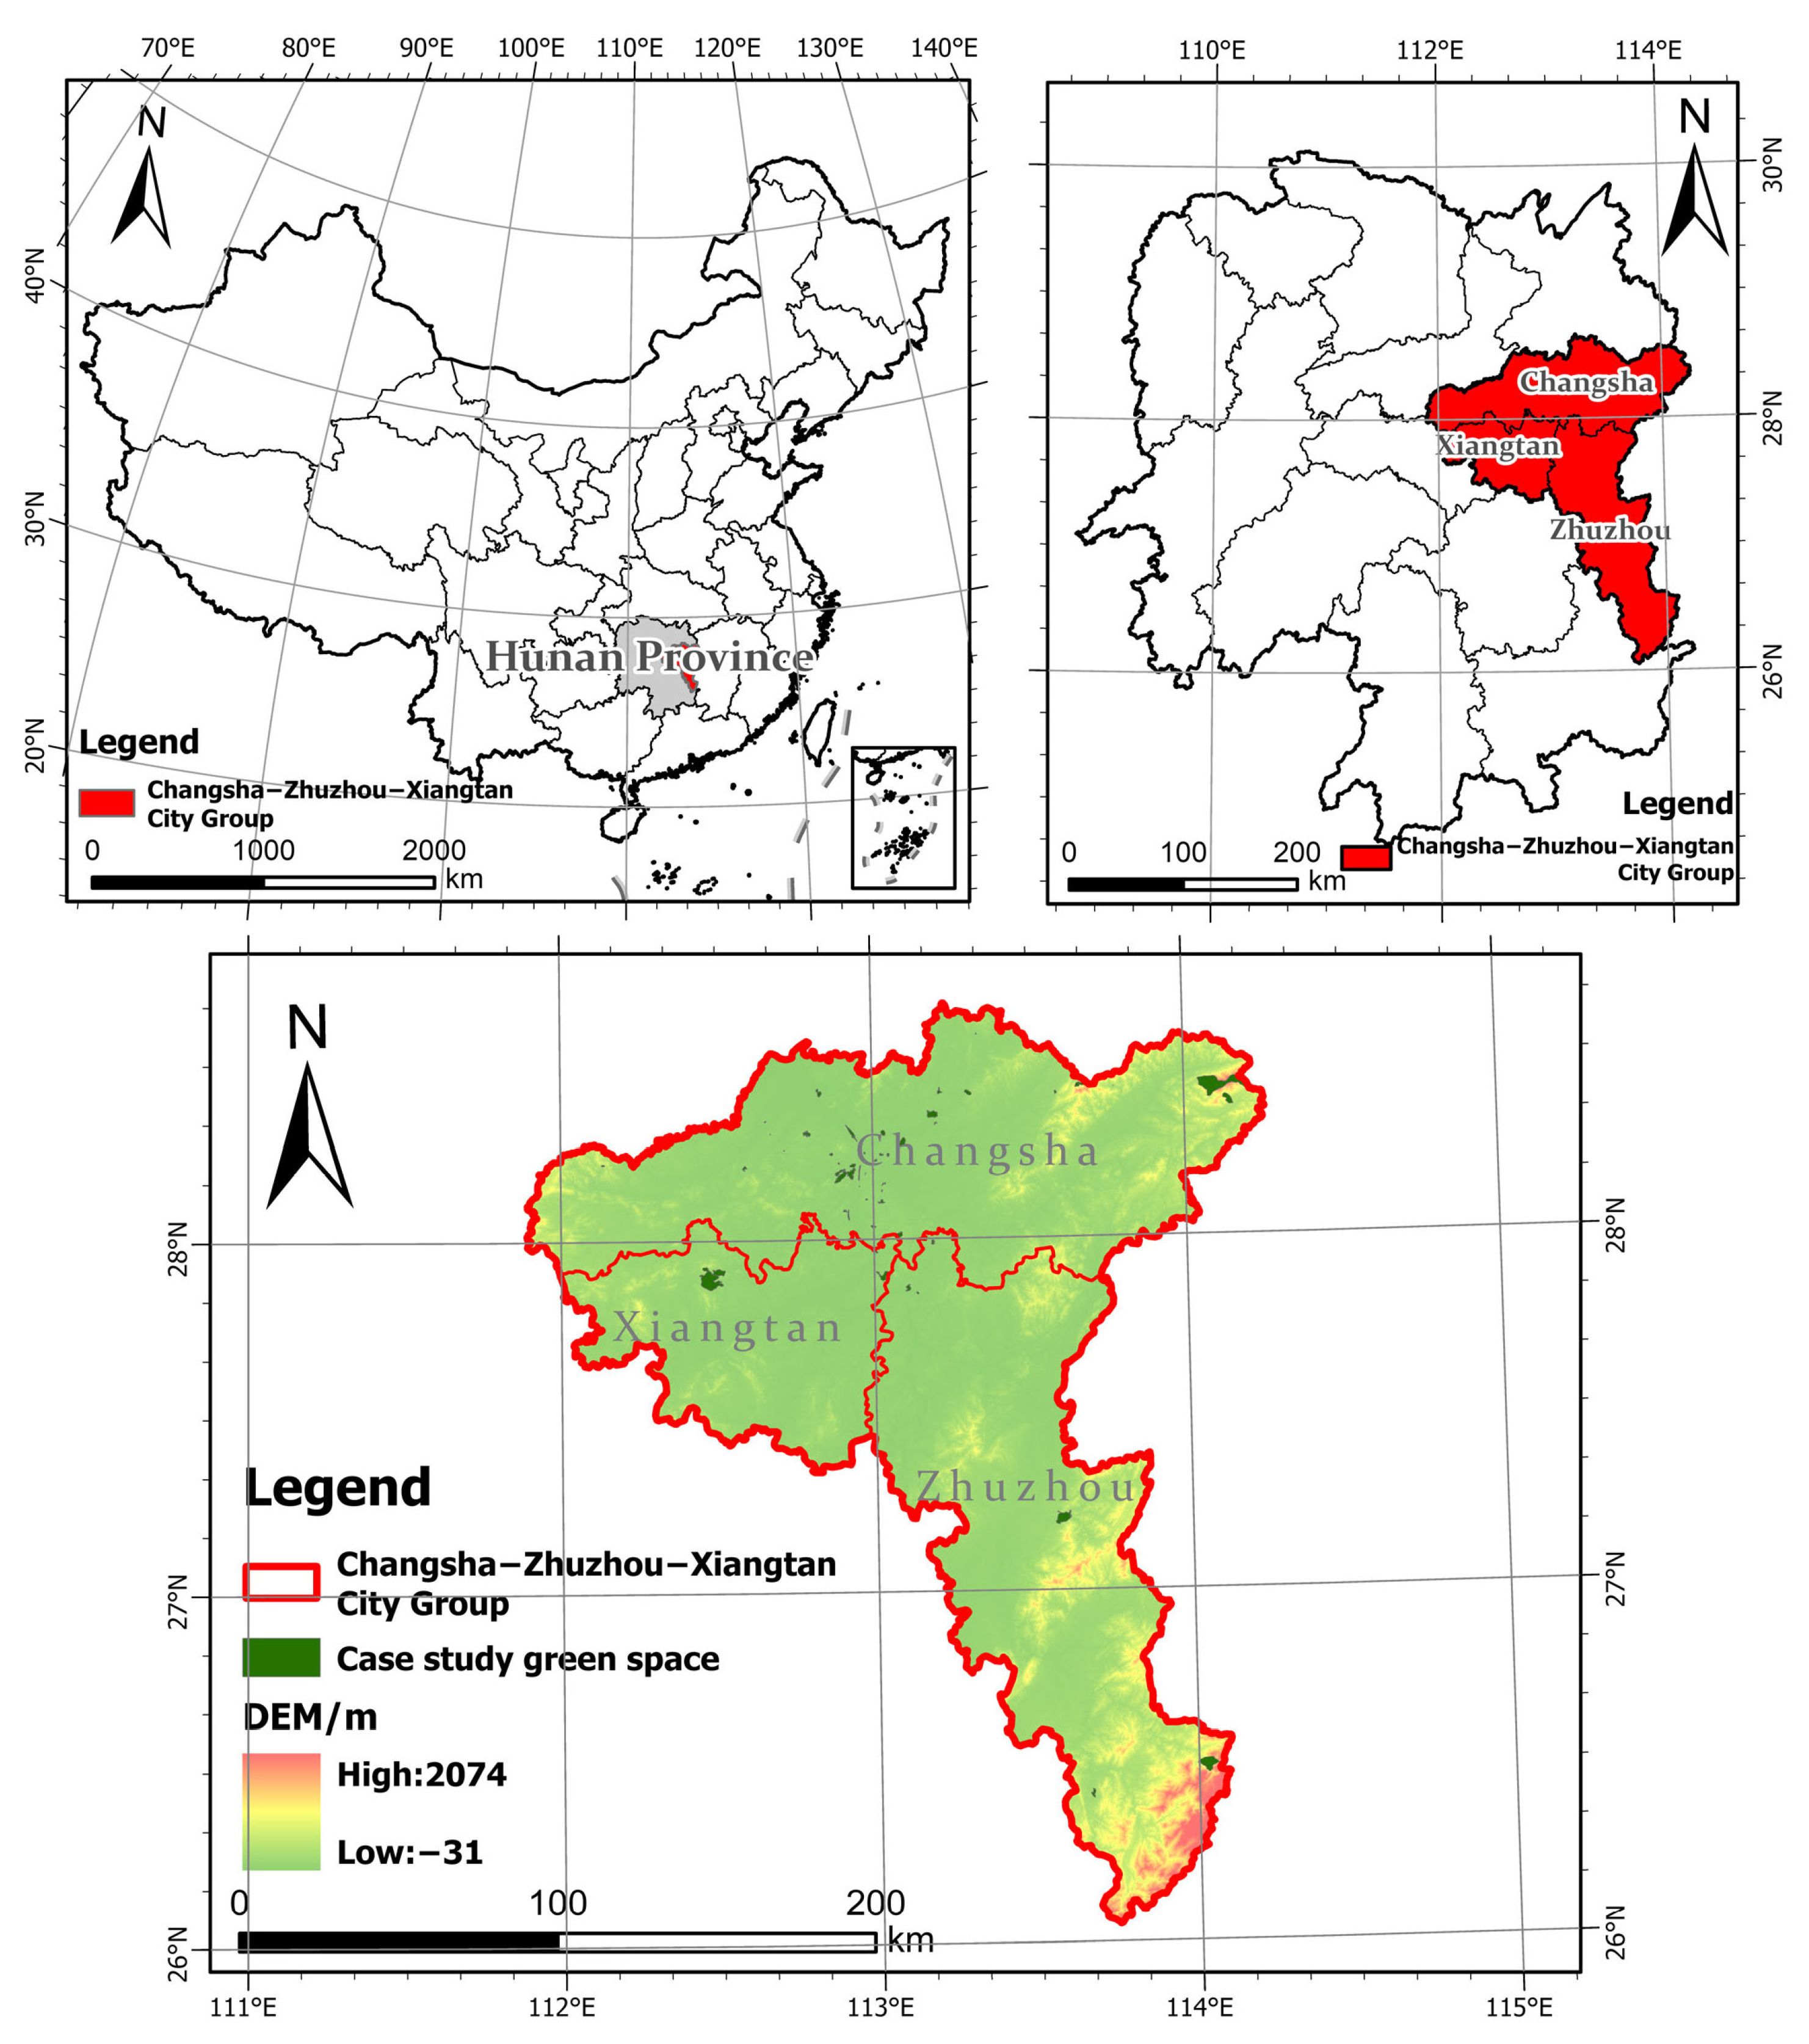
Exploring the Mental Health Benefits of Urban Green Spaces Through Social Media Big Data: A Case Study of the Changsha–Zhuzhou–Xiangtan Urban Agglomeration

Abstract

1. Introduction
2. Literature Review
Analysis of Urban Residents’ Perceptions, Activities, and Emotions Based on Social Media Textual Analysis
3. Method and Data
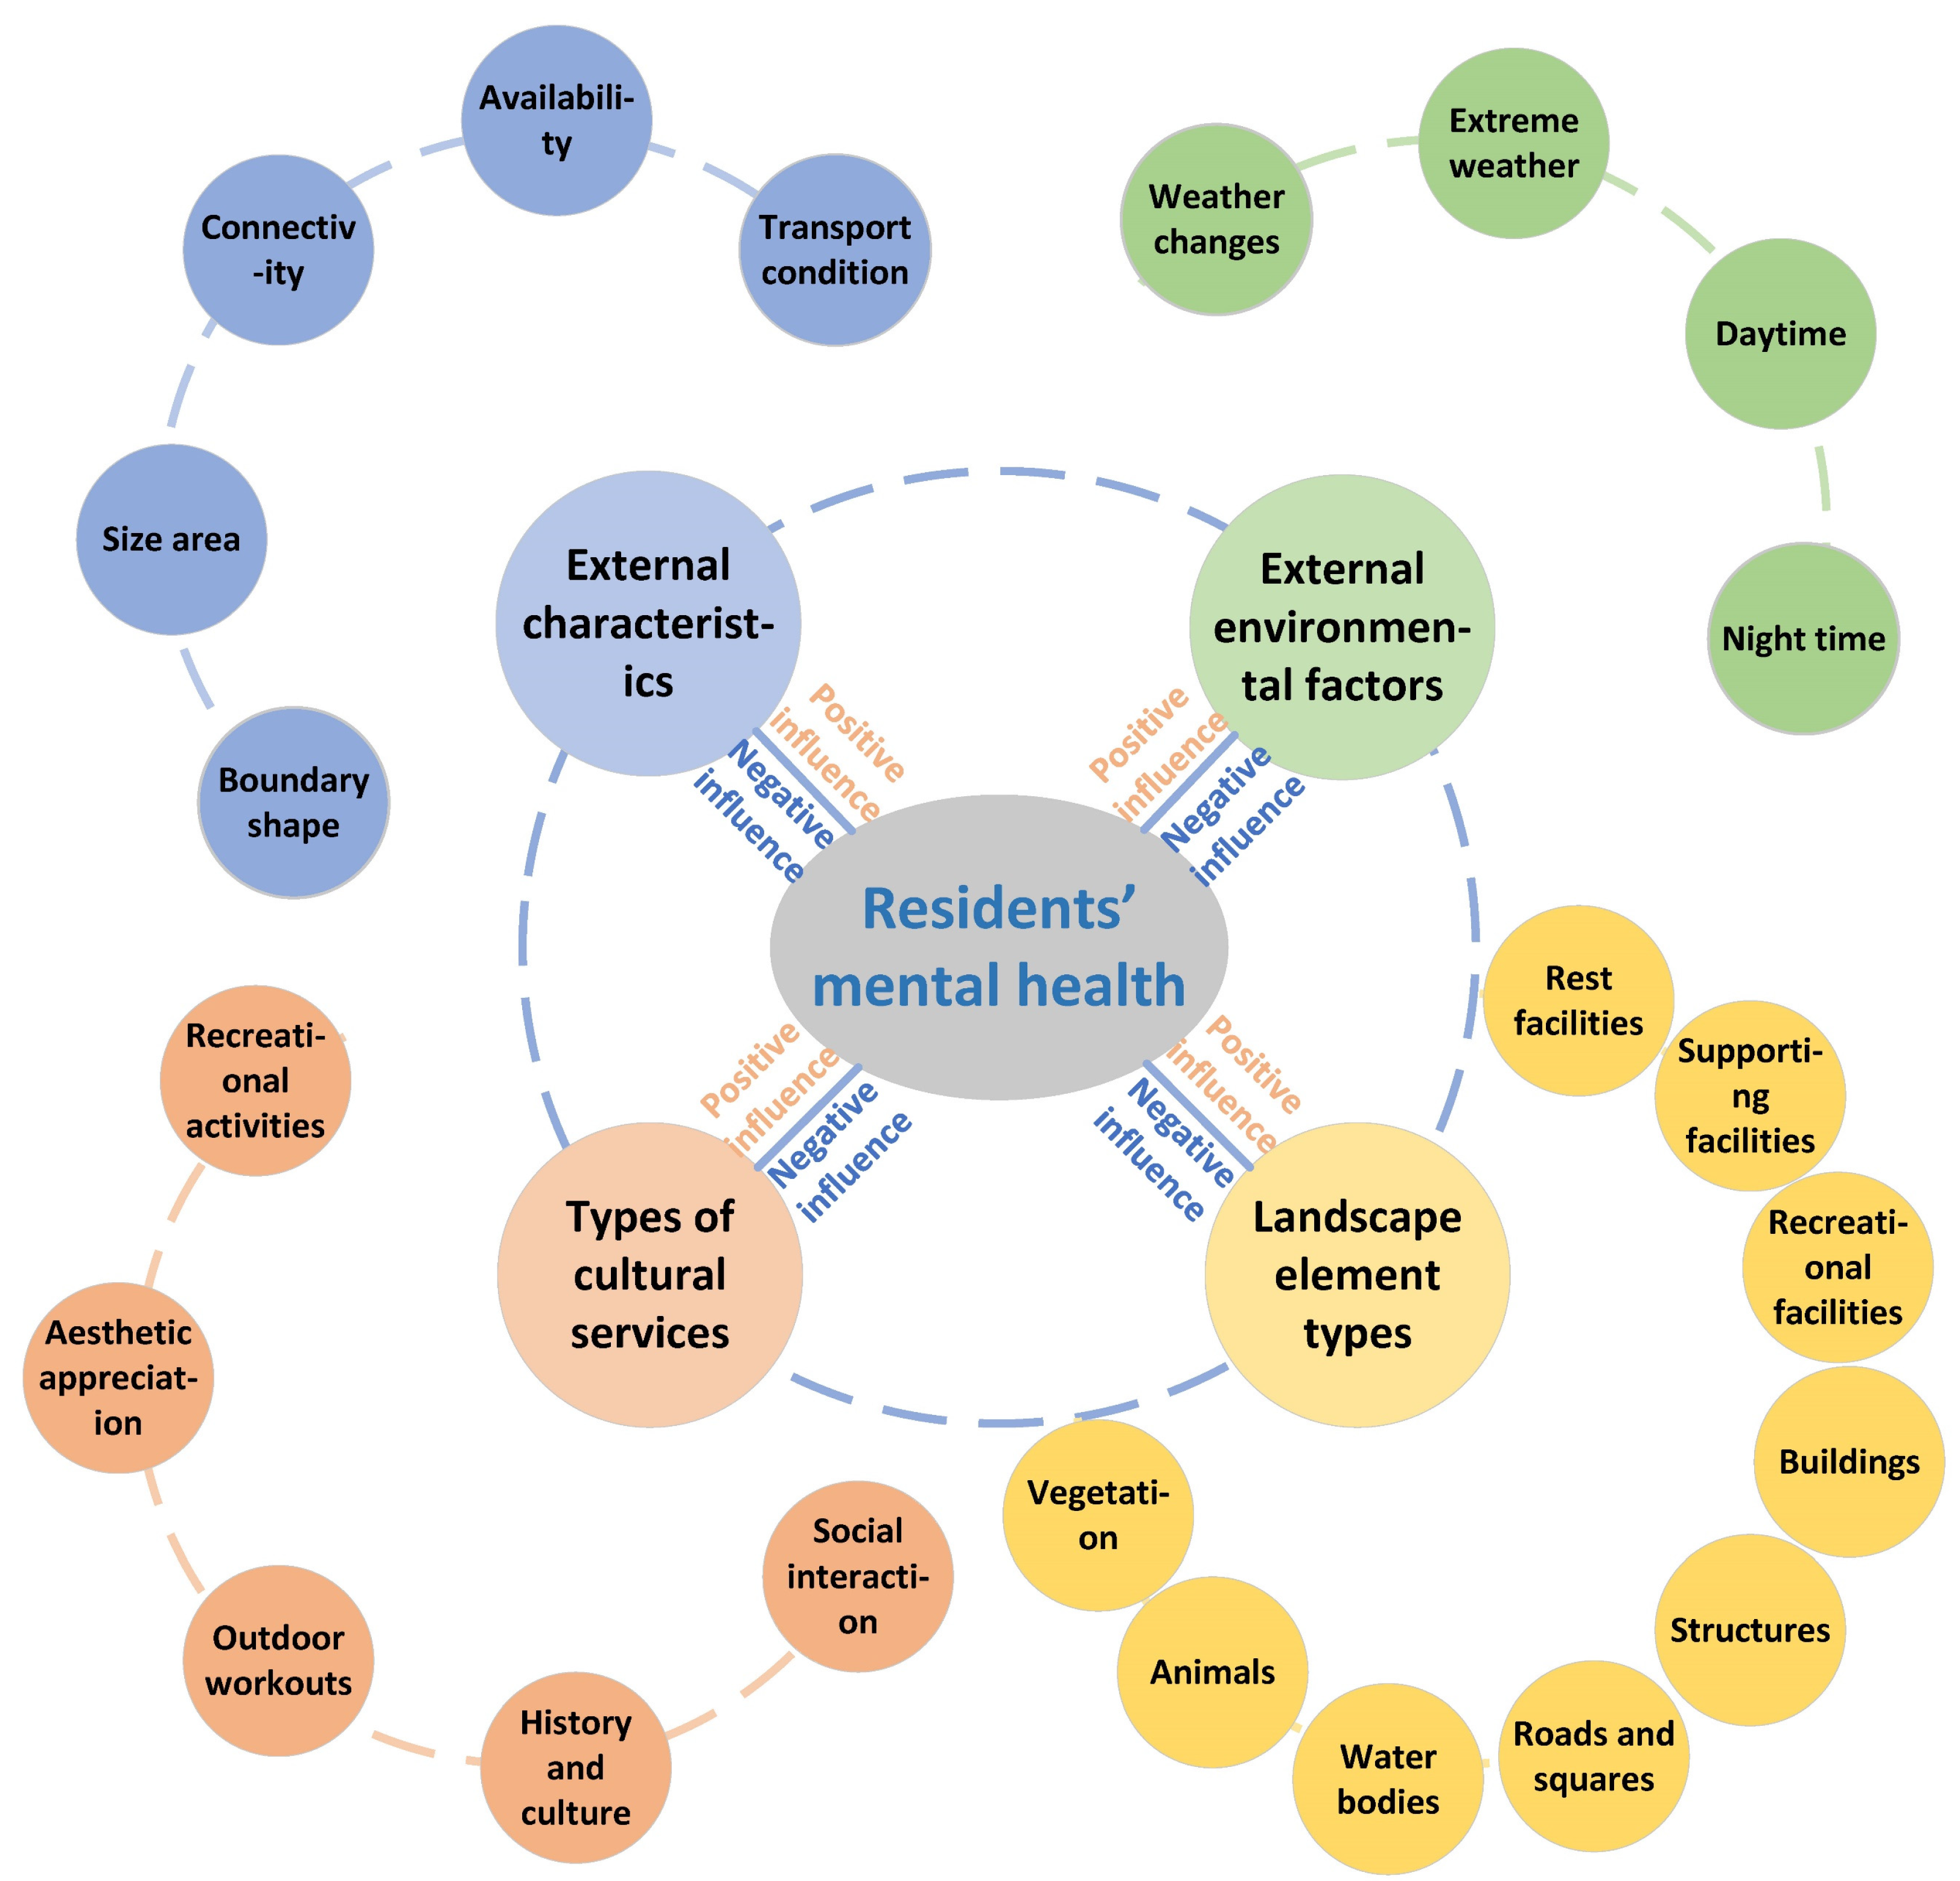
- (1)
- The external characteristics of UGS affect residents’ emotions;
- (2)
- The types of cultural services provided by UGS affect residents’ emotions;
- (3)
- The types of landscape elements in UGS affect residents’ emotions;
- (4)
- The external environmental factors of UGS affect residents’ emotions.
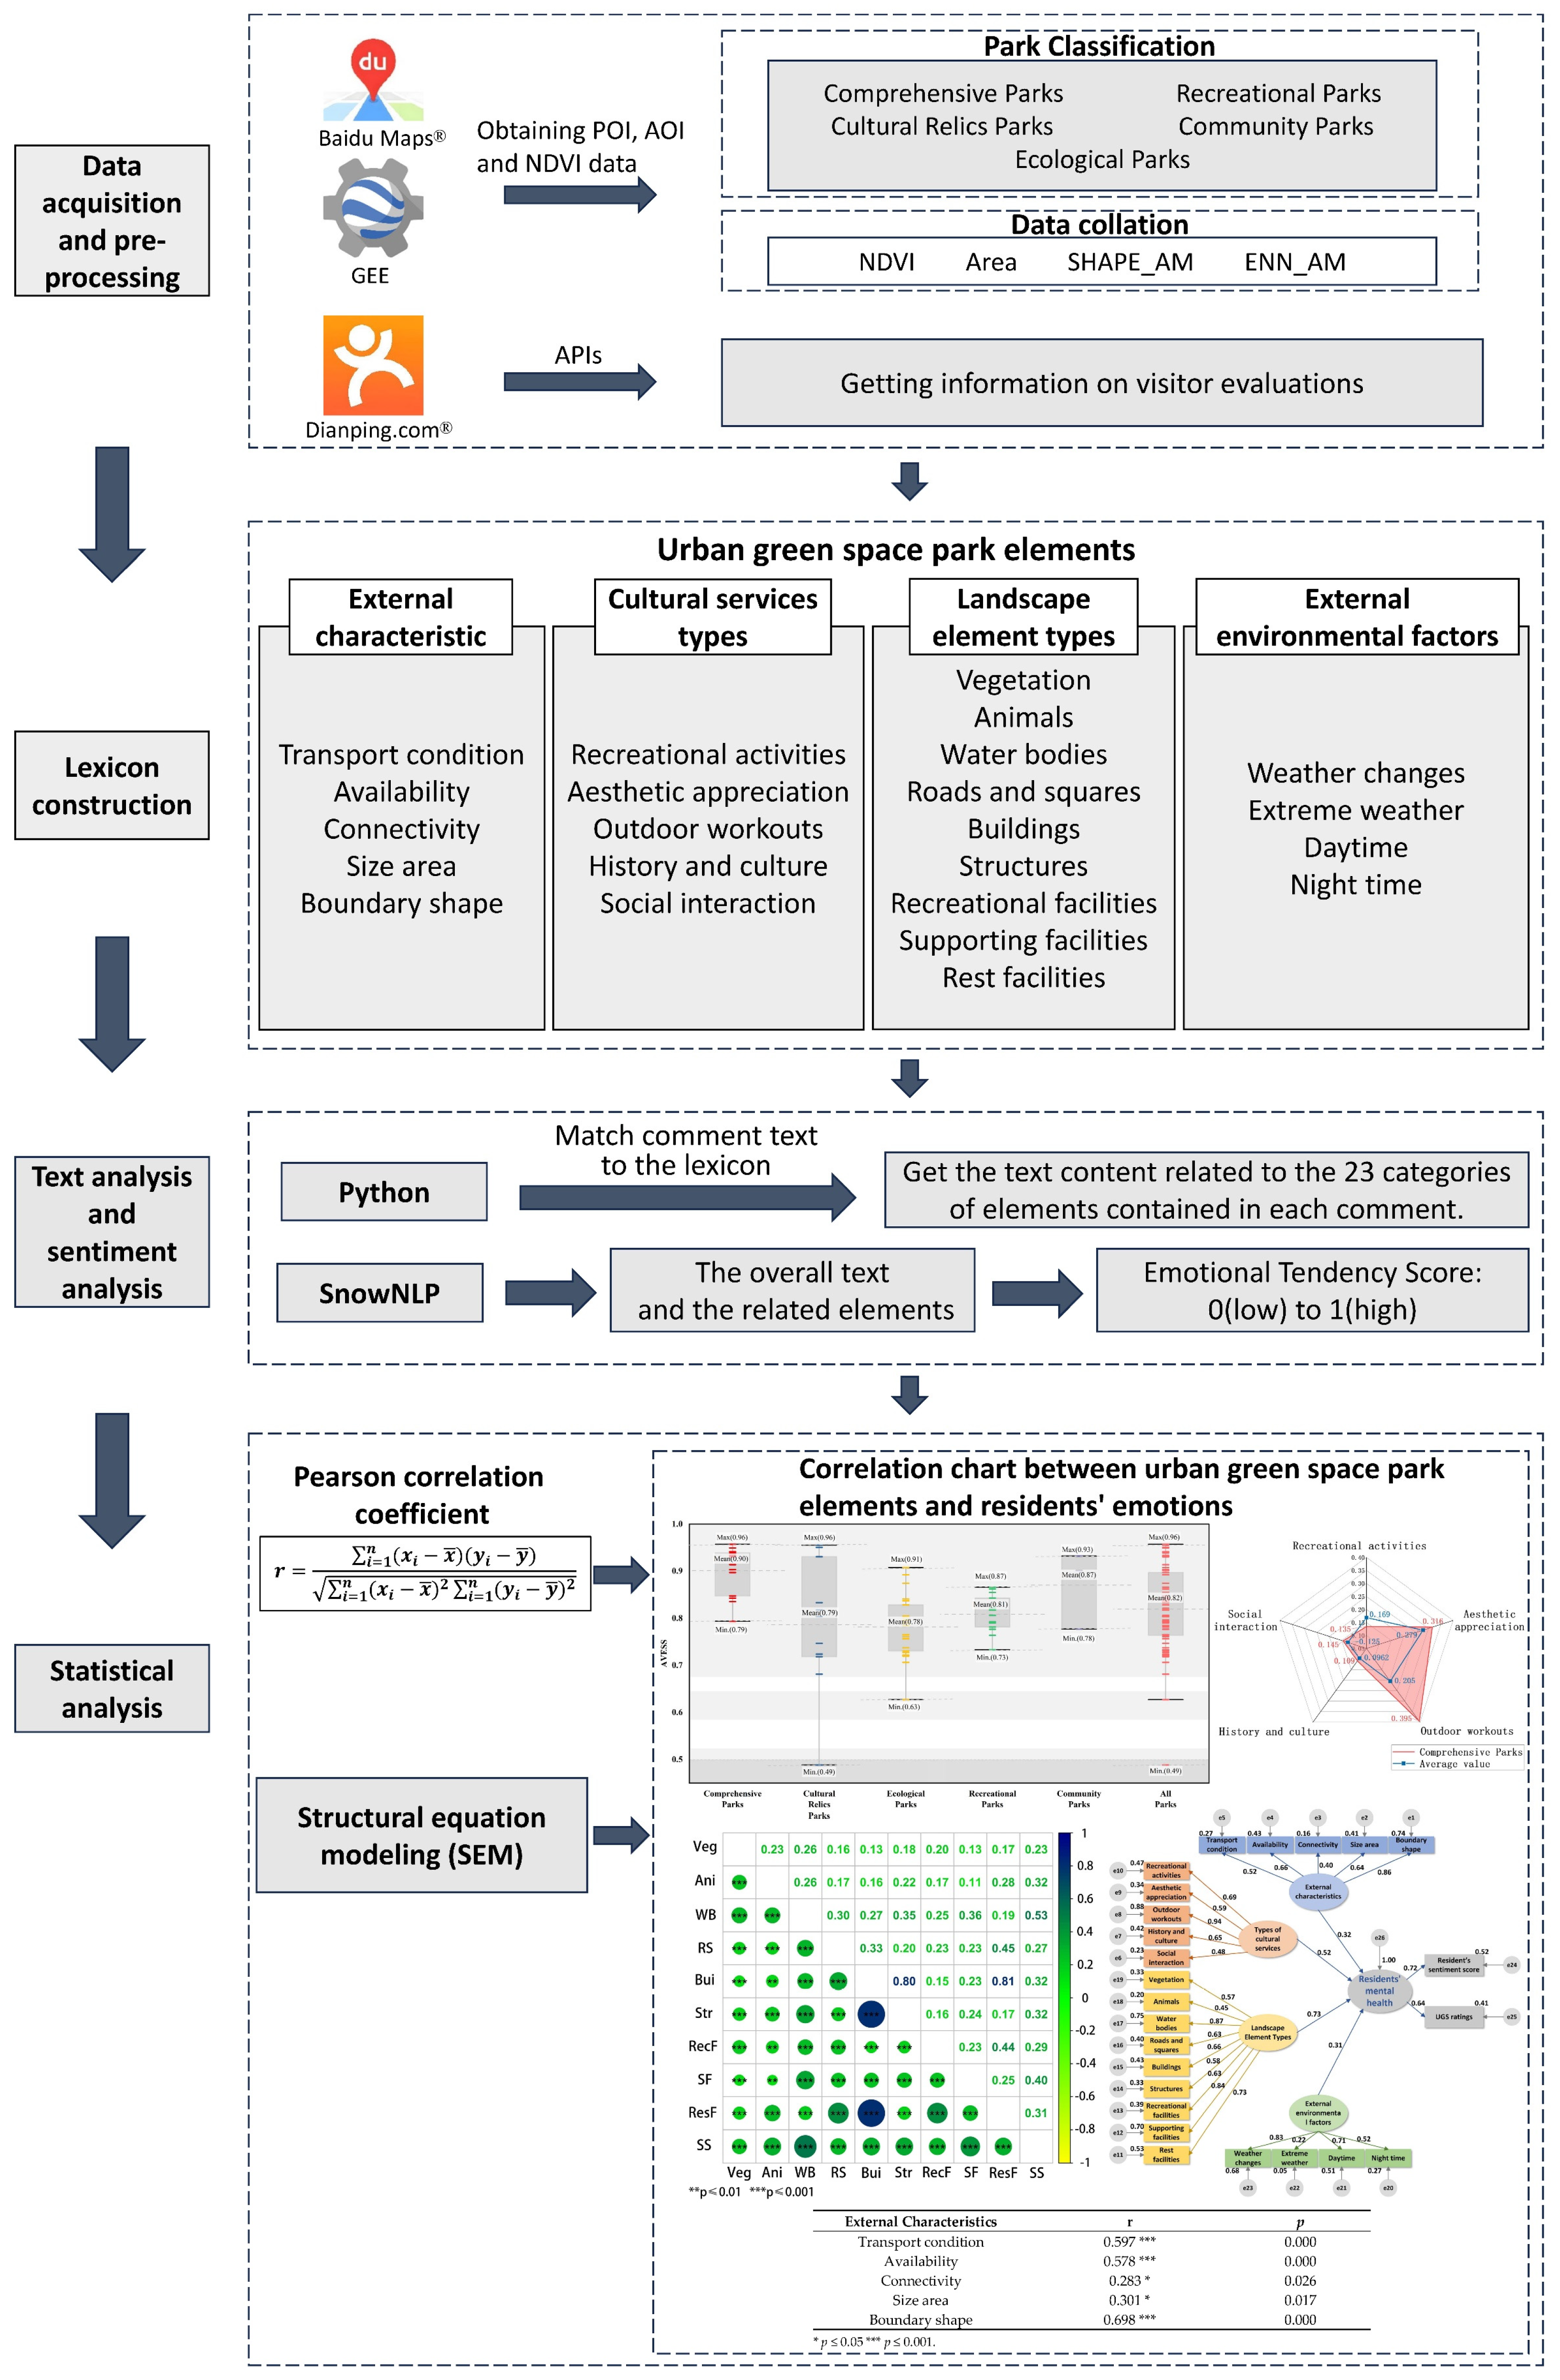
3.1. Data Acquisition and Preprocessing
3.2. Lexicon Construction
3.3. Text and Sentiment Analysis
3.4. Statistical Analysis
Structural Equation Modeling
4. Results
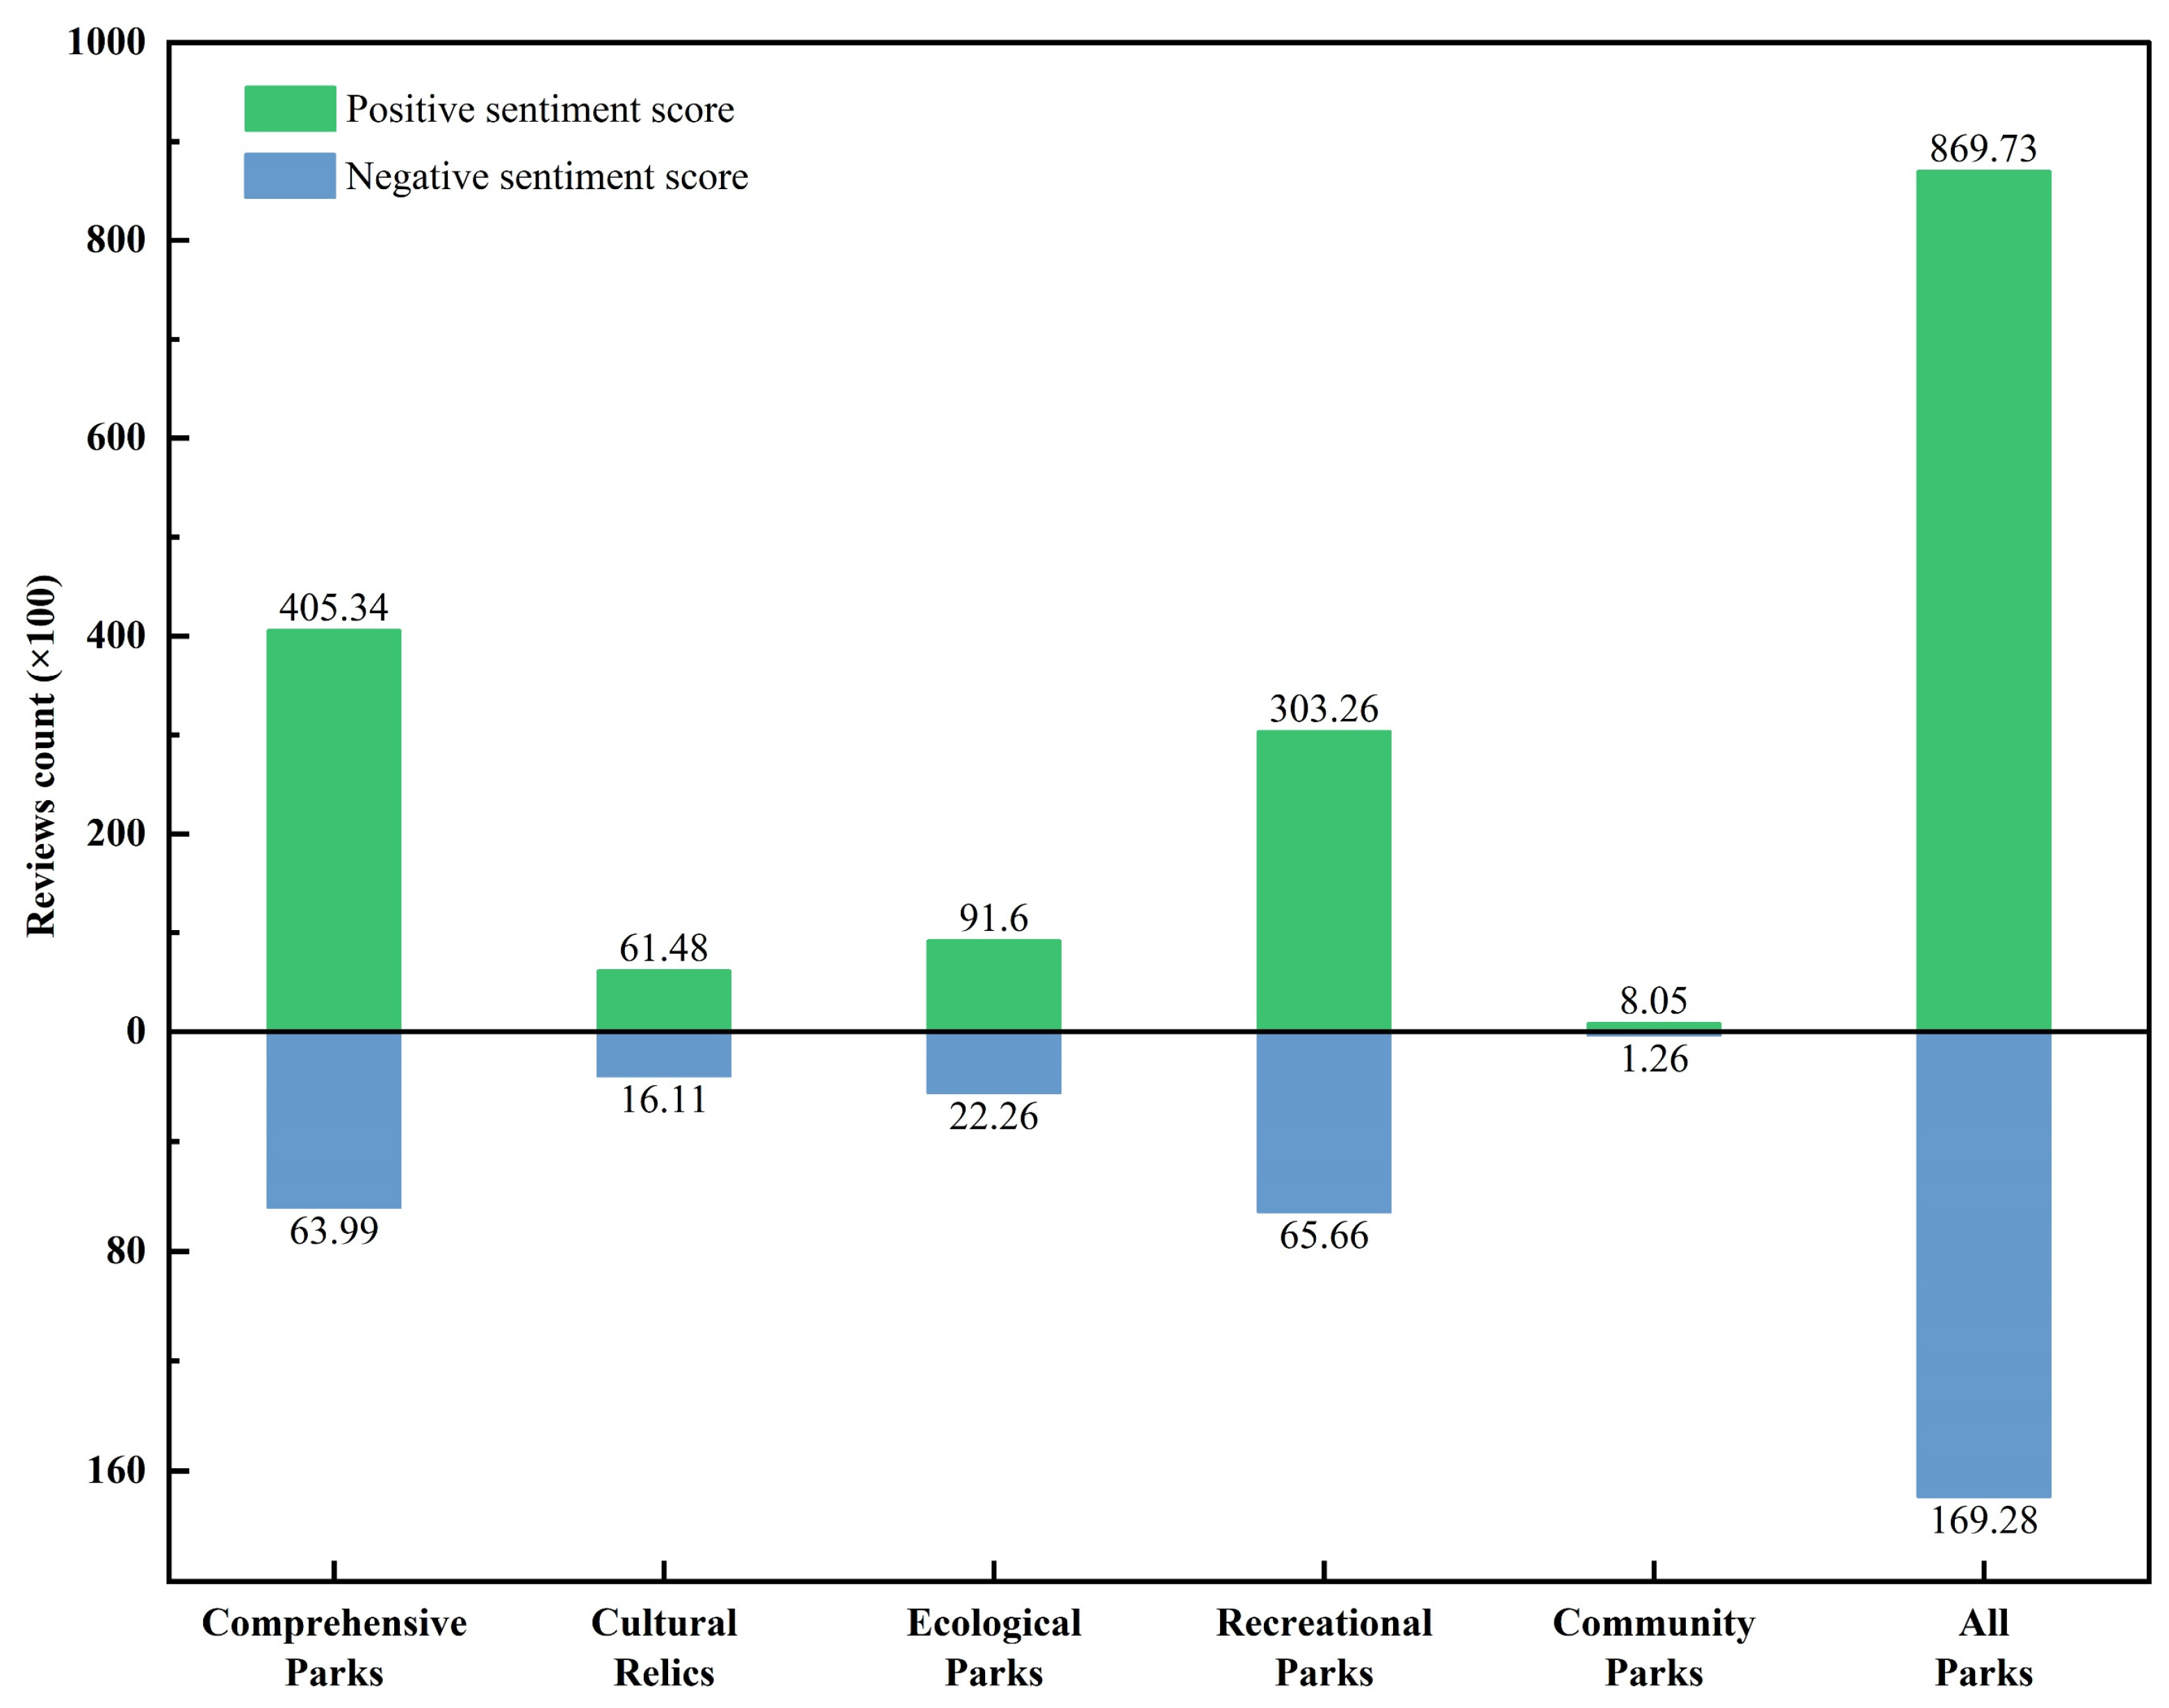
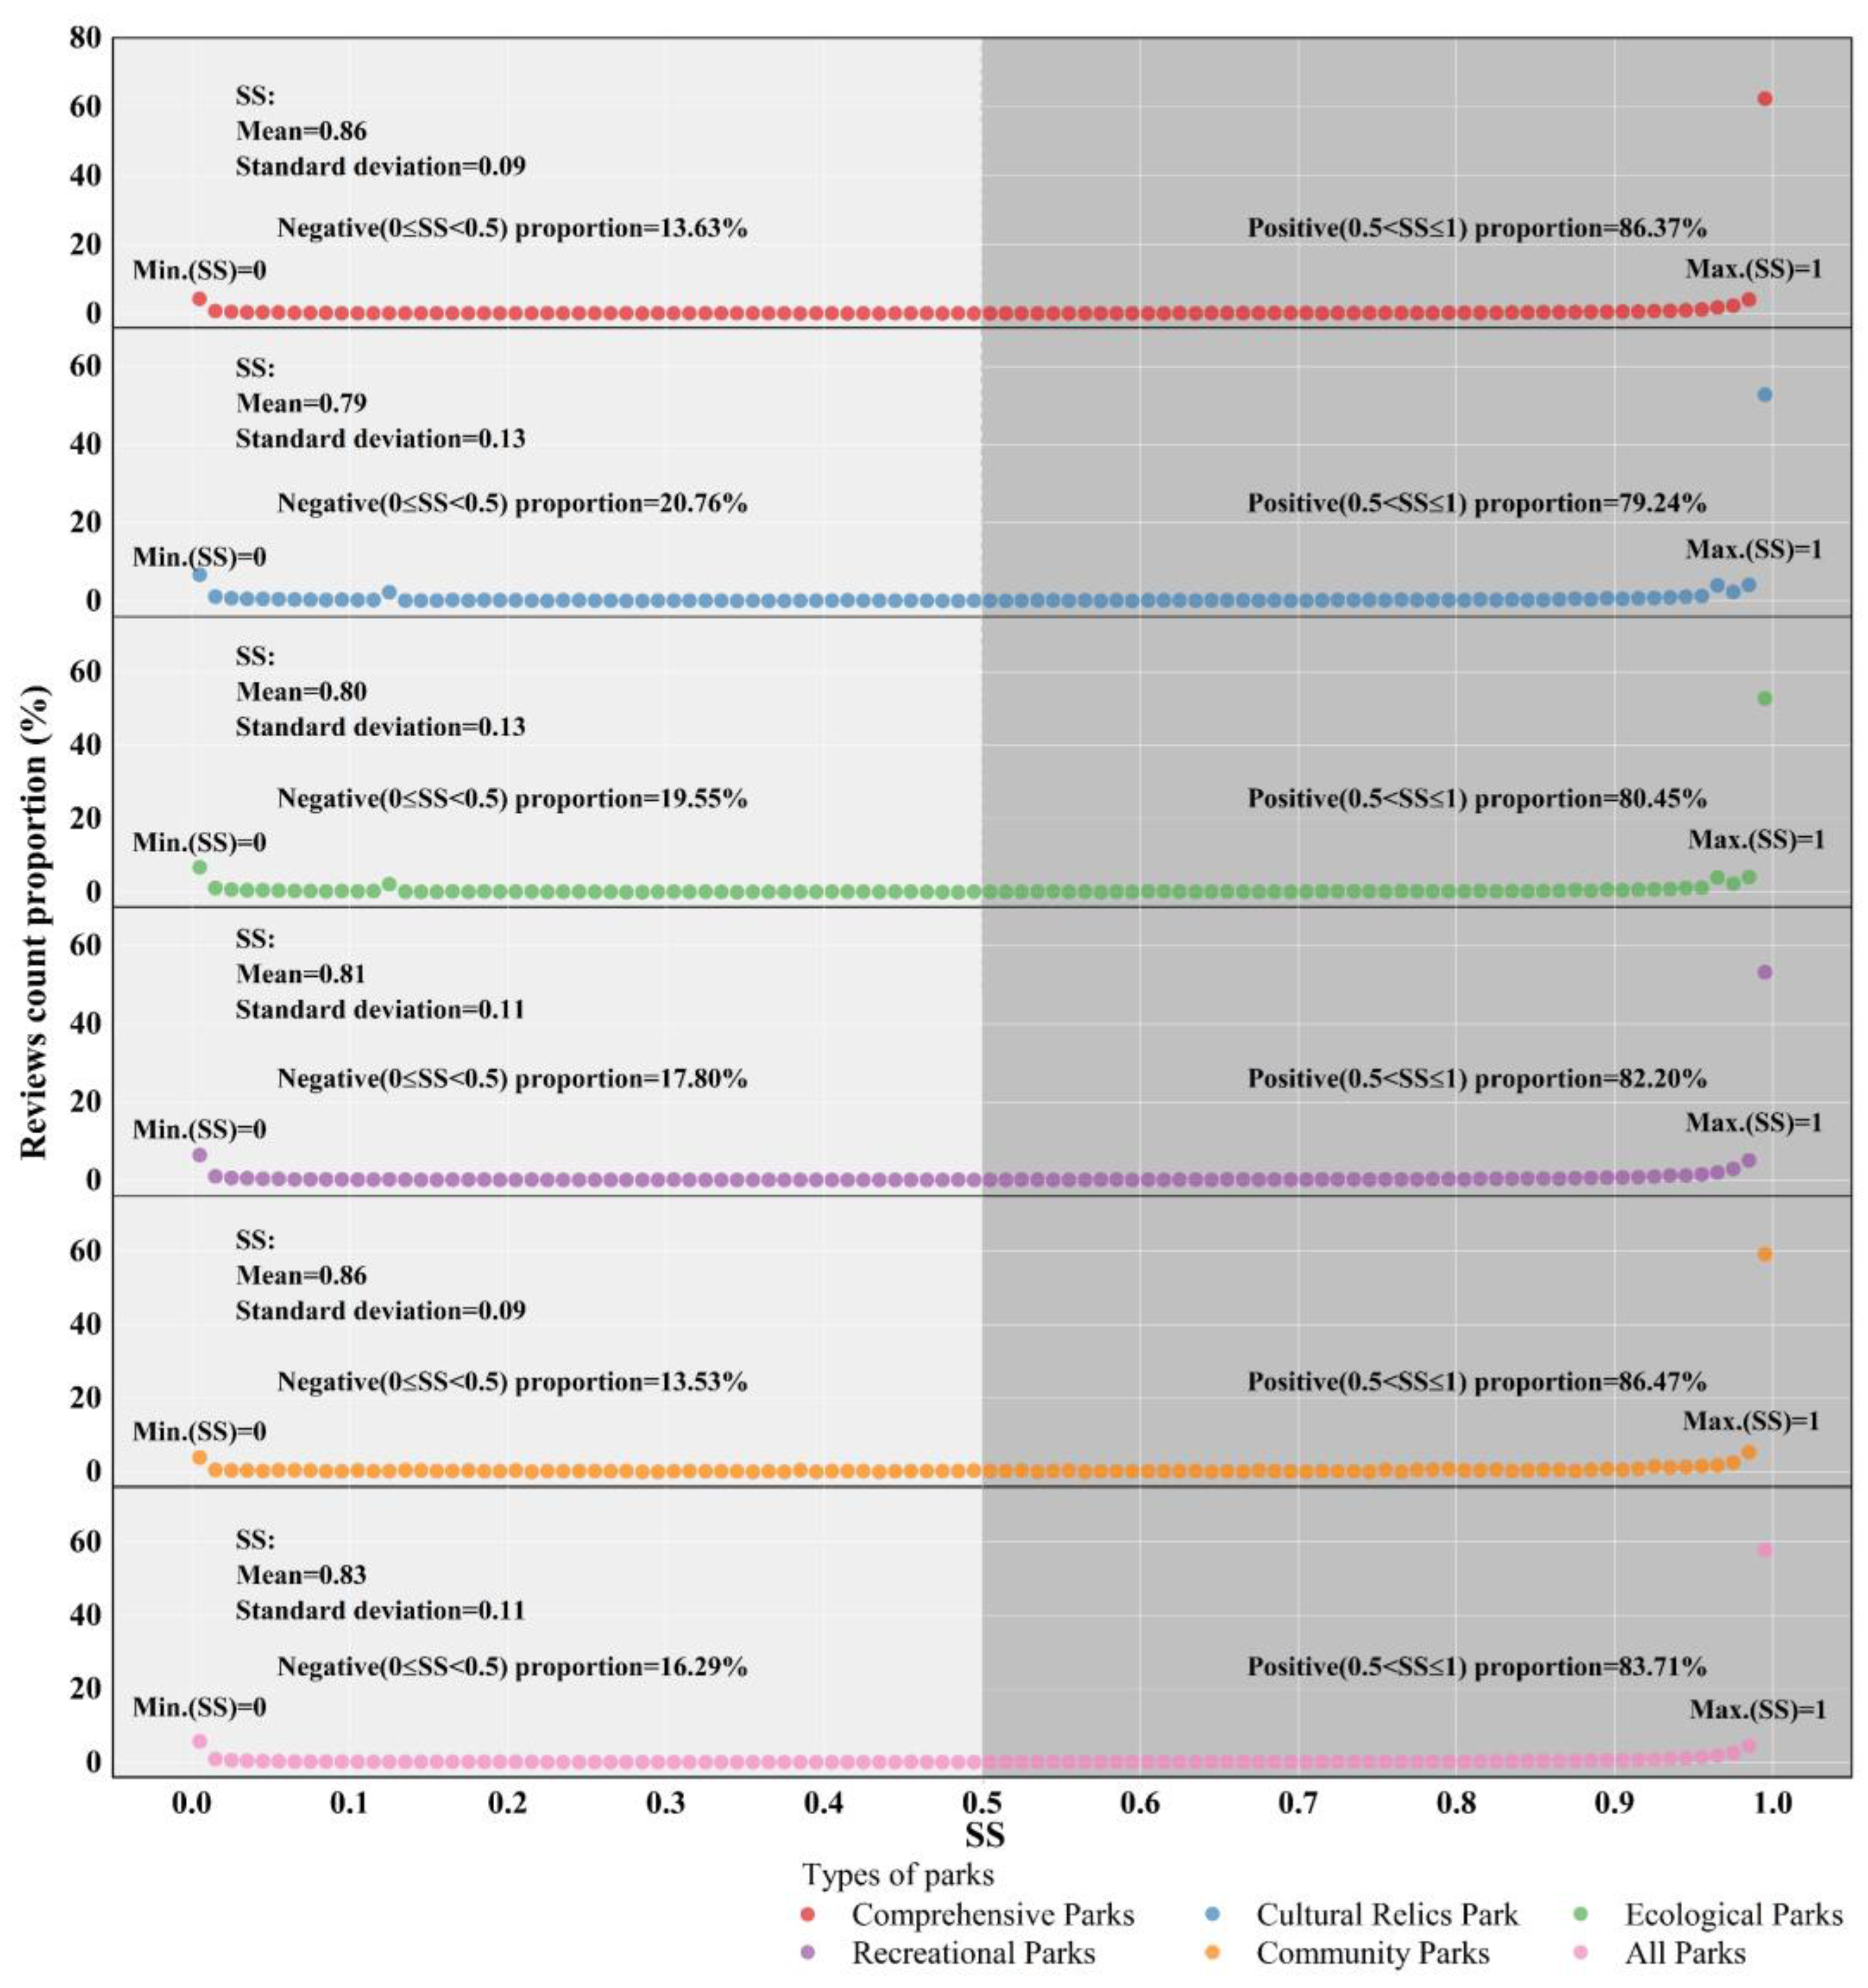
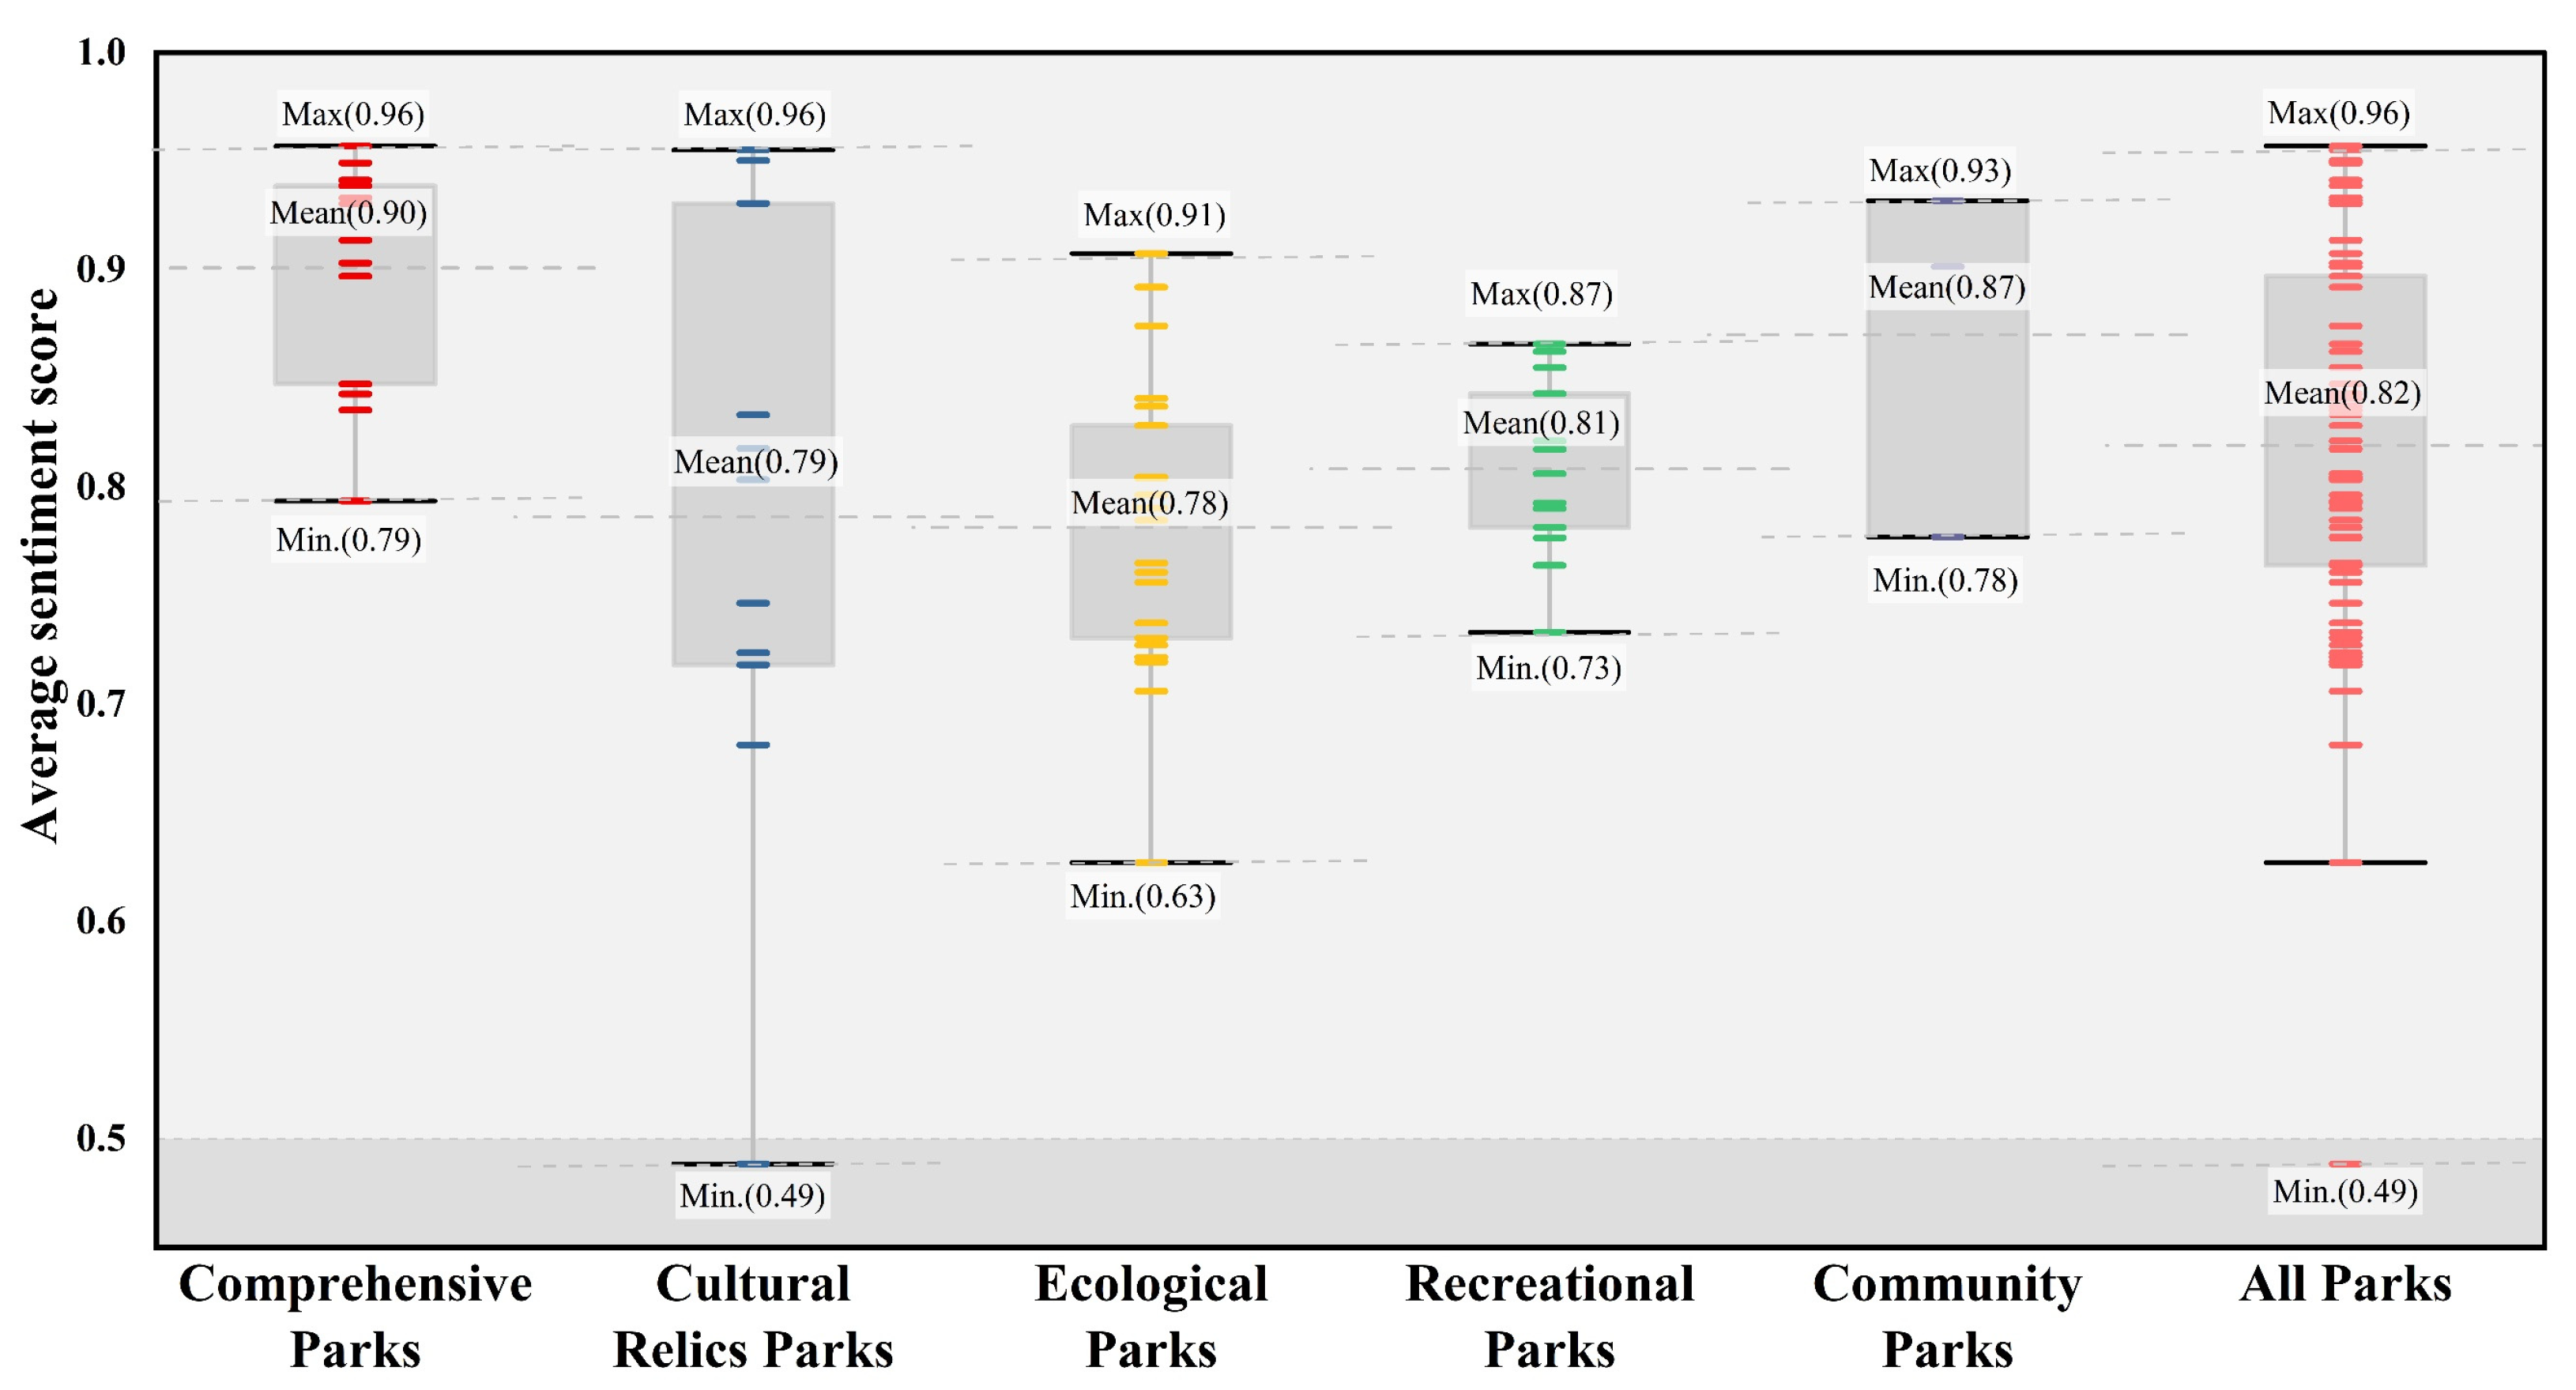
4.1. Overview of Park Sentiment Distribution
4.2. Distribution of Resident Sentiments Across Different Types of Parks
4.3. External Characteristics of Green Spaces
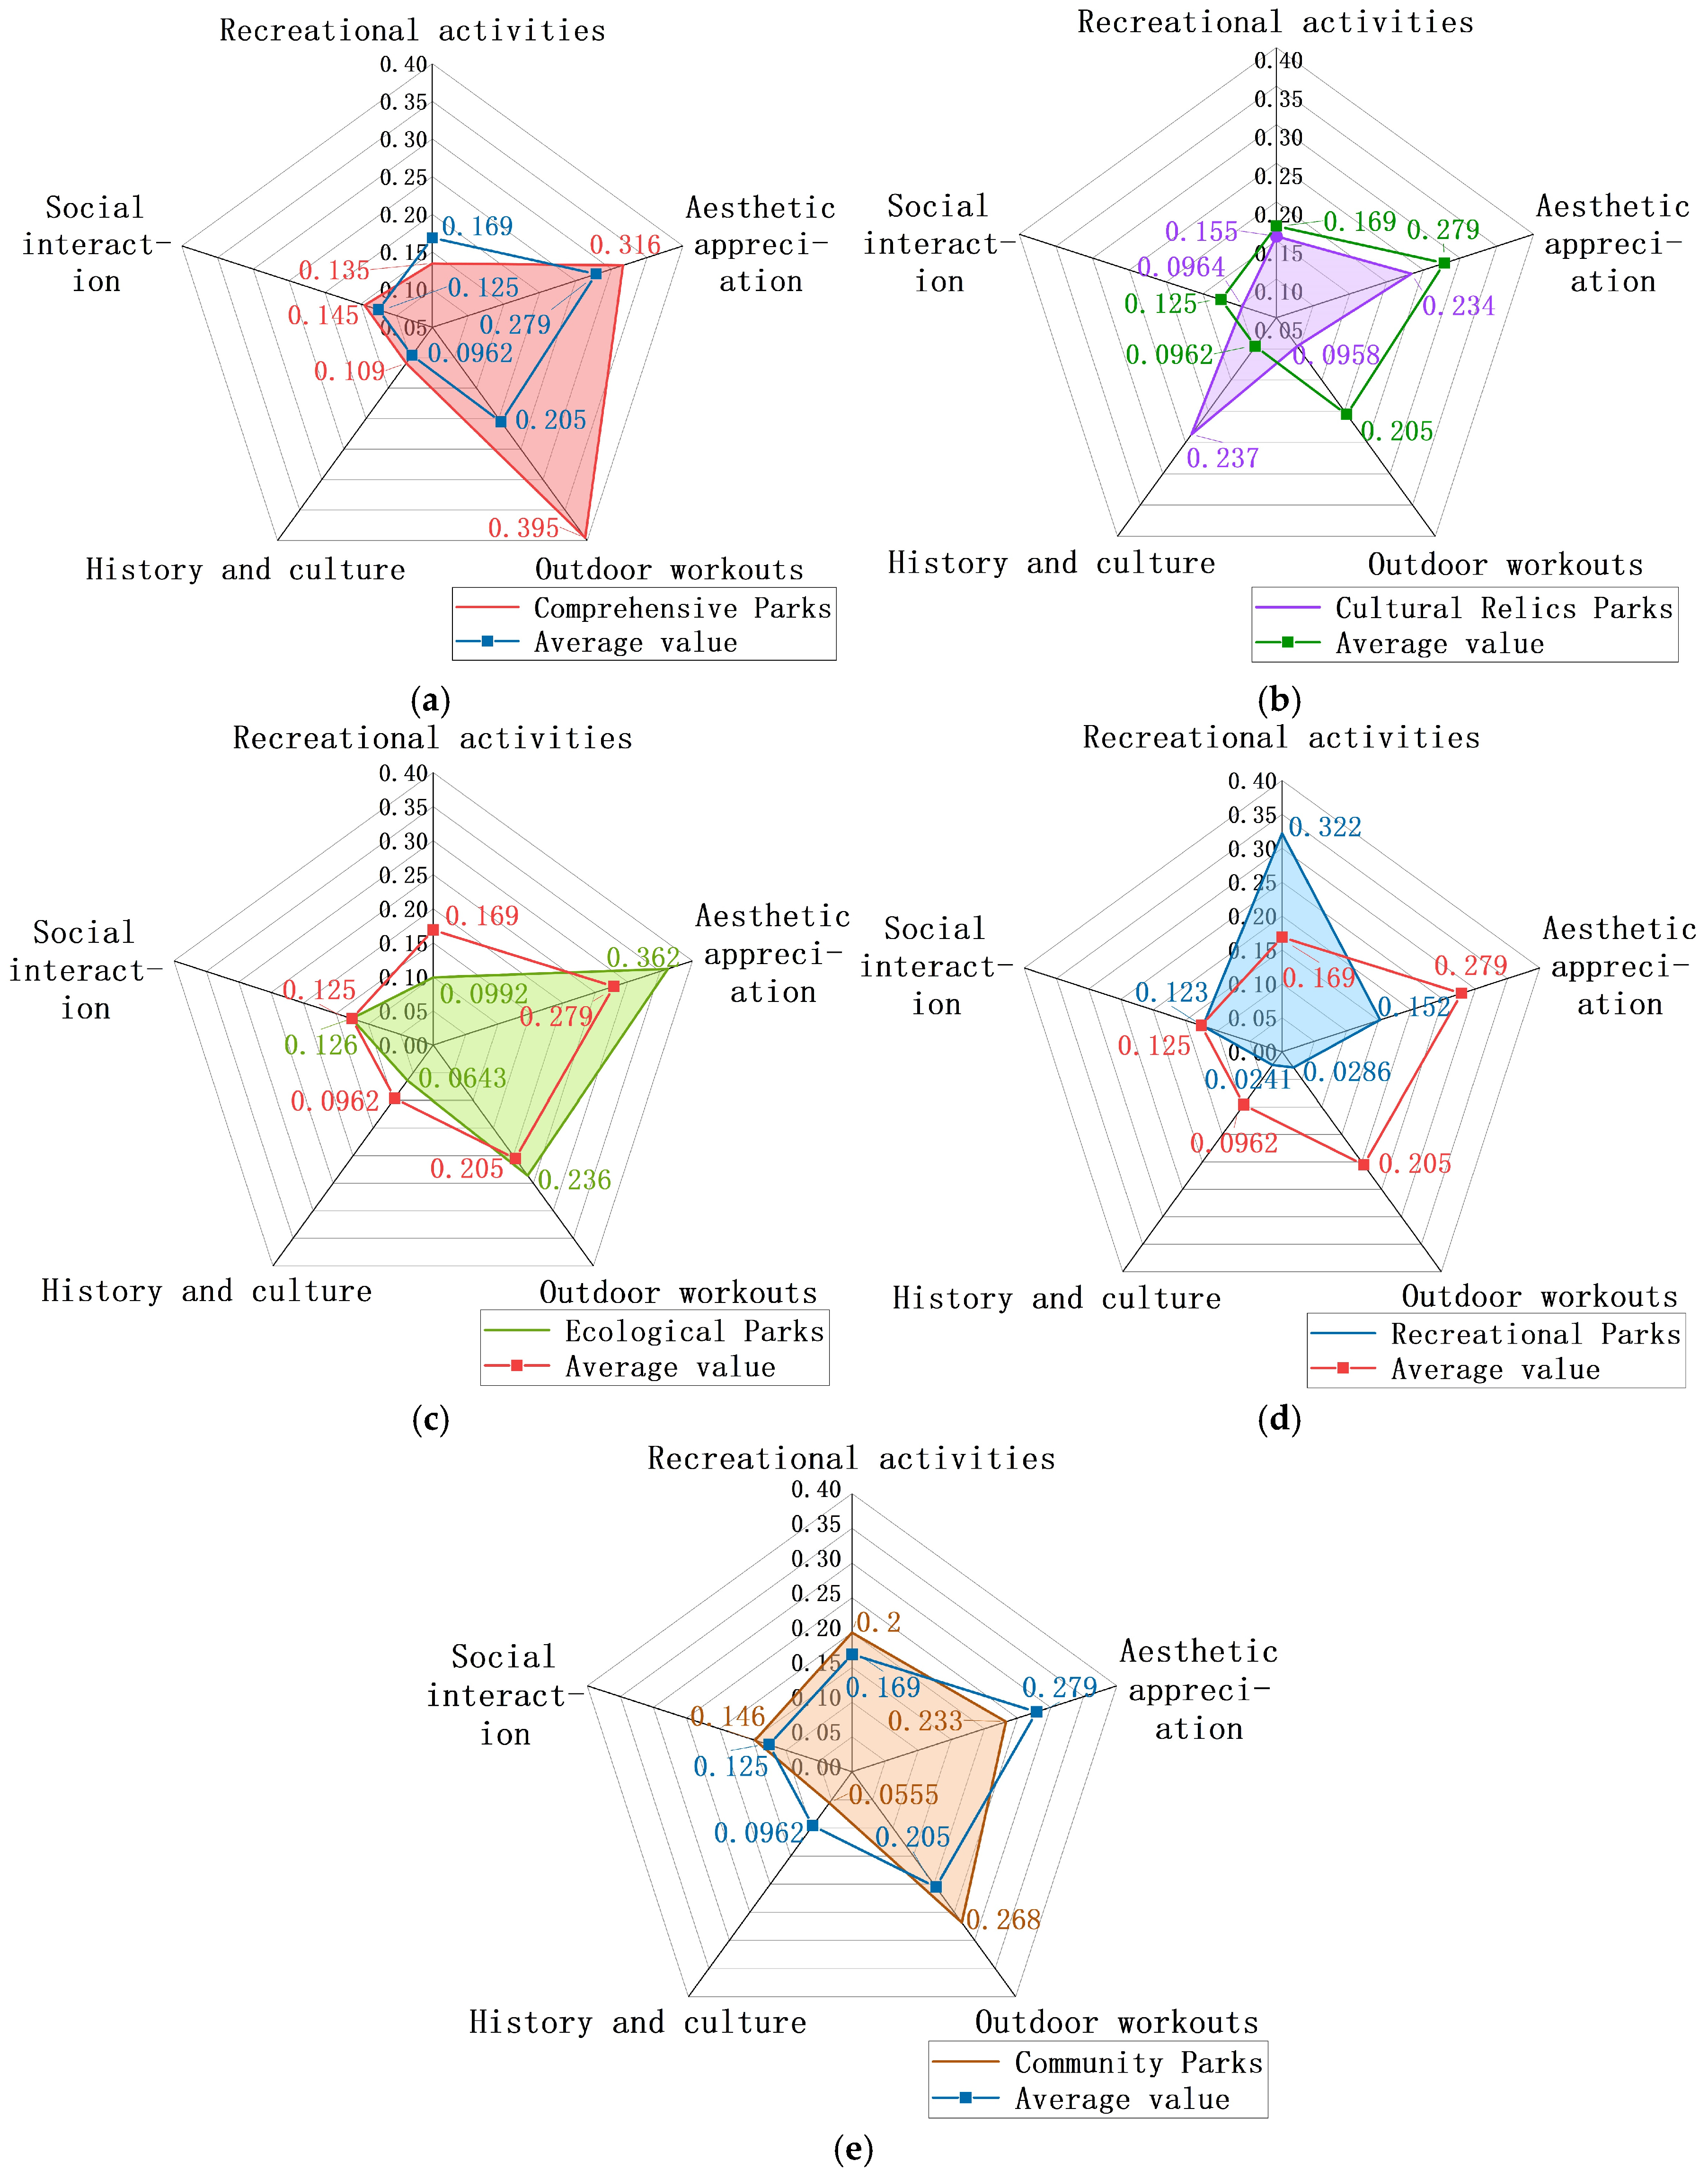
4.4. Ecosystem Cultural Service Characteristics of Different Types of Green Spaces
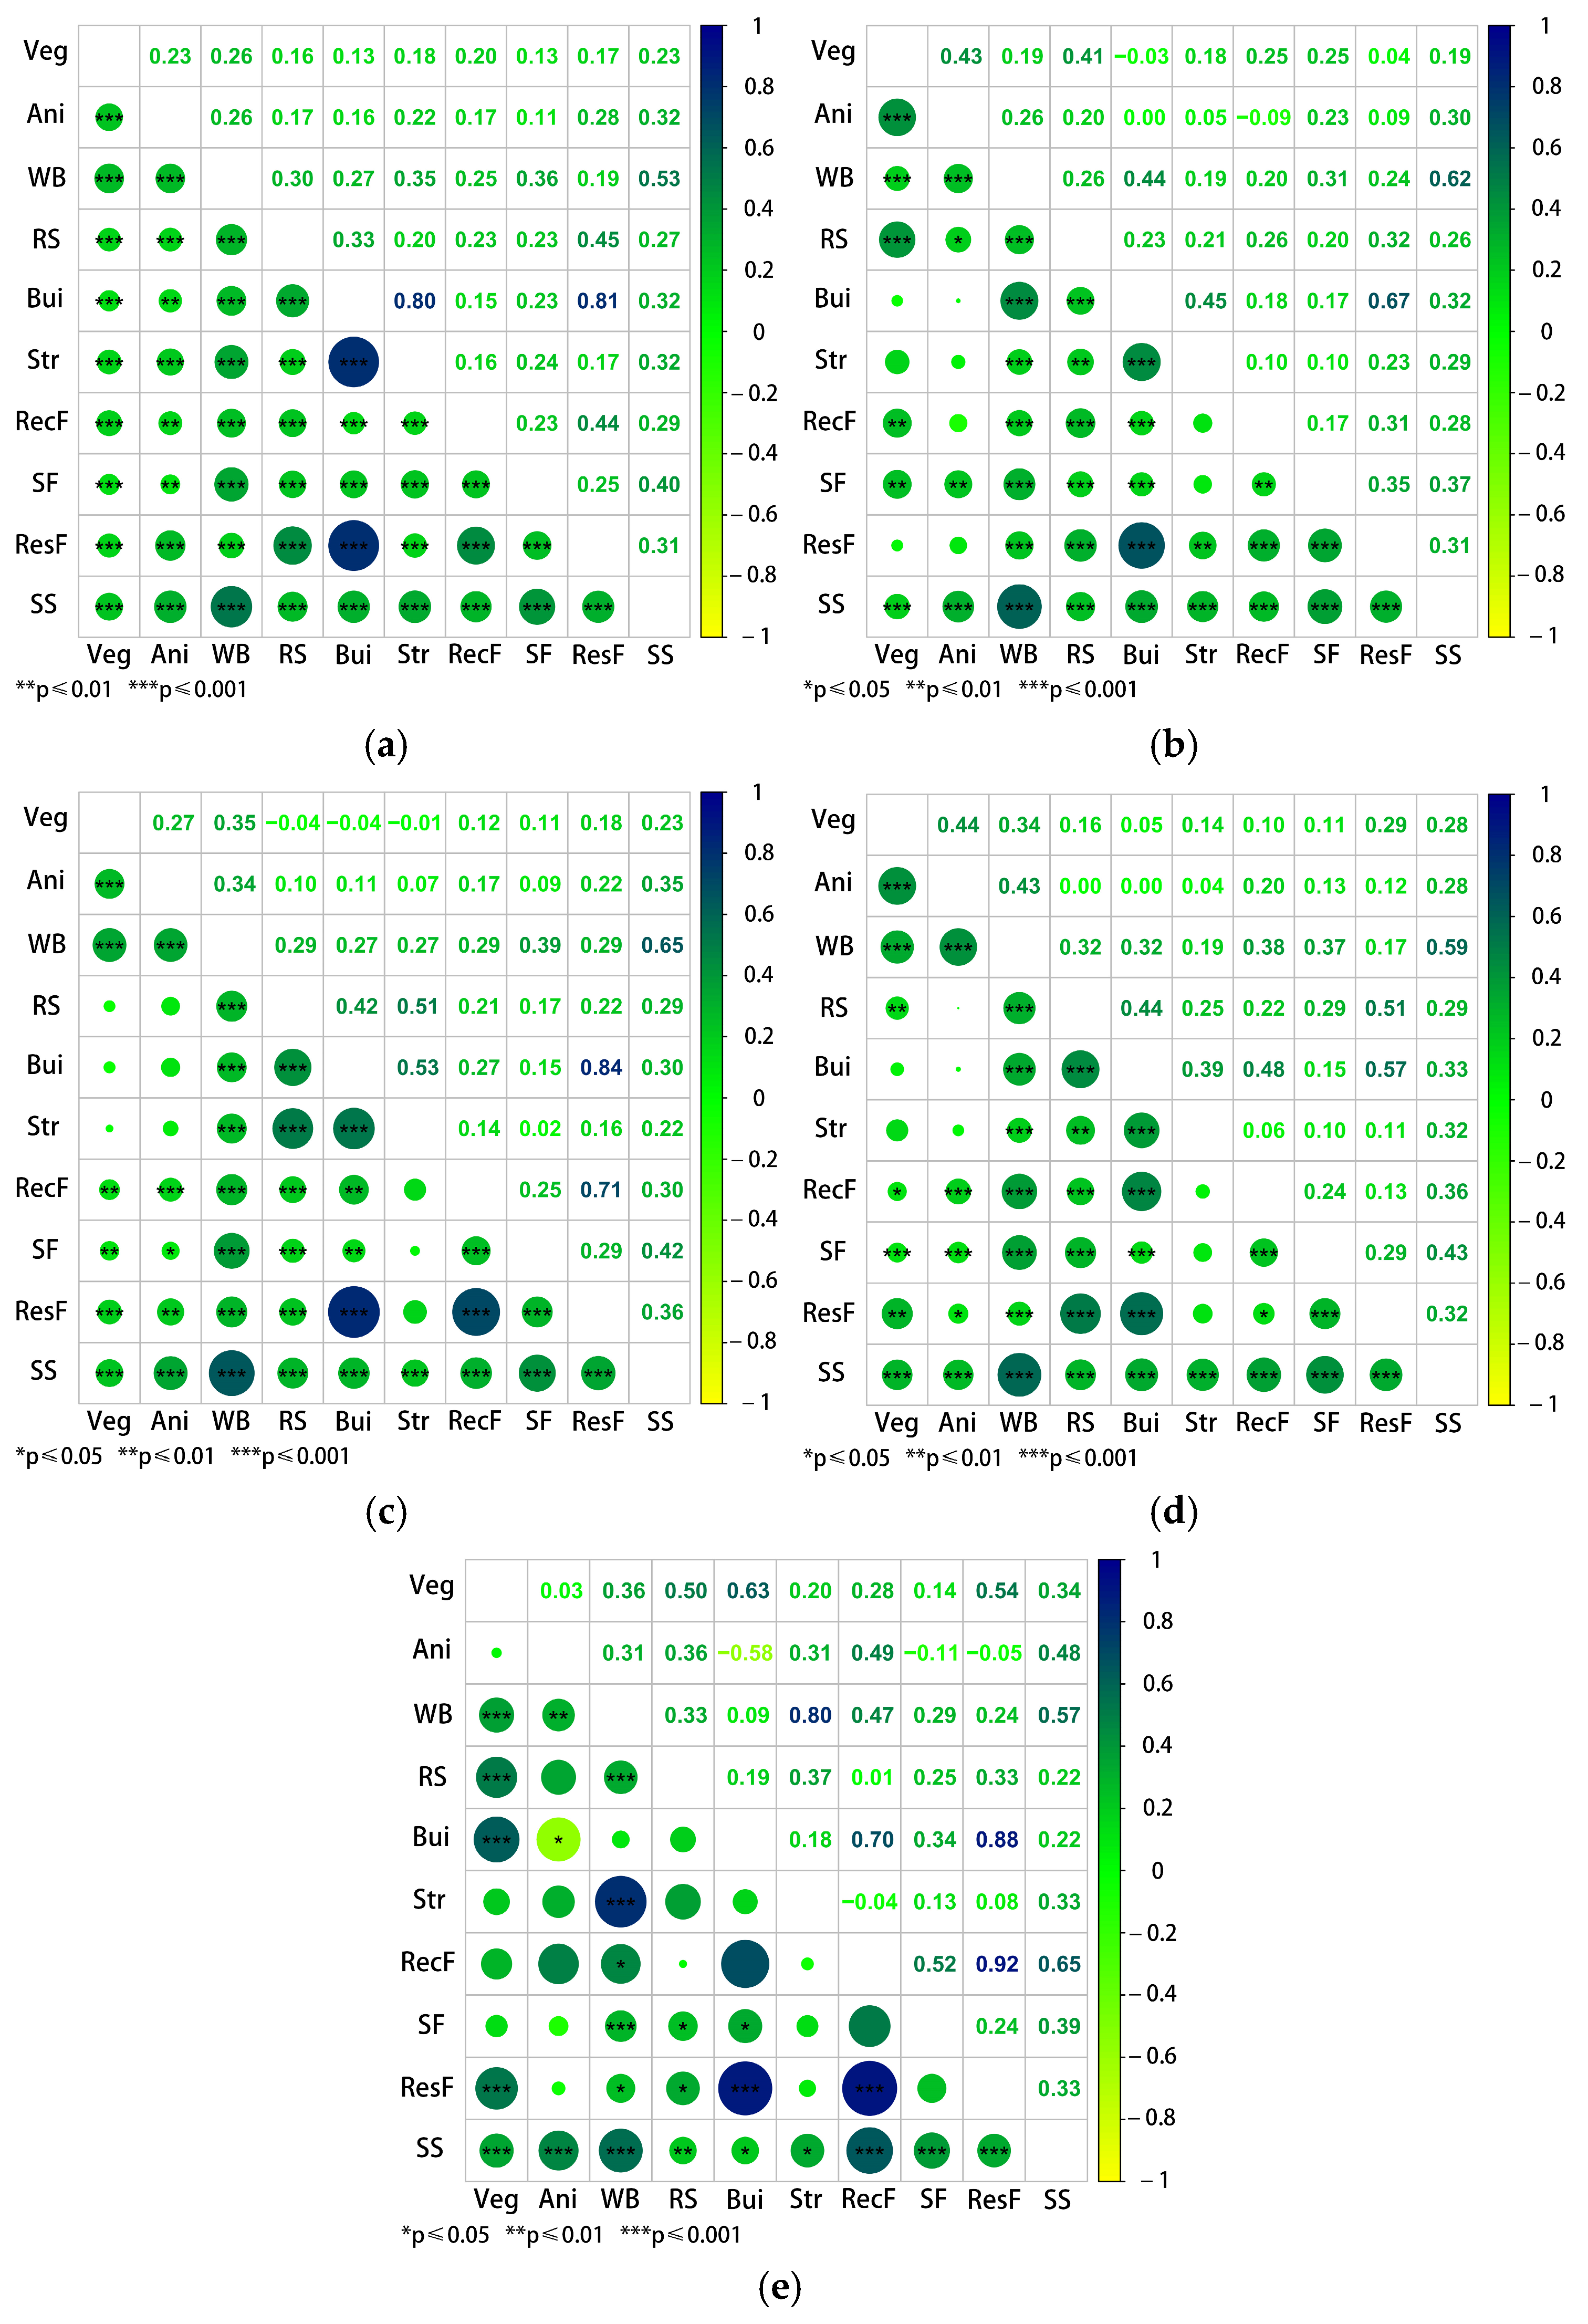
4.5. The Impact of Landscape Element Types on Residents’ Emotions in Green Spaces
4.6. The Impact of External Environmental Factors on Resident Emotions
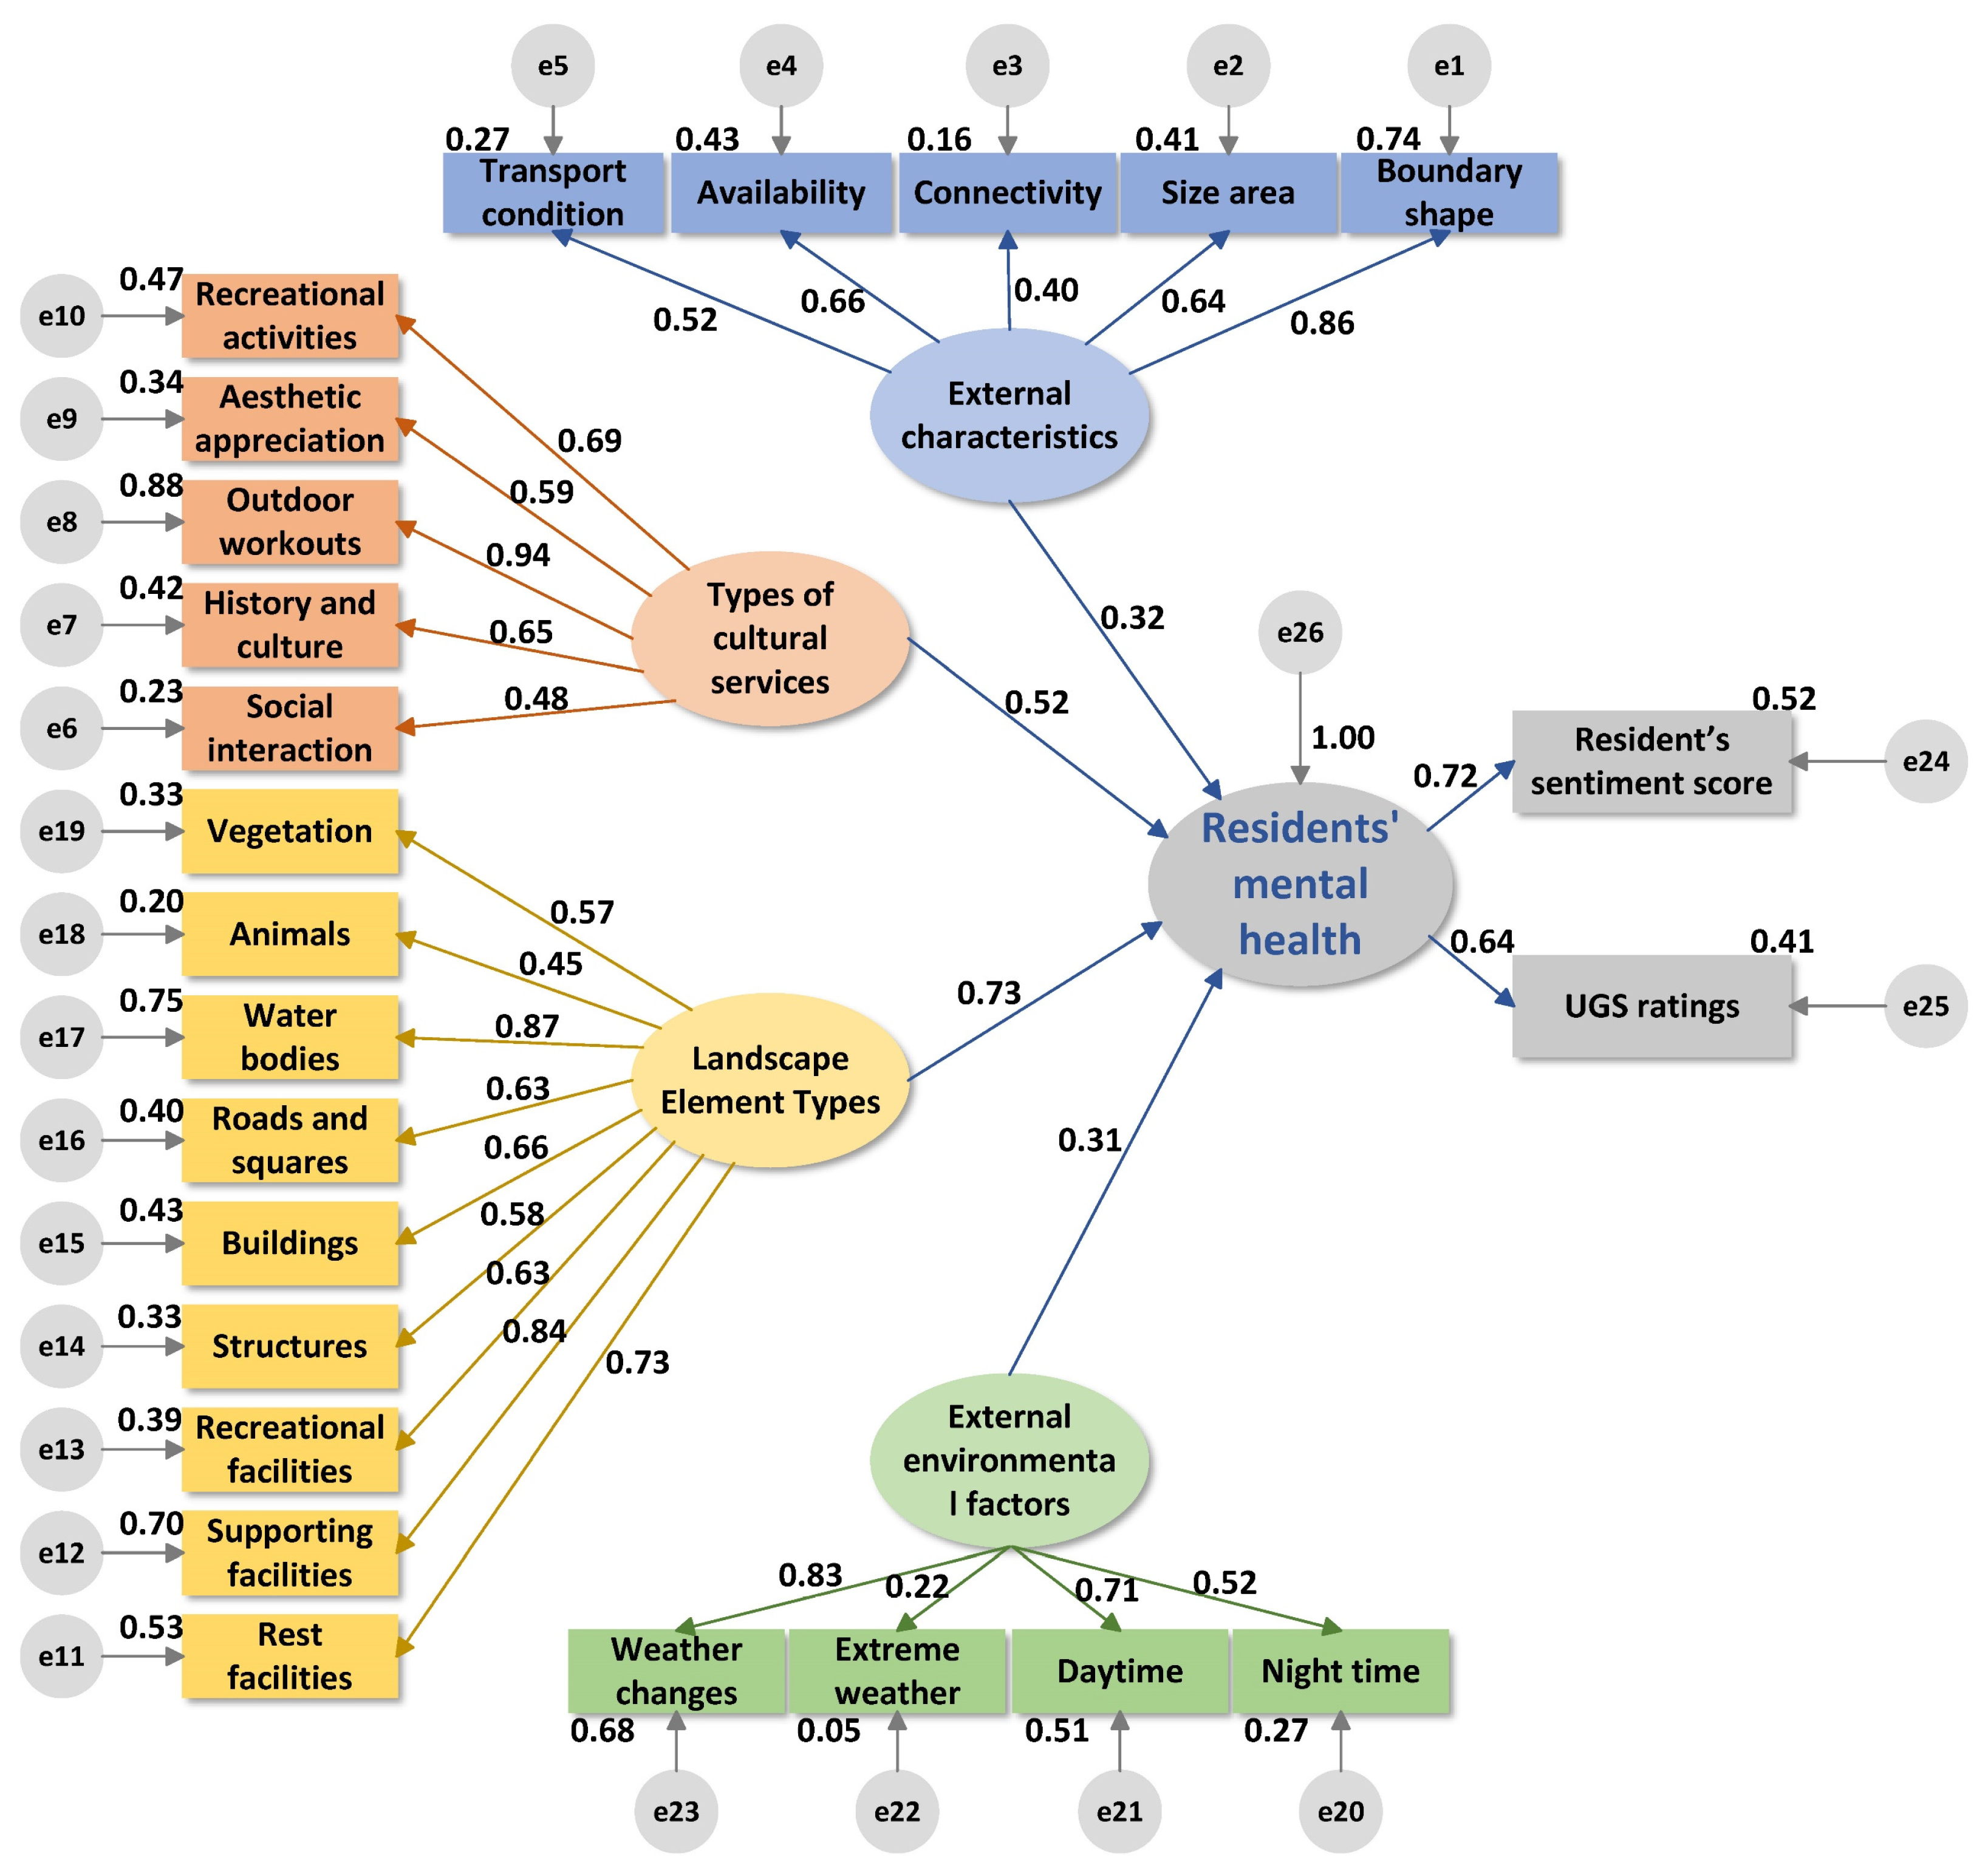
4.7. SEM of the Impact of Green Space Elements on Residents’ Mental Health
5. Discussion
5.1. The Overall Impact of Various UGS Elements on Residents’ Mental Health
- (1)
- The external characteristics of UGS have a positive impact on residents’ emotions.
- (2)
- The ecosystem cultural services of UGS positively affect residents’ emotions.
- (3)
- The landscape elements in UGS positively influence residents’ emotions.
- (4)
- The environmental factors of UGS positively affect residents’ emotions.
- (5)
- Among these, landscape elements exert the strongest positive influence on residents’ emotions, while the other three factors have relatively small and similar levels of impact.
5.2. The Impact of Various Elements in Different Types of Green Spaces on Residents’ Mental Health
5.3. Limitations and Prospects
6. Conclusions
Author Contributions
Funding
Institutional Review Board Statement
Informed Consent Statement
Data Availability Statement
Conflicts of Interest
References
- Makutėnienė, D.; Staugaitis, A.J.; Makutėnas, V.; Grīnberga-Zālīte, G. The impact of economic growth and urbanisation on environmental degradation in the Baltic states: An extended Kaya identity. Agriculture 2023, 13, 1844. [Google Scholar] [CrossRef]
- Izakovičová, Z.; Petrovič, F.; Pauditšová, E. The impacts of urbanisation on landscape and environment: The case of Slovakia. Sustainability 2021, 14, 60. [Google Scholar] [CrossRef]
- Xu, Z.; Gahr, M.; Xiang, Y.; Kingdon, D.; Rüsch, N.; Wang, G. The state of mental health care in China. Asian J. Psychiatr. 2022, 69, 102975. [Google Scholar] [CrossRef] [PubMed]
- Zhang, F.; Qian, H. A comprehensive review of the environmental benefits of urban green spaces. Environ. Res. 2024, 252, 118837. [Google Scholar] [CrossRef]
- Qi, Y.; Chen, Q.; Lin, F.; Liu, Q.; Zhang, X.; Guo, J.; Qiu, L.; Gao, T. Comparative study on birdsong and its multi-sensory combinational effects on physio-psychological restoration. J. Environ. Psychol. 2022, 83, 101879. [Google Scholar] [CrossRef]
- Schebella, M.F.; Weber, D.; Schultz, L.; Weinstein, P. The wellbeing benefits associated with perceived and measured biodiversity in Australian urban green spaces. Sustainability 2019, 11, 802. [Google Scholar] [CrossRef]
- Fisher, J.C.; Irvine, K.N.; Bicknell, J.E.; Hayes, W.M.; Fernandes, D.; Mistry, J.; Davies, Z.G. Perceived biodiversity, sound, naturalness and safety enhance the restorative quality and wellbeing benefits of green and blue space in a neotropical city. Sci. Total Environ. 2021, 755, 143095. [Google Scholar] [CrossRef]
- Bakhtsiyarava, M.; Ju, Y.; Moran, M.; Rodríguez, D.A.; Dronova, I.; Delclòs-Alió, X.; Moore, K.; Castillo-Riquelme, M.; Anza-Ramirez, C. Associations between urban greenspace and depressive symptoms in Mexico’s cities using different greenspace metrics. Appl. Geogr. 2024, 164, 103219. [Google Scholar] [CrossRef]
- Reyes-Riveros, R.; Altamirano, A.; De La Barrera, F.; Rozas-Vásquez, D.; Vieli, L.; Meli, P. Linking public urban green spaces and human well-being: A systematic review. Urban For. Urban Green. 2021, 61, 127105. [Google Scholar] [CrossRef]
- Ha, J.; Kim, H.J.; With, K.A. Urban green space alone is not enough: A landscape analysis linking the spatial distribution of urban green space to mental health in the city of Chicago. Landsc. Urban Plan. 2022, 218, 104309. [Google Scholar] [CrossRef]
- Bressane, A.; da Cunha Pinto, J.P.; Goulart, A.P.G.; de Castro Medeiros, L.C. Which dimensions of nature contact in Urban Green Spaces most significantly contribute to mental wellbeing? A multidimensional analysis in Brazilian metropolitan cities. Health Place 2024, 89, 103335. [Google Scholar] [CrossRef] [PubMed]
- Zhang, R.; Peng, S.; Sun, F.; Deng, L.; Che, Y. Assessing the social equity of urban parks: An improved index integrating multiple quality dimensions and service accessibility. Cities 2022, 129, 103839. [Google Scholar] [CrossRef]
- Liu, B.; Zheng, S.; Zhang, L.; Liu, J.; Fu, T.; Hao, R.; Yin, M. Identification and Analysis of Potential Open-Sharing Subjects of Unit-Affiliated Green Spaces in Shanghai Based on POI Data. Land 2023, 12, 2162. [Google Scholar] [CrossRef]
- Sergiacomi, C.; Vuletić, D.; Paletto, A.; Barbierato, E.; Fagarazzi, C. Exploring National Park Visitors’ Judgements from Social Media: The Case Study of Plitvice Lakes National Park. Forests 2022, 13, 717. [Google Scholar] [CrossRef]
- Li, J.; Gao, J.; Zhang, Z.; Fu, J.; Shao, G.; Zhao, Z.; Yang, P. Insights into citizens’ experiences of cultural ecosystem services in urban green spaces based on social media analytics. Landsc. Urban Plan. 2024, 244, 104999. [Google Scholar] [CrossRef]
- Ge, F.; Tang, G.; Zhong, M.; Zhang, Y.; Xiao, J.; Li, J.; Ge, F. Assessment of ecosystem health and its key determinants in the middle reaches of the yangtze river urban agglomeration, china. Int. J. Environ. Res. Public Health 2022, 19, 771. [Google Scholar] [CrossRef]
- Delgado-Serrano, M.M.; Melichová, K.; Mac Fadden, I.; Cruz-Piedrahita, C. Perception of green spaces’ role in enhancing mental health and mental well-being in small and medium-sized cities. Land Use Policy 2024, 139, 107087. [Google Scholar] [CrossRef]
- Wang, R.; Browning, M.H.; Kee, F.; Hunter, R.F. Exploring mechanistic pathways linking urban green and blue space to mental wellbeing before and after urban regeneration of a greenway: Evidence from the Connswater Community Greenway, Belfast, UK. Landsc. Urban Plan. 2023, 235, 104739. [Google Scholar] [CrossRef]
- Reid, C.E.; Rieves, E.S.; Carlson, K. Perceptions of green space usage, abundance, and quality of green space were associated with better mental health during the COVID-19 pandemic among residents of Denver. PLoS ONE 2022, 17, e0263779. [Google Scholar] [CrossRef]
- Zhang, J.; Liu, Y.; Zhou, S.; Cheng, Y.; Zhao, B. Do various dimensions of exposure metrics affect biopsychosocial pathways linking green spaces to mental health? A cross-sectional study in Nanjing, China. Landsc. Urban Plan. 2022, 226, 104494. [Google Scholar] [CrossRef]
- Yigitcanlar, T.; Kamruzzaman, M.; Teimouri, R.; Degirmenci, K.; Alanjagh, F.A. Association between park visits and mental health in a developing country context: The case of Tabriz, Iran. Landsc. Urban Plan. 2020, 199, 103805. [Google Scholar] [CrossRef]
- Yuen, H.K.; Jenkins, G.R. Factors associated with changes in subjective well-being immediately after urban park visit. Int. J. Environ. Health Res. 2020, 30, 134–145. [Google Scholar] [CrossRef] [PubMed]
- Singh, K.K.; Rho, S.; Singh, A.; Sergei, C. Big data analytics and knowledge discovery for urban computing and intelligence. Complex Intell. Syst. 2024, 10, 1–2. [Google Scholar] [CrossRef]
- Farkas, J.Z.; Hoyk, E.; de Morais, M.B.; Csomós, G. A systematic review of urban green space research over the last 30 years: A bibliometric analysis. Heliyon 2023, 9, e13406. [Google Scholar] [CrossRef] [PubMed]
- Ghermandi, A.; Sinclair, M. Passive crowdsourcing of social media in environmental research: A systematic map. Glob. Environ. Chang. 2019, 55, 36–47. [Google Scholar] [CrossRef]
- Toivonen, T.; Heikinheimo, V.; Fink, C.; Hausmann, A.; Hiippala, T.; Järv, O.; Tenkanen, H.; Di Minin, E. Social media data for conservation science: A methodological overview. Biol. Conserv. 2019, 233, 298–315. [Google Scholar] [CrossRef]
- Walter, M.; Bagozzi, B.E.; Ajibade, I.; Mondal, P. Social media analysis reveals environmental injustices in Philadelphia urban parks. Sci. Rep. 2023, 13, 12571. [Google Scholar] [CrossRef]
- Shi, L.; Maruthaveeran, S.; Yusof, M.J.M.; Dai, C. Exploring Factors Influencing Recreational Experiences of Urban River Corridors Based on Social Media Data. Appl. Sci. 2024, 14, 4086. [Google Scholar] [CrossRef]
- Li, R.; Li, Y.-Q.; Ruan, W.-Q.; Zhang, S.-N.; Wang, M.-Y. Sentiment mining of online reviews of peer-to-peer accommodations: Customer emotional heterogeneity and its influencing factors. Tour. Manag. 2023, 96, 104704. [Google Scholar] [CrossRef]
- Zhou, C.; Zhang, S.; Zhao, M.; Wang, L.; Chen, J.; Liu, B. Investigating the dynamicity of sentiment predictors in urban green spaces: A machine learning-based approach. Urban For. Urban Green. 2023, 89, 128130. [Google Scholar] [CrossRef]
- Dai, D.; Chen, Y.; Dai, K. Evaluating cultural ecosystem services in China’s modern historic parks: A sentiment computing approach. Urban For. Urban Green. 2024, 95, 128314. [Google Scholar] [CrossRef]
- Pickering, C.; Walden-Schreiner, C.; Barros, A.; Rossi, S.D. Using social media images and text to examine how tourists view and value the highest mountain in Australia. J. Outdoor Recreat. Tour. 2020, 29, 100252. [Google Scholar] [CrossRef]
- Li, P.; Liu, J.; Luo, A.; Wang, Y.; Zhu, J.; Xu, S. Deep learning method for Chinese multisource point of interest matching. Comput. Environ. Urban. 2022, 96, 101821. [Google Scholar] [CrossRef]
- Hou, Y.; Liu, Y.; Wu, Y.; Wang, L. Assessing Inequality in Urban Green Spaces with Consideration for Physical Activity Promotion: Utilizing Spatial Analysis Techniques Supported by Multisource Data. Land 2024, 13, 626. [Google Scholar] [CrossRef]
- Kong, L.; Liu, Z.; Pan, X.; Wang, Y.; Guo, X.; Wu, J. How do different types and landscape attributes of urban parks affect visitors’ positive emotions? Landsc. Urban Plan. 2022, 226, 104482. [Google Scholar] [CrossRef]
- Şenik, B.; Uzun, O. A process approach to the open green space system planning. Landsc. Ecol. Eng. 2022, 18, 203–219. [Google Scholar] [CrossRef]
- De La Iglesia Martinez, A.; Labib, S. Demystifying normalized difference vegetation index (NDVI) for greenness exposure assessments and policy interventions in urban greening. Environ. Res. 2023, 220, 115155. [Google Scholar] [CrossRef]
- Jin, B.; Geng, J.; Ke, S.; Pan, H. Analysis of spatial variation of street landscape greening and influencing factors: An example from Fuzhou city, China. Sci. Rep. 2023, 13, 21767. [Google Scholar] [CrossRef]
- Long, X.; Lin, H.; An, X.; Chen, S.; Qi, S.; Zhang, M. Evaluation and analysis of ecosystem service value based on land use/cover change in Dongting Lake wetland. Ecol. Indic. 2022, 136, 108619. [Google Scholar] [CrossRef]
- Yang, K.; Luo, Y.; Li, M.; Zhong, S.; Liu, Q.; Li, X. Reconstruction of sentinel-2 image time series using google earth engine. Remote Sens. 2022, 14, 4395. [Google Scholar] [CrossRef]
- Sun, P.; Song, Y.; Lu, W. Effect of urban green space in the hilly environment on physical activity and health outcomes: Mediation analysis on multiple greenery measures. Land 2022, 11, 612. [Google Scholar] [CrossRef]
- Masoudi, M.; Tan, P.Y. Multi-year comparison of the effects of spatial pattern of urban green spaces on urban land surface temperature. Landsc. Urban Plan. 2019, 184, 44–58. [Google Scholar] [CrossRef]
- Masoudi, M.; Richards, D.R.; Tan, P.Y. Assessment of the Influence of Spatial Scale and Type of Land Cover on Urban Landscape Pattern Analysis Using Landscape Metrics. J. Geovis. Spat. Anal. 2024, 8, 8. [Google Scholar] [CrossRef]
- Wan, J.; Wu, H.; Collins, R.; Deng, K.; Zhu, W.; Xiao, H.; Tang, X.; Tian, C.; Zhang, C.; Zhang, L. Integrative analysis of health restoration in urban blue-green spaces: A multiscale approach to community park. J. Clean. Prod. 2024, 435, 140178. [Google Scholar] [CrossRef]
- Zhao, W.; Liu, D.; Niu, J.; He, J.; Xu, F. Spatial Heterogeneity Analysis of the Multidimensional Characteristics of Urban Green Spaces in China—A Study Based on 285 Prefecture-Level Cities. Land 2024, 13, 1050. [Google Scholar] [CrossRef]
- Zhang, M.; Wang, J.; Zhang, F. The Influence of Spatial Heterogeneity of Urban Green Space on Surface Temperature. Forests 2024, 15, 878. [Google Scholar] [CrossRef]
- Zhang, Y.; Yan, S.; Liu, J.; Xu, P. Popularity influence mechanism of creative industry parks: A semantic analysis based on social media data. Sustain. Cities Soc. 2023, 90, 104384. [Google Scholar] [CrossRef]
- Huai, S.; Liu, S.; Zheng, T.; Van de Voorde, T. Are social media data and survey data consistent in measuring park visitation, park satisfaction, and their influencing factors? A case study in Shanghai. Urban For. Urban Green. 2023, 81, 127869. [Google Scholar] [CrossRef]
- Zhao, F.; Liu, H. Modeling customer satisfaction and revisit intention from online restaurant reviews: An attribute-level analysis. Ind. Manag. Data Syst. 2023, 123, 1548–1568. [Google Scholar] [CrossRef]
- Chen, J.; Becken, S.; Stantic, B. Assessing destination satisfaction by social media: An innovative approach using Importance-Performance Analysis. Ann. Tour. Res. 2022, 93, 103371. [Google Scholar] [CrossRef]
- Sun, X.; Liu, Z.; Huo, X. Six-granularity based Chinese short text classification. Ieee Access 2023, 11, 35841–35852. [Google Scholar] [CrossRef]
- Yuan, H.; Shen, X.; Kong, G.; Duan, C. Older Adults and Their Families’ Online Reviews of Urban Nursing Homes in China. Gerontologist 2024, 64, gnad134. [Google Scholar] [CrossRef]
- Kiplagat, A.K.; Koech, J.K.; Ng’etich, J.K.; Lagat, M.J.; Khazenzi, J.A.; Odhiambo, K.O. Urban green space characteristics, visitation patterns and influence of visitors’ socio-economic attributes on visitation in Kisumu City and Eldoret Municipality, Kenya. Trees Forest. People 2022, 7, 100175. [Google Scholar] [CrossRef]
- Koh, Y.F.; Loc, H.H.; Park, E. Towards a “City in nature”: Evaluating the cultural ecosystem services approach using online public participation GIS to support urban green space management. Sustainability 2022, 14, 1499. [Google Scholar] [CrossRef]
- Li, J.; Huang, Z.; Zheng, D.; Zhao, Y.; Huang, P.; Huang, S.; Fang, W.; Fu, W.; Zhu, Z. Effect of landscape elements on public psychology in urban park waterfront green space: A quantitative study by semantic segmentation. Forests 2023, 14, 244. [Google Scholar] [CrossRef]
- Cao, S.; Shang, Z.; Li, X.; Luo, H.; Sun, L.; Jiang, M.; Du, J.; Fu, E.; Ma, J.; Li, N. Cloudy or sunny? Effects of different environmental types of urban green spaces on public physiological and psychological health under two weather conditions. Front. Public Health 2023, 11, 1258848. [Google Scholar] [CrossRef]
- Ma, S.; Wang, B.; Liu, W.; Zhou, H.; Wang, Y.; Li, S. Assessment of street space quality and subjective well-being mismatch and its impact, using multi-source big data. Cities 2024, 147, 104797. [Google Scholar] [CrossRef]
- Huai, S.; Van de Voorde, T. Which environmental features contribute to positive and negative perceptions of urban parks? A cross-cultural comparison using online reviews and Natural Language Processing methods. Landsc. Urban Plan. 2022, 218, 104307. [Google Scholar] [CrossRef]
- Li, Y.; Afzaal, M.; Yin, Y. A lexicon-based diachronic comparison of emotions and sentiments in literary translation: A case study of five Chinese versions of David Copperfield. PLoS ONE 2024, 19, e0297101. [Google Scholar] [CrossRef]
- Li, S.; Zhu, B.; Zhang, Y.; Liu, F.; Yu, Z. A Two-Stage Nonlinear User Satisfaction Decision Model Based on Online Review Mining: Considering Non-Compensatory and Compensatory Stages. J. Theor. Appl. El. Comm. 2024, 19, 272–296. [Google Scholar] [CrossRef]
- Wu, K.; Wu, J.; Li, Y. Mining typhoon victim information based on multi-source data fusion using social media data in China: A case study of the 2019 Super Typhoon Lekima. Geomat. Nat. Hazards Risk 2022, 13, 1087–1105. [Google Scholar] [CrossRef]
- Saura, J.R.; Palacios-Marqués, D.; Ribeiro-Soriano, D. Exploring the boundaries of open innovation: Evidence from social media mining. Technovation 2023, 119, 102447. [Google Scholar] [CrossRef]
- Xu, J.; Guo, D.; Xu, J.; Luo, C. How Do Multiple Actors Conduct Science Communication About Omicron on Weibo: A Mixed-Method Study. Media Commun. 2023, 11, 306–322. [Google Scholar] [CrossRef]
- Wang, C.; Zhu, R.; Zhong, J.; Shi, H.; Liu, C.; Liu, H.; Tan, B.; Xiang, L.; Xiang, R.; Ye, X. Smellscape Characteristics of an Urban Park in Summer: A Case Study in Beijing, China. Sustainability 2023, 16, 163. [Google Scholar] [CrossRef]
- Xue, K.; Yu, K.; Zhang, H.; Liang, X. Research on health promotion strategies of public recreation space in the coastal area of Qingdao City Center, China. Sustain. Energy Technol. 2022, 52, 102144. [Google Scholar] [CrossRef]
- Xiang, Y.; Hedblom, M.; Wang, S.; Qiu, L.; Gao, T. Indicator selection combining audio and visual perception of urban green spaces. Ecol. Indic. 2022, 137, 108772. [Google Scholar] [CrossRef]
- van den Heuvel, E.; Zhan, Z. Myths about linear and monotonic associations: Pearson’sr, Spearman’s ρ, and Kendall’s τ. Am. Stat. 2022, 76, 44–52. [Google Scholar] [CrossRef]
- Arif, M.; Petrosillo, I.; Changxiao, L. Effects of changing riparian topography on the decline of ecological indicators along the drawdown zones of long rivers in China. Front. For. Glob. Chang. 2024, 7, 1293330. [Google Scholar] [CrossRef]
- Yin, Z.; Zhang, Y.; Zhang, R.; Chen, G.; Cong, Y.; Ma, K. Structure of an urban green space indirectly affects the distribution of airborne particulate matter: A study based on structural equation modelling. Urban For. Urban Green. 2022, 72, 127581. [Google Scholar] [CrossRef]
- He, D.; Miao, J.; Lu, Y.; Song, Y.; Chen, L.; Liu, Y. Urban greenery mitigates the negative effect of urban density on older adults’ life satisfaction: Evidence from Shanghai, China. Cities 2022, 124, 103607. [Google Scholar] [CrossRef]
- Lefcheck, J.S. piecewiseSEM: Piecewise structural equation modelling in r for ecology, evolution, and systematics. Methods Ecol. Evol. 2016, 7, 573–579. [Google Scholar] [CrossRef]
- Zhao, Y.; van den Berg, P.E.; Ossokina, I.V.; Arentze, T.A. How do urban parks, neighborhood open spaces, and private gardens relate to individuals’ subjective well-being: Results of a structural equation model. Sustain. Cities Soc. 2024, 101, 105094. [Google Scholar] [CrossRef]
- Wilson, B.; Neale, C.; Roe, J. Urban green space access, social cohesion, and mental health outcomes before and during COVID-19. Cities 2024, 152, 105173. [Google Scholar] [CrossRef]
- Owuor, I.; Hochmair, H.H.; Paulus, G. Use of social media data, online reviews and wikipedia page views to measure visitation patterns of outdoor attractions. J. Outdoor Recreat. Tour. 2023, 44, 100681. [Google Scholar] [CrossRef]
- Li, H.; Browning, M.H.; Dzhambov, A.M.; Zhang, G.; Cao, Y. Green space for mental health in the COVID-19 era: A pathway analysis in residential green space users. Land 2022, 11, 1128. [Google Scholar] [CrossRef]
- Wang, P.; Han, L.; Hao, R.; Mei, R. Understanding the relationship between small urban parks and mental health: A case study in Shanghai, China. Urban For. Urban Green. 2022, 78, 127784. [Google Scholar] [CrossRef]
- Mendoza, H.; Rodriguez-Loureiro, L.; Gadeyne, S.; Lefebvre, W.; Vanpoucke, C.; Casas, L. Urban green spaces and suicide mortality in Belgium (2001–2011): A census-based longitudinal study. Environ. Res. 2023, 216, 114517. [Google Scholar] [CrossRef]
- Zhou, Y.; Yang, L.; Yu, J.; Guo, S. Do seasons matter? Exploring the dynamic link between blue-green space and mental restoration. Urban For. Urban Green. 2022, 73, 127612. [Google Scholar] [CrossRef]
- Cao, S.; Song, C.; Jiang, S.; Luo, H.; Zhang, P.; Huang, Y.; Yu, J.; Li, K.; Li, N.; Guo, B. Effects of Urban Greenway Environmental Types and Landscape Characteristics on Physical and Mental Health Restoration. Forests 2024, 15, 679. [Google Scholar] [CrossRef]
- Dong, T.; Feng, C.R.; Yue, B.G.; Zhang, Z.D. An Evaluation Model of Urban Green Space Based on Residents’ Physical Activity. Sustainability 2024, 16, 4220. [Google Scholar] [CrossRef]
- Dong, T.; Zhong, Q.K.; Yue, B.G. How Green Space Justice in urban built-up areas affects public mental health: A moderated chain mediation model. Front. Public Health 2024, 12, 1442182. [Google Scholar] [CrossRef] [PubMed]


| Spatial Characteristics of Green Spaces | Measurement Indicators | Bibliography |
|---|---|---|
| Availability | NDVI | [37,41] |
| Connectivity | Area-weighted mean euclidean nearest neighbor distance (ENN_AM) | [42,43] |
| Size area | Area | [44,45] |
| Boundary shape | Area-weighted mean shape index (SHAPE_AM) | [43,46] |
| Type of Park | Definition | Quantities |
|---|---|---|
| Comprehensive Parks | These green areas are content-rich, ideal for various outdoor activities, and offer full recreational and support services. | 14 |
| Cultural Relics Parks | These areas are green parks primarily made up of significant relics and their surrounding environment, emphasizing relic preservation and exhibition. They hold exceptional historical and cultural importance, serving cultural, recreational, and additional purposes. | 11 |
| Ecological Parks | Ecological parks offer forest tourism and nature landscape tours to the public, with extensive woodland as their primary feature. | 21 |
| Recreational Parks | Recreational parks feature children’s areas, zoos, botanical gardens, and sports fields, each designed to support play and typically serve a single function. | 13 |
| Community Parks | These parks are self-contained, featuring basic recreational and service amenities, primarily for nearby community residents to engage in daily recreational activities near other service zones. | 3 |
| External Characteristics | Instructions | Total Number of Words |
|---|---|---|
| Transport condition | Access to the park’s surroundings, access to public transport | 248 |
| Types of Cultural Services | Instructions | Total Number of Words |
|---|---|---|
| Recreational activities | Among such services provided by the park, residents can engage in various types of cultural and recreational activities, including performances, exhibitions, etc. | 47 |
| Aesthetic appreciation | In this type of service provided by the park, residents can perceive, understand, and evaluate the landscape, layout, and elements, including marveling at and appreciating the various types of scenery. | 81 |
| Outdoor workouts | Among such services provided by the park, residents can engage in various types of physical exercise and fitness activities, including running, playing ball games, etc. | 64 |
| History and culture | In such services provided by the park, residents can experience various elements reflecting historical changes, cultural heritage, and regional characteristics, including museums, ancient buildings, etc. | 74 |
| Social interaction | In this type of service provided by the park, residents can engage in various forms of communication, sharing, and other social behaviors with each other, including chatting, taking photos, etc. | 34 |
| Landscape Element Types | Instructions | Total Number of Words | |
|---|---|---|---|
| Natural landscape elements | Vegetation | Various types of plants in the park, including trees, shrubs, herbs, aquatic plants, etc. | 115 |
| Animals | Animals in the park, including birds, mammals, insects, aquatic animals, etc. | 117 | |
| Water bodies | Water bodies in parks, including lakes, ponds, streams, fountains, waterfalls, etc. | 208 | |
| Artificial landscape elements | Roads and squares | Including lanes, walkways, trails, staging plazas, recreation plazas, cultural plazas, etc. | 72 |
| Buildings | Including service buildings, public administration facilities, tourist buildings, etc. | 167 | |
| Structures | Including sculptures, fountains, and other landscape features and structures, such as steps and walls. | 82 | |
| Recreational facilities | Including amusement parks, aquariums, ballparks, etc. | 55 | |
| Supporting facilities | Including transport facilities, public service facilities, catering, etc. | 149 | |
| Rest facilities | Includes seating, gazebos, campsites, etc. | 97 | |
| External Environmental Factors | Instructions | Total Number of Words | |
|---|---|---|---|
| Weather conditions | Weather changes | Cloudy, sunny, rainy, snowy, etc. | 39 |
| Extreme weather | Rainstorms, snowstorms, typhoons, thunderstorms, etc. | 77 | |
| Circadian conditions | Daytime | Time words for daytime. | 35 |
| Night time | Time words for evening. | 16 | |
| External Characteristics | r | p |
|---|---|---|
| Transport condition | 0.597 *** | 0.000 |
| Availability | 0.578 *** | 0.000 |
| Connectivity | 0.283 * | 0.026 |
| Size area | 0.301 * | 0.017 |
| Boundary shape | 0.698 *** | 0.000 |
| External Environmental Factors | r | p | |
|---|---|---|---|
| Weather conditions | Weather changes | 0.402 *** | 0.000 |
| Extreme weather | 0.325 *** | 0.000 | |
| Circadian conditions | Daytime | 0.352 *** | 0.000 |
| Night time | 0.350 *** | 0.000 | |
| Direction | Standardized Coefficients | Unstandardized Coefficients | S.E. | C.R. | p |
|---|---|---|---|---|---|
| External characteristics →Residents’ mental health | 0.318 | 0.042 | 0.016 | 2.572 | 0.010 |
| Types of cultural services →Residents’ mental health | 0.653 | 0.219 | 0.219 | 2.989 | 0.003 |
| Landscape Element Types →Residents’ mental health | 0.385 | 0.081 | 0.081 | 4.747 | 0.000 |
| External environmental factors →Residents’ mental health | 0.191 | 0.088 | 0.088 | 2.180 | 0.029 |
| Index | χ2/df | RMSEA | GFI | IFI | TLI | CFI |
|---|---|---|---|---|---|---|
| Recommended value | <3 | <0.08 | >0.9 | >0.9 | >0.9 | >0.9 |
| Model value | 2.136 | 0.046 | 0.918 | 0.970 | 0.960 | 0.970 |
Disclaimer/Publisher’s Note: The statements, opinions and data contained in all publications are solely those of the individual author(s) and contributor(s) and not of MDPI and/or the editor(s). MDPI and/or the editor(s) disclaim responsibility for any injury to people or property resulting from any ideas, methods, instructions or products referred to in the content. |
© 2025 by the authors. Licensee MDPI, Basel, Switzerland. This article is an open access article distributed under the terms and conditions of the Creative Commons Attribution (CC BY) license (https://creativecommons.org/licenses/by/4.0/).
Share and Cite
Li, Z.; Dong, T. Exploring the Mental Health Benefits of Urban Green Spaces Through Social Media Big Data: A Case Study of the Changsha–Zhuzhou–Xiangtan Urban Agglomeration. Sustainability 2025, 17, 3465. https://doi.org/10.3390/su17083465
Li Z, Dong T. Exploring the Mental Health Benefits of Urban Green Spaces Through Social Media Big Data: A Case Study of the Changsha–Zhuzhou–Xiangtan Urban Agglomeration. Sustainability. 2025; 17(8):3465. https://doi.org/10.3390/su17083465
Chicago/Turabian StyleLi, Zhijian, and Tian Dong. 2025. "Exploring the Mental Health Benefits of Urban Green Spaces Through Social Media Big Data: A Case Study of the Changsha–Zhuzhou–Xiangtan Urban Agglomeration" Sustainability 17, no. 8: 3465. https://doi.org/10.3390/su17083465
APA StyleLi, Z., & Dong, T. (2025). Exploring the Mental Health Benefits of Urban Green Spaces Through Social Media Big Data: A Case Study of the Changsha–Zhuzhou–Xiangtan Urban Agglomeration. Sustainability, 17(8), 3465. https://doi.org/10.3390/su17083465