Article

The Impact of Visual Elements in Street View on Street Quality: A Quantitative Study Based on Deep Learning, Elastic Net Regression, and SHapley Additive exPlanations (SHAP)

1
Department of Landscape Architecture, Kyungpook National University, Daegu 41566, Republic of Korea
2
Department of Interior Environmental Design, Pusan National University, Busan 46241, Republic of Korea
*
Author to whom correspondence should be addressed.
These authors contributed equally to this work.
Sustainability 2025, 17(8), 3454; https://doi.org/10.3390/su17083454
Submission received: 6 March 2025 / Revised: 9 April 2025 / Accepted: 11 April 2025 / Published: 13 April 2025

Abstract

:
Urban street quality directly affects the daily lives of residents and the experiences of tourists, playing a crucial role in the sustainable development of cities. However, most studies either focus on a single demographic or lack interpretable data analysis. To address this, we propose a framework integrating deep learning, elastic net regression, and SHapley Additive exPlanations (SHAPs). Using street view images, we quantitatively assess street quality in Xi’an’s Mingcheng District, considering the perspectives of both residents and tourists. The framework assesses comfort, convenience, safety, and culture to determine street quality and explores influencing factors. The results indicate that high-quality streets are primarily located near major urban roads, tourist attractions, and commercial areas, while older residential areas in historic districts exhibit widespread low-quality streets. Building density significantly and negatively impacts street quality, whereas visibility of the sky and green coverage positively influences street quality. SHAP reveals that greenery can mitigate the negative effects of high building density and enhance street quality. This study provides actionable insights for enhancing urban street quality through data-driven, human-centered approaches, directly contributing to the Sustainable Development Goal 11 (Sustainable Cities and Communities) by promoting more livable, safe, inclusive, and sustainable urban environments.

1. Introduction

With the acceleration of urbanization, urban streets, as an essential component of public spaces, have a profound impact on residents’ quality of life and sustainable urban development [1,2]. Streets serve not only as conduits for traffic but also as venues for social interaction, leisure, and cultural experiences [3,4]. Street quality influences outdoor activity frequency, public health, and city image formation [5,6]. In the context of tourist-oriented cities, street spaces are faced with more complex service demands. As interfaces between local daily life and external urban experiences, their users include both commuting residents and tourists with diverse expectations [7]. High-quality street environments, through distinctive architectural expressions, ecologically friendly design, and user-oriented infrastructure, not only improve residential livability but also serve as crucial assets for cultural identity and tourism attractiveness [8,9]. This dual service function underscores the multidimensional value of optimizing street quality, which relates not only to public well-being but also to the city’s economic competitiveness [10]. The implementation of Sustainable Development Goal 11 (SDG11) further highlights the necessity of enhancing urban street environments [11]. Therefore, enhancing street quality is vital not only for enriching residents’ everyday experiences but also for propelling tourism development, elevating urban branding, and facilitating sustainable urban transformations.
The study on urban street quality has evolved from qualitative descriptions to quantitative analyses and from singular perspectives to multi-stakeholder viewpoints. Early studies, grounded in environmental psychology and urban image theory, assessed street quality through subjective perception methods. For instance, Lynch in “The Image of the City” proposed that the morphological characteristics of street spaces directly affect residents’ spatial cognition and emotional dependence [12]; environmental psychologists have explored the impact of streets’ physical and visual attributes on psychological and physiological experiences through surveys and interviews [13,14,15,16]. Moreover, some studies focused on structural indices of street spaces, such as continuity, accessibility, and visibility, integrating these with user behavior patterns [17,18,19]. The development of objective evaluation methods for street quality can be traced back to Daniel’s Scenic Beauty Estimation (SBE) method in the 1970s, which laid the foundation for quantifying visual landscapes. Later, Lothian advanced the field by establishing a theoretical model linking landscape aesthetics with measurable indicators, promoting a shift from experiential judgment to empirical analysis [20,21]. With breakthroughs in computer vision and big data technologies, a fundamental paradigm shift occurred in post-2010 street landscape studies. Odgers and colleagues were pioneers in using Google Street View images to build quantitative models of urban environments, opening up interdisciplinary research pathways between street quality and public health [22]. Subsequent researchers have utilized deep learning, machine learning, and GIS spatial analysis techniques to objectively quantify street quality using street view images (SVIs), Points of Interest (PoI), and Location-Based Service (LBS) data [6,23,24,25]. For example, Zhang combined LBS data, PoI, supervised machine learning to extract elements and visual quality from SVIs, and network science to calculate density, diversity, design, destination accessibility, and transportation distance to evaluate street quality. Wang assessed the quality of street spaces based on SVIs focusing on green spaces, sky, roads, interface complexity, motorization, and walkability. Research has also integrated human subjective perception to study street quality [26,27]. For instance, Zhang Fan used deep learning methods to evaluate the perceived street quality in cities like Beijing and Shanghai based on SVIs and human subjective perceptions, examining the mechanisms of visual elements [27]. Wang’s study combined space syntax theory to analyze the relationship between street accessibility and perceived quality, offering new research directions to enhance street quality precisely with resident perceptions [26]. The perceptual dimensions of street quality assessment have continuously been updated, transitioning from a multidimensional consideration of safety, convenience, comfort, and security to focusing on the most crucial dimensions; Fruin emphasized seven dimensions, including safety, continuity, comfort, and attractiveness [5], whereas Lee measured street quality using three dimensions: safety, convenience, and comfort [28]; Ma explored the relationship between street quality and residents’ happiness by integrating multi-source big data, indicating that the street environment not only affects urban functions but also shapes psychological perceptions and social identity [29].
In tourist cities, street spaces not only serve residents but also play a crucial role in shaping the city’s tourism image. Studies indicate that tourists’ perceptions of street spaces are primarily influenced by factors such as safety, culture, and visual landscapes [8]. Chen and Lin analyzed the relationship between urban development and tourism experience from four aspects of neighborhood quality: street facilities, architectural landscapes, green ecological environments, and scene visibility [7]. They highlighted that street spaces are a vital component of a tourist city’s competitiveness [7]. Furthermore, Wang and Xiu’s assessment of the quality of historic districts also focused on safety, vitality, and landscape as key indicators, further illustrating the significant impact of street quality on cultural heritage and tourism value [25].
Synthesizing the existing research reveals several issues. First, the lack of perspectives on subject variability limits the comprehensiveness of the studies. Most research primarily focuses on local residents [26,30], with insufficient consideration for the unique needs of tourists, such as sensitivity to cultural symbols and requirements for spatial comfort [7,8]. Second, the insufficient integration of subjective and objective data leads to biased assessment results. Traditional methods rely heavily on surveys and are susceptible to sample bias [2,23,24], while analyzes based on SVIs provide objective measures but struggle to capture deeper cultural experiences and emotional cognition [25,26]. Additionally, the lack of interpretable mechanisms makes it difficult to effectively apply research findings to urban planning. Existing machine learning models often emphasize prediction accuracy but lack transparent explanations of the key factors affecting street quality, hindering the translation of research results into specific planning recommendations.
Addressing the aforementioned research gaps, this study constructs a street quality assessment framework that integrates deep learning, elastic net regression, and SHAP. Focusing on Xi’an’s Mingcheng District as a case study, the framework combines the dual perceptions of residents and tourists to comprehensively evaluate street quality across four dimensions: comfort, convenience, safety, and culture, aiming for a more holistic assessment (Figure 1). The study begins by employing semantic segmentation technology to parse SVIs and quantify visual elements of street spaces. Subsequently, it combines volunteer perception scores with the random forest model to establish an efficient street quality prediction framework, enabling precise assessment of large-scale data. The results of the perceptual evaluation were further analyzed through spatial analysis and cluster analysis. Finally, the framework uses elastic net regression and SHAP to reveal the nonlinear impact mechanisms of key visual elements and provide actionable urban planning optimization suggestions. The main contributions of this study are the following: methodologically, applying SHAP to street quality research addresses the “black box” issue of existing studies, making the results interpretable to planners; theoretically, it constructs a four-dimensional evaluation system, a novel approach that incorporates both residents’ and tourists’ perspectives, addressing a gap in previous street quality assessments that overlooked subject variability; practically, by visualizing SHAP values spatially, it quantifies the contribution of key street view elements, thereby supporting evidence-based strategies for targeted street improvement. Overall, this study aims to establish a street quality assessment framework that merges multi-source data analysis with interpretable machine learning, offering theoretical support and technical guidance for refined urban planning and the construction of livable environments.

2. Study Area and Data Collection

2.1. Study Area

This study focuses on the Mingcheng District of Xi’an, Shaanxi Province, as its primary research area (Figure 2). Xi’an, the capital of Shaanxi Province, lies in the Guanzhong Plain. The Mingcheng District, its historic core, balances heritage preservation with urban renewal. The district covers an area of approximately 1710 hectares, with a permanent population of about 306,462 (as of 2022, Xi’an Bureau of Statistics: http://tjj.xa.gov.cn/tjnj/2023/zk/indexch.htm (accessed on 3 December 2024)), exhibiting high population density and concentrated urban functions. Additionally, as reported by Xi’an Daily (https://mp.weixin.qq.com/s/1vKoaaOnVZ7uTEzyA0S_lA (accessed on 3 December 2024)) during the five-day Labor Day holiday in 2024, the Xi’an City Wall Scenic Area received 211,000 visitors, and the museums and memorials within the city wall collectively welcomed 174,000 visitors, highlighting the region’s tremendous potential in urban tourism. In recent years, the Xi’an municipal government has introduced a series of urban renovation policies focused on improving street infrastructure and environmental quality [31], aimed at further enhancing residents’ living experiences and the public space environment. However, as the urbanization process accelerates, the historic and central Mingcheng District faces increasing developmental and renewal pressures, underscoring the urgent need for enhancements in street quality. A scientific and systematic assessment of street quality in this area not only quantifies the actual effects of existing urban transformation policies but also provides an objective and concrete decision-making bases for subsequent urban renewal and planning, which is of significant importance for creating livable and sustainable urban environments.

2.2. Collecting Street View Image Data

To assess street quality in the Mingcheng District, this study utilized road network data from OpenStreetMap (OSM, https://www.openstreetmap.org), setting street view sampling points at 50 m intervals. At each point, SVIs were captured in the four cardinal directions (0°, 90°, 180°, and 270°) and subsequently merged to generate a panoramic view. Based on the OSM street network, a total of 5929 collection points were generated in the study area. Subsequently, URLs were constructed using Python (version 0.5.3) scripts to call the Baidu Street View Map API, obtaining panoramic images for each coordinate point. During this process, collection points without available SVIs were excluded; additionally, based on the comprehensive image quality assessment framework proposed by Hou, SVIs with issues in image quality, spatial quality, temporal quality, logical consistency, and redundancy were filtered out, retaining 5309 high-quality panoramic SVIs for further analysis [32]. The final dataset covers 89.7% of the study area, effectively capturing its street space characteristics.

2.3. Urban Street Visual Elements Data

To more accurately interpret street quality, this study utilizes image segmentation technology to calculate the proportion of visual elements in each street scene image. By inputting SVIs, the trained model can segment and recognize various other visual element labels. The optimized DeepLabv3+ model is employed, which has enhanced road scene segmentation methods, addressing the common trade-offs between accuracy and real-time performance found in existing methods [33]. The training data were sourced from the ADE20K dataset, which was published in 2017 by the Computer Science and Artificial Intelligence Laboratory at MIT, which includes high-resolution urban SVIs with detailed semantic and instance segmentation labels, covering 150 everyday life objects such as sky, road, cars, and plants, suitable for urban environment computer vision tasks [34]. The DeepLabv3+ model achieved an accuracy of 91.83% on the training set and 89.23% on the validation set, effectively segmenting SVIs to determine the proportion of visual elements in each image, serving as the feature dataset for training the random forest.
Furthermore, this study also incorporates factors affecting visual perception: color complexity and material complexity. Urban color, an indispensable component of the urban environment, can intuitively convey the city’s image, shape urban characteristics, and influence the psychological perceptions of residents and tourists [35,36,37]. The unique color count method employed in this study is based on color complexity measurement techniques used in texture image analysis, where the diversity of RGB values reflects visual complexity [38]. Initially, images are converted to RGB color space and flattened into a two-dimensional matrix containing red, green, and blue channels. By counting the number of unique color combinations, the image’s color diversity is assessed—the greater the number of unique colors, the higher the color complexity. The Sobel operator was applied to extract image gradient magnitudes as an indicator of material complexity. This method has been proven effective in surface texture analysis and edge detection in prior studies [39]. First, RGB images are converted into grayscale to reduce computational complexity and extract the primary brightness change features. Then, gradients in the horizontal and vertical directions are calculated, and the gradient magnitudes are obtained by squaring and square rooting, representing the image’s edge and texture features. Finally, the sum of the mean and standard deviation of the gradient magnitudes are calculated to determine the image’s material complexity.

2.4. Street Quality Perception Label Data

The human visual system has a significant advantage in the cognitive assessment of the built environment [40], providing a basis for the feasibility of data production. To ensure evaluative consistency and methodological rigor, all participants received standardized definitions of the four perception dimensions—comfort, safety, convenience, and culture—before scoring. They were also given the opportunity to review the complete set of images in advance, facilitating a comprehensive understanding of the evaluation framework. Comfort primarily focuses on environmental cleanliness, the level of greening, and municipal public facilities. This includes the cleanliness of roads, garbage removal and ground maintenance, rich green vegetation (such as street trees, green belts, buffer zones), and the rational layout of municipal public facilities (such as seating, lighting, walkways), all of which collectively enhance the livability of the street and the psychological comfort of pedestrians [5,10,41,42]. Safety concentrates on the community aspect of the public environment and the degree of vehicular interference with pedestrians, including traffic management safety, nighttime lighting and surveillance facilities, and pedestrians’ intuitive sense of potential crime and accidental risks, thereby reducing traffic conflicts, lowering hazards, and enhancing people’s trust in the streets [1,28,43]; Convenience focuses on the accessibility and functional diversity of street spaces, involving road congestion situations and the separation of pedestrians and vehicles, as well as convenient connections to public transportation, walking, and cycling facilities, and the balanced distribution of commercial, government, medical, educational, and other functional places to ensure that residents and the public can quickly access needed services [28,44,45]. Culture emphasizes the representation of historical culture and artistic design in street spaces, focusing on the preservation of historic buildings and traditional customs, the display of cultural symbols and historical memory, and the aesthetics of cultural artifacts, such as sculptures, murals, and artistic installations. These cultural heritage elements not only enhance the artistic and scenic value of street views but also strengthen the city’s attractiveness and residents’ sense of belonging [7,8,9]. For specific issues, see Appendix A Table A1.
To construct the human perception dataset, this study recruited 25 volunteers (12 males and 13 females; 15 residents and 10 tourists; aged between 19 and 55) from different neighborhoods within the Mingcheng District (Table 1). A purposive sampling strategy was adopted to ensure that participants had adequate familiarity with the study area and diverse spatial experiences. Specifically, residents were selected from various sub-districts to capture internal urban variation, while tourists were recruited based on their visits to the district within the past year. All participants were independent of the research team and voluntarily agreed to participate in the evaluation. Prior to the formal assessment, all participants were introduced to the four perceptual dimensions—comfort, convenience, safety, and culture—using standardized definitions and illustrative examples to ensure a consistent understanding of the evaluation criteria. To ensure the comprehensiveness of the perceptual dataset, we used a Python-based tool to conduct a semi-random selection of SVIs, ensuring coverage across various neighborhoods in the Mingcheng District for broad geographic and functional representation. A total of 500 street view images were selected, with each volunteer evaluating 50 images. Each image received ratings from at least two different volunteers. The scoring method followed the approach proposed by Yao and Han [46,47]. Volunteers rated each image on a scale from 0 to 100 across the four perceptual dimensions, where 0 indicates the lowest perceived quality and 100 the highest. Each image was observed for no less than 10 s prior to scoring [48], allowing participants to reflect on their intuitive impressions before assigning scores. All scores were compiled into a labeled dataset, which was subsequently used to train the random forest model. To assess the reliability of the perceptual data, this study employed the McDonald’s Omega coefficient to evaluate internal consistency, calculated using the pingouin package in Python (version 0.5.3). Compared to traditional measures, such as Cronbach’s Alpha, Omega has been shown to be less prone to underestimating or overestimating reliability [49,50]. The results show that the overall Omega values all exceed 0.84, indicating a high level of consistency across all ratings. Comfort ( ω = 0.877), convenience (0.864), safety (0.867), and culture (0.841) all demonstrate strong internal reliability. Although the results are reliable, some bias may exist due to perceptual differences among individuals. As the initial study in a broader research series, future work will focus on addressing these individual differences to improve the generalizability of the findings.

3. Methodology

As shown in Figure 1, this study follows three main processes. In the first process, we extract visual semantic elements from SVIs using deep learning-based semantic segmentation and then recruit volunteers to score street quality based on four perceptual dimensions. In the second process, we focus on using the random forest machine learning algorithm to score street quality perception indicators, with a weighted average used to provide an overall description of urban quality perception. In the third process, we utilize an elastic net regression model and SHAP to conduct a practical exploration of quality perception, analyzing the relationship between visual elements and street quality perception.

3.1. Urban Street Quality Perception Modeling Using Random Forests

To quantitatively predict residents’ perceived street quality based on image-derived features, this study employs a machine learning algorithm based on random forests. This model has been proven to have excellent fitting performance in previous studies [46,47], and it facilitates convenient and effective assessment of street quality in the Mingcheng District. During the training phase of the random forest model, two-thirds of the samples are randomly selected using bootstrap for data fitting or classification, while the remaining one-third are defined as out-of-bag (OOB) data, which are used to evaluate the overall model error and the importance of variables. The formula is:
V I n X j = i = 1 N OOB I f X i = f n X i i = 1 N OOB I f X i = f n X i / N O O B
where, X j : the j -th input variable used in model training; f n : the prediction function of the n -th tree; f X i : the true label of observation i ; X i : the original OOB (out-of-bag) sample; X i : the same OOB sample with variable X j randomly permuted; I · : indicator function, equal to 1 if the prediction is correct and 0 otherwise; N OOB : the total number of OOB observations used in this tree. The importance score V I n X j measures the difference in model accuracy before and after the random permutation of X j . A larger decrease in accuracy indicates higher importance. Finally, the average importance across all trees in the forest is taken as the final importance of the variable X j . Model performance was evaluated using Mean Absolute Error (MAE), Root Mean Squared Error (RMSE), and the Coefficient of Determination (R2), which are commonly used in perception prediction tasks for their interpretability and robustness.

3.2. Exploring Factors Influencing Street Quality

3.2.1. Elastic Net Regression

Elastic net regression (ENR) combines the characteristics of L1 regularization (Lasso) and L2 regularization (Ridge), effectively addressing multicollinearity issues and providing robust regression analysis capabilities in high-dimensional data environments. Ridge alleviates the effects of collinearity among variables by penalizing the squares of the regression coefficients, preventing excessive inflation of model parameters; Lasso introduces a sparsity constraint, shrinking the coefficients of less important features to zero, thereby enabling automatic feature selection [51,52]. Therefore, this study employs the elastic net regression model to systematically analyze the impact of urban street view visual elements on street quality. The function is as follows:
min β 1 2 n i = 1 n y i x i T β 2 + λ α j = i p | β i | + 1 2 1 α j = 1 p β j 2
where y i : observed street quality score for observation i ; x i : feature vector of visual elements for observation i ; β : vector of regression coefficients; λ : regularization parameter controlling overall penalty strength; α : mixing parameter between L1 (Lasso) and L2 (Ridge) penalties; p : number of visual feature variables; n : total number of observations; and j : index ranging over the visual feature variables from 1 to p .
This objective function balances model fit and complexity by minimizing prediction error while applying regularization. It enables automatic feature selection and avoids overfitting. In implementation, the α and λ parameters were tuned using grid search with 5-fold cross-validation to find the optimal combination. Specifically, this was tested across [0.1, 0.5, 0.7, 0.9, 1.0], and λ was searched logarithmically from 10−4 to 104. Model performance was evaluated based on Mean Absolute Error (MAE), Mean Squared Error (MSE), and the Coefficient of Determination (R2). These metrics were chosen for their suitability in evaluating regularized regression models with multicollinearity.

3.2.2. SHapley Additive exPlanations

To further elucidate the nonlinear influences and their interactions on street quality, the SHAP was utilized to interpret the elastic net regression model. SHAP is grounded in cooperative game theory, specifically the Shapley value theory, which allocates a contribution degree to each feature to quantify its importance in model predictions [53]. The primary aim of the SHAP is to enhance the interpretability of the model by providing fair distributions of feature influences and offering explanations at both global and local levels. This method not only enables precise analysis of the individual contributions of each feature to the predictive outcomes at the sample level but also reveals the interactions between features, thereby identifying nonlinear relationships and overcoming the limitations of linear regression in explaining complex interactions.
The computation of SHAP values is based on the concept of Shapley values, defined mathematically as follows:
ϕ j = S F \ { j } S ! F S 1 ! F ! f S { j } f S
where ϕ j represents the SHAP value of feature j , which quantifies the contribution of feature j to the prediction; S is a subset of the total feature set F , and S denotes the number of features in subset S (i.e., the cardinality of S ); and f S is the model’s predicted output when only the features in S are used. The baseline is defined by the expected value of the model’s output across all test samples, serving as a reference point. The SHAP value ϕ j thus reflects the marginal contribution of feature j relative to this baseline.

4. Results

4.1. Performance Evaluation of the Random Forest Model for Street Quality Perception Prediction

In the annotated data where volunteers scored perception indicators, two-thirds of the data were used to train the random forest model, while the remaining one-third was used to test the model’s accuracy [26]. The fitting results showed that the MAE was 2.9, the RMSE was below 4.5, the OOB error was below 2.7, and the OOB RMSE was below 4.6 (Table 2). The overall R2 was greater than 86%. The city street quality perception estimation model based on random forests demonstrated an explanatory power of over 86%, indicating that this model has practical application value in predicting human perceptual responses. Table 2 presents the detailed performance metrics of the random forest models for each perception indicator dimension: comfort, convenience, safety, and culture. “N_estimators” refers to the optimal number of decision trees used in each sub-model after hyperparameter tuning via a grid search, selected to balance model accuracy and complexity.

4.2. Spatial Statistical Analysis of Urban Spatial Quality and Indicators

4.2.1. Descriptive Statistical Analysis

This study employs the Natural Breaks (Jenks) classification method to categorize street quality into five levels—Very Poor, Poor, Moderate, Good, and Excellent—based on the perception indicators of comfort, safety, convenience, and culture (Table 3, Figure 3). The Jenks method was applied in ArcGIS and is designed to minimize intra-class variance while maximizing inter-class variance, which helps reveal the natural groupings inherent in the score distributions [54]. Table 3 presents the score ranges and distribution proportions for each level and dimension, highlighting that a considerable number of streets fall into the “Good” and “Excellent” categories, particularly for culture and convenience. The results reveal significant differences in score distribution and spatial distribution across dimensions, yet they also display a relatively consistent spatial pattern. Overall, streets classified as Excellent are predominantly located along main arterial roads, with proportions exceeding 30% for all categories except safety, which stands at 21% and represents the majority. Conversely, streets rated as Very Poor and Poor are concentrated in inner-city areas on secondary roads and alleyways. Comfort and convenience scores are higher on main transportation arteries and commercial zones, whereas scores are lower on streets farther from these areas (Figure 3a,b). Safety scores are prominent at urban intersections and bustling areas, but lower in alleyway areas (Figure 3c). Scores for culture show that areas around the city wall and popular tourist spots score higher, while other regions are relatively weak in cultural ambiance (Figure 3d). The visualization of street quality based on aggregated perception indicator scores (Figure 3e) indicates that areas with higher overall street quality are mainly concentrated on major roads, while several large areas of low-quality streets exist in the central area, demonstrating significant spatial heterogeneity.

4.2.2. Spatial Patterns of Street Quality: Optimized Hot Spot Analysis

This study employs Optimized Hot Spot Analysis to further investigate the spatial distribution of hotspots and cold spots in street quality (Figure 4). The analysis indicates that high-quality streets are primarily concentrated along main arterial roads and in key central areas, such as the Bell and Drum Tower area, the plaza in front of the government building, and parks—areas of primary interest to planners, thus featuring comprehensive infrastructure, favorable pedestrian environments, and high public service accessibility. In contrast, the inner-city old town areas and some secondary roads exhibit lower street quality, reflecting inadequate infrastructure, poor walking experiences, and potential safety hazards. Further integration with functional area analysis reveals that high-quality streets highly coincide with popular tourist attractions, public service facilities, and commercial centers, whereas low-quality streets typically overlap with residential areas in old districts characterized by outdated facilities and insufficient road space.

4.2.3. Spatial Cluster Analysis and Typological Features of Street Quality

To further analyze the spatial distribution and contextual characteristics of streets with varying quality levels, a spatial clustering analysis was conducted using the five-level classification derived from the Natural Breaks method as input. This analysis considered both the street quality scores and their geographic locations to identify areas with concentrated high- or low-quality streets. The method enabled the detection of spatially coherent clusters, thereby enhancing the interpretation of the relationship between perceived street quality, urban morphology, and functional zoning [55].
The results of the cluster analysis, combined with the analysis of all SVIs from the Mingcheng District (Figure 5), identify the typical characteristics of high-quality streets as follows: First, environmental cleanliness: streets are well-kept, and the overall spatial order is organized. Second, abundant greenery: street greenery landscapes are well-developed, with high coverage of trees, green belts, and other vegetation providing shade and improving the ecological environment for pedestrians. Third, prominent historical and cultural elements: historical relics and traditional buildings are well-preserved and displayed, enhancing the cultural vitality of the streets. Fourth, high visibility of the sky: the ratio of building height to street width is low, reducing the sense of visual space congestion and providing expansive views. Fifth, well-maintained infrastructure: sidewalks, public buildings, and lighting systems are well-maintained, enhancing the comfort and convenience of the streets.
Conversely, the typical characteristics of low-quality streets include: First, narrow roads: the constrained street space affects traffic flow and urban perception. Second, insufficient greenery: low vegetation coverage fails to provide shade, and the overall landscape is monotonous. Third, aging infrastructure: sidewalks, streetlights, and public facilities are poorly maintained, diminishing their functionality. Fourth, exposed and messy wiring: overhead wires are disorganized, not only detracting from aesthetics but also posing potential safety hazards. Fifth, disorganized signage systems: signs, such as billboards and street signs, are haphazard in color and shape, lacking unified planning and reducing the visual harmony of the street. Sixth, parking encroachment: vehicles haphazardly parked occupy pedestrian spaces, not only impeding pedestrian traffic but also reducing the sense of safety on the streets.

4.3. Analysis of Factors Affecting Street Quality

4.3.1. Descriptive Analysis of Influencing Factors

In Table 4, only the twelve most significant components identified during the image segmentation process that most influence street quality perception are listed, along with an analyses of color complexity and material complexity, totaling fourteen elements. In SVIs, buildings (35.5%), roads (16.1%), and sky (17.5%) are the primary landscape elements, indicating that the Mingcheng District is dominated by architectural landscapes. The average level of greenery is low (12.1%), and although some streets are richly greened (up to 44.8%), the overall coverage is limited. The values for color (23.9%) and material (31.9%) indicate the richness of the street environment. Signs, guardrails, and ground infrastructure generally have low prevalence (average < 2%), but there are significant variances on individual streets. Exceptionally high values, such as walls (up to 78%), are likely identified as the Ming city wall.

4.3.2. Elastic Net Regression Analysis

This study employs an elastic net regression model to evaluate the factors affecting street quality, addressing issues of multicollinearity in the data. The model evaluation results indicate that the optimal regularization parameter α is 0.0176, with an L1 ratio of 0.7, suggesting a preference for L1 regularization that emphasizes the sparsity of feature selection while retaining a substantial number of features to reflect the complexity of the street environment. The model’s Mean Absolute Error (MAE) is 2.6416, Mean Squared Error (MSE) is 10.4264, and the Coefficient of Determination (R2) is 0.9063, demonstrating a high fit and explaining 90.63% of the variance in the target variable effectively.
The regression results (Figure 6) indicate that buildings have the most significant negative impact on street quality, suggesting that higher building density may reduce openness, decrease green coverage, and visual permeability, thereby affecting street quality. Sky and vegetation exhibit significant positive effects, indicating that expansive views and abundant greenery enhance street quality. Roads and materials also show positive impacts, possibly due to high-quality infrastructure and appropriate material use enhancing visual comfort. On the other hand, cars and signboards present negative effects, reflecting the adverse impacts of traffic congestion and visual pollution on street quality. Additionally, elements such as railings, sidewalks, and vegetation positively influence street quality, whereas columns, ground surfaces, and pedestrians have minimal impacts, indicating their limited role in the perception of the street environment.

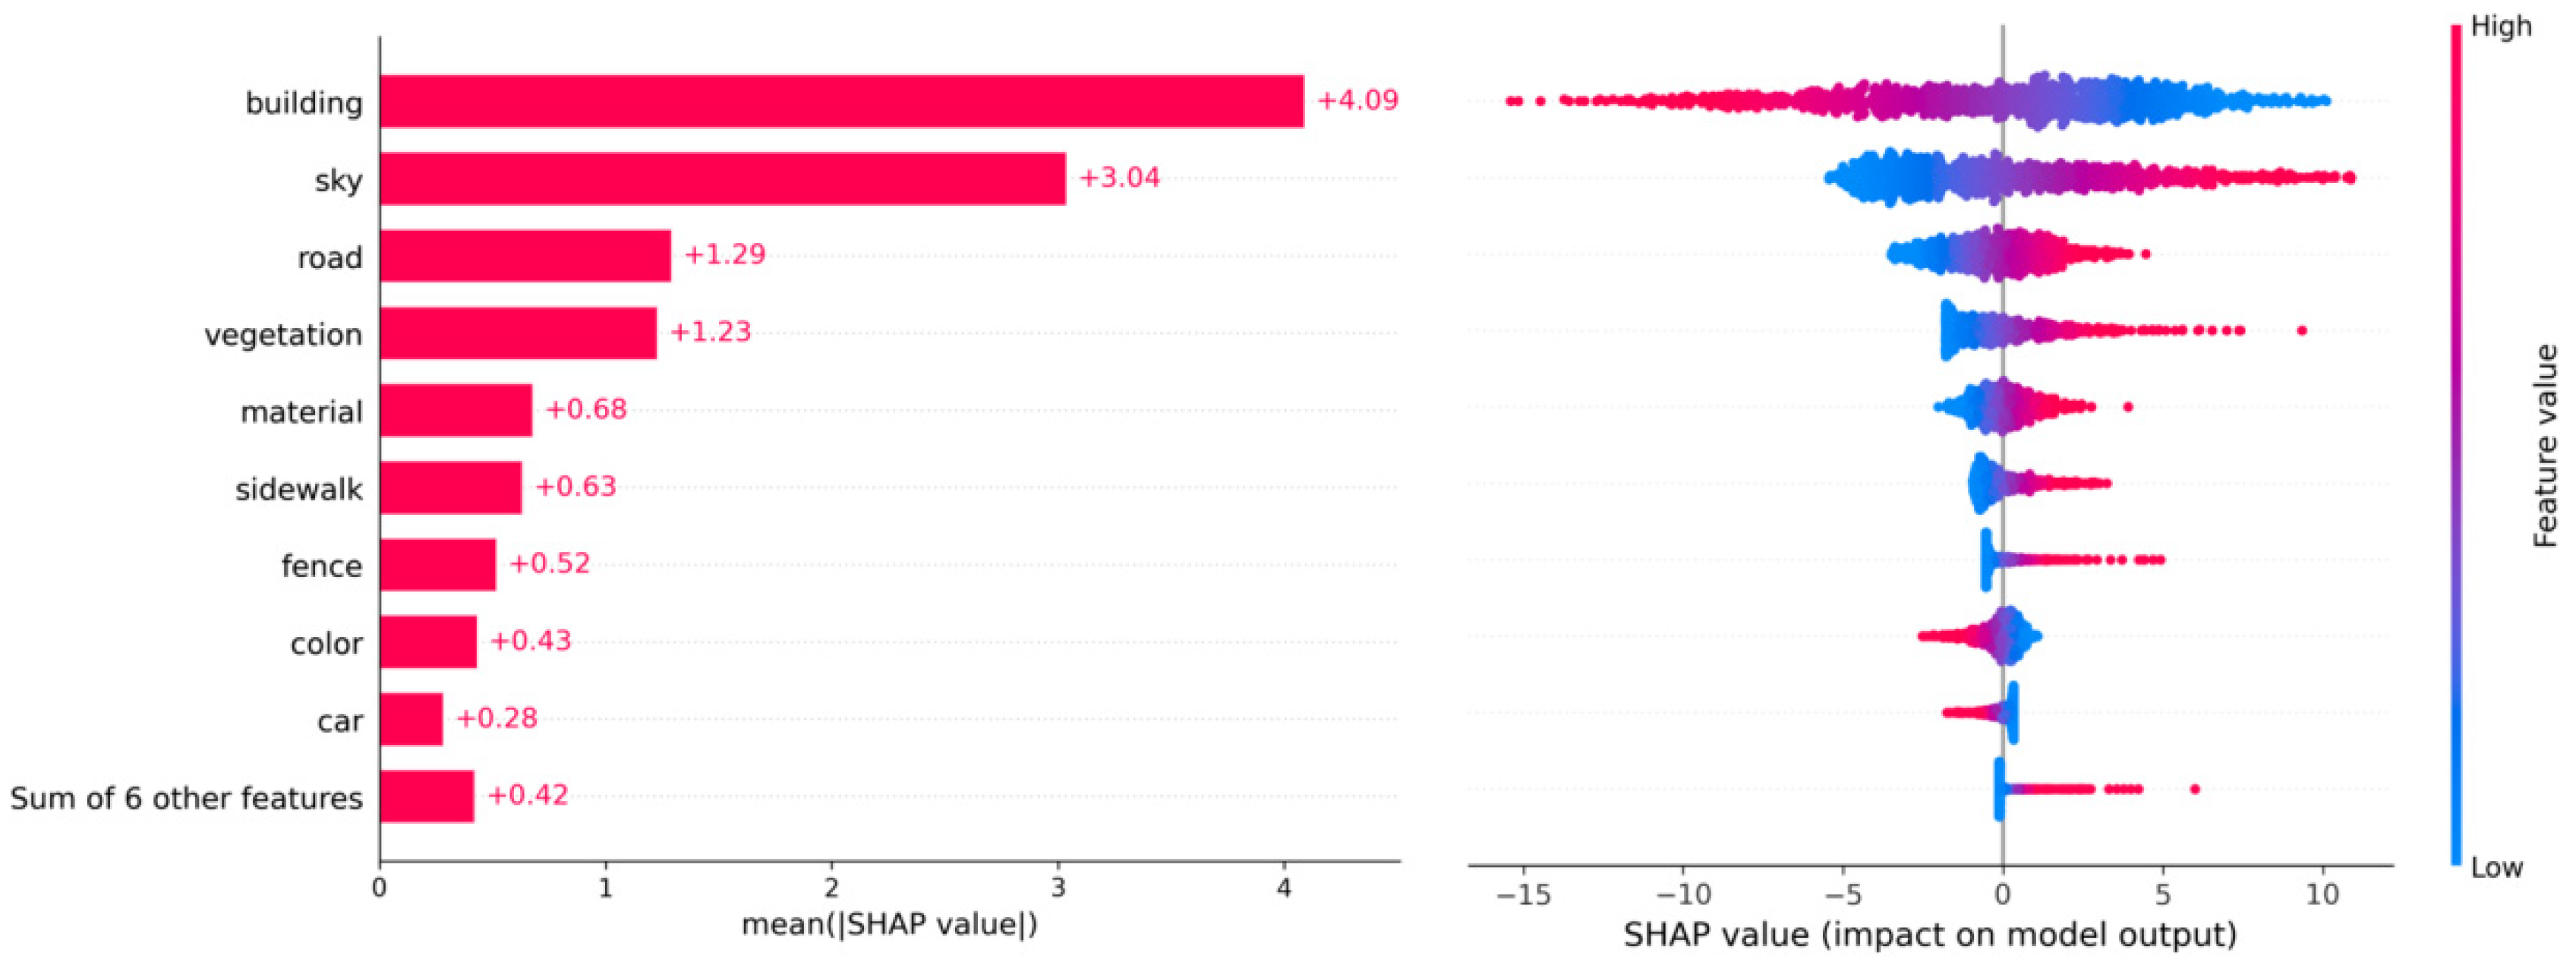
4.3.3. Using SHAP to Analyze the Elastic Net Regression Model

To further uncover the nonlinear effects and interaction relationships among factors influencing street quality, this study incorporates SHAP. SHAP results (Figure 7) show that the proportion of buildings has the most significant negative impact on street quality, contributing the highest negative value, consistent with the results from the elastic net regression model. The view of the sky, roads, and vegetation also demonstrate strong positive effects in the SHAP. Additionally, SHAP further reveals the importance of features such as material and color, which, despite having smaller regression coefficients, play critical roles in the perception of the street environment.
SHAP dependency plot analysis further elucidated the complex interrelationships among these variables (Figure 8). The variable “building” exhibited a strong negative impact on street quality, with SHAP values decreasing sharply from approximately +5 to below −12 as the building proportion increased (Figure 8a–e). Meanwhile, the “sky” feature showed an opposite and strong positive effect, with SHAP values rising from about −6 to over +6 as sky visibility increased (Figure 8i). These patterns confirm the adverse impact of building density and the beneficial role of sky openness in shaping perceived street quality. “Vegetation” also demonstrated a clear positive contribution, especially under high-density conditions. SHAP values rose from near zero to approximately +3 as vegetation coverage increased, supporting its capacity to mitigate spatial enclosure and enhance comfort (Figure 8f). The effect of “road” showed a nonlinear relationship: moderate road proportions positively contributed to quality (peaking at approximately SHAP + 1.5), whereas extremely high or low proportions reduced effectiveness (Figure 8g). “Fence” and “railing” contributed positively to perceived safety and order, with SHAP values reaching over +1 when their proportions were within moderate ranges (Figure 8h,j). Conversely, “car” displayed a distinct negative effect, with SHAP values dropping from approximately +0.5 to below −1.5 as vehicle presence increased (Figure 8l). The “sidewalk” variable exhibited a saturation effect—SHAP values increased initially but plateaued at approximately +0.5 when sidewalk coverage became too large, possibly due to spatial limitations in narrow street environments (Figure 8m). The influence of “color” appeared relatively weak and scattered, with SHAP values fluctuating narrowly between −0.3 and +0.3 (Figure 8n), indicating its limited direct effect but potential contextual relevance in visual composition.

5. Discussion

5.1. Summary of Research Findings

This study integrates machine learning models and street view image analysis to assess street quality in Xi’an’s Mingcheng District and reveals significant spatial heterogeneity in comfort, safety, convenience, and culture. Results indicate that scores for comfort and convenience are higher on main roads and commercial areas, while internal blocks and secondary roads score lower. Safety scores are higher at urban traffic intersections and busy areas, with lower scores in alleys and peripheral regions. Cultural quality scores higher near the city wall, popular attractions, and major roads, whereas areas distant from cultural landscapes score relatively lower. An aggregated evaluation of street quality scores further reveals that main roads, commercial areas, and popular tourist spots exhibit higher street quality, while many old residential alleys show extensive low-quality streets. Detailed analysis shows that high-quality streets typically feature lower building density, higher visibility of the sky, good greenery coverage, and a richer color environment. These streets are often located near peripheral main roads, commercial districts, and cultural landmarks. In contrast, low-quality streets are primarily concentrated on secondary roads and old residential areas, characterized by high building density, low greenery rates, and a strong sense of enclosure. Even if street infrastructure is well-developed, a closed visual environment can still diminish overall perception.
Elastic net regression analysis highlights that building density has the most significant negative impact on street quality, in line with the Mingcheng District’s actual conditions where high building density, coupled with aged structures, leads to reduced spatial openness, decreased greenery, and lowered visual permeability, thereby affecting street quality. This finding aligns with other research suggesting that overly dense urban buildings can negatively impact human physical and mental health [56]. Excessive building density may create monotonous landscapes, lacking aesthetic appeal and blocking sunlight, which affects perceptions [57]. Additionally, high visual proportions of buildings can evoke boredom and negative feelings [26]. Conversely, increased visible greenery positively impacts street quality, consistent with extensive research. For instance, a strong natural preference means that people generally enjoy urban landscapes more when they contain trees and other vegetation, which can reduce anxiety and stress [58,59]. Urban vegetation also moderates local climates, mitigates urban heat island effects, reduces noise and air pollution, and enhances comfort [60]. Broad roads improve spatial permeability, have more comprehensive infrastructure, and increase safety and comfort [26]. This further substantiates that areas in the Mingcheng District with narrow, low-quality streets align with reality. Additionally, excessive vehicle traffic, long-term parking, and excessive signage can decrease the pedestrian-friendliness and visual comfort of streets. Moreover, visibility of the sky significantly enhances street quality, likely linked to the high building density in the Mingcheng District, particularly in old residential areas with narrow streets and low greenery, leading to overall low quality and a synergistic effect on sky visibility. SHAP corroborates the results from elastic net regression and also reveals complex interactions between features, finding a significant nonlinear negative correlation between building density and sky visibility, while moderate greenery can mitigate the adverse effects of building density on spatial quality. Furthermore, color has a positive impact on street quality in open environments, while its effect in enclosed spaces is more complex. Overall, SHAP overcomes the limitations of linear models, providing more detailed explanations and revealing the complex nonlinear relationships between street quality and visual elements, offering a scientific basis for further optimization of street environments.

5.2. Implications for Urban Planning and Design

The results of this study provide crucial decision-making insights for urban planners and policymakers in the Mingcheng District, indicating that targeted optimization strategies are necessary to enhance the quality of urban street spaces. Significant progress has been made in improving the spatial quality of main roads, commercial policy areas, and core shopping centers. However, the enhancement of environmental quality in old residential areas still requires further attention, and improvements in living spaces should not be overlooked. Based on the findings, the following recommendations for urban planning are proposed: in high-density urban areas, control the height of buildings along the streets and integrate appropriate open space designs to enhance visual permeability; in areas with high building density, utilize vertical greening, rooftop gardens, and street trees to increase greenery coverage within limited spaces, mitigating the negative impacts of building density; in line with the SHAP results, since color richness significantly affects street quality, optimize the visual environment of streets through façade beautification and street furniture design. Additionally, differentiated street design strategies should be adopted for different areas: cultural districts should focus on enhancing the cultural atmosphere, optimizing street facilities and landscape design to enhance the historical experience; commercial areas should focus on the pedestrian environment, improving convenience and accessibility while reducing visual pollution (such as disorganized billboards); residential areas should optimize greenery and public space layouts to enhance overall comfort and safety, thereby improving the quality of life for residents.

5.3. Study Limitations and Future Research Directions

Although this study systematically quantified the influence of visual elements in SVIs on spatial quality and provided interpretable results through machine learning, several limitations should be noted. First, the analysis relies on SVIs captured at a single time point, which may be influenced by specific conditions, such as weather, seasonality, or temporary changes in street activity. Future research could incorporate multi-temporal imagery to improve the reliability of dynamic assessments. Second, the focus of this study is limited to visual information, excluding other environmental factors, such as soundscapes and air quality. Integrating sensor data and on-site surveys in future work may help build a more holistic framework for evaluating street environments. Third, the case study was conducted in a single urban district—Mingcheng District, Xi’an—which may limit the generalizability of the findings. Comparative studies across different city types and broader participant samples will be necessary to validate the applicability of this framework. Fourth, while the current model offers clear interpretability, it may not fully capture complex nonlinear interactions. Combining deep learning models with multimodal datasets could enhance the precision and generalizability of future assessments. Finally, although the perceptual rating sample was relatively small, the integration of objective image data helps compensate for potential biases and increases the robustness of results. Future work may leverage large language models to enrich the perception dataset and reduce subjectivity, thereby advancing the integration of qualitative and quantitative urban analysis.

6. Conclusions

This study has developed a street quality assessment framework that integrates deep learning, elastic net regression, and SHAP, focusing on Xi’an’s Mingcheng District. It considers both residents’ and tourists’ perceptions across four dimensions: comfort, convenience, safety, and culture. By leveraging street view image data, this study systematically assessed the spatial patterns of street quality. It examined how visual elements influence these perceptions, thereby offering empirical support for evidence-based street design improvements. The results indicate the following:
First, there is significant spatial heterogeneity in street quality within the study area. High-quality streets are mainly concentrated on main roads and around the city walls, where they benefit from well-maintained infrastructure, high levels of greenery, and good pedestrian experiences. In contrast, low-quality streets are found on secondary roads within the city, characterized by aging infrastructure, lack of greenery, and inconvenient pedestrian access.
Second, building density has the most significant and negative impact on street quality, suggesting that high-density environments may lead to enclosed spaces, reducing comfort and safety. Conversely, the visibility of the sky and levels of greenery have positive impacts on street quality, indicating that increasing visual openness and greenery are important ways to improve street quality.
Third, SHAP has revealed complex interactions among street visual elements. Building density and sky visibility show a nonlinear negative correlation, while greenery coverage and road features have synergistic effects in certain contexts. Moderate color diversity and appropriate sidewalk configurations can enhance the pedestrian environment and increase the overall attractiveness of streets.
Overall, street quality is influenced by multiple factors, including street infrastructure, greenery layout, and visual openness. Future efforts should focus on infrastructure improvements and greenery optimization for low-quality streets, along with integrating cultural elements to create distinctive neighborhoods, aiming for a balanced enhancement of street quality.
Furthermore, this study contributes to sustainable urban development by offering a scalable, interpretable framework for evaluating and improving street environments. By supporting data-driven decision-making for walkability, greenery integration, and inclusive urban design, the findings align with the goals of SDG 11 (Sustainable Cities and Communities) and provide practical insights for promoting low-carbon, age-friendly, and livable cities.

Author Contributions

Conceptualization, B.K.; Methodology, B.K. and H.Y.; Software, B.K. and H.Y.; Validation, B.K. and H.Y.; Formal analysis, H.Y.; Investigation, H.Y.; Data curation, B.K.; Writing—original draft, B.K. and H.Y.; Writing—review & editing, H.Y. and T.J.; Visualization, B.K.; Supervision, T.J.; Project administration, T.J. All authors have read and agreed to the published version of the manuscript.

Funding

This research received no external funding.

Institutional Review Board Statement

This study is waived for ethical review as Involves no direct interaction or intervention with human subjects; Collects no personal, identifiable, or sensitive data; Is based on voluntary, anonymous visual evaluations of publicly available street view images; Does not include vulnerable populations or medical/clinical data. The evaluation task posed minimal risk and was conducted under informed, voluntary participation without compensation. Based on the criteria defined in Article 2 and Article 13 of the Bioethics and Safety Act, this research falls under the category of minimal risk studies and is therefore exempt from ethical review.

Informed Consent Statement

Informed consent was obtained from all subjects involved in the study.

Data Availability Statement

The data presented in this study are available on request from the corresponding author.

Conflicts of Interest

The authors declare no conflict of interest.

Appendix A

Table A1. Street spatial quality satisfaction evaluation questions.
Evaluation IndicatorEvaluation Use Question
ComfortPlease evaluate whether the space shown in the street view image is comfortable. In your assessment, please consider the following aspects:
  • Cleanliness of the environment: whether the road is clean and tidy, garbage is cleared, and the ground is clean.
  • Level of greenery: the richness of green vegetation (such as street trees, green belts, etc.), shading and breathing effects, and the overall visual effect.
  • Public service facilities: whether municipal public facilities (such as seats, lighting, walkways, etc.) are abundant.
Please rate the comfort of this space on a scale from 0 (very uncomfortable) to 100 (very comfortable).
SafetyDo you think the space shown in this street view image is safe? When evaluating, please consider the following aspects:
  • Safety: Are the traffic management measures, nighttime lighting, and surveillance facilities adequate?
  • Vehicle interference: Do parked or moving vehicles interfere with pedestrians?
  • Potential risks: Your perception of potential crime risks or accidental hazards.
Please rate the safety of this space on a scale from 0 (very unsafe) to 100 (very safe).
ConvenienceDo you think the space shown in this street view image is convenient? When evaluating, please consider the following aspects:
  • Road accessibility: Are there any congestion issues when walking or driving? Are pedestrians and vehicles effectively separated?
  • Transport connections: Does the area have convenient public transport stops, ample walking spaces, and driveways?
  • Functional diversity: Are there different functional places, such as commercial, governmental, medical, and educational facilities?
Please rate the convenience of this space on a scale from 0 (very inconvenient) to 100 (very convenient).
CultureDo you think the space shown in this street view image has culture? When evaluating, please consider the following aspects:
  • Traditional history: Does the space preserve or display historical buildings and traditional customs that are characteristic of the region?
  • Display of cultural symbols: Are symbols that represent local culture and historical memory, such as sculptures and artistic installations, exhibited in public spaces?
  • Urban attraction and identity: In the context of a tourist city, do these cultural elements help enhance the city’s appeal and residents’ sense of belonging?
Please rate the cultural of this space on a scale from 0 (no culture) to 100 (very cultural).

References

  1. Long, Y.; Tang, J. Large-Scale Quantitative Measurement of the Quality of Urban Street Space: The Research Progress. City Plan. Rev. 2019, 43, 107–114. [Google Scholar]
  2. Karndacharuk, A.; Wilson, D.J.; Dunn, R. A Review of the Evolution of Shared (Street) Space Concepts in Urban Environments. Transp. Rev. 2014, 34, 190–220. [Google Scholar] [CrossRef]
  3. Xing, H.; Meng, Y. Measuring Urban Landscapes for Urban Function Classification Using Spatial Metrics. Ecol. Indic. 2020, 108, 105722. [Google Scholar] [CrossRef]
  4. Zhu, D.; Wang, N.; Wu, L.; Liu, Y. Street as a Big Geo-Data Assembly and Analysis Unit in Urban Studies: A Case Study Using Beijing Taxi Data. Appl. Geogr. 2017, 86, 152–164. [Google Scholar] [CrossRef]
  5. Tang, J.; Long, Y. Measuring Visual Quality of Street Space and Its Temporal Variation: Methodology and Its Application in the Hutong Area in Beijing. Landsc. Urban Plan. 2019, 191, 103436. [Google Scholar] [CrossRef]
  6. Liu, M.; Han, L.; Xiong, S.; Qing, L.; Ji, H.; Peng, Y. Large-Scale Street Space Quality Evaluation Based on Deep Learning Over Street View Image. In Image and Graphics, Proceedings of the 10th International Conference (ICIG 2019), Beijing, China, 23–25 August 2019; Zhao, Y., Barnes, N., Chen, B., Westermann, R., Kong, X., Lin, C., Eds.; Springer International Publishing: Cham, Switzerland, 2019; pp. 690–701. [Google Scholar]
  7. Chen, J.; Wu, Z.; Lin, S. The Influence of Neighborhood Quality on Tourism in China: Using Baidu Street View Pictures and Deep Learning Techniques. PLoS ONE 2022, 17, e0276628. [Google Scholar] [CrossRef]
  8. Enright, M.J.; Newton, J. Tourism Destination Competitiveness: A Quantitative Approach. Tour. Manag. 2004, 25, 777–788. [Google Scholar] [CrossRef]
  9. Du, H.; Jiang, H.; Song, X.; Zhan, D.; Bao, Z. Assessing the Visual Aesthetic Quality of Vegetation Landscape in Urban Green Space from a Visitor’s Perspective. J. Urban Plan. Dev. 2016, 142, 04016007. [Google Scholar] [CrossRef]
  10. Gehl, J. Cities for People; Island Press: Washington, DC, USA, 2013; ISBN 978-1-59726-984-1. [Google Scholar]
  11. Almulhim, A.I.; Sharifi, A.; Aina, Y.A.; Ahmad, S.; Mora, L.; Filho, W.L.; Abubakar, I.R. Charting Sustainable Urban Development Through a Systematic Review of SDG11 Research. Nat. Cities 2024, 1, 677–685. [Google Scholar] [CrossRef]
  12. Duncan, J.S. Progress Report: Review of Urban Imagery: Urban Semiotics. Urban Geogr. 1987, 8, 473–483. [Google Scholar] [CrossRef]
  13. Harvey, C.; Aultman-Hall, L.; Hurley, S.E.; Troy, A. Effects of Skeletal Streetscape Design on Perceived Safety. Landsc. Urban Plan. 2015, 142, 18–28. [Google Scholar] [CrossRef]
  14. Rezvanipour, S.; Hassan, N.; Ghaffarianhoseini, A.; Danaee, M. Why Does the Perception of Street Matter? A Dimensional Analysis of Multisensory Social and Physical Attributes Shaping the Perception of Streets. Archit. Sci. Rev. 2021, 64, 359–373. [Google Scholar] [CrossRef]
  15. Gehl, J.; Gemzøe, L. Public Spaces—Public Life; Arkitektens Forlag: Copenhagen, Denmark, 2004. [Google Scholar]
  16. Sallis, J.F.; Johnson, M.F.; Calfas, K.J.; Caparosa, S.; Nichols, J.F. Assessing Perceived Physical Environmental Variables that May Influence Physical Activity. Res. Q. Exerc. Sport 1997, 68, 345–351. [Google Scholar] [CrossRef]
  17. Aghaabbasi, M.; Moeinaddini, M.; Zaly Shah, M.; Asadi-Shekari, Z. A New Assessment Model to Evaluate the Microscale Sidewalk Design Factors at the Neighbourhood Level. J. Transp. Health 2017, 5, 97–112. [Google Scholar] [CrossRef]
  18. Lin, J.; Wu, Z.; Li, X. Measuring Inter-City Connectivity in an Urban Agglomeration Based on Multi-Source Data. Int. J. Geogr. Inf. Sci. 2019, 33, 1062–1081. [Google Scholar] [CrossRef]
  19. Logan, T.; Williams, T.; Nisbet, A.; Liberman, K.; Zuo, C.; Guikema, S. Evaluating Urban Accessibility: Leveraging Open-Source Data and Analytics to Overcome Existing Limitations. Environ. Plan. B Urban Anal. City Sci. 2019, 46, 897–913. [Google Scholar] [CrossRef]
  20. Lothian, A. Landscape and the Philosophy of Aesthetics: Is Landscape Quality Inherent in the Landscape or in the Eye of the Beholder? Landsc. Urban Plan. 1999, 44, 177–198. [Google Scholar] [CrossRef]
  21. Daniel, T.C.; Schroeder, H. Scenic Beauty Estimation Model: Predicting Perceived Beauty of Forest Landscapes. In Proceedings of Our National Landscape: A Conference on Applied Techniques for Analysis and Management of the Visual Resource, Incline Village, NV, USA, 23–25 April 1979; Elsner, G.H., Richard, C.S., Technical Coordinators; General Technical Reports PSW-GTR-35; Pacific Southwest Forest and Range Experiment Station, Forest Service, U.S. Department of Agriculture: Berkeley, CA, USA, 2022; pp. 514–523. [Google Scholar]
  22. Odgers, C.L.; Caspi, A.; Bates, C.J.; Sampson, R.J.; Moffitt, T.E. Systematic Social Observation of Children’s Neighborhoods Using Google Street View: A Reliable and Cost-Effective Method. Child Psychol. Psychiatry 2012, 53, 1009–1017. [Google Scholar] [CrossRef]
  23. Zhang, L.; Ye, Y.; Zeng, W.; Chiaradia, A. A Systematic Measurement of Street Quality through Multi-Sourced Urban Data: A Human-Oriented Analysis. Int. J. Environ. Res. Public Health 2019, 16, 1782. [Google Scholar] [CrossRef]
  24. Wang, M.; He, Y.; Meng, H.; Zhang, Y.; Zhu, B.; Mango, J.; Li, X. Assessing Street Space Quality Using Street View Imagery and Function-Driven Method: The Case of Xiamen, China. ISPRS Int. J. Geo-Inf. 2022, 11, 282. [Google Scholar] [CrossRef]
  25. Wang, Y.; Xiu, C. Spatial Quality Evaluation of Historical Blocks Based on Street View Image Data: A Case Study of the Fangcheng District. Buildings 2023, 13, 1612. [Google Scholar] [CrossRef]
  26. Wang, L.; Han, X.; He, J.; Jung, T. Measuring Residents’ Perceptions of City Streets to Inform Better Street Planning Through Deep Learning and Space Syntax. ISPRS J. Photogramm. Remote Sens. 2022, 190, 215–230. [Google Scholar] [CrossRef]
  27. Zhang, F.; Zhou, B.; Liu, L.; Liu, Y.; Fung, H.H.; Lin, H.; Ratti, C. Measuring Human Perceptions of a Large-Scale Urban Region Using Machine Learning. Landsc. Urban Plan. 2018, 180, 148–160. [Google Scholar] [CrossRef]
  28. Lee, S.; Han, M.; Rhee, K.; Bae, B. Identification of Factors Affecting Pedestrian Satisfaction toward Land Use and Street Type. Sustainability 2021, 13, 10725. [Google Scholar] [CrossRef]
  29. Ma, S.; Wang, B.; Liu, W.; Zhou, H.; Wang, Y.; Li, S. Assessment of Street Space Quality and Subjective Well-Being Mismatch and Its Impact, Using Multi-Source Big Data. Cities 2024, 147, 104797. [Google Scholar] [CrossRef]
  30. Ma, X.; Ma, C.; Wu, C.; Xi, Y.; Yang, R.; Peng, N.; Zhang, C.; Ren, F. Measuring Human Perceptions of Streetscapes to Better Inform Urban Renewal: A Perspective of Scene Semantic Parsing. Cities 2021, 110, 103086. [Google Scholar] [CrossRef]
  31. Jia, Q.; Syed Mahdzar, S.S.; Binti Shaharuddin, S.N. Study on the Spatial Characteristics of Urban Heritage in Xi’an City’s Historical Core Area. IOP Conf. Ser. Earth Environ. Sci. 2023, 1274, 012042. [Google Scholar] [CrossRef]
  32. Hou, Y.; Biljecki, F. A Comprehensive Framework for Evaluating the Quality of Street View Imagery. Int. J. Appl. Earth Obs. Geoinf. 2022, 115, 103094. [Google Scholar] [CrossRef]
  33. Ren, Z.; Wang, L.; Song, T.; Li, Y.; Zhang, J.; Zhao, F. Enhancing Road Scene Segmentation with an Optimized DeepLabV3+. IEEE Access 2024, 12, 197748–197765. [Google Scholar] [CrossRef]
  34. Wang, R.; Helbich, M.; Yao, Y.; Zhang, J.; Liu, P.; Yuan, Y.; Liu, Y. Urban Greenery and Mental Wellbeing in Adults: Cross-Sectional Mediation Analyses on Multiple Pathways Across Different Greenery Measures. Environ. Res. 2019, 176, 108535. [Google Scholar] [CrossRef]
  35. Yu, M.; Zheng, X.; Qin, P.; Cui, W.; Ji, Q. Urban Color Perception and Sentiment Analysis Based on Deep Learning and Street View Big Data. Appl. Sci. 2024, 14, 9521. [Google Scholar] [CrossRef]
  36. Lindal, P.J.; Hartig, T. Architectural Variation, Building Height, and the Restorative Quality of Urban Residential Streetscapes. J. Environ. Psychol. 2013, 33, 26–36. [Google Scholar] [CrossRef]
  37. Liu, Z.; Ma, X.; Hu, L.; Lu, S.; Ye, X.; You, S.; Tan, Z.; Li, X. Information in Streetscapes—Research on Visual Perception Information Quantity of Street Space Based on Information Entropy and Machine Learning. ISPRS Int. J. Geo-Inf. 2022, 11, 628. [Google Scholar] [CrossRef]
  38. Ivanovici, M.; Richard, N. A Naive Complexity Measure for Color Texture Images. In Proceedings of the 2017 International Symposium on Signals, Circuits and Systems (ISSCS), Iasi, Romania, 13–14 July 2017; pp. 1–4. [Google Scholar]
  39. Ismail, M.F.; Jaafar, T.R.; Pin, N.C.; Zaini, N.H. Sobel Operator for Edges Detection in Surface Texture Analysis. J. Teknol. (Sci. Eng.) 2015, 76, 71–74. [Google Scholar] [CrossRef]
  40. Greene, M.; Oliva, A. Recognition of Natural Scenes from Global Properties: Seeing the Forest Without Representing the Trees. Cogn. Psychol. 2009, 58, 137–176. [Google Scholar] [CrossRef] [PubMed]
  41. Ewing, R.; Handy, S. Measuring the Unmeasurable: Urban Design Qualities Related to Walkability. J. Urban Des. 2009, 14, 65–84. [Google Scholar] [CrossRef]
  42. Kaplan, R.; Kaplan, S. The Experience of Nature: A Psychological Perspective; CUP Archive: Cambridge, UK, 1989; ISBN 978-0-521-34939-0. [Google Scholar]
  43. Fuller, M.; Moore, R. An Analysis of Jane Jacobs’s the Death and Life of Great American Cities; Macat Library: London, UK, 2017; ISBN 978-1-912282-66-1. [Google Scholar]
  44. Erna, W.; Antariksa; Surjono; Amin, S.L. Convenience Component of Walkability in Malang City Case Study the Street Corridors Around City Squares. Procedia—Soc. Behav. Sci. 2016, 227, 587–592. [Google Scholar] [CrossRef]
  45. Loo, B.P.Y.; Lian, T.; Frank, L.D. Walking (In)Convenience: An In-Depth Study of Pedestrian Detours to Daily Facilities. J. Am. Plan. Assoc. 2024, 90, 742–757. [Google Scholar] [CrossRef]
  46. Yao, Y.; Liang, Z.; Yuan, Z.; Liu, P.; Bie, Y.; Zhang, J.; Wang, R.; Wang, J.; Guan, Q. A Human-Machine Adversarial Scoring Framework for Urban Perception Assessment Using Street-View Images. Int. J. Geogr. Inf. Sci. 2019, 33, 2363–2384. [Google Scholar] [CrossRef]
  47. Han, X.; Wang, L.; Seo, S.H.; He, J.; Jung, T. Measuring Perceived Psychological Stress in Urban Built Environments Using Google Street View and Deep Learning. Front. Public Health 2022, 10, 891736. [Google Scholar] [CrossRef]
  48. Dupont, L.; Antrop, M.; Van Eetvelde, V. Eye-Tracking Analysis in Landscape Perception Research: Influence of Photograph Properties and Landscape Characteristics. Landsc. Res. 2014, 39, 417–432. [Google Scholar] [CrossRef]
  49. Malkewitz, C.P.; Schwall, P.; Meesters, C.; Hardt, J. Estimating reliability: A Comparison of Cronbach’s α, McDonald’s Ωt and the Greatest Lower Bound. Soc. Sci. Humanit. Open 2023, 7, 100368. [Google Scholar] [CrossRef]
  50. Hayes, A.F.; Coutts, J.J. Use Omega Rather than Cronbach’s Alpha for Estimating Reliability. But…. Commun. Methods Meas. 2020, 14, 1–24. [Google Scholar] [CrossRef]
  51. Zou, H.; Hastie, T. Regularization and Variable Selection Via the Elastic Net. J. R. Stat. Soc. Ser. B Stat. Methodol. 2005, 67, 301–320. [Google Scholar] [CrossRef]
  52. Shiomi, Y.; Toriumi, A.; Nakamura, H. International Analysis on Social and Personal Determinants of Traffic Violations and Accidents Employing Logistic Regression with Elastic Net Regularization. IATSS Res. 2022, 46, 36–45. [Google Scholar] [CrossRef]
  53. Lundberg, S.M.; Lee, S.-I. A Unified Approach to Interpreting Model Predictions. In NIPS’17, Proceedings of the 31st International Conference on Neural Information Processing Systems, Long Beach, CA, USA, 4–9 December 2017; Curran Associates Inc.: Red Hook, NY, USA, 2017; Volume 30. [Google Scholar]
  54. Stefanidis, R.-M.; Bartzokas-Tsiompras, A. Where to Improve Pedestrian Streetscapes: Prioritizing and Mapping Street-Level Walkability Interventions in Cape Town’s City Centre. Urbani Izziv 2022, 33, 115–126. [Google Scholar] [CrossRef]
  55. Tom-Jack, Q.T.; Bernstein, J.M.; Loyola, L.C. The Role of Geoprocessing in Mapping Crime Using Hot Streets. ISPRS Int. J. Geo-Inf. 2019, 8, 540. [Google Scholar] [CrossRef]
  56. Zhong, W.; Schröder, T.; Bekkering, J. Biophilic Design in Architecture and Its Contributions to Health, Well-Being, and Sustainability: A Critical Review. Front. Archit. Res. 2022, 11, 114–141. [Google Scholar] [CrossRef]
  57. Wong, M.S.; Nichol, J.; Ng, E. A Study of the “Wall Effect” Caused by Proliferation of High-Rise Buildings Using GIS Techniques. Landsc. Urban Plan. 2011, 102, 245–253. [Google Scholar] [CrossRef]
  58. Ulrich, R.S. Human Responses to Vegetation and Landscapes. Landsc. Urban Plan. 1986, 13, 29–44. [Google Scholar] [CrossRef]
  59. Xie, X.; Jiang, Q.; Wang, R.; Gou, Z. Correlation between Vegetation Landscape and Subjective Human Perception: A Systematic Review. Buildings 2024, 14, 1734. [Google Scholar] [CrossRef]
  60. Zhang, H.-L.; Nizamani, M.M.; Guo, L.-Y.; Cui, J.; Padullés Cubino, J.; Hughes, A.C.; Wang, H.-F. Interplay of Socio-Economic and Environmental Factors in Shaping Urban Plant Biodiversity: A Comprehensive Analysis. Front. Ecol. Evol. 2024, 12, 1344343. [Google Scholar] [CrossRef]
Figure 1. Research framework and technical route.
Sustainability 17 03454 g001
Figure 2. Location and land use of the study area.
Sustainability 17 03454 g002
Figure 3. Spatial distribution of street space quality and various perception indicators.
Sustainability 17 03454 g003
Figure 4. Spatial distribution of optimized Hot Spot Analysis results.
Sustainability 17 03454 g004
Figure 5. Kernel density estimation and street view interpretation of street quality.
Sustainability 17 03454 g005
Figure 6. Elastic net regression analysis of street space quality and visual elements.
Sustainability 17 03454 g006
Figure 7. SHAP of visual elements impacting street space quality.
Sustainability 17 03454 g007
Figure 8. SHAP dependence plots illustrating the effects of visual features on predicted street space quality. (ae) building with interactions from road, color, vegetation, sidewalk, and sky, respectively; (f) vegetation with sky; (g) road with building; (h) fence with building; (i) sky with building; (j) railing with sky; (k) material with building; (l) car with building; (m) sidewalk with building; (n) color with sky.
Sustainability 17 03454 g008
Table 1. Volunteers’ demographics.
VariablesClassificationNumber of People/Proportion (%)
Total number of people25/100%
GenderMale12/48%
Female13/52%
Place of affiliationLocal resident15/60%
Tourists10/40%
Age19–3011/44%
30–4510/40%
45–554/10%
Table 2. Performance evaluation of random forest model for perception indicators.
Indicator TypesMAE (%)RMSE (%)R2 (%)N_EstimatorsOOB MAE (%)OOB RMSE (%)
Comfort1.98513.88770.9186841.91723.5404
Safety2.86304.48550.86011102.69864.5084
Convenience1.98364.05110.9100672.17923.9824
Culture1.85033.22270.89821912.49274.3463
Table 3. Distribution of street space quality levels across comfort, safety, convenience, and culture dimensions.
Level12345
Street ClassificationVery PoorPoorModerateGoodExcellent
ComfortScore range26–4848–5858–6767–7373–85
Number (Proportion%)857 (16)796 (15)790 (15)1260 (24)1600 (30)
SafetyScore range35–5050–5959–6868–7575–83
Number (Proportion%)835 (16)701 (13)931 (17)1732 (33)1106 (21)
ConvenienceScore range32–5050–5858–6666–7373–87
Number (Proportion%)628 (12)825 (16)976 (18)1209 (23)1666 (31)
CultureScore range36–5656–6262–6969–7474–82
Number (Proportion%)1015 (19)681 (13)756 (14)942 (18)1910 (36)
Street qualityScore range1–4949–5757–6565–7272–80
Number (Proportion%)624 (12)737 (14)752 (14)1206 (23)1990 (37)
Table 4. Basic overview of visual elements.
NumberVisual ElementsMeanMaxMinS.D.
1Building0.3550.8920.0010.174
2Sky0.1750.5110.0010.114
3Road0.1610.4270.0010.078
4Vegetation0.1210.4480.0010.059
5Sidewalk0.0640.3690.0010.056
6Car0.0350.2600.0010.037
7Wall0.0210.7860.0010.056
8Fence0.0160.1800.0010.021
9Signboard0.0060.0830.0010.008
10Railing0.0040.1420.0010.010
11Ground0.0010.1050.0010.005
12Column0.0010.0790.0010.002
13Color complexity0.2390.9990.0010.123
14Material complexity0.3190.9990.0010.104
Disclaimer/Publisher’s Note: The statements, opinions and data contained in all publications are solely those of the individual author(s) and contributor(s) and not of MDPI and/or the editor(s). MDPI and/or the editor(s) disclaim responsibility for any injury to people or property resulting from any ideas, methods, instructions or products referred to in the content.

