1. Introduction
In many developing and least developed countries and regions, non-scale agricultural production is an important pillar of the rural economy [
1]. In particular, owing to the advantages of low investment, ease of operation, and minimal risk, non-scale livestock and poultry breeding has become a significant means of alleviating extreme poverty, enhancing employment opportunities for vulnerable populations and improving rural residents’ living standards [
2]. Unfortunately, livestock and poultry waste contains large amounts of nutrients, including nitrogen and phosphorus. If the waste is untreated and discharged directly into water systems, it will cause eutrophication of water bodies and subsequently lead to the destruction of aquatic ecosystems [
3]. Furthermore, the open storage of breeding waste will produce ammonia, hydrogen sulfide, and other malodorous gases, polluting the air and affecting the quality of life of residents in surrounding areas [
4]. According to the Food and Agriculture Organization of the United Nations, unless pollution from livestock and poultry waste is controlled it will lead to a 60% increase in ammonium sulfate emissions by 2030 [
5]. In China, for example, according to the latest livestock and poultry inventory data from the National Animal Husbandry Administration and the National Bureau of Statistics, China’s total livestock and poultry manure emissions in 2021 was approximately 3.9 billion tons. Of that total, more than two-thirds came from small- and medium-sized farms [
6]. According to estimates, India’s livestock industry releases nearly 12 Tg of methane per year, more than 90% of which is released through the production of livestock and poultry waste [
5,
7]. Non-scale livestock and poultry waste pollution has thus become a key issue that is restricting sustainable rural development in the relevant regions [
8].
Employing environmental engineering enterprises to centralize the resource utilization of dispersed waste is an effective way to realize the management of non-scale livestock and poultry waste [
9]. Centralized industrial production methods can be used to convert dispersed waste into energy and fertilizer. This is not only conducive to the reduction of the surface source pollution caused by the uncontrolled discharge of agricultural waste but also helps to promote the construction of an agricultural Circular Economy (CE) system [
10,
11]. However, in reality, this centralized resource management model faces many challenges. The main problems include (1) the difficulty of collecting raw materials [
12,
13]; (2) the lack of motivation of the main parties involved in the model [
13,
14], and (3) the overall social benefits are not outstanding [
15]. Therefore, coordinating the interests of the various stakeholders in the centralized resource-based management model of non-scale livestock and poultry waste and improving the efficiency and effectiveness of management is currently a hot topic for government, enterprises, and academia [
16].
Researchers have acknowledged that government subsidies help eliminate external environmental effects in agricultural waste management. Such subsidies also promote the sustainable development of the agricultural waste resource utilization industry [
13,
17]. By implementing a subsidy policy for farmers and organic fertilizer manufacturing enterprises, the government can coordinate the interaction between the participating subjects and increase their enthusiasm for participating in waste management [
17]. Government subsidies are recognized as an effective means to promote non-scale agricultural waste management, but when should the government provide subsidies? Who should receive subsidies? And what is the best way to subsidize?
To address the above issues, this paper constructs a decision-making game model of an agricultural waste raw material recycling–organic fertilizer production supply chain that includes farmers, organic fertilizer manufacturing enterprises, and the government. Three different scenarios are studied, including one with no subsidy, one with government-subsidized farmers, and one with government-subsidized organic fertilizer manufacturing enterprises. Considering regional breeding density and the degree of road tortuosity in the transportation process, this paper simulates and analyzes the benefits to each party and the overall social benefits of resource management under the three abovementioned strategies.
The theoretical and practical significance of this study lies in the following areas: (1) Providing decision-making reference for the government to select subsidy programs for regions with different natural environmental conditions. Meanwhile, the game model research on agricultural waste raw material recycling–organic fertilizer production supply chain has been expanded in depth, which further enriches the relevant theoretical system. (2) Combined with the regional agricultural production situation and transportation conditions, this paper puts forward the idea of designing an incentive system for agricultural waste management policy; (3) Provides decision-making reference to enhance the overall social benefits of non-scale livestock and poultry waste management. At the same time, it provides theoretical support and action suggestions for the government’s participation in environmental governance and corporate investment decisions.
The remainder of this paper is organized as follows: In
Section 2, the literature related to the research topic of this paper is reviewed and organized.
Section 3 describes the specific context and parameter settings for model construction in this paper. In
Section 4, a game decision model of the organic fertilizer supply chain is constructed with no subsidy, government-subsidized farmers, and government-subsidized manufacturing enterprises. In
Section 5, the subsidy strategies applied by the government are analyzed under four different natural scenarios.
Section 6 summarizes the findings of this paper, and relevant policy recommendations are made.
3. Model Description and Parameter Setting
Based on the previous discussion, this section deeply analyzes the construction aspects of the model. Then, in
Section 3.1, this paper constructs a non-scale livestock and poultry waste raw material collection–organic fertilizer production supply chain decision-making model. In
Section 3.2, this paper sets up a parameter system matching the model by referring to Stackelberg game theory. This section will analyze the logic of model construction in detail and explain the specific basis and scope of parameter selection to provide theoretical support for subsequent research.
3.1. Modeling Background
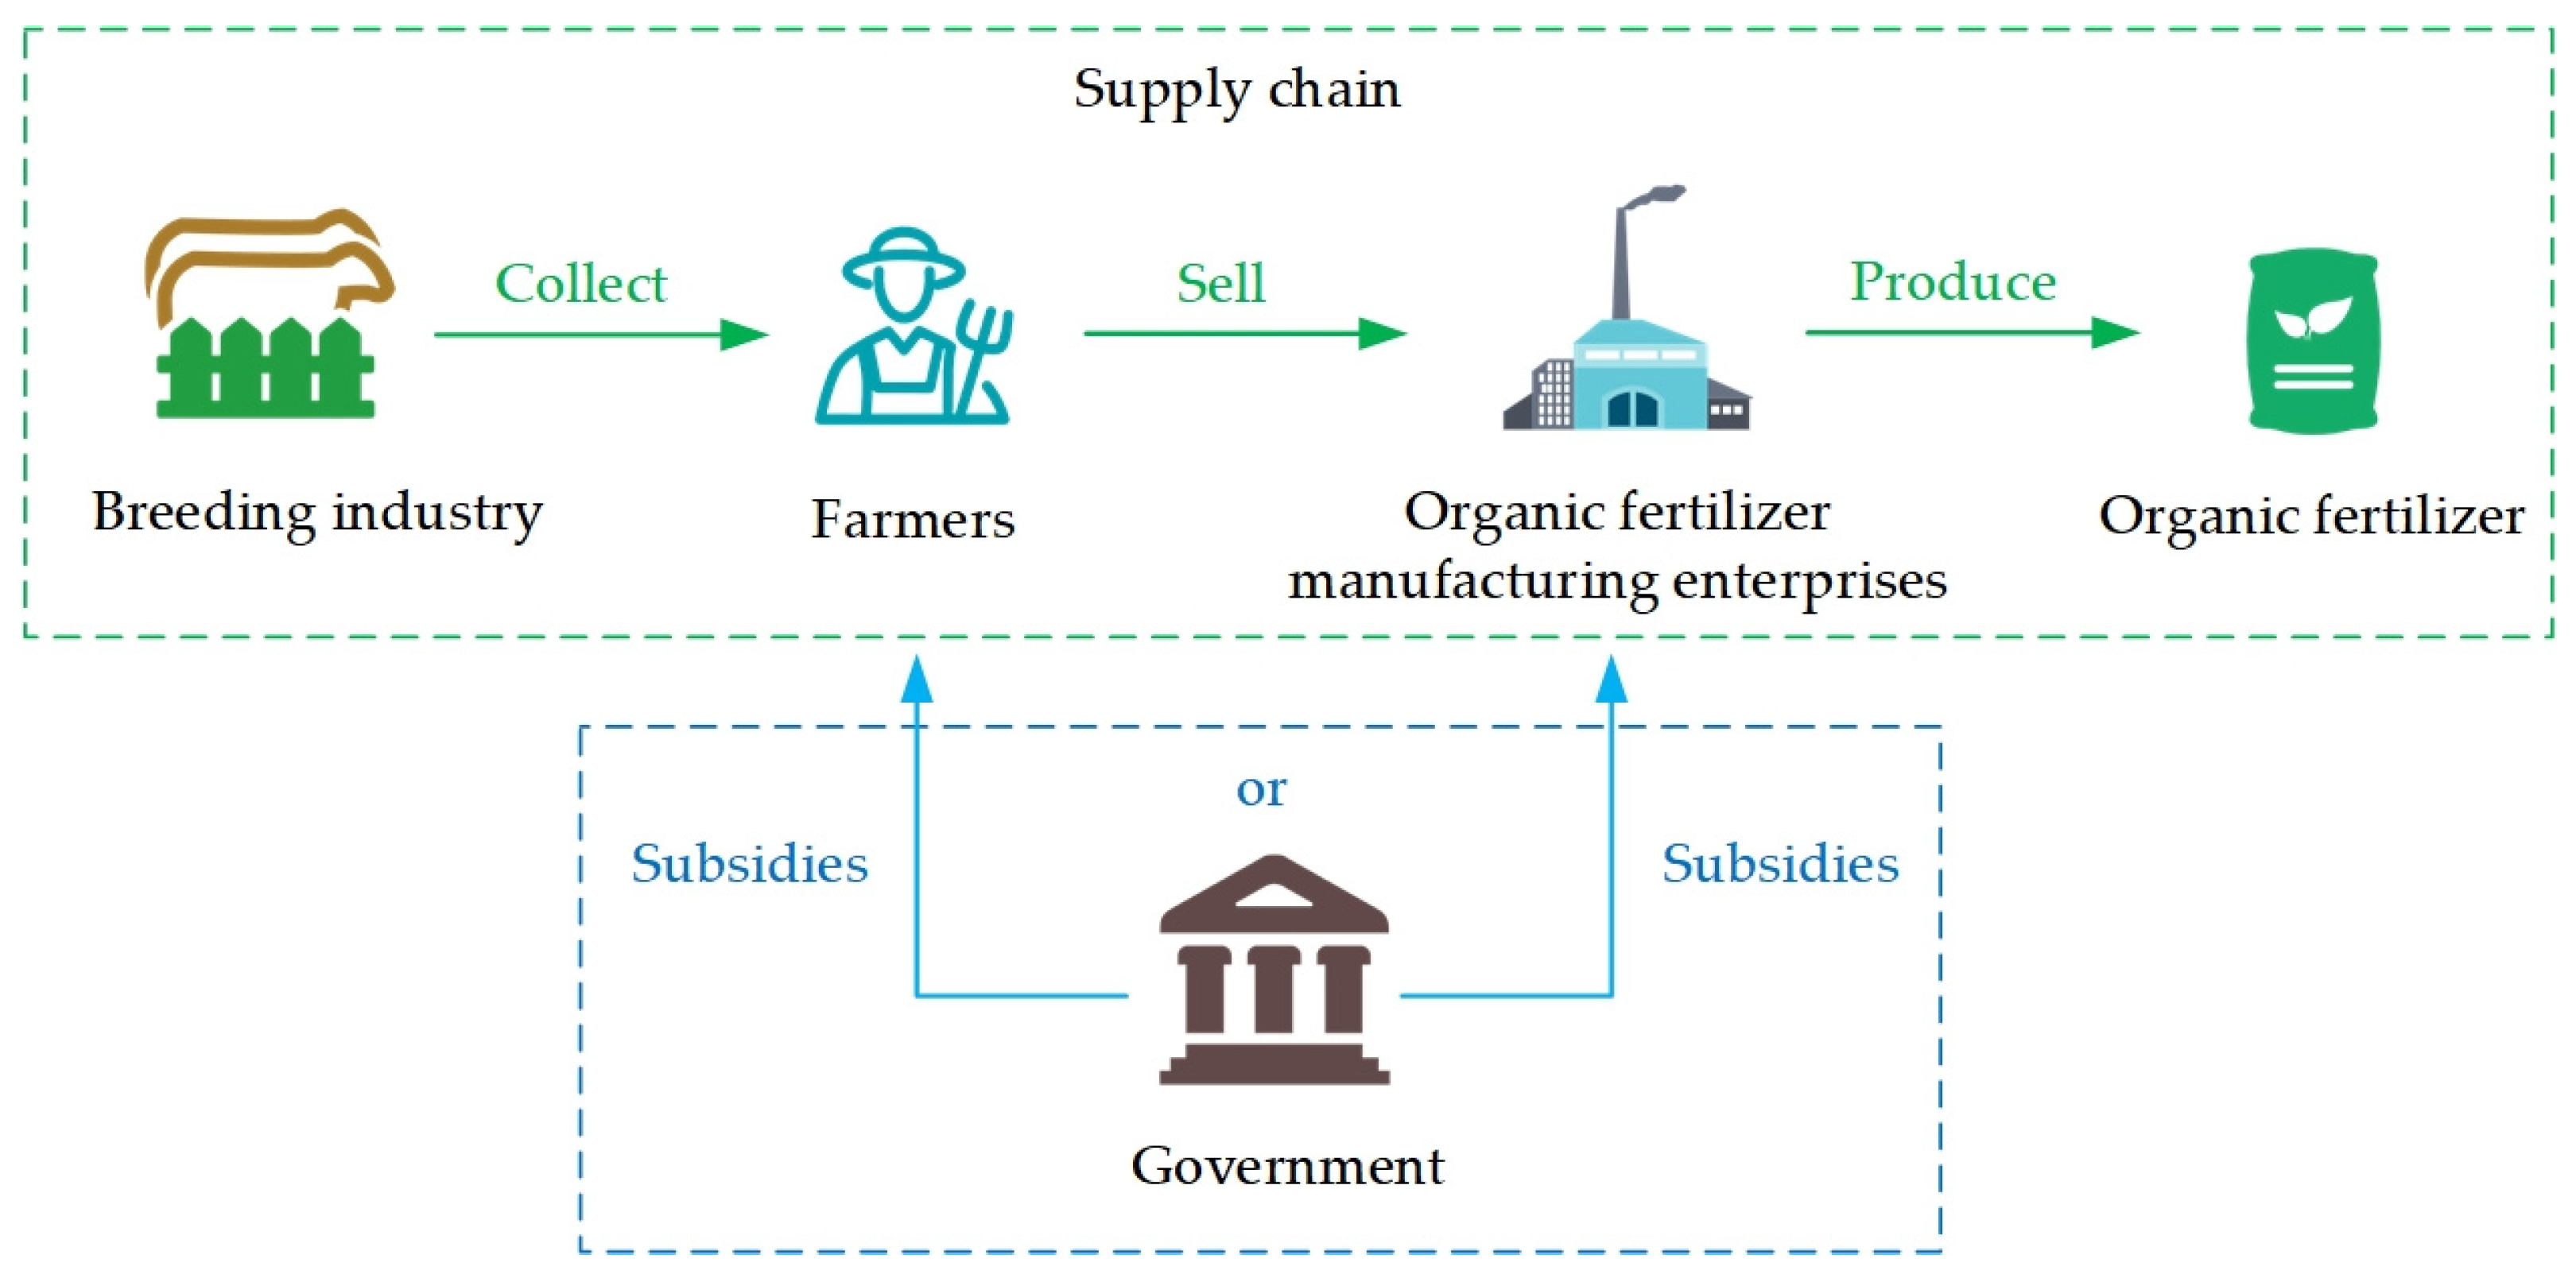
Combined with the description of the centralized resource utilization model of non-scale livestock and poultry waste in
Section 1 (Introduction), the specific scenario constructed in this paper’s model is one in which the government treats non-scale livestock and poultry waste by introducing third-party environmental engineering enterprises to process that waste into commercial organic fertilizer. At the beginning of the organic fertilizer production supply chain, farmers are responsible for collecting the farm waste and selling it to organic fertilizer production enterprises at a specified price. After the transfer, the agricultural waste is processed by the organic fertilizer manufacturing enterprise through fermentation, drying, mixing, and inspection. Finally, the waste is transformed into high-quality organic fertilizer products to be sold on the market. By converting what would otherwise be an environmental liability in the form of agricultural waste into a valuable resource, this comprehensive waste management process exemplifies the principles of a CE [
26,
40]. This centralized resource utilization model not only reduces the environmental burden of agricultural waste but also contributes to building a green and sustainable agricultural production model.
A decision model is now constructed for the supply chain of non-scale livestock and poultry waste raw material collection–organic fertilizer production (
Figure 1), and the government subsidy strategy is analyzed. To eliminate the externality of waste management and coordinate the interaction relationship between the subjects involved, the government provides subsidies for both waste collection and organic fertilizer production. In this scenario, the government may choose to subsidize organic fertilizer production enterprises to encourage them to increase the procurement of raw materials from agricultural waste. Government agencies may also choose to subsidize farmers to directly increase their economic returns and motivate them to participate in the recycling of agricultural waste.
3.2. Model Parameters
The Stackelberg game is a dynamic game based on the inverse induction method of problem solving. The game’s logical structure is that the party that makes the decision first will necessarily consider the strategic choices of the other party, i.e., the party that makes the decision [
41]. In the Stackelberg game, the leader is the first party to act and the followers are the last parties to act. The Stackelberg game already has had many successful applications in environmental governance and policy [
42,
43]. This paper uses the Stackelberg game to study the problem of non-scaled livestock and poultry waste management in the situation where government subsidies are provided. In the raw material collection process, the organic fertilizer manufacturing enterprise is the channel leader, and farmers determine their own strategies according to the purchase price offered by the organic fertilizer manufacturing enterprise. When the government provides subsidies, the government is the channel leader, the organic fertilizer manufacturing enterprise then sets the purchase price according to the amount of the government subsidies and farmers determine the amount of raw material to sell according to the subsidies and the purchase price.
Based on the above, this paper sets the relevant parameters as follows:
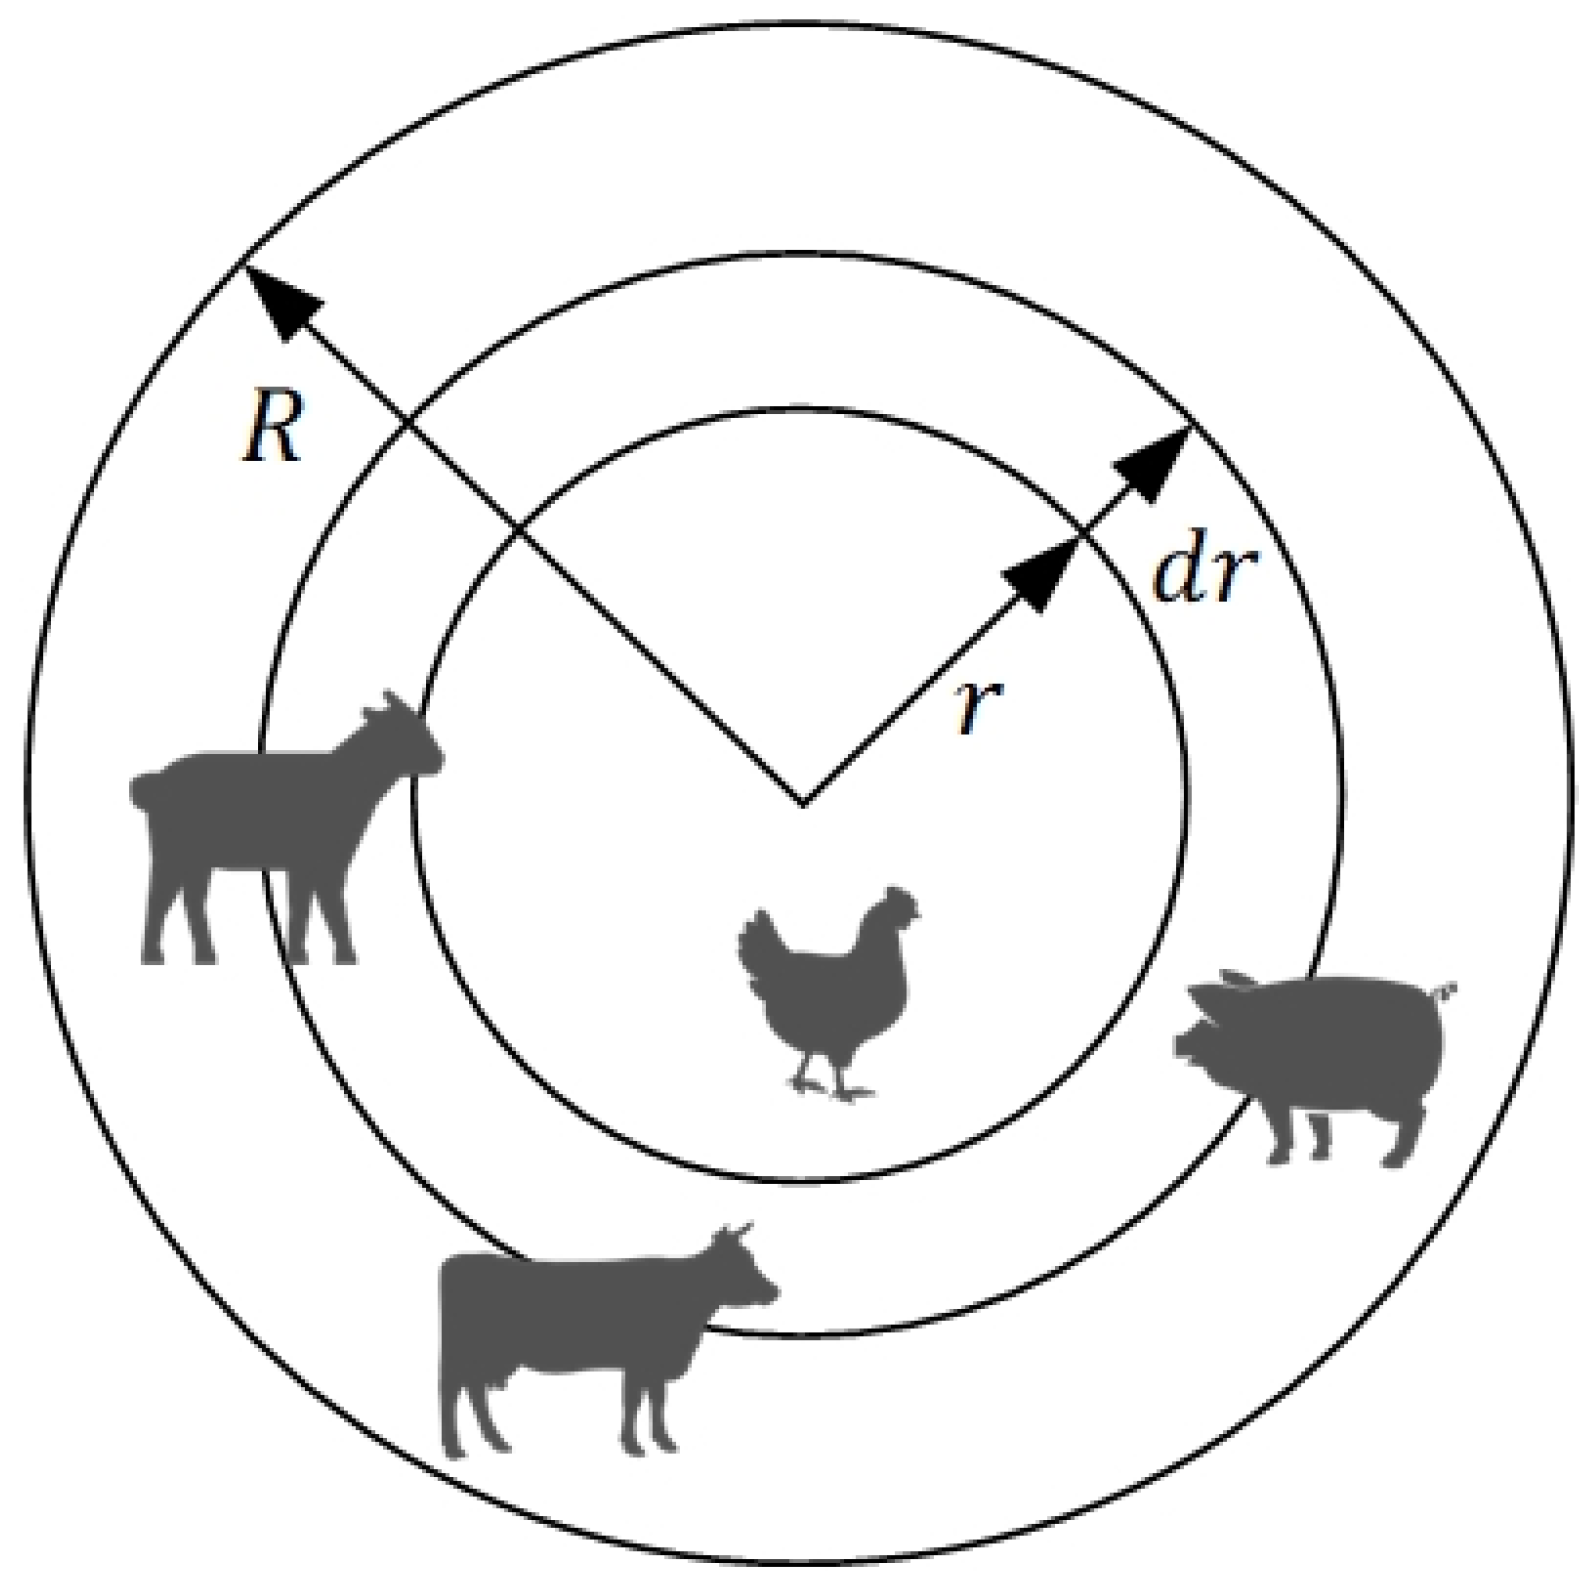
Setting 1: The loss of raw materials and the change in the amount of raw material resources during the collection of agricultural waste are not considered. It is also assumed that the collection area has a circular state, and the collection radius is
. As shown in
Figure 2, the average distance
from all points within the circle to the center of the circle is used as a proxy for transportation distance
. This figure is obtained by adding the distances from all points in the circle to the center of the circle and dividing that sum by the total number of points in the circle. The exact formula for calculating the average distance
is given by Equation (1):
Setting 2: The total amount of agricultural waste generated in the collection area is assumed to be If the farmers participate in third-party management of agricultural waste, the labor cost paid by the farmers to collect the waste is . After the organic fertilizer manufacturing enterprise buys the agricultural waste from the farmers, the farmers can receive a benefit of .
Setting 3: When organic fertilizer manufacturing enterprises recycle the raw materials of agricultural waste, the recovery amount is and the purchase price is . When organic fertilizer manufacturing enterprises transfer the collected agricultural waste, the transport cost per unit distance is , and the transport road tortuous coefficient is . The fixed cost of the organic fertilizer production of manufacturing enterprises is . This cost includes the construction of new production plants and the purchase of production equipment. The variable cost of organic fertilizer production is , the conversion coefficient of organic fertilizer production from livestock and poultry waste is , and the sales price of the produced organic fertilizer is . At this time, the income obtained by the organic fertilizer manufacturing enterprise is .
Setting 4: The third-party management model of livestock and poultry waste cannot completely solve the existing environmental pollution problem. In terms of unrecycled livestock and poultry waste, the cost of government participation in environmental pollution control is . In order to eliminate the externalities of waste management, the government provides subsidies for waste collection and organic fertilizer production, and the government’s subsidy budget is . The total social welfare at this time is .
Setting 5: With regard to the meaning of the variables in different cases, if there is no subscript this indicates the case in which the government does not subsidize; indicates the case in which where the government subsidizes farmers; and indicates the case in which the government subsidizes organic fertilizer manufacturing enterprises.
In summary, the variables and parameters used for modeling in this paper are shown in
Table 1 and
Table 2 below.
4. Supply Chain Game Analysis of Organic Fertilizer Production from Livestock and Poultry Waste Under Different Subsidy Strategies
Based on the construction of a decision-making model for the supply chain of non-scale livestock and poultry waste raw material collection–organic fertilizer production, this paper further explores the game process and results of the supply chain under different subsidy strategies. As an effective policy tool, a government subsidy can significantly affect the behavior and decision-making of each participant in the supply chain, eventually changing the operation mode and efficiency of the whole supply chain. Therefore, game analysis of different subsidy strategies can help to reveal the role of government subsidies in coordinating the supply chain operation and in promoting the resource utilization of waste. This analysis can provide a theoretical basis upon which the government can formulate a reasonable subsidy policy. In the following section, this paper analyzes the three scenarios of no subsidy, a government subsidy to farmers, and a government subsidy to organic fertilizer manufacturing enterprises.
4.1. No Subsidy
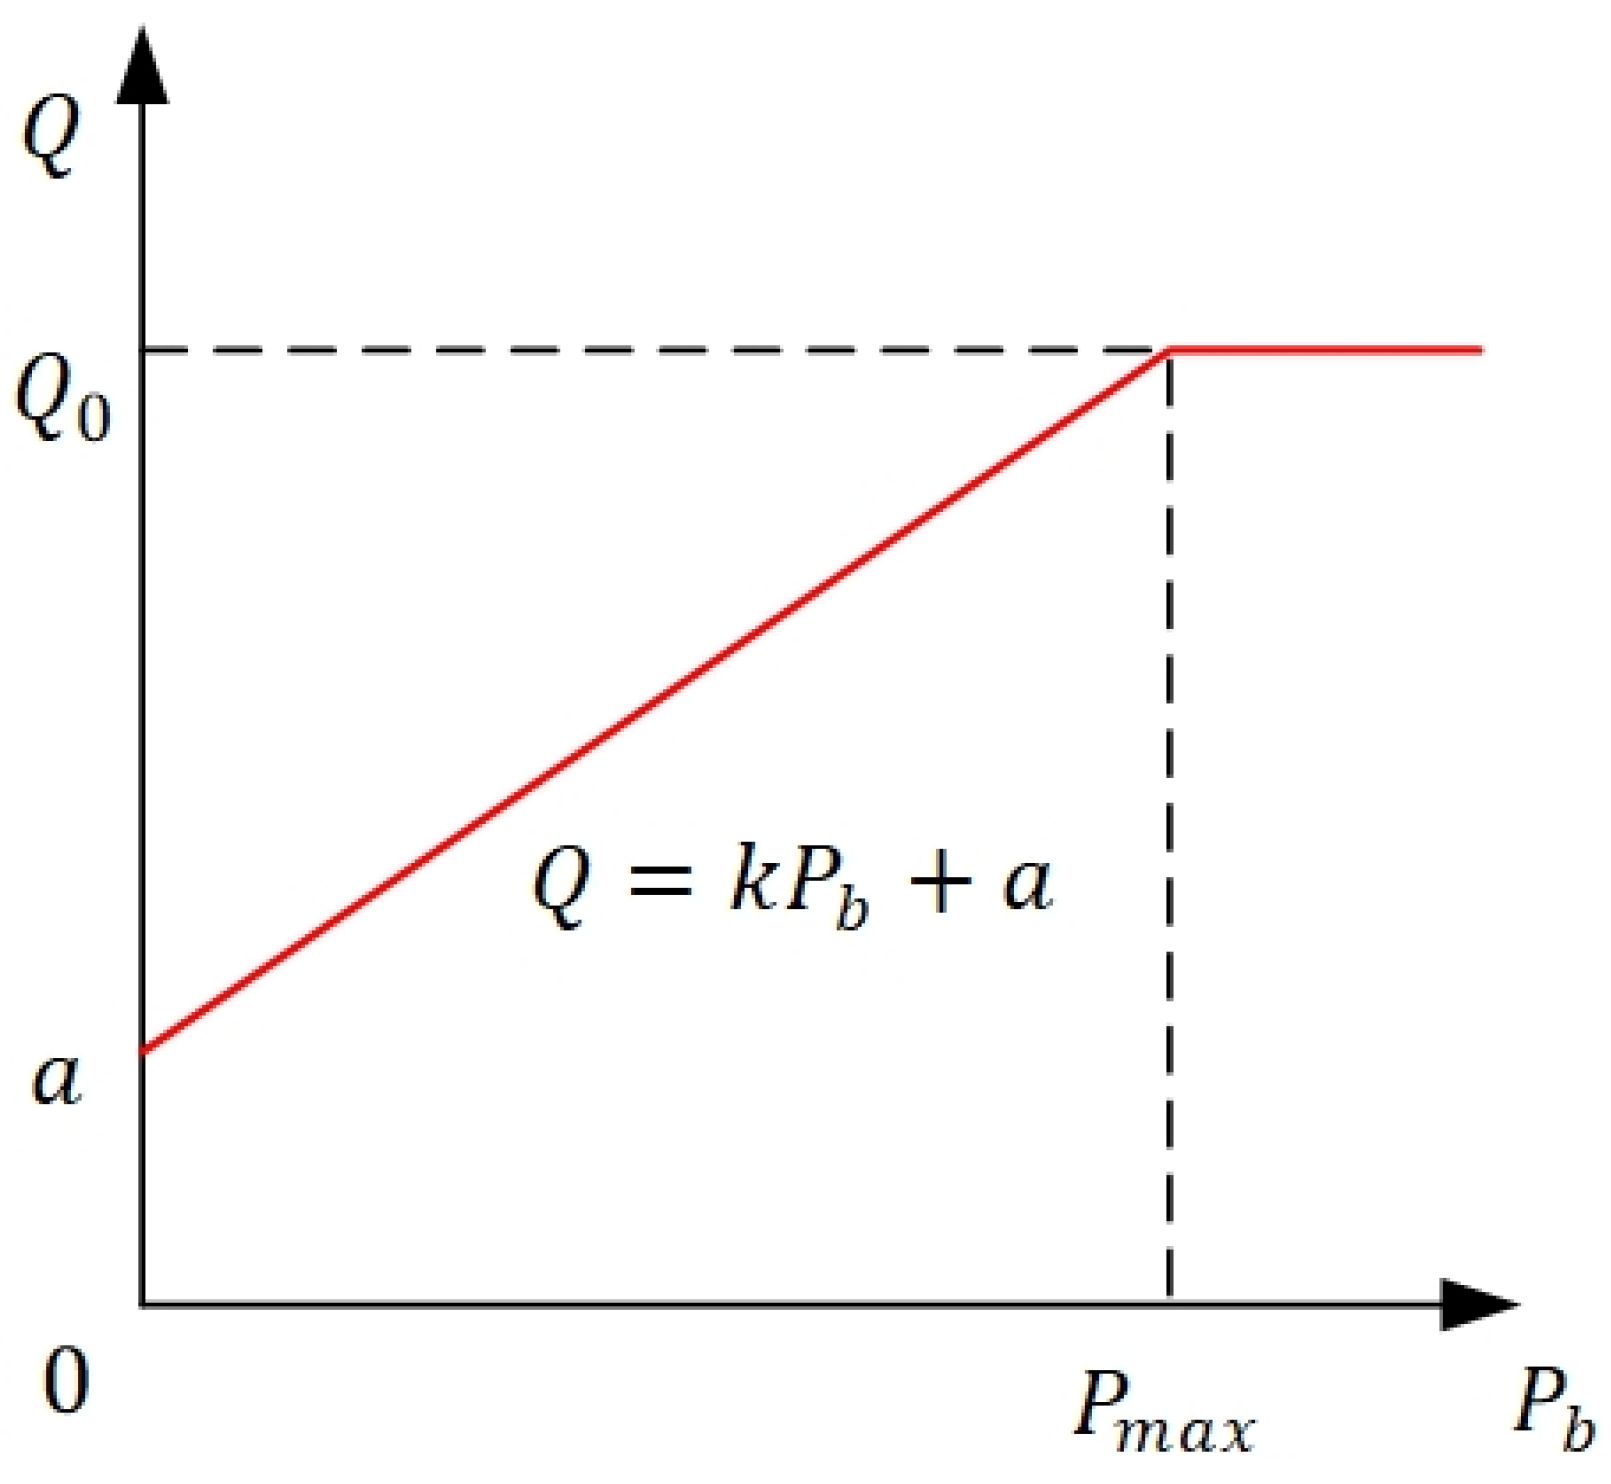
The organic fertilizer manufacturing enterprise purchases from farmers the raw materials of breeding waste to produce organic fertilizer. The farmers sell the raw materials of breeding waste
to the organic fertilizer manufacturing enterprise, and the purchase price is
. As shown in
Figure 3, in an ideal market, the relationship between
and
is assumed to be a linear function:
Since some farmers are willing to provide free breeding waste raw materials to organic fertilizer manufacturing enterprises, . In the linear function, reflects the farmers’ willingness to sell. The larger is, the stronger is the willingness of farmers to sell waste raw materials to organic fertilizer manufacturing enterprises rather than to other raw material recycling channels. Therefore, it is easier for organic fertilizer manufacturing enterprises to acquire more breeding waste raw materials. Here, is the total amount of breeding waste materials produced by local agriculture every year.
The farmers’ labor cost of collecting waste raw materials is
, therefore the cost for farmers to collect waste is
. The revenue function of farmers selling waste raw materials is
The sales revenue of the organic fertilizer manufacturing enterprises that collect waste raw materials to produce organic fertilizer is and the organic fertilizer manufacturing enterprises’ production cost is . The cost to the organic fertilizer manufacturing enterprises to acquire waste raw materials is . The cost of transporting the waste recovered in the collection area with a radius of to the manufacturing plant is . The organic fertilizer manufacturing enterprises’ fixed cost is .
The revenue of organic fertilizer manufacturing enterprises that purchase waste raw materials to produce organic fertilizer is
For ease of calculation, let the expression of
be
. Here,
is related to the profitability of the organic fertilizer manufacturing enterprises that produce organic fertilizer from agricultural waste. The larger
is, the stronger the ability of organic fertilizer manufacturing enterprises to produce organic fertilizer from agricultural waste. The revenue function of the organic fertilizer manufacturing enterprise is obtained as follows:
The government’s loss from the environmental pollution caused by the illegal discharge of unrecycled waste is
Farmers determine the amount of waste sold, , according to the purchase price paid by the organic fertilizer manufacturing enterprises. To maximize their own interests, organic fertilizer manufacturing enterprises determine according to the sales volume, of farmers.
At this time, the organic fertilizer manufacturing enterprise is the leader. In order to ensure the organic fertilizer manufacturing enterprise gets the maximum profit, make and obtain the best purchase price for waste raw materials under the maximization of the interests of the organic fertilizer manufacturing enterprise: .
In this case, , and the organic fertilizer manufacturing enterprise’s income reaches the maximum value.
Substituting at this time into .
Proposition 1. In the absence of a subsidy, the revenue of farmers, organic fertilizer manufacturing enterprises, and social welfare are as follows (the proof of Proposition 1 is provided in the Appendix A.1): 4.2. Subsidies to Farmers
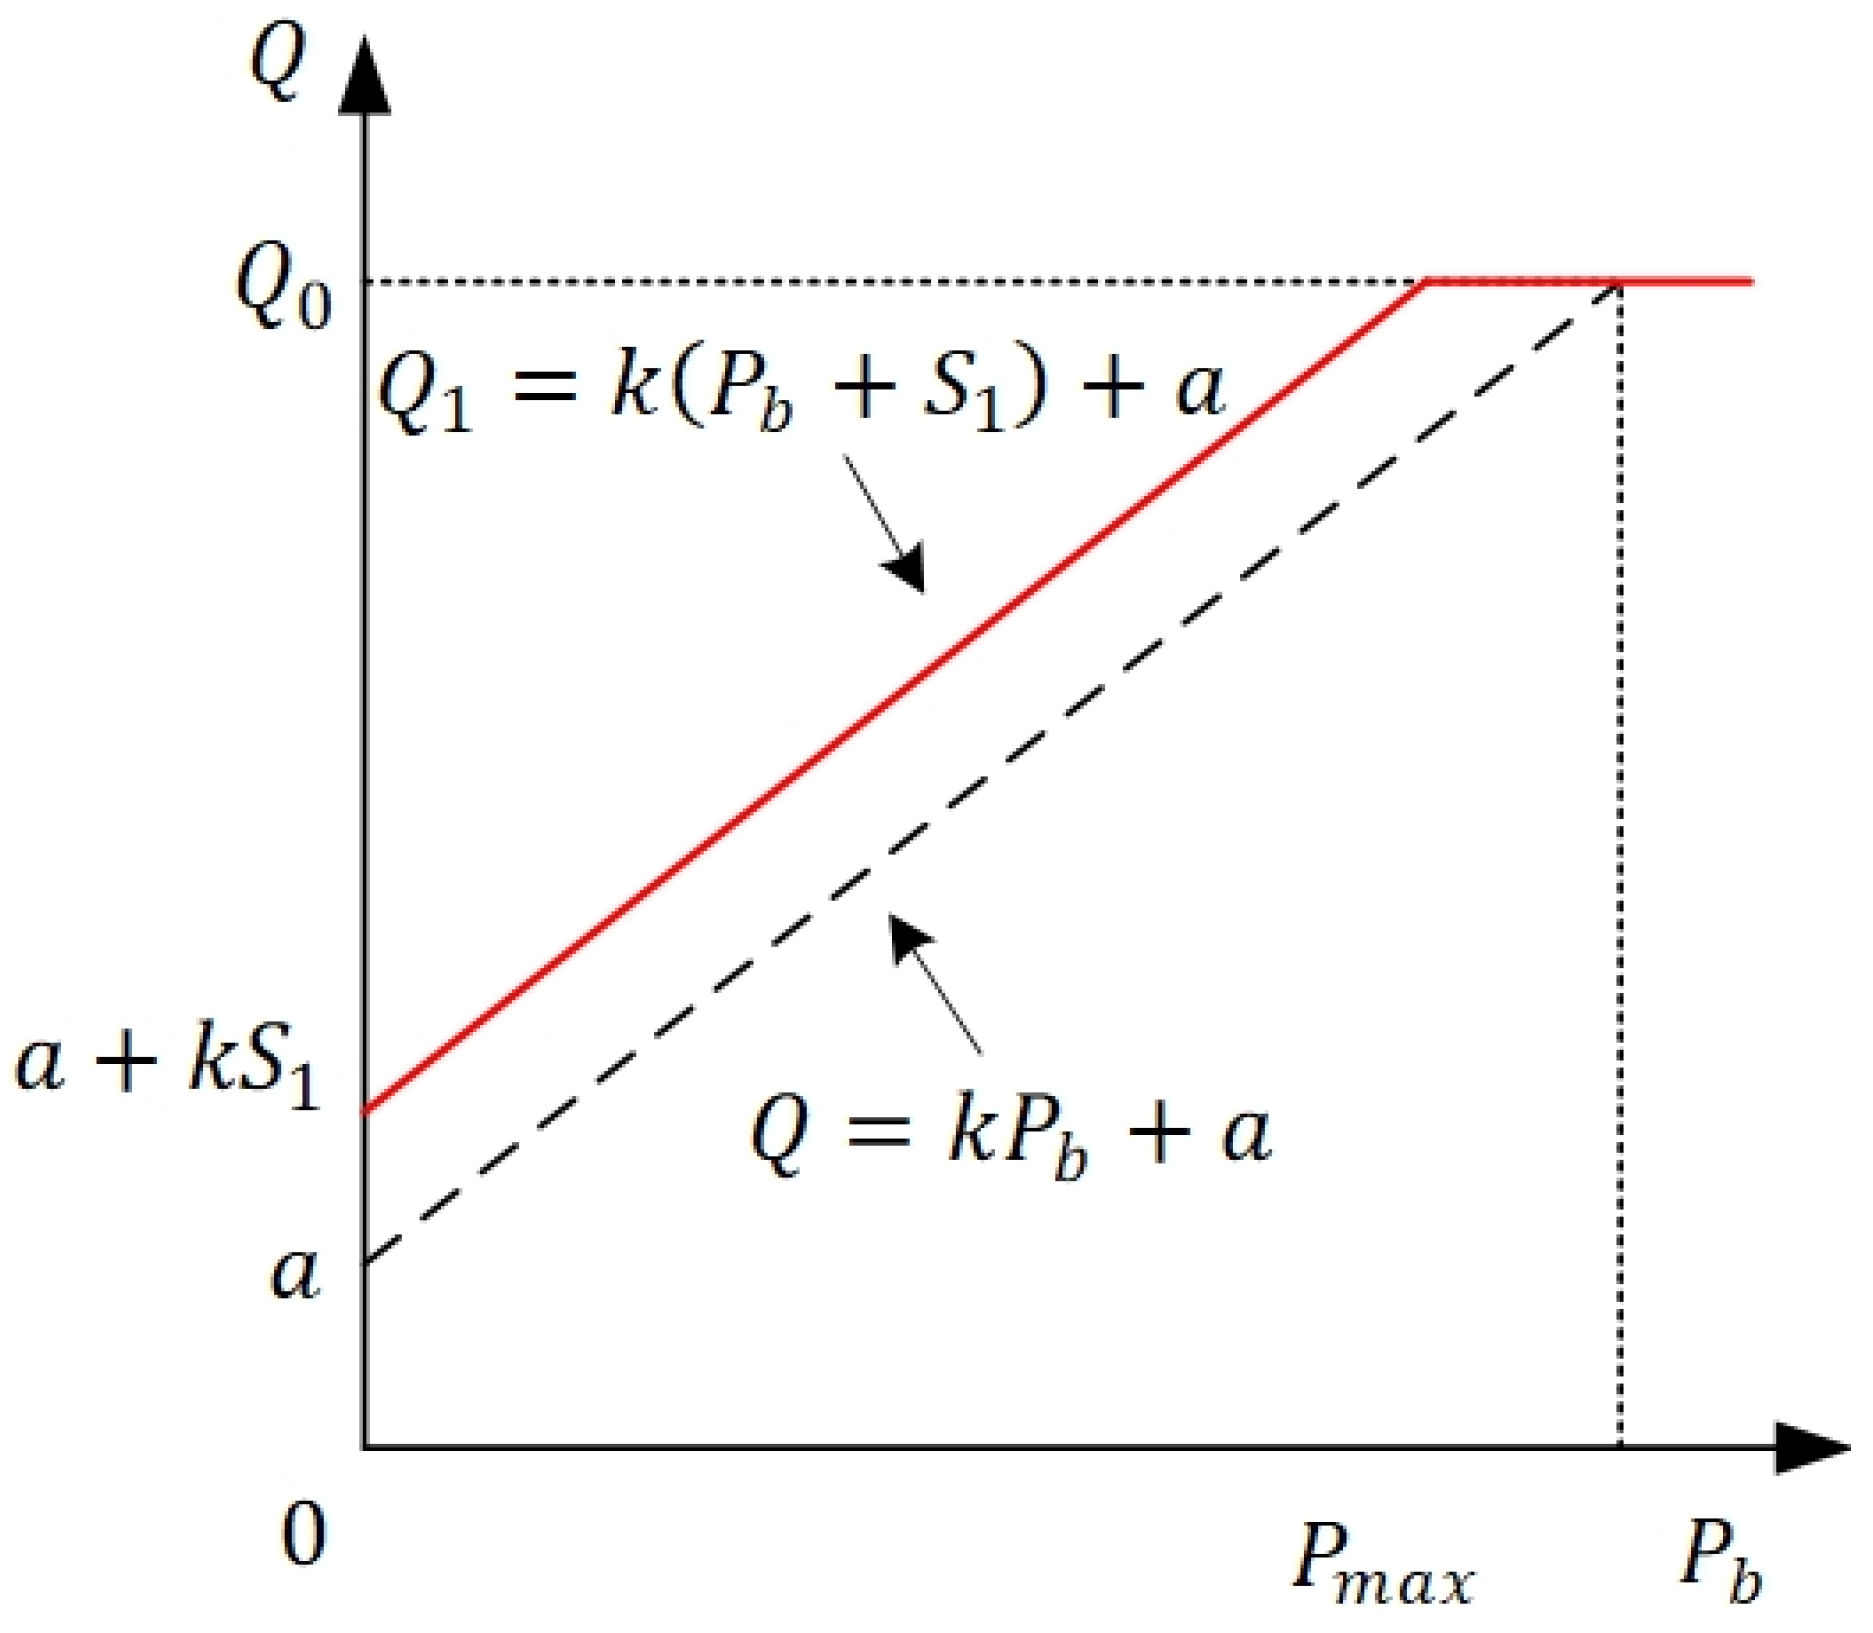
The government provides some subsidy funds to encourage farmers to sell waste raw materials to organic fertilizer manufacturing enterprises. The aim is to reduce the environmental pollution caused by the illegal discharge of waste raw materials. In this case, the government’s subsidy to farmers for selling waste raw materials is
. As shown in
Figure 4, the supply function of farmers at this time is
The revenue function for selling waste materials under the scenario of government-subsidized farmers is
This section solves the game model in the case of subsidized farmers. According to Stackelberg game theory, the government is regarded as the leader, the organic fertilizer manufacturing enterprise is the secondary leader, and the farmers are the followers. The equilibrium solution of the sequential game is obtained according to the inverse order solution method.
Farmers determine the amount of waste sold,
according to the purchase price
paid by the organic fertilizer manufacturing enterprises and the subsidy
paid by the government. To maximize their own interests, organic fertilizer manufacturing enterprises formulate
according to the sales volume
of farmers. To minimize fiscal expenditure, the government formulates subsidy
according to its own fiscal expenditure. The revenue function of farmers is
To maximize their own interests, organic fertilizer manufacturing enterprises make
according to the sales volume
of farmers. The revenue function of the organic fertilizer manufacturing enterprise is
Derivate , and make , so we obtain .
At this time, and the organic fertilizer manufacturing enterprises’ revenue reaches the maximum. Substituting yields .
Therefore, the revenue of farmers and the revenue of organic fertilizer manufacturing enterprises, respectively, in the case of government subsidies to farmers are obtained as follows:
The government’s social welfare decision function is
The social welfare at this point is
From the above equation, social welfare
is directly proportional to government subsidy
. Therefore, under the budget constraints of government subsidy funds, the subsidy strategy to maximize social welfare is
Proposition 2. In the case where the government subsidizes the farmers, the purchase price, purchase amount, farmers’ revenue, organic fertilizer manufacturing enterprise revenue, and social welfare are as follows (the proof of Proposition 2 is provided in the Appendix A.2): 4.3. Production Subsidies for Organic Fertilizer Manufacturing Enterprises
Production subsidies are mainly to compensate for the financial support provided by organic fertilizer manufacturing enterprises when purchasing waste raw materials to produce organic fertilizer. This subsidy policy aims to encourage enterprises to purchase waste materials from farmers to promote the development and utilization of waste energy.
The process in this section is the same as in
Section 4.2. The government is regarded as the leader, the organic fertilizer manufacturing enterprise is the secondary leader, and the farmer is the follower. The equilibrium solution of the sequential game is obtained according to the inverse order solution method. The government provides subsidy funds to encourage organic fertilizer manufacturing enterprises to purchase waste materials from farmers. The government’s aim is to reduce the environmental pollution caused by the illegal discharge of waste.
In this case, the government’s subsidy provided to organic fertilizer manufacturing enterprises to purchase waste raw materials is
. The expression of the purchase amount
is as follows:
Farmers determine the amount of waste sold,
according to the purchase price
paid by organic fertilizer manufacturing enterprises. The revenue function of farmers is
The government provides partial subsidies to organic fertilizer manufacturing enterprises to produce organic fertilizers, and the subsidy standard is
. The revenue function of the organic fertilizer manufacturing enterprise is
Derivate and make , so we get .
At this time, and the organic fertilizer manufacturing enterprises’ revenue reaches the maximum. Substituting yields .
Therefore, the revenue of farmers and the revenue of organic fertilizer manufacturing enterprises, respectively, under the government’s subsidy for organic fertilizer manufacturing enterprises are obtained as follows:
The government’s social welfare decision function is
The social welfare at this point is
From the above equation, one can see that social welfare
is directly proportional to government subsidy
. Therefore, under the budget constraints of government subsidy funds, the subsidy strategy to maximize social welfare is
Proposition 3. When the government provides production subsidies to organic fertilizer manufacturing enterprises, the purchase price, purchase amount, farmers’ revenue, organic fertilizer manufacturing enterprise revenue, and social welfare are as follows (the proof of Proposition 3 is similar to Proposition 2, so please refer to Proposition 2):
4.4. Comparative Analysis
The results of the above three scenarios are summarized as shown in
Table 3 and
Table 4 below.
This study utilized MATLAB R2022b software for numerical simulation. Combined with the research results and historical data of the research group, the parameters of the baseline scenario are set as follows: the radius of the planning area is km, the total amount of livestock and poultry waste generated in the area is tons (1 ton = 1000 kg), the density of waste (the total amount of waste collected /the radius of the area ) = , and the farmer’s labor cost to collect the waste is CNY/ton.
For organic fertilizer manufacturing enterprises, the market price of organic fertilizer is set to /ton; the variable cost of organic fertilizer /ton; the transportation cost /(ton·km), and the fixed cost of organic fertilizer manufacturing enterprises . The conversion rate of organic fertilizer produced from livestock and poultry breeding waste is related to process equipment and is generally between and . In this paper, the conversion rate and the transportation road twist factor are set.
The government subsidizes the farmer’s budget . The government also subsidizes the manufacturing enterprise’s budget CNY, and the cost of the loss due to environmental pollution caused by unrecovered waste /ton. The acquisition function parameter and the acquisition function parameter .
According to the above parameter settings, the calculation results of purchase price, purchase amount, farmers’ revenue, organic fertilizer manufacturing enterprise revenue, and social welfare in the three cases, respectively, are shown in
Table 5.
As can be seen from
Table 5, compared with the case in which no subsidy is provided, the strategies of subsidizing both farmers and manufacturing enterprises have significantly increased the amount of waste being recycled. These strategies not only promote the recycling of resources but also bring higher overall social welfare. At the same time, these two types of subsidies also significantly improve the economic benefits for both farmers and manufacturing enterprises. This shows that the government’s subsidy policy can effectively encourage farmers and enterprises to participate in the recycling of waste materials and the production of organic fertilizers, thus achieving a win-win situation for economic and environmental benefits. In addition, the improvement in social welfare not only reflects the improvement in resource utilization efficiency but also reflects society’s attention to the improvement of environmental quality. Therefore, the above subsidy policy not only improves economic benefits but also promotes the growth of social welfare and helps realize the coordinated development of economy, society, and environment.
5. Numerical Simulation
In exploring the decision-making model for the supply chain of organic fertilizer produced from waste, significant differences exist among different regions in terms of natural resource endowment and agricultural production. These differences can have a significant impact on the effectiveness of the government’s subsidy strategy and the operation of the supply chain. In order to more accurately assess and compare the effectiveness of different subsidy strategies under different regional conditions, this paper also considers two key factors, namely waste density (the ratio of total waste collection to regional radius ) and road tortuosity factor , based on the baseline scenario. These two factors represent the density of waste distribution within the region and the accessibility to waste due to transport conditions, respectively. These factors have a direct impact on the cost and efficiency of waste collection.
This paper therefore combines these two factors and distills four different scenarios to simulate the actual specific conditions of different regions. These scenarios are designed to reflect the challenges and strengths of different regions in terms of waste collection and transportation and thus provide a scientific basis upon which the government can formulate region-specific subsidy policies. Scenarios I to IV, shown in
Table 6 below, correspond to realistic regional conditions, with different natural resource endowments and agricultural production. Next, the subsidy strategies under these four scenarios will be analyzed through numerical simulation. Simulating the supply chain’s operation under different scenarios will help to identify which subsidy strategy can maximize the economic and environmental benefits under specific regional conditions and thus provide corresponding decision support for policymakers.
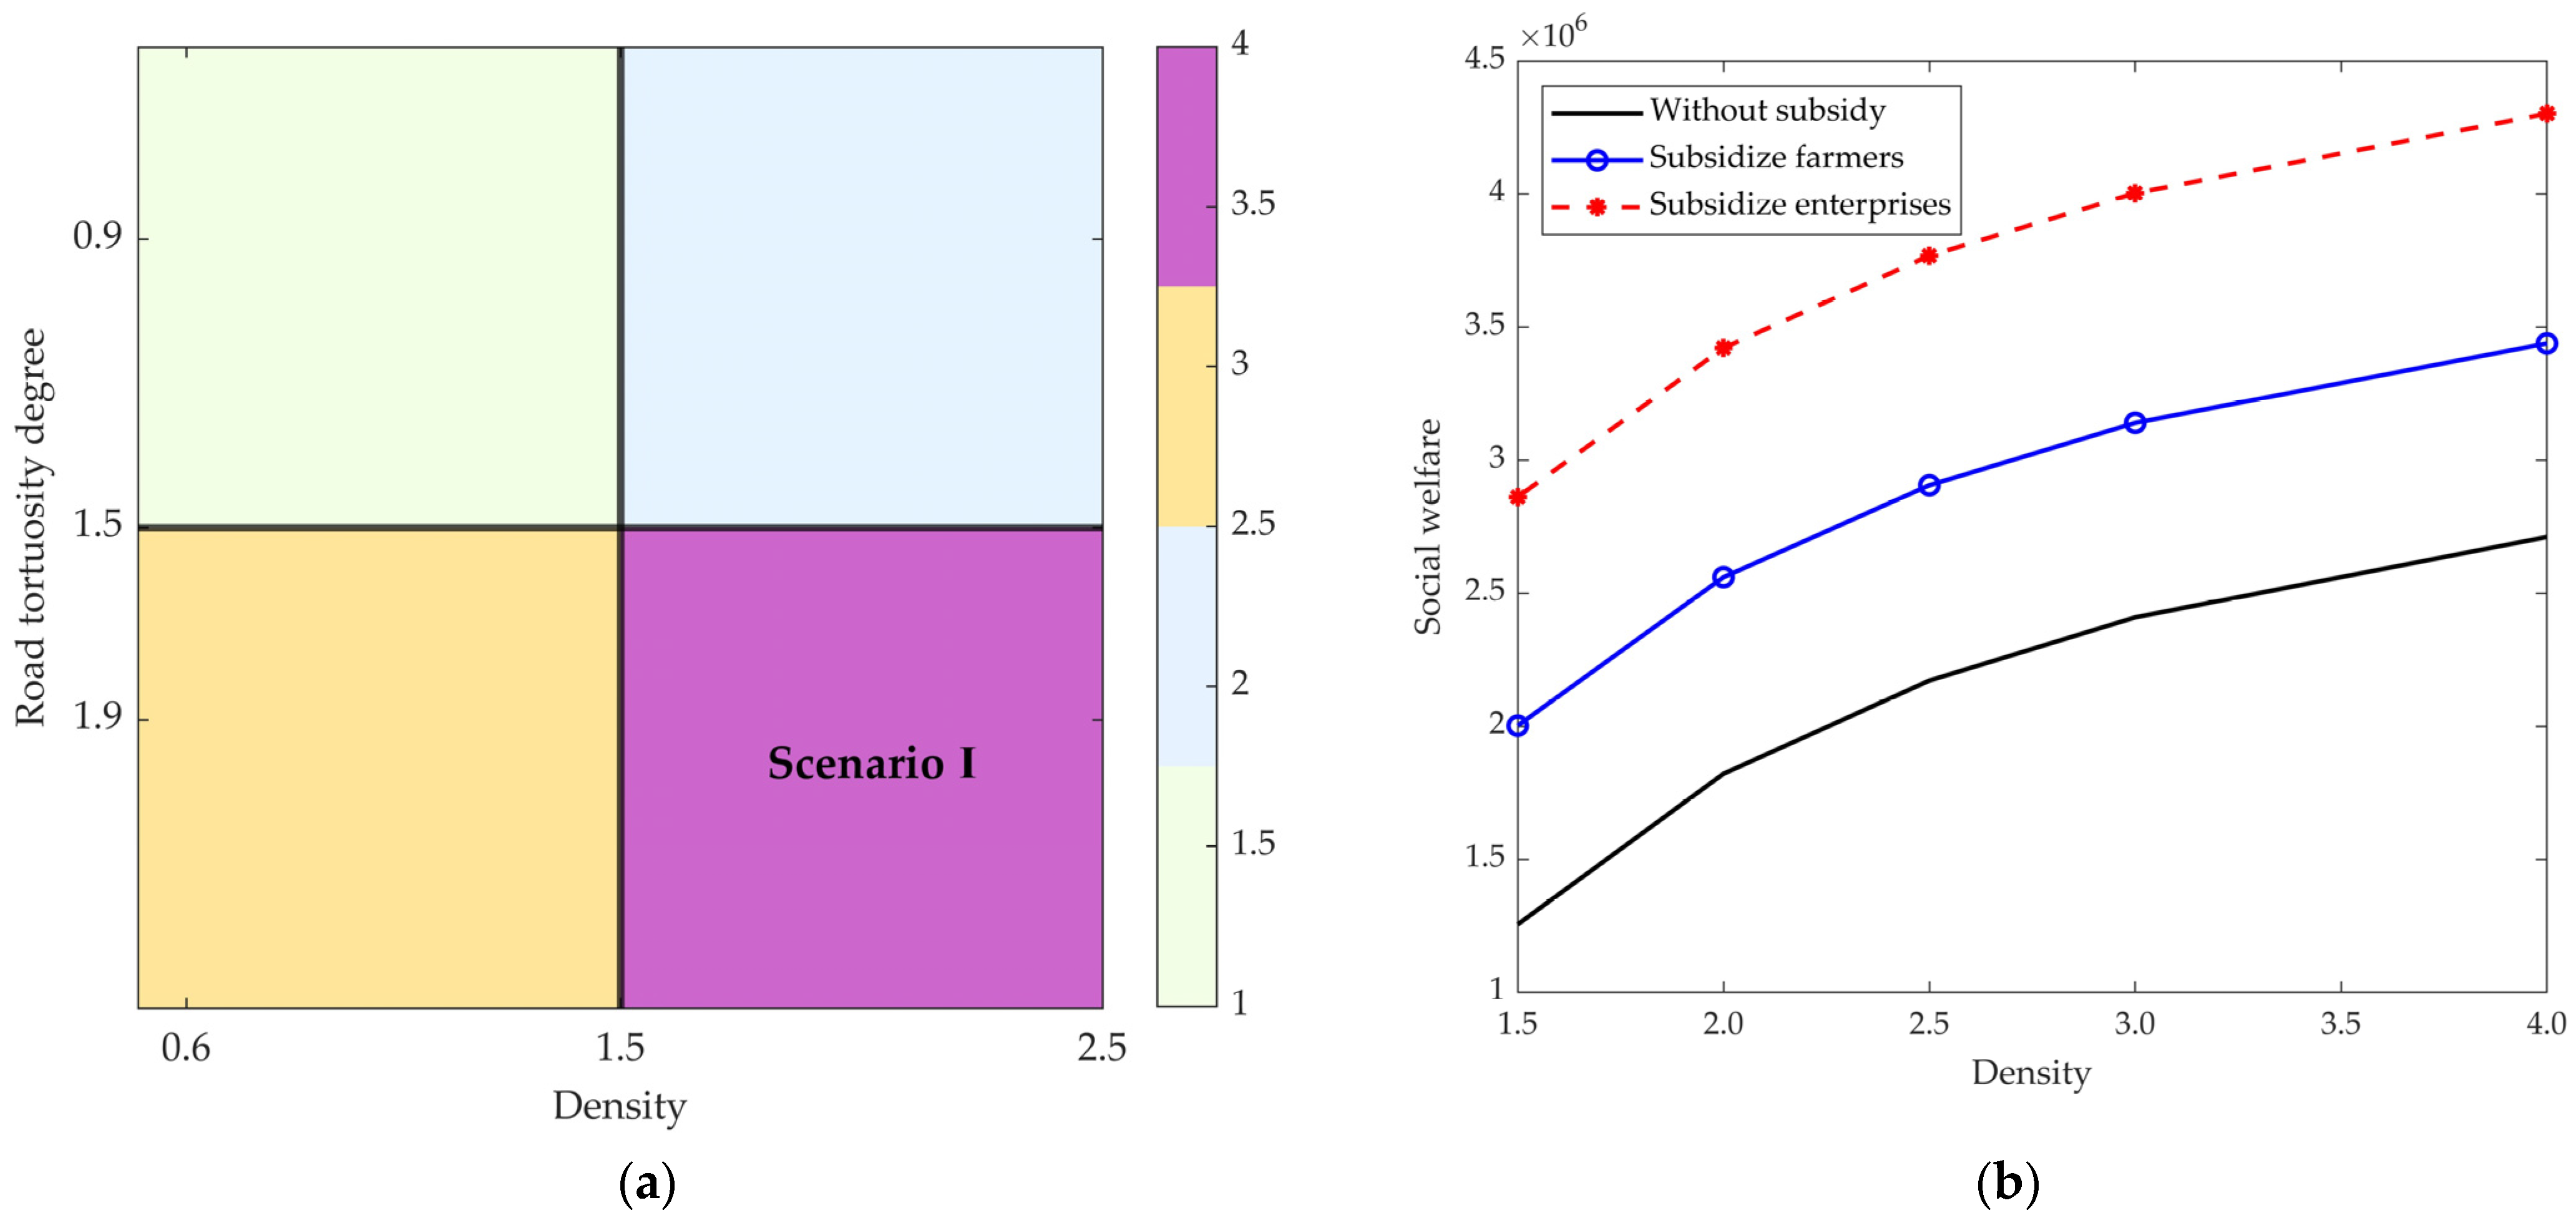
5.1. Scenario I
In Scenario I, the waste density and road tortuosity degree in the region are higher than in other scenarios. Referring to the baseline scenario, this study assumes that, in Scenario I, the road tortuosity factor is higher than the baseline scenario . Also, the values of other parameters are consistent with the baseline scenario. In order to show the increase in road tortuosity degree and the increase in waste density, the waste density values in this scenario are respectively.
Figure 5 shows the dynamic response of overall social welfare to changes in waste density under different subsidy strategies. Scenarios I shows that in the scenario of high waste density and high road tortuosity degree, the level of social welfare tends to increase with the increase in farm waste density, but the effect of different subsidy strategies varies significantly. In particular, the social welfare level of subsidized manufacturing enterprises (red dashed line) is consistently higher than the other two subsidy approaches, with peak values (4.3) that are 40% and 21% higher than those of unsubsidized (2.6) and subsidized farmers (3.4), respectively.
In areas such as Scenario I, the high density of waste and the complex road network significantly increase the transportation and disposal costs for manufacturing enterprises. Providing targeted subsidies to manufacturing enterprises by the government can reduce their marginal costs and incentivize them to scale up waste recycling, which further promotes the increase in resource utilization. At the same time, areas with high levels of road tortuosity degree are in dire need of supporting transportation infrastructure investments, such as specialized transportation corridors and storage nodes. This usually requires government intervention and leadership and creates a synergistic effect with government subsidies to manufacturing enterprises. Therefore, governments should prioritize subsidy resources towards manufacturing enterprises, especially in agricultural agglomerations with high waste densities. This can be implemented in the form of tax breaks, freight subsidies or special funds for technological upgrading.
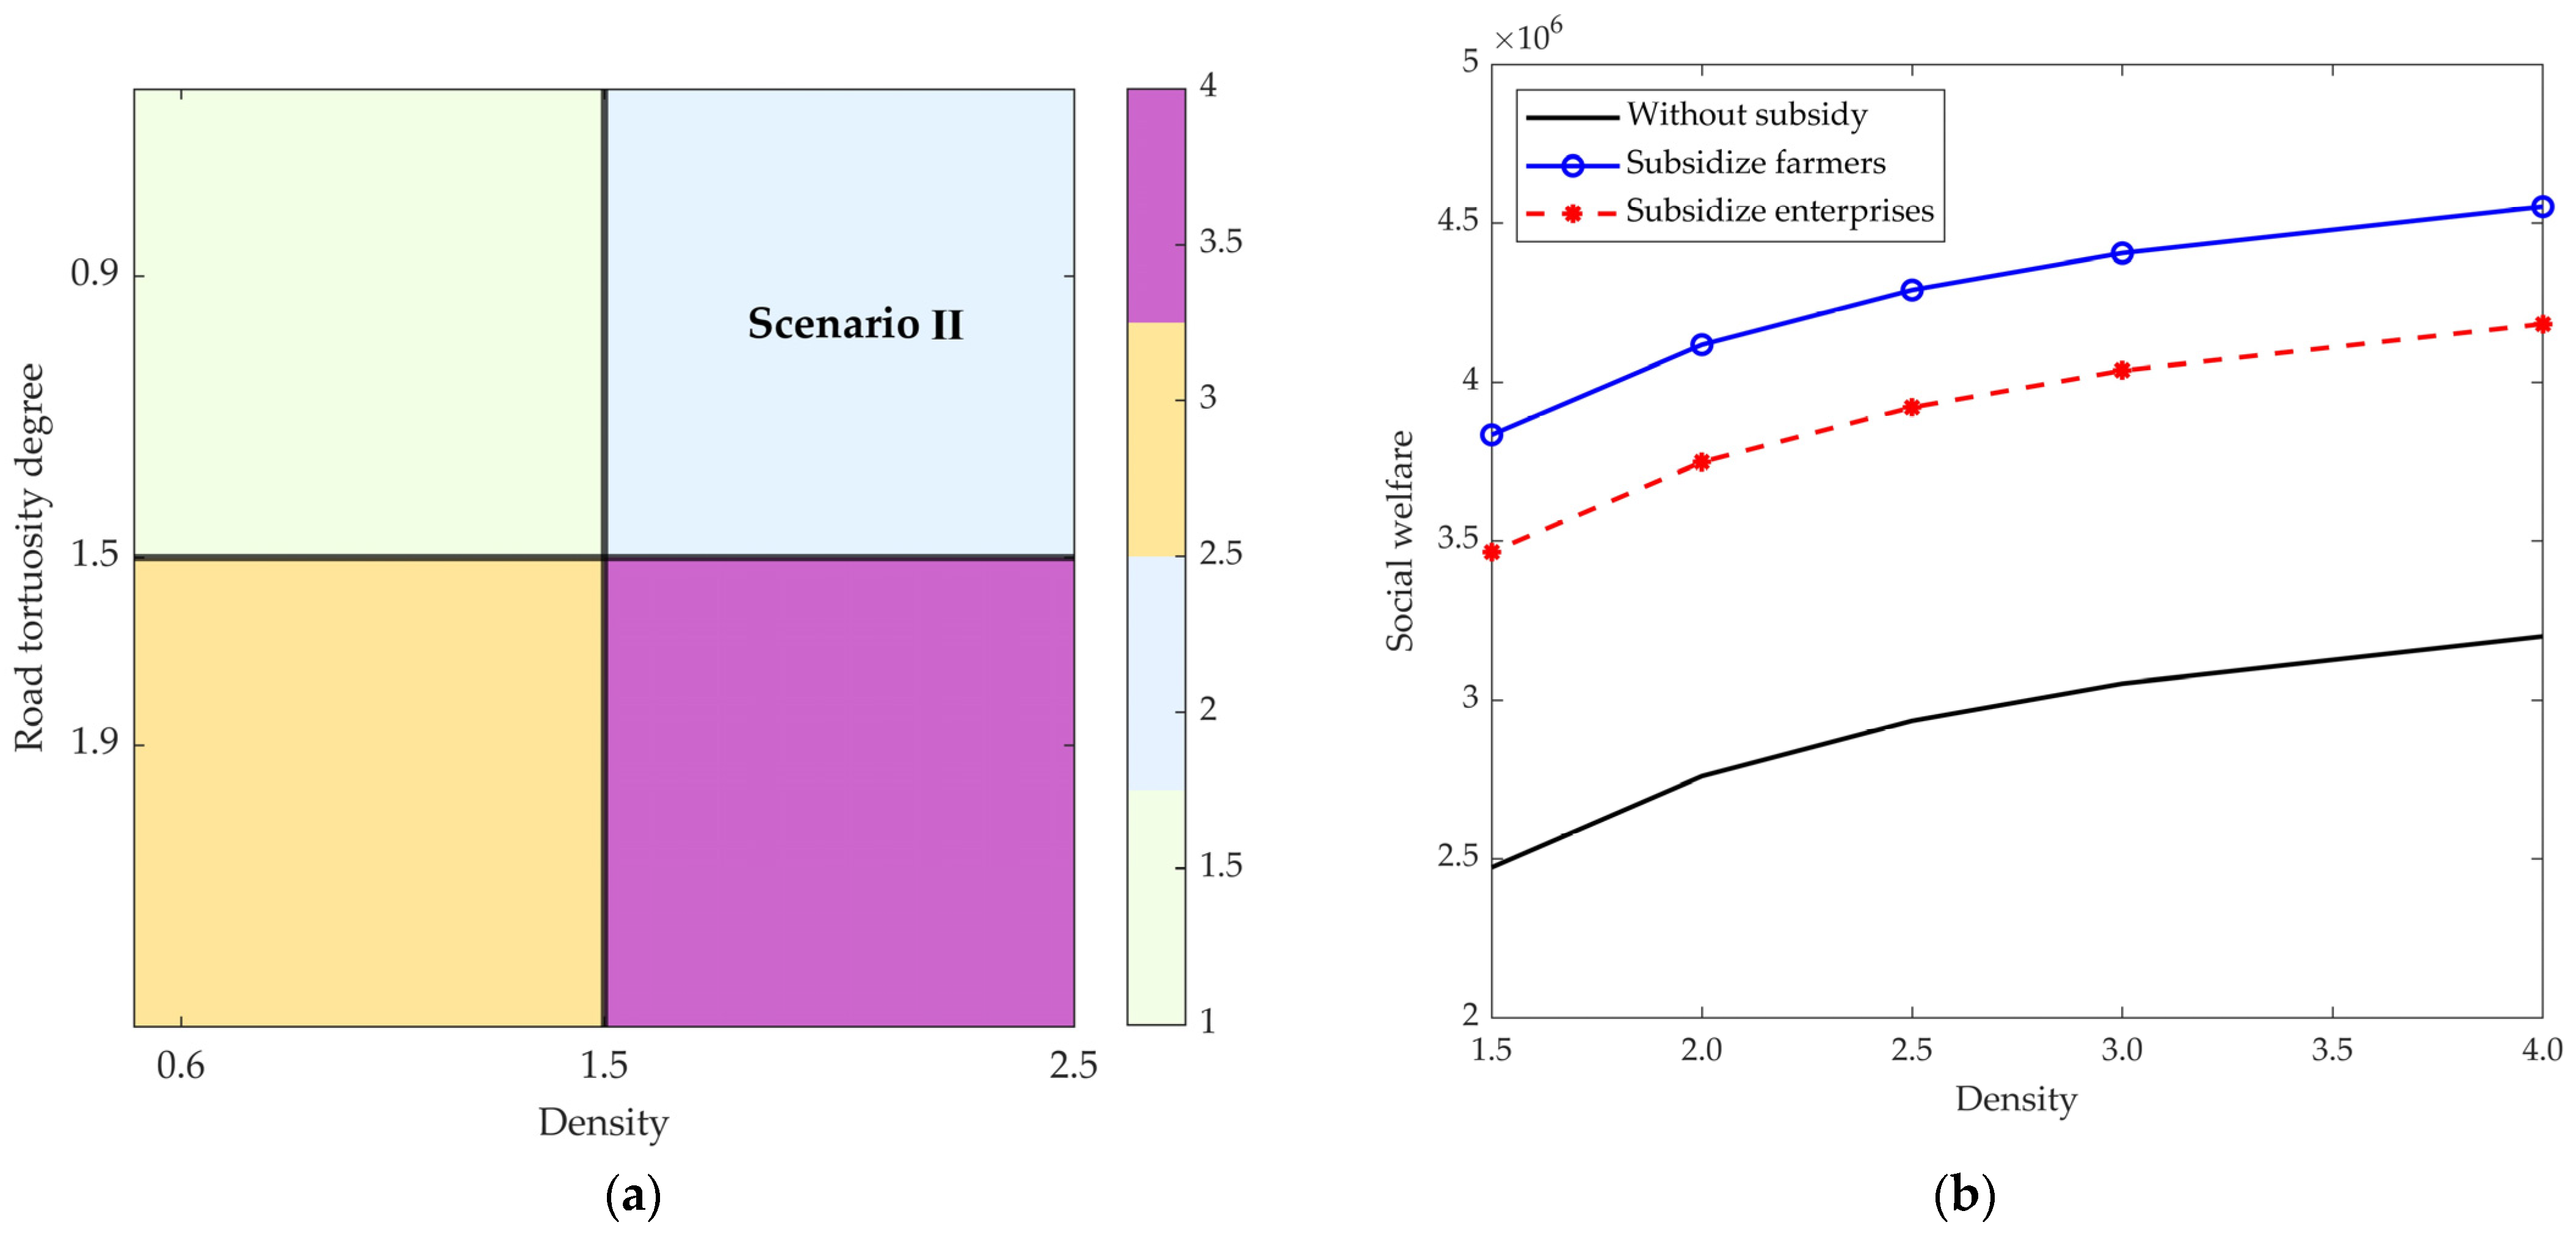
5.2. Scenario II
In Scenario II, the waste density in the region is higher, and the road tortuosity degree is lower. Referring to the baseline scenario, this study assumes that in Scenario II the road tortuosity factor is lower than the baseline scenario . The values of the other parameters are consistent with the baseline scenario. In order to show the decrease in road tortuosity degree and the increase in waste density, the waste density values are respectively.
Figure 6 shows the dynamic response of total social welfare with the change in waste density under different subsidy strategies. Scenario II shows that in the scenario of high waste density but low road tortuosity degree, the social welfare level shows an upward trend with the increase in waste density. Among the strategies, the strategy of subsidizing farmers (blue solid line) has the best effect on improving social welfare level. Its peak value (4.5) was 29% and 8% higher than that of unsubsidized (3.2) and subsidized households (4.1).
In Scenario II, the waste density is high, but the road tortuosity degree is low. The transportation cost of waste is significantly reduced and farmers can complete the collection and transportation of waste at lower cost. The collection of waste by manufacturing enterprises depends on large-scale treatment facilities. Although it has certain benefits under low transportation costs, it is limited by the cooperation efficiency between enterprises and farmers, and the social welfare is lower than when directly subsidizing farmers. In the absence of subsidies, the participation of farmers and enterprises is low due to the lack of economic incentives, and the growth of social welfare is slow. Therefore, the government should assign priority to the strategy of subsidizing farmers by providing quantitative subsidies (such as CNY 50 per ton of waste subsidy) or providing collection equipment (such as small transport vehicles) to promote the enthusiasm of farmers to participate in waste collection.
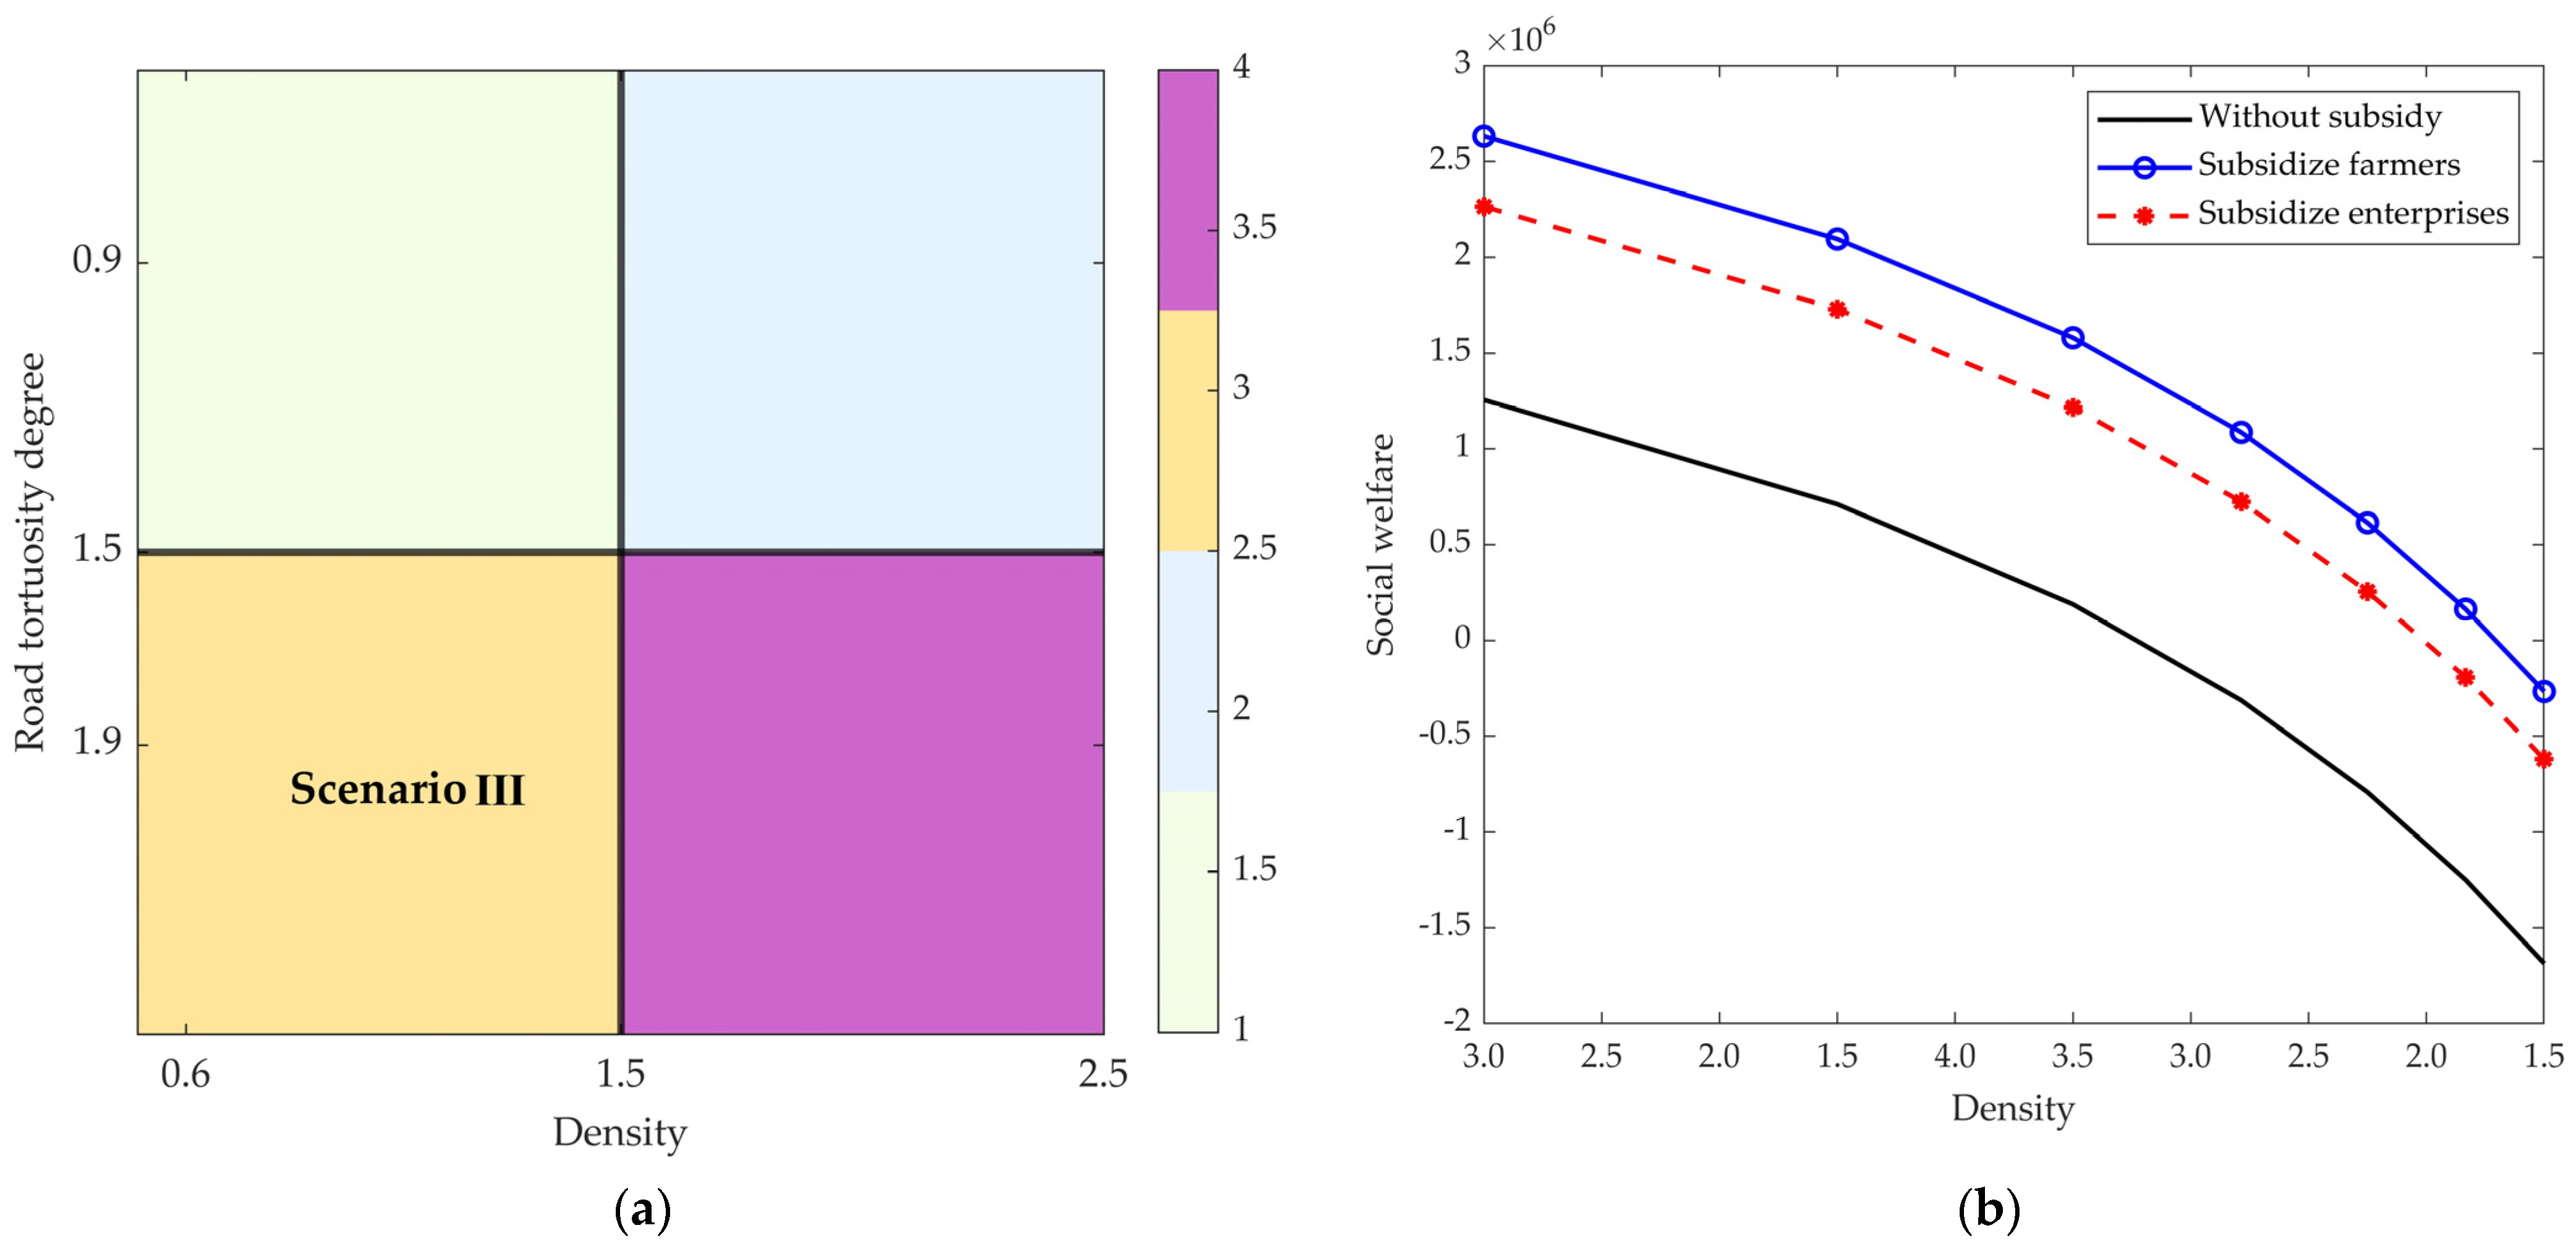
5.3. Scenario III
In Scenario III, the waste density in the region is lower, and the road tortuosity degree is higher. Referring to the baseline scenario, this study assumes that, in Scenario III, the road tortuosity factor is higher than in the baseline scenario, where . The values of the other parameters are consistent with the baseline scenario. In order to show the increase in road tortuosity degree and the decrease in waste density, the waste density values range from to , decreasing by increments successively (i.e., ).
Figure 7 shows the dynamic change in total social welfare with the decrease in waste density under different subsidy strategies. The results show that in areas with low waste density and complex terrain, social welfare generally decreases with the decrease in waste density. However, the strategy of subsidizing farmers (solid blue line) shows the best performance in slowing the rate of welfare decline, especially when the waste density is low, and this strategy is more effective in maintaining the level of social welfare.
Considering the low-density area in Scenario III, the scattered waste distribution and complex terrain will greatly increase the scale collection costs of manufacturing enterprises. The decentralized collection of farmers is more flexible. Therefore, the government should assign priority to subsidizing farmers to cover the economic costs of small-scale collection and maintain the stability of waste collection. It is suggested to invest in the construction of village-level collection stations in areas with complex terrain, as a transit node between farmers and enterprises, so as to reduce the direct transportation cost between farmers and manufacturing enterprises.
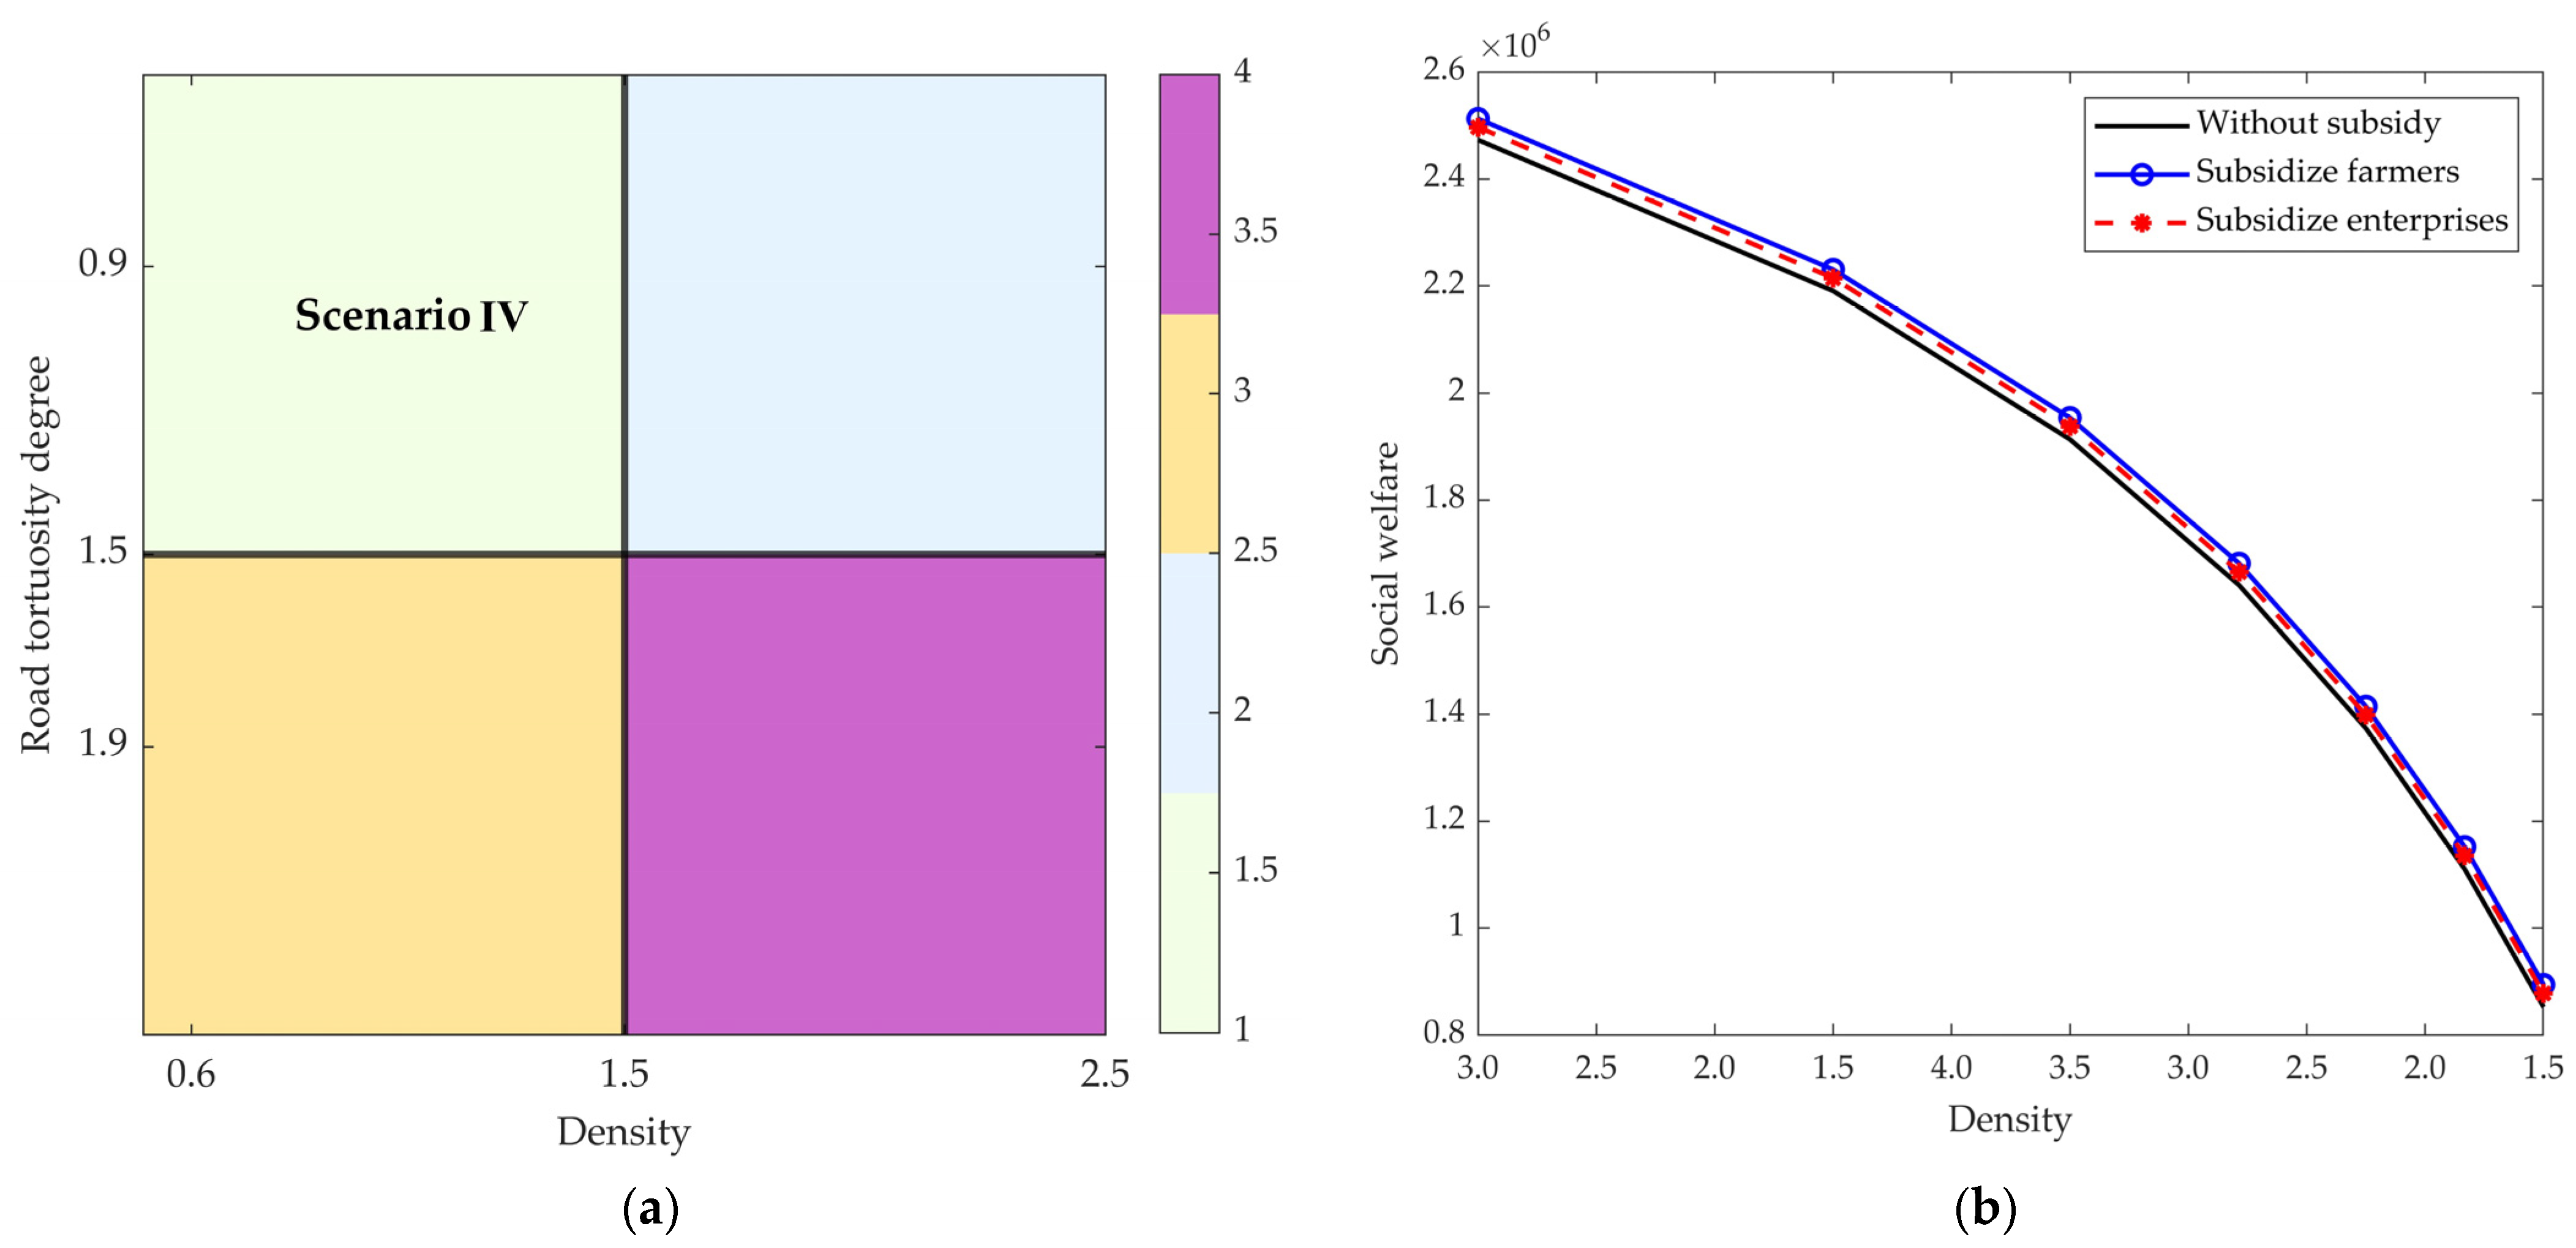
5.4. Scenario IV
In Scenario IV, the waste density in the region is lower, and the road tortuosity degree is lower. Referring to the baseline scenario, this study assumes that, in Scenario IV, the road tortuosity factor is lower than the baseline scenario . The values of the other parameters are consistent with the baseline scenario. In order to show the decrease in road tortuosity degree and the decrease in waste density, the waste density values are respectively.
Figure 8 shows the dynamic change in total social welfare with the decrease in waste density under different subsidy strategies. The results show that in areas with low waste density and weak road tortuosity degree, social welfare generally decreases with the decrease in density. However, subsidies to farmers and subsidies to manufacturing enterprises did not significantly slow down the decline in social welfare. Low waste density leads to insufficient economies of scale in collection, while good road conditions further weaken the marginal incentive effect of subsidies.
In Scenario IV, the potential benefits of waste resource utilization are limited and it is difficult to elicit enthusiasm to participate from farmers or enterprises simply by providing subsidies from the government. Therefore, in this case, it is not recommended that the government directly subsidizes farmers or manufacturing enterprises. Choose the “light subsidies, heavy technology” strategy; that is, the government provides technical support and market information services to help farmers and manufacturing enterprises to improve efficiency, which is more cost-effective in principle and also avoids wasting financial resources.
6. Conclusions and Discussion
6.1. Conclusion and Policy Suggestions
Effective management of agricultural farming waste is crucial to enhance the rural ecological environment and promote the sustainability of agriculture. In order to promote the long-term development of non-large-scale livestock and poultry waste collection and production of organic fertilizer in rural areas, this study constructs a tripartite game theory model of government, farmers, and organic fertilizer manufacturing enterprises. The incentive effects and social welfare effects of different subsidy strategies on the supply chain of waste recycling and organic fertilizer production were systematically analyzed. Secondly, this study extracts four scenarios with different natural resource endowments and agricultural production conditions, considering the regional farming density and road tortuosity degree in the transportation process, and carries out simulation analysis for each regional scenario.
The results show that the effectiveness of government subsidy strategies is highly dependent on the spatial heterogeneity of regional resource endowments and transportation conditions. In areas with high waste density and high road tortuosity degree (Scenario I), manufacturers face significant transportation and disposal cost pressures. Targeted government subsidies can effectively reduce marginal costs, provide incentives for manufacturers to scale up recycling, and promote the coordinated construction of transportation infrastructure, thereby achieving significant increases in social welfare. In contrast, in areas with high waste density but good road conditions (Scenario II), farmers become the key players in waste collection by virtue of their low transportation cost advantage. Government tonnage subsidies or equipment support can directly stimulate the enthusiasm of farmers to participate and maximize the growth of social welfare. For low-density regions with scattered waste distribution and complex terrain (Scenario III), the strategy of subsidizing farmers can alleviate the problem of diseconomies of scale and maintain the stability of waste recycling through layout optimization of village-level collection nodes. In contrast, in low-density, low-road tortuosity areas (Scenario IV), the marginal incentive effect of subsidies is limited due to the lack of scale effects coexisting with the advantages of low transportation costs, so the necessity of policy intervention is low.
Further analysis shows that the selection of government subsidies needs to be closely aligned with regional characteristics. For high-density agricultural agglomeration areas, the large-scale processing capacity of manufacturing enterprises is at the core of improving resource utilization efficiency and subsidy policies should assign priority to supporting enterprise technology upgrading and logistics network optimization. In areas dominated by decentralized farming, farmers are the main body of waste recycling, and their economic incentives and collection convenience directly determine the operational efficiency of the supply chain. Governments can compensate for the cost disadvantages of small-scale collection through targeted subsidies. In addition, road conditions, as a key geographic variable, not only affect transportation costs but also interact with subsidy policies. Infrastructure investment in high-road tortuosity areas can amplify the synergistic benefits of subsidies for manufacturing enterprises, while in low-road tortuosity areas, policy potential needs to be realized by optimizing farmer–enterprise collaboration mechanisms.
This study has important implications for the development of livestock and poultry waste management policies. First, policy design should abandon the “one-size-fits-all” mentality and build a differentiated subsidy framework based on regional farming densities and topographic features. Second, it is necessary to pay attention to the dynamic balance between subsidy policies and market mechanisms. Excessive intervention in low-density and low-tortuosity areas may lead to resource waste, while relying on market regulation can stimulate the autonomy of the main body. Third, long-term improvement in social welfare depends on the multi-dimensional collaboration of “policy–facilities–technology”; for example, optimizing the information connection between farmers and enterprises through digital platforms or building regional waste resource utilization alliances to strengthen the resilience of the industrial chain.
6.2. Deficiencies and Prospects
This paper considers a raw material recycling–organic fertilizer production supply chain consisting of farmers and organic fertilizer manufacturing enterprises. Also, the changes in purchase amount, purchase prices, the revenues of each party, and the overall welfare of society under different government subsidy policies for both farmers and manufacturing enterprises are all thoroughly examined. Similar to the research by Yang, Dai, and Zhang [
44] on government subsidies to farmers or retailers, this study focuses on government subsidies to the organic fertilizer production supply chain for either farmers or manufacturing enterprises. However, unlike the studies by Zhao and Zheng [
45] and Ling et al. [
46], this paper does not fully consider the complex situation where the government may provide mixed subsidies to both parties. In contrast to the studies by He et al. [
47] and Kang, Wang, and Luan [
48], which took into account the cost-sharing aspect, our research did not consider the possibility of both farmers and manufacturing enterprises jointly bearing the transportation costs of livestock waste. Although most studies on government subsidies for livestock and poultry waste recycling have focused on studying the mechanisms of government subsidies, rewards, and penalties through game theory [
13,
36,
49], the influencing factors on farmers’ resourceful use of waste [
3,
11,
50], etc., this paper pays special attention to the effects of the density of agricultural waste and the degree of tortuosity of the transportation roads on the government’s subsidy policy. Through numerical simulation combined with specific case data, we analyzed the subsidy forms that the government should adopt under different waste density and road conditions, drew relevant conclusions, and extended existing research. Several studies have also shown [
51,
52,
53,
54] that in the real situation, price, cost, and other factors also have an important impact on the government’s choice of subsidy strategy. Corresponding to this study, how purchase prices and transportation costs affect the actual effects of government subsidy strategies is a topic that deserves further in-depth research. Due to space constraints, this paper could not explore these factors in depth. Therefore, future research can expand the analysis of these factors and thus provide additional theoretical support and practical guidance for government formulation of more precise and effective subsidy policies.


