Abstract
The system subject, resilience capacity, and factor endowment are the core elements of resilient city construction. A rational assessment of urban resilience is crucial for transforming the urban governance paradigm. This study develops an analytical framework for resilient city system (RCS) grounded in the conceptual connotation and constituent elements of urban resilience. Using the strategically significant Chengdu–Chongqing Economic Circle (CCEC) as a case study, an urban resilience (UR) index system was proposed, encompassing economics, society, ecology, infrastructure, and organizational management. A panel dataset of urban resilience indicators was compiled using official data from national and local urban statistical yearbooks spanning 2012 to 2022. By analyzing the spatiotemporal evolution patterns of the CCEC, this study revealed the dominant factors influencing these patterns and dynamically simulated the urban resilience of the CCEC over the next 16 years. The findings indicate the following: (1) During 2012–2022, the urban resilience of the CCEC transitioned from a “single-core” model centered on Chongqing to a “dual-core” model featuring both Chongqing and Chengdu. The overall level of urban resilience in the study area exhibited an upward trend, characterized by a spatially divergent pattern with two prominent wings and a concave center. (2) Economic factors, social factors, and facility factors were identified as the dominant factors affecting urban resilience in the CCEC. (3) Projections for 2025–2035 suggest that the urban resilience level of the CCEC will continue to increase steadily at a moderate pace. These results provide valuable theoretical references for advancing the high-quality development of the CCEC and fostering a development pattern characterized by “two-wing drive and whole-area synergy”.
1. Introduction
As complex socioeconomic–ecological mega-systems, urban safety faces significant challenges stemming from the dual impact of natural disasters and human-induced stressors [1]. Enhancing cities’ capacity to withstand external uncertainties has become a critical priority for ensuring urban stability and sustainable development. Within the framework of sustainable urban development and territorial planning, urban resilience has emerged as both a frontier issue and a key research focus in recent years [2]. China’s 14th Five-Year Plan and the 20th National Congress Report of the Communist Party of China (CPC) explicitly emphasize resilient city development. Furthermore, the latest rounds of urban spatial planning in Beijing and Shanghai have underscored the importance of “enhancing urban resilience”. Given the Chengdu–Chongqing Economic Circle (CCEC)’s strategic role as a pivotal growth pole for China’s socioeconomic development, strengthening urban dynamic adaptive capacities is essential. To promote the establishment of resilient, livable, green, and healthy cities, it is crucial to investigate urban resilience in the CCEC from the perspectives of spatiotemporal evolution and dynamic prediction while systematically identifying the influencing factors.
The theoretical development of urban resilience research has undergone a paradigmatic shift from singular disaster mitigation to complex system adaptation. “Resilience” originally referred to the ability of an engineering object to return to its original state after being subjected to external forces, also known as “engineering resilience” [3]. Holling, a Canadian ecologist, pioneered the application of the concept of “resilience” to ecology, defining it as the capacity of ecosystems to spontaneously reorganize and maintain their functionality after environmental perturbations, i.e., ecological resilience [4]. Subsequent interdisciplinary expansion extended resilience studies from natural systems to human-dominated ecosystems. Internationally, scholars have mainly focused on constructing urban resilience theoretical frameworks [5,6], assessing urban resilience and post-disaster recovery [7,8], exploring the impact mechanisms and enhancement pathways of urban resilience [9,10], and developing an increasingly refined “economic-social-ecological-infrastructure” multidimensional urban resilience evaluation framework [11,12]. In contrast, Chinese scholars tend to emphasize theoretical reviews of urban resilience [13,14], quantitative assessments of urban resilience [15,16], and analyses of spatiotemporal evolution characteristics and influencing factors [17,18,19]. The majority of the aforementioned studies focus on the “social-economic-ecological-engineering” urban resilience assessment framework, comprehensively considering the influence of economic development, social environment, ecological conditions, and infrastructure on urban sustainable development [13,14,15,16,17,18,19]. While these studies emphasize the integration of China’s urbanization characteristics—such as Shao et al. [20], who incorporate local indicators like community participation and emergency response speed—they still neglect the interaction mechanisms between human and environmental systems [21]. Additionally, insufficient attention is given to the proactive role of urban stakeholders, including residents and communities, in decision-making processes. The components of urban resilience and the construction of a comprehensive analytical framework remain underinvestigated. Therefore, while maintaining the basic framework of urban resilience research, this study analyzes the main components of resilient cities based on existing urban resilience concepts [14,22,23] and integrates Complex Adaptive System (CAS) theory [24] to propose a “Factor Endowment-System Subject-Resilience Capacity” framework. On the other hand, under the current trend of regional synergistic development, the scope of urban resilience research has expanded to encompass large-scale regions such as entire countries [25,26,27], urban agglomerations [28,29,30], provinces [31,32], and municipalities [33,34], as well as small-scale regions such as counties [35] and communities [36]. This expansion aims to optimize the pathways for synergistic regional development. The CCEC, as a critical driver for promoting high-quality development in western China, requires an assessment and prediction of its urban resilience. Given that the concept of resilient cities has been integrated into national strategic planning, this evaluation is essential to enhance the city’s capacity to withstand polymorphic risks and improve its disaster prevention, adaptation, and recovery capabilities. Meanwhile, existing studies have predominantly focused on static horizontal comparisons of urban resilience measurement and influencing factors as well as the coupled and coordinated relationship between urban resilience and new-type urbanization. However, there remains a relative deficiency in longitudinal and dynamic analyses from a long-term developmental perspective.
In view of this, to promote the healthy and sustainable development of the CCEC urban agglomeration, this study constructs a five-dimensional urban resilience evaluation index system oriented toward “economics-society-ecology-infrastructure-organizational management” based on the resilient city system framework of “Factor Endowment-System Subject-Resilience Capacity”. By utilizing a combination of methods including the gray prediction model, entropy weight–TOPSIS evaluation model, and GIS spatial analysis, this study scientifically assesses the urban resilience of the CCEC. The aim is to provide an optimized pathway for high-quality, synergistic urban development and the construction of resilient cities.
2. Construction of Research Framework
2.1. Study Area
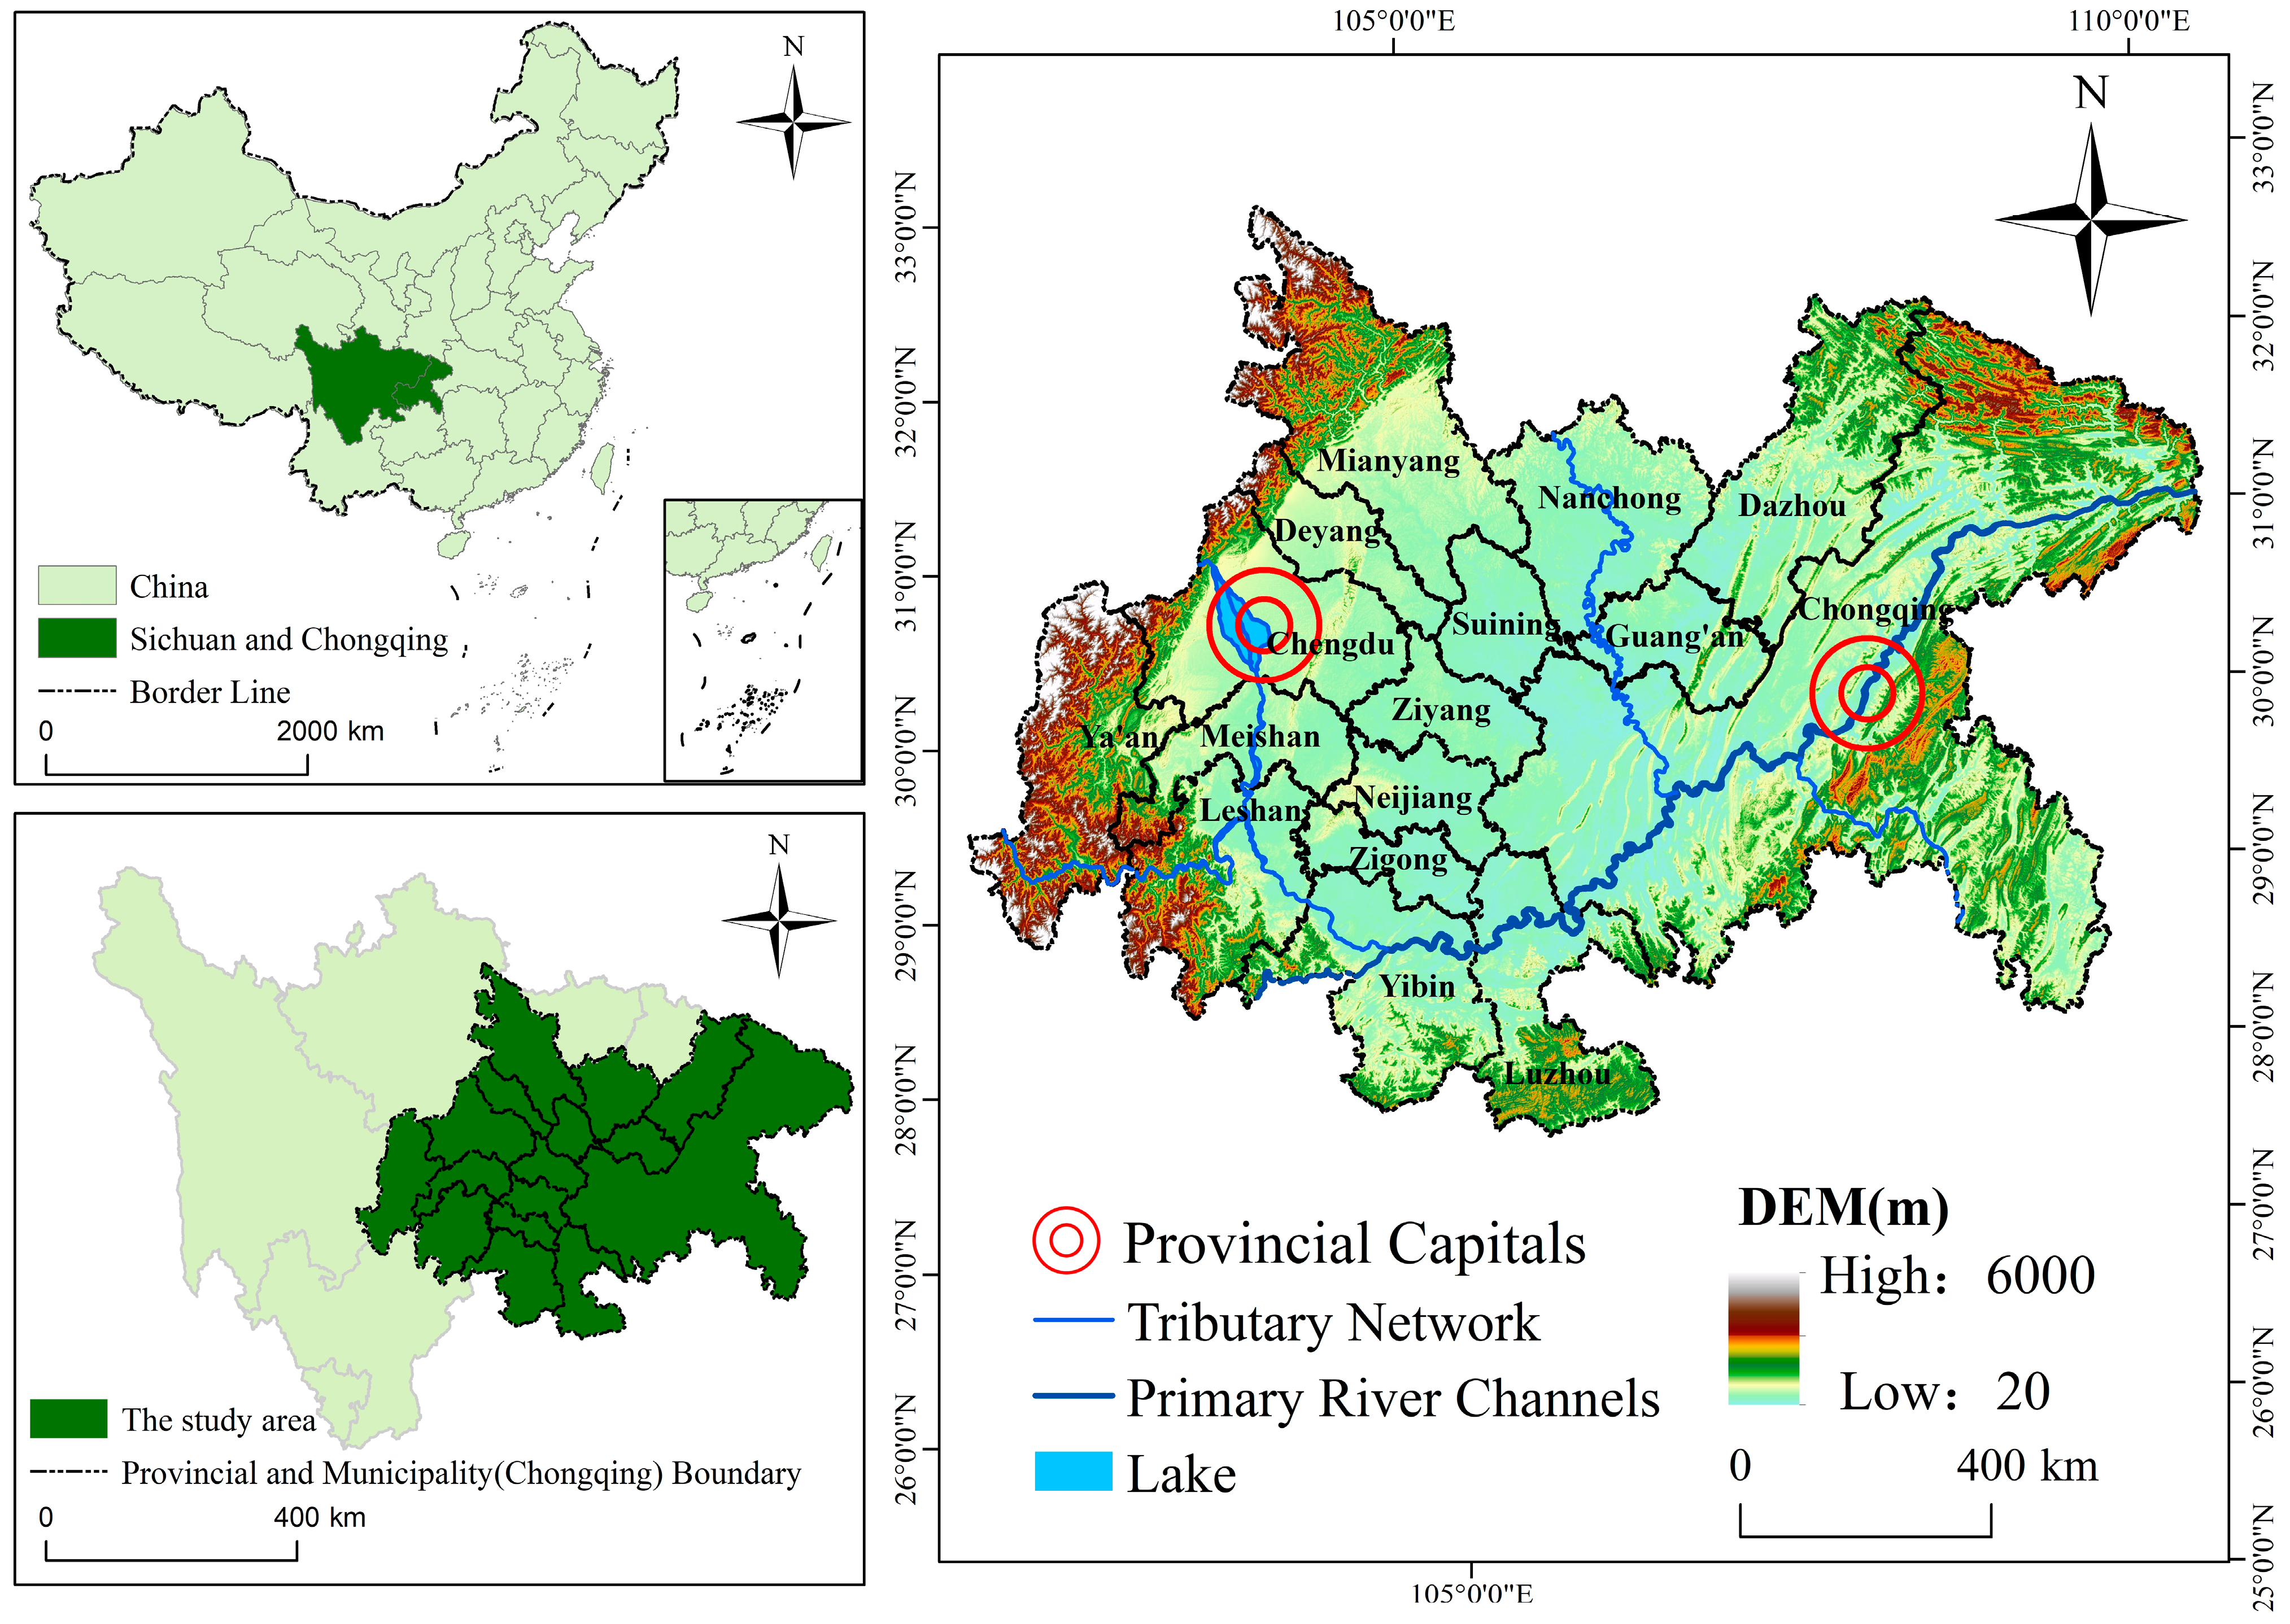
The CCEC is situated at the intersection of the “Belt and Road” initiative and the Yangtze River Economic Belt. Covering a total area of 185,000 km2, the CCEC includes Chongqing Municipality and 15 cities in Sichuan Province, such as Chengdu (Figure 1) [37]. Given that this paper focuses on urban resilience, which is categorized according to the “Statistical Yearbook of Urban Construction of China”, we treat “Chongqing” as an independent urban unit for analysis. The study area is located in the southwest region, one of China’s seven major natural geographic divisions. This region experiences an average annual rainfall of 1000 to 1300 mm, with uneven seasonal distribution, leading to frequent droughts and floods. The topography of the study area, characterized by mountains, hills, and plains, is complex and diverse, making it prone to natural disasters such as floods, mudslides, and earthquakes [38].
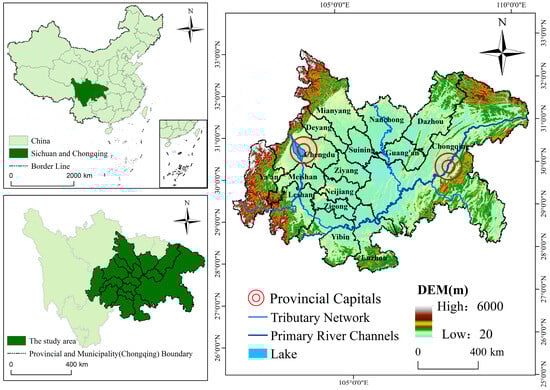
Figure 1.
Study area. The map is produced based on the standard map with review number GS (2022) 1873 downloaded from the website of the Standard Map Service of the Ministry of Natural Resources, and there is no modification of the boundaries of the base map shown.
2.2. Components of Urban Resilience
The concept of urban resilience lacks a uniform definition. Scholars and organizations define urban resilience differently depending on their specific research focuses [14,22,23]. A resilient urban system is an interdependent network where humans and the environment jointly resist multiple risks to achieve sustainable development. This concept emphasizes the active participation and collaboration of various system actors, including residents, enterprises, governments, communities, and non-profit organizations (NPOs), in addressing both chronic stresses and acute shocks originating from external sources. Furthermore, it highlights the urban system’s capacity to maintain structural and functional homeostasis while adapting to, recovering from, and learning from disturbances.
Complex Adaptive System (CAS) theory posits [39] that system evolution is driven by interactions among adaptive subjects and between subjects and their environment. Through continuous interactions governed by stimulus–response mechanisms, systems progressively optimize their structures, functions, and behavioral patterns to adapt to environmental and inter-agent dynamics. The theory underscores the importance of an agent’s adaptability in promptly responding to external environment changes as well as the dynamic nature of accumulating experience through interactions and modifying behavioral patterns. It emphasizes that the primary driver of system evolution lies in the interaction between the agents and the environment as well as the interactions among various agents. Regarding the concept of urban resilience, it can be observed that a resilient urban system emphasizes its dynamic adjustment mechanism, enabling the urban system to cope with multiple disturbances while maintaining the city’s sustainable development across economic, social, ecological, infrastructural, and organizational management dimensions. Significant emphasis is placed on the joint participation, collaboration, and strategic deployment of system actors to achieve cross-scalar dynamic interaction cycles and foster system innovation breakthroughs.
As a result, a resilient city system should comprise four principal elements [39], based on the connotation of resilient city systems and the key principles of CAS theory.
- Subjectivity: the capacity of government, enterprises, communities, residents, NPOs, and other system actors to address, learn from, adapt to, and regenerate in response to environmental changes.
- Diversity: urban infrastructure for water supply and drainage, transportation, flood control, communication, and epidemic prevention should be planned and constructed according to the standards of networked, distributed, and parallel connectivity.
- Autonomy: the ability of various actors and urban units within the city to interconnect, thereby enabling them to prevent, mitigate, and respond to disasters effectively.
- Appropriate redundancy: urban infrastructure construction should incorporate adequate buffer space to enhance resilience by preventing, mitigating, and responding to disasters through the interconnectedness of various actors and urban units.
2.3. Evaluation Model of a Resilient City System (RCS)
While conventional assessment frameworks for resilient city systems emphasize infrastructure resilience, they often neglect the effective integration of infrastructure resilience with governmental and societal emergency response. Professor Fan, an academician at Tsinghua University, developed a triangular model of the public security system by synthesizing representative theoretical perspectives [40], indicator systems, and practical cases related to resilience and resilient cities. This model integrates three core components—“emergencies”, “carriers”, and “emergency management”—thereby establishing both theoretical foundations and practical pathways for systematically enhancing urban resilience. Furthermore, through practical validation, this model enriches the connotation of urban resilience, positioning the triangular model of the public security system as one of the key paradigms in global resilient city research.
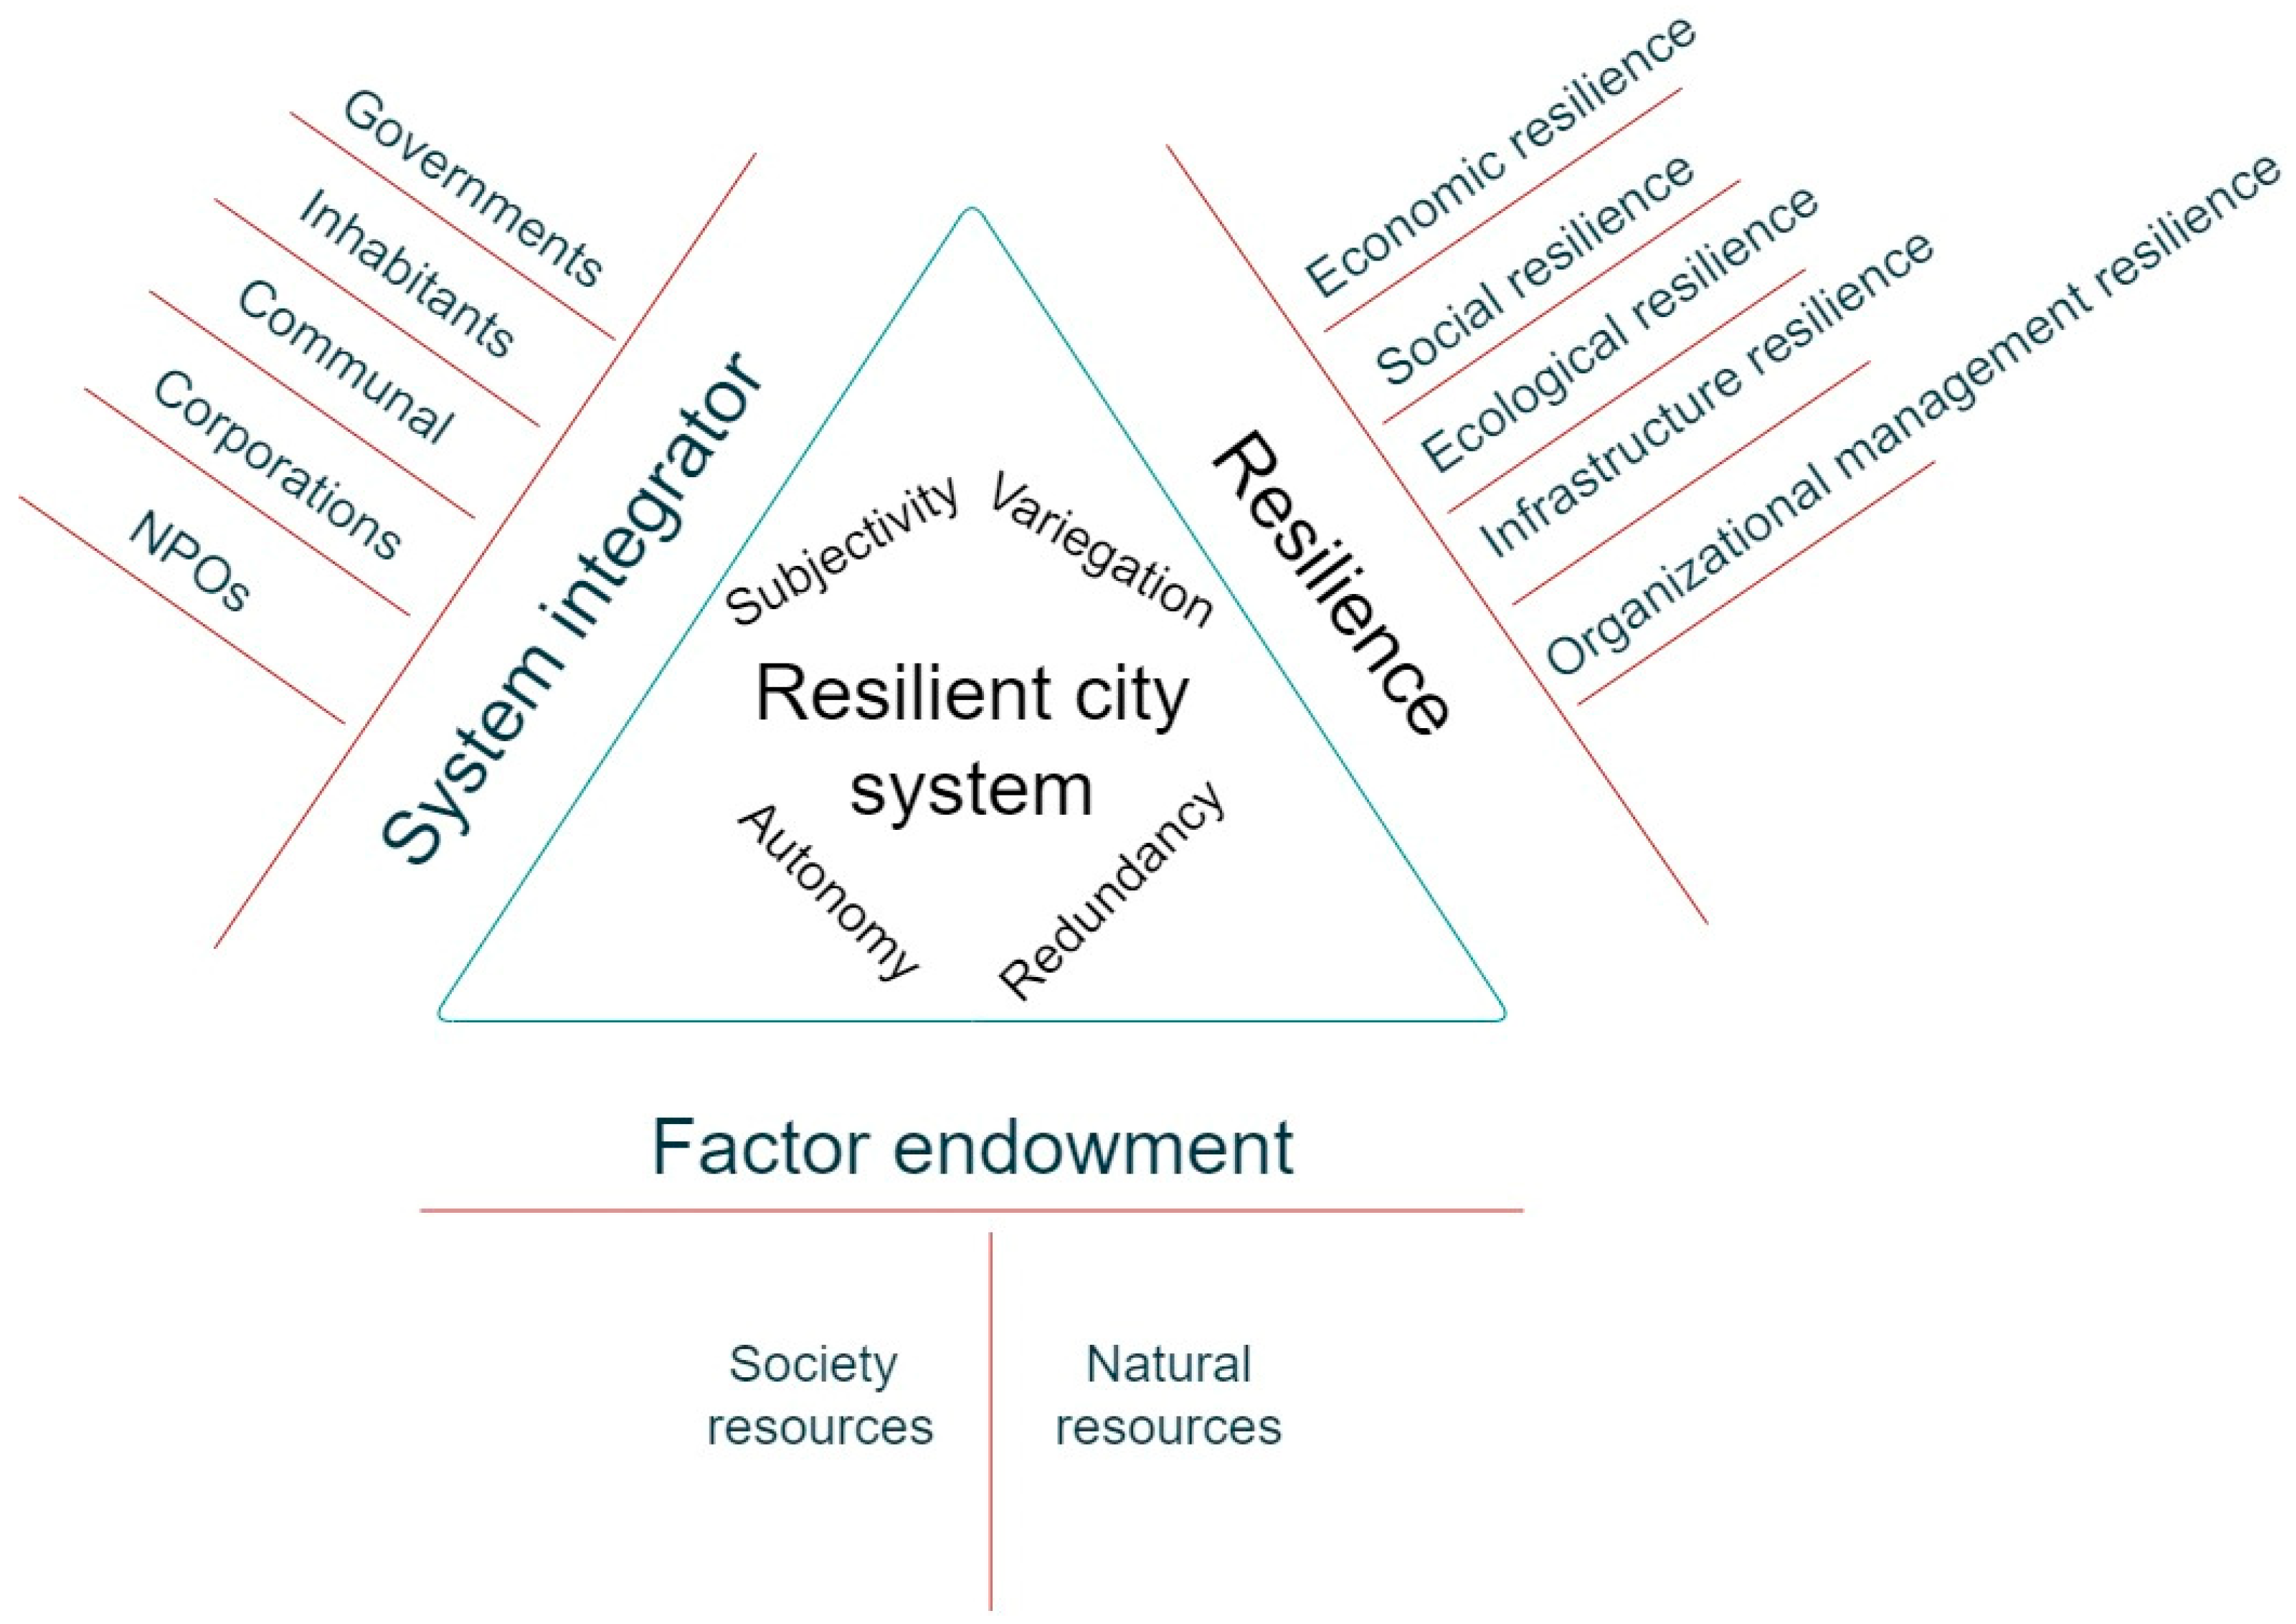
Building upon the constituents of urban resilience and the tripartite public safety framework, we developed an evaluation model for resilient city systems (Figure 2). Compared with the international mainstream frameworks, this model places greater emphasis on integrating infrastructure resilience with the emergency response capabilities of resilient system actors, making it well suited for the urban resilience assessment and cross-regional collaborative governance in the context of rapid urbanization within the CCEC.
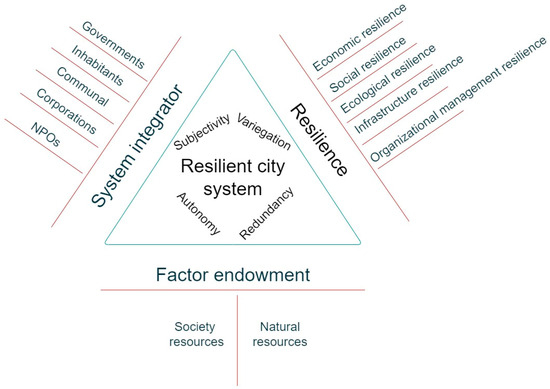
Figure 2.
Evaluation model of a resilient city system (RCS).
2.4. Structure of a Resilient City System (RCS)
The evaluation framework reveals that a resilient city system (RCS) consists of three core components: system integrator, resilience capacity, and factor endowment. The relationship among these components, as well as their intrinsic linkages and mechanisms of action, are illustrated in Figure 3.
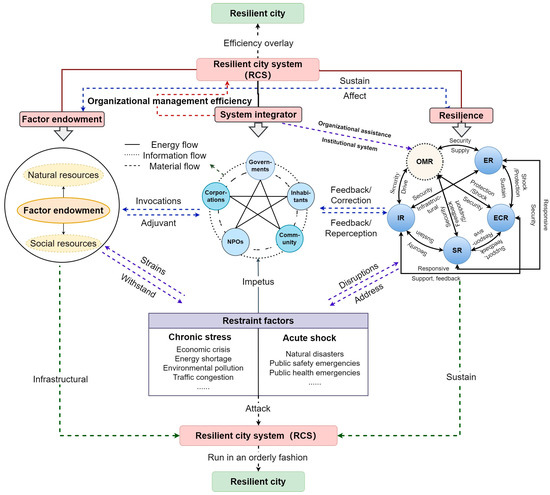
Figure 3.
Structure of a resilient city system (RCS).
As shown in the figure, natural resources and social resources constitute the factor endowments of the RCS, providing development space, and material and non-material foundations for resilient cities. These resources are subject to multiple disturbances and exhibit direct resistance to risky perturbations, thereby serving as critical enablers for sustaining the operational vitality of resilient cities.
Urban resilience capacity represents the integrated response of all elements within a resilient city system, functioning as the dynamic mechanism that ensures systemic operations and drives urban innovative transformation. This capacity reflects a city’s ability to cope with various disturbances and is operationally manifested through five key dimensions: economic robustness, social adaptability, ecological sustainability, infrastructure redundancy, and institutional resilience.
(1) Economic resilience (ER) serves as both the foundation and driving force for urban economic systems to withstand risky perturbations and maintain normal urban operations. Within the comprehensive security framework of urban disaster prevention, mitigation, and relief, robust economic resilience provides a stable economic environment and ensures financial security.
(2) Social resilience (SR) is grounded in population health and well-being and focuses on evaluating the fundamental level of social development. When a city responds to pressures arising from changes in the social environment, it demonstrates a capacity for ensuring security and fostering developmental potential, thereby facilitating the smooth functioning of the economy.
(3) Ecological resilience (ECR) is a critical factor characterizing the sustainable development of urban ecosystems. It supports the normal operation of economic, social, and infrastructure resilience while providing positive resources and environmental responses to enhance resilient cities.
(4) Infrastructure resilience (IR) refers to the ability of the infrastructure to ensure social development and sustain productive life. The higher the degree of infrastructure improvement, the more effectively it can provide the necessary information and materials for social development in a timely manner.
(5) Organizational management resilience (OMR) emphasizes the decision-making and operational capacities of urban actors (government, corporations, residents, and NPOs) in addressing the dynamics of social development. This plays a crucial role in enhancing urban resilience and facilitating sustainable urban transitions.
Governmental decision making plays a pivotal role in urban development processes, encompassing comprehensive considerations of livelihood issues such as education, employment, retirement, and ecological conservation. The accuracy of resilience positioning, rationality of governance protocols, agility of emergency responses, and efficacy of policy implementation collectively influence the likelihood of achieving urban resilience [14]. Simultaneously, the involvement of other urban actors in decision-making processes supports the government in enhancing system development. A well-designed institutional framework and efficient organizational collaboration can improve the efficiency of urban emergency response mechanisms and minimize risk-related losses.
Governments, corporations, communities, residents, and NPOs serve as both the organizational managers of resilient cities and the system actors within the RCS. The influence of perturbing factors such as chronic stresses and acute shocks prompts urban actors to reflect on or anticipate the deficiencies and challenges present in resilient urban systems, ultimately feeding back into the refinement of these systems. Organizational management efficiency directly impacts the planning, construction, and operation of resilient cities, reflecting a city’s capacity to address urban risks in a timely and effective manner.
Finally, a resilient city is established through the effective functioning of system actors, factor endowments, and resilience capabilities within the RCS.
3. Indicator System Construction
The RCS is a highly intricate coupled human–environment system comprising two primary subsystems: the human subsystem and the environmental subsystem. The environmental subsystem encompasses various elements such as economic, social, ecological, infrastructure, and others, while the human subsystem is centered on human factors and includes human subjective consciousness and behavioral capabilities. The resilience of the human–environmental system is reflected through connectivity, dynamic mechanisms, and mutual feedback within the system [41].
Based on the aforementioned analysis of the RCS, and drawing upon existing domestic and international research findings as well as the Chinese national standard “Resilient City Safety Evaluation Guidelines” (GB/T 40947-2021), 27 evaluation indicators (Table 1) were selected across 5 dimensions—social, economic, ecological, infrastructure, and organization and management—to comprehensively reflect the resilience characteristics of the CCEC.

Table 1.
Urban resilience evaluation index system.
The system achieves a balance between universality and territoriality in the selection of indicators. Universality is demonstrated through the alignment of Chinese resilient city standards with the international research consensus. Territoriality is ensured by integrating the national strategic orientation of the CCEC, while OMR is measured independently to offer more precise recommendations for the subsequent optimization and enhancement of resilient city construction. Consequently, the indicator system can serve as a reference framework for cross-regional studies, contingent upon optimizing the indicators based on regional contexts or supplementing them with locally relevant indicators.
Indicators were selected to comprehensively assess the urban resilience of the CCEC from five interconnected dimensions, as follows:
- (1)
- ER: Comprehensive support for the city’s resilience to risks
The economic resilience of the CCEC is evaluated through five dimensions: economic volume, growth speed, consumption stimulation, emergency preparedness, and economic structure. These dimensions are interconnected through their dynamic equilibrium and synergistic effects. Specifically, economic volume provides the foundation for structural optimization, which in turn accelerates development. Sustained high growth stimulates consumption vitality, thereby enhancing fiscal capacity. Adequate fiscal resources ensure effective emergency response, while robust emergency capabilities stabilize the economic volume.
- Economic volume: GDP per capita (X1) reflects the total economic output of the region and the income level of its residents and serves as the core indicator of the economic base.
- Growth speed: Tertiary sector as a share of GDP (X5) indicates the speed of economic structural optimization and directly influences long-term development potential.
- Consumption stimulation: Urban disposable income per capita (X3) and total retail sales of consumer goods (X12) links to analyze the vitality of consumption and assess the ability to drive domestic demand.
- Emergency preparedness: General budget revenue from local finances (X4) is a critical resource for addressing economic shocks, and its absence would weaken emergency response capacity.
- Economic structure: Number of industrial enterprise units above a designated size (X2) is linked to economic diversification, and reliance on a single industry will significantly reduce economic resilience.
- (2)
- SR: Safeguarding people’s lives and urban stability
- The social resilience of the CCEC is evaluated through five key indicators: healthcare, employment, urban scale, education, and residential consumption vitality. The interconnections among these factors hinge on the synergy between human capital development and public service provision. Specifically, investments in education enhance workforce quality, thereby promoting employment structure optimization. Stable employment ensures sustained consumption capacity, while vibrant consumption activity generates new job opportunities. Enhanced consumption vitality increases tax revenues, enabling further investments in education and healthcare systems. High-quality healthcare and education systems attract population agglomeration (thereby elevating urbanization rates), and the resulting economies of scale reduce the costs of public service delivery.
- Medical care level: The number of beds in health facilities (X7) directly determines the ability to respond to public health emergencies and serves as a fundamental guarantee for life safety.
- Employment structure: The share of urban registered unemployed in the total population (X8), as a negative indicator, reflects the degree of social stability; an excessively high unemployment rate exacerbates social vulnerability. The percentage of employees in the tertiary sector (X9) reflects economic dynamism and employment absorption capacity. Together, these two indicators provide a more objective assessment of the regional employment structure.
- Urbanization scale: Population density (X11), natural population growth rate (X13), and the urbanization rate of the resident population (X14) jointly influence resource allocation efficiency; both excessively high or low levels may lead to management imbalances.
- Consumption dynamism: Total retail sales of consumer goods (X12) and urban disposable income per capita (X3) together reveal the market’s internal circulation capacity, and their combination provides a more comprehensive evaluation of social dynamism.
- Investment in education: Education expenditure as a share of fiscal expenditure (X10) affects the accumulation of human capital, and long-term neglect weakens social adaptability.
- (3)
- ECR: Maintaining environmental security and sustainability
The ecological resilience of the CCEC is assessed through three core dimensions: environmental security, greening levels, and pollution intensity. The interconnected dynamics of these factors rely on synergistic governance and the maximization of ecological benefits. Specifically, the level of greening acts as the “buffer” of environmental security, the level of pollution represents the “source of threat” to environmental security, and environmental security results from the dynamic balance between greening and pollution control.
- The greening level: The greening ratio of built-up areas (X15) and parkland per capita (X17) together measure the ecological carrying capacity of urban areas.
- Pollution treatment: The non-hazardous domestic waste disposal rate (X18) and centralized sewage treatment rate (X19) reflect the effectiveness of environmental governance. Monitoring only the treatment rates while ignoring municipal wastewater discharges (X20) may lead to an underestimation of ecological pressure. The share of environmental protection expenditure in fiscal expenditure (X16) reflects the government’s ability to support environmental governance financially.
- Pollution level: Municipal wastewater discharges (X20), as a negative indicator, directly reflect environmental risks and potential crises.
- (4)
- IR: Safeguarding the daily and emergency operations of the city
The facility dimension indicators are primarily aligned with residents’ daily needs, emphasizing urban evacuation capacity, resource supply, and resource utilization efficiency. The core of the linkage among these three aspects lies in synergy; resource supply serves as the material basis for evacuation capacity, resource utilization efficiency determines the sustainability of evacuation, and evacuation capacity drives the synergistic upgrading of both resource supply and efficiency.
- Urban evacuation capacity: Road area per capita (X21) reflects the availability of safe passage to safeguard residents during emergencies. Length of urban drainage pipes (X23) reflects the city’s ability to discharge floodwater. Together, these two indicators determine the overall evacuation efficiency and emergency response capacity in disaster scenarios.
- Resource supply: Water penetration rate (X24) and city gas penetration rate (X22) serve as the basic guarantees for sustaining residents’ daily lives.
- Resource utilization efficiency: Daily domestic water consumption per capita (X25), as a negative indicator, can be combined with the supply indicators to comprehensively assess the sustainability of resource management.
- (5)
- OMR: Strengthening urban governance and risk response
The organizational management dimension evaluates the governance capabilities of urban actors (e.g., governments and communities) within the CCEC, particularly their emergency management capacity in responding to urban risks. Management capacity further reflects the ability of urban entities to manage emergencies when the city is exposed to risks. Therefore, indicators are selected based on social security coverage and the staffing levels of public management and social organizations.
- Social security: The number of urban workers enrolled in basic pension insurance at the end of the year (X26) reflects the government’s ability to ensure foundational support and promote long-term social stability.
- Public management: The proportion of public administration and social organization personnel relative to the total population (X27) directly impacts administrative efficiency. Understaffing may weaken the speed or effectiveness of emergency response.
4. Materials and Methods
4.1. Data Sources
The present study utilizes panel data consisting of a total of 27 indicators for 16 cities within the CCEC from 2012 to 2022 (https://doi.org/10.5281/zenodo.14921654). The specific data encompass GDP per capita, the number of large-scale industrial enterprises, urban per capita disposable income, general budget revenue of local finance, the proportion of the tertiary industry in GDP, per capita deposit balances in financial institutions, the number of beds in healthcare facilities, the proportion of registered unemployed individuals in the urban population, urban population density, and other relevant indicators. These data are primarily sourced from the “Statistical Yearbook of China’s Cities (2013–2023)”, the “China Urban Statistical Yearbook (2013–2023)”, and the “Chongqing Statistical Yearbook (2013–2023)”. Meanwhile, data on urban road area per capita, green coverage rate of built-up areas, per capita parks green space area, and drainage pipe density within municipal jurisdictions were obtained from the “China Statistical Yearbook of Urban Construction (2011–2020)”. Missing data were addressed as follows: for certain indicators with available data from 2012 to 2018 but missing values for 2019, the average annual growth rate was used to interpolate the missing data.
4.2. Methodology
4.2.1. Entropy Weight–TOPSIS Evaluation Model
The entropy weight–TOPSIS evaluation model is a widely adopted comprehensive evaluation method that enhances the TOPSIS model by incorporating the entropy weight method. The core principle of this model is to determine the distance between the evaluated object and both the optimal value and the worst value, followed by calculating the proximity of the evaluated object to the ideal solution, thereby enabling the ranking of alternatives based on their performance. This study employs this model to assess the urban resilience of the CCEC. The specific theoretical introduction can be found in the literature [42], and will not be elaborated upon here.
4.2.2. Kernel Density Estimation
As a non-parametric testing method, kernel density estimation avoids biases arising from artificially imposed functional forms and achieves optimal fitting of the data distribution [43]. The formula for kernel density estimation is presented as follows:
where f(s) represents the density function of the random variable s; m denotes the number of observations; si signifies the i-th observation in the sample; represents the mean of the observed values; h indicates the bandwidth; and K(s) is a Gaussian kernel function.
4.2.3. Standard Deviation Ellipse Analysis
The standard deviation ellipse (SDE) method is employed to analyze the spatial distribution patterns of geographic elements. This method characterizes the spatiotemporal patterns of geographic elements through basic parameters such as the center, distribution range, azimuth, long and short axes, and the ratio of the long to short axes. These parameters accurately reveal the overall spatial characteristics of changes in geographic elements, their distribution states, and spatiotemporal evolution features. The detailed formulas are provided in reference [44].
4.2.4. Geographical Detector Model
The geographical detector is widely adopted as a tool to investigate spatial differentiation and its underlying influencing factors, with extensive applications across various fields. In this study, the geographical detector model is employed to identify the primary factors influencing the spatial distribution of UR in the CCEC. The basic principle of the model is as follows [45]:
where h = 1, 2, …; L represents the index classification of variable Y; Y denotes the level of UR; N and Nh indicate the number of detection indicators in layer h and the whole region, respectively; σ2 and denote the variances of the Y values of the layer h and the whole region, respectively. The values of q are within the range [0, 1], with values closer to 1 indicating a stronger influence of the indicator on the UR level.
4.2.5. Gray Prediction Model
The GM (1, 1) model, which is grounded in gray prediction theory, has been widely used in dynamic prediction research [45]. This model is particularly suitable for predicting data characterized by small sample sizes, incomplete time series, and low reliability, as it does not require consideration of the distribution pattern or change trend. Moreover, it is well suited for short- and medium-term forecasting. Therefore, the GM (1, 1) model was selected to predict the UR in the CCEC. The detailed calculation process of the model can be found in reference [46]. To avoid redundancy, only the core formula of the model is presented here, which has the form of
In this equation, a is the parameter we aim to estimate, referred to as the development coefficient, while b is termed the gray action. By employing regression analysis, we can determine a and b, thus enabling the prediction of UR through the numerical solution of the first-order differential equation.
4.2.6. Geostatistical Trend Analysis Method
The trend projection of the UR level values of the 16 study cities in the CCEC from 2025 to 2035 is conducted by projecting data onto the (x, y) plane based on geographic location and onto the z-axis direction based on height. On the (x, y) plane of the city geographic location trend analysis map, vertical bars represent the magnitude of the index value. Points on the (x, z) plane indicate the projection direction of the east–west elasticity value, while points on the (y, z) plane represent the projection direction of the north–south elasticity value. A spatial trend curve is fitted to the projected points obtained from the two planes using a curve [47].
5. Results
This section aims to analyze the spatiotemporal distribution characteristics of urban resilience in the CCEC and elucidate its resilience evolution mechanism.
Firstly, we examine the spatiotemporal differentiation patterns of urban resilience, for example. By employing GIS visual analysis and standard deviation ellipse methods, we depict the distinct features of resilience across three dimensions: volatility (temporal sequence), temporal agglomeration (kernel density), and directionality (migration of the center of gravity) so as to clarify the formation of the polarization pattern.
Secondly, we deconstruct the multi-scale driving mechanisms by leveraging geographic detector models. This model quantitatively isolates the contributions of social, economic, and institutional factors while considering spatial heterogeneity as a constraint, thereby revealing the dominant factors in the differentiation process.
Finally, we focus on the evolutionary pathways for resilience. By embedding dynamic driver contributions into a gray prediction model, we simulate trend surfaces and test spatial asymmetries to elucidate how current drivers will shape the future resilience pattern.
5.1. Characteristics of the Spatiotemporal Evolution of UR
5.1.1. Characteristics of Time-Series Evolution
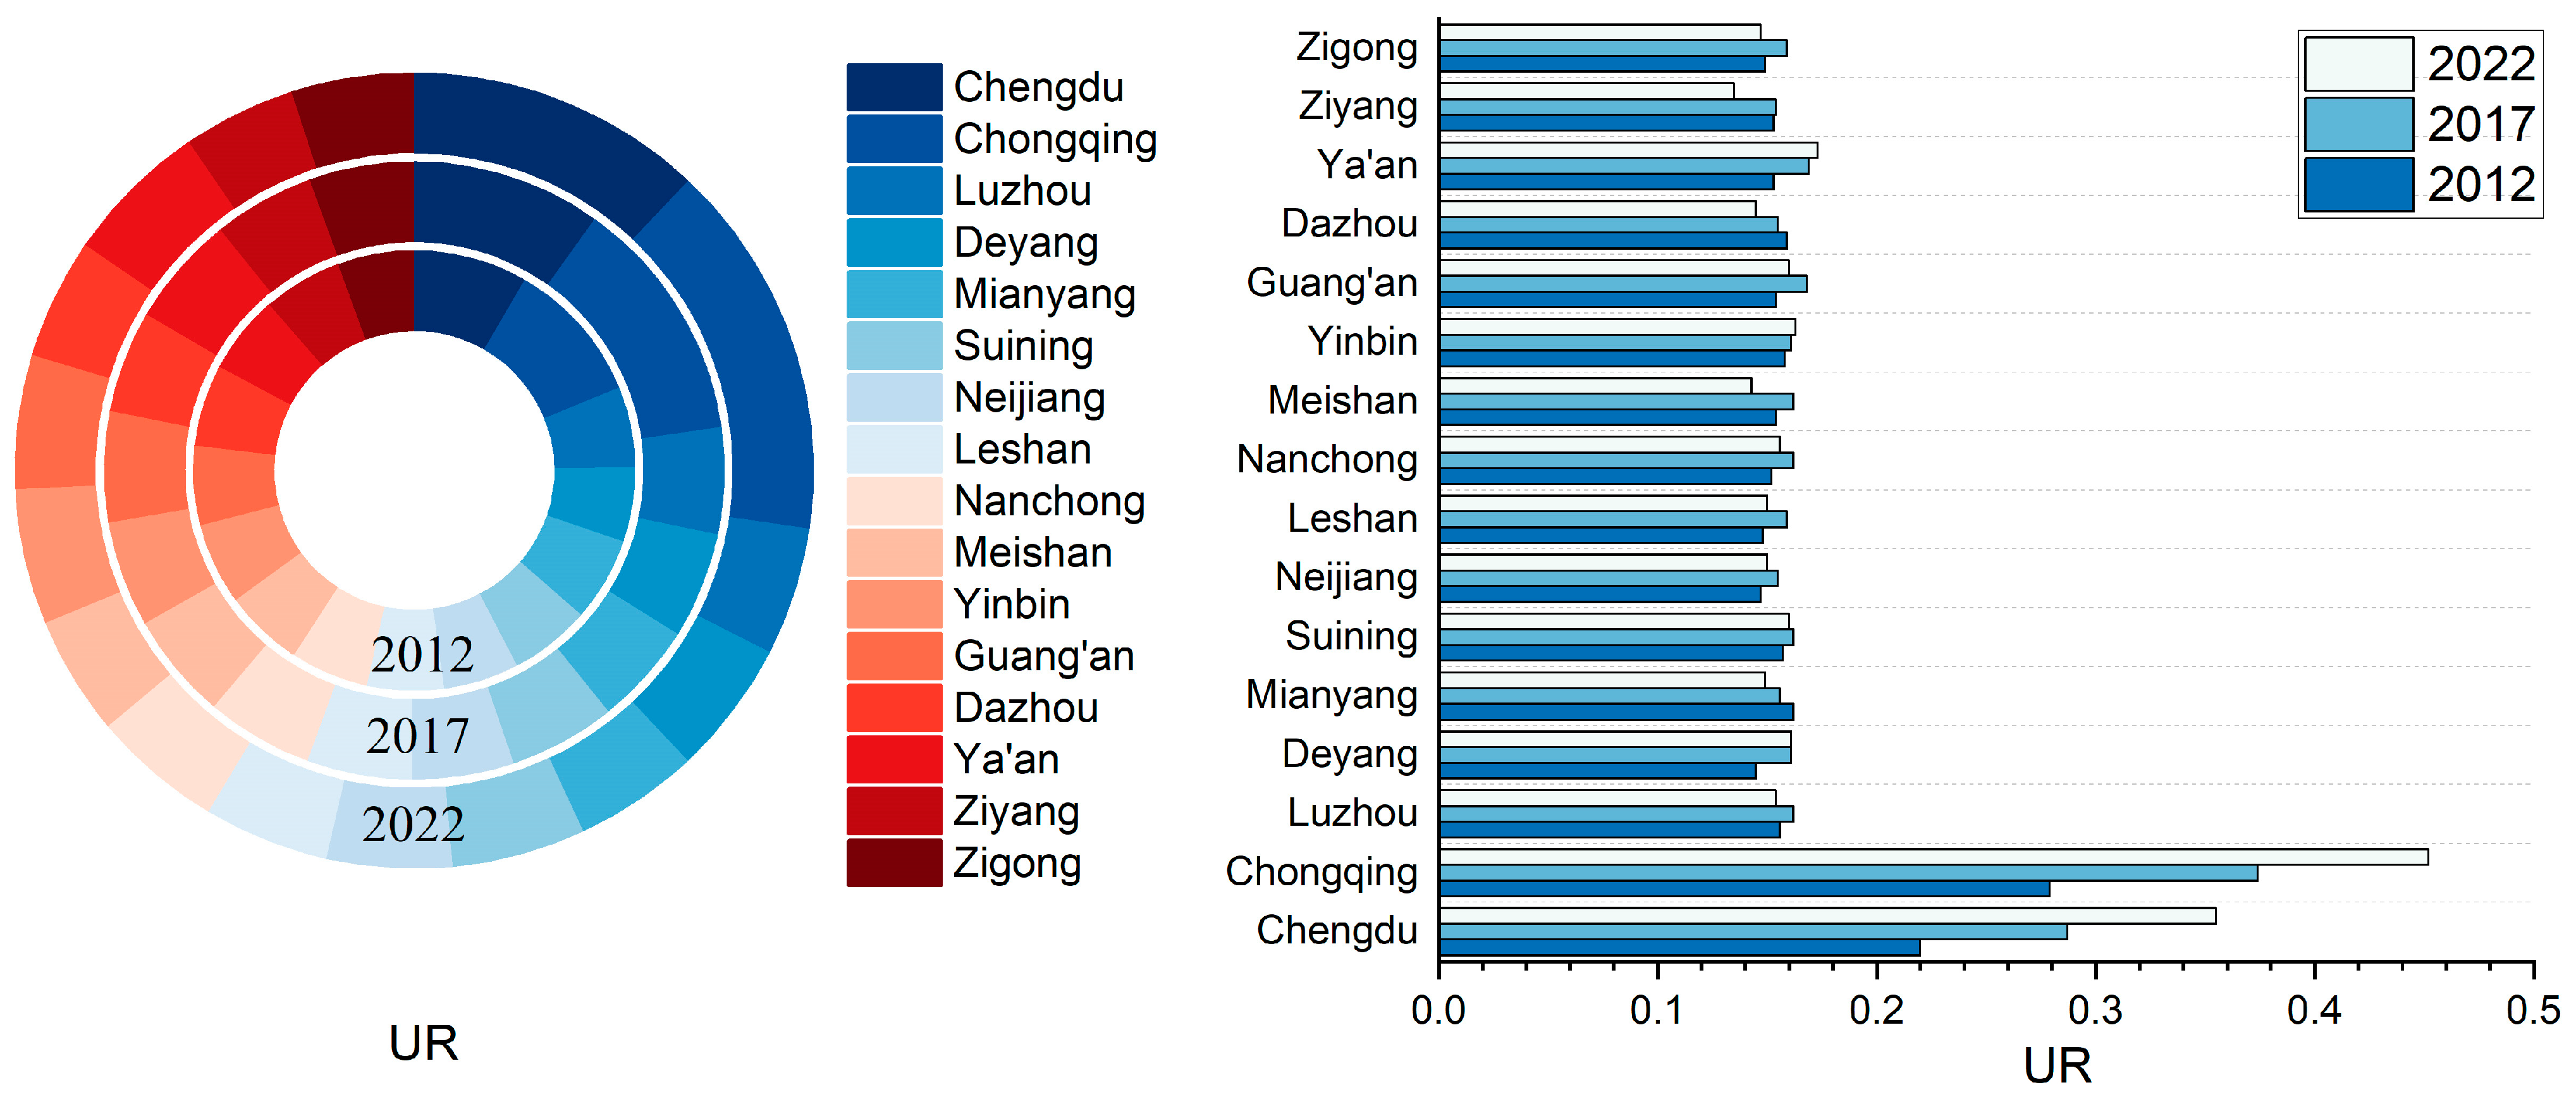
The urban resilience values of the CCEC from 2012 to 2022 were calculated using entropy-weighted TOPSIS, and from the characteristics of the time-series evolution of urban resilience during 2012–2022 (Figure 4), the urban resilience of the study area as a whole shows long-term fluctuations and has synchronicity; the urban resilience centers of Chengdu and Chongqing are prominent, with urban resilience growth being consistent, while the trend of city resilience changes in other regions is more variable.

Figure 4.
Temporal changes in urban resilience in 2012, 2017, and 2022.
During 2012–2017 (Rapid Synergistic Growth Phase), the resilience values of all cities within the CCEC exhibited consistent growth, reflecting a region-wide enhancement of resilience. This trend underscores the catalytic role of integrated regional development strategies in driving infrastructure advancement and economic resilience. In 2017–2022 (Differentiation and Adjustment Phase), a “dual-core” resilience acceleration pattern emerged, with Chongqing, as the center of the CCEC, experiencing a pronounced surge in urban resilience growth. This phenomenon likely correlates with the CCEC (upgraded to a national strategy in 2019) in the strengthening of the positioning of Chongqing, fostering the formation of new growth poles. Meanwhile, other cities generally displayed slower growth or stabilized resilience levels comparable to 2017, with variations in growth trajectories. This divergence may be attributed to the impact of the COVID-19 pandemic outbreak in late 2019. Chongqing and Chengdu, as regions with dense concentrations of population and economic activity, are under greater pressure than other cities to cope with the impact of public health events. However, the fact that their urban resilience has continued to grow indicates that they are better able to withstand and recover from the impact of infrastructure development and organizational and management efficiency.
5.1.2. GIS Visual Analysis of Urban Resilience
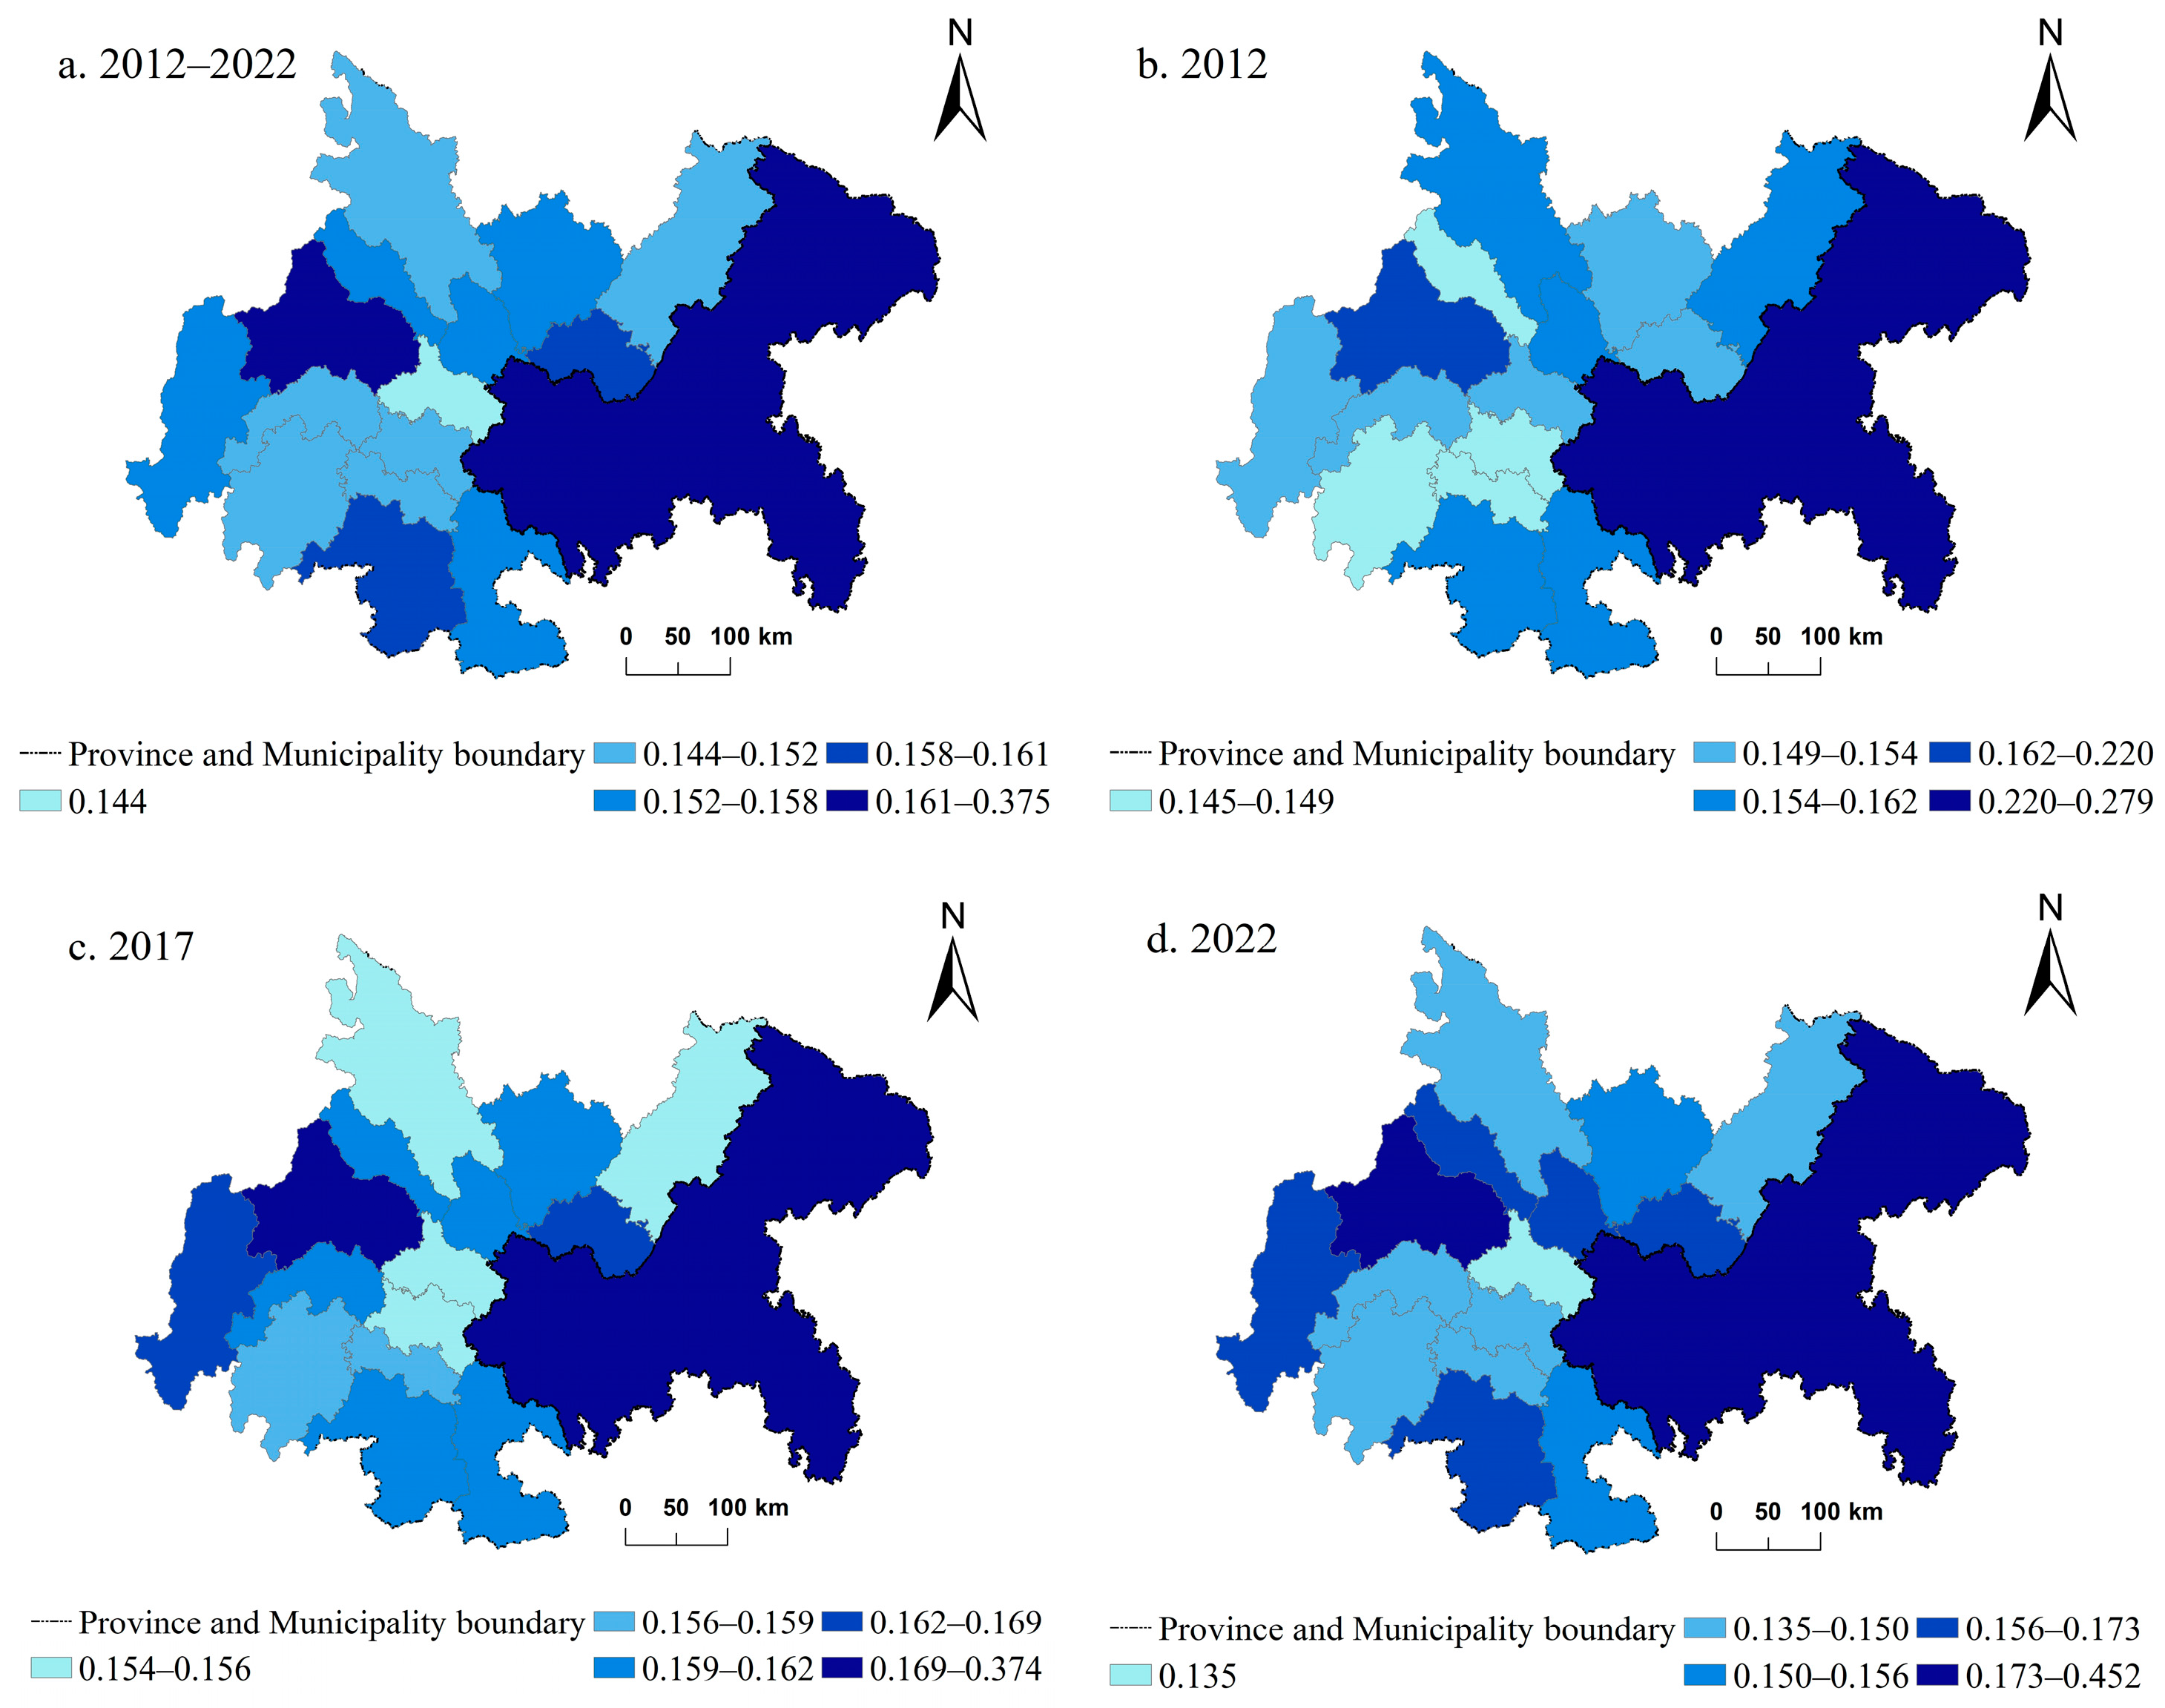
The Jenks natural breakpoints method was employed to categorize the urban resilience values of each region into five classes for the years 2012, 2017, and 2022 (Figure 5).

Figure 5.
Evolution of urban resilience spatial pattern of the CCEC in 2012, 2017, and 2022.
The city resilience values were calculated separately for the 11-year period from 2012 to 2022, as demonstrated by the 11-year average resilience values for each city (Figure 5a). From 2012 to 2022, the urban resilience of the CCEC exhibited a spatial differentiation pattern of “two wings being prominent, with the center being concave”. Specifically, 56.25% of the regions fell into the middle and upper resilience zones, slightly exceeding the proportion of those in the lower resilience zones, and the number of cities in each tier exhibited a more uniform spatial distribution. The average value of urban resilience is the highest at 0.375, and the lowest at 0.144, highlighting significant variations in urban resilience development. In terms of the spatial pattern of urban resilience within the two metropolitan areas under study, the Chongqing metropolitan area demonstrated stronger urban resilience development than the Chengdu metropolitan area over the period from 2012 to 2022, suggesting that Chongqing, as the dual-core city of the CCEC, possesses a greater radiative capacity compared with Chengdu.
From the perspective of the spatial pattern of urban resilience of the two major metropolitan areas in the study area, the radiation-driven role and diffusion effect of the Chongqing metropolitan area on Guang’an tends to increase steadily (Figure 5b–d). The radiative and diffusive effects of the Chengdu metropolitan area on Deyang, Ziyang, and Meishan have fluctuated over an extended period of time. With the exception of Deyang, which has been steadily increasing, the remaining two cities are subject to varying degrees of inhibition, and Deyang, Guang’an, and Suining, the three high-resilience zones of the metropolitan area, have been developed in the form of a belt in a deep east–west direction. Ziyang City, which is geographically closest to Chengdu City and Chongqing Municipality, does not have a high level of urban resilience, and the development of urban resilience is obviously inhibited, indicating that the spatial spillover effect of Chongqing Municipality is greater than that of Chengdu Municipality. This, in turn, indicates that Chengdu Municipality and Chongqing Municipality exert a “siphoning effect” on the neighboring regions. As time progressed, the proportion of higher and highly resilient zones in the CCEC increased from 12.50% in 2012 to 43.75% in 2022, indicating that the resilience capacity of cities in the CCEC is improving rapidly. The data demonstrate that since the promulgation of the Chengdu–Chongqing City Cluster Plan in 2016, the CCEC has achieved relatively rapid development under the strategy, guided by the strategic initiative of establishing an inland open economy strategic highland. The higher resilience area is situated in close proximity to the boundary of the functional area of Chengdu and Chongqing. This suggests that, as the resilience center cities of the CCEC, the cities have a strong ability to resist external disturbances, and their radiation-driven effect on the neighboring cities continues to increase over time, with the diffusion effect becoming increasingly visible.
In conclusion, the CCEC presents the spatial evolution structure of the “Chengdu–Chongqing” twin centers, and the spatial pattern of urban resilience of the “twin cores” with strong centripetal force and the “collapsed area” with weak correlation is further consolidated.
5.1.3. Kernel Density Estimation Analysis
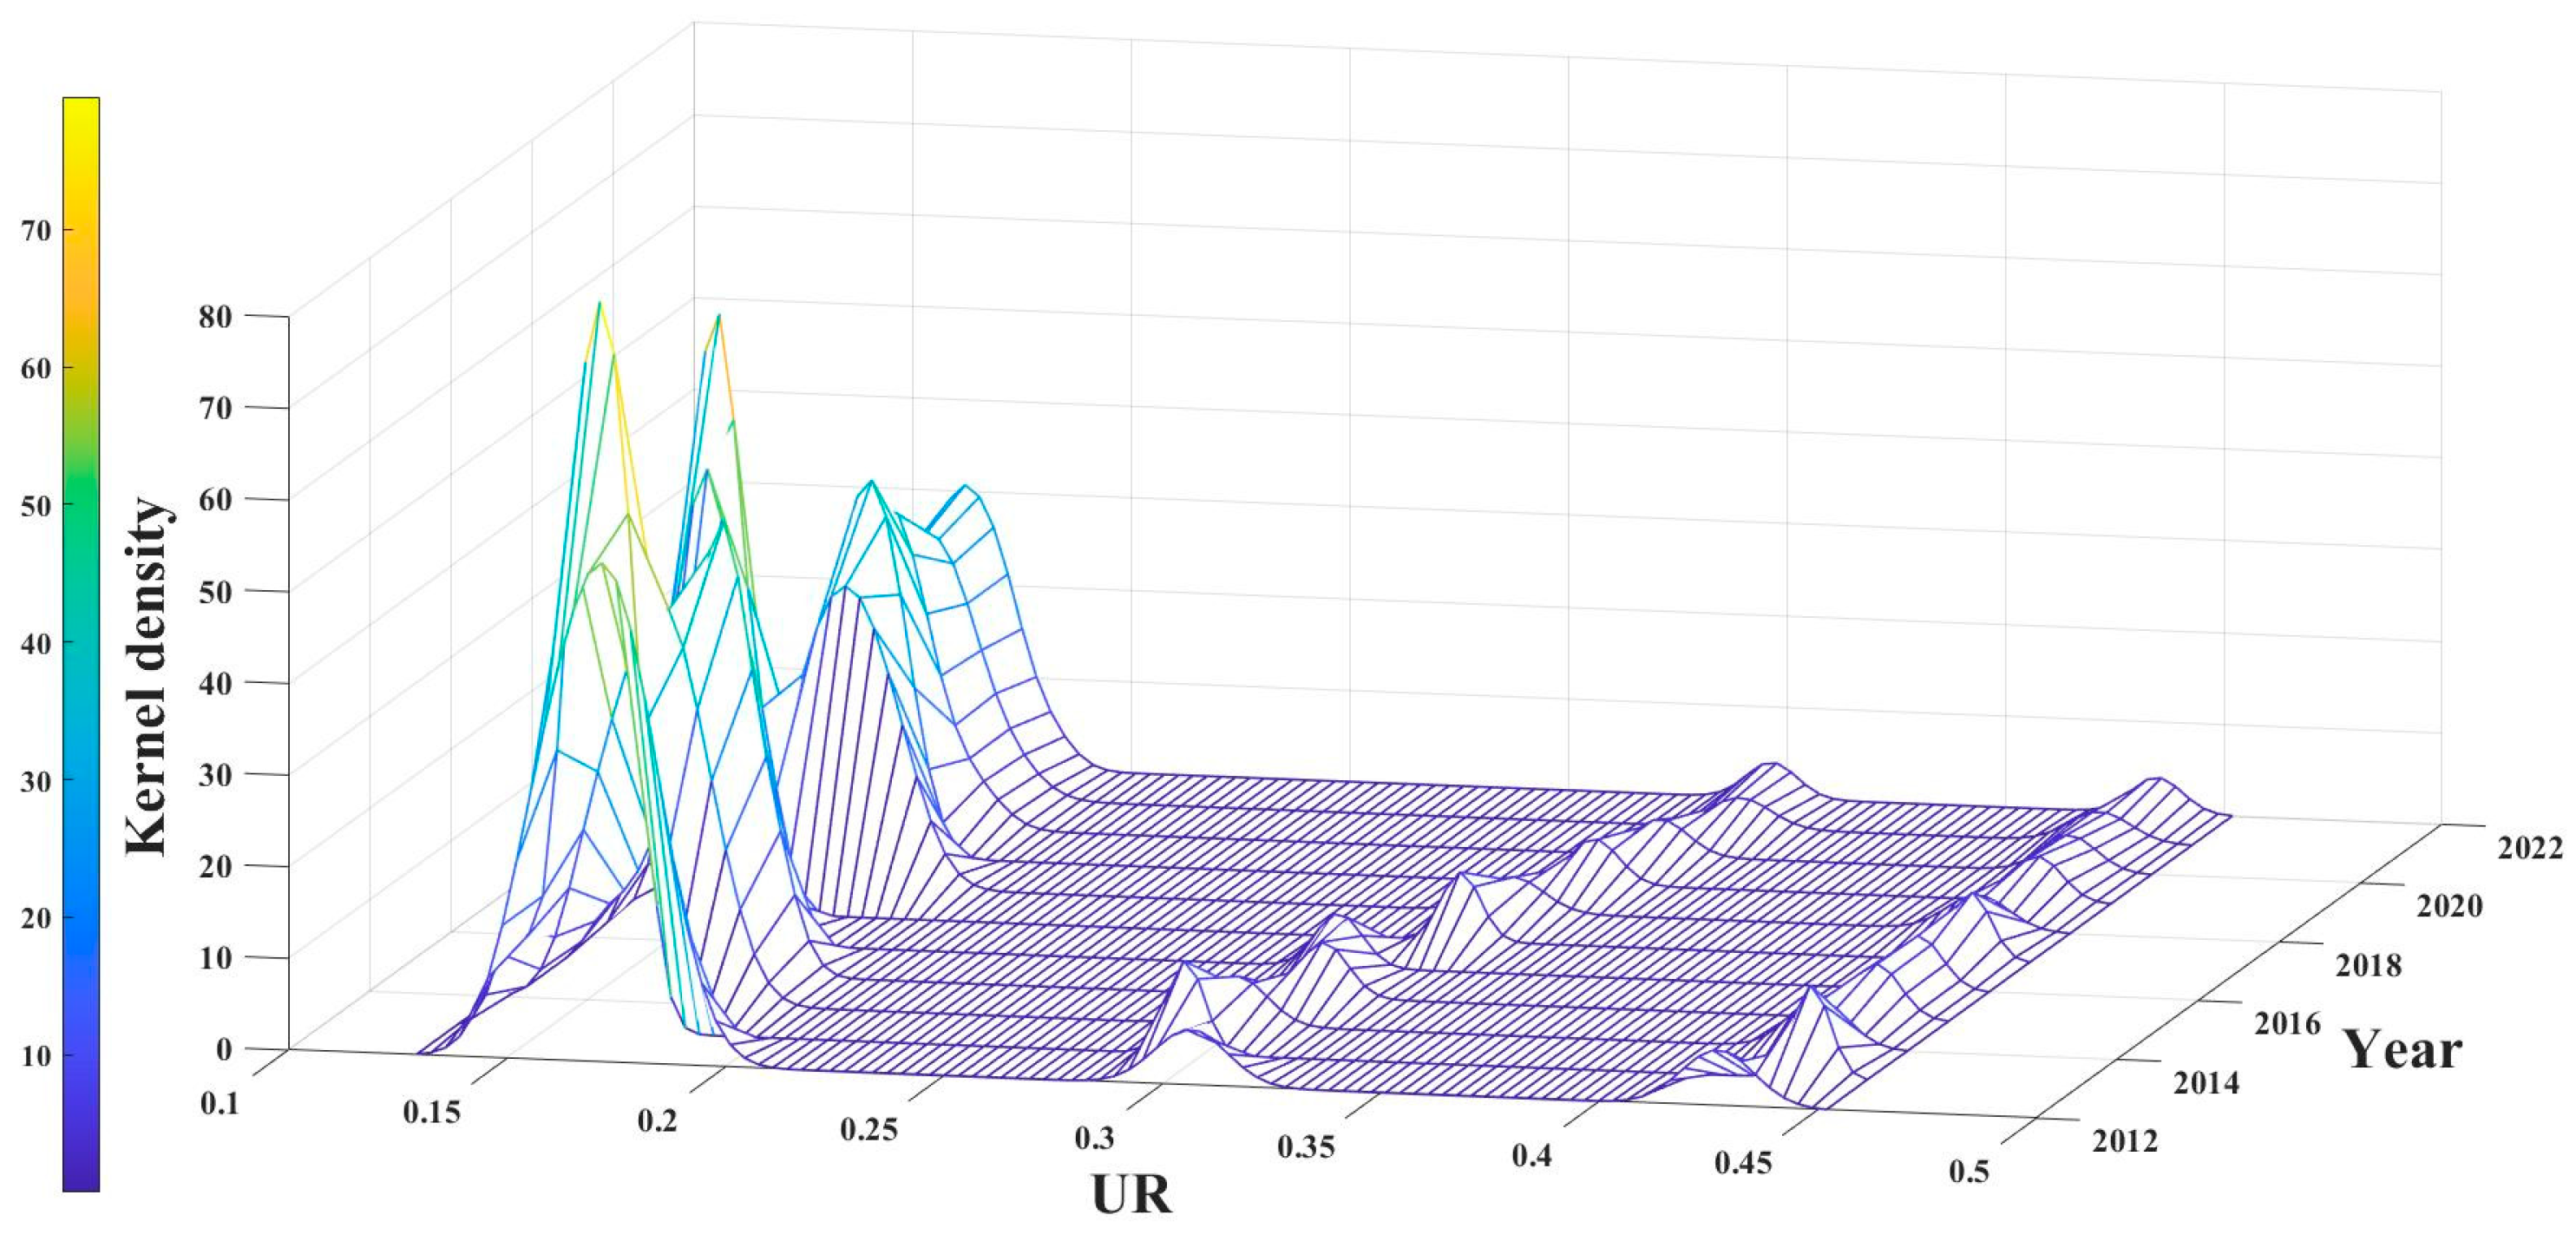
During 2012–2022, the CCEC exhibited a bimodal distribution of high-value zones and a clustered distribution of low-value zones, indicating notable spatial imbalance and discernible polarization (Figure 6). Areas with low kernel density are distant from those with high values, suggesting significant regional disparities in urban resilience within the study area. The gradual transition from sharp peaks to broader peaks in the low-value area curves indicates that this discrepancy may be diminishing over time. The peak height of the low-value area in the study area demonstrates an “M” type change of “rising-declining-rising-declining”, and there is a tendency for the distribution extension to widen. The height of the “twin peaks” is essentially uniform and distributed continuously along a belt-like structure. This indicates a “club convergence” in low-level cities, a “grade lock” in high-level cities, and a leading effect of the superior in the “two poles” area.
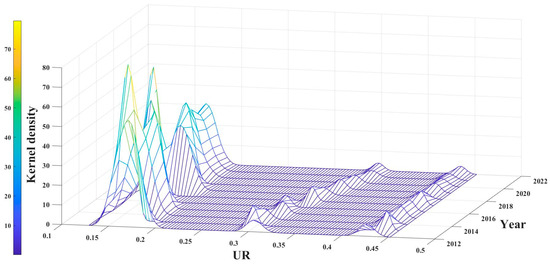
Figure 6.
Urban resilience kernel density estimates.
5.1.4. Standard Deviation Ellipse Analysis of Urban Resilience
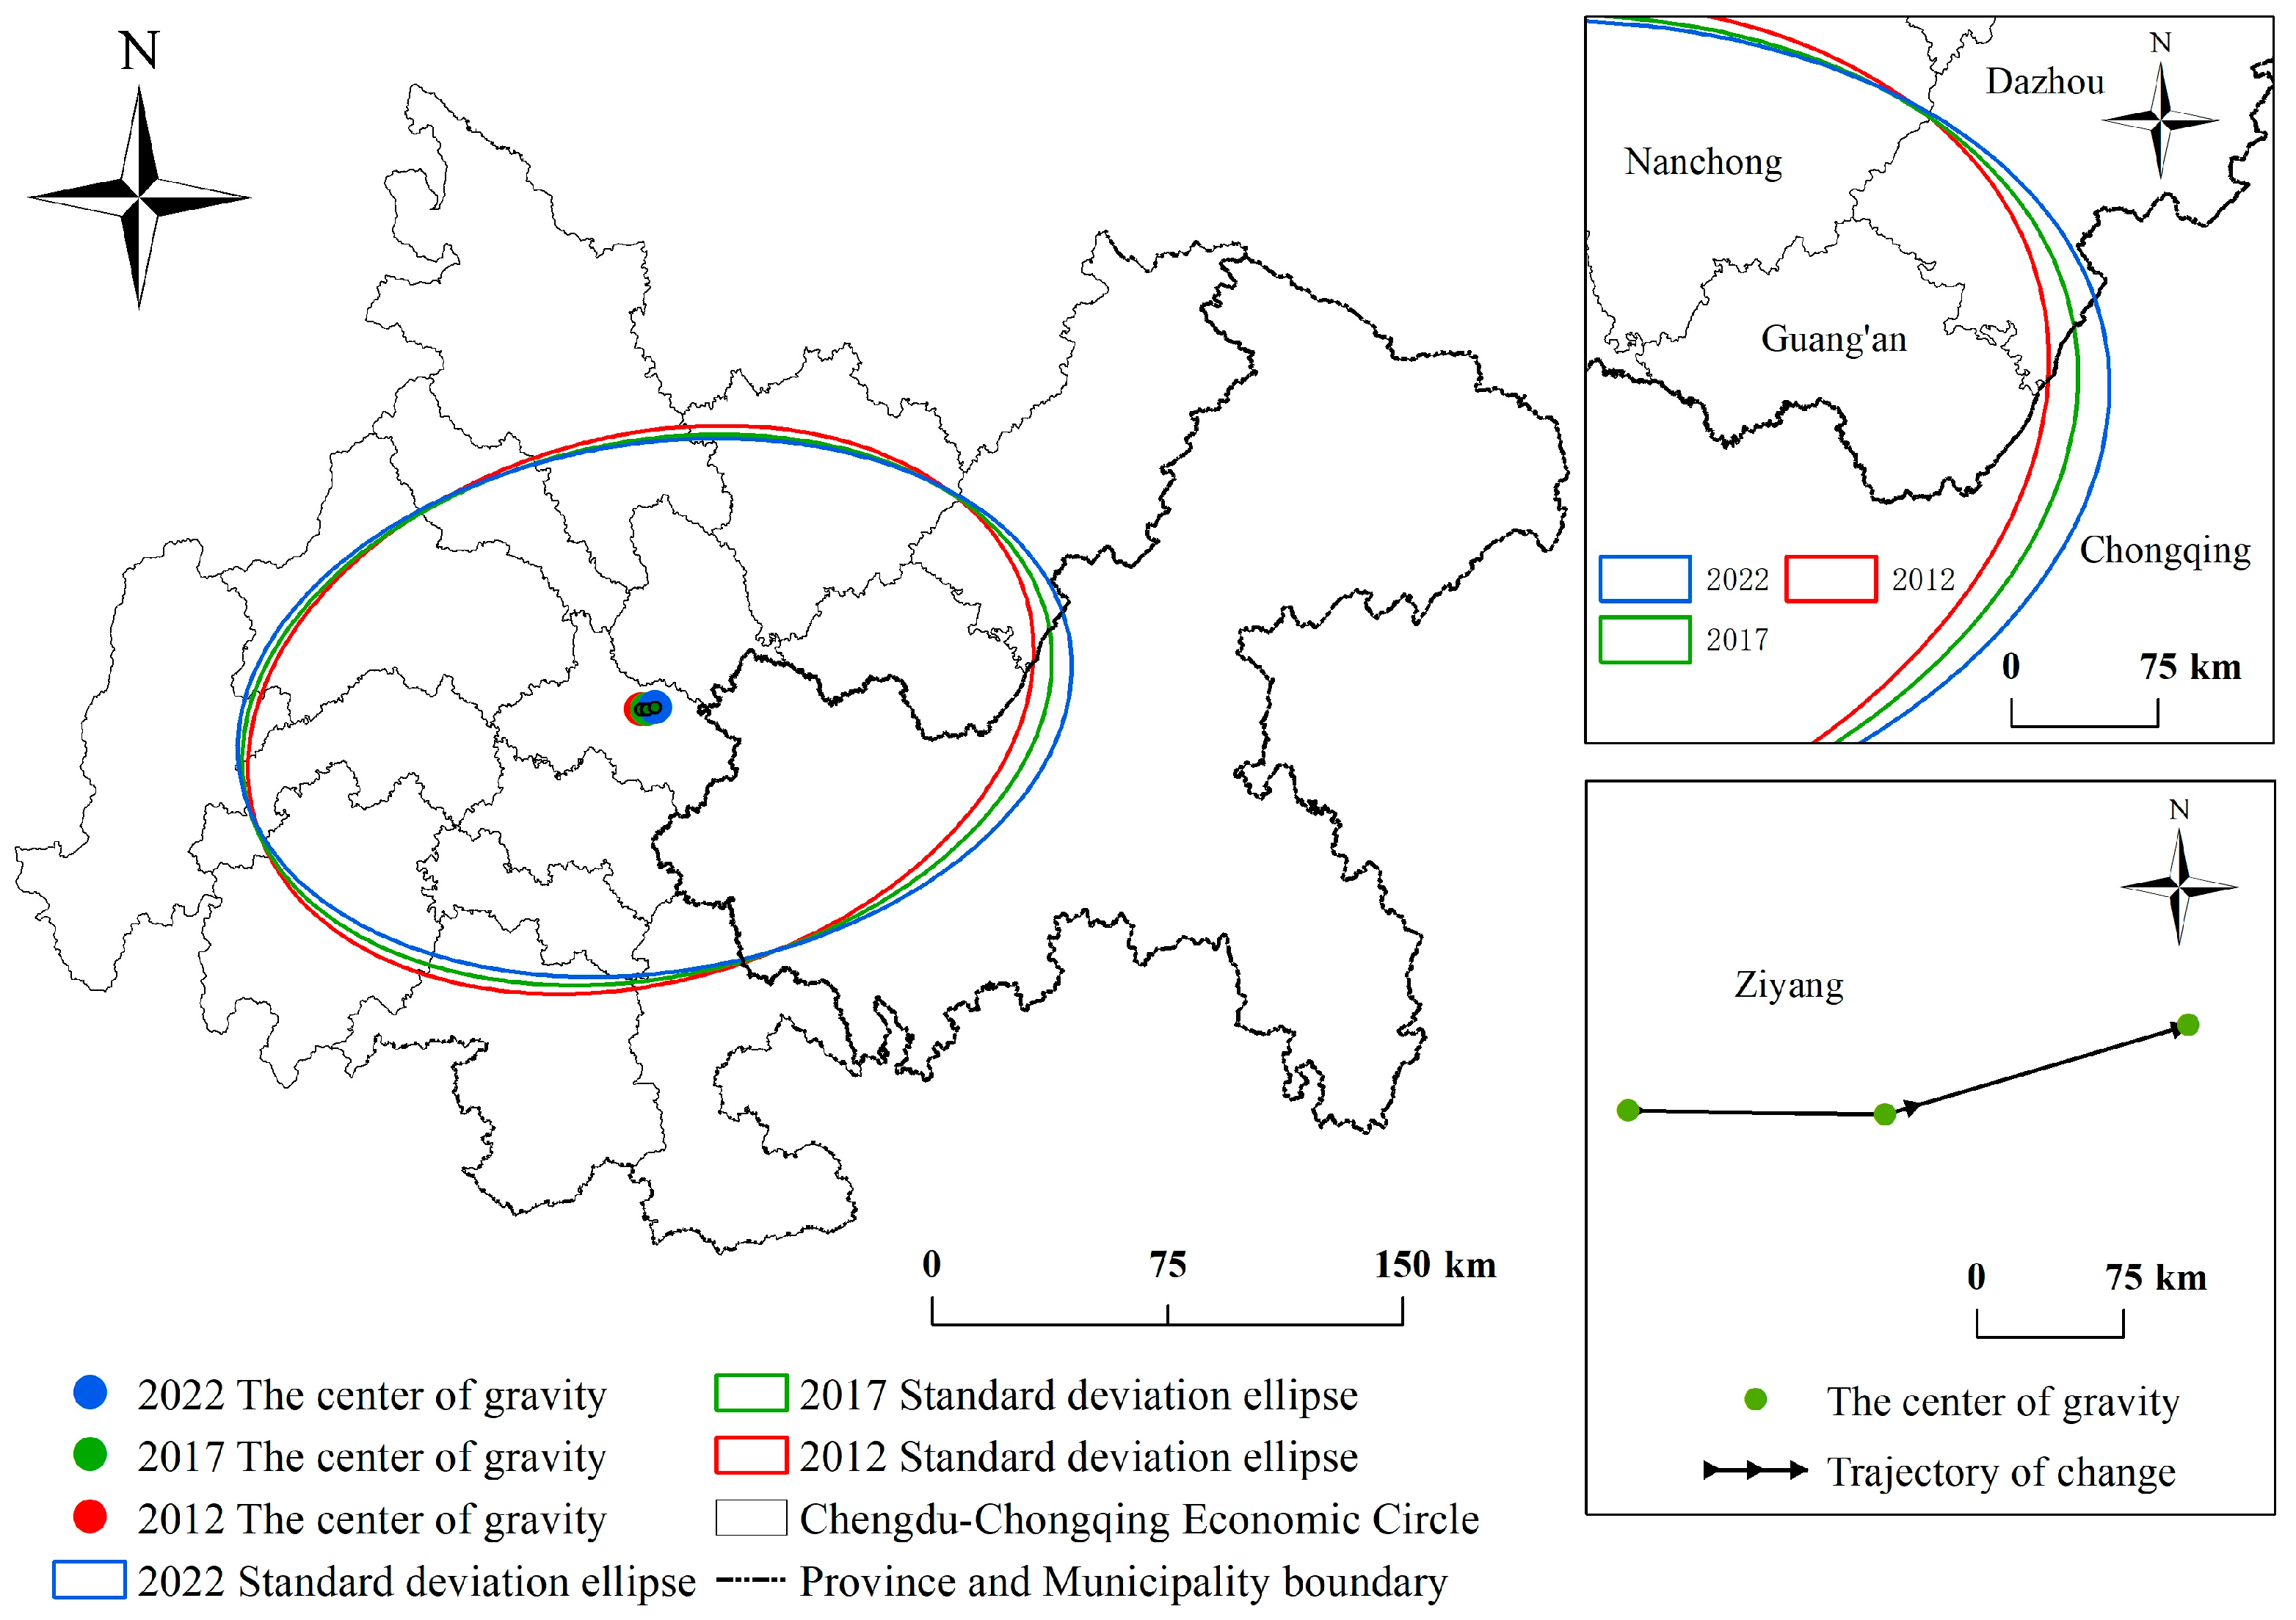
The center of gravity–standard deviation ellipse is used to further explore the spatial dynamic evolution of urban resilience within the CCEC (Table 2 and Figure 7).
Table 2.
The standard deviation elliptic parameter of urban resilience.
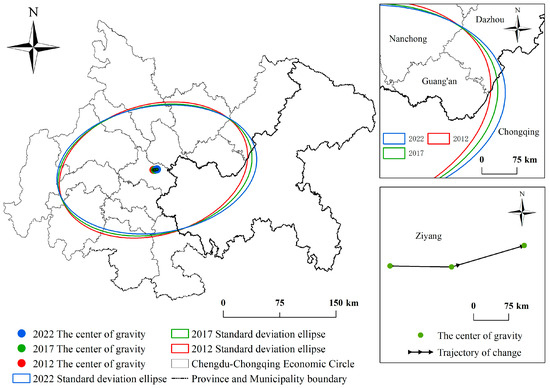
Figure 7.
Evolution of urban resilience spatial pattern of the CCEC.
From 2012 to 2022, the standard deviation ellipse of the twin-city economic circle in the Chengdu–Chongqing region exhibits a vertical spatial pattern with an east–west orientation. The alteration in the standard deviation ellipse area indicates that the ellipse area has expanded by 648,348,262.06 km2, exhibiting a rising trajectory in the total area encompassed. In consideration of the long and short semi-axes, the length of the long semi-axis increased by 2892.4 m from 2012 to 2017 and by approximately 1274.94 m from 2017 to 2022, for a total increase of 4167.34 m. This suggests that there is a trend of increasing urban resilience that is dominated by traction effects between the east and west in the direction of the east–west principal axis. The length of the short half-axis shrinks by a total of about 1456.41 m between 2012 and 2022, suggesting that the urban resilience of the north–south has developed in a manner characterized by a dominant braking effect. With regard to the center of gravity of urban resilience, the coordinates of the center of gravity are situated between 105°46′~105°47′ E and 30°25′~30°27′ W, and are consistently located within the boundaries of Suining city. Between the years 2012 and 2017, the center of gravity shifted to the northeast by 6.282 km, followed by a further shift of 6.448 km to the southwest. From the azimuthal angle of the ellipse, it rotated clockwise from 2012 to 2022, indicating that southern cities are increasingly capable of shaping the spatial pattern of urban resilience and that the traction effect on the standard deviation ellipse is progressively more pronounced, but the potential for power is weakening.
5.1.5. Spatial Heterogeneity Detection
The results of urban resilience measurement are influenced by a multitude of factors. According to the evaluation index system established in this paper, urban resilience is comprehensively reflected through economic resilience, social resilience, ecological resilience, facility resilience, and organizational management resilience. To identify the main factors influencing the spatial differentiation of urban resilience in the study area, geodetectors were utilized to measure the extent to which each indicator factor in the indicator system explains the spatial differentiation in the study area. Table 3 lists the major detection factors that ranked in the top ten of the impact resilience index in 2012, 2017, and 2022. The degree of explanation of the q indicates that the detection indicators that are larger in all three time nodes can be categorized as social security factors, economic development factors, organizational management factors, and facility factors. The strength of these impact factors is ranked as follows: social > economic > organizational management factor > facility.
Table 3.
The detection results of influencing factors for urban resilience.
(1) Social factors. A stable and supportive social environment is conducive to robust economic growth and infrastructure improvements; furthermore, it serves as an important measure of the organizational management capacity of city managers. The number of beds in health institutions (X7) represents the degree of optimization of the allocation of urban health resources, reflecting the degree of improvement in the region’s public service facilities and the medical stress-bearing capacity in the face of public health emergencies; the impact rank decreased and then increased during the period 2012–2022. The urbanization rate, population growth rate, and urban population density serve to reflect the scale of urbanization and the degree of urban population agglomeration as well as their ability to restore urban functions by efficiently deploying human and material resources when responding to disasters. Among these metrics, urban population density (X9) became the influential factor affecting urban resilience, ranking third in 2017, but dropping to sixth in 2022; the natural population growth rate (X11) appeared for the first time only in 2017 and ranked sixth; and the population growth rate (X11) appeared and ranked fourth. The urbanization rate of the resident population (X12) remained in the seventh position in 2013 and 2022 and fell out of the top ten in 2017. Increases in the proportion of employees in the tertiary sector (X23) means optimizing and adjusting the industrial structure of a region, strengthening its ability to absorb talents, and concentrating more employment opportunities in the tertiary industry, highlighting the tertiary industry’s alignment with the requirements of the era of high-quality development.
(2) Economic factors. The economy is a crucial basis for fostering social stability, infrastructure improvement, and the proper functioning of organizational management capabilities. The number of above-scale industrial enterprise units (X2) is closely correlated with local tax revenue and industrial layout, and the increase in local financial tax revenue and the optimization of industrial layout have a profound impact on regional economic growth and employment activities. The balance of deposits per capita in financial institutions (X6) is a concentrated reflection of the region’s comprehensive strength and development potential as well as a prerequisite for promoting consumption and stimulating market vitality. During the period of 2012–2022, the influence of these two remained consistently in the first and second places, suggesting that differences in the level of urban resilience are strongly influenced by economic stability and growth potential. The share of the tertiary sector in GDP (X5) is indicative of the extent of socioeconomic transformation and optimization, and its impact on the ranking in 2017 declined, subsequently falling out of the top ten in 2022. Local general budget revenues (X4), which reflect both the financial strength of local governments and the responsiveness of the region to ensure the normal functioning of the economy, society, and other systems, remained in sixth place in both 2012 and 2017 and declined to ninth place in 2022. The first appearance of GDP per capita (X1), which reflects the overall level of socioeconomic development, was in 2022, where it was in the fourth position, suggesting that its role in driving up the resilience capacity of the city is beginning to emerge.
(3) Organizational management capacity is an important driving force in facilitating social, infrastructure, and economic development, and effective organizational management can promote social justice and stimulate economic vitality. The number of urban workers’ basic pension insurance participants at the end of the year (X25) is a key consideration for managers in terms of social security, and the influence of both the organizational management capacity and the number of social security participants continued to decline from 2012 to 2022.
(4) The degree of infrastructural sophistication characterizes a well-functioning economy, social stability, and effective organization and management and reflects the level of social and public services and of economic development. The length of urban drainage pipes (X20) is a reflection of the level and perfection of infrastructure construction in a region, and it also reflects the timely evacuation capacity of the city in the face of natural disasters such as floods and exceptionally heavy rains, with the influence decreasing and then increasing during 2012–2022, corresponding to the city’s sewage discharge (X17) for the first time in 2022, ranked eighth. The city’s sewage discharge increases the pressure to install additional urban drainage pipes.
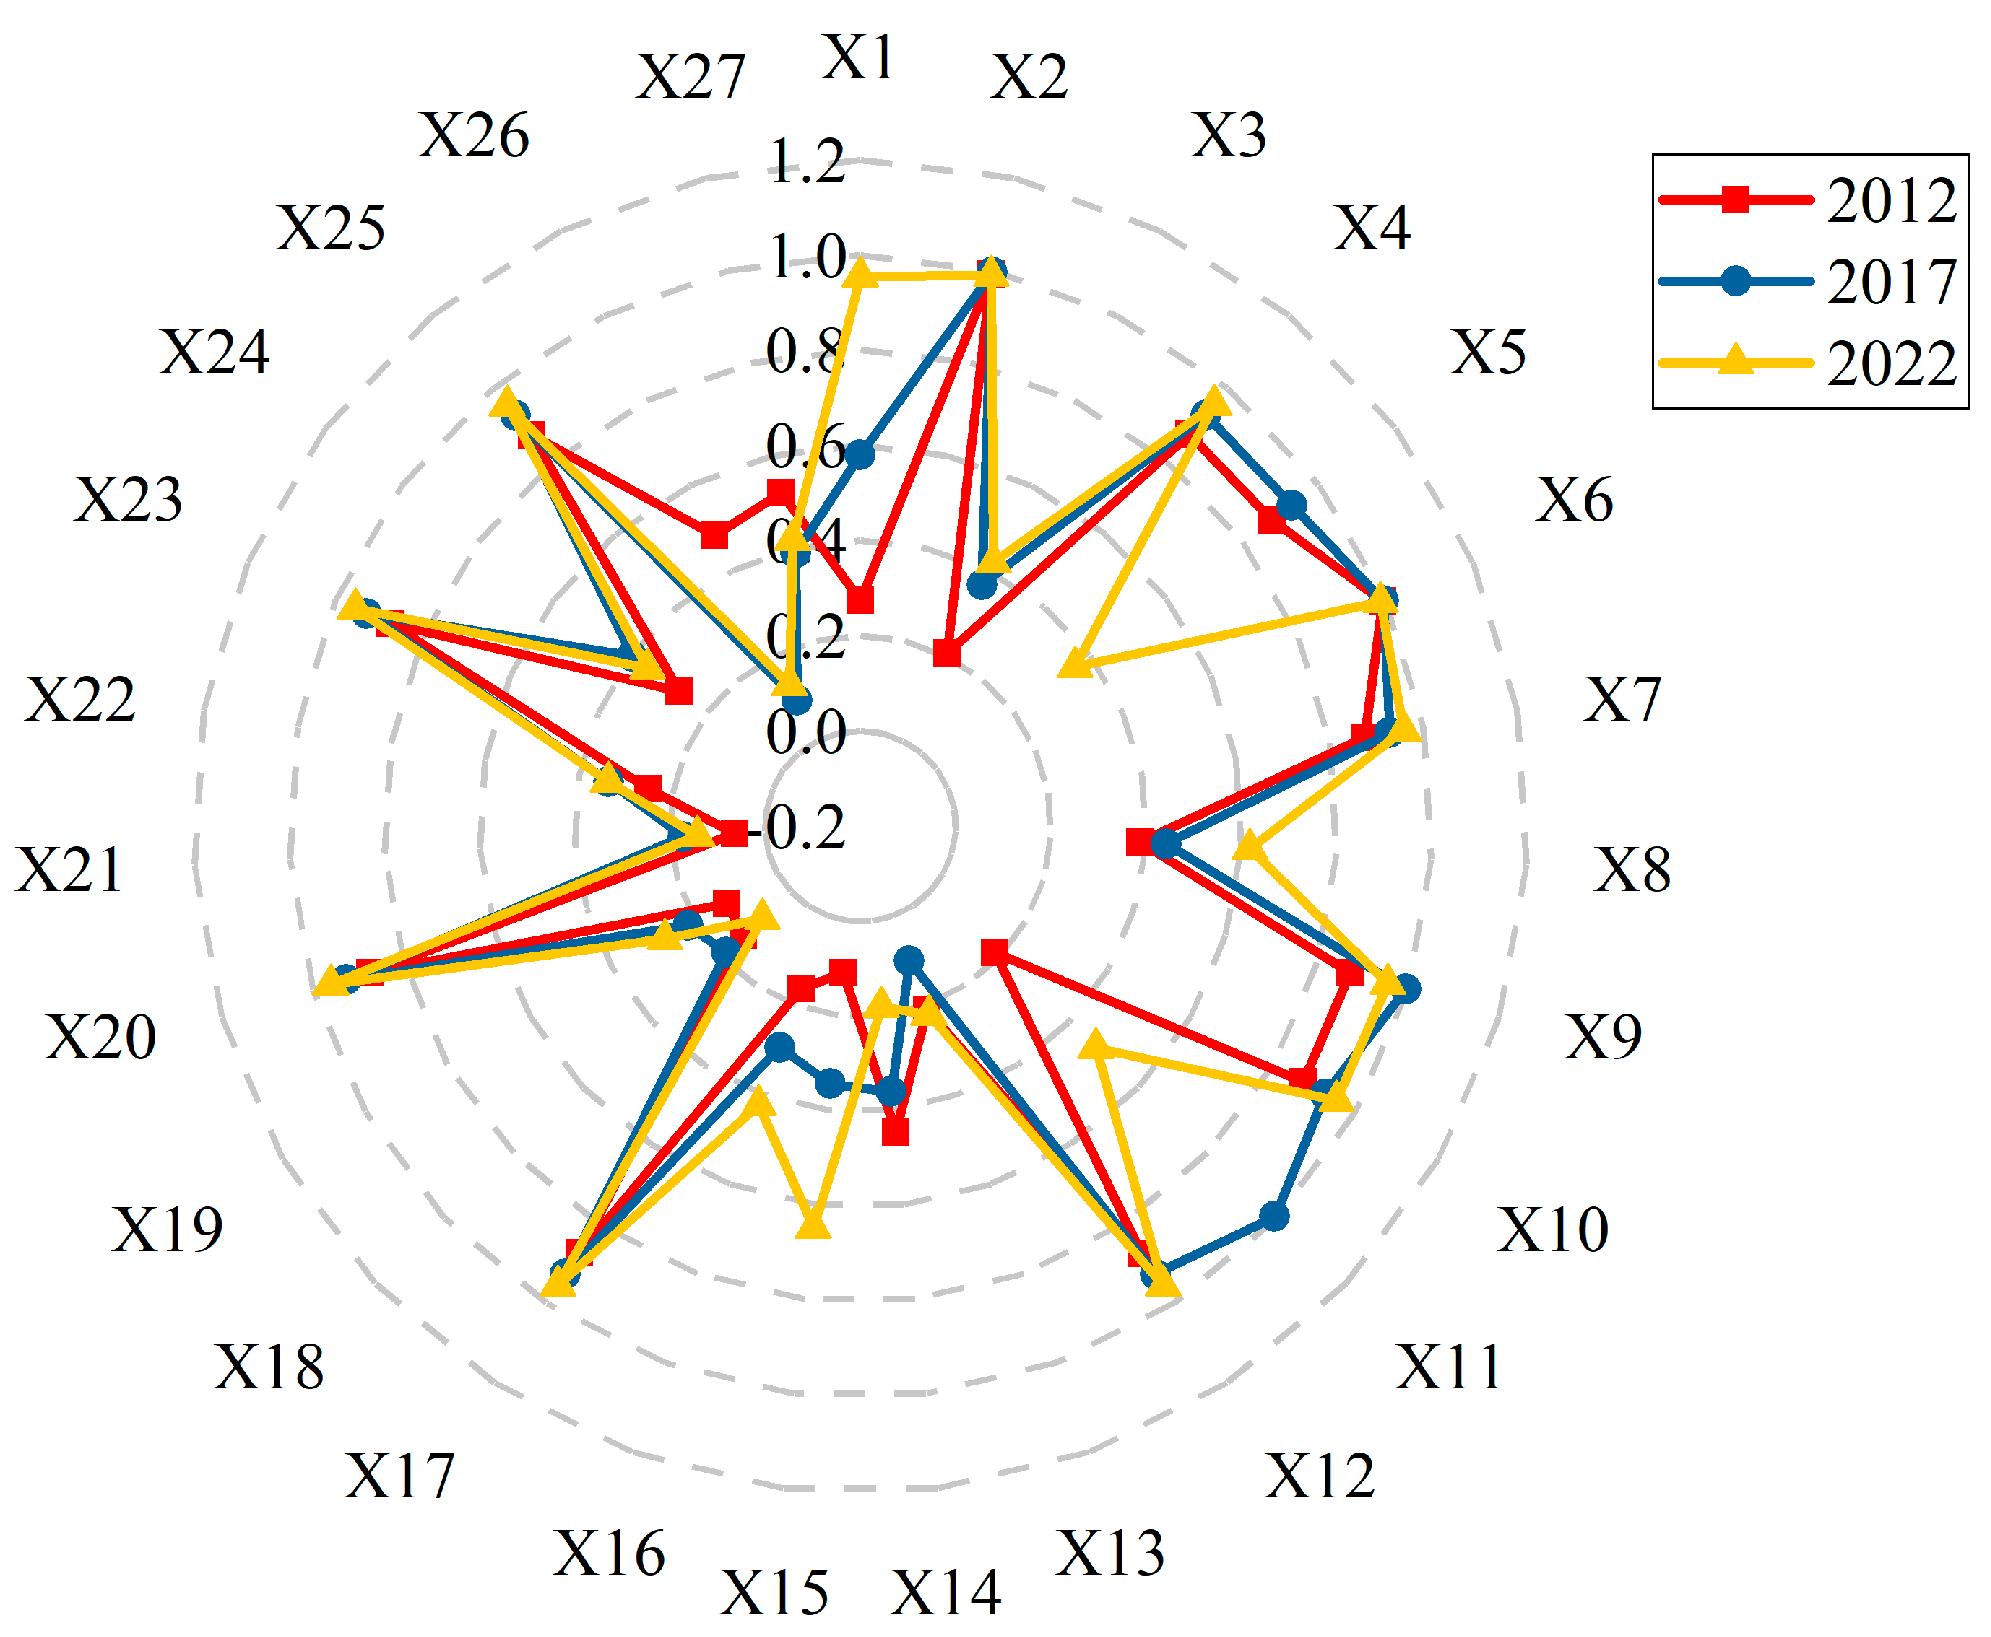
Based on the evolutionary trend of the top ten indicators of urban resilience over the years (Figure 8), the six explanatory indicators with the highest overlap at the three time points were obtained, including the number of industrial enterprise units above large scale (X2), the general budget revenue of the local finance (X4), the per capita balance of deposits in financial institutions (X6), the number of beds in the health institutions (X7), the percentage of employees in tertiary industry (X9), and the length of municipal drainage pipelines (X20). Sub-dimensionally, in the three time nodes, the intensity of urban resilience influencing factors in the CCEC is mainly manifested in the economic factor, the facility factor, and the social factor: economy > society > facility. The enhancement of urban resilience in the CCEC is driven primarily by economic development. While infrastructure plays a supporting role, it has a limited impact on urban resilience. This suggests that the study area is in the early stages of resilient city creation. It is essential to strike a balance between the economy, society, ecology, infrastructure, and organizational management. In particular, attention must be paid to green development, as the ecological factor plays a pivotal role in economic growth, social stability, and infrastructure improvement. This, in turn, facilitates effective organizational management.
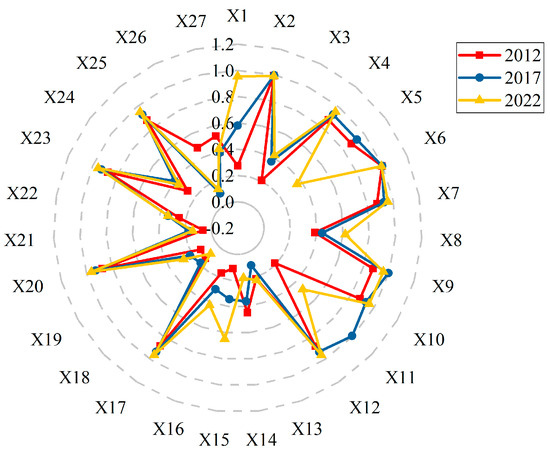
Figure 8.
Influencing factors of urban resilience in the CCEC.
5.2. Dynamic Simulation Evolution of the UR
5.2.1. Analysis of Prediction Results
The resilience measurements of each city in the CCEC from 2012 to 2022 were used to obtain the results of the resilience level of the cities in the study area from 2025 to 2035 using the gray prediction model (Table 4). The results were verified to satisfy the extreme ratio test prediction accuracy.
Table 4.
Prediction results of urban resilience of the CCEC.
From the perspective of 2025, 2030, and 2035, the chronological changes in each region (Figure 9), the CCEC, and the level of urban resilience show a gradual and consistent growth trajectory. The growth of urban resilience in each region is more consistent; in Chengdu and Chongqing, the urban resilience center status is prominent; the “dual-core” structure is obvious; and the inter-regional development rate is relatively unbalanced, but the regional central city polarization effect is prominent. The growth rate of the Chongqing–Chengdu “dual-center” remains at 18.5%, 15.8%; Chengdu, Chongqing, and Ya’an city resilience is higher than the average value of the resilience of cities in the CCEC; Ziyang City, Meishan City, Zigong City, and other cities’ resilience value with the change in the year of the study fluctuates with an upward trend; but in the overall Chengdu–Chongqing City Cluster, the level of resilience needs to be further improved.
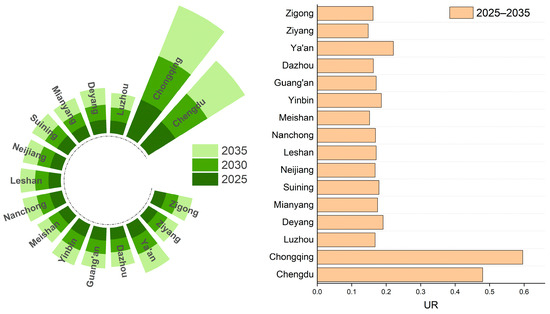
Figure 9.
Temporal changes in urban resilience of the CCEC in 2025, 2030, and 2035.
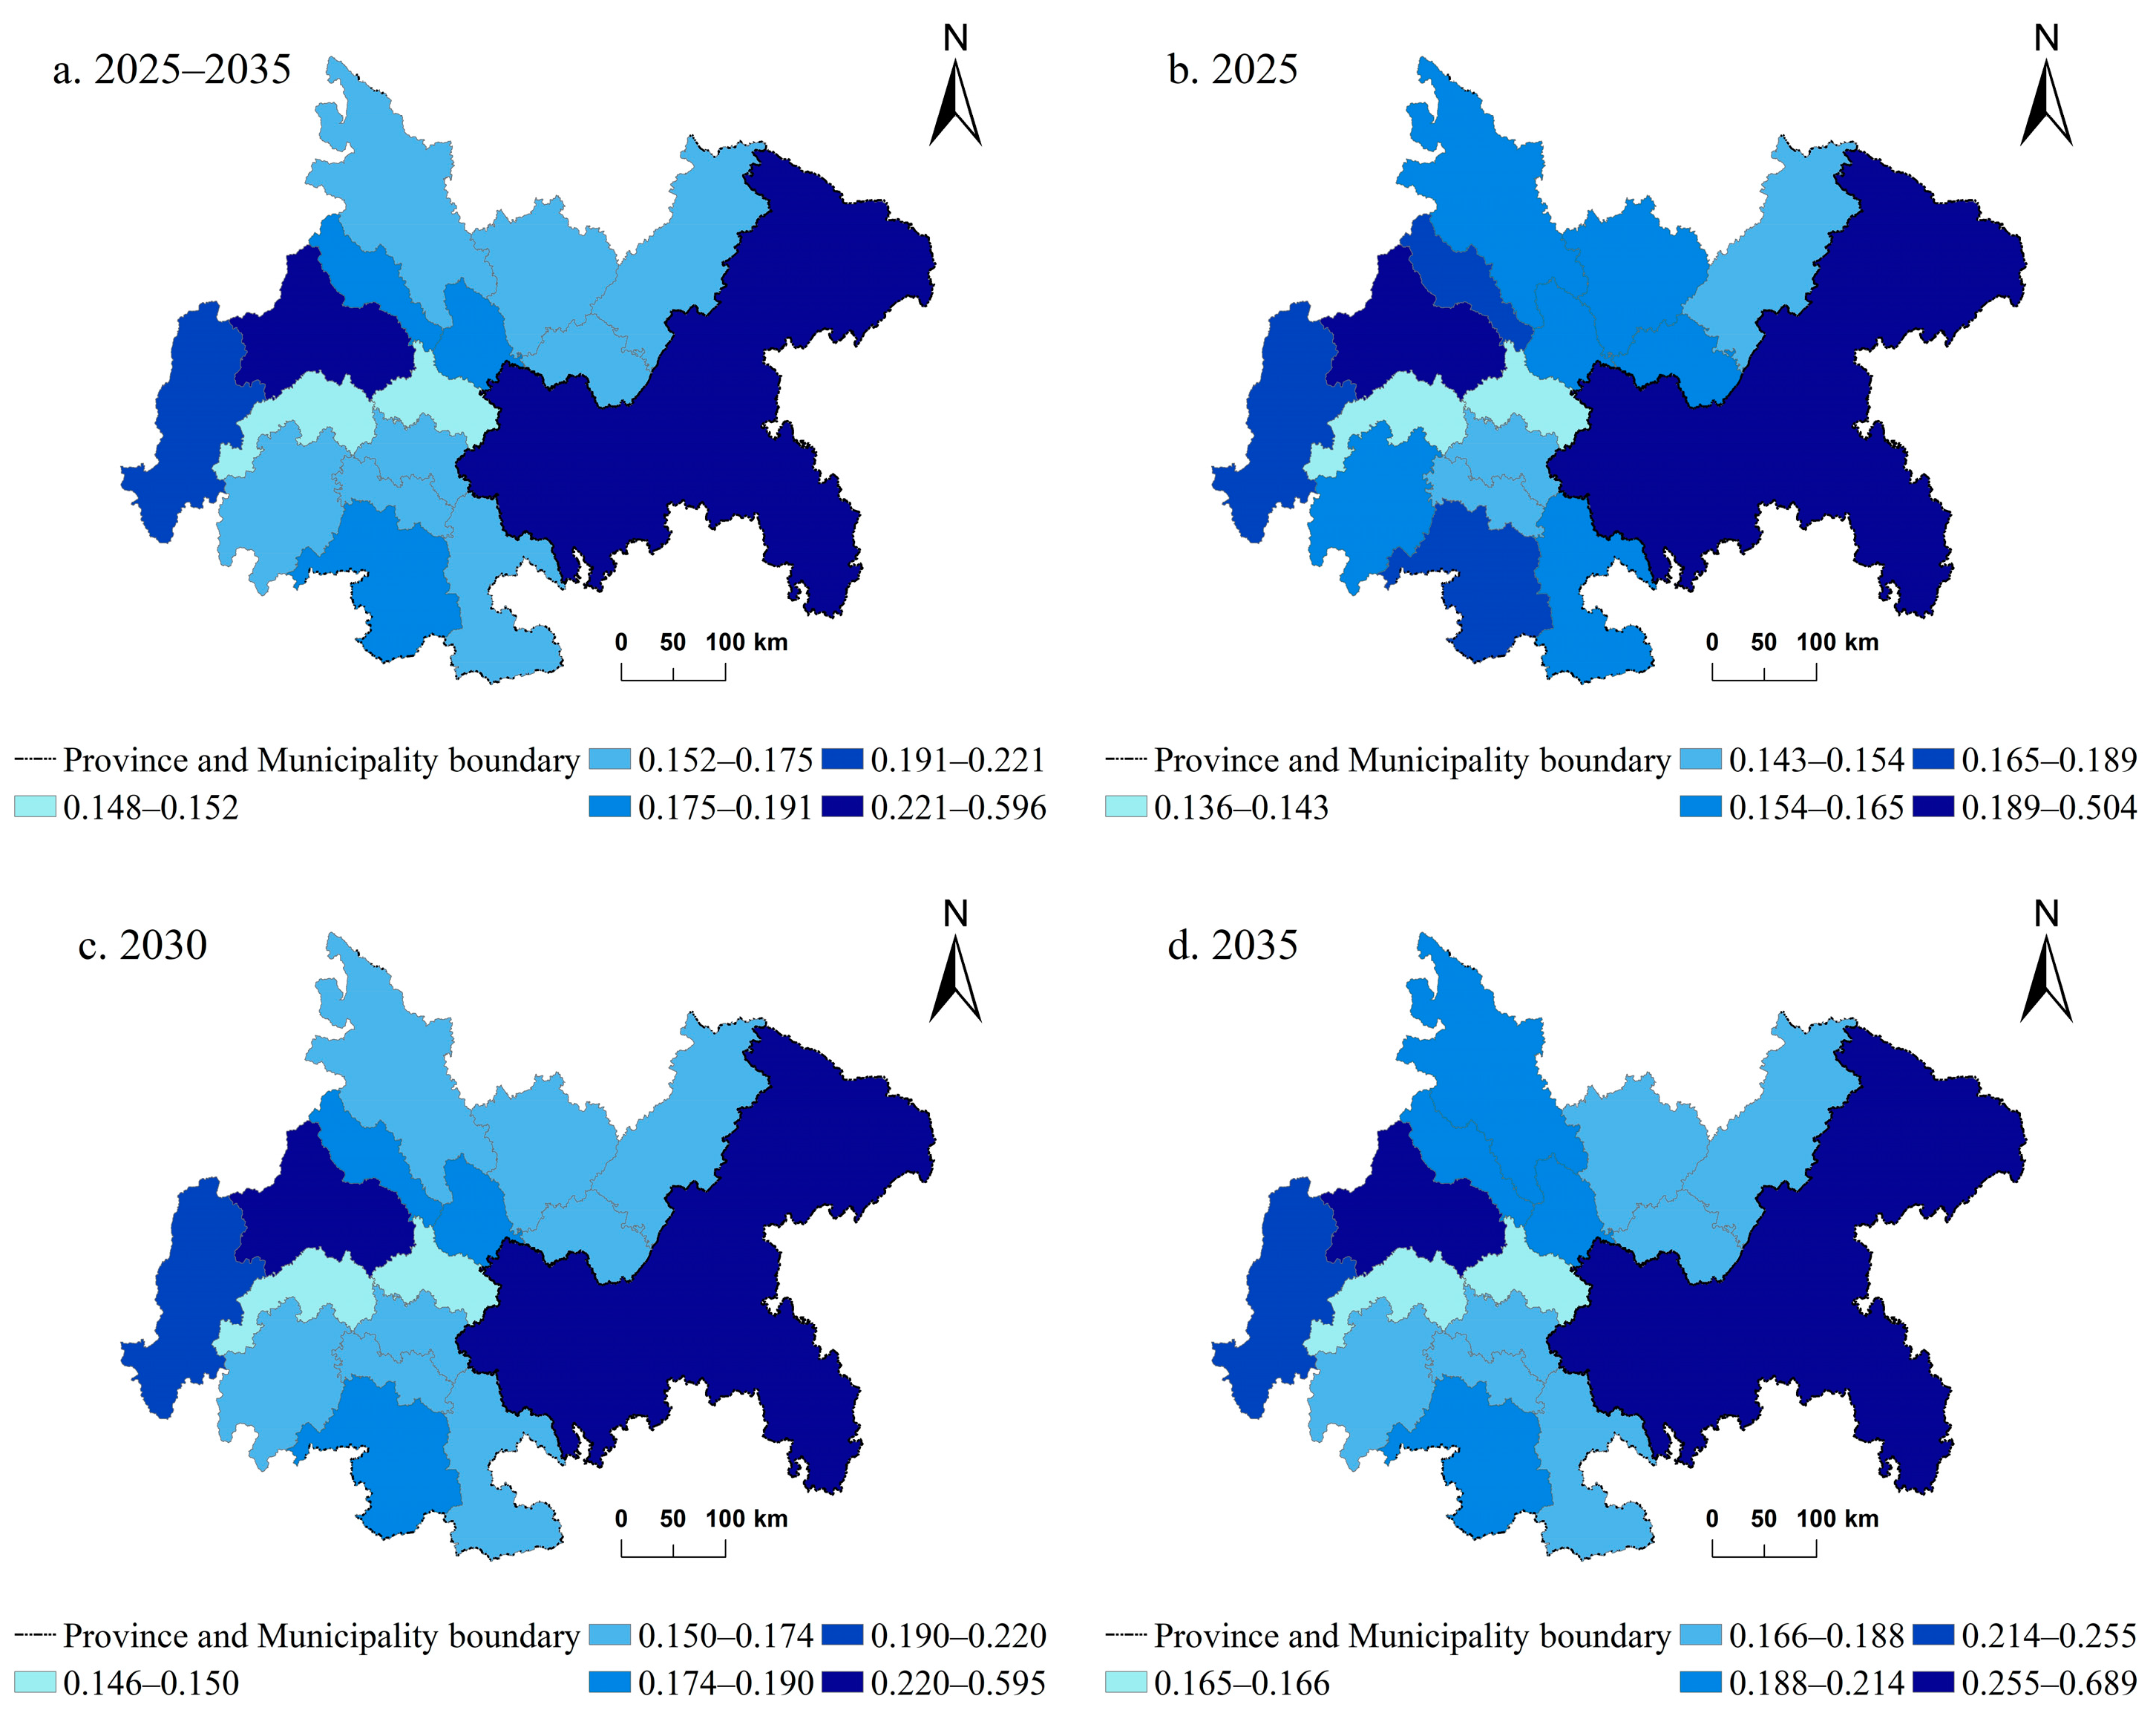
With regard to the evolution of space (Figure 10a), it can be observed that during the period spanning 2025–2035, the urban resilience pattern of the CCEC will be characterized by a “twin-core” linkage, with the low-value zones concentrated in the south-central zone. During the study period, the average value of the resilience of the cities in the CCEC was the highest at 0.3835 and the lowest at 0.143, with obvious differences in the resilience level between the regions and fewer areas of high resilience, concentrated mainly in the regional center cities of Chengdu and Chongqing as well as in Guang’an and Yibin, while the resilience level of the other cities was generally low. The primary rationale for this is that the regional center of the city, with its political, economic, cultural, and central and strategic position, acts as a resource attraction. In addition, Guang’an and Chongqing, as the CCEC in the Chongqing Municipality metropolitan area, in the development of the development strategy led with rapid development. The spatial differences in urban resilience in the study area in 2025, 2030, and 2035 are relatively obvious, and the two wings of Chongqing and Chengdu, which have the highest resilience, consistently lead the development pattern of the overall growth in the resilience value of the sub-cities, with some fluctuations (Figure 10b–d). By 2025, the overall resilience level of the CCEC will be high, with 62.50% of the total area classified as medium and above tier; the diffusion effect of Chengdu City will play an obvious role; the periphery of the surrounding cities will show a “center-periphery” pattern; and the phenomenon of low resilience zones concentrated in the central part of the study area will begin to emerge. By the year 2030, 37.50% of the cities in the study area will be in the medium resilience level or above, representing a rapid decline compared with the figures for 2025. By 2035, 43.75% of the cities in the CCEC will be in the medium resilience level or above, and the “center-periphery” pattern of Chengdu and its surrounding cities will be further consolidated while the low-resilience cities will show a pattern of distribution along the boundary of Chongqing, situated in the central part of the study area; the lower resilience areas will be mainly distributed in the southern part of Sichuan. The process of developing the CCEC “dual-core” linkage, with the intermediate zone serving as a platform for close interaction between the two parties, has instead become the object of the “siphon effect”. This is evidenced by the production factors to the dual-core city of the unidirectional transfer of resources, leading to the hollowing out of industries and brain drain in resource outflows, which further exacerbates the regional development gap.
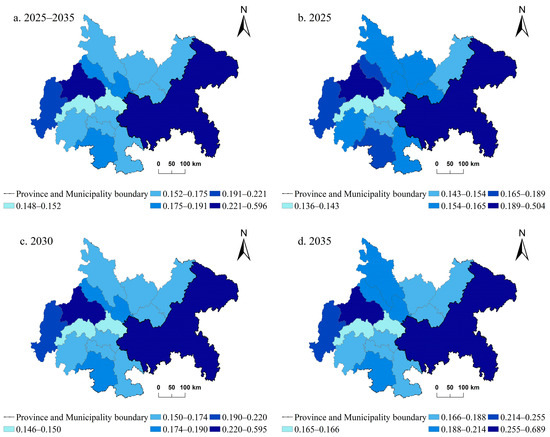
Figure 10.
Evolution of urban resilience spatial pattern of the CCEC in 2025, 2030, and 2035.
Overall, the spatial differences in urban resilience in the study area are large, with more low-value areas than high-value areas. The spatial distribution pattern of urban resilience in the “two-winged and central concave” area is further consolidated, with the status of Chongqing and Chengdu as the regional central cities further strengthened.
5.2.2. Spatial Development Trend of the UR Level
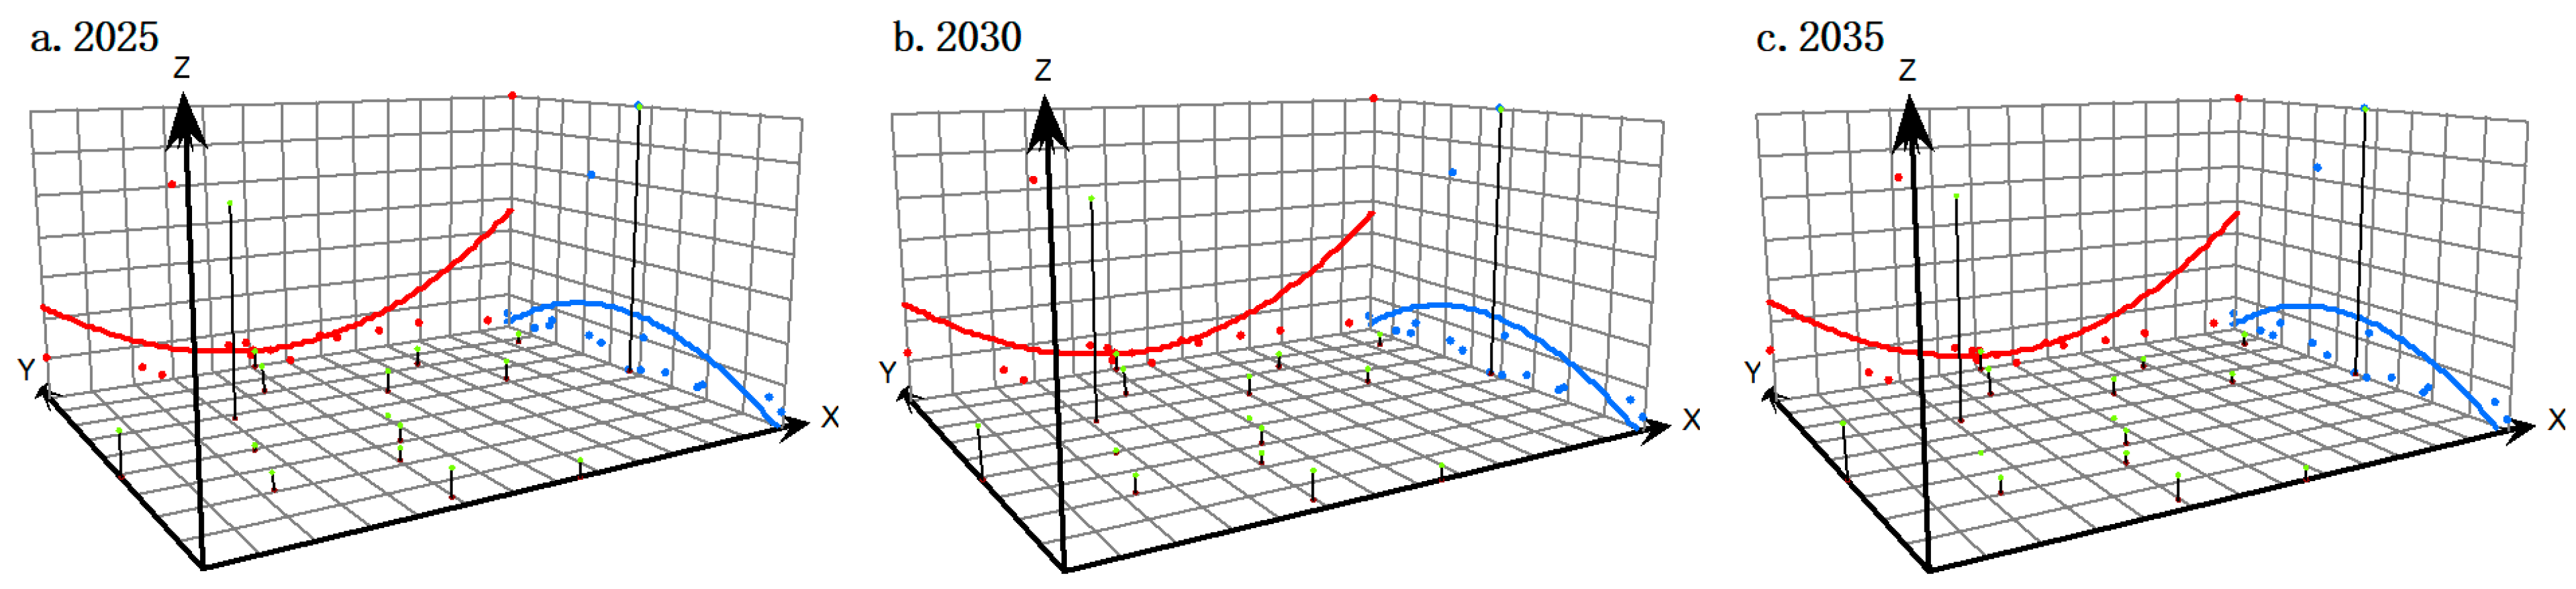
Based on the predicted data of urban resilience in the CCEC from 2025 to 2035, the trend line prediction map of urban resilience level is plotted (Figure 11) in order to analyze the distribution characteristics and spatial development trend of urban resilience in the study area during the prediction period. The blue arc represents the spatial development trend of resilience in the east–west direction, and the red arc represents the spatial development trend of resilience in the north–south direction. In general, there is a significant difference between the urban resilience levels in the east–west and north–south directions, and the resilience levels show a slowly increasing trend in the 2025–2035 timeframe. In terms of the spatial development trend, there is no significant change in the north–south direction during the forecast period; while the north–south direction shows a “∪” type distribution, the east–west direction shows a “∩” type distribution. To a certain extent, this reflects the uneven distribution characteristics of the spatial distribution of urban resilience in the study area, and the uneven distribution trend continues to increase with the growth of time.
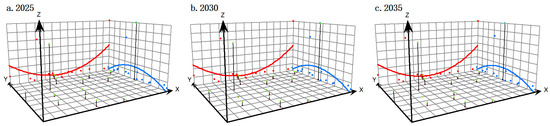
Figure 11.
Urban resilience level in 2025, 2030, and 2035.
6. Conclusions and Policy Implications
6.1. Conclusions
This research investigates the four fundamental components of a resilient urban system through the CAS theory and establishes a framework for the RCS. A five-dimensional evaluation index system for urban resilience is developed, encompassing economic, social, ecological, infrastructural, and organizational management dimensions. This framework is applied to analyze the spatiotemporal evolution patterns of the CCEC as well as the factors shaping these patterns and potential future development trajectories. The key findings are summarized as follows:
- Between 2012 and 2022, the UR of the CCEC transitioned from a “single-core” model centered on Chongqing to a “dual-core” model featuring both Chongqing and Chengdu. The overall level of UR in the study area improved, exhibiting a spatial differentiation pattern with two prominent wings and a concave center. Additionally, the spatial shaping capacity of UR was strengthened by the influence of cities in southern Sichuan.
- In terms of influencing factors, there were significant variations in the extent to which various factors influenced the level of UR. Factors such as economic diversity, economic emergency response capacity, economic resilience, healthcare level, and urban supply and drainage capacity demonstrated a more pronounced positive influence. Indicators with stronger explanatory power were primarily concentrated in the economic, social, and infrastructure dimensions.
- In terms of dynamic prediction, during the period of 2025 to 2035, the study area is expected to exhibit prominent high points in UR. However, the resilience levels of most cities will remain relatively low, demonstrating an overall trend of slow yet steady growth. The status of regional central cities such as Chongqing and Chengdu will be further consolidated, and the spatial pattern of UR, characterized by “two prominent wings and a central depression”, will become more pronounced.
6.2. Policy Implications
In light of the aforementioned conclusions, we put forward the following recommendations:
- (1)
- To address the widening gap in UR levels, cities should adopt collaborative management strategies to dismantle barriers between urban resources such as human capital, logistics information, and capital flows. This will enhance interdepartmental communication, optimize resource allocation, strengthen the capacity of cities to jointly mitigate risks, and promote synergy development in urban regions.
- (2)
- In response to the persistent expansion of disparities in urban emergency response capabilities, the self-organization and flexibility of residents, communities, and other key actors in resilient urban systems should be fully leveraged. This will encourage their active participation in resilience governance and foster a collective resilience management system that spans from residents to communities and ultimately involves government oversight.
- (3)
- To tackle the imbalance in urban factor endowments, a differentiated resilience enhancement strategy should be implemented based on the current resilience development levels of individual cities. The central cities should amplify their spillover effects to surrounding regions, while peripheral areas should actively learn from and adapt the successful practices of central cities. This approach will effectively guide the positive influence of highly resilient cities, counteract the “siphon” effect, and reduce polarization.
Author Contributions
Conceptualization, H.H.; data curation, H.H.; formal analysis, H.H.; funding acquisition, X.Y.; writing—original draft, H.H.; writing—review and editing, H.H. and X.Y. All authors have read and agreed to the published version of the manuscript.
Funding
This research was funded by the Project of the Nanchong Federation of Social Science Associations, grant number NC25B308.
Institutional Review Board Statement
Not applicable.
Informed Consent Statement
Not applicable.
Data Availability Statement
The datasets used during the current study are available from the first author on reasonable request.
Conflicts of Interest
The authors declare no conflicts of interest.
References
- Shao, Y.W.; Xu, J. Understanding Urban Resilience: A Conceptual Analysis Based on Integrated International Literature Review. Urban Plan. Int. 2015, 30, 48–54. [Google Scholar]
- Lyu, Y.F.; Xiang, M.T.; Wang, M.J.; Wu, C.F. From Disaster Prevention to Resilience Construction: Exploration and Prospect of Resilience Planning under the Background of Territorial Governance. J. Nat. Resour. 2021, 36, 2281–2293. [Google Scholar] [CrossRef]
- Berkes, F.; Folke, C. Linking Social and Ecological Systems for Resilience and Sustainability; Beijer Discussion Paper Series No. 52; Beijer International Institute of Ecological Economics, The Royal Swedish Academy of Sciences: Stockholm, Sweden, 1994; pp. 2–16. [Google Scholar]
- Holling, C.S. Resilience and Stability of Ecological Systems. Annu. Rev. Ecol. Syst. 1973, 4, 1–23. [Google Scholar] [CrossRef]
- Cutter, S.L.; Ahearn, J.A.; Amadei, B.; Crawford, P.; Eide, E.A.; Galloway, G.E.; Goodchild, M.F.; Kunreuther, H.C.; Li-Vollmer, M.; Schoch-Spana, M.; et al. Disaster Resilience: A National Imperative. Environ. Sci. Policy Sustain. Dev. 2013, 55, 25–29. [Google Scholar] [CrossRef]
- Ribeiro, P.J.G.; Gonçalves, L.A.P.J. Urban Resilience: A Conceptual Framework. Sustain. Cities Soc. 2019, 50, 101625. [Google Scholar] [CrossRef]
- Ozbay, A.E.O.; Karapinar, I.S.; Unen, H.C. Integrated Urban Resilience Framework: A Comprehensive Approach to Pre-and Post-Disaster Assessment for Earthquake Risk Reduction. Struct. Eng. Mech. 2024, 92, 197–206. [Google Scholar]
- Park, S.; Yabe, T.; Ukkusuri, S.V. Post-Disaster Recovery Policy Assessment of Urban Socio-Physical Systems. Comput. Environ. Urban Syst. 2024, 114, 102184. [Google Scholar] [CrossRef]
- Yu, J.; Hu, W.; Hou, L. Towards More Resilient Cities-Analyzing the Impact of New-Type Urbanization on Urban Resilience: Considering Spatial Spillover Boundaries. Sustain. Cities Soc. 2024, 114, 105735. [Google Scholar] [CrossRef]
- Zhang, J.; Wang, T.; Goh, Y.M.; He, P.; Hua, L. The Effects of Long-Term Policies on Urban Resilience: A Dynamic Assessment Framework. Cities 2024, 153, 105294. [Google Scholar] [CrossRef]
- Bruneau, M.; Chang, S.E.; Eguchi, R.T.; Lee, G.C.; O’Rourke, T.D.; Reinhorn, A.M.; Shinozuka, M.; Tierney, K.; Wallace, W.A.; Von Winterfeldt, D. A Framework to Quantitatively Assess and Enhance the Seismic Resilience of Communities. Earthq. Spectra 2003, 19, 733–752. [Google Scholar] [CrossRef]
- Cutter, S.L.; Barnes, L.; Berry, M.; Burton, C.; Evans, E.; Tate, E.; Webb, J. A Place-Based Model for Understanding Community Resilience to Natural Disasters. Glob. Environ. Change 2008, 18, 598–606. [Google Scholar] [CrossRef]
- Wu, C.; Cenci, J.; Wang, W.; Zhang, J. Resilient City: Characterization, Challenges and Outlooks. Buildings 2022, 12, 516. [Google Scholar] [CrossRef]
- Zhao, R.D.; Fang, C.L.; Liu, H.M. Progress and Prospect of Urban Resilience Research. Prog. Geogr. 2020, 39, 1717–1731. [Google Scholar] [CrossRef]
- Ruan, J.; Chen, Y.; Yang, Z. Assessment of Temporal and Spatial Progress of Urban Resilience in Guangzhou under Rainstorm Scenarios. Int. J. Disaster Risk Reduct. 2021, 66, 102578. [Google Scholar] [CrossRef]
- Shi, Y.; Zhai, G.; Xu, L.; Zhou, S.; Lu, Y.; Liu, H.; Huang, W. Assessment Methods of Urban System Resilience: From the Perspective of Complex Adaptive System Theory. Cities 2021, 112, 103141. [Google Scholar] [CrossRef]
- Guo, Z.; Li, Z.; Lu, C.; She, J.; Zhou, Y. Spatio-Temporal Evolution of Resilience: The Case of the Chengdu-Chongqing Urban Agglomeration in China. Cities 2024, 153, 105226. [Google Scholar] [CrossRef]
- Li, H.; Wang, Y.; Zhang, H.; Yin, R.; Liu, C.; Wang, Z.; Fu, F.; Zhao, J. The Spatial-Temporal Evolution and Driving Mechanism of Urban Resilience in the Yellow River Basin Cities. J. Clean. Prod. 2024, 447, 141614. [Google Scholar] [CrossRef]
- Wang, H.; Xue, H.; He, W.; Han, Q.; Xu, T.; Gao, X.; Liu, S.; Jiang, R.; Huang, M. Spatial-Temporal Evolution Mechanism and Dynamic Simulation of the Urban Resilience System of the Guangdong-Hong Kong-Macao Greater Bay Area in China. Environ. Impact Assess. Rev. 2024, 104, 107333. [Google Scholar] [CrossRef]
- Xu, J.; Shao, Y. Resilient Cities: A New Shift to Urban Crisis Management. Urban Plan. Int. 2015, 30, 1–3. [Google Scholar]
- Zhao, S.; Zeng, W.; Feng, D. Coupling Coordination of Urban Resilience and Urban Land Use Efficiency in Hunan Province, China. Sustainability 2024, 16, 10860. [Google Scholar] [CrossRef]
- Hofmann, S.Z. 100 Resilient Cities Program and the Role of the Sendai Framework and Disaster Risk Reduction for Resilient Cities. Prog. Disaster Sci. 2021, 11, 100189. [Google Scholar] [CrossRef]
- Meerow, S.; Newell, J.P.; Stults, M. Defining Urban Resilience: A Review. Landsc. Urban Plan. 2016, 147, 38–49. [Google Scholar] [CrossRef]
- Holland, J.H. Hidden Order. Bus. Week-Domest. Ed. 1995, 21, 112–148. [Google Scholar]
- Liu, S.-C.; Peng, F.-L.; Qiao, Y.-K.; Dong, Y.-H. Quantitative Evaluation of the Contribution of Underground Space to Urban Resilience: A Case Study in China. Undergr. Space 2024, 17, 1–24. [Google Scholar] [CrossRef]
- Yao, F.; Li, L.; Liang, J. Spatial and Temporal Evolution of Urban Resilience in China and Analysis of Barriers: Based on a Sustainable Development Perspective. PLoS ONE 2024, 19, e0285113. [Google Scholar] [CrossRef]
- Zhang, S.; Ma, X.; Cui, Q.; Liu, J. Digitalization and Urban Resilience: How Does the Allocation of Digital Factors Affect Urban Resilience under Energy Constraints in China? Environ. Dev. Sustain. 2024, 26, 23613–23641. [Google Scholar] [CrossRef]
- Pan, H.; Yang, Y.; Zhang, W.; Xu, M. Research on Coupling Coordination of China’s Urban Resilience and Tourism Economy—Taking Yangtze River Delta City Cluster as an Example. Sustainability 2024, 16, 1247. [Google Scholar] [CrossRef]
- Sun, J.; Zhai, N.; Mu, H.; Miao, J.; Li, W.; Li, M. Assessment of Urban Resilience and Subsystem Coupling Coordination in the Beijing-Tianjin-Hebei Urban Agglomeration. Sustain. Cities Soc. 2024, 100, 105058. [Google Scholar] [CrossRef]
- Yi, P.; Wang, S.; Li, W.; Dong, Q. Urban Resilience Assessment Based on “Window” Data: The Case of Three Major Urban Agglomerations in China. Int. J. Disaster Risk Reduct. 2023, 85, 103528. [Google Scholar] [CrossRef]
- Liu, W.; Zhou, J.; Li, X.; Zheng, H.; Liu, Y. Urban Resilience Assessment and Its Spatial Correlation from the Multidimensional Perspective: A Case Study of Four Provinces in North-South Seismic Belt, China. Sustain. Cities Soc. 2024, 101, 105109. [Google Scholar] [CrossRef]
- You, X.; Sun, Y.; Liu, J. Evolution and Analysis of Urban Resilience and Its Influencing Factors: A Case Study of Jiangsu Province, China. Nat. Hazards 2022, 113, 1751–1782. [Google Scholar] [CrossRef] [PubMed]
- Liu, R.; Zhang, L.; Tang, Y.; Jiang, Y. Understanding and Evaluating the Resilience of Rural Human Settlements with a Social-Ecological System Framework: The Case of Chongqing Municipality, China. Land Use Policy 2024, 136, 106966. [Google Scholar] [CrossRef]
- Wen, H.; Huang, J.; Qian, L.; Li, Z.; Zhang, Y.; Zhang, J. The Spatial-Temporal Evolution Patterns of Landslide-Oriented Resilience in Mountainous City: A Case Study of Chongqing, China. J. Environ. Manag. 2024, 370, 122963. [Google Scholar] [CrossRef]
- Xiu, C.; Wei, Y. Urban Resilience Assessment of Dalian City Based on “Scale-Density-Morphology”. J. Geogr. 2018, 73, 2315–2328. [Google Scholar]
- Wang, Y.-C.; Shen, J.-K.; Xiang, W.-N.; Wang, J.-Q. Identifying Characteristics of Resilient Urban Communities through a Case Study Method. J. Urban Manag. 2018, 7, 141–151. [Google Scholar] [CrossRef]
- The Plan for the Construction of the Chengdu-Chongqing Economic Circle was jointly issued by the Central Committee of the Communist Party of China (CPC Central Committee) and the State Council of the People’s Republic of China. Available online: https://www.gov.cn/zhengce/2021-10/21/content_5643875.htm (accessed on 5 October 2024).
- Luo, K. Draft Plan for the Physiographic Regionalization of China. Acta Geogr. Sin. 1954, 379–394. Available online: https://kns.cnki.net/kcms2/article/abstract?v=O_n6o0K2eioPwWtLwjzXigQJBrADnuXR47r486CTTTbuEgGblhxHROhAOaFvYEE0uovAlzsC-rwRJLbbifvDwOSzO2wtfdXqMwurgb5kOXifRMU39sUF0If9FxxK2BJTpCSHjprOanaRrtwEfGuS-HSgQZ9mD2ms1CkjvdGF001i9AC6ykI9Mo2YuD1T_Cl7&uniplatform=NZKPT&language=CHS (accessed on 11 October 2024).
- Baoxing, Q. Resilient Urban Design Methods and Principles Based on the Complex Adaptive System Theory. Landsc. Archit. Front. 2018, 6, 42–47. [Google Scholar] [CrossRef]
- Fan, W.C. Modernizing Public Safety Governance with the Construction of a Safe and Resilient City. Frontiers 2022, 14–24. [Google Scholar] [CrossRef]
- Nyström, M.; Jouffray, J.-B.; Norström, A.V.; Crona, B.; Søgaard Jørgensen, P.; Carpenter, S.R.; Bodin, Ö.; Galaz, V.; Folke, C. Anatomy and Resilience of the Global Production Ecosystem. Nature 2019, 575, 98–108. [Google Scholar] [CrossRef]
- Chen, P. Effects of the Entropy Weight on Topsis. Expert Syst. Appl. 2021, 168, 114186. [Google Scholar] [CrossRef]
- Chen, Y.-C. A Tutorial on Kernel Density Estimation and Recent Advances. Biostat. Epidemiol. 2017, 1, 161–187. [Google Scholar] [CrossRef]
- Gong, J. Clarifying the Standard Deviational Ellipse. Geogr. Anal. 2002, 34, 155–167. [Google Scholar] [CrossRef]
- Song, Y.; Wang, J.; Ge, Y.; Xu, C. An Optimal Parameters-Based Geographical Detector Model Enhances Geographic Characteristics of Explanatory Variables for Spatial Heterogeneity Analysis: Cases with Different Types of Spatial Data. GISci. Remote Sens. 2020, 57, 593–610. [Google Scholar] [CrossRef]
- Tien, T.-L. A Research on the Grey Prediction Model Gm (1, N). Appl. Math. Comput. 2012, 218, 4903–4916. [Google Scholar] [CrossRef]
- Poizot, E.; Mear, Y.; Thomas, M.; Garnaud, S. The Application of Geostatistics in Defining the Characteristic Distance for Grain Size Trend Analysis. Comput. Geosci. 2006, 32, 360–370. [Google Scholar] [CrossRef]


Disclaimer/Publisher’s Note: The statements, opinions and data contained in all publications are solely those of the individual author(s) and contributor(s) and not of MDPI and/or the editor(s). MDPI and/or the editor(s) disclaim responsibility for any injury to people or property resulting from any ideas, methods, instructions or products referred to in the content. |
© 2025 by the authors. Licensee MDPI, Basel, Switzerland. This article is an open access article distributed under the terms and conditions of the Creative Commons Attribution (CC BY) license (https://creativecommons.org/licenses/by/4.0/).