Article

Research on the Evolutionary Game of Quality Governance of Geographical Indication Agricultural Products in China: From the Perspective of Industry Self-Governance

by
Guanbing Zhao
1,2 and
Kuijian Zhan
1,*
1
School of Management, Jiangsu University, Zhenjiang 212013, China
2
School of Intellectual Property, Jiangsu University, Zhenjiang 212013, China
*
Author to whom correspondence should be addressed.
Sustainability 2025, 17(8), 3414; https://doi.org/10.3390/su17083414
Submission received: 16 February 2025 / Revised: 6 April 2025 / Accepted: 8 April 2025 / Published: 11 April 2025

Abstract

:
Clarifying stakeholder demands and establishing an efficient quality governance system are key to geographical indication development. Current frameworks focus on government oversight, neglecting industry self-governance through associations. A four-party evolutionary game model—production organizations, governments, associations, and consumers—was developed to explore the impact of self-governance on quality. Results show association-led self-governance reduces government burdens and improves efficiency. Its success depends on government support and fair interest distribution. Additionally, the evolutionary system exhibits two optimal equilibrium points at different stages of geographical indication development. Even under relatively relaxed supervision by local governments, the governance system remains functional during the mature development phase. Lastly, a reputation mechanism incorporating consumer participation can effectively shape the decision-making processes of production organizations, while the costs associated with governance participation and complaints play a critical role in influencing consumer strategy choices.

1. Introduction

Agricultural geographical indications constitute an essential lever for the development of rural industries and a significant means to achieve rural revitalization. The Ministry of Agriculture and Rural Affairs of China indicated in its Notice on the Implementation Plan for Supporting Poverty-stricken Areas to Develop Regional Public Brand (2023–2025) [1]. that industrial revitalization is the foremost priority for rural revitalization, and that agricultural brands serve as an important symbol of industrial prosperity. In recent years, the growing concern among consumers regarding food quality and safety has significantly boosted the demand for organic agricultural products. As most geographical indication agricultural products are categorized as organic foods, they have become increasingly preferred by consumers [2]. Geographical indications, as a vital carrier of agricultural brands, play an irreplaceable role in promoting agricultural development, consolidating the achievements of poverty alleviation in local areas, and increasing the income of small- and medium-sized farmers. As of the end of 2023, China had approved 2508 geographical indication products, registered 7277 geographical indications as collective trademarks and certification marks, and the total number of business entities operating geographical indication specialty mark logos had reached 26,000. The annual output value of geographical indication products exceeded 800 billion yuan [3].
As an experience good, agricultural products are such that ordinary consumers, owing to the deficiency of information and experience, can merely purchase based on the reputation of the brand. The distinctive quality of agricultural products with geographical indications stems from the unique natural or cultural factors of their place of origin, which can furnish consumers with greater confidence in quality. Hence, as a collective and credible quality certification tool, the brand reputation of geographical indications is of great significance [4]. Nevertheless, as an internally non-competitive collective asset, the reputation-sharing value characteristic of geographical indications [5] exposes it to the risk of collective reputation impairment caused by the speculative behavior of individual manufacturers. As Jean Tirole (1996) demonstrated, new members in a collective organization might still suffer from the original sin of the old members long after their departure [6]. Consequently, the damage to the collective reputation can lead the entire brand into a crisis. For example, in the production area of Northeast China’s Wuchang rice, some manufacturers outside the region purchase low-cost rice and sell it as authentic Wuchang rice. In 2023, the well-known Chinese brand “Golden Dragon Fish” was exposed for allegedly using substandard rice from outside the region, specifically “Zhongkefa No. 5”, to counterfeit high-quality “Jiaohuaxiang No. 2”. By evading regulatory inspections and labeling the product with the geographical indication of “Wuchang Rice”, this practice severely infringed upon consumer rights. Similarly, Suzhou’s Yangcheng Lake hairy crabs have long been plagued by counterfeit products such as “bath crabs” and “watered crabs” [7]. Yangcheng Lake, located near the mouth of the Yangtze River, features clear water with a slightly alkaline pH and a hard sandy lake bottom, providing an ideal environment for raising hairy crabs known for their fine texture, delicious flavor, and high nutritional value. However, due to the limited crab farming capacity of Yangcheng Lake, some unscrupulous vendors transport crabs raised elsewhere to Yangcheng Lake, soak them briefly, and then sell them as “Yangcheng Lake Hairy Crabs”. A key reason why such fraudulent practices persist despite repeated bans is the difficulty in effective supervision. Although government agencies are primarily responsible for market regulation, their capacity is constrained by information asymmetry and numerous blind spots in oversight, making it challenging to manage these incidents effectively. This situation significantly impedes the healthy development of geographical indication brands for agricultural products in China. As Liu et al. (2016) highlighted, the circulation process of agricultural products is a critical determinant of their quality, with distribution and transportation posing significant barriers to ensuring safe supply [8]. The inherent complexity of this process complicates government oversight. Consequently, it is imperative to engage all stakeholders in the quality governance of geographical indication (GI) agricultural products, thereby enhancing GI brand value and protecting shared interests. Thus, guiding collaborative efforts toward governing the quality of GI agricultural products to preserve brand reputation represents the paramount concern in advancing GI development. Therefore, mobilizing all stakeholders to participate in the quality governance of geographical indication agricultural products is essential for building strong brands and safeguarding shared interests. Guiding all parties to govern the quality of geographical indication agricultural products and maintain brand reputation is thus the top priority in the current development of geographical indications.
As the pioneer in adopting geographical indications as an industrial policy tool, the European Union has cultivated numerous globally renowned agricultural product brands over its long history of agricultural production, such as French champagne, Swiss cheese, and Italian Parma ham. To tackle the challenges arising during the development of geographical indications, the EU places significant emphasis on their protection and has established a comprehensive set of legal norms. Many scholars have conducted extensive research on this topic, offering valuable insights into China’s geographical indication development. For instance, Wang et al. (2025) [9], using the Swiss cheese market as an example, highlighted that quality differentiation in the cheese market enables producers to achieve higher and more stable prices. The effectiveness of this approach largely hinges on the strength of geographical indication protection and the governance mechanisms implemented by producer organizations [9]. Similarly, Menapace & Moschini (2014) demonstrated that when producers of geographical indications receive more robust protection, they are incentivized to use geographical indication labels to secure genuine quality premiums, thereby fostering the sustainable development of the industry [10]. However, the protection of geographical indications cannot be solely entrusted to the government or individual enterprises. Quinones-Ruiz et al. (2017), through a comparative analysis of the geographical indication registration processes in Italy and Austria, revealed that the active participation of multiple stakeholders and the deep involvement of enterprises can enhance industry trust and social cohesion, effectively facilitating the adoption of geographical indication labels and the enforcement of quality standards [11]. Boga et al. (2023) [12] further underscored the critical role of public institutional support and the presence of producer management organizations in advancing the development of geographical indications. Thus, effective producer management and quality governance are indispensable for the thriving of the geographical indication industry [12]. Additionally, regarding the interplay between geographical indications and rural development, several scholars have conducted Europe-based studies. For example, Cei et al. (2018), drawing on the EU’s geographical indication policies, synthesized relevant literature and affirmed that geographical indications serve as a potent tool for stimulating rural development [13]. Poetschki et al. (2021) [14] employed quantitative analysis methods to examine the impact of geographical indication adoption on the income of rural wine and olive farms in 2014. Their findings indicated that the use of geographical indications significantly boosted farm income, underscoring their potential to drive rural economic growth [14].
China’s geographical indication (GI) system was established relatively late, and its national conditions differ significantly from those of Europe. Additionally, the public infrastructure in rural areas remains underdeveloped, leading to a heavy reliance on local government leadership for GI development. Nevertheless, various organizations, including agricultural production cooperatives and industry associations, have also actively participated in GI construction. Similar to Europe, China’s GI development focuses primarily on GI protection and quality governance. Against this backdrop, numerous studies have investigated strategies for enhancing the quality governance of China’s GI agricultural products. For instance, Dong Y and Qian W (2022) contend that information asymmetry is the root cause of the “free-riding” phenomenon in the construction of regional public brands for agricultural products and propose establishing a digital information traceability system to effectively address this issue [15]; Cheng J and Zheng S (2018), based on self-organizing theory, suggest that farmers’ self-organizing behavior can effectively control some “free-riding” behaviors and enhance product quality [16]. Nevertheless, the public nature of geographical indications dictates that regardless of the adopted strategy, the active engagement of multiple stakeholders is requisite for effective implementation [17]. The government, as the provider and manager of public goods, constitutes the main driving force for the development of geographical indication brands [18], particularly in the initial stage of brand development. Moderate government subsidies can stimulate the participation of all parties involved in geographical indication construction, and facilitate the improvement of the quality and brand value of geographical indication products [19,20,21]. However, the government aims to maximize social benefits, thereby lacking the initiative to participate in the market [22]. Hence, it is essential to have industry associations capable of representing the collective economic interests of the region to operate and manage geographical indication brands. Industry associations can ensure the maintenance of product quality and uniqueness by formulating strict production and processing standards [23] and integrating industry resources to assist production organizations in conducting specialized production. Other market operators, such as leading enterprises, can further unify production technologies and quality standards, thereby significantly elevating the premium level and image of regional public brands [24]. For instance, by collaborating with research institutions to develop advanced production management approaches, the optimization of agricultural cultivation through effective protective planting and irrigation techniques can not only promote agricultural sustainability [25,26] but also enhance the nutritional value and yield of agricultural products [26,27,28]. Simultaneously, introducing advanced detection technologies for agricultural products, such as non-destructive testing and other rapid methods for detecting harmful substances, can further ensure the quality of geographical indication of agricultural products entering the market [29,30,31]. Additionally, the governance of product quality is inseparable from the role of social supervision mechanisms. Incorporating consumer participation in supervision is an effective strategy to tackle the insufficient quality awareness of enterprises and the inadequate regulatory efforts of the government [32].
In conclusion, the quality governance of geographical indications ought to be jointly engaged in by agricultural product production organizations, local governments, industry associations, and consumers, which highly accords with the value co-creation theory from the perspective of the service ecosystem. The value co-creation theory in the service ecosystem perspective emphasizes that all economic and social participants within the service ecosystem are resource integrators and different subjects build a brand jointly with the aim of creating value together [33]. Lu and Sun (2022) integrated this theory with the practical problems of geographical indication development and pointed out that the construction of agricultural product regional brands is conducted in a value co-creation ecosystem, and the government, enterprises, industry associations, and consumers are the core stakeholders in the construction of agricultural product regional brands [34]. Based on this, this paper formulates an evolutionary game model composed of four main participants—agricultural product production organizations, local governments, industry associations, and consumers—under the framework of industry self-governance, aiming to answer the following questions: What factors influence the strategic choices of each party participating in quality governance? Can the industry self-governance mechanism centered on industry associations function effectively and operate sustainably? How should local government intervention strategies be formulated under industry self-governance? The main contribution of this paper is to propose a new model of geographical indication agricultural product quality governance based on industry self-governance, disclose the intrinsic mechanism of collaborative governance and value co-creation under the new model, coordinate the interests of major participating entities, enhance the willingness of all parties to co-create value, and ultimately achieve efficient governance of geographical indication agricultural products.

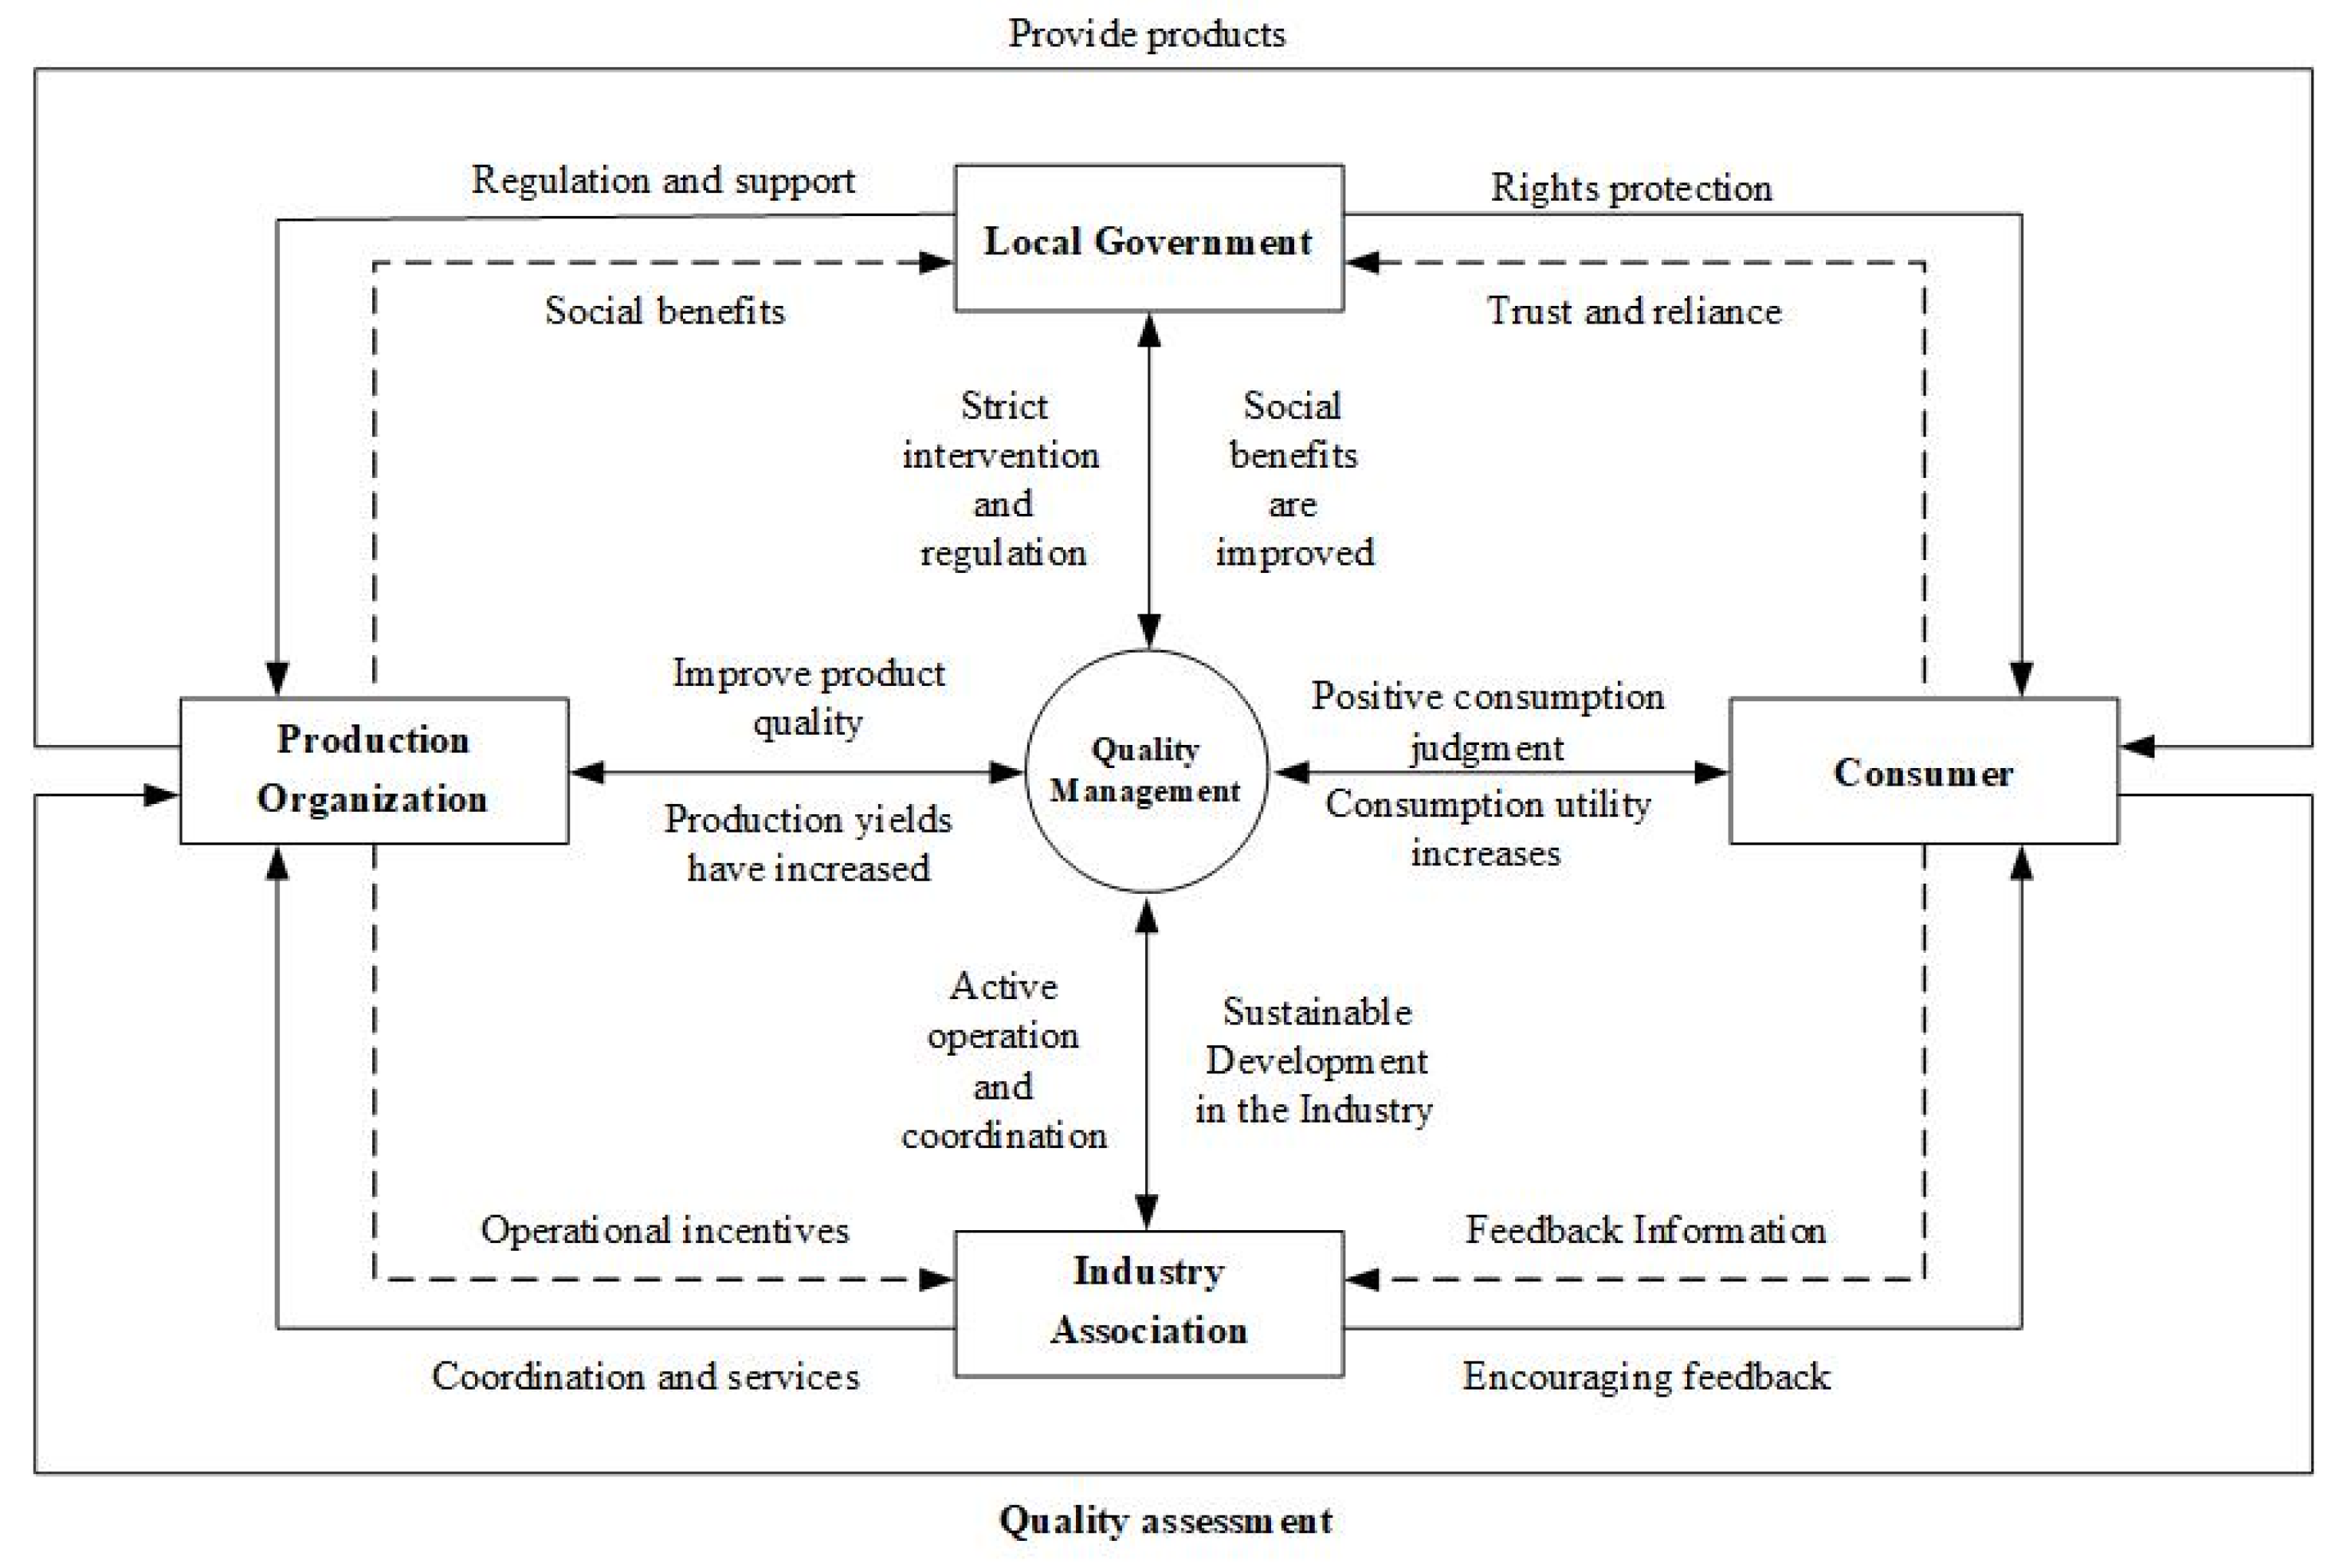
2. Model Assumptions and Construction

2.1. Model Assumptions

In the construction of geographical indications in China, the leading role of local governments is deeply rooted in the “central-local” hierarchical governance system. Within the framework of the rural revitalization strategy, local governments shoulder dual responsibilities for industrial development and quality supervision. Their regulatory actions are not only governed by laws such as the “Agricultural Product Quality and Safety Law” and the “Regulations on the Protection of Geographical Indication Products”, but are also directly tied to the “quality and safety” indicators in official performance evaluations. This institutional pressure compels local governments to balance fiscal costs while responding to accountability demands from higher authorities, thereby forming a dynamic equilibrium in their strict regulatory strategies. Furthermore, the enhanced functions of industry associations are closely linked to recent reforms promoting industry self-governance in China. Since the decoupling of industry associations from administrative bodies in 2017, their roles in standard-setting (e.g., the “Administrative Measures for the Use of Geographical Indication Special Marks”) and technical training have significantly expanded. Their resource integration capabilities and industry credibility now serve as key drivers of self-regulatory mechanisms, requiring industry associations to sustain their survival and development through effective coordination. Additionally, the feasibility of consumer participation in governance is bolstered by digital technology’s innovation of traditional regulatory models. The “Internet + Supervision” platform promoted by the State Administration for Market Regulation, along with the “one-click complaint” mechanism on e-commerce platforms, has substantially reduced the cost of consumer rights protection. Moreover, under the “new consumption” trend, the public’s increased willingness to pay for high-quality agricultural products further incentivizes consumers to engage in governance and achieve value co-creation. Finally, the sensitivity of reputation mechanisms vividly reflects both the cultural characteristics and regulatory deficiencies of the Chinese market. The fragility of collective reputation, exemplified by incidents like the “Yangcheng Lake Bathing Crabs”, reveals that the cost of restoring reputation far exceeds the initial investment in building it. This asymmetry in risk intensifies the constraining impact of reputation loss on producers’ strategic decisions.
The quality governance of agricultural products with geographical indications encompasses multiple stakeholders, and the interests of each stakeholder vary to some extent. To achieve mutual benefits and win–win results for all stakeholders, by integrating the value co-creation theory, we have identified the main stakeholders involved, namely agricultural product production organizations (hereinafter referred to as production organizations), local governments, industry associations, and consumers. Production organizations will make decisions on whether to collaborate with the government and industry associations for production based on external incentive policies and regulatory intensity, their own business conditions, and market situations. Local governments participate in quality maintenance primarily by strictly regulating production organizations, providing operating subsidies to industry associations, and handling complaints from consumers. Industry associations play a crucial role in standardizing production processes, maintaining brand image, coordinating relationships among various parties, and promoting information technology in numerous aspects. Consumers, conversely, decide whether to participate in the governance process based on the additional benefits they obtain from their purchasing behavior (i.e., consumer surplus). The quality governance model is presented in Figure 1.
Based on this, the following hypotheses are put forward:
Assumption 1. 
Given that the quality governance of geographical indication agricultural products involves complex interest relationships, each subject’s decision-making during the game process is constrained by their level of information access. As a result, it is challenging to fully adhere to the “maximization of benefits” principle when determining the optimal strategy. Instead, subjects progressively evolve toward better choices through continuous learning and strategy adjustment. Therefore, it is assumed that each subject operates under bounded rationality in making strategic decisions. Furthermore, the core objective of this model is to uncover the evolutionary equilibrium mechanism of multi-agent collaboration. Incorporating behavioral factors would substantially increase the model’s complexity and obscure the analysis of the main effects of core variables. Simultaneously, drawing on Li et al. (2022) [19], the costs incurred by all parties, the coordination parameters of industry associations, and the probability of successful supervision collectively reflect the stable state determined by current technological conditions and policy environments. These conditions and environments typically exhibit a certain degree of medium-term stability. Hence, to simplify the model, the influence of behavioral factors on evolution is temporarily disregarded, and it is assumed that all parameters within this model remain static.
Assumption 2. 
The strategy space of production organizations is (Self-regulated Production, Unregulated Production), and they select Self-Regulated Production and Unregulated Production with probabilities of   x and 1 x , respectively. The strategy space of local governments is (Strict Regulation, Loose Regulation), and they choose Strict Regulation and Loose Regulation with probabilities of y and 1 y , respectively. The strategy space of industry associations is (Active Compliance, Passive Compliance), and they opt for Active Compliance and Passive Compliance with probabilities of z and 1 z , respectively. The strategy space of consumers is (Participation in Governance, Non-Participation in Governance), and they decide on Active Consumption and Passive Consumption with probabilities of w and 1 − w, respectively ( x , y , z , w [ 0,1 ] ) .
Assumption 3. 
The agricultural products produced by production organizations will initially undergo internal inspections by industry associations and then be inspected by the relevant departments of local governments. Only after passing both inspections are the agricultural products considered to meet the quality standards and allowed to be sold with geographical indication trademarks. If they fail to pass the quality inspection, they are regarded as general agricultural products and can only be sold at regular prices, without the brand premium brought by geographical indication brands. Let the probability of successful inspection by the local government be α , the probability of successful inspection by the industry association be β , and the probability of successful inspection when both parties are involved be γ . Since industry associations are more professional in inspection than local governments, it is assumed that 0 < α < β < γ < 1 .
Assumption 4. 
Self-disciplined production by production organizations ensures product quality. In this case, the incremental production cost compared to ordinary agricultural products is denoted as C x . When agricultural products are sold under the geographical indication label, they generate additional revenue R x for the production organization. If consumers participate in governance and consume high-quality geographical indication products that meet their expectations, they are likely to promote these products through the Internet and other channels. This enhances the brand reputation of the production organization, generating additional income K 1 . Conversely, if consumers encounter low-quality agricultural products that have evaded supervision and entered the market, it leads to a loss of brand reputation, represented as K 2 . Drawing on Xia et al.’s (2023) analysis of the reputation mechanism in evolutionary game theory [34], the influence of reputation in real-world scenarios often exhibits nonlinear or threshold effects, with the negative impact of reputation outweighing its positive benefits. Consequently, we define K 1 = K 1 w = k 10 × m ε and K 2 = K 2 m = k 20 × m μ , where  m denotes the intensity of social public opinion, and ε and μ represent the elasticity coefficients of this intensity. It is assumed that K 1 < K 2 and ε < μ.
Assumption 5. 
The local government’s strict regulation will incur additional costs of C y . If the local government actively regulates, it will bring certain regulatory benefits R y to the local government, including subsidies from higher-level governments and recognition from local enterprises and people. When the local government regulates successfully, it will impose a penalty on the production organization, set at F 1 . If the production organization produces products that ultimately sell as geographical indication products, it will bring an increase in tax revenue U to the local government. If the low-quality products produced by the production organization enter the market under the guise of geographical indication products and are consumed by consumers participating in governance, the local government will be held accountable by the higher-level government and suffer reputational loss N 1 .
Assumption 6. 
Industry associations that actively discharge their responsibilities will receive certain benefits R z , including donations from relevant enterprises and other non-market incomes, as well as subsidies from local governments S. The additional cost at this juncture is C z . Sufficient funds are a prerequisite for industry associations to actively discharge their responsibilities. When the association actively fulfills its duties, it will offer consulting and technical training services to enterprises that choose self-disciplined production, thereby saving them production cost B 1 . It will also actively assist local governments in regulation, thereby reducing their regulatory cost B 2 . Simultaneously, the association will actively disclose information on the quality of geographical indication products and how to identify them, thereby saving consumers the cost of collecting information B 3 . For the sake of simplicity, it is assumed that if the association successfully regulates production organizations that produce low-quality agricultural products that do not meet requirements, it will impose a penalty F 1 on them. If the industry association opts for passively fulfilling its responsibilities when enterprises choose self-disciplined production, it will suffer reputational loss N 2 , manifested as production organizations considering the association inactive and losing trust, thus refusing to pay membership fees, etc.
Assumption 7. 
Consumer participation in governance requires a certain expense and opportunity cost to understand and learn relevant information and use relevant channels for quality evaluation. The cost of investment is denoted as C w . In this situation, if the consumer purchases a low-quality agricultural product that does not meet expectations, they are willing to pay a cost of D   ( D > B 3 ) to report to the government regulatory department. Upon successful reporting, they will receive compensation F 2 from the production organization. Additionally, it is assumed that if the consumer chooses to participate in governance, it indicates that their demand for geographical indication agricultural products is large and their willingness to pay is high. Conversely, it indicates that the consumer’s demand for geographical indication agricultural products is low and their willingness to pay is low. According to the theory of consumer surplus, the consumer surplus of the consumer who participates in governance and consumes high-quality geographical indication products that meet expectations is denoted as E 1 ; the consumer surplus of the consumer who participates in governance and consumes normal-priced ordinary agricultural products equivalent to high-quality products when not participating in governance is denoted as E 2 ; although the consumer’s willingness to pay for geographical indication agricultural products is insufficient when not participating in governance, they still hold a negative attitude towards paying a premium and receiving low-quality products. Therefore, it is assumed that the consumer surplus when the consumer does not participate in governance and when they participate in governance and purchase low-quality agricultural products is the same, denoted as E 3 ( E 1 > E 2 > E 3 ) .
Based on the theoretical analysis and model assumptions, the parameters, settings, and symbol meanings are shown in Table 1.

2.2. Model Building and Solution

Based on the behavior strategies of the production organization, local government, industry association, and consumers, in combination with the model assumptions and parameter settings, we obtain the payoff matrix (Table 2) for the four strategic actors, and subsequently construct the replicator dynamic equations for their behavior strategies.
The elements of the payoff matrix are as follows:
P 1 = R x C x + B 1 + K 1 P 2 = R x C x + B 1 P 3 = R x C x + K 1 + B 1 P 4 = R x C x + B 1 P 5 = 1 γ ( R x F 2 K 2 ) F 1 P 6 = ( 1 γ ) R x γ F 1 P 7 = ( 1 β ) ( R x F 2 ) F 1 P 8 = ( 1 β ) R x β F 1 P 9 = R x C x + K 1 P 10 = R x C x P 11 = R x C x + K 1 P 12 = R x C x P 13 = ( 1 α ) ( R x F 2 K 2 ) F 1 P 14 = ( 1 α ) R x α F 1 P 15 = R x F 2 K 2 P 16 = R x G 1 = R y C y S + B 2 + U G 2 = R y C y S + B 2 + U G 3 = U S G 4 = U S G 5 = 1 γ ( U N 1 ) + R y + B 2 C y S G 6 = 1 γ U + R y + B 2 C y S G 7 = 1 β ( U N 1 ) S G 8 = 1 β U S G 9 = R y C y + U G 10 = R y C y + U G 11 = U G 12 = U G 13 = ( 1 α ) ( U N 1 ) + R y C y + F 1 G 14 = ( 1 α ) U + R y C y + α F 1 G 15 = U N 1 G 16 = U A 1 = R z + S C z A 2 = R z + S C z A 3 = R z + S C z A 4 = R z + S C z A 5 = R z + S C z + F 1 A 6 = R z + S C z + γ F 1 A 7 = R z + S C z + F 1 A 8 = R z + S C z + β F 1 A 9 = N 2 A 10 = N 2 A 11 = N 2 A 12 = N 2 A 13 = 0 A 14 = 0 A 15 = 0 A 16 = 0 C 1 = E 1 C w + B 3 C 2 = E 2 C 3 = E 1 C w + B 3 C 4 = E 2 C 5 = γ E 2 + 1 γ ( E 3 + F 2 ) C 6 = γ E 2 + 1 γ E 3 C 7 = β E 2 + 1 β ( E 3 + F 2 ) C 8 = β E 2 + 1 β E 3 C 9 = E 1 C w C 10 = E 2 C 11 = E 1 C w C 12 = E 2 C 13 = α E 2 + 1 α ( E 3 + F 2 ) C 14 = α E 2 + 1 α E 3 C 15 = E 3 C w D + F 2 C 16 = E 3
Evolutionary game theory adopts the principle of “survival of the fittest” from biological evolution as its logical foundation and highlights the limited rationality of actors in real-world scenarios. According to this theory, individual decision-making is not based on fully rational calculations but evolves dynamically through strategic interactions among groups, such as learning from experience, adaptive adjustments, and random mutations [35]. In this process, low-fitness strategies are gradually phased out due to their inferior utility, while high-utility strategies are widely adopted through positive feedback mechanisms, eventually leading to the establishment of a stable strategic equilibrium at the population level [36]. As the core analytical framework of evolutionary game theory, drawing on the research of Taylor & Jonker (1978) [37], constructing the replicator dynamics equation requires defining a strategy set containing two pure strategies. Let the proportion of individuals in the population adopting strategy S 1 be ρ , and the proportion of individuals adopting strategy ρ be   1 ρ . At this point, the replicator dynamics equation for strategy S 1 can be expressed as follows:
F ρ = d ρ d t = ρ E 1 E ¯
Here, E 1 represents the expected payoff of the pure strategy S 1 , while E ¯   denotes the average expected payoff of the mixed strategy. The aforementioned equation characterizes the evolutionary pattern of strategy distribution within a single population. To extend this framework to multiple populations, the dynamic system of multiple populations can be derived by jointly solving their respective replicator dynamic equations.
If the agricultural product production organization opts for the “self-disciplined production” strategy, its expected benefit is E 11 ; and if it selects the “unregulated production” strategy, its expected benefit is E 10 , with the average benefit being E ¯ 1 . If the local government chooses the “strict regulation” strategy, its expected benefit is E 21 ; and if it selects the “lax regulation” strategy, its expected benefit is E 20 , with the average benefit being E ¯ 2 . If the industry association selects the “active responsibility” strategy, its expected benefit is E 31 ; and if it opts for the “passive responsibility” strategy, its expected benefit is E 30 , with the average benefit being E ¯ 3 . If the consumer chooses the “participate in governance” strategy, its expected benefit is E 41 ; and if it selects the “do not participate in governance” strategy, its expected benefit is E 40 , with the average benefit being E ¯ 4 .
(1)
The replication dynamic equation of agricultural product production organizations
The expected return from self-regulated production by agricultural product production organizations is as follows:
E 11 = y z w P 1 + y z 1 w P 2 + 1 y z w P 3 + 1 y z 1 w P 4 + y 1 z w P 9 + y 1 z 1 w P 10 + 1 y 1 z w P 11 + 1 y 1 z 1 w P 12 = R x C x + z B 1 + w K 1
The expected return from unregulated production by agricultural product production organizations is as follows:
E 10 = y z w P 5 + y z 1 w P 6 + 1 y z w P 7 + 1 y z 1 w P 8 + y 1 z w P 13 + y 1 z 1 w P 14 + 1 y 1 z w P 15 + 1 y 1 z 1 w P 16 = y z w 1 γ F 1 + R x γ 1 w y 1 z 1 F 2 + K 2 R x w y z F 1 γ 1 F 2 + K 2 R x R x w 1 y 1 z 1 + w z F 1 F 2 R x b 1 y 1 y w 1 α F 2 + R x α 1 z 1 z w 1 y 1 β F 1 + R x β 1 + w y F 1 α 1 F 2 + K 2 R x z 1
The average expected return for agricultural production organizations is as follows:
E ¯ 1 = x E 11 + 1 x E 10 = α + β γ 1 F 1 + α F 2 + K 2 + β F 2 γ F 2 K 2 γ 1 w R x + F 1 α + β γ x 1 y x 1 β 1 F 1 + β F 2 + K 2 w + F 1 β + R x β + B 1 x β R x + F 1 z x 1 α 1 F 1 + α F 2 + K 2 w α R x + F 1 y + F 2 + K 1 + K 2 x F 2 K 2 w x C x + R x
The dynamic equation can be copied as follows:
F x = d x d t = x E 11 E ¯ 1 = x 1 x α y z β y z + γ y z + α y + β z R x + ( α w y z γ w y z α w y + w y z w z + w ) K 2 + α w y z + β w y z γ w y z α w y α y z β w z β y z + γ y z w y z + α y + β z + w y + w z F 1 C x + α w y z + β w y z γ w y z α w y β w z + w F 2 + B 1 z + K 1 w
(2)
The replication dynamic equation of local governments
The expected benefit of stricter regulation by local governments is as follows:
E 21 = x z w G 1 + x z 1 w G 2 + 1 x z w G 5 + 1 x z 1 w G 6 + x 1 z w G 9 + x 1 z 1 w G 10 + 1 x 1 z w G 13 + 1 x 1 z 1 w G 14 = F 1 N 1 w F 1 + U z 1 x 1 α + x 1 γ N 1 + F 1 z F 1 + N 1 w + x γ U γ U + B 2 S z + R y + U C y
The expected benefits of relaxed regulatory oversight by local governments are as follows:
E 20 = x z w G 3 + x z 1 w G 4 + 1 x z w G 7 + 1 x z 1 w G 8 + x 1 z w G 11 + x 1 z 1 w G 12 + 1 x 1 z w G 15 + 1 x 1 z 1 w G 16 = β w x 1 N 1 + U x 1 β S z + w x 1 N 1 + U
The average expected return for local governments is as follows:
E ¯ 2 = y E 21 + 1 y E 20 = x 1 F 1 N 1 α F 1 + β + γ N 1 w + F 1 U α U β γ x + F 1 + U α + U β γ + B 2 z + x 1 F 1 N 1 α F 1 w F 1 U α x + F 1 U α C y + R y y + β w x 1 N 1 + U β x U β S z + w x 1 N 1 + U
The dynamic equation can be copied as follows:
F y = d y d t = y E 21 E ¯ 2 = y 1 y α x + α z + β z α x z β x z + γ x z γ z α U + ( α w x z + β w x z γ w x z α w x α w z β w z + γ w z + α w ) N 1 + ( α w x z + α w x + α w z + α x z + w x z α w α x α z w x w z + α + w ) F 1 + B 2 z C y + R y
(3)
The replication dynamic equation of industry associations
The expected benefits of industry associations actively fulfilling their responsibilities are as follows:
E 31 = x y w A 1 + x y 1 w A 2 + 1 y x w A 3 + 1 x y 1 w A 4 + 1 x y w A 5 + y 1 x 1 w A 6 + 1 x 1 y w A 7 + 1 x 1 y 1 w A 8 = x 1 β γ y β + 1 w + β + γ y + β F 1 + R z C z + S x y w x + y + 1
The expected payoff from industry associations’ inaction is as follows:
E 30 = x y w A 9 + x y 1 w A 10 + 1 y x w A 11 + 1 x y 1 w A 12 + 1 x y w A 13 + y 1 x 1 w A 14 + 1 x 1 y w A 15 + 1 x 1 y 1 w A 16 = N 2 w x y 1 N 2 w x y + N 2 x y w 1 N 2 y w 1 x 1
The average expected return for industry associations is as follows:
E ¯ 3 = z E 31 + 1 z E 30 = F 1 β γ x + F 1 β γ S N 2 R z + C z y + β 1 F 1 + S + N 2 + R z C z x β 1 F 1 w + F 1 β γ x + β + γ F 1 + S + N 2 + R z C z y x 1 F 1 β C z + R z + S z N 2 x y w + y
The dynamic equation can be copied as follows:
F z = d z d t = z E 31 E ¯ 3 = z 1 z w x w y x + y + 1 S + R z + w x w y + y N 2 + γ w x y + β w x + β w y + β x y β w x y γ w y γ x y β w β x β y + γ y w x + β + w F 1 + w y w x + x y 1 C z
(4)
The replication dynamic equation of Consumer
The expected benefits of consumer participation in governance are as follows:
E 41 = x y z C 1 + x 1 y z C 3 + 1 x y z C 5 + 1 x 1 y z C 7 + x y 1 z C 9 + x 1 y 1 z C 11 + 1 x y 1 z C 13 + 1 x 1 y 1 z C 15 = x 1 α β + γ E 3 + α β + γ F 2 + E 2 α + E 2 β E 2 γ + D + C w y + E 2 β + E 3 β + F 2 β + B 3 C w D x + E 2 β β E 3 β F 2 + D + C w z x 1 E 2 α E 3 α F 2 α + C w + D y + D + E 1 E 3 F 2 x D + E 3 + F 2 C w
The expected benefit of consumer non-participation in governance is as follows:
E 40 = x y z C 2 + x 1 y z C 4 + 1 x y z C 6 + 1 x 1 y z C 8 + x y 1 z C 10 + x 1 y 1 z C 12 + 1 x y 1 z C 14 + 1 x 1 y 1 z C 16 = α + β γ z α E 2 E 3 x 1 y β E 2 E 3 x 1 z + x + 1 E 3 + x E 2
The average expected return for consumers is as follows:
E ¯ 4 = w E 41 + 1 w E 40 = x 1 α β + γ F 2 + D + C w w + α + β γ E 2 E 3 y + F 2 β + B 3 C w D x β F 2 + D + C w w β E 2 E 3 x 1 z x 1 α F 2 + C w + D w + α E 2 E 3 y + D + E 1 E 2 F 2 x D C w + F 2 w + E 2 E 3 x + E 3
The dynamic equation can be copied as follows:
F w = d w d t = w E 41 E ¯ 4 = w w 1 [ ( α x y z + β x y z γ x y z α x y α y z β x z β y z + γ y z + α y + β z + x 1 ) F 2 + x y z + x y + x z + y z x y z + 1 D + x y + x z + y z x y z y z + 1 C w x z B 3 x E 1 + x E 2 ]

3. Analysis of the Stability of Equilibrium Points in the Four-Dimensional Evolutionary Game System

To explore the conditions and process for forming stable strategies in the evolutionary game of quality governance for geographical indication agricultural products, a replicator dynamic system for a four-party game is constructed and solved. By solving F x = 0 , F y = 0 , F z = 0 and F w = 0 , we obtain the equilibrium points of the four-party evolutionary game, which include 16 pure strategy equilibrium points and 1 mixed strategy equilibrium point. The 16 pure strategy equilibrium points are (1, 0, 0, 0), (1, 1, 0, 0), (1, 1, 1, 0), (1, 1, 1, 1), (1, 0, 1, 1), (1, 0, 0, 1), (0, 1, 0, 0), (0, 1, 1, 0), (0, 1, 1, 1), (0, 0, 1, 1), (0, 0, 0, 1), (0, 0, 0, 0), (0, 0, 1, 0), (0, 0, 0, 1), (0, 1, 0, 1), and (1, 0, 1, 0). Based on the conclusion proposed by Ritzberger et al. (1995) [38], the stable solution of the evolutionary game corresponds to a strict Nash equilibrium. Therefore, it is necessary to analyze only the stability of the aforementioned 16 pure strategy equilibrium points.
The Jacobian matrix of the replicator dynamic system is as follows:
J = F ( x ) / x F ( x ) / y F ( x ) / z F ( x ) / w F ( y ) / x F ( y ) / y F ( y ) / z F ( y ) / w F ( z ) / x F ( z ) / y F ( z ) / z F ( z ) / w F ( w ) / x F ( w ) / y F ( w ) / z F ( w ) / w
According to the first Lyapunov rule, the stability of the strategy combination in the four-party game is evaluated. Specifically, if any eigenvalue of the Jacobian matrix corresponding to an equilibrium point is positive, the equilibrium point is deemed unstable; if all eigenvalues are negative, the equilibrium point is asymptotically stable, and the corresponding strategy combination constitutes an Evolutionarily Stable Strategy (ESS). Based on this principle, to further investigate the influence of the industry association’s stable strategy on the overall stability of the game system, the subsequent analysis will be divided into two parts to systematically examine the stability of the 16 pure strategy equilibrium points.

3.1. Analysis of the Stability of Strategic Combination Under the Passive Compliance of Industry Associations

When the stable strategy of the industry association is negative compliance, i.e., when the industry association’s replication dynamic equation satisfies the condition G 3 y < 0 , the stability analysis of the equilibrium point in the replication dynamic system is shown in Table 3.
According to Table 3, in the case where the industry association is inactive in fulfilling its duties, there are five possible stable strategy combinations, namely (1,1,0,1), (1,1,0,0), (1,0,0,1), (0,0,0,0), and (0,0,0,1). There are three stable scenarios where the production organization opts for self-discipline. Among them, only one occurs in the absence of government or industry regulation, which demands that consumers be proficient in safeguarding their own rights and that consumer behavior exerts a significant influence on the product market, such as consumer evaluations having a considerable reputation impact on the product market. In this situation, (1,0,0,1) becomes the stable strategy of the system evolution. Additionally, when industry self-regulation is lacking, the cost of strict government regulation by local governments is higher, which is typically the case in the initial stage of industry development. All parties do not attach great significance to geographical indications, and the upper-level government may offer financial support to local governments. In this case, consumers will decide whether to participate in governance based on the actual situation of regulatory intensity. Thus, (1,1,0,1) and (1,1,0,0) become possible stable strategy combinations. There are two stable situations where the production organization selects non-self-discipline, which might be due to the parties’ lack of a reasonable understanding of geographical indications and their sole focus on short-term interests. The government and the association abandon regulation due to their inattention to the development of geographical indications, resulting in market chaos. Unless consumer behavior has a significant impact on the market and can protect their own legitimate rights by participating in governance, they will choose not to participate in governance for the time being. Therefore, it is necessary to enhance publicity as well as laws and regulations education, and training to raise the awareness of all parties regarding the importance of geographical indications and encourage the government and the association to participate in governance to prevent the emergence of malicious equilibria.

3.2. Analysis of the Stability of Strategic Portfolios Under the Active Responsibility of Industry Associations

When the stable strategy of the industry association is proactive, i.e., when the replication dynamic equation of the industry association satisfies the condition G 3 y > 0 , the stability analysis of the equilibrium point of the replication dynamic system is shown in Table 4.
From Table 4, it can be observed that there are three possible evolutionarily stable combinations when the industry association actively fulfills its responsibilities, namely (1,1,1,1), (1,1,1,0), and (1,0,1,1). It has been found that effective regulatory incentives and reputation mechanisms can compel production organizations to self-regulate, and the higher the consumer surplus obtained by consumers when participating in governance, the stronger the motivation for consumers to participate in governance. The greater the difference between E 1 E 2 and C w B 3 , the lower the regulatory cost for regulators, and the more efficient the equilibrium can be achieved. Additionally, when the regulatory cost increases or the regulatory subsidy provided by the superior government decreases, resulting in C y > B 2 + R y , the local government will opt for lenient regulation. However, due to the existence of a more effective industry self-governance mechanism, the system will still remain in a benign equilibrium. In this case, the legitimate rights and interests of consumers can be protected, the cost of participating in governance can be reduced, and consumers are more inclined to participate in governance, thereby achieving value co-creation.
In conclusion, the above-mentioned evolutionarily stable points correspond to two stages in the development process of geographical indications. The first stage is the nascent stage of the development of the geographical indications industry. During this stage, geographical indication brands need to gain consumer recognition by producing high-quality products to build brand reputation and achieve higher brand premiums. However, at the initial stage, all parties involved lack relevant experience and do not fully appreciate the significance of geographical indication brands. Therefore, the local government, as the representative of collective interests, should enhance its support and supervision over the development of geographical indications at the initial stage. On the one hand, it should intensify supervision over production organizations; on the other hand, it should offer subsidies to industry associations to enhance their willingness to fulfill their duties, thereby motivating production organizations to regulate production voluntarily. The second stage is the mature stage of the development of the geographical indications industry. At this point, production organizations and associations have fully recognized the importance of geographical indication brands, and consumers have formed consumption habits.

4. Simulation Analysis

4.1. Parameter Assignment

To verify the validity of the aforementioned four-party evolutionary game analysis conclusion, this paper employs Matlab R2020a for numerical simulation and analysis to investigate the impact of varying parameter changes on the system’s evolutionary trajectory. A rational evolutionary game necessitates that variable parameters align with economic assumptions and empirical judgments. Drawing on relevant data regarding geographical indication construction from existing studies, authoritative institutional reports, and selected policy documents, values are assigned to each parameter corresponding to every type of participant.
(1)
According to the survey data on the production and consumption of “Three Standards and One Brand” released by the Suzhou Municipal Bureau of Agriculture and Rural Affairs [39], the additional cost for most production organizations adopting standardized production is typically 20% to 50% higher than that of conventional production. Taking the median value of 35%, and considering that the premium level for most geographical indications ranges from 20% to 50%, combined with the research by Jiang et al. (2023) on the premium of agricultural product geographical indications [40], the premium level for agricultural product geographical indications is approximately 32%. Therefore, in this study, the premium level is set at 32%, with C x set at 15 and R x at 21. According to the “ Measures for the Protection of Geographical Indications Products” [41], and the “Product Quality Law of the People’s Republic of China” [42], individuals or entities forging or misappropriating certification marks will have their illegal products confiscated and be fined an amount not exceeding the value of the goods. Based on publicly available administrative penalty information from Jining City, Shandong Province, F 1 is set at 4. Additionally, according to the “Food Safety Law” of China [43], consumers can demand that producers pay ten times the price or three times the loss for producing food that does not meet standards. Combined with the research by Huo & Liu (2024) on the supervision of agricultural product quality and safety [44], F 2 is set at 1.5. Drawing on the research by Wu et al. and Xia et al. [45,46], k 10 , k 20 , m , ε and μ are, respectively, set at 2, 3, 1.2, 1.1, 1, and 4;
(2)
Based on the research by Guo et al. (2023) regarding government intervention in the development of agricultural product brands [47], and in conjunction with the 2024 budget data from the Ganzhou Municipal Bureau of Agriculture and Rural Affairs [48], the values of C y and R y are set at 8 and 10, respectively. Given that the current tax rate imposed by the Chinese government on agricultural products is 9%, U   is set to 2. Drawing on the accountability scenarios for local governments in product quality supervision as outlined in the study by Zhao et al. (2023) [49], N 1 is assigned a value of 4. Furthermore, concerning the success probabilities of supervision conducted by local governments and industry associations, this paper references the research by Wu et al. (2024) on quality investment behavior in the food supply chain under the framework of social co-governance [45], setting α , β and γ to 0.4, 0.5, and 0.7, respectively;
(3)
Referring to the charter of the Ganzhou City Gan Nan Tangerine Industry Association [50], the cost of fulfilling the association’s duties includes expenses for skills training and supervision. Based on the research by Li et al. (2022) [19], C z is set at 6. According to Qi et al. (2009)’s study on the role of industry associations in agricultural industrialization [51], R z is set at 5, while B 1 , B 2 and B 3 are assigned values of 3, 2, and 0.2, respectively. Drawing on the budget data from the Ganzhou City Agricultural and Rural Affairs Bureau for 2024, which allocates 70,000 yuan for rural cooperative economies, and combining this with the notice issued by the Ministry of Finance in 2018 [52], as well as Lyu (2015) ’s research [53], local governments support association development through service procurement and other means and provide rewards to entities obtaining geographical indication product status. Therefore, S is set at 4. Referring to the trust crisis triggered by the inaction of the “Northeast Rice” association, the failure of industry associations to act can lead to reputation losses (e.g., member attrition). Hence, N 2 is set at 3;
(4)
Drawing on Saïdi et al. (2020)’s research on consumers’ willingness to pay for geographical indication products [54] and the analysis of consumer surplus presented in Wu et al. (2024)’s study on consumer strategy selection [45], E 1 and E 2 are set to 2 and 1, respectively, the value of C w is 0.3.
The initial values assigned to each parameter are summarized in the table below.

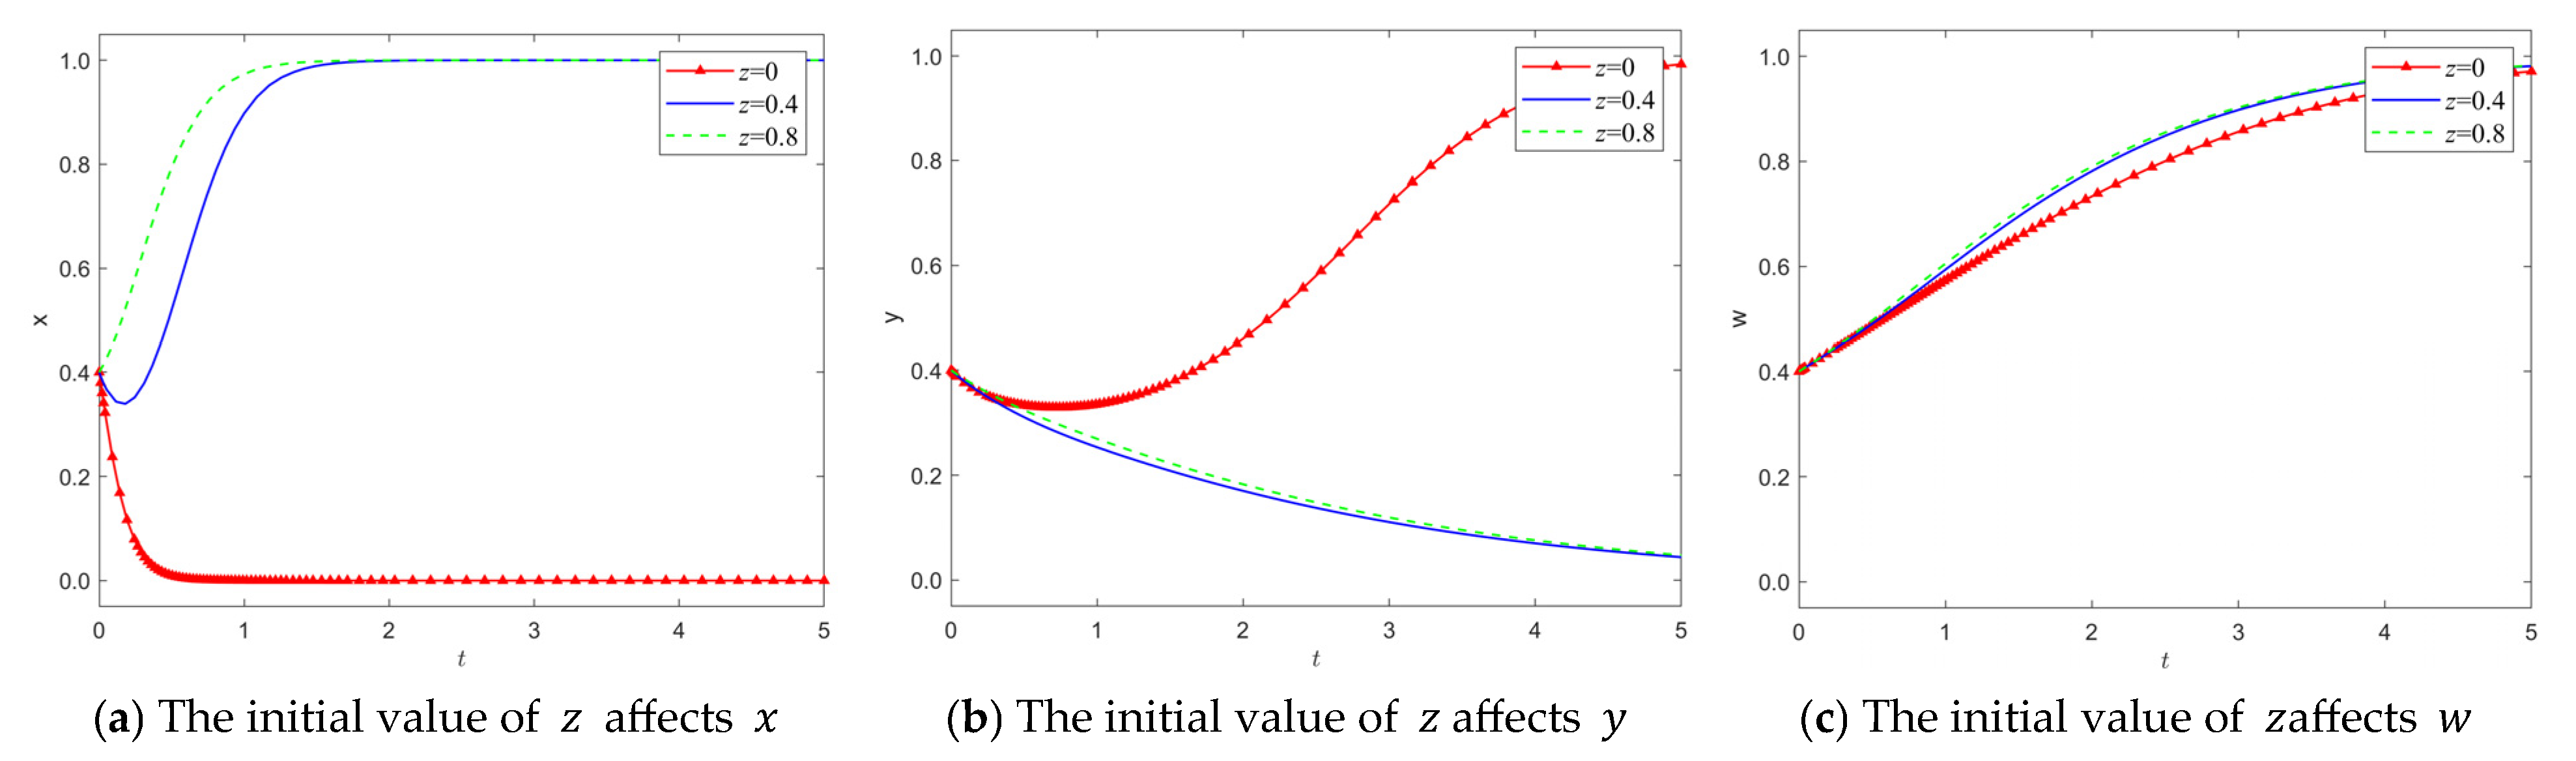
4.2. Numerical Analysis of the Stability of the Ideal Equilibrium Point

Based on the reality and by employing game theory to analyze the game relationship among the main stakeholders in the quality governance of geographical indication agricultural products, (1,1,1,1) indicates self-disciplined production by production organizations, strict regulation by local governments, active duty fulfillment by industry associations, and consumer participation in governance; (1,0,1,1) represents self-disciplined production by production organizations, lenient regulation by local governments, active duty fulfillment by industry associations, and consumer participation in governance. These two stable states, respectively, constitute the ideal stable states for the initial and mature stages of geographical indication agricultural product development. In order to further investigate the evolution trend of the game among the four main stakeholders and the validity of the model, this paper will set parameters based on the stability analysis results in the (1,1,1,1) and (1,0,1,1) scenarios and conduct simulations. Based on the survey results regarding the production and sales of “three products and one standard” agricultural products conducted by the Suzhou Agricultural and Rural Affairs Bureau among the operating entities of the “SUNONG Famous Products” platform, and in conjunction with prior scholarly research, parameter values were assigned according to the principle of equilibrium. The simulation assignments and justifications for each parameter under the (1,1,1,1) scenario are presented in Table 5. Under the (1,0,1,1) scenario, C y , R y , C z , and R z were adjusted to 12, 6, 9, and 9, respectively. The initial values of x, y, z, and w were set at 0.1 with a fixed step size of 0.2, and random simulations were performed ranging from 0.1 to 0.9. The evolution processes of the four-party game strategies under these two scenarios are illustrated in Figure 2 and Figure 3. After simulating the equilibrium point, it can be observed that the stability situation of the evolution in this scenario is consistent with the stability analysis results mentioned above.
As depicted in Figure 2, in this situation, C y B 2 R y < 0 , signifying that the benefits derived from local governments’ adoption of a strict regulatory strategy outweigh the costs, and the system ultimately evolves to the stable state of (1,1,1,1), namely (self-disciplined production, strict regulation, active fulfillment of duties, and participation in governance). This implies that in the initial stage of geographical indication product development, due to the inadequate recognition of the significance of geographical indications by all involved parties, the industry lacks the impetus and experience to independently manage product quality and requires the compelled intervention of local governments for guidance and regulation. At this point, the geographical indication industry is not large in scale, and the regulatory cost is not high. The upper-level government will also offer certain subsidies to support the development of the local geographical indication industry, thereby enabling local governments to have the initiative to participate in governance. Therefore, in the initial stage of industrial development, it is essential for local governments to fully exert their role in strictly regulating the production and sales of geographical indication products and guiding all involved parties to recognize the importance of product quality for the development of the geographical indication industry, so as to facilitate the healthy development of the geographical indication industry.
As indicated in Figure 3, in this situation, C y B 2 R y > 0 , denoting that the benefits of the local government opting for a strict regulatory strategy are lower than its costs. Nevertheless, there still exists C z S N 2 R z < 0 , signifying that the benefits of the industry association actively fulfilling its duties are greater than its costs. In such circumstances, the system eventually evolves to the stable state of (1,0,1,1), namely (self-disciplined production, lenient regulation, active duty fulfillment, and participation in governance). This is because in the mature stage of geographical indication product development, due to the expansion of the industry scale, the regulatory cost of the government rises, and the subsidy from the upper-level government is not as substantial as in the early stage of industry development. Hence, the cost of the local government’s strict regulation exceeds its benefits, and its enthusiasm for strict regulation is relatively low. However, due to the formation of an effective self-governing mechanism within the industry, the production of agricultural products can be effectively monitored and governed. At this time, the market environment is favorable, and consumers have a high enthusiasm for participating in governance. Therefore, the system can still evolve to the ideal stable state.

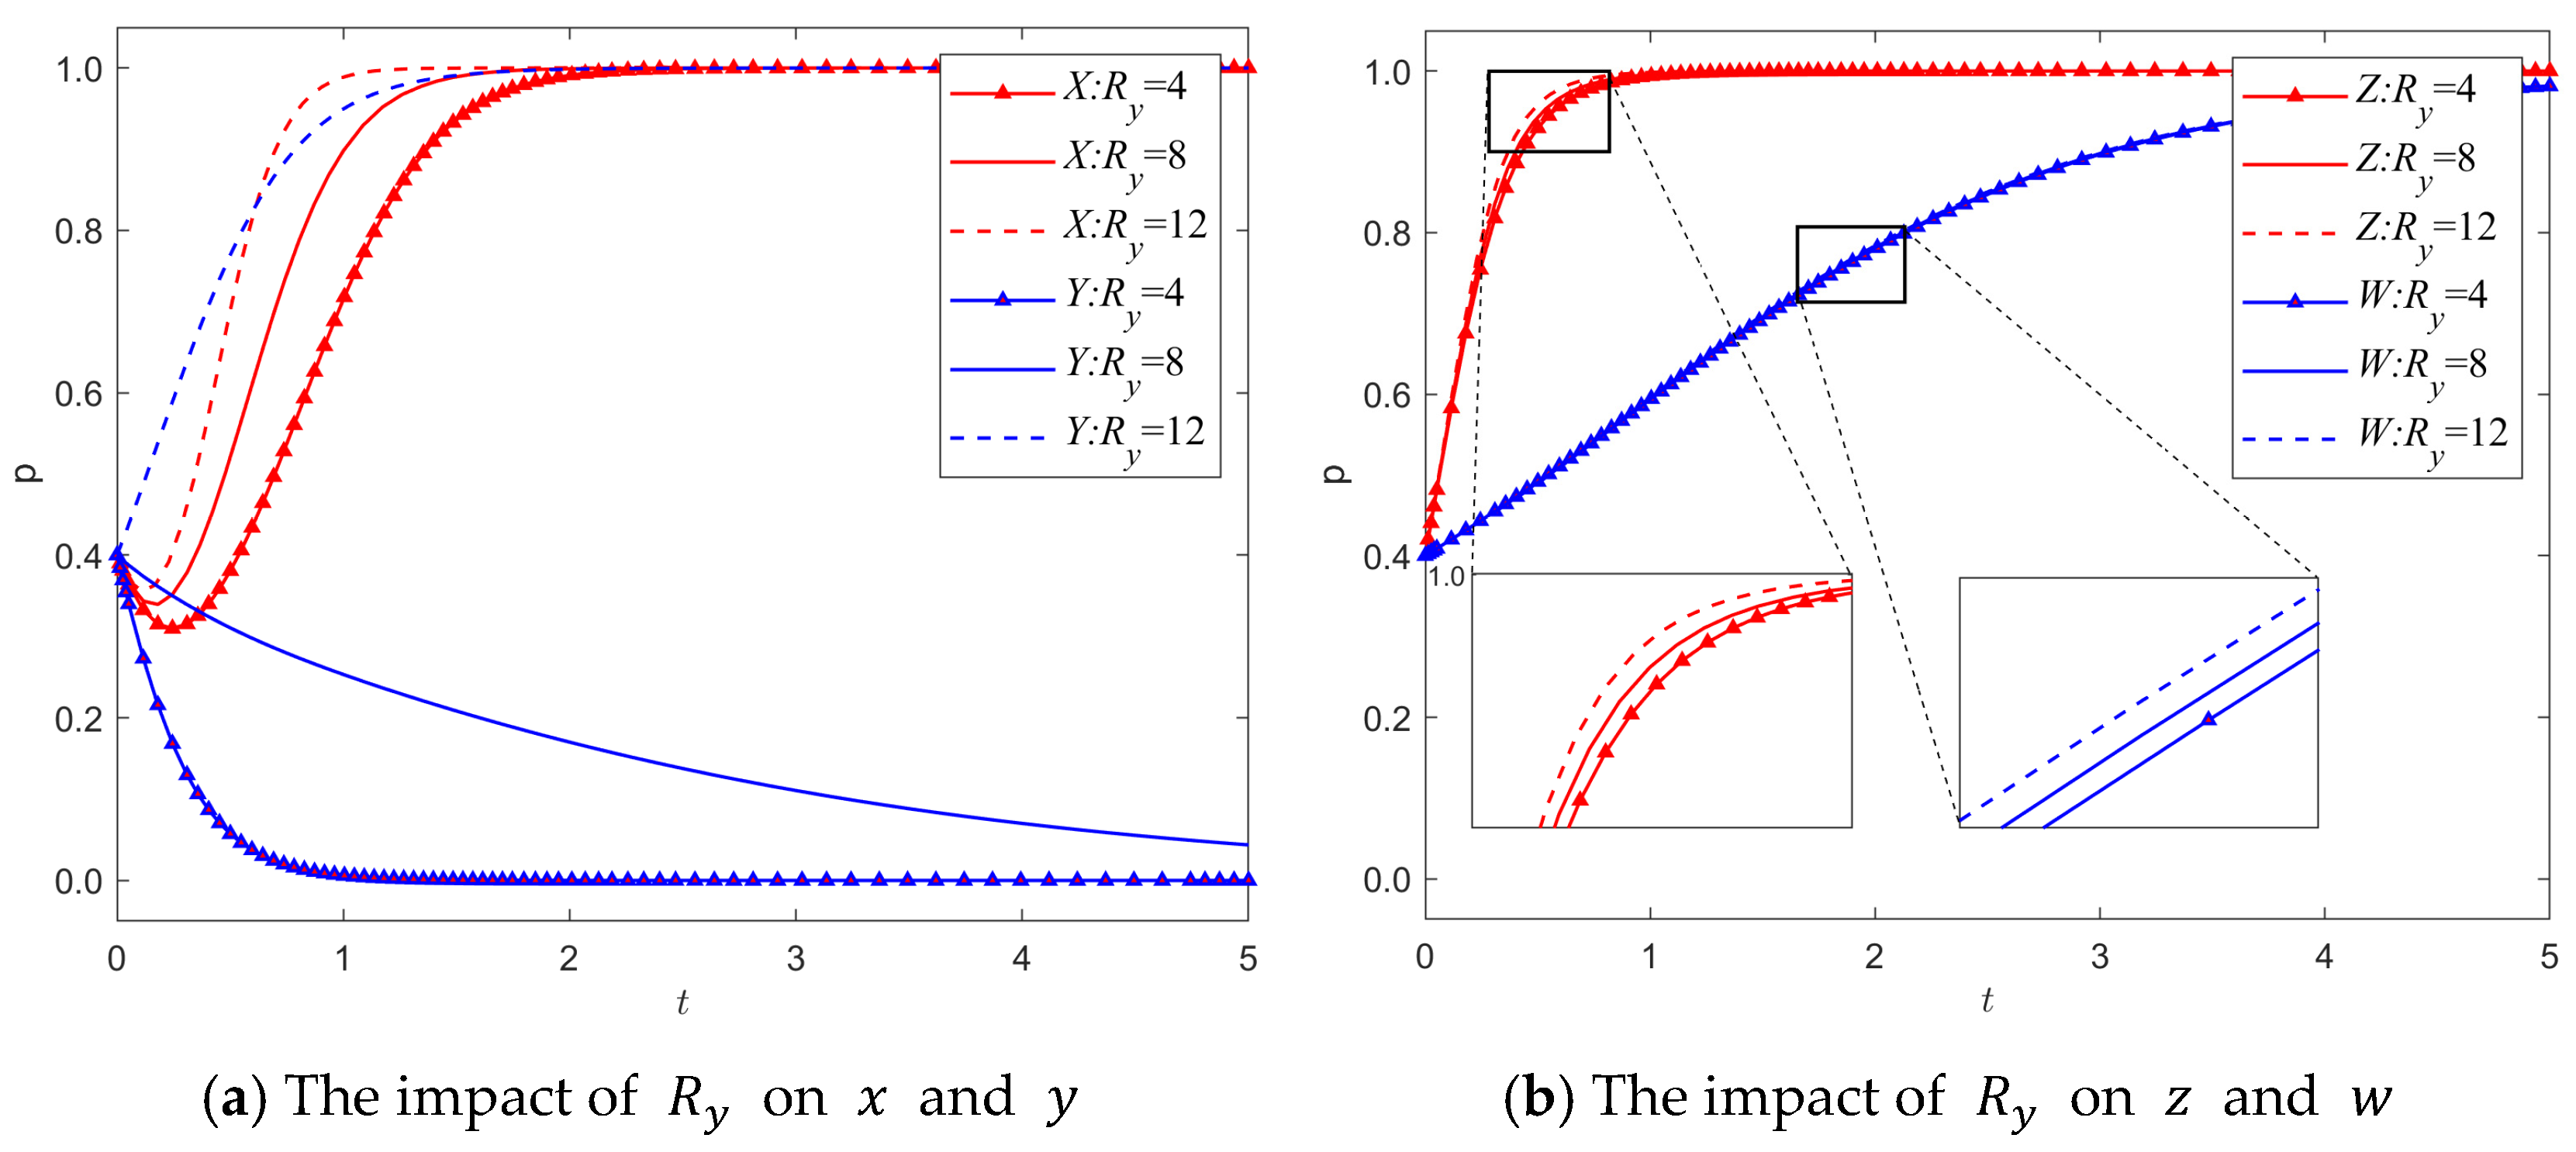
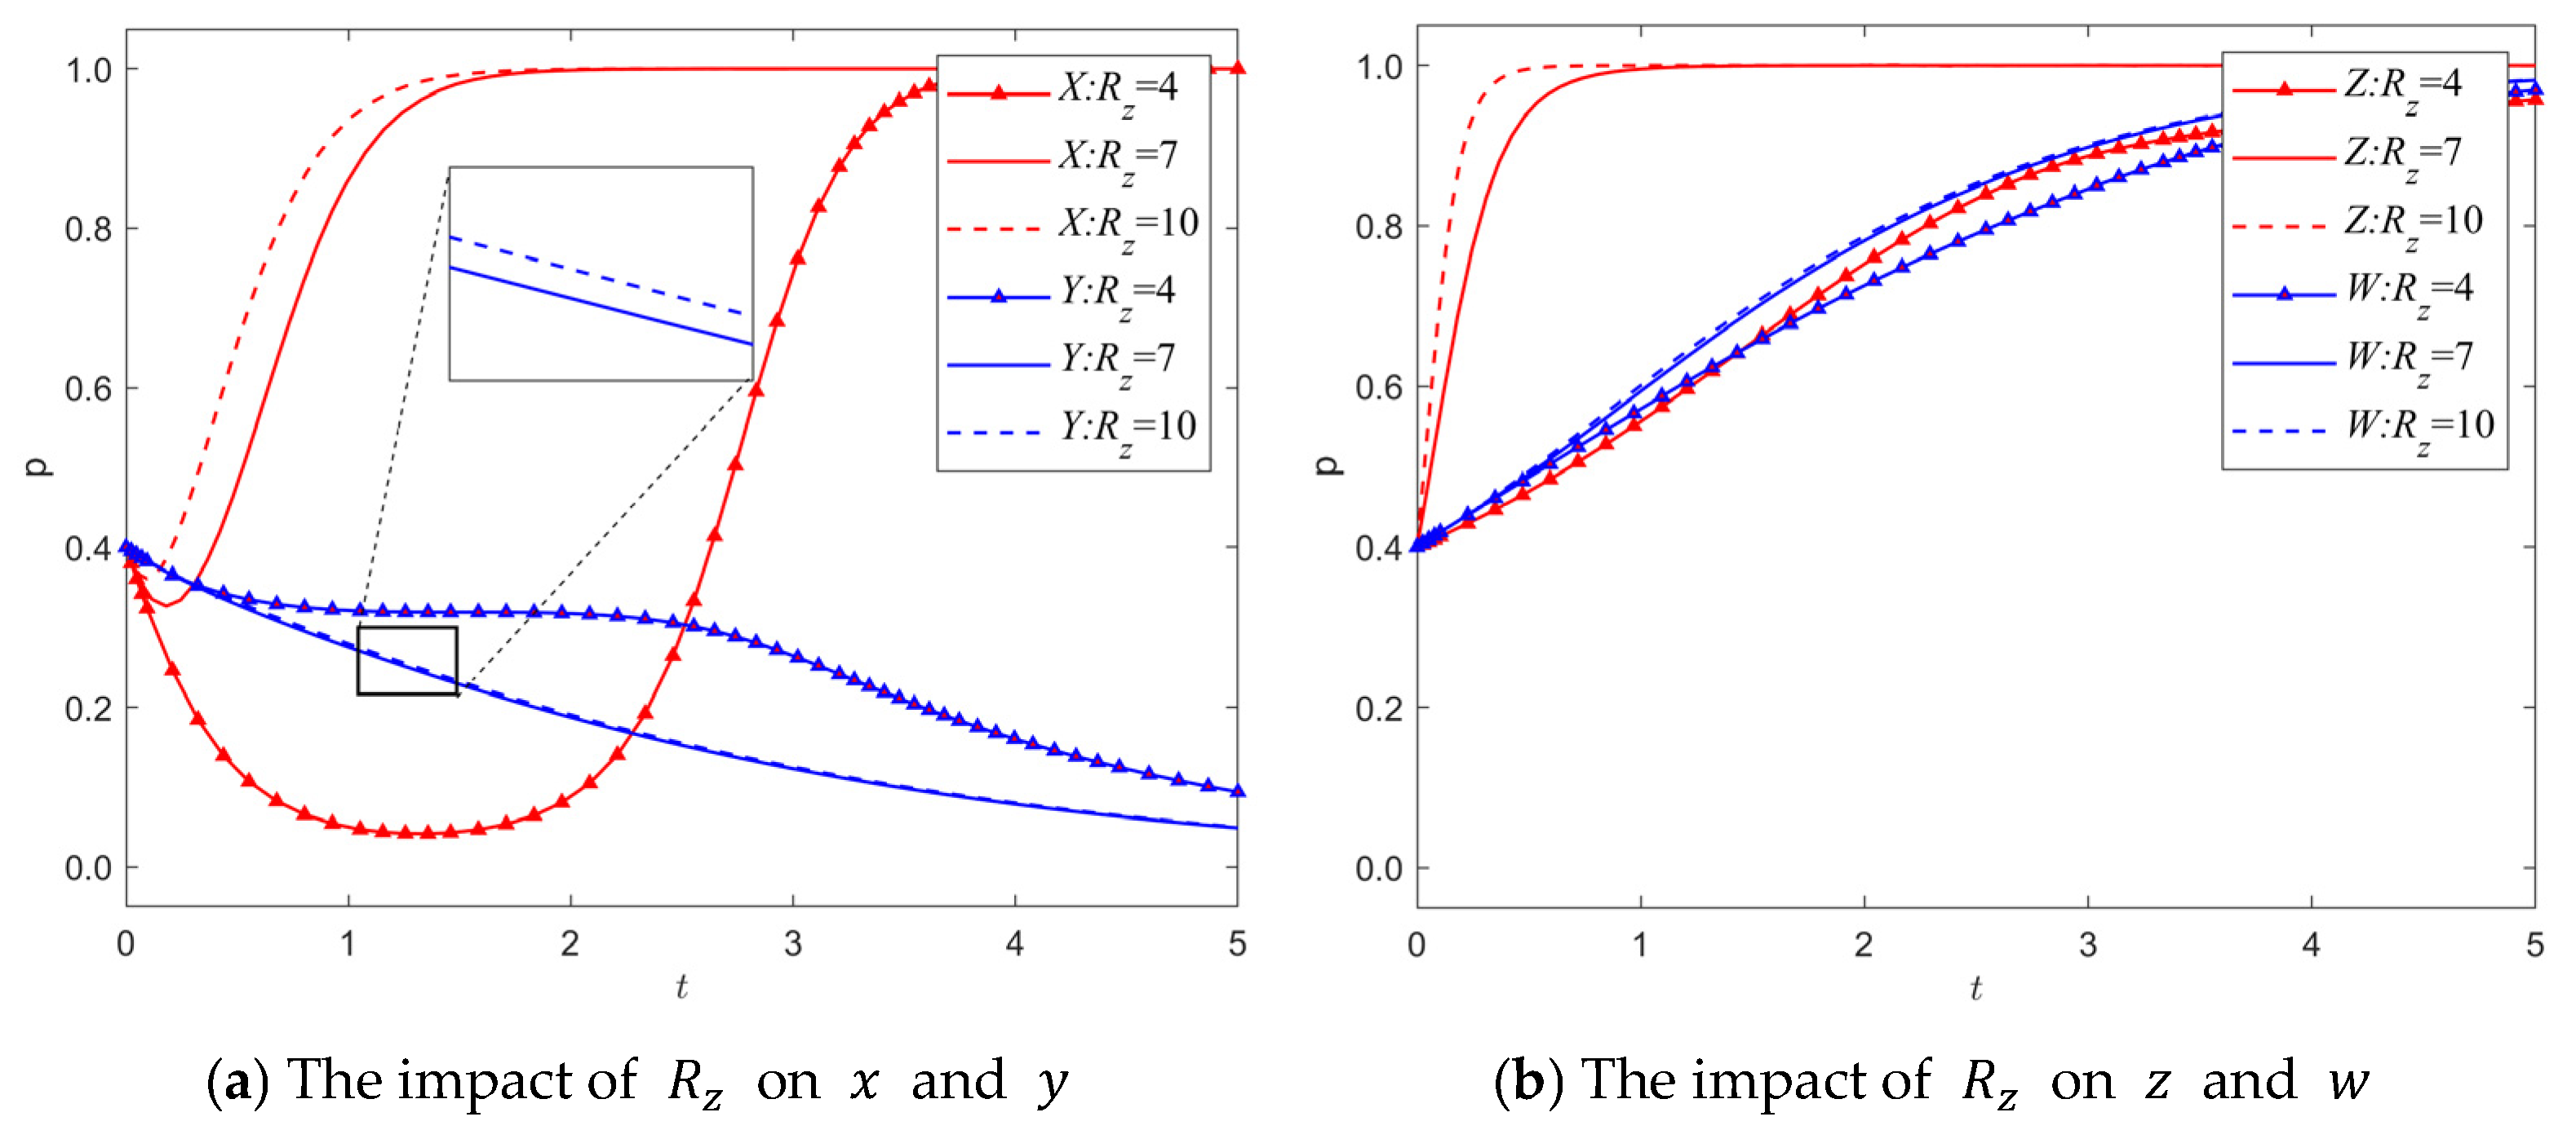
4.3. Sensitivity Analysis of Parameters

In order to analyze the main factors influencing the strategic evolution of various stakeholders in the geographical indication agricultural product quality governance process under the industry self-governance mechanism and the sensitivity of related parameters, the evolutionary stable point (1,0,1,1) will be used as the initial scenario in the following text. Meanwhile, the values of C y   and R y are changed to 10.5 and 8, respectively, to simulate the scenarios of transition from the initial stage to the mature stage of geographical indication industry development. The change in values does not affect the stability of the equilibrium point (1,0,1,1), and it can provide a more intuitive discussion of the sensitivity of parameters. Other parameters remain unchanged.
(1)
The impact of industry self-regulation mechanisms on evolution
To assess the efficacy of industry self-regulation mechanisms, modify the initial willingness of industry association participation, and analyze the influence of setting z values at 0, 0.4, and 0.8 on the strategic choices of production organizations, local governments, and consumers. As depicted in Figure 4, when the initial willingness of industry association participation is 0, due to the absence of regulatory mechanisms, the strategic choices of production organizations will converge to 0. At this juncture, local government intervention is requisite to compensate for the deficiencies resulting from the lack of industry self-regulation mechanisms. When the initial willingness of industry association participation is initially raised from 0 to 0.4, the industry self-regulation mechanism becomes effective and can proficiently regulate and coordinate the production behavior of production organizations, such that the strategic probability of production organizations ultimately converges to 1. The higher the value of z , the faster the convergence to 1. At this point, the strategic probability of the local government ultimately converges to 0. The strategic probability of consumers converges to 1 faster as z decreases, indicating that when a regulatory failure occurs, the market environment deteriorates, and at this point, consumers need to actively participate in governance to safeguard their legitimate rights. The aforementioned analysis demonstrates that the industry self-regulation mechanism with industry association participation as its primary feature is effective. The following section will continue to analyze how the mechanism can function effectively and why it can operate sustainably.
(2)
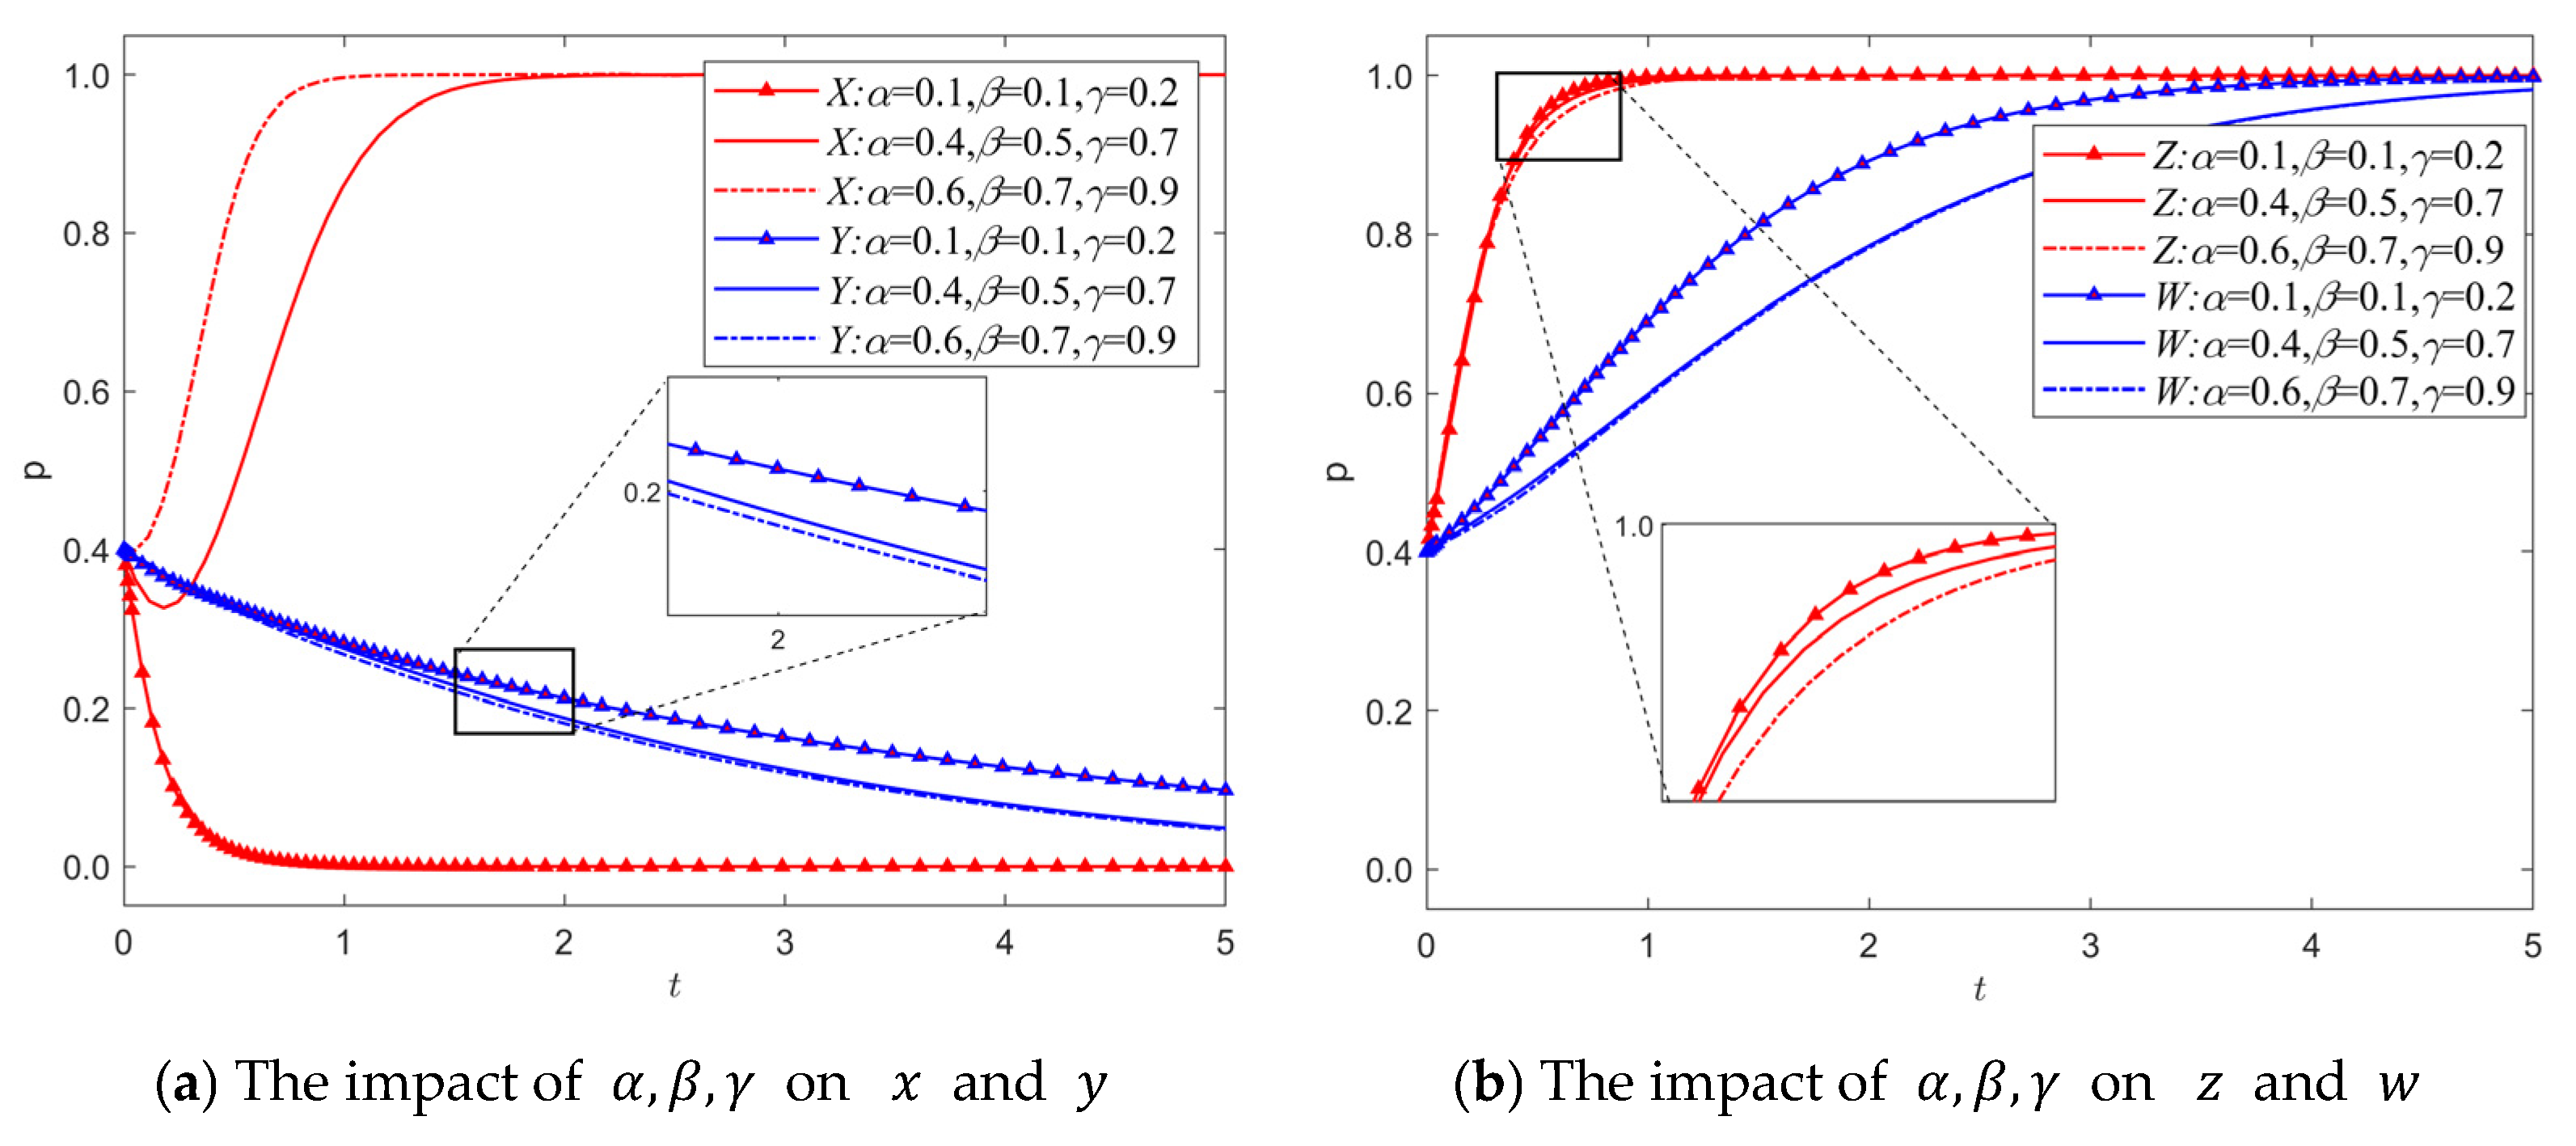
The synergistic capabilities of industry associations in influencing evolution
According to the theory of value co-creation from the perspective of the service ecosystem, as an important participant and core stakeholder in the development of the geographical indication industry, industry associations need to pay heed to the interests of all stakeholders along the entire value chain. Therefore, in this paper, B 1 , B 2   and   B 3 are, respectively, assigned values of 1, 0.5, 0.1; 3, 2, 0.2, and 5, 3, 0.3 to analyze the influence of the synergy capacity of industry associations on the evolution of the governance system. As depicted in Figure 5, as B 1 , B 2   and   B 3 increase, the convergence speed of the strategy probability of production organizations and consumers to 1 is faster, while the convergence speed of the strategy probability of the government to 0 is also faster. As B 1 , B 2   and   B 3 continue to increase, the convergence speed slows down. When B 1 = 5 , B 2 = 3   and   B 3 = 0.3 , the strategy probability ultimately converges to 1. This indicates that as an important participant in the value co-creation process of geographical indication brand development, the stronger the synergy capacity of industry associations is, the lower the cost of self-disciplined production by production organizations, the lower the regulatory cost of local governments, and the lower the cost of consumer participation in governance. The entire system is more prone to approach the ideal stable state.
(3)
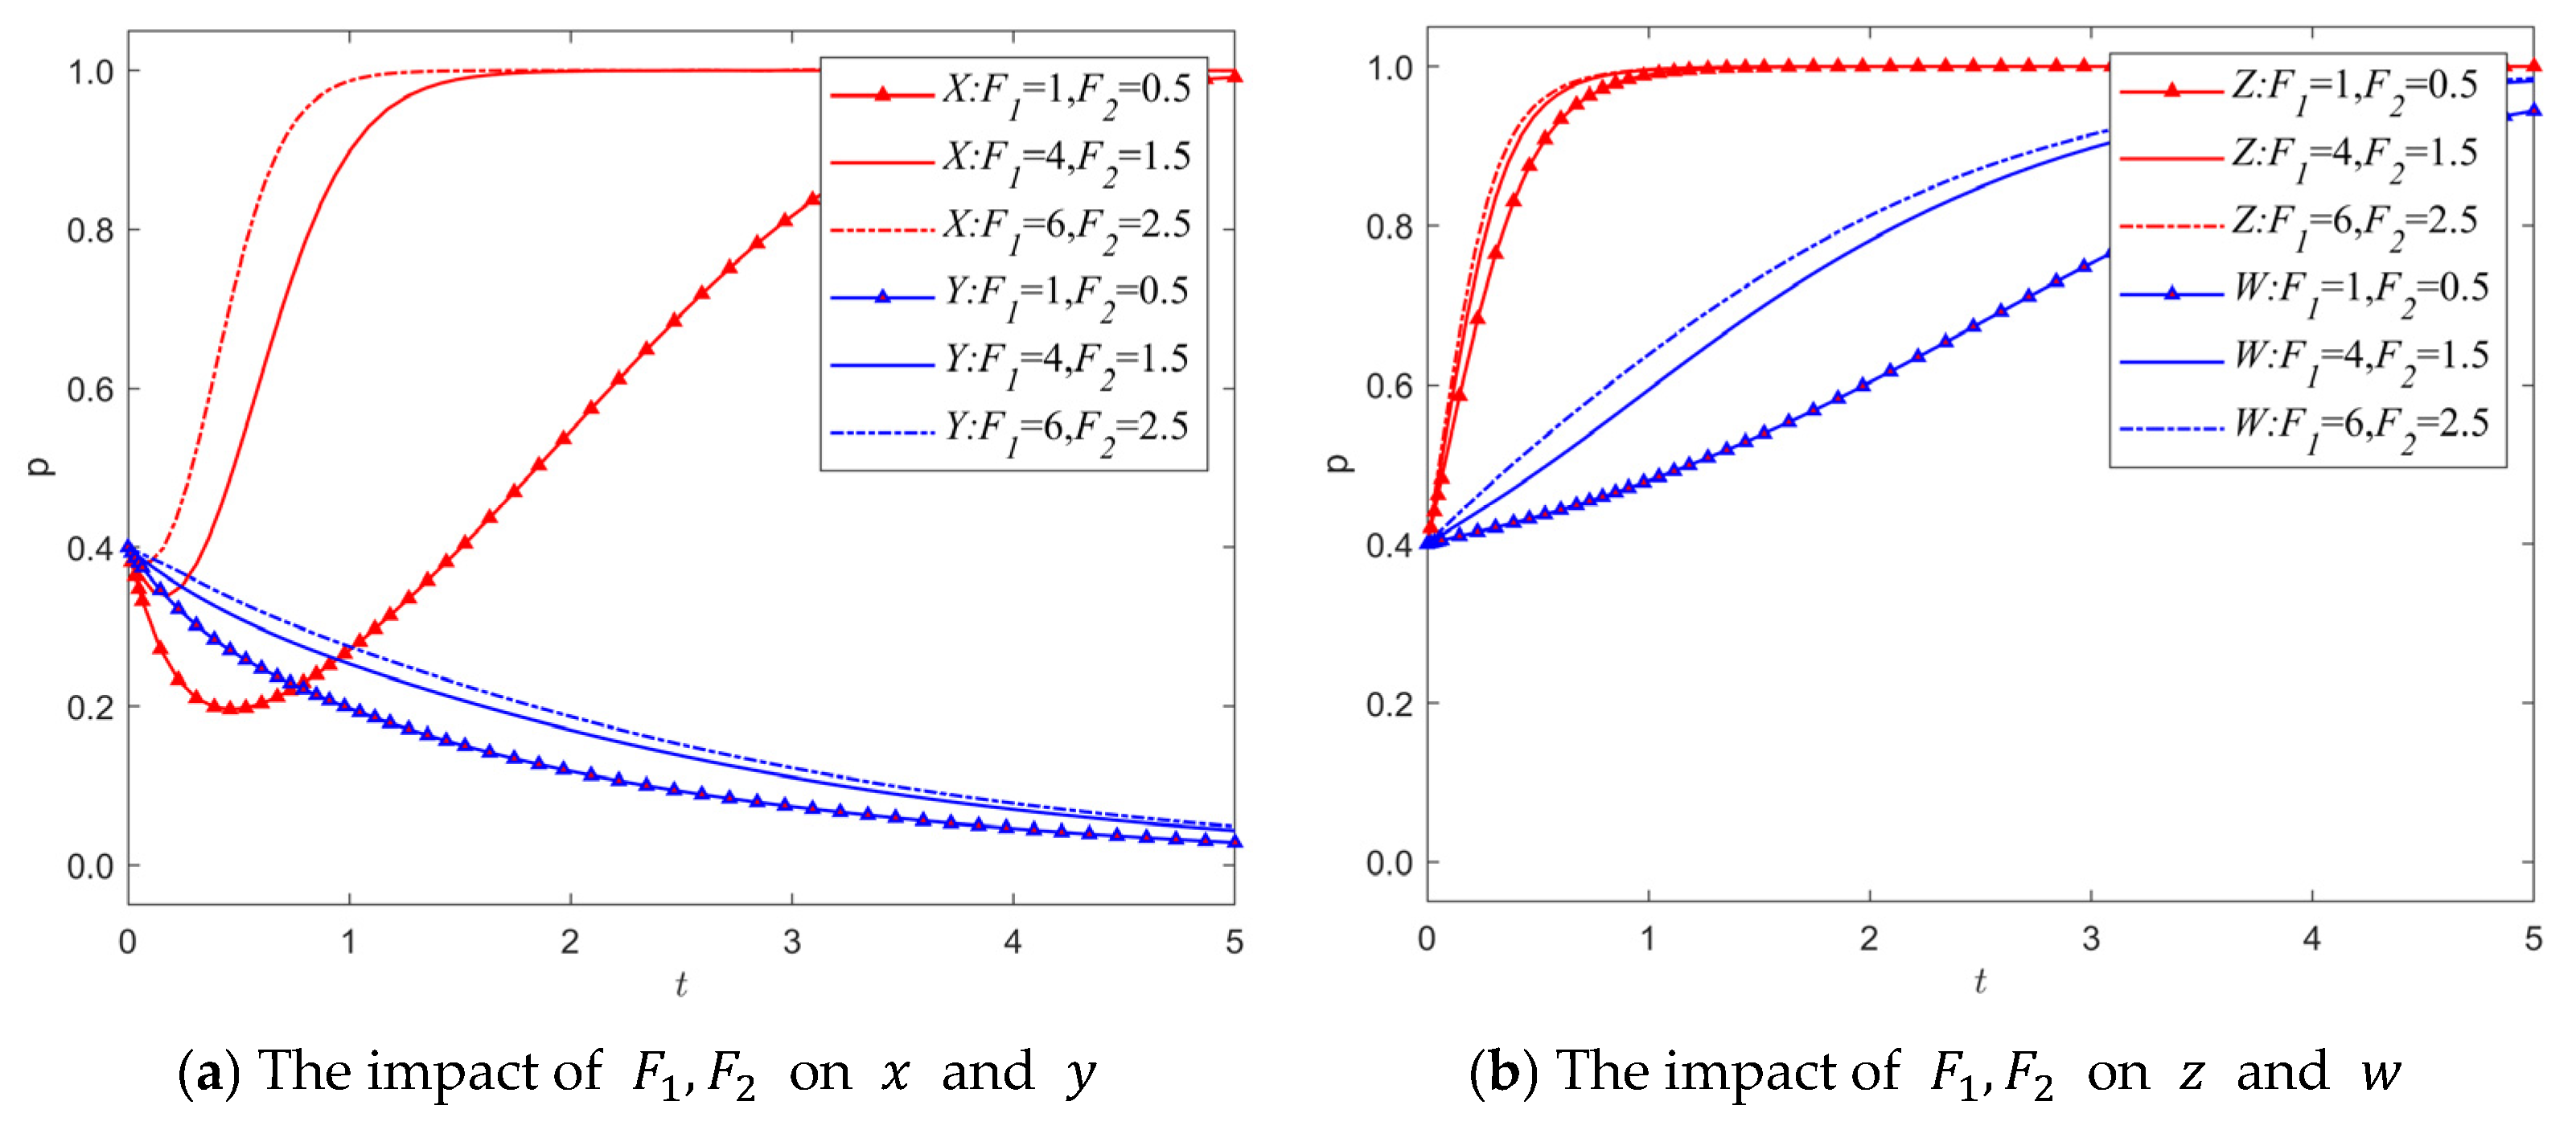
The impact of subsidies and benefit distribution on evolution
The parameter S was assigned values of 1, 4, and 7 to investigate its influence on the system’s evolution. As illustrated in Figure 6, the strategy selection of production organizations converges toward 1 more quickly as S increases, and a similar trend is observed for industry associations. This suggests that an increase in subsidies received by industry associations from local governments enhances the likelihood of their proactive responsibility fulfillment, which subsequently raises the probability of production organizations adhering to self-regulated practices. Consequently, it is essential for local governments to provide subsidies to industry associations within the framework of industry self-governance. Additionally, since S has minimal impact on the strategy choices of local governments and consumers, further analysis in this regard is not provided.
The parameter R y was assigned values of 4, 8, and 12 to investigate its influence on the system’s evolution. As illustrated in Figure 7, the strategy selection of production organizations converges toward 1 as R y increases, with the convergence rate accelerating progressively. For local governments, the strategy selection initially converges to 0 and subsequently shifts to converge to 1 as R y grows, with the convergence rate also increasing steadily. This suggests that R y plays a critical role in shaping the behavior of local governments and indirectly influences the strategies of production organizations. Therefore, during the early stages of landmark industry development, subsidies from higher-level governments are essential for enabling local governments to fulfill their roles effectively. Since R y has minimal impact on the strategy choices of associations and consumers, further analysis in these areas is not provided.
The parameter R z was assigned values of 4, 7, and 10, respectively, to analyze its impact on the system’s evolution. As shown in Figure 8, the strategy selection of production organizations converges to 1 as the value of R z increases, and the speed of convergence accelerates. The same is true for industry associations. This indicates that an increase in R z can motivate industry associations to actively fulfill their responsibilities, thereby indirectly encouraging production organizations to self-regulate their production. R z represents the donations and other non-marketized income of related enterprises. Therefore, it is necessary to actively explore new paths for cooperation within the industry, optimize the mechanism for benefit distribution, stimulate the enthusiasm of industry associations to fulfill their responsibilities and achieve value co-creation.
(4)
The impact of reputation mechanisms on evolution
To analyze the impact of market reputation on system evolution, k 10   and   k 20 were set to 0.5, 1, 2, 3, 4, and 5, reflecting increasing influence on participants’ strategies. As Figure 9 shows, higher k 10   and   k 20 values lead to greater brand premiums and revenue when production organizations self-regulate due to positive consumer evaluations. Conversely, non-self-regulated production results in stronger negative reputational effects from complaints, reducing brand value and income. The probability of choosing self-disciplined production converges to 1 with accelerating speed. Stakeholders should prioritize reputation mechanisms, communicate effectively with consumers, and enhance quality for a virtuous cycle. Since k 10   and   k 20 minimally affect other parties, further analysis is omitted.
To analyze the impact of reputation loss for local governments and industry associations on system evolution, N 1 and N 2 are assigned values of 2, 1, 4, 3, 6, and 5, respectively, representing the increasing influence of reputation loss on the strategy choices of all participants. As illustrated in Figure 10, when the values of N 1 and N 2 increase, the probability of local governments choosing active governance gradually rises, while the strategy selection of industry associations converges to 1 more rapidly. Consequently, the combined regulatory pressure from both parties drives production organizations’ strategies to converge to 1 at an accelerated rate. This suggests that when local governments and industry associations are less proactive in governance, greater reputational losses incentivize them to actively participate in governance, thereby influencing the strategy choices of production organizations. Since N 1 and N 2 have minimal effects on consumer strategy choices, further analysis is not provided.
(5)
The impact of regulation on evolution
Regulatory punishment serves as a critical mechanism to ensure the effective functioning of the quality governance system for geographical indication of agricultural products. By assigning the parameters α , β and γ values of 0.1, 0.1, 0.2; 0.4, 0.5, 0.7; and 0.6, 0.7, and 0.9, respectively, their impact on the evolution of the game system is analyzed. As illustrated in Figure 11, when α , β and γ are set to 0.1, 0.1, and 0.2, respectively—indicating an extremely low probability of successful regulation—the regulatory mechanism becomes ineffective. In this case, the production organization’s choice of non-compliant production is unlikely to be detected by either the government or industry associations, causing the strategy probability to converge to 0. As the values of α , β and γ increase, the strategy probability converges to 1, with the convergence rate accelerating progressively. Furthermore, due to the ineffectiveness of the regulatory mechanism, regulators cannot guarantee the quality of agricultural products entering the market. Consequently, consumers, aiming to protect their legitimate rights and interests, are more inclined to participate in governance. Moreover, the smaller the values of α , β and γ , the faster the consumer strategy probability converges to 1. This demonstrates that effective regulation plays a vital role in the quality governance of agricultural products. Governments and associations can enhance the likelihood of successful regulation by adopting traceability technologies such as blockchain. Since variations in α , β and γ have minimal effects on local governments and industry associations, they are not further analyzed here.
The parameters F 1 and F 2 are, respectively, assigned the values of 1, 0.5, 4, 1.5, 6, and 2.5, and the influence of these parameters on the system evolution is studied. As demonstrated in Figure 12, with the increase in the values of F 1 and F 2 , the trend of production organizations choosing self-disciplined production and that of consumers choosing to participate in governance accelerated. It can be observed that the strategic choices of production organizations and consumers are affected by the parameters F 1 and F 2 . This indicates that the more severe the punishment for unregulated production is, the higher the implicit cost of unregulated production for production organizations will be, and they will tend to choose self-disciplined production to reduce this implicit cost. For consumers, the higher the compensation they can obtain for participating in governance when they consume low-quality products that do not meet their expectations, the greater their willingness to participate in governance will be.
(6)
The impact of consumer participation costs and benefits on evolution
The parameters C w and D are assigned values of 0.2, 0.3; 0.3, 0.6; and 0.6, 0.9, respectively, to analyze their influence on the evolution of strategy. As illustrated in Figure 13a, as the values of C w and D increase, the probability of consumers choosing to participate in governance progressively decreases. This suggests that the higher the costs for consumers to collect quality information and file complaints about substandard products, the less likely they are to actively engage in governance. To enhance consumer participation, measures such as blockchain technology can be adopted to reduce information collection costs, streamline rights protection channels, and provide support for consumer advocacy. Since C w and D have minimal effects on the other three parties, further analysis is not provided.
To analyze the impact of parameters E 1 and E 2 on the evolution of strategy, they are assigned values of 1.5, 1; 2, 1; and 3, 1, respectively. As illustrated in Figure 14b, when the difference between E 1 and E 2 increases, the probability of consumers choosing to participate in governance also rises. This suggests that when consumers engage in governance, the higher consumer surplus derived from consuming high-quality geographical indication agricultural products enhances their motivation to participate. Therefore, production organizations should continuously improve product quality and added value to increase consumer surplus. Simultaneously, collaboration with local governments and industry associations can facilitate the development of effective consumer information-sharing and feedback platforms, thereby enhancing emotional rewards and incentives for consumer participation in governance, stimulating their enthusiasm, and fostering value co-creation. Since E 1 and E 2 have minimal effects on the other three parties, further analysis is not provided.

5. Conclusions and Recommendations

5.1. Conclusions

Based on the realistic backdrop of quality maintenance for agricultural products with geographical indications, this paper introduces the theory of value co-creation and constructs a four-party evolutionary game model among agricultural product production organizations, local governments, industry associations, and consumers under industry self-governance. It systematically analyzes the stability of the strategic choices of each participant and the stability of the equilibrium strategy combination of the game system, and combines numerical simulation to study the influencing factors of the equilibrium strategy choice. The main conclusions are as follows:
(1)
The game model constructed in this paper has a series of stable equilibrium points in the two distinct stages of geographical indication industry development. (1,1,1,1) is the ideal equilibrium point in the initial stage of development, where the production organization conducts autonomous production, the local government exercises strict regulation, the industry association actively fulfills its responsibilities, and the consumer participates in governance. (1,0,1,1) is the ideal equilibrium point in the mature stage of development, where the production organization conducts autonomous production, the local government loosens its regulation, the industry association actively fulfills its responsibilities, and the consumer participates in governance. This indicates that the optimal regulatory strategy of local governments can be adjusted in accordance with the different stages of industrial development under industry self-governance;
(2)
The industry self-regulation mechanism proves to be effective and highly efficient. The strategy choices of industry associations exert significant influences on the strategic decisions of other stakeholders. The support from local governments, donations from social organizations, social reputation, and the ability to integrate resources are the key factors motivating industry associations to actively fulfill their responsibilities. The resource integration capacity of industry associations can effectively drive the entire governance system to operate efficiently. Additionally, an effective interest allocation mechanism between production organizations and industry associations can incentivize industry associations to continuously play their roles;
(3)
The regulatory strategies of local governments in the different development stages of the geographical indication industry exhibit stability differences, mainly influenced by regulatory benefits, regulatory costs, and the degree of collaboration with industry associations. Hence, the selection of local government regulatory strategies is a dynamic adjustment process aimed at maximizing regulatory benefits. Furthermore, subsidies from higher-level governments are crucial factors affecting their strategic choices. In the initial stage of industry development, subsidies from higher-level governments are of vital importance for local governments to play a leading role;
(4)
Effective regulatory mechanisms and reputation mechanisms are of vital significance for the quality governance of geographical indication agricultural products. The more efficient the regulation is, the greater the likelihood that the production organization will opt for self-disciplined production. Meanwhile, as a brand profoundly influenced by reputation, the existence of reputation mechanisms can empower consumers to effectively engage in the quality governance of geographical indication agricultural products;
(5)
The participation strategies of consumers in the quality governance of geographical indication agricultural products are significantly influenced by their costs of information acquisition, authenticity identification, and complaint. Higher participation and complaint costs may restrain consumers’ active participation. Additionally, the consumer surplus that consumers obtain from the consumption of geographical indication products is also a key factor affecting their participation in governance. The more consumer surplus consumers perceive, the higher their willingness to participate in governance tends to be.

5.2. Management Insights

(1)
During the initial stage of the geographical indication industry’s development, the higher-level government ought to offer financial subsidies to local governments that can effectively alleviate their financial strain. Such financial support not only mitigates the financial burden of local governments but also boosts their motivation and capacity to fulfill their supervisory duties, fully mobilizing their initiative in quality governance. For example, in the quality-related incidents involving “Wuchang Rice” and “Yangcheng Lake Crabs”, if the higher-level government provides adequate financial support to the local government responsible for the brand, it can empower the local government to strengthen regulatory efforts, identify counterfeiting issues within the supply chain at an earlier stage, and thereby protect the brand from sustaining significant reputational damage;
(2)
Local governments should place significant emphasis on the role of geographical indication industry associations and provide operating subsidies to heighten their willingness to participate in governance. They should also collaborate with the associations to establish quality standards for geographical indication of agricultural products. During the initial stage of industry development, local governments should closely cooperate with industry associations to explore efficient supervisory models to reduce supervisory costs and enhance supervisory efficiency. In the mature stage of the industry, local governments should gradually delegate powers and clarify the responsibilities of industry associations in aspects such as standard formulation, production supervision, infringement handling, etc. Both sides should also actively coordinate the participation of stakeholders like farmers, enterprises, and research institutions to ensure that the standards not only reflect the actual demands of the industry but also enjoy wide recognition. Under the guidance of the local agricultural and rural affairs bureau and the market supervision bureau, Yangcheng Lake Town established a specialized Yangcheng Lake hairy crab industry association. This association not only enforces industry supervision but also actively engages in brand promotion and technical support, thereby playing a highly constructive role in safeguarding the geographical indication status of “Yangcheng Lake Hairy Crab”;
(3)
By constructing a multi-party value co-creation system based on blockchain technology, it is feasible to promote coordinated development within the geographical indication agricultural products sector through technological empowerment. The regulatory function of blockchain furnishes transparent tools for local governments and industry associations to dynamically monitor production processes and quality certification, thereby ensuring the credibility of products. Consumers can engage in evaluation via the blockchain platform, forming a reputation-based feedback mechanism that not only prompts producers to enhance product quality but also strengthens consumer trust in products. Simultaneously, smart contracts supported by blockchain can optimize the distribution of interests between production organizations and industry associations, guaranteeing fair rewards and stimulating in-depth participation from multiple parties. Through closely connecting producers, governments, industry associations, and consumers, blockchain technology can break through the trust bottleneck of traditional collaboration and establish a transparent, fair, and mutually beneficial value co-creation ecosystem. Recently, Xingkuang Technology, a subsidiary of the Tianxiangxiu Group, has partnered with the “Gusu Chengwai” hairy crab brand to launch “Digital Traceability Crabs” integrated with anti-counterfeiting codes. By leveraging blockchain technology, this initiative enables digital traceability for Yangcheng Lake hairy crabs, significantly assisting consumers in overcoming information asymmetry. On one hand, it helps reduce the production and distribution costs associated with Yangcheng Lake hairy crabs; on the other hand, it effectively minimizes the risk of counterfeit and substandard products entering the market.

Author Contributions

G.Z.: Draft or revise the article critically for important intellectual content, funding acquisition. K.Z.: Writing—original draft, Methodology, Formal analysis. All authors have read and agreed to the published version of the manuscript.

Funding

This research was funded by The National Social Science Fund of China under Grant No. 24FGLB016: “Research on the Derivation Mechanism and Brand Governance of Geographical Indications for Agricultural Products” and Jiangsu University Undergraduate Research Project Funding Program under Grant No. Y23C061: “Research on the Multi-Subject Synergistic Maintenance Mechanism of Agricultural Product Geographical Indications from the Perspective of Value Co-creation”.

Institutional Review Board Statement

This article does not include any studies involving animals conducted by the authors. All procedures involving human participants adhered to the ethical standards of the institutional and/or national research committees and the Academic Ethics and Ethics Committee of Jiangsu University.

Informed Consent Statement

Informed consent was obtained from all subjects involved in the study.

Data Availability Statement

No new data were created or analyzed in this study. Data sharing is not applicable to this article.

Conflicts of Interest

The authors declare no conflict of interest.

References

  1. Ministry of Agriculture and Rural Affairs of the People’s Republic of China, General Office. Implementation Plan for Supporting the Development of Regional Public Brands in Poverty-Alleviated Areas (2023–2025). 2023. Available online: http://www.moa.gov.cn/govpublic/SCYJJXXS/202304/t20230420_6425711.htm (accessed on 14 November 2024).
  2. Giampieri, F.; Mazzoni, L.; Cianciosi, D.; Alvarez-Suarez, J.M.; Regolo, L.; Sánchez-González, C.; Capocasa, F.; Xiao, J.; Mezzetti, B.; Battino, M. Organic vs conventional plant-based foods: A review. Food Chem. 2022, 383, 132352. [Google Scholar] [CrossRef] [PubMed]
  3. Ma, Y.; Han, T. Exploring the Improvement of Geographical Indication Protection System. Economic Daily, 23 February 2024. [Google Scholar]
  4. Moschini, G.; Menapace, L.; Pick, D. Geographical Indications and the Competitive Provision of Quality in Agricultural Markets. Am. J. Agric. Econ. 2008, 90, 794–812. [Google Scholar] [CrossRef]
  5. Zhao, G.; Luan, J. Value Characteristics, Realization Approach and Public Governance of Geographical Indication of Agricultural Products. Financ. Trade Res. 2021, 32, 41–47. [Google Scholar]
  6. Jean Tirole, A. Theory of Collective Reputations (with applications to the persistence of corruption and to firm quality). Rev. Econ. Stud. 1996, 63, 1–22. [Google Scholar] [CrossRef]
  7. Dong, Y.; Gao, X. Regional Quality Reputation and Export Quality of Agricultural Products: Concurrently Discussing the Issue of ‘Free Riding’ by Enterprises. Macroeconomics 2020, 12, 84–97. [Google Scholar]
  8. Liu, B.; Xu, J.; Shi, G.; Huang, X. Evaluation and countermeasures for the secure supply of fruit and vegetable products in jiangyin, China. Agro Food Ind. Hi-Tech 2016, 27, 22–27. [Google Scholar]
  9. Wang, Y.; Hug, S.; Irek, J.; Finger, R. Product differentiation, quality, and milk price stability: The case of the Swiss cheese market. Appl. Econ. Perspect. Policy 2025, 47, 416–435. [Google Scholar] [CrossRef]
  10. Menapace, L.; Moschini, G.C. Strength of protection for geographical indications: Promotion incentives and welfare effects. Am. J. Agric. Econ. 2014, 96, 1030–1048. [Google Scholar] [CrossRef]
  11. Quiñones-Ruiz, X.F.; Penker, M.; Belletti, G.; Marescotti, A.; Scaramuzzi, S. Why early collective action pays off: Evidence from setting Protected Geographical Indications. Renew. Agric. Food Syst. 2017, 32, 179–192. [Google Scholar] [CrossRef]
  12. Boga, R.; Paül, V. ‘Because of its size, it’s not worth it!’: The viability of small-scale geographical indication schemes. Food Policy 2023, 121, 102549. [Google Scholar] [CrossRef]
  13. Cei, L.; Defrancesco, E.; Stefani, G. From geographical indications to rural development: A review of the economic effects of European Union policy. Sustainability 2018, 10, 3745. [Google Scholar] [CrossRef]
  14. Poetschki, K.; Peerlings, J.; Dries, L. The impact of geographical indications on farm incomes in the EU olives and wine sector. Br. Food J. 2021, 123, 579–598. [Google Scholar] [CrossRef]
  15. Dong, Y.; Qian, W. The Free-rider Problem in the Construction of Region Public Brands of Agricultural Products: An Analysis Based on Governance Study of Digital Traceability, Transparency and Assurances Systems. China Rural. Surv. 2022, 6, 142–162. [Google Scholar]
  16. Cheng, J.; Zheng, S. Research on the Use of Regional Public Brand for Agricultural Products by Farmers: Collective Action Dilemma and Self-Organized Governance. J. Rural Econ. 2018, 2, 78–85. [Google Scholar]
  17. Li, Z.; Li, G.; Luo, C. The Mechanism and Improvement Strategy of Value Co-creation for Regional Shared Brand in Agricultural Product. J. Hubei Eng. Univ. 2023, 43, 118–122. [Google Scholar]
  18. Zeng, Y. Research on the Construction of Agricultural Product Geographical Indication Brands in the Perspective of Economic Law in China. J. Southeast Univ. (Philos. Soc. Sci.) 2020, 22, 90–93. [Google Scholar]
  19. Li, X.; Yang, H.; Zeng, L.; Li, X. The Evolutionary Game of Three Parties Participating in the Promotion of Regional Brands of Agricultural Products. Chin. J. Manag. Sci. 2022, 30, 196–209. [Google Scholar]
  20. Barjolle, D.; Quiñones-Ruiz, X.F.; Bagal, M.; Comoé, H. The role of the state for geographical indications of coffee: Case studies from Colombia and Kenya. World Dev. 2017, 98, 105–119. [Google Scholar] [CrossRef]
  21. Yang, W.; Xie, C.; Ma, L. Tripartite evolutionary game and simulation analysis of brand enhancement for geographical indications agri-food. China Agric. Econ. Rev. 2024, 16, 340–367. [Google Scholar] [CrossRef]
  22. Huang, B.; Geng, X. A Study on the Governance of Opportunistic Behavior of Geographical Indications Agricultural Producers:Based on the Perspective of Collective Action. Econ. Manag. 2022, 36, 19–26. [Google Scholar]
  23. Belletti, G.; Marescotti, A. Origin products, geographical indications and rural development. In Labels of Origin for Food: Local Development, Global Recognition; CAB International: Wallingford, UK, 2011; pp. 75–91. [Google Scholar]
  24. Zhang, Y.; Qin, Y.; Wang, L.; Yu, Y. Research on Applying “Double Engines” of Government and Market to Strengthen the Construction of Regional Public Brands of Agricultural Products. Collect. Essays Financ. Econ. 2022, 38, 90–101. [Google Scholar]
  25. Cayambe, J.; Heredia-R, M.; Torres, E.; Puhl, L.; Torres, B.; Barreto, D.; Heredia, B.N.; Vaca-Lucero, A.; Diaz-Ambrona, C.G. Evaluation of sustainability in strawberry crops production under greenhouse and open-field systems in the Andes. Int. J. Agric. Sustain. 2023, 21, 2255449. [Google Scholar] [CrossRef]
  26. Ali, A.B.; Elshaikh, N.A.; Hong, L.; Adam, A.B.; Yan, H. Conservation tillage as an approach to enhance crops water use efficiency. Acta Agric. Scand. Sect. B—Soil Plant Sci. 2017, 67, 252–262. [Google Scholar] [CrossRef]
  27. Zhang, C.; Li, X.; Yan, H.; Ullah, I.; Zuo, Z.; Li, L.; Yu, J. Effects of irrigation quantity and biochar on soil physical properties, growth characteristics, yield and quality of greenhouse tomato. Agric. Water Manag. 2020, 241, 106263. [Google Scholar] [CrossRef]
  28. Darko, R.O.; Yuan, S.; Hong, L.; Liu, J.; Yan, H. Irrigation, a productive tool for food security—A review. Acta Agric. Scand. Sect. B—Soil Plant Sci. 2016, 66, 191–206. [Google Scholar] [CrossRef]
  29. Du, Z.; Hu, Y.; Ali Buttar, N.; Mahmood, A. X-ray computed tomography for quality inspection of agricultural products: A review. Food Sci. Nutr. 2019, 7, 3146–3160. [Google Scholar] [CrossRef]
  30. Cheng, J.; Yu, P.; Huang, Y.; Zhang, G.; Lu, C.; Jiang, X. Application status and prospect of impedance spectroscopy in agricultural product quality detection. Agriculture 2022, 12, 1525. [Google Scholar] [CrossRef]
  31. Tang, C.; He, Y.; Yuan, B.; Li, L.; Luo, L.; You, T. Simultaneous detection of multiple mycotoxins in agricultural products: Recent advances in optical and electrochemical sensing methods. Compr. Rev. Food Sci. Food Saf. 2024, 23, e70062. [Google Scholar] [CrossRef]
  32. Zhao, Z.; Jin, L.; Liu, Y.; Li, L. The Evolutionary Game of Quality Regulation among Government, Enterprise and Consumer in the Social Media Environment. Manag. Rev. 2023, 35, 248–261. [Google Scholar]
  33. Vargo, S.L.; Lusch, R.F. From repeat patronage to value co-creation in service ecosystems: A transcending conceptualization of relationship. J. Bus. Mark. Manag. 2010, 4, 169–179. [Google Scholar] [CrossRef]
  34. Lu, J.; Sun, J. Research on Collaborative Co-construction of Regional Brand of Agricultural Products Under Rural Revitalization Strategy—From the Perspective of Value Co-creation. Res. Econ. Manag. 2022, 43, 96–110. [Google Scholar]
  35. Fishman, M.A. Asymmetric evolutionary games with non-linear pure strategy payoffs. Games Econ. Behav. 2008, 63, 77–90. [Google Scholar] [CrossRef]
  36. Cai, G.; Kock, N. An evolutionary game theoretic perspective on e-collaboration: The collaboration effort and media relativeness. Eur. J. Oper. Res. 2009, 194, 821–833. [Google Scholar] [CrossRef]
  37. Taylor, P.D.; Jonker, L.B. Evolutionary stable strategies and game dynamics. Math. Biosci. 1978, 40, 145–156. [Google Scholar] [CrossRef]
  38. Ritzberger, K.; Weibull, J.W. Evolutionary selection in normal-form games. Econom. J. Econom. Soc. 1995, 63, 1371–1399. [Google Scholar] [CrossRef]
  39. Suzhou Municipal Bureau of Agriculture and Rural Affairs. What Do Producers and Operators Say About Suzhou’s ‘Three Products and One Label’ Agricultural Products? Available online: https://mp.weixin.qq.com/s?__biz=MzU0NDc4NTMwMw==&mid=2247593066&idx=2&sn=d943d4c40c9c8a28137be46757ccc6a2&chksm=fb75fa92cc027384590d87667e519424f2df4e01120e99dbf5a757ed24340b0a2936c3f12ea6&scene=27 (accessed on 25 November 2023).
  40. Jiang, Y.; Pu, Y.; Ding, Y.; Ji, S.; Yu, H. Premium Between Geographical Indications of Agricultural Products and Corporate Brands and Their Synergistic Effect: Taking Green Tea for Example. Econ. Geogr. 2023, 43, 179–186. [Google Scholar]
  41. National Intellectual Property Administration, China. Measures for the Protection of Geographical Indications Products. 2024. Available online: https://www.cnipa.gov.cn/art/2024/1/2/art_2790_189522.html (accessed on 23 November 2023).
  42. Standing Committee of the National People’s Congress of China. Product Quality Law of the People’s Republic of China; Standing Committee of the National People’s Congress of China: Beijing, China, 2023.
  43. Standing Committee of the National People’s Congress of China. Food Safety Law of the People’s Republic of China; Committee of the National People’s Congress of China: Beijing, China, 2015.
  44. Huo, H.; Liu, X. Behavioral decision-making of government, agricultural product producers, and consumers on agricultural product quality and safety regulation in a digital environment. Front. Public Health 2024, 12, 1373747. [Google Scholar] [CrossRef]
  45. Wu, L.; Ling, Z.; Chen, X. Selection of Behavior Strategy for Quality Investment in Food Supply Chain under Social Co-governance Framework. J. Macro-Qual. Res. 2024, 12, 69–85. [Google Scholar]
  46. Xia, C.; Wang, J.; Perc, M.; Wang, Z. Reputation and reciprocity. J. Phys. Life Rev. 2023, 46, 8–45. [Google Scholar] [CrossRef]
  47. Guo, X.; Yao, J. Government Interference, Consumer Purchase Behavior and Brand Construction of Agricultural Products: Based on Tripartite Evolutionary Game Theory. J. Agro-For. Econ. Manag. 2023, 22, 171–181. [Google Scholar]
  48. Ganzhou Municipal Bureau of Agriculture and Rural Affairs. 2024 Department Budget Disclosure of Ganzhou Municipal Bureau of Agriculture and Rural Affairs. Available online: https://www.ganzhou.gov.cn/zfxxgk/c116058/202404/10e34e931a6b4a04a7ab91ea8bc0356e.shtml (accessed on 23 November 2023).
  49. Zhao, Z.; Liu, Y.; Chu, N. Evolutionary Game Analysis of Internal Employee’s Participation in Product Quality Supervision. Oper. Res. Manag. Sci. 2023, 32, 50–56. [Google Scholar]
  50. Ganzhou Gannan Navel Orange Association. Articles of Association of Ganzhou Gannan Navel Orange Association; Ganzhou Gannan Navel Orange Association: Ganzhou, China, 2020. [Google Scholar]
  51. Qi, Y.; Shao, J.; Mu, Y. The Role of Agricultural Product Industry Associations in Agricultural Industrialization: A Case Study of Heilongjiang Province. Acad. Exch. 2009, 1, 78–83. [Google Scholar]
  52. Ministry of Finance of the People’s Republic of China. Notice on the Cancellation of Direct Central Government Funding for Industry Associations and Chambers of Commerce from 2018. 27 October 2015. Available online: http://www.mof.gov.cn/index.htm (accessed on 23 November 2023).
  53. Lyu, S. Reflection on Chinese Subsidy and Bonus Policies of Geographical Indications of Agricultural Products in China Based on the Reform Trend of CAP in EU. Int. Econ. Trade Res. 2015, 31, 70–81. [Google Scholar]
  54. Saïdi, M.; Ay, J.S.; Marette, S.; Martin, C. Willingness-to-pay for reshuffling geographical indications. J. Wine Econ. 2020, 15, 95–111. [Google Scholar] [CrossRef]
Figure 1. Multi-stakeholder participation model for geographical indication agricultural product quality governance.
Sustainability 17 03414 g001
Figure 2. Evolutionary simulation under the scenario of (1,1,1,1).
Sustainability 17 03414 g002
Figure 3. Evolutionary simulation under the scenario of (1,0,1,1).
Sustainability 17 03414 g003
Figure 4. The impact of the initial probability of strategy choice by industry associations on evolution.
Sustainability 17 03414 g004
Figure 5. The impact of the synergistic capabilities of industry associations on evolution.
Sustainability 17 03414 g005
Figure 6. The impact of government subsidies received by industry associations on evolution.
Sustainability 17 03414 g006
Figure 7. The impact of local government revenue on evolution.
Sustainability 17 03414 g007
Figure 8. The impact of industry association revenue on evolution.
Sustainability 17 03414 g008
Figure 9. The impact of reputation mechanism on evolution.
Sustainability 17 03414 g009
Figure 10. The Impact of Reputational Losses of Local Governments and Industry Associations on Evolution.
Sustainability 17 03414 g010
Figure 11. The impact of probability of regulatory success on evolution.
Sustainability 17 03414 g011
Figure 12. The impact of the penalty on evolution.
Sustainability 17 03414 g012
Figure 13. The impact of consumer participation costs on evolution.
Sustainability 17 03414 g013
Figure 14. The impact of the benefits of consumer participation in governance on evolution.
Sustainability 17 03414 g014
Table 1. Parameter definition table.
SymbolMeaning
C x The additional costs arisen for agricultural product production organizations during self-regulatory production
C y The additional costs incurred when the local government imposes strict regulations
C z Additional costs incurred by trade associations in fulfilling their responsibilities
C w The cost of consumer participation in governance
R x The additional revenue derived from the sale of agricultural products under the name of geographical indication products
R y The regulatory gains from strict local government regulation
R z Benefits of active engagement by industry association
S Subsidies received from the local government when the association actively fulfills its responsibilities
B 1 The association saves the cost of improving quality for self-regulated production organizations
B 2 The association saves the government the cost of regulatory oversight.
B 3 The association saves information collection costs for consumers who participate in governance
D The cost of consumer complaints
F 1 Punishment by local government and associations for unregulated enterprises
F 2 Liability of production organization to consumer
K 1 The brand reputation that it brings to the organization of production
K 2 Reputational damage to the production organization
N 1 Local governments have been held accountable by higher-level governments and suffered reputational losses
N 2 Reputational damage to trade associations
U Taxes imposed by the government when agricultural products are sold under the name of geographical indications
E 1 Consumer surplus when consumers purchase high-quality agricultural products while participating in governance
E 2 The consumer surplus of consumers who consume ordinary products versus consumers who consume landmark products when no regulation is in place
E 3 Consumer surplus from purchasing low-quality agricultural products
α The probability of successful regulation when local governments exercise strict oversight
β The probability of regulatory success when trade associations actively fulfill their responsibilities
γ The probability of successful co-regulation between local governments and industry associations
Table 2. The payoff matrix of the quadrilateral evolutionary game in quality governance.
ParticipantsLocal Government (G)
Strictly   Regulate   ( y ) Loosely   Regulate   ( 1 y )
Consumer (C)
Participating
( w )
Not Participating Temporarily
( 1 w )
Participating
( w )
Not Participating Temporarily
( 1 w )
Industry association (A)Actively fulfilling responsibilities
( z )
Production organization
(P)
Standardize production
( x )
( P 1 , G 1 , C 1 , A 1 ) ( P 2 , G 2 , C 2 , A 2 ) ( P 3 , G 3 , C 3 , A 3 ) ( P 4 , G 4 , C 4 , A 4 )
Unstandardized production ( 1 x ) ( P 5 , G 5 , C 5 , A 5 ) ( P 6 , G 6 , C 6 , A 6 ) ( P 7 , G 7 , C 7 , A 7 ) ( P 8 , G 8 , C 8 , A 8 )
Negatively fulfilling responsibilities
( 1 z )
Standardize production
( x )
( P 9 , G 9 , C 9 , A 9 ) ( P 10 , G 10 , C 10 , A 10 ) ( P 11 , G 11 , C 11 , A 11 ) ( P 12 , G 12 , C 12 , A 12 )
Unstandardized production ( 1 x ) ( P 13 , G 13 , C 13 , A 13 ) ( P 14 , G 14 , C 14 , A 14 ) ( P 15 , G 15 , C 15 , A 15 ) ( P 16 , G 16 , C 16 , A 16 )
Table 3. Stability analysis of equilibrium points in the context of negative performance by industry associations.
Equilibrium PoinJacobian Matrix EigenvaluesSymbolStability
λ 1 λ 2 λ 3 λ 4
E 1 1,1 , 0,1 C x B 1 F 1 1 α F 2 K 1 1 α K 2 α R x C y R y N 2 C z + S + R z C w E 1 + E 2 ( × , × , × , × ) Conditional ESS
E 2 1,1 , 0,0 C x α ( F 1 + R x ) C y R y N 2 C z + S + R z E 1 C w E 2 ( × , × , × , × ) Conditional ESS
E 3 1,0 , 0,1 C x F 2 K 1 K 2 R y C y N 2 C z + S + R z C w E 1 + E 2 ( × , × , × , × ) Conditional ESS
E 4 1,0 , 0,0 C x R y C y 0 E 1 E 2 C w ( + , × , 0 , × ) Unstable point
E 5 0,0 , 0,0 C x R y C y + α ( F 1 U ) β F 1 C z + S + R z F 2 C w D ( , × , × , × ) Conditional ESS
E 6 0,0 , 0,1 F 2 C x + K 1 + K 2 F 1 + R y C y + α N 1 U F 1 C z + S + R z C w F 2 + D ( × , × , × , × ) Conditional ESS
E 7 0,1 , 0,0 α F 1 + R x C x C y R y + α U F 1 γ F 1 + 2 S + R z C z + N 2 1 α F 2 ( × , × , × , + ) Unstable point
E 8 0,1 , 0,1 F 1 C x + 1 α F 2 + K 2 + K 1 + α R x C y F 1 R y + α U N 1 F 1 C z + R z + S 1 α F 2 ( × , × , × , + ) Unstable point
Table 4. Stability analysis of equilibrium points in the context of positive performance by industry associations.
Equilibrium PoinJacobian Matrix EigenvaluesSymbolStability
λ 1 λ 2 λ 3 λ 4
E 9 1,1 , 1,1 C x B 1 F 1 1 γ F 2 K 1 1 γ K 2 γ R x C y B 2 R y C z S N 2 R z C w B 3 E 1 + E 2 ( × , × , × , × ) Conditional ESS
E 10 1,1 , 1,0 C x B 1 γ ( F 1 + R x ) C y B 2 R y C z S N 2 R z B 3 C w + E 1 E 2 ( × , × , × , × ) Conditional ESS
E 11 1,0 , 1,1 C x B 1 F 1 1 β F 2 K 1 1 β K 2 β R x B 2 C y + R y C z S N 2 R z C w B 3 E 1 + E 2 ( × , × , × , × ) Conditional ESS
E 12 1,0 , 1,0 C x B 1 β F 1 β R x B 2 C y + R y 0 B 3 C w + E 1 E 2 ( × , × , 0 , × ) Unstable point
E 13 0,0 , 1,0 B 1 C x + β ( F 1 + R x ) B 2 C y C z β F 1 S R z 1 β F 2 ( × , , × , + ) Conditional ESS
E 14 0,0 , 1,1 B 1 C x + F 1 + K 1 + R x B 2 C y C z F 1 S R z 1 α F 2 ( × , , × , + ) Conditional ESS
E 15 0,1 , 1,0 B 1 C x + γ F 1 + γ R x C y B 2 R y + γ β U 2 C z S R z γ F 1 N 2 1 γ F 2 ( × , × , × , + ) Unstable point
E 16 0,1 , 1,1 B 1 C x + F 1 + 1 γ F 2 + K 2 + K 1 + γ R x C y B 2 R y + γ β U N 1 C z F 1 S R z 1 γ F 2 ( × , × , × , + ) Unstable point
Table 5. Simulation parameter values.
Variable C x R x F 1 F 2 k 10 k 20 m ϵ μ C y R y U C z
Value152141.5231.21.11.281026
Variable R z S N 1 N 2 B 1 B 2 B 3 C w E 1 E 2 α β γ
Value5443320.20.3210.40.50.7
Disclaimer/Publisher’s Note: The statements, opinions and data contained in all publications are solely those of the individual author(s) and contributor(s) and not of MDPI and/or the editor(s). MDPI and/or the editor(s) disclaim responsibility for any injury to people or property resulting from any ideas, methods, instructions or products referred to in the content.

