Article

Clean Heating Technology Diffusion with Government Departments’ and Commercial Banks’ Participation: An Evolutionary Game Analysis

by
Ruguo Fan
1,
Jianfeng Lu
2 and
Chaoping Zhu
3,4,*
1
Economics and Management School, Wuhan University, Wuhan 430072, China
2
Dong Fureng Institute of Economic and Social Development, Wuhan University, Wuhan 430072, China
3
School of Software, Jiangxi Normal University, Nanchang 330022, China
4
Research Center of Management Science and Engineering, Jiangxi Normal University, Nanchang 330022, China
*
Author to whom correspondence should be addressed.
Sustainability 2025, 17(8), 3413; https://doi.org/10.3390/su17083413
Submission received: 3 March 2025 / Revised: 7 April 2025 / Accepted: 9 April 2025 / Published: 11 April 2025
(This article belongs to the Section Energy Sustainability)

Abstract

:
As a key driver of the green and low-carbon transformation of the energy sector, clean heating technology plays a crucial role in advancing sustainable energy development. However, the research and development (R&D) of clean heating technology is hindered by conflicting interests among key supply-side stakeholders, including heating enterprises, commercial banks, and government departments. These conflicts create challenges for promoting the diffusion of clean heating technology. To address this issue, this paper develops a tripartite evolutionary game model involving these stakeholders, with the aim of exploring strategies to facilitate clean heating technology diffusion from the supply side. Through mathematical modeling and numerical simulations, we examine how variables such as cost, subsidies, and penalties affect the strategic decisions of these participants. The results showusing that (1) the cost of clean heating technology R&D significantly influences commercial banks’ willingness to collaborate with heating enterprises; (2) increasing credit penalties for non-compliance and enhancing returns from clean heating technology can motivate heating enterprises to engage in technology R&D; (3) enhancing economic penalties and strengthening informal regulations can improve cooperation between commercial banks and heating enterprises; (4) moderate subsidies can positively influence the strategies adopted by commercial banks and heating enterprises. Based on these findings, we propose policy recommendations to promote clean heating technology diffusion from the supply side. This study offers both theoretical support and practical guidance for advancing clean heating technology diffusion, which is strategically important for sustainable energy development.

1. Introduction

In September 2020, the Chinese government explicitly announced its goals to achieve carbon peaking by 2030 and carbon neutrality by 2060, collectively known as the “3060” dual carbon targets. To achieve these targets, China is actively advancing the green and low-carbon transformation of its energy structure. Heating, a crucial component of building energy consumption, has emerged as a key area in this transformation. However, in northern China, traditional heating sources such as coal, fuelwood, and straw burning still dominate during the winter months [1]. According to the Building Energy Research Center [2], heating energy consumption in northern Chinese towns reached 212 million tons of standard coal equivalent in 2018, with only approximately 25% of this energy originating from clean sources. Confronted with the increasing depletion of traditional energy sources and growing climate and environmental pressures, it has become imperative to identify sustainable, efficient, and environmentally friendly heating solutions. Clean heating technologies, including solar, geothermal, and electric heating, are regarded as the mainstream direction for future heating technology due to their environmentally friendly, renewable, or low-carbon emission characteristics [3]. This type of heating not only significantly reduces greenhouse gas emissions and reliance on fossil energy [4], but also provides a more comfortable and healthier indoor environment [5]. Nevertheless, the diffusion of clean heating technology still encounters significant challenges. On the one hand, the high cost of technology research and development (R&D) is a major obstacle [6], as many heating enterprises often cannot afford the substantial funds required for technology R&D on their own. On the other hand, the imperfect policies and regulations further hinder the diffusion of clean heating technology. The absence of clear incentives and standard guidelines leads to limited market adoption [7]. Moreover, the reliability of the technology and the stability of the energy supply are equally important and cannot be overlooked [8]. Given the strategic importance of clean heating technology and the uncertainties and complexities surrounding their adoption, exploring effective strategies to accelerate their diffusion has become a critical issue that demands urgent attention.
The diffusion of clean heating technology is a multifaceted process encompassing several stages, from the adoption of clean energy to technology research and development (R&D), and ultimately market commercialization [9,10]. This process parallels the diffusion of green and low-carbon technologies [11,12], and is shaped by various internal and external factors. It also involves interactions among various stakeholders, including heating enterprises, government departments, commercial banks, and residents. The existing literature has extensively examined the role of internal factors, such as R&D costs and technology returns, in technology diffusion [13,14]. Policy instruments like fiscal subsidies, tax incentives, financial penalties, and credit penalties have been proven effective in promoting technology diffusion [15,16,17,18]. Government regulations also help to restrain opportunistic behavior [19,20]. Additionally, the successful diffusion of clean heating technology relies on the support from multiple stakeholders: heating enterprises conduct R&D; government departments oversee technology R&D and its application; commercial banks provide financial support for R&D; and residents serve as the end-users of the technology [21]. While much research has focused on interactions between governments and heating enterprises [22], or governments and residents [23], little attention has been paid to the crucial role of commercial banks in the diffusion of clean heating technology. As key suppliers of funds on the supply side, commercial banks play an indispensable role in lowering R&D costs and promoting technology innovation. Therefore, this study will delve into the impact of commercial banks’ participation in clean heating technology diffusion.
Research and development (R&D) in clean heating technology is inherently complex, costly, and risky [24]. The diffusion of clean heating technology from the supply side is a complex, evolutionary process involving multiple stakeholders. As the complexity and interactivity of technology diffusion grows, the academic community increasingly recognizes that a single factor or subject is inadequate for uncovering the intrinsic mechanisms of technology diffusion [25,26]. Evolutionary game theory, introduced by Maynard Smith (1974) [27], provides a scientific framework for modeling multi-agent behavioral interactions and their dynamic evolution. This approach is well-suited for analyzing the complexities of clean heating technology diffusion [28]. Recently, evolutionary game theory has been widely applied to study the diffusion of low-carbon technology [29], water-saving technology [30], and digital technology [19]. In the field of clean technology, scholars have begun using evolutionary game theory to explore the mechanisms underlying technology diffusion [13]. For instance, Wang et al. (2022) [31] constructed an evolutionary game model involving the energy industry, a third-party regulatory authority, and the national government to study clean energy technology diffusion. They concluded that moderate government supervision and penalties contribute to technology diffusion. Fang et al. (2019) [22] studied the choice of fuel technology in urban heating systems using an evolutionary game between centralized heating enterprises and the government. They proposed that the combination of dynamic taxation and subsidy policies could accelerate the electrification transformation of heating systems. Moreover, some of the literature examining interactions among the central government, local governments, and farmers suggests that increasing governance strength and subsidy intensity can promote clean heating adoption [23]. In addition, studies focusing on how government policies affect clean heating technology diffusion have found that increasing social welfare, subsidies, and penalties can improve the profitability of clean heating and thus promote technology diffusion [21]. However, the increase in technology R&D costs may reduce the profitability of clean heating enterprises and hinder supply-side clean heating technology diffusion efforts. In the broader field of technology diffusion, scholars employed an evolutionary game approach to investigate how to promote the diffusion of carbon emission reduction technology [32,33], new energy vehicle technology [34,35], energy storage technology [36,37], etc. Therefore, evolutionary game theory undoubtedly provides a powerful analytical tool for understanding the dynamics of clean heating technology diffusion.
Existing research on the diffusion of clean heating technology has provided valuable insights; however, certain gaps remain. Primarily, the literature emphasizes the role of government policies in promoting technology diffusion, while often overlooking other potential mechanisms such as credit penalties and informal regulations. Although financial subsidies, economic penalties, and tax incentives have been extensively studied, the impacts of credit penalties remain underexplored. Similarly, formal government regulations have been analyzed, but the significance of informal regulations is not well recognized. Meanwhile, previous studies have predominantly examined technology diffusion from the demand side, focusing on consumer acceptance of clean heating technologies. In contrast, supply-side research—especially regarding the roles of government departments and commercial banks—is relatively scarce. Furthermore, many studies suffer from subjectivity and uncertainty in model construction and parameter setting. In some cases, the initial value setting of variables lacks a reasonable basis, limiting the reliability and general applicability of the findings. To comprehensively understand the complex evolutionary mechanisms driving supply-side clean heating technology diffusion, this study aims to address the following key questions:
(1) How can a multi-agent evolutionary game model be constructed to accurately capture clean heating technology diffusion on the supply side?
(2) Under what conditions can the dynamic system of clean heating technology diffusion reach an evolutionary stable state?
(3) How do changes in key variables—such as cost-, subsidy-, and punishment-related variables—affect the strategic choices of stakeholders in clean heating technology diffusion?
To address these questions and fill the gaps in the existing literature, this paper employs evolutionary game theory to analyze the interactions among commercial banks, government departments, and heating enterprises. A tripartite evolutionary game model is developed to represent clean heating technology diffusion. Using a Delphi survey and considering real-world conditions, we set the initial values of key variables to ensure the scientific validity and reliability of the findings. Furthermore, this paper employs a numerical simulation technique to explore in-depth the impact of key variables—such as R&D costs, government subsidies, economic penalties, and liquidated damages—on the strategic selections of the involved parties. In summary, through evolutionary game modeling and numerical simulation, this paper investigates the dynamics of clean heating technology diffusion on the supply side, providing a theoretical foundation and practical guidance for promoting the widespread application of this technology.
This study provides an innovative examination of clean heating technology diffusion from the supply side. The main contributions of this study are outlined as follows. First, we develop a tripartite evolutionary game model to examine clean energy technology diffusion from the supply side. Unlike most existing studies that focus on demand-side diffusion, our study shifts the perspective to the supply side. Furthermore, we incorporate commercial banks—an essential yet often overlooked stakeholder—into the model, providing new insights into the dynamics of clean heating technology diffusion. Second, we analyze how key variables and two forms of opportunistic behavior of heating enterprises influence participants’ strategic choices. Using the Delphi survey method and numerical simulations, we explore the effects of factors related to costs, subsidies, and penalties, as well as the impacts of “subsidy fraud” and “loan fraud” on strategy evolution. This deepens the understanding of the mechanisms driving clean heating technology diffusion. Third, we highlight the significance of green credit policies and informal regulations in promoting supply-side clean heating technology diffusion. Our findings suggest that green credit policies help alleviate financial constraints for heating enterprises, encouraging investment in R&D and facilitating technology diffusion. Moreover, we show that informal regulations can complement formal regulations by curbing opportunistic behaviors among heating enterprises. In summary, this paper offers new perspectives on clean energy technology diffusion, providing insights into promoting technology R&D and mitigating opportunistic behavior. The remainder of this paper is organized as follows. Section 2 presents the construction and analysis of the evolutionary game model. Section 3 summarizes the simulation results. In Section 4, we discuss the main findings and compare them with the existing literature. Finally, the conclusions and policy recommendations are presented in Section 5.

2. Evolutionary Game Model Construction and Analysis

2.1. Problem Description and Modeling Assumptions

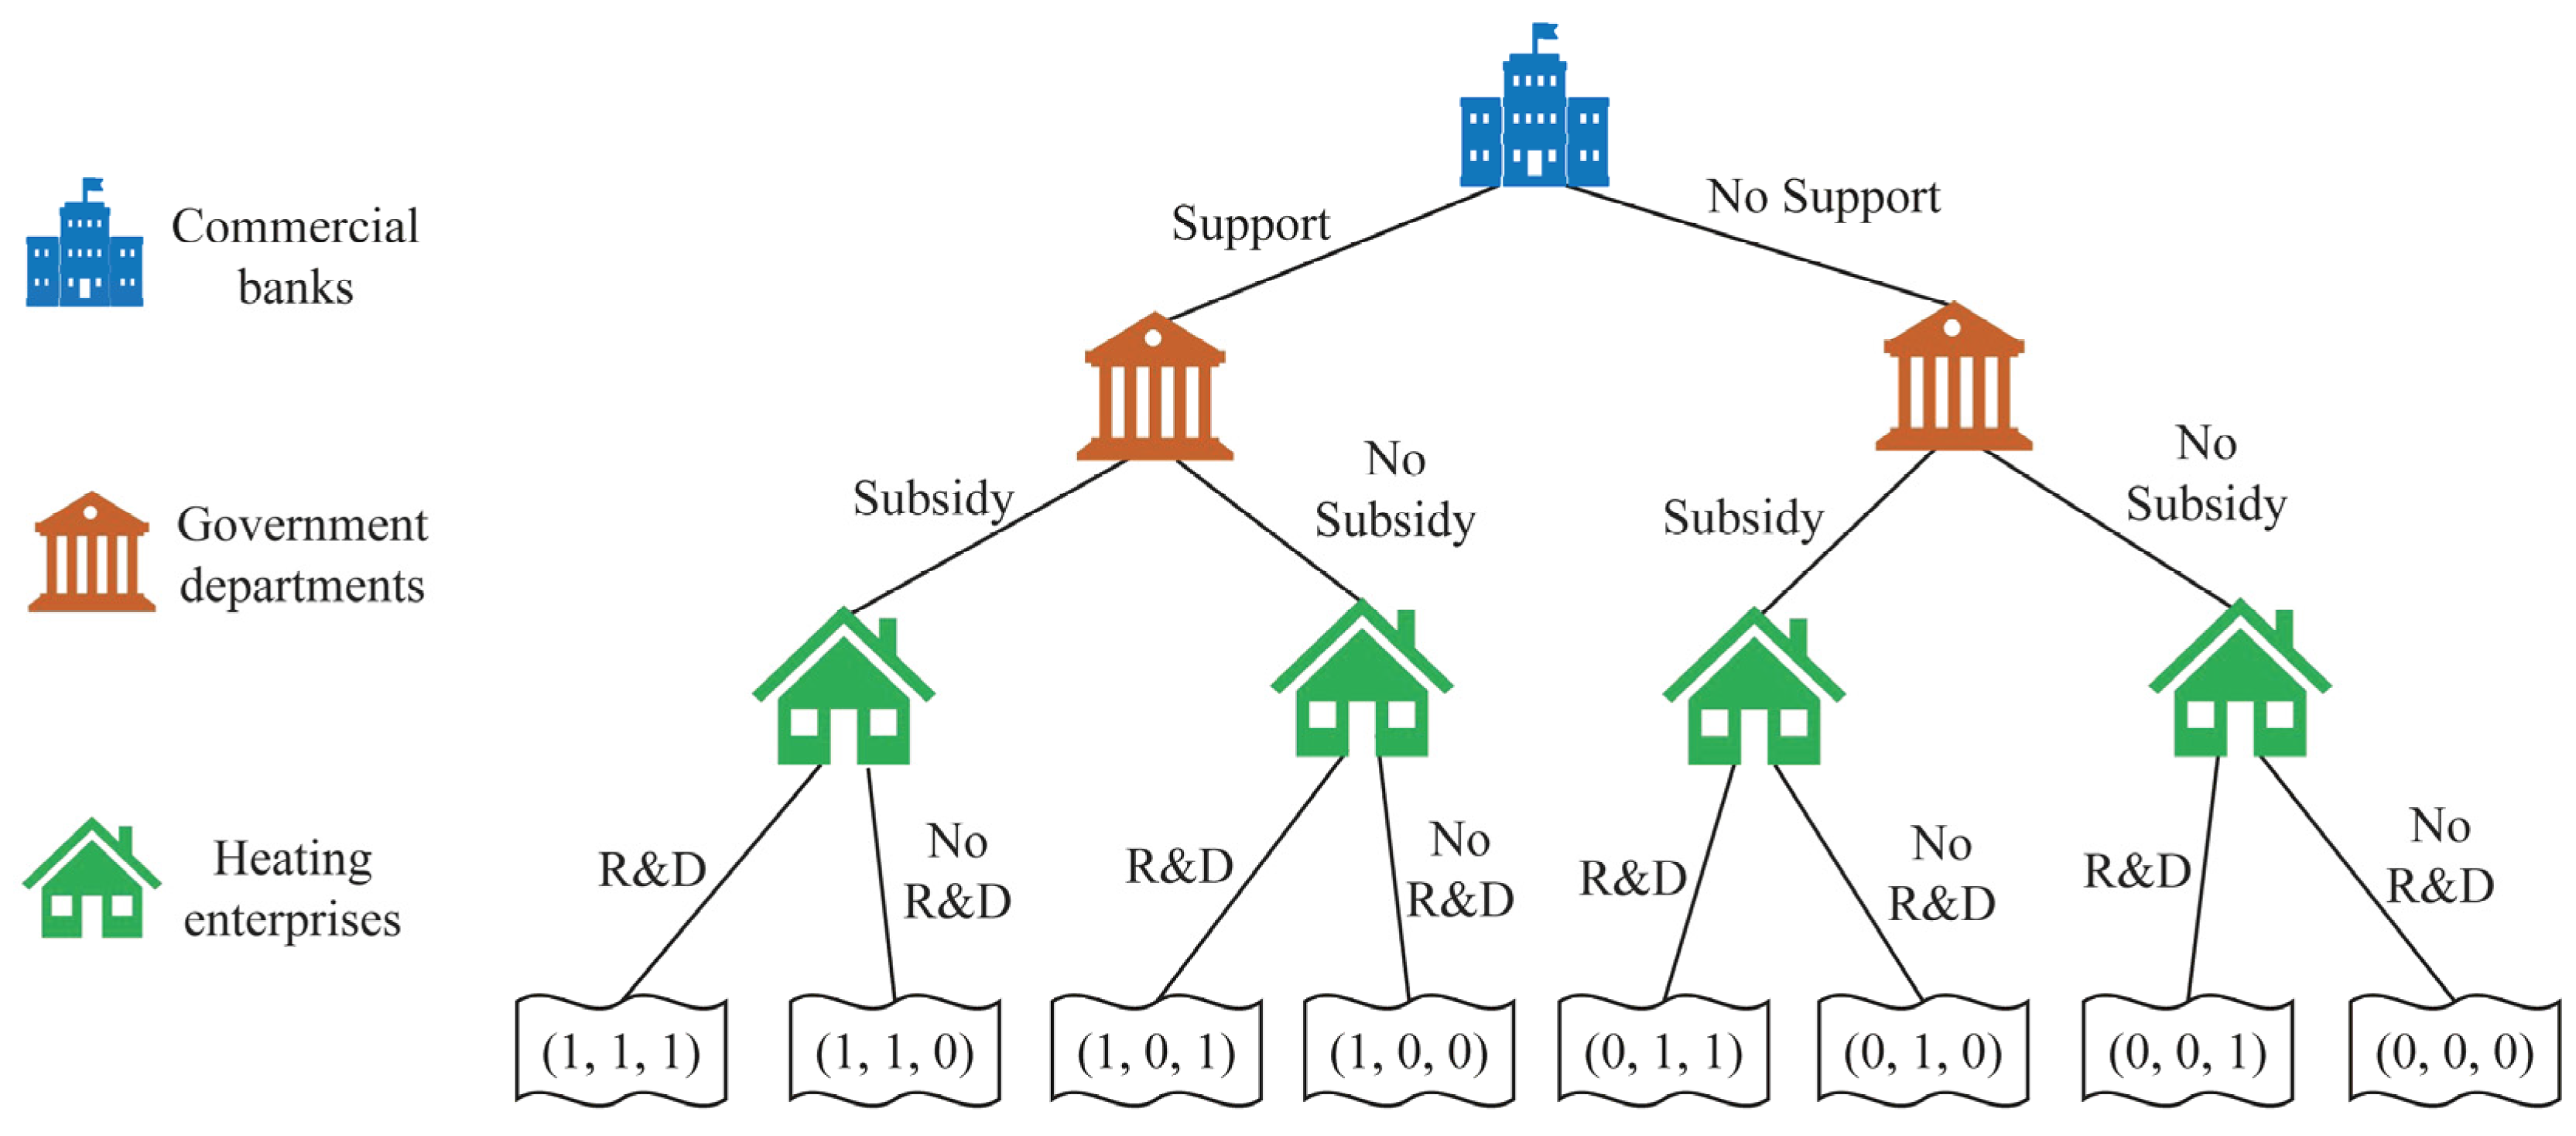
2.1.1. Problem Description

In the context of the “3060” dual carbon goals, the Chinese government is actively transforming its energy structure from traditional coal-fired energy to cleaner alternatives like electricity and biomass. Heating accounts for a significant portion of building energy consumption and is crucial for meeting basic human needs. Consequently, implementing clean heating is vital for overall energy transformation. In northern China, however, winter heating still relies predominantly on coal, firewood, and straw, posing significant challenges for the adoption of clean heating technologies. From a stakeholder perspective, the diffusion of clean heating technology on the supply side involves three core participants: heating enterprises, commercial banks, and government departments. Heating enterprises, as technology providers, supply the necessary technical support; commercial banks offer financial backing for R&D through green credit policies; and government departments use policy instruments—such as financial subsidies and economic penalties—to stimulate both R&D and technology application.
These stakeholders often have conflicting interests. For instance, heating enterprises may hesitate to invest in technology R&D due to high capital requirements and inherent risks, which undermines the effectiveness of clean heating diffusion on the supply side. Therefore, coordinating these conflicts and establishing effective incentive and constraint mechanisms are crucial. Evolutionary game theory offers a robust analytical framework to address this challenge. By modeling micro-level strategic interactions among stakeholders, this approach can elucidate how incentive and restraint mechanisms influence stakeholder behavior, thereby facilitating the diffusion of clean heating technology on the supply side. This paper constructs a tripartite evolutionary game model involving heating enterprises, commercial banks, and government departments to examine key factors affecting clean heating technology diffusion. The goal is to provide a theoretical foundation and practical guidance for policy formulation and market mechanism design.

2.1.2. Basic Assumptions

In this study, we employ evolutionary game theory to construct a mathematical model. Drawing from existing research on clean heating technology diffusion [21,22,23], we propose the following assumptions:
Assumption 1. The diffusion of clean heating technology on the supply side involves three key stakeholders: heating enterprises, commercial banks, and government departments. Each participant operates under bounded rationality, striving to adopt strategies that maximize their individual benefits [38]. Due to incomplete information, these stakeholders make optimal strategic choices based on the limited data available to them [39].
Assumption 2. Commercial banks have two strategic options regarding clean heating technology R&D: a Support strategy and a No Support strategy [40]. The Support strategy involves providing green credit to promote clean heating technology R&D, while the No Support strategy means that commercial banks choose not to provide green credit. Let the probability of a commercial bank adopting the Support strategy be denoted as x . Consequently, the probability of adopting the No Support strategy is 1 x . Similarly, government departments have two strategic choices: a Subsidy strategy and a No Subsidy strategy [41]. The Subsidy strategy involves offering financial subsidies to heating enterprises to stimulate clean heating technology R&D, and the No Subsidy strategy means that government departments opt not to provide financial subsidies. Let the probability of a government department selecting the Subsidy strategy be denoted as y . Therefore, the probability of selecting the No Subsidy strategy is 1 y . Heating enterprises also have two strategic options for clean heating technology R&D: an R&D strategy and a No R&D strategy [42]. The R&D strategy involves investing resources into technology R&D, which is crucial for clean energy heating technology diffusion on the supply side. Conversely, the No R&D strategy indicates that heating enterprises choose not to engage in technology R&D, thereby hindering the diffusion of clean energy heating technologies. Let the probability of a heating enterprise choosing the R&D strategy be denoted as z , and then the probability of choosing the No R&D strategy is 1 z .
Assumption 3. When heating enterprises choose to pursue the R&D strategy, they must secure green credit from commercial banks to cover the associated costs, denoted as C 1 [42]. If government departments choose the Subsidy strategy, heating enterprises receive a financial subsidy, denoted as S 3 [41], where S 3 < C 1 . If commercial banks provide green credit support, heating enterprises receive green credit with a credit limit of C 1 and an interest rate of r [40]. Considering the inherent uncertainties in technology R&D [43], we assume that the probability of successful R&D for clean heating technology is p 1 [41]. In the case of R&D failure, heating enterprises are obligated to repay only the principal of the green credit. Conversely, if R&D is successful, the clean heating technology yields returns R 1 for the enterprises [21]. However, even with government subsidies or green credit, heating enterprises may choose not to engage in technology R&D, a behavior known as “subsidy fraud” or “loan fraud” [44,45]. “Subsidy fraud” refers to situations where an enterprise receives a government subsidy but does not engage in technology R&D. If such fraudulent behavior is exposed [46], the probability of being reported is p 2 , and the enterprise may face a fine F 1 imposed by government departments. Similarly, “loan fraud” occurs when commercial banks provide green credit, but the heating enterprise does not engage in technology R&D. If this fraudulent behavior is discovered [47], the probability of being reported is p 3 , and the heating enterprise must pay the bank a default fine F 2 and may also suffer a credit loss L 1 .
Assumption 4. Referring to the existing studies [48], we assume that commercial banks provide green credit to heating enterprises, denoted as C 1 , with an associated interest rate of r . If clean heating technology R&D is successful, the expected return for commercial banks from providing green credit is p 1 C 1 r . Conversely, if R&D fails, commercial banks incur a bad debt loss, denoted as ( 1 p 1 ) C 1 . This assumption does not account for the capital cost of commercial banks. Furthermore, if heating enterprises choose to engage in clean heating technology R&D and commercial banks do not provide green credit support, commercial banks may face the risk of being reported by heating enterprises. The probability of commercial banks being reported for non-compliance with the green credit policy is denoted as p 4 , and the fine imposed by the government is F 3 [32].
Assumption 5. When providing subsidies to heating enterprises, government departments assume the regulatory responsibility of ensuring that the funds are utilized exclusively for clean heating technology R&D [22]. If the R&D is successful, the government receives environmental benefits, denoted as p 1 E 1 . Conversely, if heating enterprises fail to conduct R&D, the government incurs a comprehensive performance loss, denoted as L 2 [39]. Additionally, if heating enterprises fail to engage in technology R&D after receiving subsidies, the government incurs an additional performance loss, denoted as ( 1 p 1 ) L 2 .
Based on the assumptions above, we present the main variables involved in the modeling of this study in Table 1.

2.2. Payoff Analysis and Solving for Replicator Dynamics Equations

2.2.1. Payoff Analysis

In this study, we introduce a tripartite game model to analyze the diffusion of clean heating technology on the supply side, involving three key players: heating enterprises, commercial banks, and government departments. Each player has two strategic options, as detailed in Section 2.1.2, resulting in eight possible strategy combinations. To visually represent these combinations and their potential interactions, we construct a tripartite game tree, shown in Figure 1. This game tree delineates the strategy choices and interactions among the players, providing a structured framework for the subsequent payoff analysis.
Using evolutionary game theory, we calculate the payoff for each player in every strategic combination. The methodology for this analysis is outlined in Appendix A. Based on these calculations, we present the payoff matrix for the tripartite game model in Table 2.

2.2.2. Calculation of Replicator Dynamics Equation

The replicator dynamics equation is a key tool in evolutionary game theory, used to track the evolution of strategies adopted by participants. This equation illustrates how players adjust their strategies to maximize benefits, typically by observing and replicating the strategies of others. In essence, the replicator dynamics equation captures the rate at which a player’s strategy changes. It is calculated by multiplying the proportion of a given strategy by the difference between its expected payoff and the population’s average payoff.
The main goal of solving the replicator dynamics equation is to determine the probability of a player choosing a specific strategy, the expected payoff for that strategy, and the average payoff for the entire population. Solving these equations is a crucial step in evolutionary game analysis. This paper presents the replicator dynamics equations for commercial banks, government departments, and heating enterprises, labeled as Equations (1)–(3), respectively. The detailed calculations are provided in Appendix A.
F x = d x d t = x ( U B S U ¯ B ) = x 1 x [ y p 4 F 3 + z ( p 1 C 1 r + C 1 p 3 F 2 ) + p 3 F 2 C 1 ]
F y = d y d t = y ( U G S U ¯ G ) = y 1 y [ x z S 3 x p 4 F 3 + z ( S 3 p 2 F 1 ) + p 2 F 1 + p 4 F 3 S 3 ]
F z = d y d t = z ( U E R U ¯ E ) = z 1 z { x y S 3 + x [ p 1 ( R 1 r C 1 ) + p 3 F 2 + L 1 2 C 1 ] y ( S 3 p 2 F 1 ) }

2.3. Equilibrium Points and Stability Analysis

2.3.1. Solving for Equilibrium Points and Eigenvalue Analysis

By combining the replicator dynamics equations for each player, we derive the dynamic system corresponding to the tripartite evolutionary game:
F x = x 1 x [ y p 4 F 3 + z ( p 1 C 1 r + C 1 p 3 F 2 ) + p 3 F 2 C 1 ] F y = y 1 y [ x z S 3 x p 4 F 3 + z ( S 3 p 2 F 1 ) + p 2 F 1 + p 4 F 3 S 3 ] F z = z 1 z { x y S 3 + x [ p 1 ( R 1 r C 1 ) + p 3 F 2 + L 1 2 C 1 ] y ( S 3 p 2 F 1 ) }
Let F x = 0 , F y = 0 and F z = 0 ; the system can be solved to reveal eight pure-strategy equilibrium points and at least one mixed-strategy equilibrium point. The eight pure-strategy equilibrium points are E 1 0 ,   0 ,   0 , E 2 0 ,   0 ,   1 , E 3 0 ,   1 ,   0 , E 4 0 ,   1 ,   1 , E 5 1 ,   0 ,   0 , E 6 1 ,   0 ,   1 , E 7 1 ,   1 ,   0 and E 8 1 ,   1 ,   1 , and the mixed-strategy equilibrium point is E 9 x ,   y ,   z . As shown in previous studies [49], the mixed-strategy equilibrium point is not an evolutionary stable strategy (ESS). To assess the stability of the equilibrium points, we employ the Lyapunov asymptotic stability theorem, which is the most widely used tool for this purpose. This paper applies the theorem to analyze the stability of the eight pure-strategy equilibrium points. First, we calculate the Jacobian matrix of the dynamic system:
J = F x x F x y F x z F y x F y y F y z F z x F z y F z z = a 1 ( 1 2 x ) x 1 x p 4 F 3 x 1 x a 2 y 1 y ( z S 3 p 4 F 3 ) b 1 ( 1 2 y ) y 1 y ( x S 3 + S 3 p 2 F 1 ) z 1 z ( y S 3 + c 1 ) z 1 z ( x S 3 S 3 + p 2 F 1 ) c 2 ( 1 2 z )
where a 1 = y p 4 F 3 + z ( p 1 C 1 r + C 1 p 3 F 2 ) + p 3 F 2 C 1 , a 2 = p 1 C 1 r + C 1 p 3 F 2 , b 1 = x z S 3 x p 4 F 3 + z ( S 3 p 2 F 1 ) + p 2 F 1 + p 4 F 3 S 3 , c 1 = p 1 ( R 1 r C 1 ) + p 3 F 2 + L 1 2 C 1 , and c 2 = x y S 3 + x [ p 1 ( R 1 r C 1 ) + p 3 F 2 + L 1 2 C 1 ] y ( S 3 p 2 F 1 ) . Accordingly, we can further solve the three eigenvalues, λ 1 , λ 2 , and λ 3 , of the Jacobian matrix corresponding to each equilibrium point, as shown in Table 3.

2.3.2. Stability Analysis of Equilibrium Points

According to evolutionary game theory and the Lyapunov asymptotic stability theorem, a necessary condition for an equilibrium point to be considered an ESS is that all the eigenvalues of its Jacobian matrix must be negative. In this study, we analyze the stability of the eight equilibrium points. The results, presented in Table 3, show that the Jacobian matrices for equilibrium points E 1 0 ,   0 ,   0 , E 2 0 ,   0 ,   1 , E 4 0 ,   1 ,   1 , and E 8 1 ,   1 ,   1 contain at least one non-negative eigenvalue. Thus, these points do not satisfy the ESS conditions. As a result, we will further investigate the stability of the remaining four equilibrium points.
(1)
Case A: Stability conditions for equilibrium point E 3 0 ,   1 ,   0
In this case, the conditions for the equilibrium point to be an ESS are defined by the following inequalities: p 4 F 3 < C 1 p 3 F 2 , S 3 < p 2 F 1 + p 4 F 3 , and p 2 F 1 < S 3 . These conditions suggest that if the potential loss faced by commercial banks for providing green credit exceeds the fine imposed by the government for non-compliance with the green credit policy, commercial banks are more likely to choose the No Support strategy. Similarly, if the subsidy provided by the government is lower than the total fines for “subsidy fraud” of heating enterprises and commercial banks’ non-compliance with the green credit policy, government departments will opt for the Subsidy strategy. Furthermore, heating enterprises will select the No R&D strategy if the subsidy they receive outweighs the fine they would incur for committing “subsidy fraud”. This stability condition demonstrates that commercial banks, considering the potential losses from offering credit support, may prefer not to provide such support. For government departments, offering subsidies becomes the dominant strategy when the subsidy cost is lower than the total fines for non-compliance. Meanwhile, heating enterprises may engage in “subsidy fraud” if the subsidy is sufficient to offset the potential fines.
(2)
Case B: Stability conditions for equilibrium point E 5 1 ,   0 ,   0
In this case, the necessary conditions for the equilibrium point to be an ESS are defined by the following inequalities: C 1 < p 3 F 2 , p 2 F 1 < S 3 , p 1 ( R 1 r C 1 ) < 2 C 1 p 3 F 2 + L 1 . These conditions indicate that the evolutionary game reaches an ESS when (1) the potential loss for commercial banks for providing green credit support is lower than the fine they face for “loan fraud”; (2) the fine imposed by government departments for heating enterprises committing “subsidy fraud” is lower than the subsidy provided; and (3) the net benefit of heating enterprises from clean heating technology R&D is less than the benefit from “loan fraud”. In this equilibrium, commercial banks choose the Support strategy, the government selects the No Subsidy strategy, and heating enterprises opt for the No R&D strategy. This implies that if the potential loss for commercial banks providing green credits is lower than the penalty for “loan fraud”, the Support strategy becomes their dominant choice due to the sufficient economic incentives. For government departments, if the penalty for “subsidy fraud” is less than the subsidies provided, the No Subsidy strategy becomes more beneficial. For heating enterprises, if the net benefit from technology R&D is lower than the benefit from “loan fraud”, there is little incentive to pursue the R&D strategy.
(3)
Case C: Stability conditions for equilibrium point E 6 1 ,   0 ,   1
In this case, the conditions for the equilibrium point to be an ESS are defined by the following inequalities: p 1 C 1 r < 0 , S 3 < 0 ,   2 C 1 p 3 F 2 + L 1 < p 1 ( R 1 r C 1 ) . These conditions suggest that the evolutionary game reaches an ESS when the net payoff for heating enterprises from clean heating technology R&D exceeds the payoff from “loan fraud”. In this equilibrium, commercial banks adopt the Support strategy, government departments select the No Subsidy strategy, and heating enterprises opt for the R&D strategy. This implies that if the economic return from technology R&D is at least equal to the payoff from opportunistic behavior, heating enterprises are motivated to engage in technology R&D.
(4)
Case D: Stability conditions for equilibrium point E 7 1 ,   1 ,   0
In this case, the conditions for the equilibrium point to be an ESS are defined by the following inequalities: C 1 < p 4 F 3 + p 3 F 2 , S 3 < p 2 F 1 , p 1 ( R 1 r C 1 ) + p 3 F 2 + L 1 + p 2 F 1 < 2 C 1 . These conditions demonstrate that the ESS of the evolutionary game occurs when (1) the potential loss for commercial banks from providing green credit is lower than the fine for non-compliance with the green credit policy; (2) the penalty for “subsidy fraud” for heating enterprises exceeds the subsidies provided; and (3) the expected net benefit for heating enterprises in clean heating technology R&D is lower than the net gains from “loan fraud” and “subsidy fraud”. In this equilibrium, commercial banks select the Support strategy, the government departments choose the Subsidy strategy, and heating enterprises opt for the No R&D strategy. For commercial banks, the Support strategy is more economically beneficial than the No Support strategy. Similarly, government departments benefit from adopting the Subsidy strategy under these conditions. However, heating enterprises are unlikely to engage in R&D if the net benefits from “loan fraud” and “subsidy fraud” exceed those from technology R&D.

3. Simulation Results and Analysis

3.1. Parameter Settings

This study conducts a numerical simulation analysis of a tripartite evolutionary game model using Matlab 2016a. The objective is to investigate how changes in key variables affect the behavior strategies of the players. As some variables lacked authoritative data, expert opinions were sought to acquire the necessary knowledge and experience. The values of these variables were determined based on expert assessments obtained through a Delphi survey [50,51]. The Delphi survey process consists of three steps. First, a questionnaire was designed (see Appendix B, Table A1) outlining the survey content, variable descriptions, and possible value ranges to guide expert judgment. Second, twelve experts from relevant fields were invited to participate via email, WeChat, phone calls, and other channels. Finally, nine experts responded with their professional opinions (see Appendix B, Table A1 for their profiles). After several rounds of iterations, the expert opinions converged, and the final values were adopted as the model’s initial variable values. These results are presented in Appendix B, Table A3. In addition, according to China’s prevailing credit policy for renewable energy projects, the green credit interest rate was set at 0.05. Additionally, in line with China’s prevailing credit policy for renewable energy projects, the green credit interest rate was set at 0.05. Following the approach of previous studies, all probability-related variables were assigned a value of 0.5. The initial values of the model’s variables were determined using the aforementioned process [39,52], as summarized in Table 1. This method ensures the scientific and rational assignment of parameters, providing a solid foundation for the subsequent numerical simulation analysis.

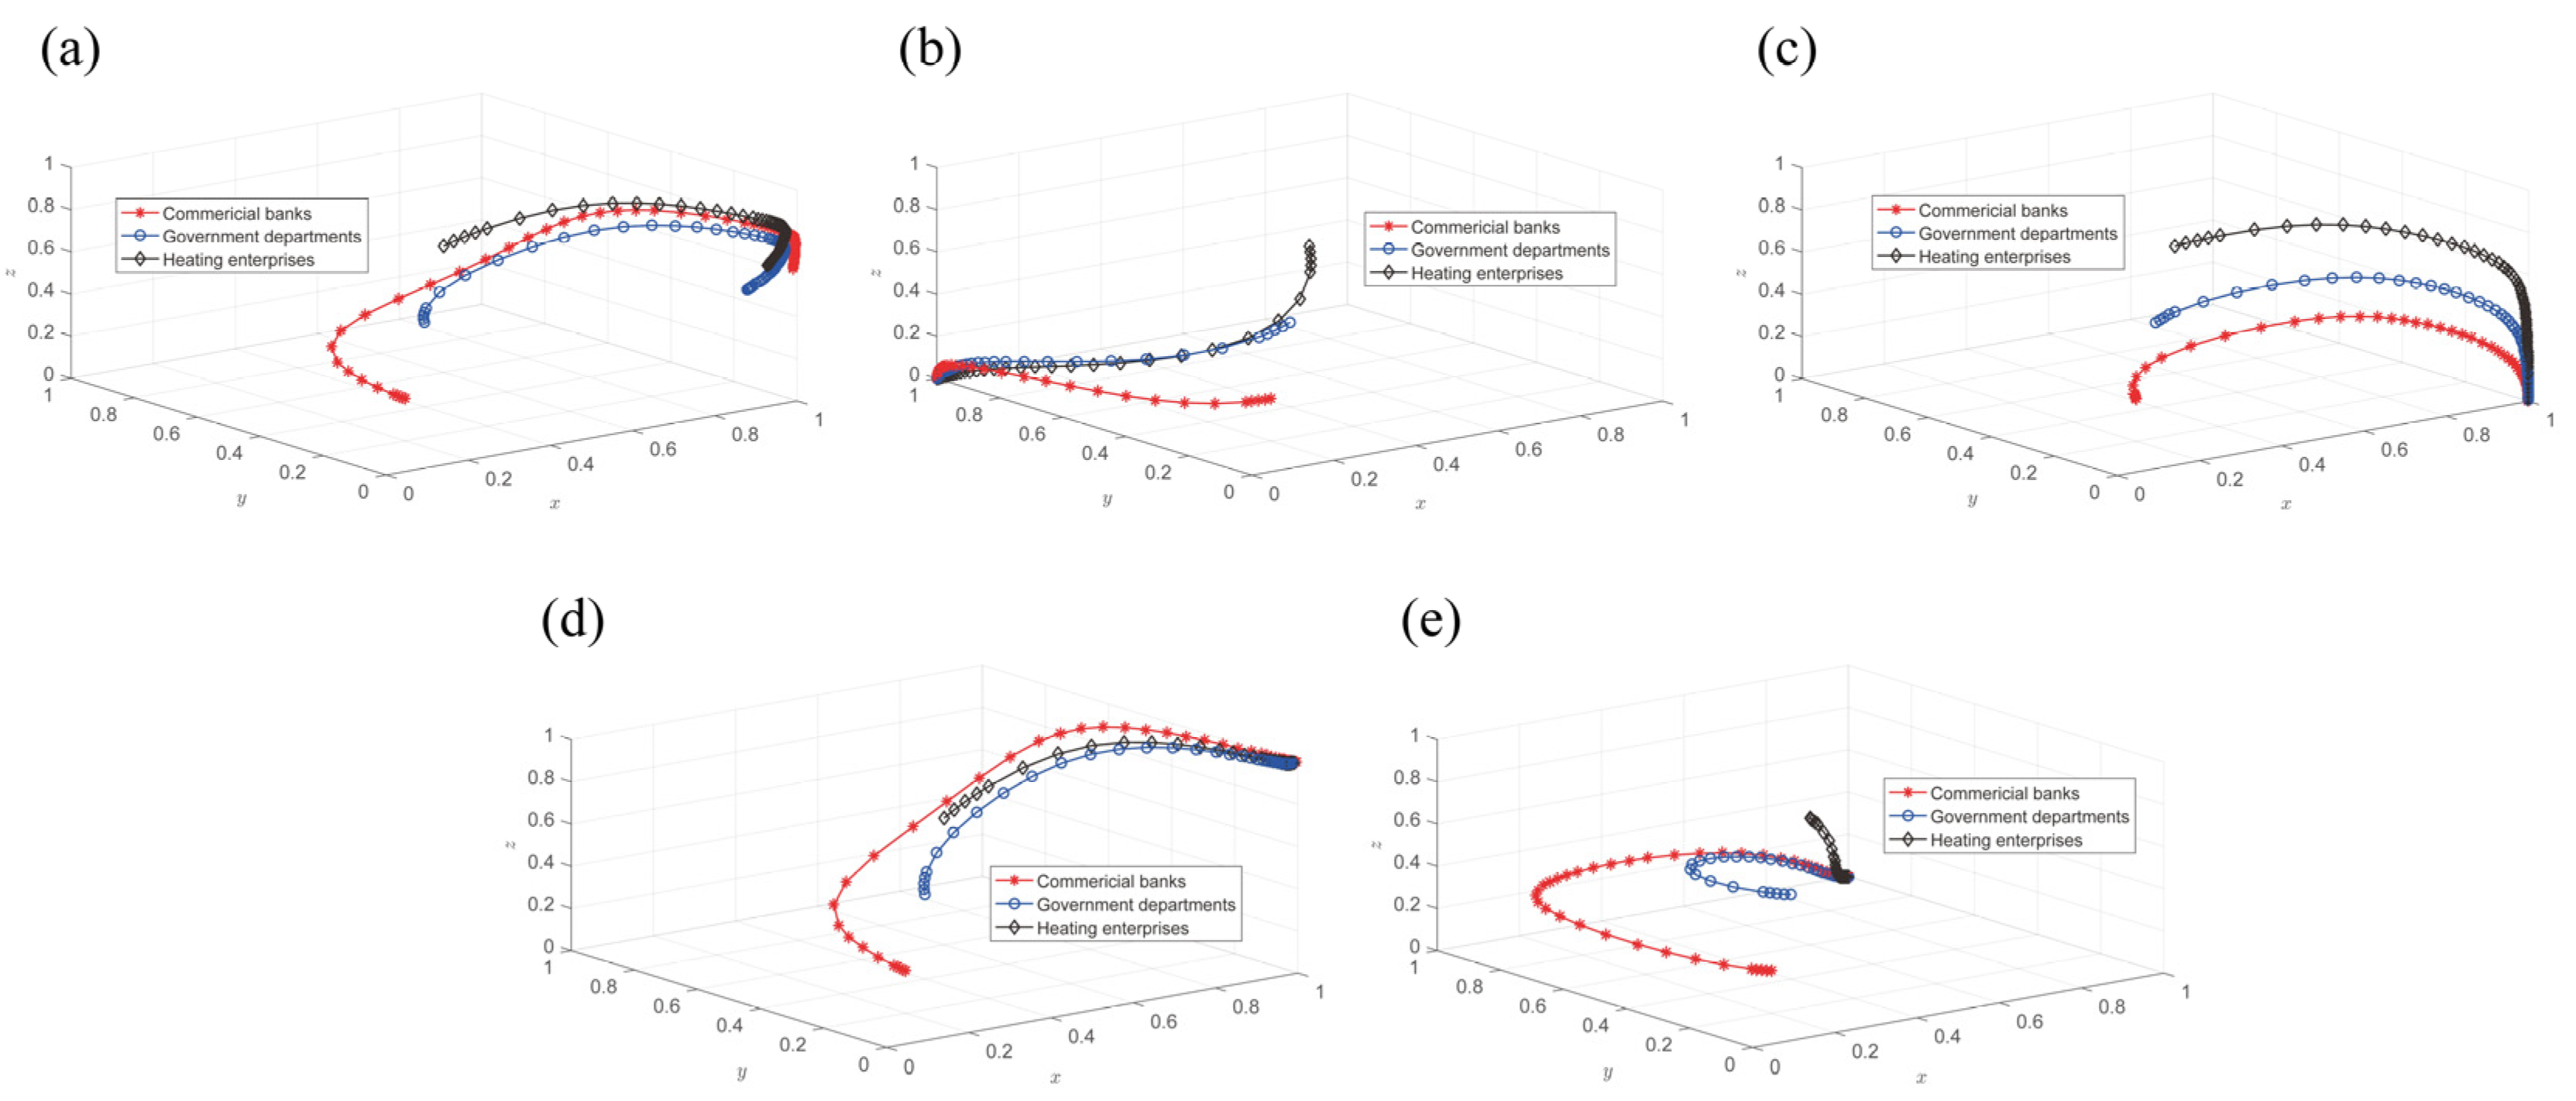
3.2. ESS Simulation Results for the Four Cases

Using the initially determined parameter values as a baseline, we explore the equilibrium outcomes of the tripartite evolutionary game model through numerical simulations. To validate the stability of the equilibrium points discussed in Section 2.3, we conduct systematic tests of the ESS under various strategy combinations. The simulation results are presented in Figure 2b–e.
In verifying the ESS under Case A, the parameter C 1 is set to 8, F 3 is adjusted to 6, and the other variables are kept at their benchmark values. As shown in Figure 2b, the simulation results demonstrate that, when the stability conditions for Case A are met, the ESS of the tripartite evolutionary game E 3 0 ,   1 ,   0 is achieved. This outcome aligns with the predictions of the theoretical analysis, suggesting that in this scenario, commercial banks are likely to withhold support, government departments may provide subsidies, and heating enterprises are unlikely to invest in technology R&D. Thus, the numerical simulation results confirm the theoretical analysis regarding the ESS in Case A.
In verifying the ESS under Case B, the variable p 1 is reduced from 0.5 to 0.25, and the variable F 1 is decreased from 5 to 4. Simultaneously, p 1 is adjusted from 0.5 to 0.4, while F 2 is increased from 8 to 12, with all other variables remaining at their benchmark values. As illustrated in Figure 2c, the simulation results confirm that when the stability conditions for Case B are met, the ESS of the tripartite evolutionary game E 5 1 ,   0 ,   0 is achieved. This suggests that, in this case, commercial banks are likely to adopt the Support strategy, government departments will choose not to provide subsidies, and heating enterprises will opt not to engage in technology R&D. Therefore, the numerical simulation results validate the theoretical analysis of the ESS under Case B.
In verifying the ESS under Case C, the parameter R 1 is increased from 10 to 15, while all other variables remain at their benchmark values. As shown in Figure 2d, when the stability conditions for Case C are met, the ESS of the tripartite evolutionary game E 6 1 ,   0 ,   1 is identified. This ESS indicates that, in this case, commercial banks tend to adopt the Support strategy, government departments will not provide subsidies, and heating enterprises will engage in technology R&D. The numerical simulation results confirm the ESS conclusions derived from the theoretical analysis under Case C.
In verifying the ESS under Case D, the parameter C 1 is set to 10, F 1 is adjusted to 10, and F 3 is increased from the baseline value of 10 to 15, while the remaining variables are kept at their benchmark levels. As shown in Figure 2e, the simulation results indicate that, when the stability conditions for Case D are met, the ESS of the tripartite evolutionary game E 7 1 ,   1 ,   0 is reached. This ESS suggests that commercial banks are inclined to pursue the Support strategy, while the government is expected to implement the Subsidy strategy. Conversely, heating enterprises are less likely to engage in technology R&D. The numerical simulation results confirm the theoretical analysis conclusions for Case D.

3.3. The Impact of Key Parameters on Strategy Evolution

From the perspective of social development, collaboration between commercial banks and heating enterprises is crucial for promoting clean heating technology diffusion on the supply side. Although the tripartite evolutionary game model developed in this study identifies up to four ESSs, Case C (where E 6 1 ,   0 ,   1 corresponds to the ESS) is considered as the most ideal outcome. To further explore this ideal ESS, we perform a numerical simulation to analyze how changes in key parameters affect the strategy choices of each game player.

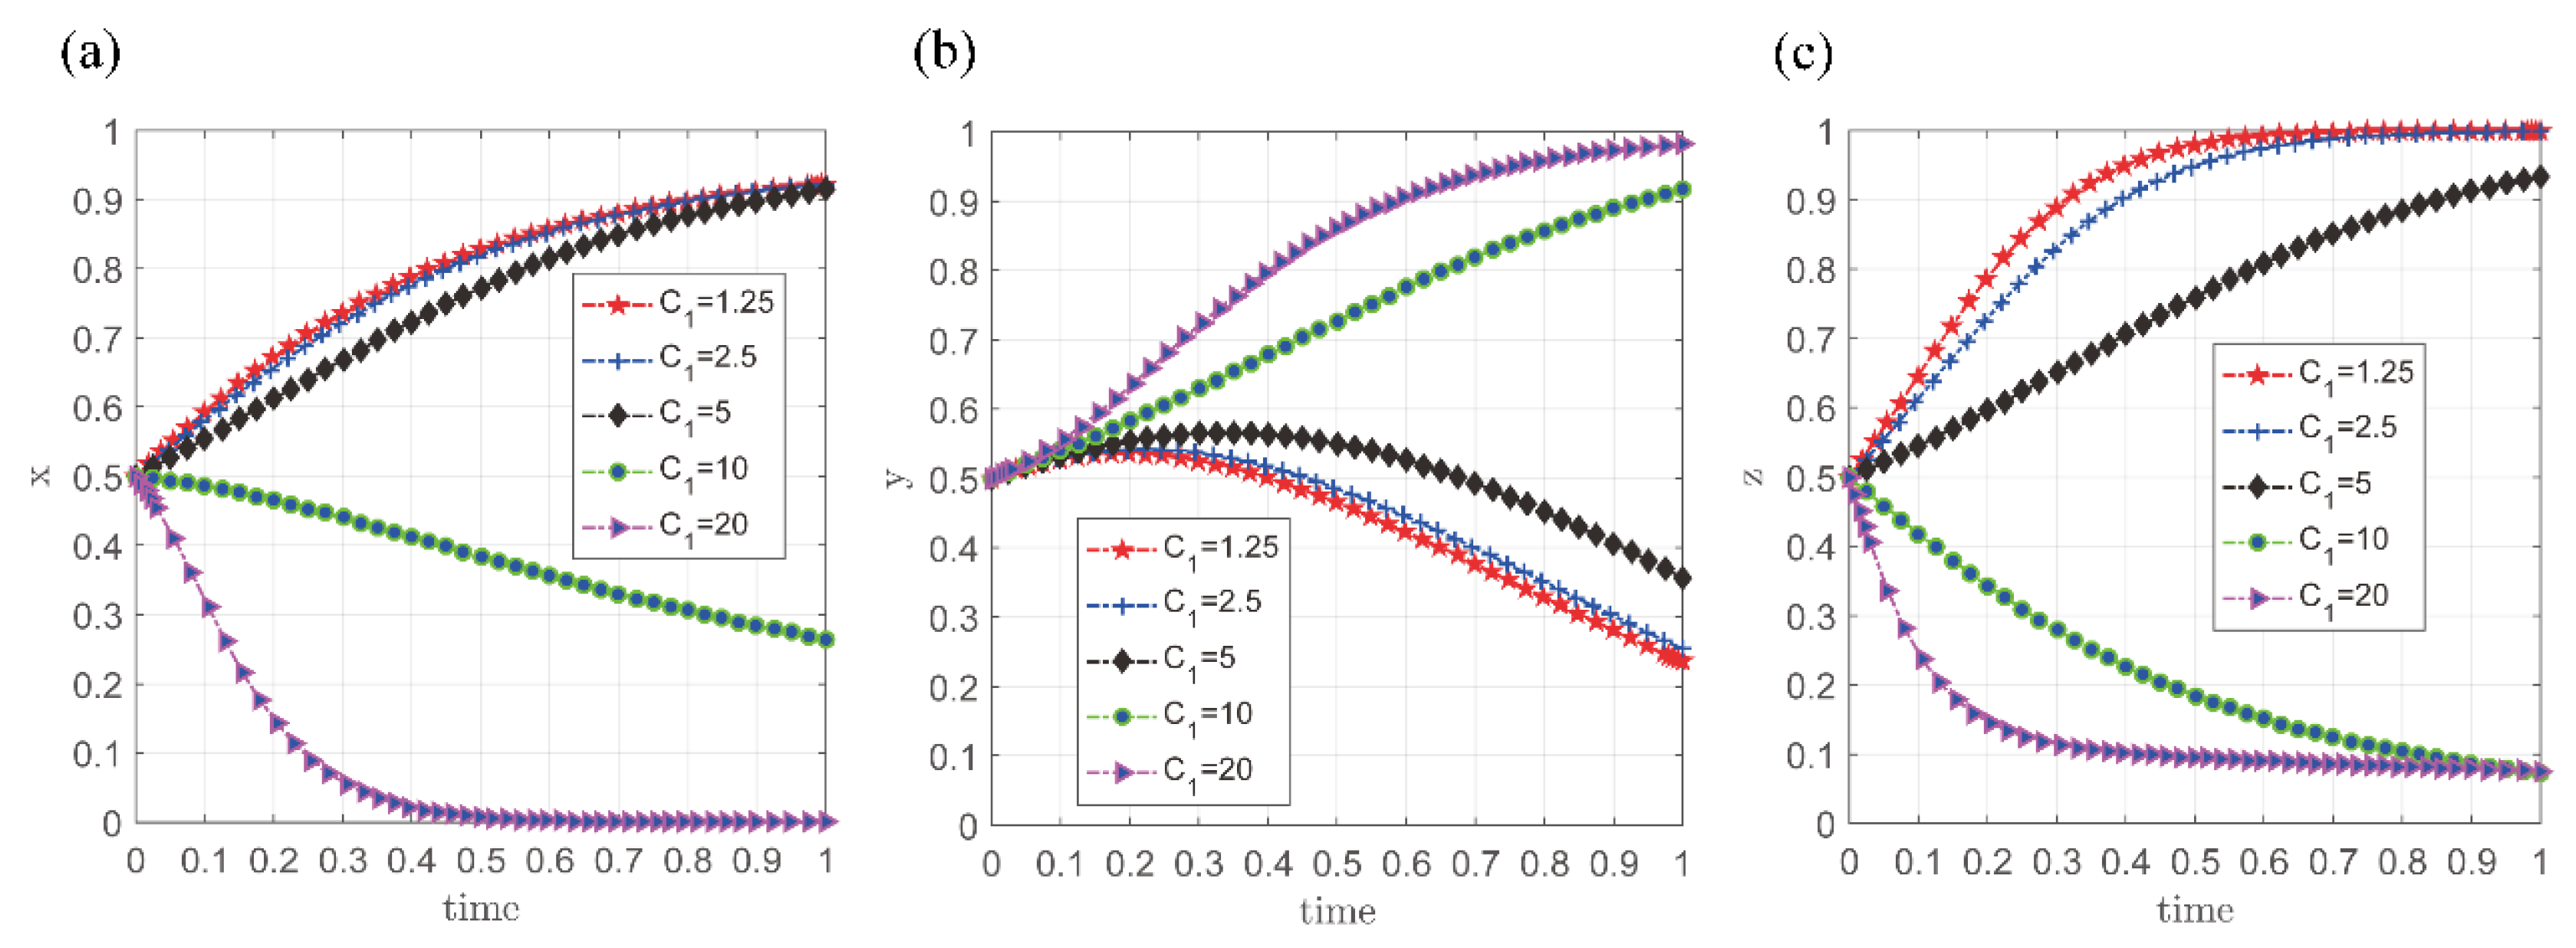
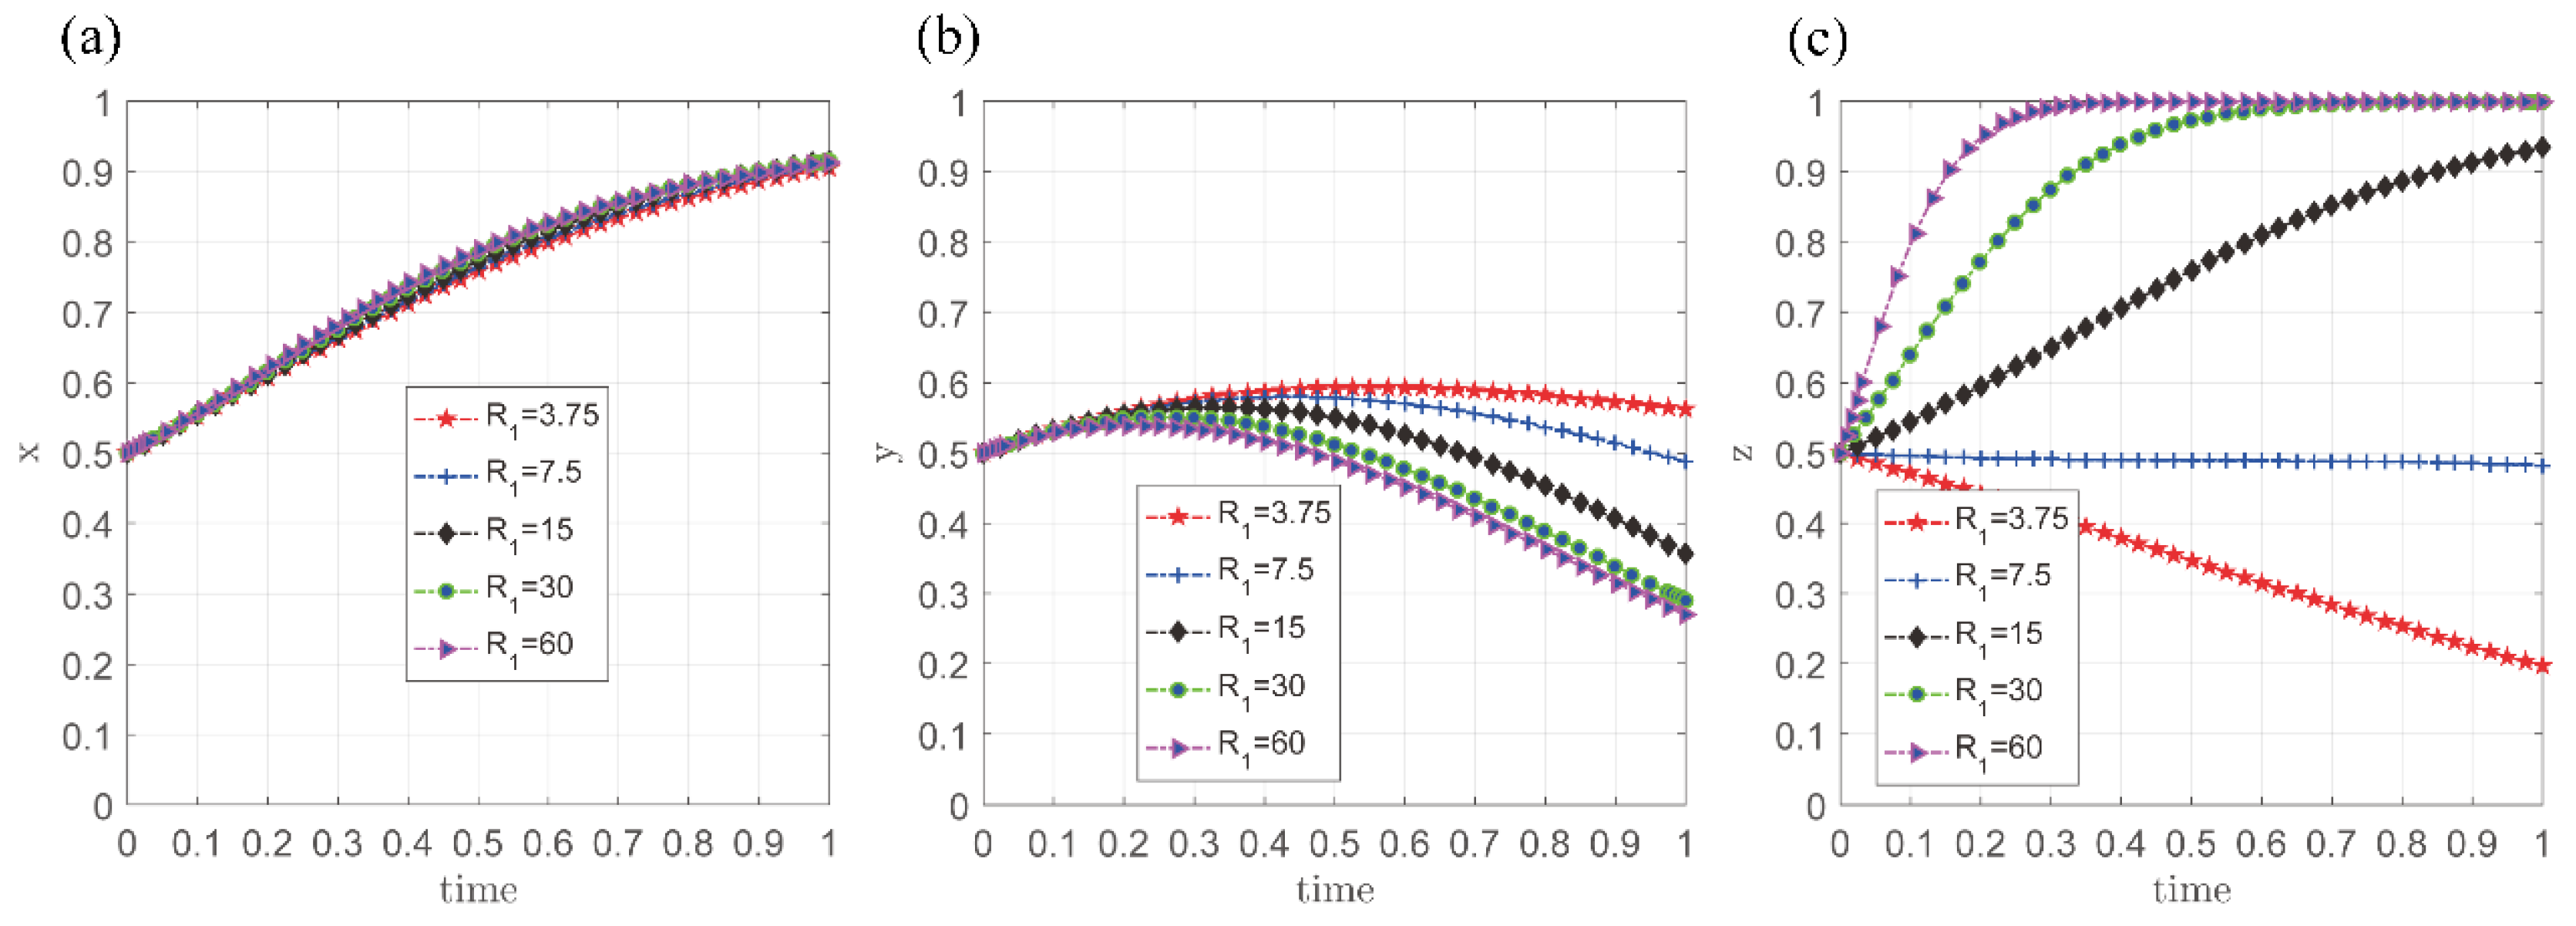
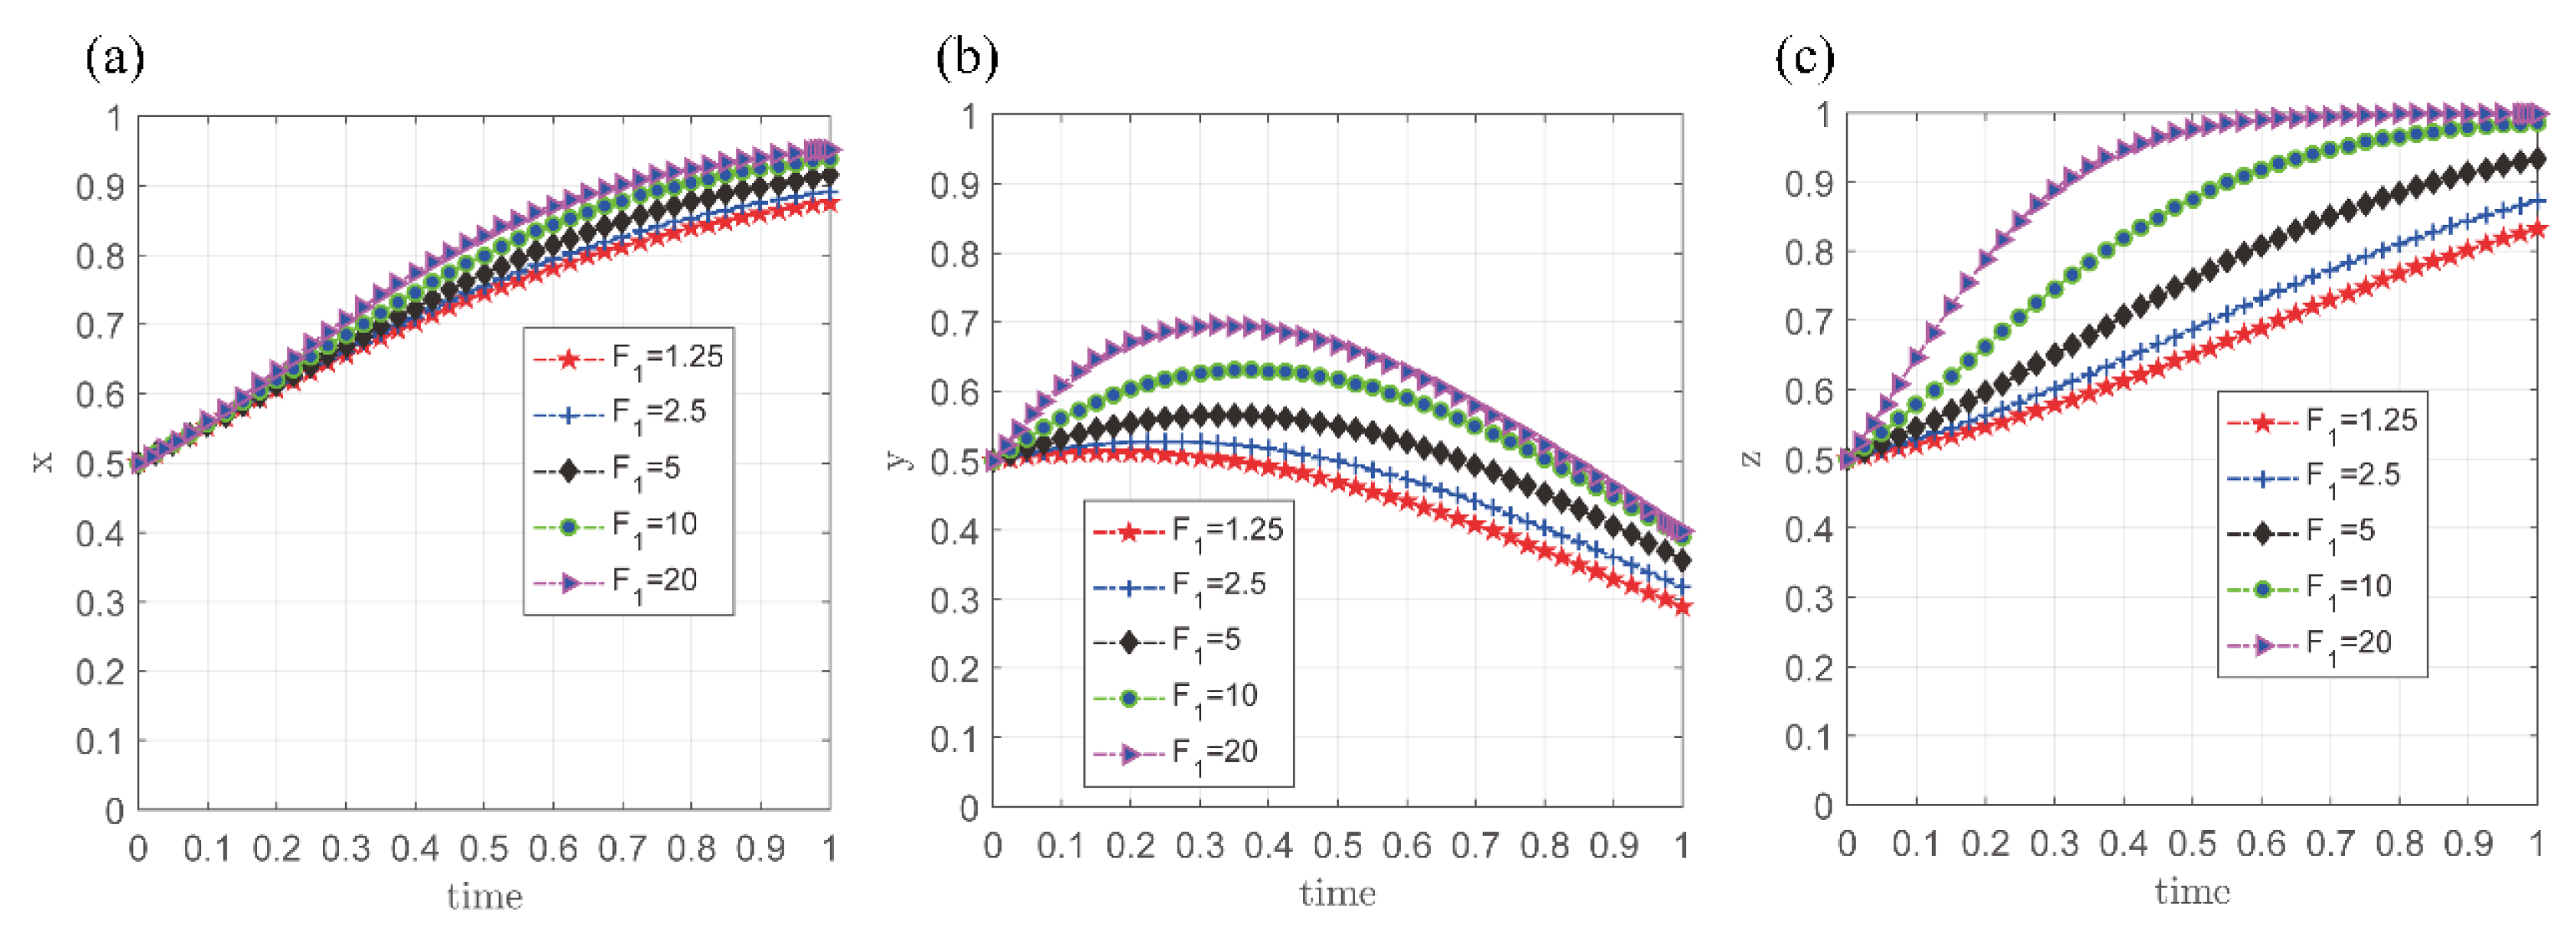
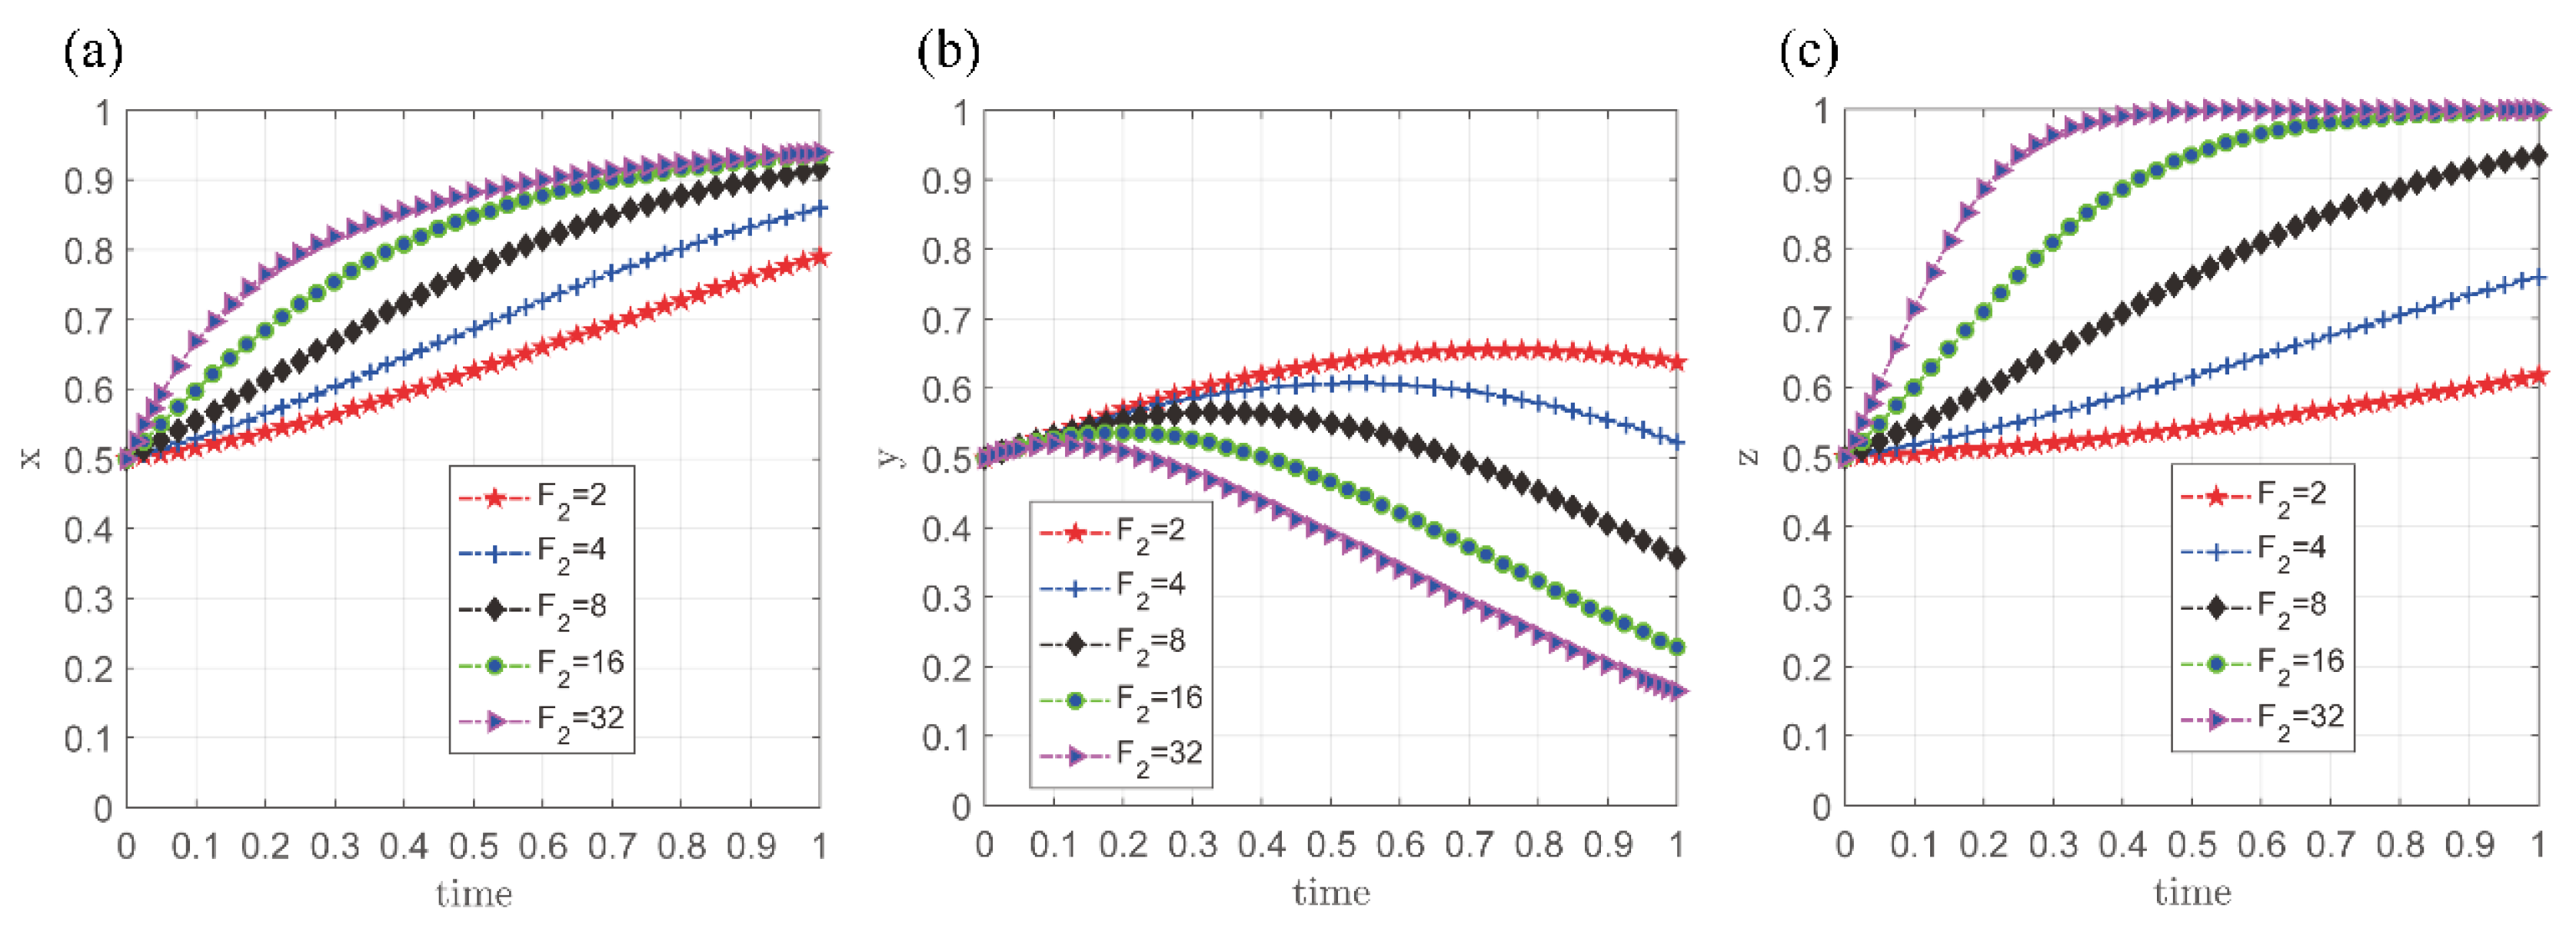
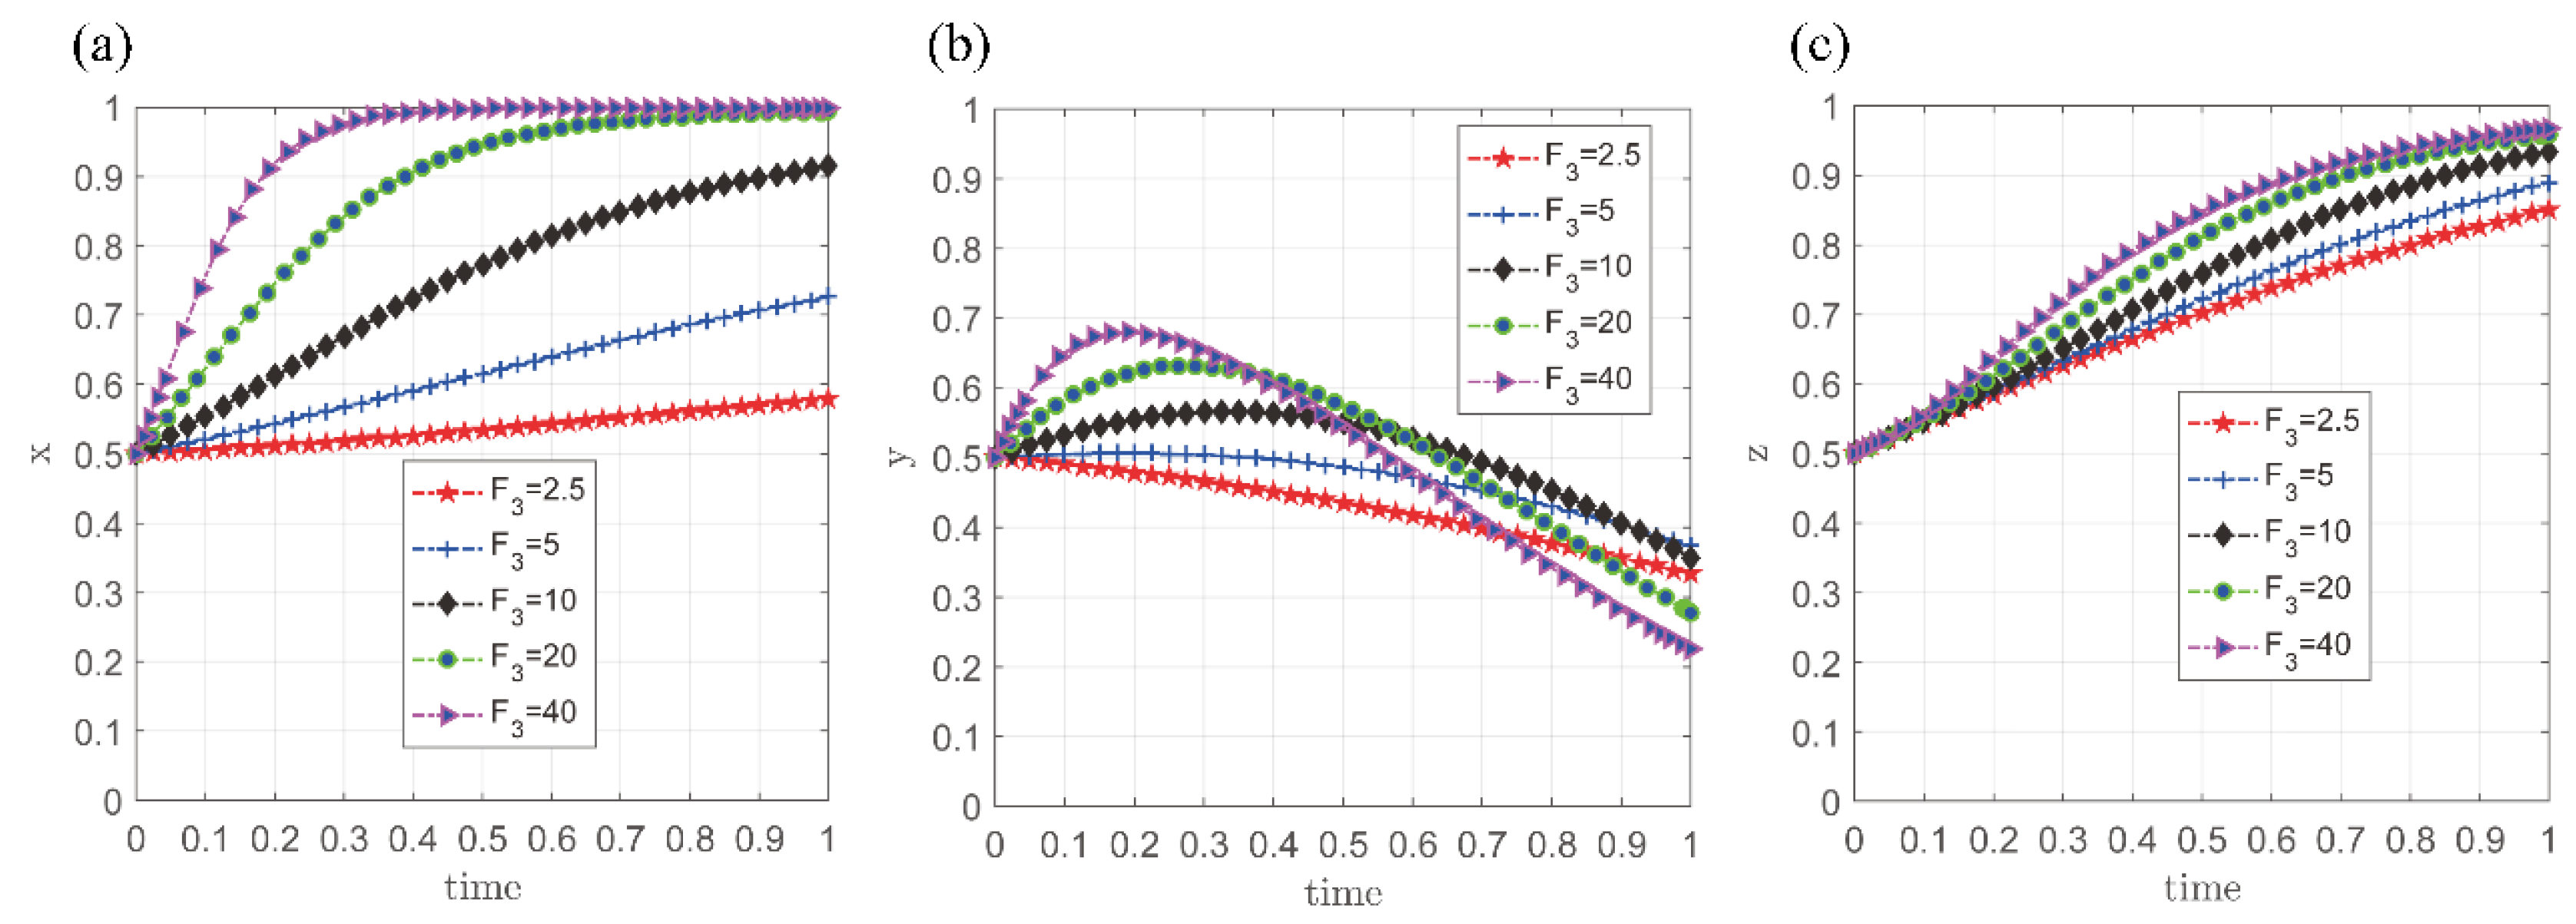
3.3.1. The Impact of Cost- and Subsidy-Related Variables on the Strategy Selections

In the tripartite evolutionary game model developed in this study, the cost variable C 1 and the subsidy variable S 3 are key factors influencing the strategic choices of players. To better understand how these variables affect strategy evolution, we create five simulation scenarios for C 1 and S 3 , setting their values to 0.25×, 0.5×, 1×, 2×, and 4× of the benchmark values. The other variables are kept consistent with those in Case C. The simulation results are presented in Figure 3 and Figure 4.
(1)
The impact of C 1 on strategy selections of game players
As illustrated in Figure 3, the simulation results demonstrate that when the cost of clean heating technology R&D ( C 1 ) is low, commercial banks are more likely to adopt the Support strategy, and heating enterprises tend to choose the R&D strategy. Meanwhile, government departments generally adopt the No Subsidy strategy to minimize regulatory burden. However, as C 1 increases, both commercial banks and heating enterprises show a reduced willingness to adopt their respective strategies. In particular, when C 1 reaches a high level (e.g., C 1 = 20 , where the credit limit is high), all commercial banks abandon the Support strategy. Furthermore, the proportion of heating enterprises opting for the R&D strategy falls below 10%. At this point, government departments are compelled to adopt the Subsidy strategy and enhance regulation. These findings suggest that when R&D costs are low, the market can effectively promote collaboration between commercial banks and heating enterprises without excessive government intervention. However, when R&D costs are high, market forces weaken, and government subsidies and stronger regulation become necessary to support the diffusion of clean heating technology.
(2)
The impact of S 3 on strategy selections of game players
Figure 4 demonstrates the impact of a government subsidy ( S 3 ) on the strategic choices of game players. When S 3 is low, government departments initially increase their subsidy provision, but this tendency decreases as S 3 rises. As the subsidy continues to increase, the willingness of commercial banks to adopt the Support strategy and heating enterprises to choose the R&D strategy diminishes. Particularly at high subsidy levels (e.g., S 3 = 12 ), the strategy choice of commercial banks initially increases before decreasing again. These results suggest that subsidy policy should carefully consider the effect of subsidy intensity on the behavior of game players. A well-calibrated subsidy is crucial to encourage positive actions from both commercial banks and heating enterprises. However, excessively high subsidies may lead to unintended market responses that contradict the policy’s goals.

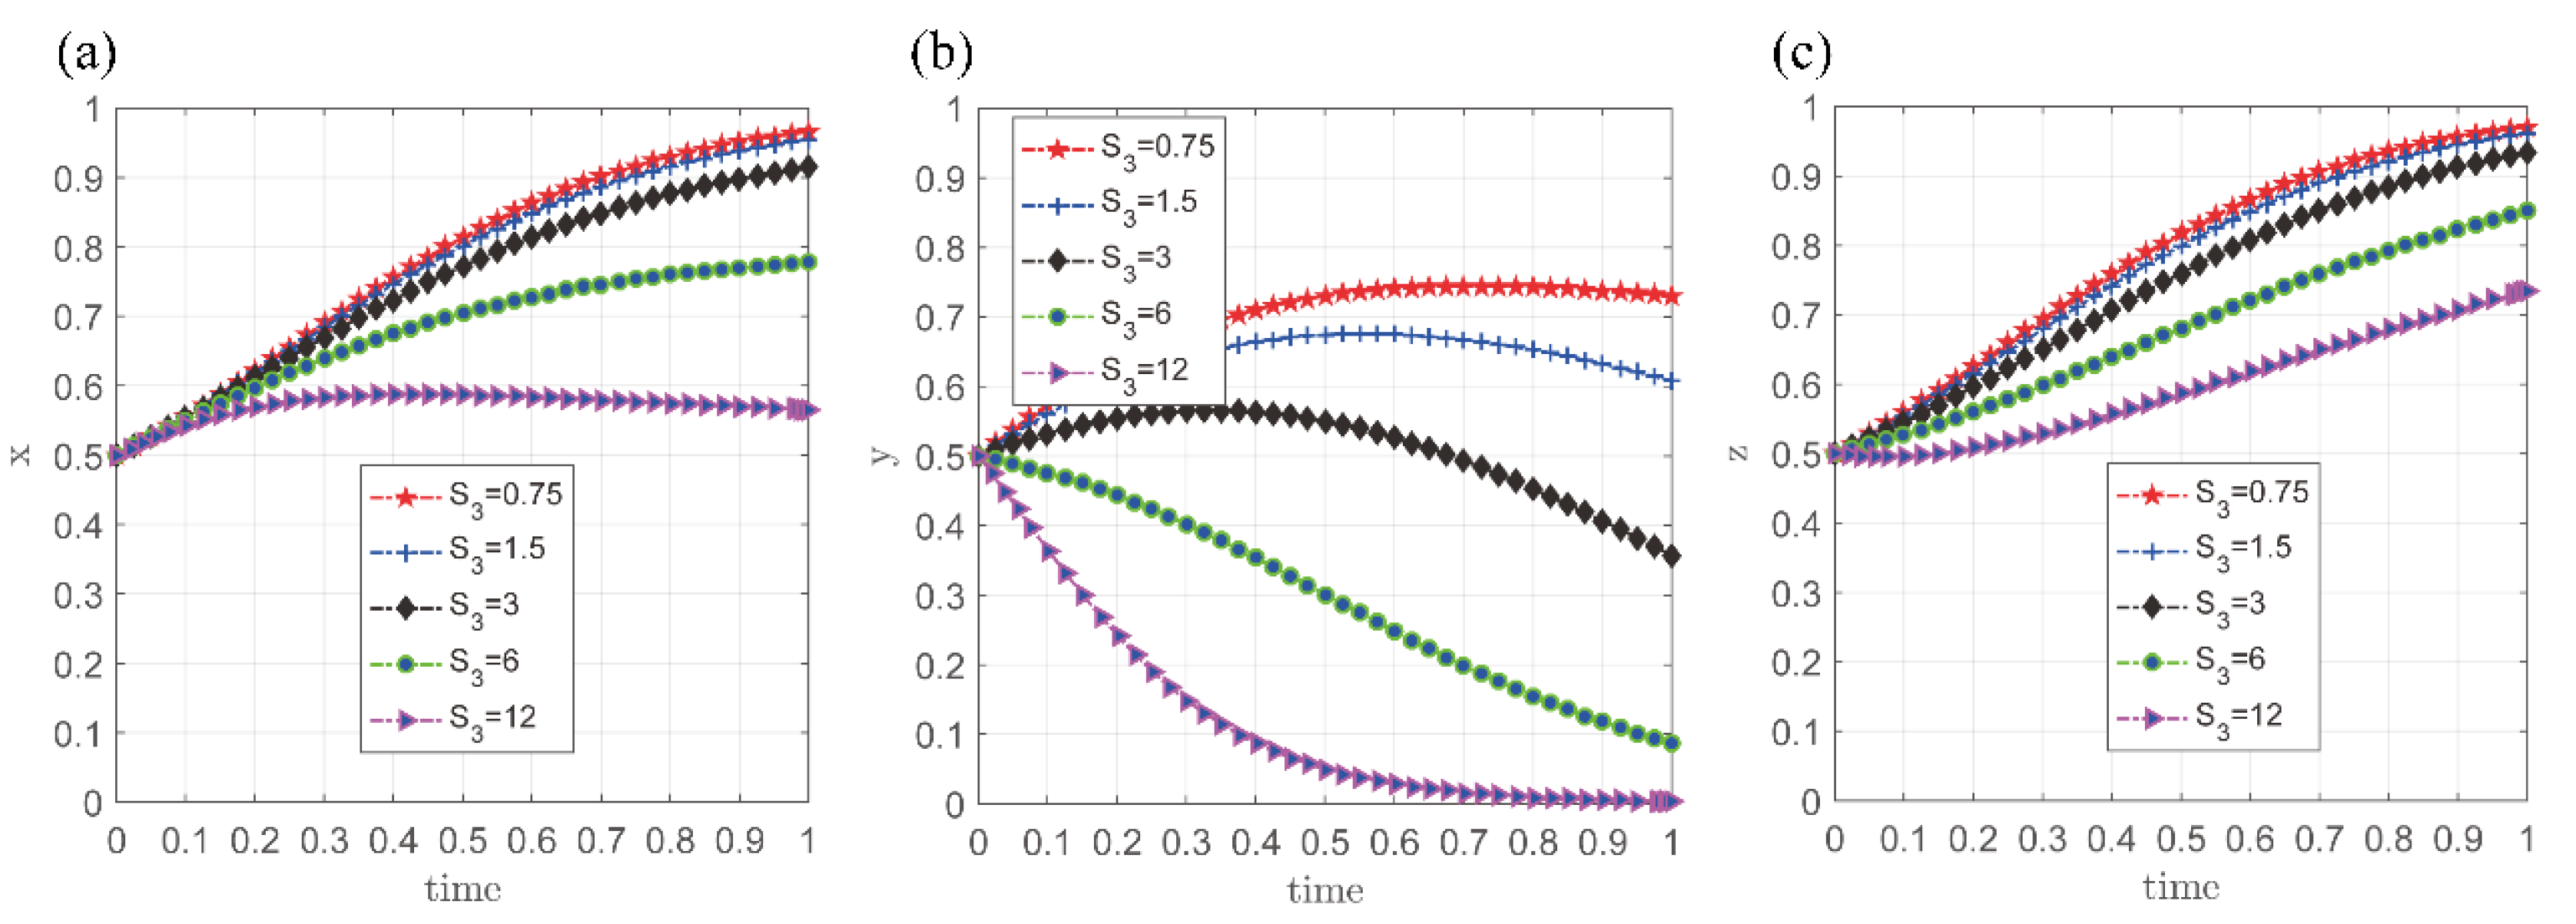
3.3.2. The Impact of Loss- and Return-Related Variables on Strategy Selections

To better understand the effects of loss- and return-related variables on strategy evolution, we created five simulation scenarios for L 1 and R 1 , using values of 0.25×, 0.5×, 1×, 2×, and 4× of the benchmark values. All other variables were held constant at the values from Case C. The simulation results are shown in Figure 5 and Figure 6.
(1)
The impact of L 1 on strategy selections of game players
The simulation results in Figure 5 reveal that credit loss ( L 1 ) has little impact on the strategy choices of commercial banks. This suggests that the strategy evolution of commercial banks remains unchanged regardless of variations in L 1 . In contrast, the strategy choices of government departments follow a dynamic pattern: initially increasing and then decreasing, with the decline becoming more pronounced as L 1 rises. Additionally, the likelihood of heating enterprises adopting the R&D strategy increases significantly as L 1 increases. This indicates that raising the credit penalty for “loan fraud” can effectively encourage heating enterprises to invest in clean heating technology R&D.
(2)
The impact of R 1 on strategy selections of game players
Figure 6 illustrates how game players respond to changes in the returns from clean heating technology R&D ( R 1 ). The strategy choices of commercial banks generally increase, though with a delayed response to rising R 1 . In contrast, the strategic choices of government departments initially increase and then decrease, with the decline becoming steeper as R 1 grows. Heating enterprises are less likely to adopt the R&D strategy when R 1 is low. However, once R 1 exceeds a certain threshold, such as 15, their inclination to adopt the R&D strategy gradually increases, with the adoption rate accelerating as R 1 continues to rise. This suggests that increasing the returns from clean heating technology R&D positively influences heating enterprises’ decision to engage in technology R&D, thereby promoting the diffusion of clean heating technologies on the supply side.

3.3.3. The Impact of Punishment-Related Variables on Strategy Selections

To better understand the effects of punishment-related variables on strategy evolution, we conducted five simulation scenarios for F 1 , F 2 , and F 3 using values of 0.25×, 0.5×, 1×, 2×, and 4× of the benchmark values. All other variables were kept consistent with those in Case C. The simulation results are presented in Figure 7, Figure 8 and Figure 9.
(1)
The impact of F 1 on strategy selections of game players
As shown in Figure 7, the simulation results indicate that as the penalty for “subsidy fraud” ( F 1 ) increases, both commercial banks’ tendency to adopt the Support strategy and heating enterprises’ inclination to pursue R&D gradually strengthen. Meanwhile, government departments’ enthusiasm for adopting the Subsidy strategy initially rises, then declines. Specifically, as F 1 increases from 1.25 to 20, the strategy choices of commercial banks and heating enterprises steadily rise, with the growth rate accelerating. During this process, government departments initially adopt the Support strategy for regulation. However, as F 1 continue to rise, the peak value of the Subsidy strategy also increases. These results suggest that raising the penalty for “subsidy fraud” can encourage heating enterprises to engage in clean heating technology R&D, while simultaneously reducing the financial burden on government departments related to subsidies.
(2)
The impact of F 2 on strategy selections of game players
Figure 8 shows that game players are highly sensitive to changes in the “loan fraud” penalty ( F 2 ). As F 2 increases, the time required for the strategy selections of commercial banks and heating enterprises to reach a steady state significantly decreases, indicating that a higher penalty accelerates strategy evolution. Nonetheless, even with a significantly high “loan fraud” penalty, about 5% of commercial banks still refrain from adopting the Support strategy. In contrast, the evolutionary path of government departments’ strategy choice differs notably. When F 2 is low, government departments are compelled to adopt the Subsidy strategy to regulate heating enterprises’ behavior. However, when F 2 is high, it exerts greater pressure on heating enterprises, reducing their opportunistic behavior and enabling government departments to ease regulatory intensity. These findings suggest that increasing the penalty for “loan fraud” not only speeds up the stabilization of strategic choices for both commercial banks and heating enterprises, but also encourages collaboration between the two parties while allowing the government to relax regulatory constraints.
(3)
The impact of F 3 on strategy selections of game players
Figure 9 illustrates the sensitivity of each game player’s strategy choice to the fine for non-compliance with the green credit policy ( F 3 ). As shown in Figure 9a, when F 3 is low, commercial banks show minimal enthusiasm for the Subsidy strategy and tend to engage in strong opportunistic behavior. However, as F 3 increases, commercial banks become more willing to cooperate, leading to a rapid stabilization in their strategy selection. Figure 9b reveals that the strategy choice of the government departments follows a pattern of initially rising and then falling as F 3 increases. An increase in F 3 accelerates the pace at which government departments adjust their strategies. Figure 9c shows that as F 3 rises, heating enterprises’ willingness to adopt the R&D strategy gradually increases. Overall, these results suggest that increasing penalties for non-compliance with the green credit policy effectively motivates commercial banks to adopt the policy, thereby promoting the diffusion of clean heating technologies on the supply side.

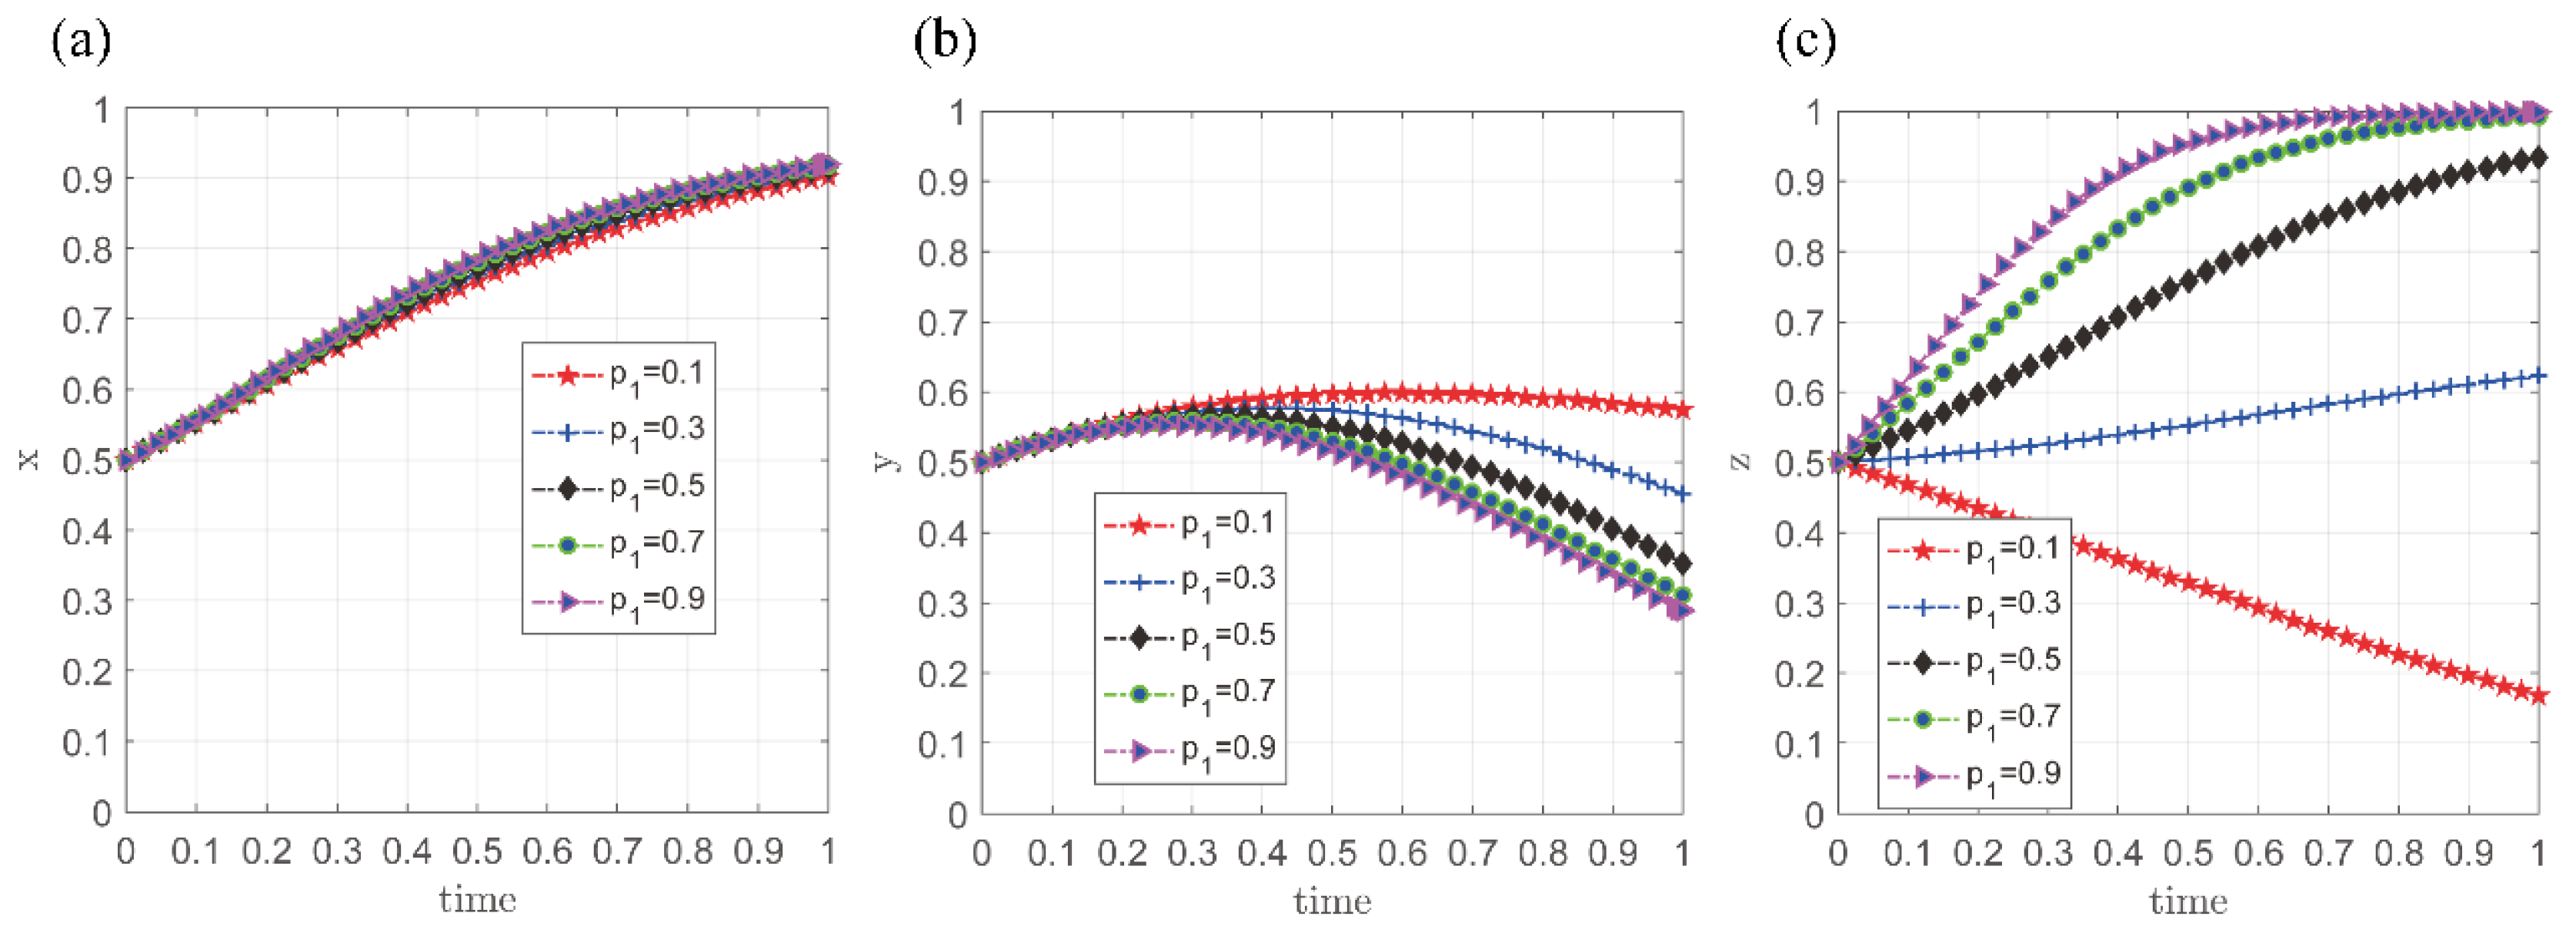
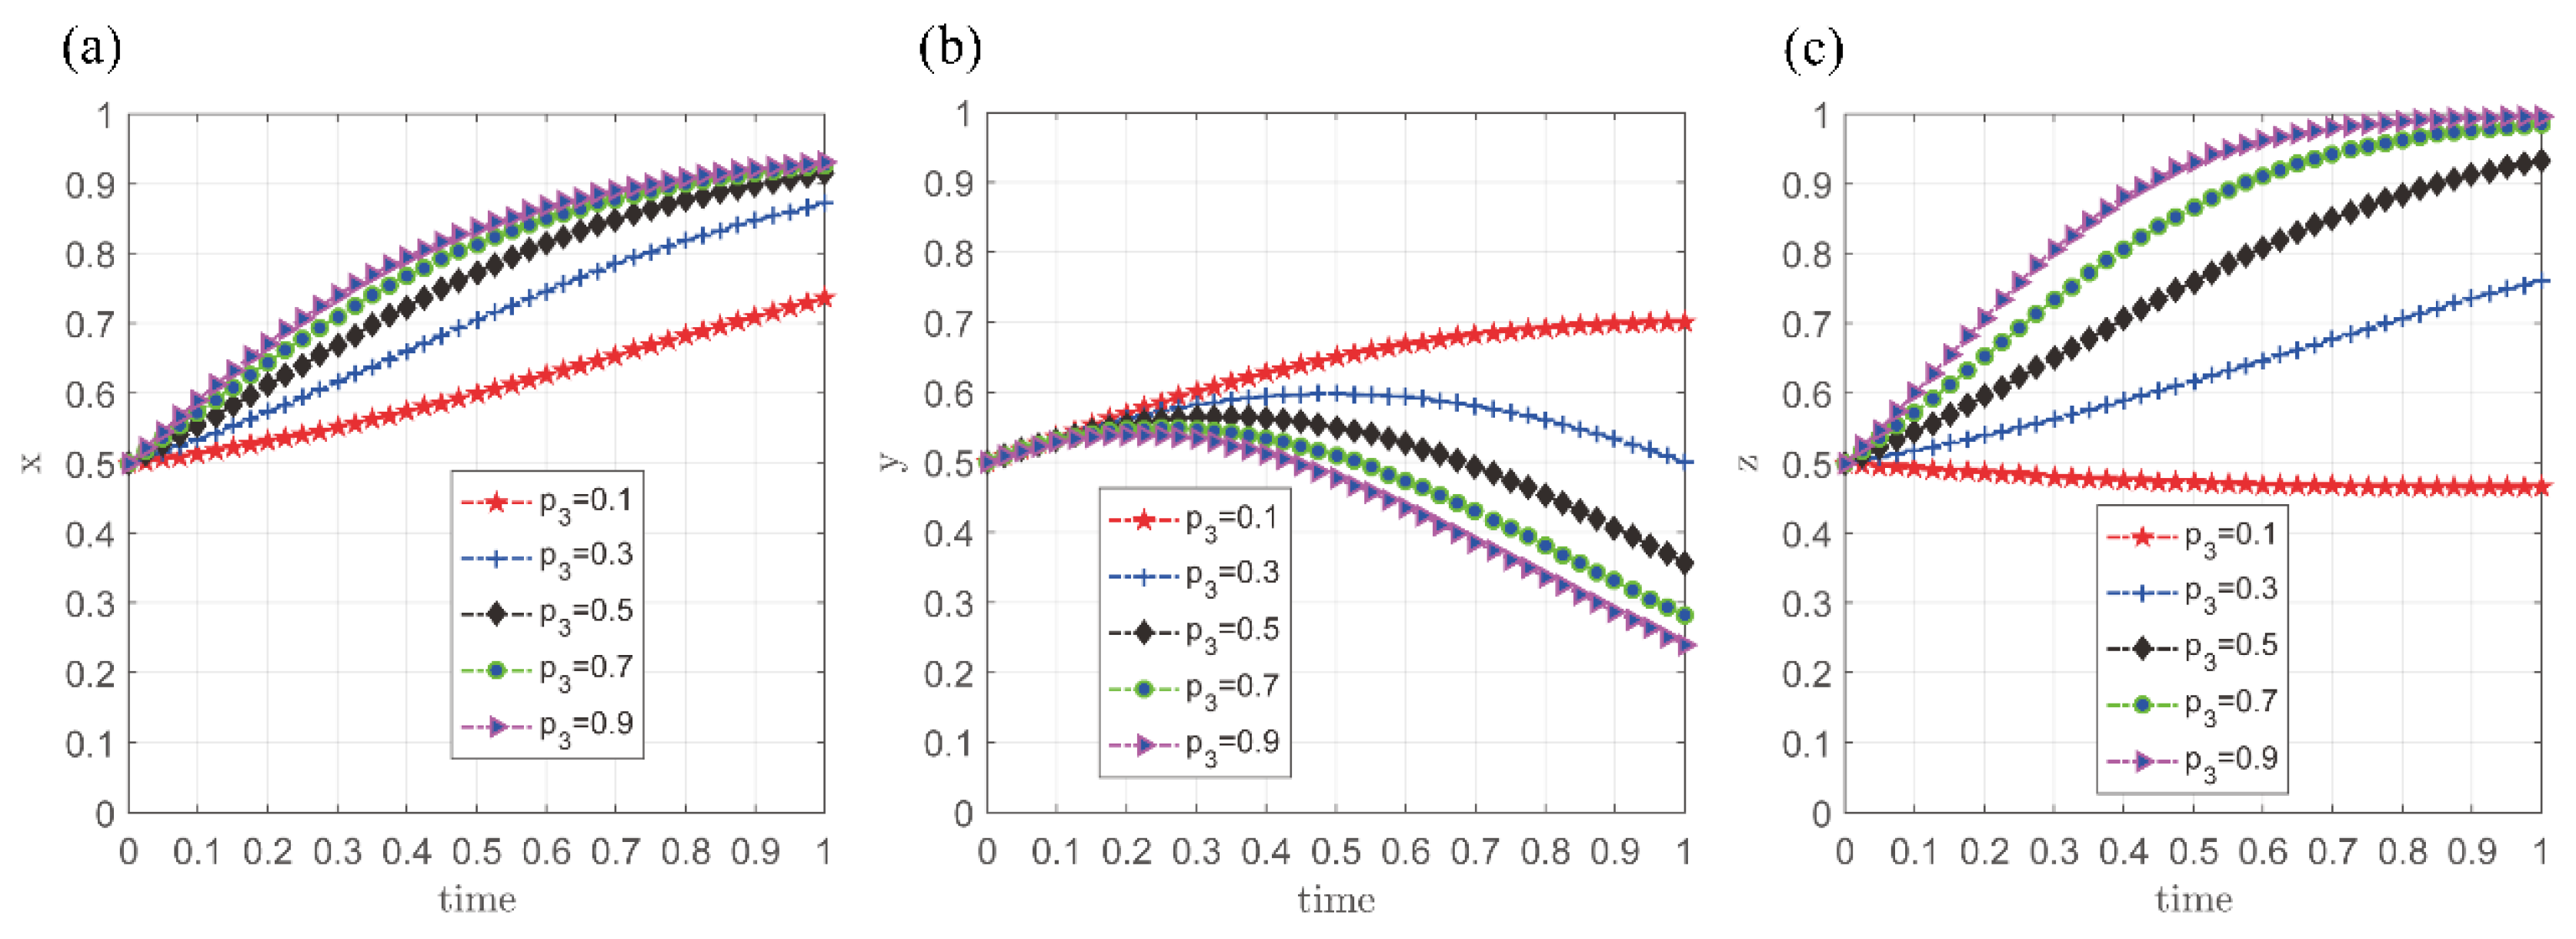
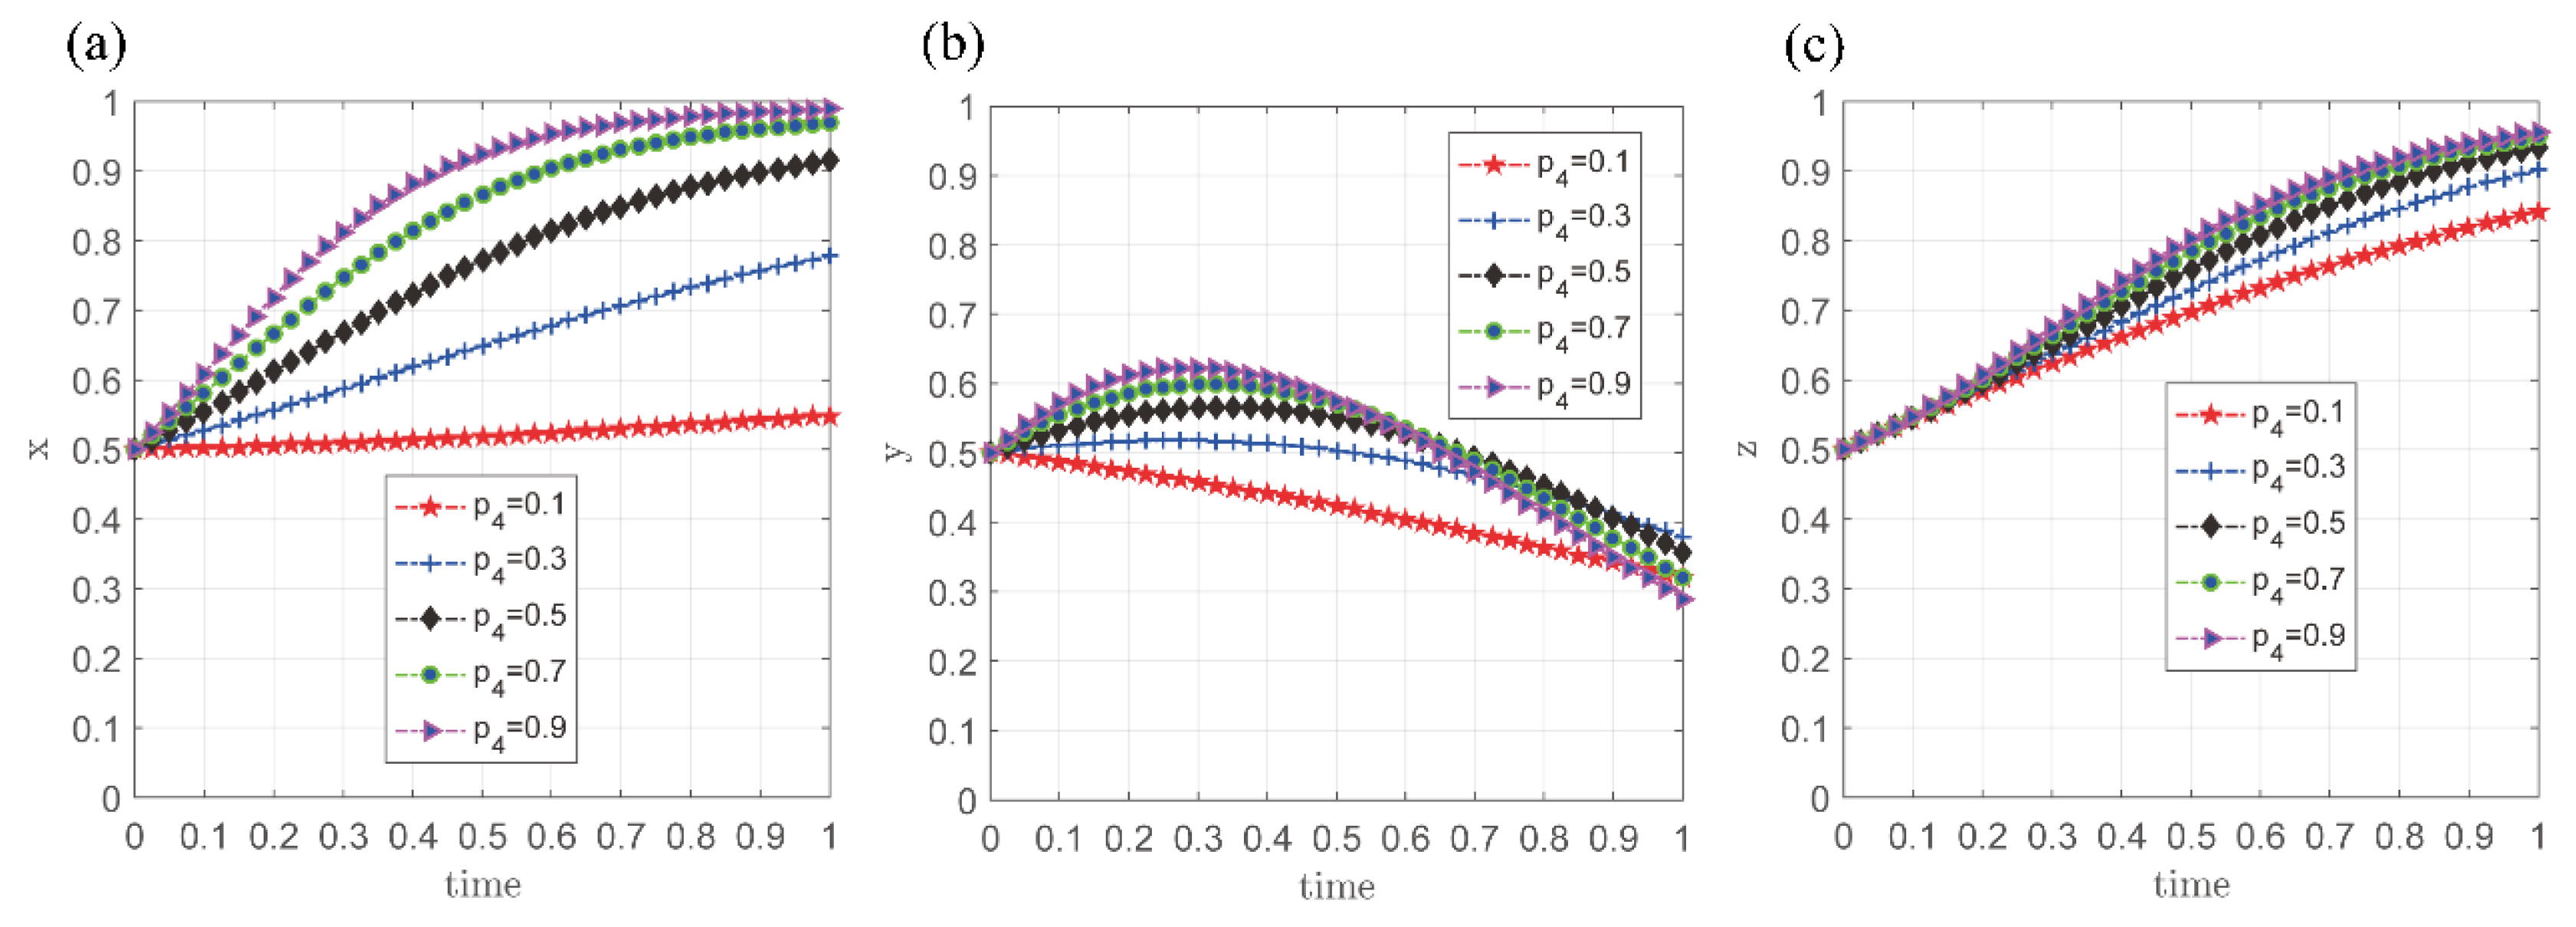
3.3.4. The Impact of Probability-Related Variables on the Strategy Selections

To better understand how probability-related variables influence strategy evolution, we designed five simulation scenarios for each of p 1 , p 2 , p 3 , and p 4 . Each variable was set at 0.1, 0.3, 0.5, 0.7, and 0.9, respectively. All other variables were kept consistent with those in Case C. The simulation results are shown in Figure 10, Figure 11, Figure 12 and Figure 13.
(1)
The impact of p 1 on strategy selections of game players
A comparison between Figure 10 and Figure 6 reveals that the probability of successful R&D for clean heating technology ( p 1 ) affects strategy selection in a manner similar to R 1 . Specifically, commercial banks exhibit a general upward trend in adopting the Support strategy, although their response to p 1 remains relatively modest. Conversely, government departments initially increase their use of the Subsidy strategy, but this trend reverses and declines more rapidly as p 1 rises. For heating enterprises, a low p 1 often leads to the abandonment of the R&D strategy. However, once p 1 exceeds a certain threshold (e.g., 0.3), their willingness to invest in R&D increases steadily, with the rate of adoption accelerating as p 1 continue to rise. These findings highlight the crucial role of increasing the probability of successful R&D to promote the development of clean heating technology.
(2)
The impact of p 2 on strategy selections of game players
Figure 11 shows that commercial banks’ strategy choices are relatively insensitive to changes in the probability of “subsidy fraud” being reported ( p 2 ). In contrast, government departments and heating enterprises are more sensitive to changes in p 2 . As p 2 increases from 0.1 to 0.9, commercial banks’ strategy choices show a slight upward trend. Government departments initially increase their adoption of the Subsidy strategy, followed by a gradual decline. A higher p 2 leads to a greater initial increase in subsidy adoption by government departments. Meanwhile, heating enterprises show a significant rise in enthusiasm for the R&D strategy as p 2 increases. These results suggest that a higher probability of reporting subsidy fraud effectively deters opportunistic behavior and encourages heat enterprises to invest more actively in clean heating technology R&D.
(3)
The impact of p 3 on strategy selections of game players
As shown in Figure 12, a higher probability of “loan fraud” being reported ( p 3 ) significantly boosts the willingness of commercial banks to adopt the Support strategy and heating enterprises to pursue R&D. When p 3 is low, heating enterprises show limited motivation to invest in clean heating technology R&D. However, as p 3 increases, their enthusiasm for R&D rises sharply. Government departments initially increase their adoption of the Subsidy strategy at low levels of p 3 , but this is followed by a decline as p 3 continues to grow. A comparison between Figure 11 and Figure 12 reveals that the commercial banks and heating enterprises are more sensitive to changes in the probability of “loan fraud” being reported than to “subsidy fraud” being reported. Therefore, similarly to increasing the probability of reporting subsidy fraud, raising the probability of “loan fraud” being reported can effectively curb opportunistic behavior among heating enterprises, promoting the diffusion of clean heating technology on the supply side.
(4)
The impact of p 4 on strategy selections of game players
Comparing Figure 13 and Figure 9 reveals that the probability of being reported for non-compliance with the green credit policy ( p 4 ) affects strategy selection similarly to fines for non-compliance. When p 4 is low, the proportion of commercial banks adopting the Support strategy remains largely unchanged. However, as p 4 increases, the transition to the Support strategy accelerates significantly. Government departments initially increase their adoption of the Subsidy strategy, but reduce it later, accelerating their strategic adjustments. Meanwhile, heating enterprises gradually strengthen their commitment to the R&D strategy as p 4 increases. These findings suggest that increasing the likelihood of being reported for non-compliance with green credit policies can incentivize commercial banks to provide financial support for clean heating technology R&D, thereby promoting its diffusion on the supply side.

4. Discussions

4.1. Incentive Effects of Cost Reduction and Return Increase

This study develops a tripartite evolutionary game model to examine how technology costs and returns influence clean heating technology diffusion on the supply side. The findings indicate that lower R&D costs significantly increase the likelihood of cooperation between commercial banks and heating enterprises, while higher costs hinder cooperation. This is because elevated costs not only increase financial risks but also indicate low technological feasibility and a high probability of failure, thereby reducing banks’ willingness to finance high-risk projects. These results highlight R&D costs as a major barrier to clean heating technology diffusion and underscore their critical role in shaping adoption dynamics. This conclusion aligns with previous research [21,53]. Moreover, higher returns from clean heating technology R&D incentivizes heating enterprises to invest in innovation, which is consistent with prior studies [48]. Possible explanations include the large market potential of clean heating technology, strong government policy support, and the generation of competitive advantages and economic benefits. Additionally, clean heating technology R&D not only fosters the long-term sustainable development of heating enterprises but also strengthens their future market competitiveness.

4.2. Penalty Mechanisms for Non-Compliance

This study explores potential non-compliance in clean heating technology diffusion, focusing on the impact of penalties for “subsidy fraud”, “loan fraud”, and violations of the green credit policy on participants’ strategic choices. The findings indicate that increasing penalties effectively deter commercial banks and heating enterprises from engaging in non-compliant behavior. Consistent with previous studies [26], these findings emphasize the need for stronger enforcement mechanisms. Ensuring intrinsic motivation to comply, reinforced by a effective penalty system, is crucial for sustained policy adherence. Strengthening penalties raises the cost of non-compliance, prompting commercial banks and heating enterprises to reconsider their strategies and adopt compliant behaviors. An effective penalty mechanism is essential for coordinating multi-agent interactions, fostering desirable strategies, and accelerating clean heating technology diffusion [31,54]. These results provide strong evidence that a well-designed punishment framework can optimize participant behavior and highlight the importance of both preventive and corrective measures in promoting compliance and technology adoption.

4.3. Informal Regulation for Opportunistic Behaviors

Formal government regulations may not fully deter opportunistic behaviors among participants during the diffusion of clean heating technology. This study employs simulation analysis to examine how increasing the probability of reporting opportunistic behaviors—such as “subsidy fraud” and “loan fraud”—as a form of informal regulation measures influences participants’ strategic choices. The results indicate that strengthening informal regulation, such as increasing the likelihood of reporting “subsidy fraud”, effectively curbs opportunistic behaviors among commercial banks and heating enterprises. Consistent with existing studies [39,52], this research underscores the importance of strengthening informal regulation. In contexts where formal government regulation is limited, societal and public oversight plays a crucial role in deterring opportunistic behaviors. By increasing the risk of detection, informal regulation prompts commercial banks and heating enterprises to revise their actions and adopt compliant strategies. Strengthening informal regulation compensates for the shortcomings of formal regulation, encouraging participants to abandon opportunistic behaviors and adopt constructive strategies [55], thereby promoting clean heating technology R&D. These findings offer valuable insights for policymakers, suggesting that leveraging social oversight can effectively regulate participants’ behaviors and accelerate the diffusion of clean heating technology.

4.4. Optimization and Adjustment of Green Credit Policies

This paper examines how green credit policy factors, such as credit lines, affect the strategic choices of participants in the diffusion of clean heating technology. The results show that commercial banks are more likely to decline green credit loans when credit lines are increased, which in turn reduces heating enterprises’ willingness to invest in technology R&D. This finding is generally consistent with the existing literature [56]. Higher credit lines are perceived as raising funding risks, particularly given the inherent challenges associated with clean heating technology R&D. As a result, commercial banks may raise the credit threshold, leading to the denial of loans for heating enterprises [57]. In contrast, changes in credit interest rates have a relatively minor impact on funding risks. These findings underscore the critical role of credit policy in promoting the diffusion of clean heating technology on the supply side. Specifically, optimizing green credit policies—such as lowing credit thresholds and reducing financing costs—can ease financial constraints for heating enterprises and encourage their investment in clean heating technology R&D.

4.5. Rationalization of Subsidy Schemes

This paper analyzes the impact of subsidy policy on the strategy choices of participants through numerical simulation. The results show that when subsidies are low, government departments must continue offering subsidies to regulate the behavior of other participants. Conversely, when subsidies are high, government departments can quickly reduce or terminate them promptly. Subsidies have a counter-intuitive effect on the strategic choices of commercial banks and heating enterprises. Specifically, low subsidies can encourage both players to adopt proactive strategies. Compared to previous studies, this paper places greater emphasis on optimizing government subsidy schemes. As the clean energy market matures and becomes more competitive, market players become more sensitive to policy changes. This finding aligns with prior research [58], which suggests that higher subsidies are not always beneficial. One explanation is that government subsidies may foster market dependence and trigger a “crowding out effect” [48], where excessive support reduces the willingness of commercial banks and heating enterprises to collaborate. Consequently, policymakers must strike a balance between stimulating innovation and preventing market distortions. A potential solution is to implement dynamic subsidy schemes that support clean heating technology diffusion [31].

5. Conclusions and Policy Implications

5.1. Conclusions

In this study, we develop a tripartite evolutionary game model involving commercial banks, government departments, and heating enterprises to explore the dynamics of clean heating technology diffusion. Through evolutionary game theory analysis and numerical simulations, we draw the following conclusions:
(1) The cost of clean heating technology R&D significantly influences commercial banks’ willingness to collaborate with heating enterprises. When R&D costs are low, commercial banks are more likely to provide green credit support, which encourages greater engagement in technology R&D from heating enterprises. This suggests that reducing R&D costs can effectively accelerate the diffusion of clean heating technology.
(2) Increasing credit penalties for non-compliance and enhancing returns from clean heating technology can motivate heating enterprises to engage in technology R&D. Our findings emphasize that increasing penalties for non-compliance and the return from clean heating R&D can significantly improve the enthusiasm of heating enterprises for technology R&D.
(3) Enhancing economic penalties and strengthening informal regulations can improve cooperation between commercial banks and heating enterprises. Simulation results reveal that increasing penalties and the likelihood of reporting opportunistic behaviors not only fosters collaboration between these entities but also alleviates the financial subsidy burden on government departments, thereby facilitating the diffusion of clean heating technology.
(4) Moderate subsidies can positively influence the strategies adopted by commercial banks and heating enterprises. Our study indicates that such subsidies promote collaboration between these entities. However, excessively high subsidies may increase market dependence, resulting in a “crowding out effect”. Therefore, subsidy policies should balance innovation stimulation with the prevention of market imbalances to effectively promote the diffusion of clean heating technology.

5.2. Policy Implications

Based on the key findings of this study, along with the government strategic plans and the latest policies, regulations, and standard systems related to environmental protection, the following policy recommendations are proposed to promote the diffusion of clean heating technology from the supply side:
Firstly, it is essential to design effective subsidy systems and encourage heating enterprises to reduce R&D costs and enhance economic returns. Policymakers should aim to stimulate technological innovation while avoiding the trap of subsidy dependence. They should gradually cultivate innovative enterprises, promote innovation-driven development, and enhance the overall effectiveness of the national innovation system. Heating enterprises should make full use of government support for R&D innovation, proactively engage with policy guidance, and take responsibility for conducting clean heating technology R&D. Advancing and sustaining clean heating technology is crucial for promoting the green, low-carbon economic transition and supporting ecological civilization strategies. This requires ongoing technology R&D cost reduction and improved economic returns.
Secondly, it is recommended to enhance penalties and reinforce informal regulations for raising the cost of non-compliance and restraining opportunistic behavior. The government should strengthen legislation and supervision, enhance law enforcement by leveraging artificial intelligence and big data, and refine mechanisms for addressing corporate violations. Specifically, policymakers should increase penalties and reinforce informal regulations pertaining to non-compliance, particularly in cases such as those concerning “subsidy fraud” and “loan fraud”. These measures will effectively elevate the financial and economic penalties imposed on non-compliant behaviors, help maintain market order, restrain opportunistic behavior, and support a fair and dynamic competitive market environment.
Thirdly, green credit policies should be optimized to encourage commercial banks to finance R&D in clean heating technology. Government departments should improve policies and standards in order to facilitate green, low-carbon development and foster a favorable environment for these industries to emerge and grow. They should enhance green financial standards and core systems, and encourage commercial banks to prioritize clean energy projects through preferential green credit policies. Lowering credit thresholds and costs would ease the financial burden on heating companies and encourage their investment in clean heating technology R&D.
Finally, it is imperative to establish and enhance a robust credit system to facilitate the transparency and sharing of credit information among market participants. The government should improve the environmental credit evaluation system for enterprise, maintain comprehensive records of law enforcement processes, and strengthen both internal and external supervision to ensure transparency and fairness. Meanwhile, a comprehensive credit evaluation system for all market participants should be implemented to increase openness and facilitate credit information sharing. Additionally, the government should develop a sound social credit system and establish a unified mechanism for credit repair. A strong credit system can reduce transaction costs, improve market efficiency, and provide a solid information base for effective policy-making and implementation, thereby promoting the diffusion of clean heating technology.

5.3. Limitations and Future Research

This study constructs a tripartite evolutionary game model to examine how clean heating technology diffusion can be promoted from the supply side. The proposed model provides a general framework for analyzing similar technology diffusion challenges in other sectors. The findings offer practical insights into advancing clean heating technology diffusion, which is strategically important for sustainable energy development. However, several limitations of this study should be acknowledged. This study primarily focuses on how government policy factors influence the diffusion of clean heating technology, while overlooking other important factors, such as legislation, that may also impact this process. As a result, this study does not address how legislation may contribute to the diffusion of clean energy technology. Future research should incorporate legislative variables into the model to better capture their impact on clean heating technology diffusion. In addition, the Delphi method was used to determine the initial values of several key parameters. However, this method may be subject to expert bias, potentially affecting the reliability of the results. Future research could adopt more rigorous methods or use official data sources to determine initial values more reliably.

Author Contributions

Conceptualization, R.F. and C.Z.; methodology, J.L. and C.Z.; software, J.L.; formal analysis, J.L.; writing—original draft preparation, R.F. and J.L.; writing—review and editing, C.Z.; visualization, C.Z.; project administration, R.F. and C.Z.; funding acquisition, R.F. and C.Z. All authors have read and agreed to the published version of the manuscript.

Funding

This research was funded by the National Social Science Foundation of China (Grant No. 20&ZD068, 20&ZD155), the National Natural Science Foundation of China (Grant No. 72362025), and the Jiangxi Provincial Social Science Foundation (Grant No. 24GL33). The APC was funded by the National Social Science Foundation of China and the National Natural Science Foundation of China.

Institutional Review Board Statement

Data used in this study will be derived from publicly available sources, policy documents, and aggregated datasets, with no risks to participant privacy or welfare. The methodology aligns with [School of Software, Jiangxi Normal University]’s exemption criteria for research that does not engage directly with human subjects or sensitive information.

Informed Consent Statement

Informed consent was obtained from all subjects involved in the study.

Data Availability Statement

Data will be made available on reasonable request.

Acknowledgments

The authors express their gratitude to these funding organizations for their invaluable support. We also thank the editors and reviewers for their constructive comments, which have significantly improved the quality of this article.

Conflicts of Interest

The authors declare no conflicts of interest.

Appendix A. Payoff Analysis and Calculation of Replicator Dynamic Equations

Appendix A.1. Payoff Analysis for Eight Strategy Combinations

Strategy combination (No Support, No Subsidy, No R&D)
In this scenario, commercial banks do not provide green credit to heating enterprises, resulting in a payoff of 0 for the banks. Government departments experience a comprehensive performance loss L 2 due to the failure to promote clean heating technology diffusion. Heating enterprises, lacking necessary financial support, are unable to initiate R&D activities related to clean heating technology, leading to a payoff of 0 for them as well.
Strategy combination (No Support, No Subsidy, R&D)
In this scenario, commercial banks do not provide green credit, resulting in a payoff of 0 for them. Government departments fail to promote clean heating technology diffusion, leading to a comprehensive performance loss and a corresponding payoff of L 2 . Although heating enterprises intend to conduct technology R&D, insufficient funds prevent them from carrying out these activities, resulting in a payoff of 0.
Strategy combination (No Support, Subsidy, No R&D)
In this scenario, commercial banks may face penalties from the government for failing to provide green credit, resulting in a negative payoff of p 4 F 3 . Despite receiving subsidies, government departments are unable to effectively promote clean heating technology diffusion, leading to a payoff of p 2 F 1 + p 4 F 3 L 2 S 3 . Heating enterprises are identified for engaging in “subsidy fraud” by accepting government subsidies without conducting technology R&D. Their payoff is S 3 p 2 F 1 .
Strategy combination (No Support, Subsidy, R&D)
In this scenario, commercial banks may face penalties from the government for failing to provide green credit, resulting in a negative payoff of p 4 F 3 . Government departments experience comprehensive performance losses due to their inability to promote clean heating technology R&D, leading to a corresponding payoff of p 4 F 3 L 2 . Heating enterprises, despite their intention to conduct technology R&D, lack sufficient funding to cover R&D costs, resulting in a payoff of 0.
Strategy combination (Support, No Subsidy, No R&D)
In this scenario, commercial banks provide green credit support. However, heating enterprises may engage in “loan fraud”, resulting in a payoff of p 3 F 2 C 1 for the banks. Simultaneously, the absence of subsidies leads to significant performance losses for government departments, as they are unable to advance clean heating technology diffusion. Consequently, their payoff is L 2 . Heating enterprises, having obtained loans without engaging in technology R&D, are identified as committing “loan fraud”, resulting in a payoff of C 1 p 3 F 2 + L 1 .
Strategy combination (Support, No Subsidy, R&D)
In this scenario, the payoff of commercial banks is influenced by the probability of successful clean heating technology R&D, credit lines, and interest rates. Their payoff depends on these factors and is represented by p 1 C 1 r . Government departments’ payoff is determined by the probability of successful R&D in clean heating technology, leading to a payoff of p 1 E 1 1 p 1 L 2 . The payoff for heating enterprises is the net result of clean heating technology R&D, factoring in both the successful outcomes and the costs incurred in the case of R&D failure. This payoff is represented by p 1 [ R 1 1 + r C 1 ] 1 p 1 C 1 .
Strategy combination (Support, Subsidy, No R&D)
In this scenario, the payoff for commercial banks must consider the impact of “loan fraud” in heating enterprises, denoted as p 3 F 2 C 1 . Similarly, the payoff for government departments must account for the impact of “subsidy fraud” in heating enterprises, represented by p 2 F 1 L 2 S 3 . The payoff for heating enterprises is associated with the risks of opportunistic behaviors when they fail to conduct technology R&D, and is denoted as C 1 + S 3 p 2 F 1 p 3 ( F 2 + L 1 ) .
Strategy combination (Support, subsidy, R&D)
In this scenario, commercial banks can earn returns by providing credit support for technology R&D, and their payoff is denoted as p 1 C 1 r . The payoff for government departments is affected by the probability of successful R&D for clean heating technology, represented by p 1 E 1 1 p 1 L 2 S 3 . The payoff for heating enterprises includes the net benefit from successful R&D, the cost incurred in the event of R&D failure, and the subsidy provided by government departments, expressed as S 3 + p 1 [ R 1 1 + r C 1 ] 1 p 1 C 1 .

Appendix A.2. Calculation of Replicator Dynamic Equations

Replicator dynamic equation for commercial banks
Assuming the expected payoff for commercial banks choosing the Support strategy is U B S , and the expected payoff for choosing the No Support strategy is U B N , with their average expected payoff being U ¯ B , we can derive the following equations based on the payoff matrix:
U B S = y z p 1 C 1 r + y 1 z p 3 F 2 C 1 + 1 y z p 1 C 1 r + ( 1 y ) ( 1 z ) ( p 3 F 2 C 1 )
U B N = y z p 4 F 3 + y 1 z p 4 F 3
U ¯ B = x U B S + 1 x U B N
Therefore, the replicator dynamic equation for commercial banks is as follows:
F x = d x d t = x ( U B S U ¯ B ) = x 1 x [ y p 4 F 3 + z ( p 1 C 1 r + C 1 p 3 F 2 ) + p 3 F 2 C 1 ]
Replicator dynamic equation for government departments
Assuming that the expected payoff for government departments selecting the Subsidy strategy is U G S , the expected payoff for selecting the No Subsidy strategy is U G N , and their average expected payoff is U ¯ G , we can derive the following equations based on the payoff matrix:
U G S = x z [ p 1 E 1 1 p 1 L 2 S 3 ] + x 1 z ( p 2 F 1 L 2 S 3 ) + 1 x z ( p 4 F 3 L 2 ) + ( 1 x ) ( 1 z ) ( p 2 F 1 + p 4 F 3 L 2 S 3 )
U G N = x z p 1 E 1 1 p 1 L 2 + x 1 z L 2 + 1 x z L 2 + ( 1 x ) ( 1 z ) ( L 2 )
U ¯ G = x U G S + 1 x U G N
Therefore, the replicator dynamic equation for government departments is as follows:
F y = d y d t = y ( U G S U ¯ G ) = y 1 y [ x z S 3 x p 4 F 3 + z ( S 3 p 2 F 1 ) + p 2 F 1 + p 4 F 3 S 3 ]
Replicator dynamic equation for heating enterprises
Assuming the expected payoff for heating enterprises adopting the R&D strategy is U E R , the expected payoff for adopting the No R&D strategy is U E N , and their average expected payoff is U ¯ E , we can derive the following equations based on the payoff matrix:
U E R = x y { S 3 + p 1 [ R 1 C 1 1 + r ] 1 p 1 C 1 } + x 1 y { p 1 [ R 1 1 + r C 1 ] 1 p 1 C 1 }
U E N = x y C 1 + S 3 p 2 F 1 p 3 ( F 2 + L 1 ) + x 1 y [ C 1 p 3 F 2 + L 1 ] + 1 x y ( S 3 p 2 F 1 )
U ¯ E = z U E R + 1 z U E N
Therefore, the replicator dynamic equation for heating enterprises is as follows:
F z = d y d t = z ( U E R U ¯ E ) = z 1 z { x y S 3 + x [ p 1 ( R 1 r C 1 ) + p 3 F 2 + L 1 2 C 1 ] y ( S 3 p 2 F 1 ) }

Appendix B. Questionnaire, Expert Profiles, and Scoring in the Delphi Survey

This paper uses the Delphi survey method to obtain the values for the variables in the tripartite evolutionary game model. The questionnaire designed for the Delphi survey is presented in Table A1.
Table A1. The questionnaire used for the Delphi survey.
NumberSurvey ItemsMinimum ValueMost Likely ValueMaximum Value
1Returns from clean heating technology R&D ( V 1 )
2Liquidated damages that heating enterprises need to pay to the commercial banks for “loan fraud” ( V 2 )
3Cost of clean heating technology R&D ( V 3 )
4Government subsidy for heating enterprises ( V 4 )
5Government fine for commercial banks’ non-implementation of green credit policies ( V 5 )
6Credit loss of heating enterprises for “loan fraud” ( V 6 )
7Government fine for heating enterprises’ “subsidy fraud” ( V 7 )
Notes: The table above presents the general framework of the questionnaire developed using the Delphi method in this study. To minimize potential bias from the experts’ knowledge and experience, we applied the Three-Point Estimate technique, commonly used in project management. Each expert was asked to provide the minimum, most likely, and maximum values for each survey item (variable) based on their assessment of the relative magnitude of all survey items (variables). During the survey process, the questionnaire was adjusted as needed to enhance the experts’ understanding of the items. The survey was conducted in three stages, and the weighted average of all experts’ scores was used as the initial value for each variable.
A total of nine experts responded positively to the Delphi survey in this study. Their detailed information is provided in Table A2.
Table A2. The detailed information of experts involved in the Delphi survey.
ExpertAgeEducation BackgroundOrganizationPositionWork ExperienceExpertise
E151Bachelor’s degree Heating enterpriseTechnical Director22Leading research on clean heating technology
E244Master’s degreeHeating enterpriseDepartment manager17Responsible for a clean heating technology project
E343Master’s degreeGovernment departmentDepartment head16Responsible for the promotion of clean heating technology
E442Master’s degreeGovernment departmentResearch fellow15Deeply participated in drafting green credit policies for clean energy projects
E540Doctorate degreeUniversityProfessor13Deeply participated in research project of clean heating technology
E642Doctorate degreeUniversityProfessor16Engaged in policy research on clean heating technology
E746Master’s degreeUniversityProfessor18Responsible for a major R&D project of clean heating technology
E838Doctorate degreeResearch institutionResearch fellow10Deeply participated in research project of clean heating technology
E942Master’s degreeCommercial bankGeneral manager14Responsible for the review of green credit loan applications
After several rounds of questionnaire surveys, the experts’ opinions converged. The average scores provided by the experts are calculated and presented in Appendix B, Table A3.
Table A3. Average scores from experts involved in the Delphi survey.
Survey ItemsScoring of Experts
E1E2E3E4E5E6E7E8E9
V 1 9.51010.6910.11110.210.59.6
V 2 7.297.98.27.48.58.67.68.5
V 3 4.554.55.44.65.35.54.45.3
V 4 2.43.22.632.73.53.32.53.1
V 5 910.510.28.810.610.49.79.510.8
V 6 1.821.72.22.11.821.92.2
V 7 4.85.24.75.55.14.45.25.44.5

References

  1. Wang, Z.; Li, C.; Cui, C.; Liu, H.; Cai, B. Cleaner heating choices in northern rural China: Household factors and the dual substitution policy. J. Environ. Manag. 2019, 249, 109433. [Google Scholar] [CrossRef] [PubMed]
  2. BERC. Building Energy Research Center of Tsinghua University: China Building Energy Use 2020. Available online: https://berc.dest.net.cn/?ky/Article250/ (accessed on 8 August 2024).
  3. Zhao, N.; Zhang, Y.; Li, B.; Hao, J.; Chen, D.; Zhou, Y.; Dong, R. Natural gas and electricity: Two perspective technologies of substituting coal-burning stoves for rural heating and cooking in Hebei Province of China. Energy Sci. Eng. 2019, 7, 120–131. [Google Scholar] [CrossRef]
  4. Mahmoud, M.; Ramadan, M.; Naher, S.; Pullen, K.; Olabi, A.G. The impacts of different heating systems on the environment: A review. Sci. Total Environ. 2021, 766, 142625. [Google Scholar] [CrossRef] [PubMed]
  5. Sadrizadeh, S.; Yao, R.; Yuan, F.; Awbi, H.; Bahnfleth, W.; Bi, Y.; Cao, G.; Croitoru, C.; de Dear, R.; Haghighat, F.; et al. Indoor air quality and health in schools: A critical review for developing the roadmap for the future school environment. J. Build. Eng. 2022, 57, 104908. [Google Scholar] [CrossRef]
  6. Lin, J.; Lin, B. Heat tariff and subsidy in China based on heat cost analysis. Energy Econ. 2018, 71, 411–420. [Google Scholar] [CrossRef]
  7. Streimikiene, D. Renewable energy technologies in households: Challenges and low carbon energy transition justice. Econ. Sociol. 2022, 15, 108–120. [Google Scholar] [CrossRef]
  8. Zhu, Y.; Wu, S.; Li, J.; Jia, Q.; Zhang, T.; Zhang, X.; Han, D.; Tan, Y. Towards a carbon-neutral community: Integrated renewable energy systems (IRES)–sources, storage, optimization, challenges, strategies and opportunities. J. Energy Storage 2024, 83, 110663. [Google Scholar] [CrossRef]
  9. Chen, S.; Bravo-Melgarejo, S.; Mongeau, R.; Malavolti, E. Adopting and diffusing hydrogen technology in air transport: An evolutionary game theory approach. Energy Econ. 2023, 125, 106864. [Google Scholar] [CrossRef]
  10. Sinsel, S.R.; Riemke, R.L.; Hoffmann, V.H. Challenges and solution technologies for the integration of variable renewable energy sources—A review. Renew. Energy 2020, 145, 2271–2285. [Google Scholar] [CrossRef]
  11. Huang, X.; Lin, Y.; Lim, M.K.; Zhou, F.; Liu, F. Electric vehicle charging station diffusion: An agent-based evolutionary game model in complex networks. Energy 2022, 257, 124700. [Google Scholar] [CrossRef]
  12. Liu, P.; Li, X.; Li, J. Competitive firms’ low-carbon technology diffusion under pollution regulations: A network-based evolutionary analysis. Energy 2023, 282, 128836. [Google Scholar] [CrossRef]
  13. Yang, Y.; Liu, H.; Liu, L. An evolutionary game for analysis of implementation strategies in inter-regional diffusion of clean technology. Socio-Econ. Plan. Sci. 2024, 95, 102009. [Google Scholar] [CrossRef]
  14. Zheng, Y.; Bai, C.; Wang, L.; Han, C.; Yang, M.; Pappu, A. Evolutionary game analysis on the diffusion of general purpose technologies with government multiple supports. Econ. Innov. New Technol. 2024, 33, 436–454. [Google Scholar] [CrossRef]
  15. Li, F.; Cao, X.; Sheng, P. Impact of pollution-related punitive measures on the adoption of cleaner production technology: Simulation based on an evolutionary game model. J. Clean Prod. 2022, 339, 130703. [Google Scholar] [CrossRef]
  16. Li, J.; Song, L.; Zhu, Y. Subsidies, clean heating choices, and policy costs: Evidence from rural households in northern China. Sustainability 2021, 13, 169. [Google Scholar] [CrossRef]
  17. Shi, Y.; Wei, Z.; Shahbaz, M.; Zeng, Y. Exploring the dynamics of low-carbon technology diffusion among enterprises: An evolutionary game model on a two-level heterogeneous social network. Energy Econ. 2021, 101, 105399. [Google Scholar] [CrossRef]
  18. Zhao, L.; Sun, M. How can credit supervision mechanism improve security crowdsourcing ecosystem governance: An evolutionary game theory perspective. IEEE Access 2024, 12, 21647–21661. [Google Scholar] [CrossRef]
  19. Ning, J.; Li, X.; Gao, Y. Dynamic analysis and influence mechanism of digital technology diffusion in the energy industry based on the evolutionary game model of complex networks. Energy Environ. 2023, 0958305X231217653. [Google Scholar] [CrossRef]
  20. Zhang, M.; Huang, Y.; Jin, Y.; Bao, Y. Government regulation strategy, leading firms’ innovation strategy, and following firms imitation strategy: An analysis based on evolutionary game theory. PLoS ONE 2023, 18, e0286730. [Google Scholar] [CrossRef]
  21. Wang, Q.; Tan, Z.; De, G.; Tan, Q.; Pu, L. An evolutionary game study of clean heating promotion mechanisms under the policy regulation in China. Sustainability 2019, 11, 3778. [Google Scholar] [CrossRef]
  22. Fang, Y.; Chen, L.; Mei, S.; Wei, W.; Huang, S.; Liu, F. Coal or electricity? An evolutionary game approach to investigate fuel choices of urban heat supply systems. Energy 2019, 181, 107–122. [Google Scholar] [CrossRef]
  23. Liu, W.; Li, Y.; Zhu, W. Evolutionary game analysis of clean heating governance in rural areas of Northern China. Front. Environ. Sci. 2022, 10, 988353. [Google Scholar] [CrossRef]
  24. Dos Santos, L.L.C.; Canha, L.N.; Bernardon, D.P. Projection of the diffusion of photovoltaic systems in residential low voltage consumers. Renew. Energy 2018, 116, 384–401. [Google Scholar] [CrossRef]
  25. Wang, Z.; Feng, Y.; Yao, N.; Lin, O.; Li, Q.; Liu, B. Impact of policy interventions on low-carbon technology innovation diffusion in supply networks. Manag. Decis. Econ. 2024, 45, 5040–5053. [Google Scholar] [CrossRef]
  26. Zou, C.; Huang, Y.; Hu, S.; Huang, Z. Government participation in low-carbon technology transfer: An evolutionary game study. Technol. Forecast. Soc. Change 2023, 188, 122320. [Google Scholar] [CrossRef]
  27. Maynard Smith, J. The theory of games and the evolution of animal conflicts. J. Theor. Biol. 1974, 47, 209–221. [Google Scholar] [CrossRef]
  28. Zhu, C.; Fan, R.; Luo, M.; Zhang, Y.; Qin, M. Simulating policy interventions for different quota targets of renewable portfolio standard: A combination of evolutionary game and system dynamics approach. Sustain. Prod. Consump. 2022, 30, 1053–1069. [Google Scholar] [CrossRef]
  29. Han, J.; Tan, Q.; Ji, Q.; Li, Y.; Liu, Y.; Wang, Y. Simulating the CCUS technology diffusion in thermal power plants: An agent-based evolutionary game model in complex networks. J. Clean. Prod. 2023, 421, 138515. [Google Scholar] [CrossRef]
  30. Xu, L.; Huang, D.; He, Z.; Cao, J. Evolutionary game analysis of the innovation and diffusion of water-saving technology. Water Econ. Policy 2023, 9, 2340009. [Google Scholar] [CrossRef]
  31. Wang, H.; Gao, L.; Jia, Y. The predicament of clean energy technology promotion in China in the carbon neutrality context: Lessons from China’s environmental regulation policies from the perspective of the evolutionary game theory. Energy Rep. 2022, 8, 4706–4723. [Google Scholar]
  32. Song, X.; Shen, M.; Lu, Y.; Shen, L.; Zhang, H. How to effectively guide carbon reduction behavior of building owners under emission trading scheme? An evolutionary game-based study. Environ. Impact Assess. Rev. 2021, 90, 106624. [Google Scholar] [CrossRef]
  33. Xia, X.; Zeng, X.; Wang, W.; Liu, C.; Li, X. Carbon constraints and carbon emission reduction: An evolutionary game model within the energy-intensive sector. Expert Syst. Appl. 2024, 244, 122916. [Google Scholar] [CrossRef]
  34. Liao, D.; Tan, B. An evolutionary game analysis of new energy vehicles promotion considering carbon tax in post-subsidy era. Energy 2023, 264, 126156. [Google Scholar] [CrossRef]
  35. Wang, Y.; Fan, R.; Lin, J.; Chen, F.; Qian, R. The effective subsidy policies for new energy vehicles considering both supply and demand sides and their influence mechanisms: An analytical perspective from the network-based evolutionary game. J. Environ. Manag. 2023, 325, 116483. [Google Scholar] [CrossRef] [PubMed]
  36. Li, X.; Chen, L.; Sun, F.; Hao, Y.; Du, X.; Mei, S. Share or not share, the analysis of energy storage interaction of multiple renewable energy stations based on the evolution game. Renew. Energy 2023, 208, 679–692. [Google Scholar] [CrossRef]
  37. Zhang, T.; Cao, S.; Pan, L.; Zhou, C. A policy effect analysis of China’s energy storage development based on a multi-agent evolutionary game model. Energies 2020, 13, 6293. [Google Scholar] [CrossRef]
  38. Hu, F.; Zhou, D.; Zhu, Q.; Wang, Q. How dynamic renewable portfolio standards affect trading behavior of power generators? Considering green certificate and reward/penalty mechanism. Appl. Energy 2024, 375, 124114. [Google Scholar] [CrossRef]
  39. Zhu, C.; Fan, R.; Lin, J.; Chen, R.; Luo, M. How to promote municipal household waste management by waste classification and recycling? A stochastic tripartite evolutionary game analysis. J. Environ. Manag. 2023, 344, 118503. [Google Scholar] [CrossRef]
  40. Chen, L.; Zhang, M.; Zhao, S. Game analysis of the multiagent evolution of existing building green retrofitting from the perspective of green credit. Discrete Dyn. Nat. Soc. 2021, 2021, 5560671. [Google Scholar] [CrossRef]
  41. Fan, R.; Wang, Y.; Chen, F.; Du, K.; Wang, Y. How do government policies affect the diffusion of green innovation among peer enterprises? An evolutionary-game model in complex networks. J. Clean. Prod. 2022, 364, 132711. [Google Scholar] [CrossRef]
  42. Chen, L.; Bai, X.; Chen, B.; Wang, J. Incentives for green and low-carbon technological innovation of enterprises under environmental regulation: From the perspective of evolutionary game. Front. Energy Res. 2022, 9, 793667. [Google Scholar] [CrossRef]
  43. Wang, X.; Cho, S.; Scheller-Wolf, A. Green technology development and adoption: Competition, regulation, and uncertainty—A global game approach. Manag. Sci. 2021, 67, 201–219. [Google Scholar] [CrossRef]
  44. Lashgari, Z.; Bahiraie, A.; Eshaghi Gordji, M. A new credit and loan lending strategy and credit in banking systems: An evolutionary game theory approach. J. Appl. Math. 2022, 2022, 3400319. [Google Scholar] [CrossRef]
  45. Zuo, W.; Li, Y.; Wang, Y. Research on the optimization of new energy vehicle industry research and development subsidy about generic technology based on the three-way decisions. J. Clean. Prod. 2019, 212, 46–55. [Google Scholar] [CrossRef]
  46. Zhang, L.; Long, R.; Huang, Z.; Li, W.; Wei, J. Evolutionary game analysis on the implementation of subsidy policy for sustainable transportation development. J. Clean. Prod. 2020, 267, 122159. [Google Scholar] [CrossRef]
  47. Sun, R.; He, D.; Su, H. Evolutionary game analysis of blockchain technology preventing supply chain financial risks. J. Theor. Appl. Electron. Commer. Res. 2021, 16, 2824–2842. [Google Scholar] [CrossRef]
  48. Gao, Y.; Ning, J.; Zhang, M. An evolutionary game dynamic analysis of enterprise technological innovation implementation strategy: From the perspective of green bonds. IEEE Trans. Eng. Manag. 2024, 71, 11551–11564. [Google Scholar] [CrossRef]
  49. Binmore, K.; Samuelson, L. Evolution and mixed strategies. Games Econ. Behav. 2001, 34, 200–226. [Google Scholar] [CrossRef]
  50. Dou, Y.; Sun, X.; Ji, A.; Wang, Y.; Xue, X. Development strategy for prefabricated construction projects: A tripartite evolutionary game based on prospect theory. Eng. Constr. Archit. Manag. 2023, 30, 105–124. [Google Scholar] [CrossRef]
  51. Zhao, R.; Peng, L.; Zhao, Y.; Feng, Y. Coevolution mechanisms of stakeholder strategies in the green building technologies innovation ecosystem: An evolutionary game theory perspective. Environ. Impact Assess. Rev. 2024, 105, 107418. [Google Scholar] [CrossRef]
  52. Zhao, H.; Liu, X.; Wang, Y. Evolutionary game analysis of opportunistic behavior of Sponge City PPP projects: A perceived value perspective. Sci. Rep. 2022, 12, 8798. [Google Scholar] [CrossRef] [PubMed]
  53. Jia, C.; Zhang, R.; Wang, D. Evolutionary game analysis of low-carbon technology innovation diffusion under PPP mode in China. PLoS ONE 2022, 17, e0279493. [Google Scholar] [CrossRef] [PubMed]
  54. Li, M.; Gao, X. Implementation of enterprises’ green technology innovation under market-based environmental regulation: An evolutionary game approach. J. Environ. Manag. 2022, 308, 114570. [Google Scholar] [CrossRef] [PubMed]
  55. Hu, Q.; Chan, S.F.; Zhang, G.; Yang, Z. The joint-liability mechanism: Controlling opportunism through peer monitoring among Chinese supplier groups. J. Bus. Ind. Mark. 2016, 31, 640–653. [Google Scholar] [CrossRef]
  56. Zhou, K.; Wang, Q.; Tang, J. Evolutionary game and simulation analysis of enterprise’s green technology innovation under green credit policy: Evidence from China. Technol. Anal. Strateg. Manag. 2024, 36, 1551–1570. [Google Scholar] [CrossRef]
  57. Wang, J.; Liu, X. Research on the development strategy selection of the new energy vehicle industry from the perspective of green credit—Based on the foursquare evolutionary game analysis. PLoS ONE 2024, 19, e0297813. [Google Scholar]
  58. Li, J.; Ren, H.; Zhang, C.; Li, Q.; Duan, K. Substantive Innovation or Strategic Innovation? Research on Multiplayer Stochastic Evolutionary Game Model and Simulation. Complexity 2020, 2020, 9640412. [Google Scholar] [CrossRef]
Figure 1. The tripartite game tree of clean heating technology diffusion.
Sustainability 17 03413 g001
Figure 2. Simulation results of the ESS under the condition of the (a) benchmark, (b) Case A, (c) Case B, (d) Case C, and (e) Case D.
Sustainability 17 03413 g002
Figure 3. Impact of the cost of clean heating technology R&D ( C 1 ) on the strategy evolution of (a) commercial banks, (b) government departments, and (c) heating enterprises.
Sustainability 17 03413 g003
Figure 4. Impact of the subsidy from government departments ( S 3 ) on the strategy evolution of (a) commercial banks, (b) government departments, and (c) heating enterprises.
Sustainability 17 03413 g004
Figure 5. Impact of credit loss due to “loan fraud” being reported ( L 1 ) on the strategy evolution of (a) commercial banks, (b) government departments, and (c) heating enterprises.
Sustainability 17 03413 g005
Figure 6. Impact of returns from clean heating technology R&D ( R 1 ) on the strategy evolution of (a) commercial banks, (b) government departments, and (c) heating enterprises.
Sustainability 17 03413 g006
Figure 7. Impact of fines for “subsidy fraud” ( F 1 ) on the strategy evolution of (a) commercial banks, (b) government departments, and (c) heating enterprises.
Sustainability 17 03413 g007
Figure 8. Impact of liquidated damages for “loan fraud” ( F 2 ) on the strategy evolution of (a) commercial banks, (b) government departments, and (c) heating enterprises.
Sustainability 17 03413 g008
Figure 9. Impact of fines for non-compliance with the green credit policy ( F 3 ) on the strategy evolution of (a) commercial banks, (b) government departments, and (c) heating enterprises.
Sustainability 17 03413 g009
Figure 10. Impact of the probability of successful R&D of clean heating technology ( p 1 ) on the strategy evolution of (a) commercial banks, (b) government departments, and (c) heating enterprises.
Sustainability 17 03413 g010
Figure 11. Impact of the probability of “subsidy fraud” being reported ( p 2 ) on the strategy evolution of (a) commercial banks, (b) government departments, and (c) heating enterprises.
Sustainability 17 03413 g011
Figure 12. Impact of the probability of “loan fraud” being reported ( p 3 ) on the strategy evolution of (a) commercial banks, (b) government departments, and (c) heating enterprises.
Sustainability 17 03413 g012
Figure 13. Impact of the probability of non-compliance with the green credit policy being reported ( p 4 ) on the strategy evolution of (a) commercial banks, (b) government departments, and (c) heating enterprises.
Sustainability 17 03413 g013
Table 1. Main variables and their initial values.
Variables Definition Initial Value
C 1 Cost of clean heating technology R&D5
S 3 Government subsidy for heating enterprises3
r Interest rate of green credit 0.05
p 1 Probability of successful R&D for clean heating technology0.5
R 1 Returns from clean heating technology R&D 10
p 2 Probability of heating enterprises being reported for “subsidy fraud”0.5
F 1 Government fine for heating enterprises’ “subsidy fraud” 5
p 3 Probability of heating enterprises being reported for “loan fraud”0.5
F 2 Liquidated damages that heating enterprises need to pay to the commercial banks for “loan fraud”8
L 1 Credit loss of heating enterprises for “loan fraud” 2
p 4 Probability of commercial banks being reported for non-compliance with green credit policies0.5
F 3 The fine for non-compliance with the green credit policy10
Table 2. The payoff matrix of the tripartite game model proposed in this paper.
Commercial
Banks
Government DepartmentsHeat Supply Enterprises
R&DNo R&D
SupportSubsidy p 1 C 1 r , p 3 F 2 C 1 ,
p 1 E 1 1 p 1 L 2 S 3 , p 2 F 1 L 2 S 3 ,
S 3 + p 1 [ R 1 1 + r C 1 ] 1 p 1 C 1 C 1 + S 3 p 2 F 1 p 3 ( F 2 + L 1 )
No Subsidy p 1 C 1 r , p 3 F 2 C 1 ,
p 1 E 1 1 p 1 L 2 , L 2 ,
p 1 [ R 1 1 + r C 1 ] 1 p 1 C 1 C 1 p 3 F 2 + L 1
No SupportSubsidy p 4 F 3 , p 4 F 3 ,
p 4 F 3 L 2 , p 2 F 1 + p 4 F 3 L 2 S 3 ,
0 S 3 p 2 F 1
No Subsidy 0 ,0,
L 2 , L 2 ,
00
Table 3. Eigenvalues of the Jacobian matrix corresponding to the eight equilibrium points.
PointsEigenvalues ( λ 1 , λ 2 , λ 3 )Stability
E 1 0 ,   0 ,   0 p 3 F 2 C 1 ,   p 2 F 1 + p 4 F 3 S 3 ,   0 Unstable
E 2 0 ,   0 ,   1 p 1 C 1 r ,   p 4 F 3 ,0Unstable
E 3 0 ,   1 ,   0 p 4 F 3 + p 3 F 2 C 1 ,   S 3 p 2 F 1 p 4 F 3 ,   p 2 F 1 S 3 Case A
E 4 0 ,   1 ,   1 p 4 F 3 + p 1 C 1 r ,   p 4 F 3 ,   S 3 p 2 F 1 Unstable
E 5 1 ,   0 ,   0 C 1 p 3 F 2 ,   p 2 F 1 S 3 ,   p 1 ( R 1 r C 1 ) + p 3 F 2 + L 1 2 C 1 Case B
E 6 1 ,   0 ,   1 p 1 C 1 r , S 3 ,   2 C 1 p 1 ( R 1 r C 1 ) p 3 F 2 + L 1 Case C
E 7 1 ,   1 ,   0 C 1 p 4 F 3 p 3 F 2 ,   S 3 p 2 F 1 ,   p 1 ( R 1 r C 1 ) + p 3 F 2 + L 1 + p 2 F 1 2 C 1 Case D
E 8 1 ,   1 ,   1 p 4 F 3 p 1 C 1 r ,   S 3 ,   2 C 1 p 1 ( R 1 r C 1 ) p 3 F 2 + L 1 p 2 F 1 Unstable
Disclaimer/Publisher’s Note: The statements, opinions and data contained in all publications are solely those of the individual author(s) and contributor(s) and not of MDPI and/or the editor(s). MDPI and/or the editor(s) disclaim responsibility for any injury to people or property resulting from any ideas, methods, instructions or products referred to in the content.

