Article

Sustainable Transformation: The Impact of Climate Risk Perception on Corporate Operational Resilience in China

1
School of Economics and Management, Tsinghua University, Beijing 100084, China
2
International Institute of Green Finance, Central University of Finance and Economics, Beijing 100081, China
*
Author to whom correspondence should be addressed.
Sustainability 2025, 17(8), 3387; https://doi.org/10.3390/su17083387
Submission received: 26 February 2025 / Revised: 3 April 2025 / Accepted: 8 April 2025 / Published: 10 April 2025

Abstract

:
Enhancing corporate operational resilience is a core element in responding to escalating climate change risks and achieving sustainable development. Based on dynamic capabilities theory, this paper utilizes data from A-shared listed companies between 2012 and 2023 to explore how climate risk perception influences corporate operational resilience in China and identify the specific mechanisms underlying this relationship. The study found a significant positive relationship between climate risk perception and corporate operational resilience. A mechanism analysis indicated that increased climate risk perception enhanced corporate operational resilience by alleviating financing constraints, promoting technological innovation, and improving internal control quality. A heterogeneity analysis revealed that the effect of climate risk perception on corporate operational resilience was more pronounced in companies located in the central and western regions of China and in high-pollution industries. The findings of this study offer new perspectives and empirical evidence for understanding the micro-dynamics of sustainable transformation.

1. Introduction

Climate change has become a significant challenge for the global economy and society [1]. The increasing frequency of extreme weather events and the accelerated adjustment of climate policies are profoundly reshaping the external environment in which businesses operate [2]. According to the Intergovernmental Panel on Climate Change (IPCC)’s Sixth Assessment Report, physical climate risks, such as extreme weather events, and transition risks, including shifts in carbon policies, are interconnected and severely impact the stability of supply chains, asset valuations, and business models [3]. As the world’s second-largest economy and a major contributor to global carbon emissions, China is at a critical stage of green transformation. Since the introduction of the “dual carbon” goals in 2020—a carbon peak by 2030 and carbon neutrality by 2060—climate risk management has become a central focus in corporate strategic decision making [4]. In this context, the ability of businesses to effectively identify climate risk signals and establish dynamic resilience systems has become crucial for achieving sustainable transformation.
Operational resilience is defined as a company’s capacity to absorb and recover from external shocks [5]. It enables enterprises to recover rapidly from crises and environmental shifts, minimizing losses, optimizing resources, enhancing market competitiveness, and supporting sustainable development [6]. Traditionally, studies have identified resource matching [5] and supply chain learning [7] as crucial to resilience, highlighting the importance of internal resource management. However, operational resilience, as a dynamic capability, requires not only resource redundancy but also strategic restructuring in response to external disruptions such as climate risks [8]. Climate risks specifically compel businesses to accelerate digital transformation, optimize production processes, adjust supplier networks, and establish disaster recovery mechanisms [9,10]. The innovative practices of Chinese companies offer valuable theoretical insights in this area. For example, China Resources Sanjiu Pharmaceutical Co., Ltd. has integrated climate risk management into its organizational framework through green supply chain certification and the development of low-carbon factories, achieving a strategic alignment between its operational systems and carbon neutrality goals [11]. This practice supports Essuman et al.’s “resource orchestration” theory, suggesting that businesses transform climate pressures into innovation more effectively when internal carbon management aligns with external policy demands [6].
Understanding the role of climate risk perception at the corporate level is crucial yet remains understudied, especially in developing countries like China. Recent advancements emphasize the significance of micro-level mechanisms for effective climate risk adaptation, arguing that macro-level assessments, such as those provided by the IPCC, inadequately capture firm-level heterogeneity [12]. The depth of strategic cognition significantly influences corporate responsiveness [13]. For example, companies like Tencent Holdings Limited integrate dual carbon goals into budget assessment systems, overcoming the “cost constraint illusion” and developing latent capabilities such as carbon data platforms. Kolk and Pinkse’s “cognition–strategy” framework specifically illustrates how entrepreneurs’ interpretations of external pressures can foster a climate adaptation model distinctive to China [14]. Busch and Hoffmann further highlighted how European firms leverage proactive disclosures to integrate climate risk perceptions into strategic decision making, emphasizing transparency to mitigate stakeholder uncertainty [15]. Slawinski and Bansal showed that U.S. firms employ strategic ambiguity to flexibly allocate resources amidst uncertain climate policies [16]. These comparative studies underscore the necessity of examining how Chinese enterprises might exhibit distinctive adaptation strategies under varying institutional contexts.
While the existing literature has made significant strides in assessing the economic impacts of climate risks, significant limitations persist within the theoretical framework. First, the existing literature predominantly employs macro-level indicators, overlooking systematic analyses of corporate cognitive agency, particularly the link between climate risk perception and strategic decision making [17,18,19]. Second, mainstream research prioritizes the explicit financial costs of climate shocks, neglecting latent dimensions of operational resilience such as resistance, recovery, and adaptability [20,21,22,23]. Finally, mechanisms of corporate climate adaptation within developing countries’ institutional contexts remain insufficiently explored. Addressing these gaps, this study aims to systematically investigate how Chinese enterprises shape their operational resilience through climate risk perception, identify the specific mechanisms involved, and examine whether this relationship exhibits heterogeneity.
Utilizing data from Chinese A-shared listed companies, this paper constructed a theoretical framework based on dynamic capabilities theory, specifically proposing a “risk identification–resource reconfiguration–resilience output” narrative. It systematically explains how climate risk perception enhances corporate operational resilience through three pathways: alleviating financing constraints, catalyzing technological innovation, and optimizing internal controls. This study extends prior studies in three ways. First, while previous studies primarily focused on internal resources, often overlooking the external shocks posed by climate change, this paper broadens the scope of operational resilience by considering climate risks [5,6,7]. Second, while existing research has predominantly explored the impact of climate risks on corporate financial performance, this study extends the framework to include operational resilience. It, therefore, contributes new evidence regarding the consequences of climate risk exposure from this perspective [20,21,22,23]. Third, unlike previous studies that primarily rely on macro-level indicators to measure the climate risks faced by enterprises objectively, this study incorporates firm-level risk perception to offer new insights into how climate risks impact operational resilience [18,19].
The remainder of the paper is organized as follows. Section 2 outlines the theoretical framework and research hypotheses. Section 3 describes the research design, including data collection, sample selection, variable definitions, and modeling. Section 4 presents the empirical results, covering a baseline regression, endogeneity tests, robustness checks, mechanism exploration, and a heterogeneity analysis. Section 5 concludes the study and discusses its implications.

2. Theoretical Analysis and Research Hypotheses

The impact of climate risk perception on corporate operational resilience can be observed through two aspects: its direct influence and its mechanisms of action. The mechanisms of action are primarily shaped by financing constraints, technological innovation, and internal controls, all of which impact corporate operational resilience. Based on Figure 1, this paper will explain the theoretical logic connecting climate risk perception and corporate operational resilience.

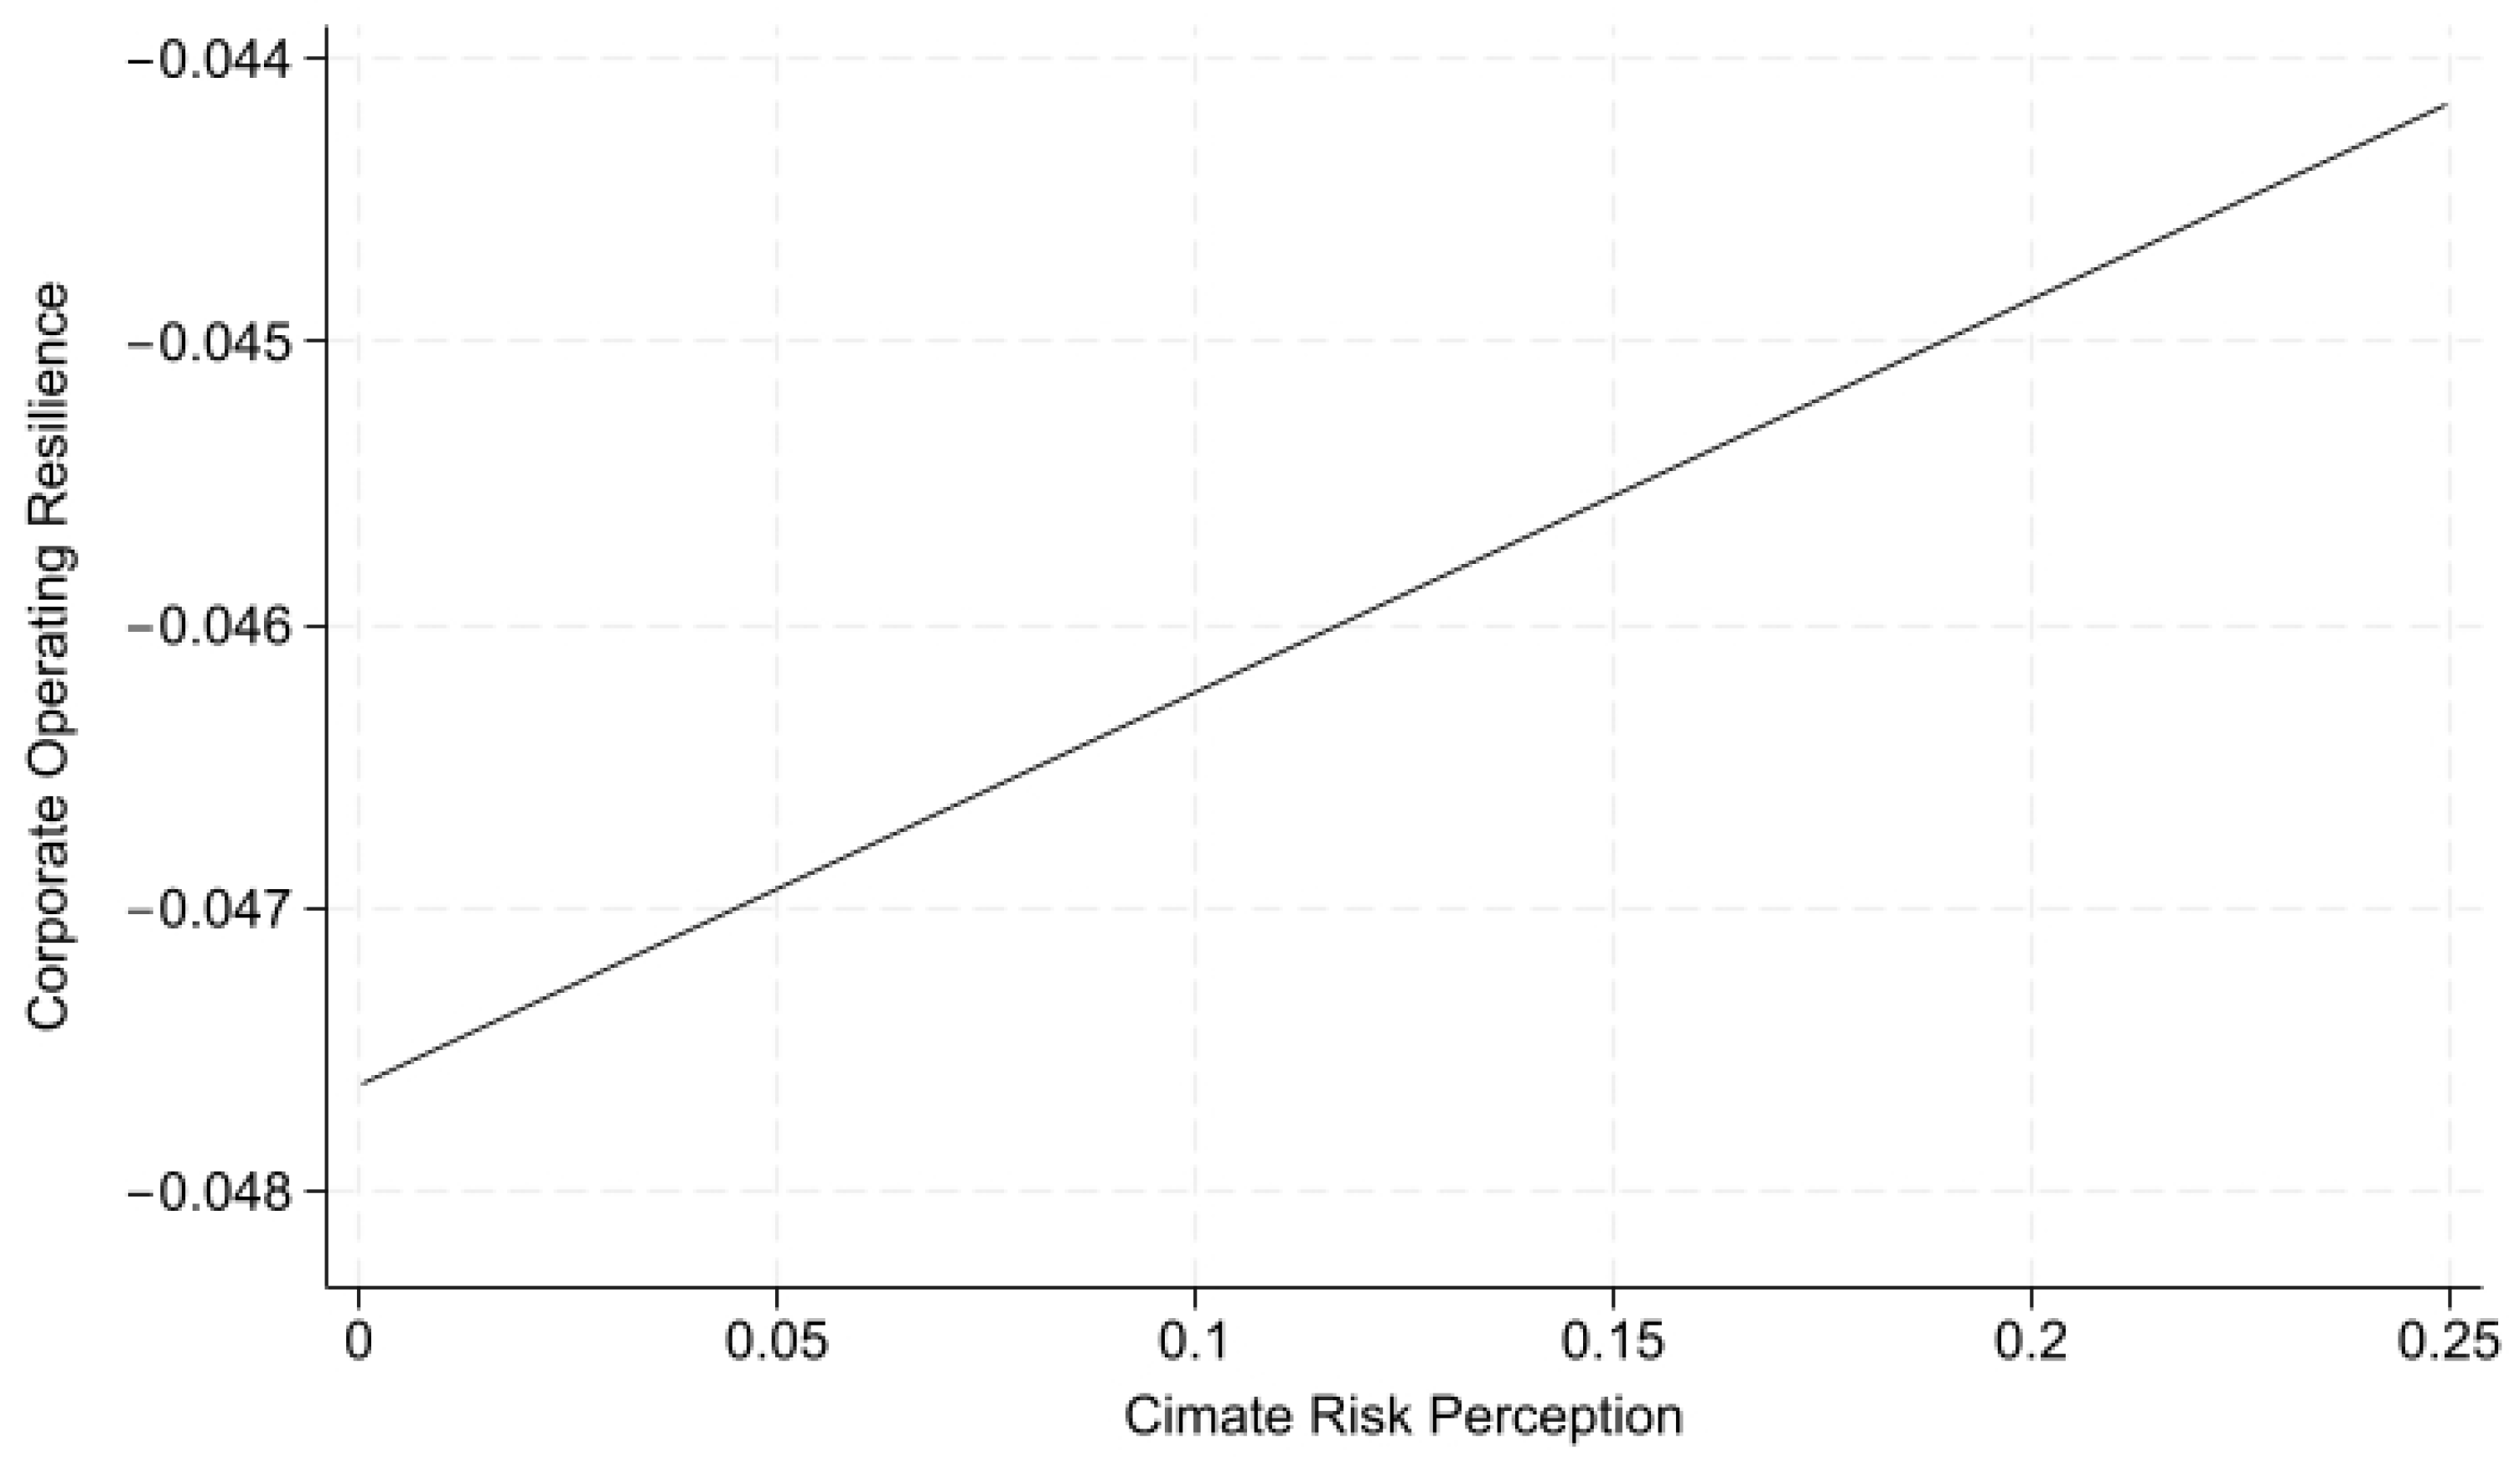
2.1. The Direct Influence of Climate Risk Perception on Corporate Operational Resilience

Dynamic capabilities theory posits that firms adapt to external changes and sustain long-term competitive advantages by continuously sensing these changes and adaptively restructuring their resource base [24]. Climate risk perception, as a higher-order dynamic capability, directly drives firms to integrate internal and external resources while optimizing the resilience of their operational system [13]. Specifically, climate risk perception encourages firms to incorporate environmental uncertainties into strategic decision making. It triggers resource reconfiguration through risk identification, allowing for the adjustment and reallocation of resources to address climate risks. Firms assess and prioritize their existing resources, utilizing climate scenario simulations to predict supply chain vulnerabilities and adjust supplier networks or inventory strategies accordingly [25]. At the same time, they activate redundant resources to mitigate potential shocks. This capability for resource reconfiguration directly enhances the robustness and recovery of operational systems [26].
The integration of resource-based theory and dynamic capabilities theory suggests that climate risk perception enhances firms’ control over heterogeneous resources and drives them to transform these resources into “resilience capital” to withstand risks [27]. When firms systematically identify the physical and transitional attributes of climate risks, their operational strategies proactively integrate climate adaptation goals. For example, firms may optimize the regional distribution of production networks to mitigate physical risks or invest in digital management systems to improve responsiveness to policy changes [28]. This strategic adjustment, driven by resource integration, enables firms to mobilize resource buffering mechanisms more efficiently in the face of external shocks, thereby maintaining or even enhancing operational performance [29]. Based on this, the following research hypothesis is proposed:
H1. 
The higher the level of climate risk perception, the stronger the corporate operational resilience.

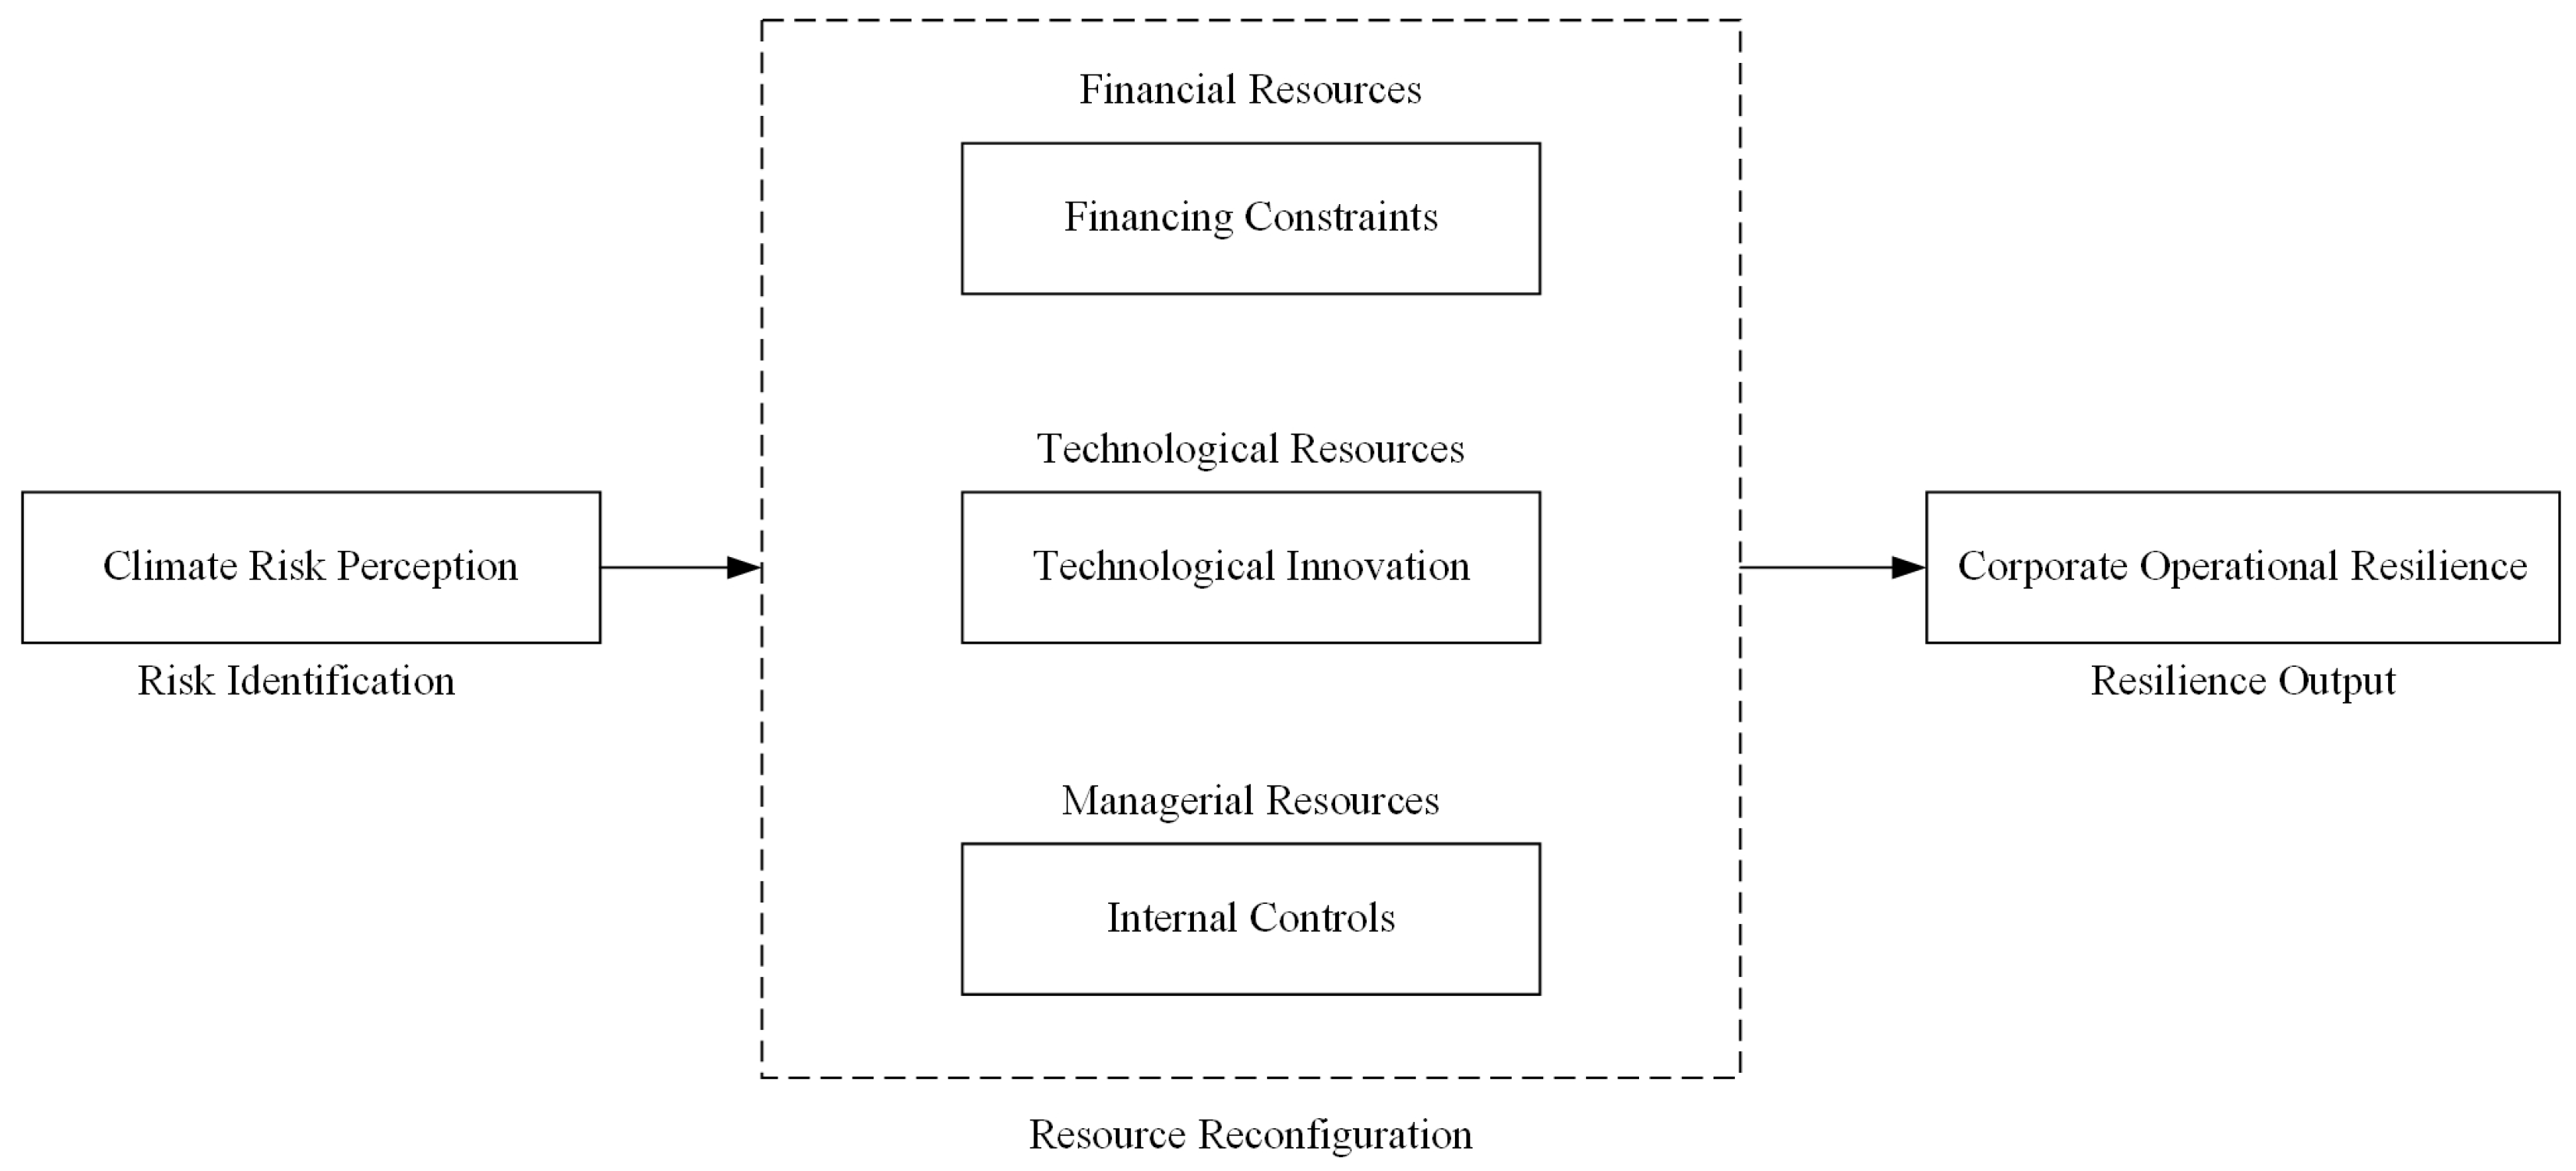
2.2. The Mechanisms of Climate Risk Perception’s Impact on Corporate Operational Resilience

Information asymmetry theory posits that external investors often struggle to assess a firm’s risk exposure accurately, resulting in higher financing premiums and constraints [30]. Climate risk perception addresses this issue through two primary mechanisms: proactive information disclosure and policy-driven tools. First, by improving the quality of climate risk management disclosures, such as those outlined by the Task Force on Climate-related Financial Disclosures (TCFD) [31], firms signal their governance capabilities to the capital market, thereby reducing investors’ discount expectations regarding potential risks. The TCFD recommends disclosures in four core areas: governance, strategy, risk management, and metrics and targets. For example, improved environmental, social, and governance (ESG) performance enhances information transparency and lowers external financing costs [32]. Second, policy-driven tools such as the Carbon Emission Reduction Support Tools employed by the People’s Bank of China offer targeted financing channels that lower interest rates and extend loan terms to optimize firms’ financial flexibility [33]. These tools reduce reliance on traditional high-cost financing and synergize with ESG certifications to attract green investment capital [34].
This process essentially restructures the firm’s capability to access financial resources. When firms prioritize climate risk as a strategic issue, they can access lower-cost funding and optimize debt maturity structures through the aforementioned pathways, thereby enhancing liquidity reserves and emergency response capabilities. Evidence indicates that alleviating financing constraints enables firms to allocate resources more flexibly in response to external shocks, such as supply chain disruptions. For instance, during periods of heightened macroeconomic uncertainty, firms may increase their financial asset allocations to buffer against liquidity risks [35]. Furthermore, the governance effect of information disclosure can enhance their willingness to take risks [31]. This increased willingness drives long-term strategic investments, such as green innovation, which strengthens supply chain stability and effectively mitigates the risk of operational disruptions [36]. Consequently, the following research hypothesis is proposed:
H2a. 
Climate risk perception positively impacts corporate operational resilience by alleviating financing constraints.
Teece elaborates on dynamic capabilities theory, indicating that the processes of sensing, integrating, and reconfiguring capabilities collectively establish a framework that allows firms to maintain flexibility and a competitive advantage in response to external shocks [37]. Climate risk perception enhances operational resilience by driving innovation in exploration and exploitation. Specifically, identifying climate risks compels firms to move beyond existing technological pathways and fosters innovations. For example, to address the potential impact of carbon tariffs, manufacturing companies have increased their investments in research and development (R&D) for clean production technologies. These process innovations reduce reliance on traditional energy sources, thereby improving the resilience of resource utilization [38]. At the same time, companies integrate climate risks into their existing technology improvement processes, driving exploitation innovations such as the real-time monitoring of equipment energy consumption and optimizing operational efficiency through Internet of Things (IoT) technology [39]. This incremental innovation lowers marginal costs and strengthens the pressure resistance of operational systems.
This process essentially involves the reconfiguration of technological resources, aligning with the “Innovation Compensation Hypothesis,” which posits that climate regulatory pressures drive firms to transform environmental constraints into innovation incentives [40]. The resulting technological innovations yield efficiency dividends and offer adaptability premiums, establishing the micro-foundations of operational resilience. Specifically, when confronted with climate policy risks, firms can enhance their resource utilization efficiency and improve market adaptability by strengthening R&D in green technologies [41]. Consequently, the following research hypothesis is proposed:
H2b. 
Climate risk perception positively impacts corporate operational resilience by promoting technological innovation.
According to agency theory, differences in climate risk preferences between management and shareholders may result in a tendency for short-term decision making [42]. Climate risk perception can alleviate agency conflicts by strengthening the supervisory and coordination functions of internal controls. First, companies incorporate climate risks into their internal control frameworks by establishing climate risk management committees. Through risk matrices, they quantify the climate vulnerabilities of various business units, requiring management to disclose climate response measures and report to the board [43]. Second, climate risk identification drives companies to optimize internal information flows. Integrating carbon emission data from the supply chain through enterprise resource planning (ERP) systems improves cross-departmental coordination in addressing climate risks [44]. This refined resource allocation enables companies to build preventive management redundancy, ensuring that effective emergency plans and rapid decision-making mechanisms are in place before external shocks occur.
Climate risk perception optimizes a company’s internal control mechanisms and promotes cross-departmental information flow and collaboration. This process essentially involves the reconfiguration of management resources, enabling companies to respond more flexibly and effectively to changes in the external environment. Consequently, the following research hypothesis is proposed:
H2c. 
Climate risk perception positively impacts corporate operational resilience by optimizing internal controls.

3. Research Design

3.1. Data and Samples

The research sample included Chinese A-shared listed enterprises from 2012 to 2023, excluding financial companies, those marked as ST or ST*, and companies with missing relevant data [19]. This extended research period was chosen not only due to data availability but also because it coincided with a critical era during which China significantly intensified its focus on climate risk management, particularly including the establishment of the dual carbon goals in 2020. To mitigate the impact of extreme values, all continuous variables were winsorized at the 1% and 99% levels. The climate risk perception index was sourced from the Global Climate Risk Index Database (GCRID), and the remaining data came from the China Stock Market & Accounting Research (CSMAR) database and the National Bureau of Statistics of China.

3.2. Variable Selection

3.2.1. Dependent Variable

Financial performance loss is a fundamental indicator in resilience research [45]. The less a firm’s financials fluctuate over a given period, the greater its resilience and ability to cope with operational risks [5]. This paper followed the approach of John et al. and Acharya et al., using the firm’s longitudinal performance volatility to measure corporate operational resilience [46,47]. Specifically, the standard deviation of the firm’s earnings before interest, taxes, depreciation, and amortization (EBITDA) was calculated over a 4-year rolling period. For ease of interpretation, the negative value of this measure was used in the regression analysis.

3.2.2. Independent Variable

This paper followed Lei et al.’s approach and used the Climate Risk Manager Attention Index from the GCRID to measure climate risk perception [48]. This index was derived from the Management Discussion and Analysis (MD&A) section of the annual reports of listed companies. The index was constructed as follows: First, a “climate risk” domain lexicon was built using the word2vec model, as shown in Table 1. Then, text mining was performed using Python’s Jieba and Gensim libraries. Finally, the relative frequency of word occurrences was calculated and normalized, with a higher value indicating a stronger ability to perceive climate risk.

3.2.3. Mediator Variable

This paper identified three key mediator variables that help explain the relationship between climate risk perception and corporate operational resilience: financing constraints, technological innovation, and internal controls.
To represent the level of financing constraints, this study utilized the SA index, calculated as follows: S A = 0.737 × S i z e + 0.43 × S i z e 2 0.040 × A g e . S i z e and A g e represent the firm size and age, respectively [49]. The calculated index was negative, and its absolute value was used as a proxy variable. The larger the value ( a b s S A ), the more severe the financing constraints faced by the company.
The proportion of R&D personnel ( R D P ) was employed as a measure of corporate innovation capability. This variable assessed the company’s focus on research and development by calculating the ratio of R&D staff to total employees, providing insight into the firm’s capacity for technological innovation [50,51].
The presence of internal control deficiencies ( I C D ) served as a measure of corporate internal control capability. This variable identified gaps in the company’s internal controls.

3.2.4. Control Variable

We introduced control variables related to company financial and governance characteristics in the regression model to avoid the influence of other factors on the analysis [19,52]. Corporate size ( s i z e ) was measured as the logarithm of the company’s total assets at year end. The proportion of fixed assets ( t a n ) was measured as the ratio of fixed assets to total assets at year end. The growth rate of fixed assets was represented by t a g r . The debt-to-asset ratio was denoted by l e v . The cash growth rate was represented by c a s h . The ownership concentration ( t o p 1 ) was measured as the ratio of shares held by the largest shareholder. The proportion of independent directors ( i n d e p ) was indicated by the ratio of independent directors to the total number of directors. We also included a binary variable ( d u a l ), where a value of one indicated that the Chairman and CEO are the same person and zero indicated these roles are filled by separate people. A detailed description of key variables is provided in Table 2.

3.3. Model

First, to verify whether climate risk perception had a direct impact on corporate operational resilience, this study used the following regression model [19,53]:
C O R i , t = β 0 + β 1 C R P i , t + β k C o n t r o l s i , t + i n d u s t r y d u m + y e a r d u m + ε i , t
where i and t represent the corporation and the year, respectively. C O R denotes corporate operational resilience, and C R P represents climate risk perception. C o n t r o l s is a vector set of control variables, i n d u s t r y d u m and y e a r d u m represent industry fixed effects and annual fixed effects, and ε i , t is a stochastic disturbance term. If the coefficient values of β 1 are significant, it means that the direct effect is significant.
Moreover, to explore the mechanisms by which climate risk perception affected corporate operational resilience, this study constructed the following mediation effects model [54]:
M e d i a i , t = β 0 + β 2 C R P i , t + β k C o n t r o l s i , t + i n d u s t r y d u m + y e a r d u m + ε i , t
C O R i , t = β 0 + β 3 C R P i , t + β 4 M e d i a i , t + β k C o n t r o l s i , t + i n d u s t r y d u m + y e a r d u m + ε i , t
Equation (3) tested the effect of climate risk perception on the mediator variables, which included financing constraints, technological innovation, and internal controls. The independent variable and mediator variables were placed into the same equation for the regression, as shown in Equation (3). If the coefficient values of β 2 , β 3 , and β 4 are significant, it means that the mediation effect is significant. In other words, climate risk perception influences corporate operational resilience through its impact on financing constraints, technological innovation, and internal controls.

3.4. Descriptive Statistics

The descriptive statistics of key variables are shown in Table 3. The mean of corporate operational resilience was −0.045, with a standard deviation of 0.052. The minimum and maximum values were −0.305 and −0.003, respectively. This result indicates that while the distribution of operational resilience across different firms is relatively uniform, there are still certain differences. The mean of climate risk perception was 0.023, with a standard deviation of 0.046. The relatively high standard deviation suggests significant fluctuation in firms’ perception of climate risks during the sample period. This characteristic provides a strong sample basis for exploring how corporate operational resilience changes under different climate risk perception scenarios. The statistical characteristics of the remaining variables are generally consistent with the findings of previous studies.

4. Empirical Result

4.1. Correlation Analysis

Figure 2 illustrates the relationship between climate risk perception and corporate operating resilience using a linear fit diagram. The horizontal axis denotes climate risk perception, and the vertical axis represents corporate operating resilience. The figure clearly demonstrates a positive correlation between these variables, suggesting that higher climate risk perception is conducive to improvements in corporate operating resilience.

4.2. Baseline Regression Result

Table 4 shows the results of the baseline regression. Columns (1) to (3) represent the regression results without control variables, with financial control variables, and with both financial and governance control variables, respectively. The coefficients for climate risk perception were 0.0426, 0.0589, and 0.0577, and they were significant at the 1% confidence level. This indicates that climate risk perception has a significant positive impact on corporate operational resilience. In other words, an increase in climate risk perception enhances corporate operational resilience. Therefore, hypothesis H1 is validated. This result validates the core proposition of the dynamic capabilities theory [10]. When firms incorporate climate risk into their strategic cognitive framework, they reconstruct their value chains through forward-looking actions such as scenario simulation and the activation of redundant resources, thereby transcending the passive risk response mode [55]. This reconstruction is not only a tactical adjustment for risk defense but also becomes a micro-foundation for sustainable transformation [56].

4.3. Robustness Check and Endogeneity Discussion

4.3.1. Robustness Check

To ensure the robustness of the baseline empirical results, this study conducted robustness tests using three approaches [57]. First, we replaced the corporate operational resilience metric, using the entropy weight method to measure the long-term outcomes of resilience ( C O R 1 ) from the perspectives of corporate profitability, growth, and debt repayment. Specifically, profitability included the return on equity, return on total assets, and net profit margin; growth included the year-on-year growth rates of the operating income and net profit; and debt repayment ability was measured by the ratio of the net cash flow to debt. The results, as presented in Column 1 of Table 5, indicate that climate risk perception continues to have a significant positive impact on corporate resilience at the 1% confidence level.
Second, we changed the way climate risk perception is measured by using the climate policy uncertainty ( C P U ) index to measure external climate risks as perceived by firms [58]. Climate policy uncertainty refers to the uncertainty perceived by businesses regarding government climate policies and regulations. The CPU index, constructed based on Chinese news data, serves as a robust proxy because it captures real-time policy dynamics and public sentiment shifts. Media discourse reflects anticipated regulatory risks, offering broader coverage and timeliness than firm-specific surveys while mitigating self-reporting biases, thereby enhancing objectivity in assessing climate risk exposure [19]. Due to the perfect collinearity between the climate policy uncertainty index and the time-fixed effects, we do not control for year-fixed effects in the regression analysis, the results of which are presented in Column 2 of Table 5. Climate policy uncertainty still has a significant positive impact on corporate operational resilience at the 5% confidence level.
Finally, to account for the lag effect of climate risk perception, we estimated the impact of climate risk perception using data from the previous year ( C R P t 1 ) and two years before ( C R P t 2 ) [19]. The regression results are shown in Columns (3) and (4) of Table 5. The coefficients for climate risk perception were 0.0579 and 0.0577, both significant at the 1% confidence level, indicating that climate risk perception has a significant positive effect.

4.3.2. Endogeneity Discussion

Potential endogeneity issues may exist due to variable omission, sample self-selection, and reverse causality. To address the issue of endogeneity related to variable omission, this study incorporated macroeconomic variables such as the GDP growth rate and CPI growth rate. The regression results shown in Column (1) of Table 6 indicate that climate risk perception had a significant positive impact on corporate operational resilience at the 1% level when including these control variables.
Since corporate climate risk perception is not random but jointly determined by internal firm characteristics and the external environment, we divided the sample into experimental and control groups using the median of corporate climate risk perception to address the issue of sample self-selection bias. We then performed robustness checks using propensity score matching. The results, presented in Column (2) of Table 6, show that after matching, corporate risk perception still had a significant positive effect at the 1% confidence level, confirming the robustness of the results.
Finally, to tackle the issue of reverse causality, we adopted the two-stage least squares (2SLS) method, following the approach of Wang et al., using the average climate risk perception of other firms in the province in a given year ( C R P _ o t h e r s ) as the instrumental variable for climate risk perception [59]. The two-stage regression results are shown in Columns (3) and (4) of Table 6. At the 1% confidence level, climate risk perception still had a significant positive impact on corporate operational resilience, further confirming the robustness of the results.

4.4. Mechanism Analysis

4.4.1. Mechanism Effect of Financing Constraints

Columns (1) and (2) of Table 7 present the regression results for the mediation effect of corporate financing constraints. Column (1) of Table 7 indicates that climate risk perception had a significant impact on corporate financing constraints at the 1% confidence level, suggesting that climate risk perception alleviated financing constraints. Climate risk perception would encourage corporations to reduce their reliance on debt financing, enhance financial resilience, and alleviate financing constraints [60]. As shown in Column (2) of Table 7, financing constraints had a significant negative effect on corporate operational resilience at the 10% confidence level, suggesting that an increase in financing constraints reduced corporate operational resilience. The increased financing constraints faced by corporations would limit their flexibility in responding to market changes and risks, thereby reducing operational resilience [61]. These results confirm the significant mediating effect of financing constraints, supporting hypothesis H2a. This result corroborates the mechanism of financial resource reconfiguration in dynamic capabilities theory. Climate risk perception enhances ESG transparency and the credibility of climate narratives, enabling firms to access targeted financing instruments like green loans and climate bonds, thereby breaking through the shackles of traditional financing constraints [62].

4.4.2. Mechanism Effect of Technological Innovation

Columns (1) and (2) of Table 7 present the regression results for the mediation effect. Column (3) of Table 7 indicates that climate risk perception had a positive impact on corporate technological innovation at the 1% confidence level. Climate risk perception would prompt corporations to enhance technological innovation to improve their market competitiveness [63]. Column (4) of Table 7 reveals that corporate technological innovation had a significant positive effect on operational resilience at the 10% confidence level. Technological innovation enhances the ability of corporations to respond to market changes and risks by optimizing internal resources and capabilities [64]. The impact of corporate climate risk perception on operational resilience was significantly positive, indicating that enhancing climate risk perception improves corporate operational resilience by promoting technological innovation. Hypothesis H2b is confirmed. This finding reveals the key pathway of technological resource reconfiguration under the dynamic capabilities theory. Climate risk perception drives firms to shift their R&D investments from general-purpose technologies to climate-adaptive innovations, thereby forming a risk-resilient technological moat [65,66].

4.4.3. Mechanism Effect of Internal Control

Columns (1) and (2) of Table 6 present the regression results for the mediation effect of internal control. Column (5) of Table 7 indicates that climate risk perception had a positive impact on corporate internal control at the 1% confidence level. Corporations would optimize internal management processes and enhance internal control capabilities to address climate risks [67]. As shown in Column (6) of Table 7, corporate internal control had a significant positive effect on operational resilience at the 1% confidence level. The improvement of internal control would enhance the operational resilience of corporations [68,69]. These findings indicate that enhancing climate risk perception improved internal control, increasing corporate operational resilience in turn. Therefore, hypothesis H2c is confirmed. This conclusion highlights the governance logic of managerial resource reconfiguration in the dynamic capabilities theory. Climate risk perception drives firms to embed climate scenario simulations into their internal control processes, thereby breaking organizational inertia through institutional self-reflection [67]. This enables firms to proactively adjust their strategies and improve their ability to respond to uncertainty and external shocks.

4.5. Heterogeneous Analysis

The dynamic interplay between external environment heterogeneity and firm-level resource endowment heterogeneity constitutes a critical determinant of Chinese enterprises’ sustainable development pathways [70,71]. This paper conducts an analysis of heterogeneity from three dimensions: regional distribution, ownership structure, and industry attributes.

4.5.1. Regional Heterogeneity

As shown in Column (1) of Table 8, the impact of climate risk perception on corporate operational resilience in the eastern region of China was significant at the 1% confidence level, with a coefficient value of 0.0497. The impact of climate risk perception on corporate operational resilience in the central and western regions, as shown in Column (2), was also significant at the 1% confidence level, albeit with a coefficient value of 0.0957. We found that improved climate risk perception had a greater impact on corporate operational resilience for companies in the central and western regions of China.
The regional heterogeneity stems from the dynamic adaptability differences between the external environment and resource reconfiguration capabilities. From a dynamic theory perspective, the marginal benefits generated by the “risk perception–resource reconfiguration” pathway in enterprises from central and western regions are more pronounced, possibly due to the relatively weaker resource endowments and risk response foundations in these areas [44]. When climate risk awareness is enhanced, firms in the central and western regions are more inclined to achieve resource reallocation through three channels: alleviating financing constraints (optimizing capital structure), strengthening technological innovation (improving adaptive capacity), and improving internal control (enhancing risk management mechanisms). This systematic reconfiguration has a magnifying effect in regions where infrastructure and risk management systems are relatively underdeveloped. The research findings confirm the policy implication that climate risk governance strategies should be tailored to regional development differences.
Compared to enterprises in the east, enterprises in the central and western regions may face greater challenges in financing [72]. After enhancing their ability to perceive climate risks, enterprises in the central and western regions established a more comprehensive ESG data monitoring system, incorporating climate risks into their strategic planning. This improvement in soft power enables enterprises in the central and western regions to better alleviate financing constraints and drive greater operational resilience.

4.5.2. Ownership Heterogeneity

Firms were classified into state-owned enterprises (SOEs) and non-state-owned enterprises (non-SOEs) based on the ultimate controlling shareholder. Specifically, a firm was defined as an SOE if the ultimate controlling shareholder was the government or a state-owned entity; otherwise, it was categorized as a non-SOE. As shown in Column (3) of Table 8, the impact of climate risk perception on corporate operational resilience in SOEs was significant at the 1% confidence level, with a coefficient value of 0.0486. The impact of climate risk perception on corporate operational resilience in non-SOEs was similarly significant at the 1% confidence level, with a coefficient value of 0.0406. In other words, the impact of climate risk perception on corporate operational resilience was not significantly different between SOEs and non-SOEs.
This indicates the convergence characteristics of ownership structure in the relationship between climate risk perception and operational resilience. Despite institutional differences between SOEs, which benefit from policy resources, and non-SOEs, which excel in market agility, both types of enterprises exhibit similar marginal effects in enhancing resilience through the “risk perception–resource reconfiguration” pathway. SOEs often have more complete internal controls and are more likely to obtain financing support due to implicit government support, while non-SOEs are more active in technology investment and innovation [73,74]. This convergence may stem from SOEs focusing more on risk buffering through optimizing internal control systems and policy-driven financing support, while non-SOEs rely more on technological innovation and market-based capital allocation to enhance adaptability, ultimately achieving a balanced effect under different pathways [75].

4.5.3. Industry Pollution Heterogeneity

This study utilized the Industry Classification Guidelines for Listed Companies revised by the China Securities Regulatory Commission in 2012, the Environmental Protection Verification Industry Classification Management List for Listed Companies established by the Ministry of Environmental Protection in 2008 (Environmental Affairs Office Letter [2008] No. 373), and the Environmental Information Disclosure Guidelines for Listed Companies (Environmental Affairs Office Letter [2010] No. 78) to identify the industry codes for heavily polluting listed companies. The industry classification of these companies used three main categories and 16 major types, as outlined in Appendix A.
Column (5) of Table 8 shows that the impact of climate risk perception on the operational resilience of high-pollution enterprises was significant at the 1% confidence level, with a coefficient value of 0.0908. The impact of climate risk perception on the operational resilience of non-high-pollution enterprises, as seen in Column (6), was also significant at the 1% confidence level, with a coefficient value of 0.0482. In terms of the impact of climate risk perception on corporate operational resilience, high-pollution enterprises showed a more pronounced improvement than non-high-pollution firms.
This difference may stem from the fact that high-pollution enterprises, facing stricter environmental regulations and greater exposure to climate risks, exhibit a stronger marginal response in strategic adjustments through the “risk perception–resource reconfiguration” mechanism. Specifically, these enterprises are more likely to actively utilize paths such as technological innovation, supply chain restructuring, and environmental management system upgrades to achieve resilience improvement [76,77]. This differentiated response not only arises from the rigid need of high-pollution enterprises to avoid environmental compliance risks but also reflects their strategic choice to gain a green competitive advantage through proactive climate adaptation.
Heavily polluting enterprises may invest more in clean technology on the surface, resulting in a lower operational efficiency and less significant actual effects of clean technology investment [78]. When the ability of enterprises to perceive climate risks improves, heavily polluting enterprises are more willing to respond to climate risks through technological investment, thereby driving greater operational resilience.

5. Conclusions and Policy Implications

5.1. Conclusions

This study analyzed the impact of climate risk perception on corporate operational resilience in terms of their direct effects, underlying mechanisms, and heterogeneous effects. The key findings were as follows: (1) Climate risk perception had a significant positive impact on corporate operational resilience. (2) The mediating effects of financing constraints, technological innovation, and internal control were significant, and increasing climate risk perception would enhance corporate operational resilience by alleviating financing constraints, promoting technological innovation, and improving internal control. (3) We found that climate risk perception would enhance corporate operational resilience more effectively for firms located in the central and western regions, and in high-pollution industries, with little difference between SOEs and non-SOEs. This insight contributes to dynamic capabilities theory by introducing a nuanced framework of “risk identification, resource reconfiguration, and resilience output,” which helps explain how firms can gradually adapt to climatic and environmental pressures.

5.2. Policy Implications

Adaptive and dynamic climate risk management systems should be integrated across firms of all sizes, with a special focus on those operating in pollution-intensive industries and challenging environments. Firms are encouraged to streamline processes for real-time climate risk monitoring and response, invest in R&D for low-carbon technologies, and enhance internal governance structures to better accommodate environmental and ESG considerations. Governments are urged to craft inclusive, industry-specific policies that facilitate sustainable practices across all business scales. This includes establishing funds like the “Central and Western Climate Resilience Fund” to aid in greener operations and promoting the creation of green financial products. Policies should also mandate rigorous climate risk assessments and regular carbon footprint disclosures across industries, bolstering corporate accountability and ensuring that environmental policies accommodate the diverse economic landscapes across regions.

5.3. Limitations of the Research

This study’s limitation may be its reliance on linear models, which might not capture the potentially non-linear relationship between climate risk perception and corporate resilience. Future research could explore alternative metrics for operational resilience and employ non-linear analytical methods to provide a more nuanced understanding of this dynamic. Additionally, expanding the dataset to include a broader range of geographical and regulatory contexts could enhance the generalizability of the findings.

Author Contributions

Conceptualization, X.Z.; methodology, X.Z.; software, X.B.; validation, X.Z. and X.B.; formal analysis, X.Z. and X.B.; investigation, X.Z. and X.B.; resources, X.Z.; data curation, X.Z. and X.B.; writing—original draft preparation, X.Z.; writing—review and editing, X.Z.; visualization, X.Z.; supervision, X.Z.; project administration, X.Z.; funding acquisition, X.Z. and X.B. All authors have read and agreed to the published version of the manuscript.

Funding

This work was supported by the National Social Science Foundation of China (No.21AJY014).

Institutional Review Board Statement

Not applicable.

Informed Consent Statement

Not applicable.

Data Availability Statement

The data presented in this study are available on request from the corresponding author.

Conflicts of Interest

The authors declare no conflicts of interest.

Appendix A

Table A1. Industry codes of heavily polluting listed companies.
Category CodeIndustry CodeIndustry Name
Mining industry (B)B06Coal mining and washing industry
B07Oil and gas extraction industry
B08Ferrous metal mining and processing industry
B09Non-ferrous metal mining and processing industry
Manufacturing (C)C17Textile industry
C19Leather, fur, feathers, and their products and footwear industry
C22Paper and paper products industry
C25Petroleum processing, coking, and nuclear fuel processing industry
C26Chemical raw materials and chemical products manufacturing industry
C27Pharmaceutical manufacturing industry
C28Chemical fiber manufacturing
C30Non-metallic mineral products industry
C31Ferrous metal smelting and rolling processing industry
C32Non-ferrous metal smelting and rolling processing industry
C33Metal products industry
Electricity, heat, gas, and water production and supply industry (D)D44Electricity and heat production and supply industry
Note: The industry code is derived from the Chinese Guidelines on the Industry Classification of Listed Companies (revised in 2012).

References

  1. Lee, S.H.; Choi, D.J.; Han, S.H. Corporate cash holdings in response to climate risk and policies. Financ. Res. Lett. 2023, 55, 103910. [Google Scholar] [CrossRef]
  2. Li, Y.; Zhang, Z. Corporate climate risk exposure and capital structure: Evidence from Chinese listed companies. Financ. Res. Lett. 2023, 51, 103488. [Google Scholar] [CrossRef]
  3. IPCC. Climate Change 2023: Synthesis Report; Core Writing Team, Lee, H., Romero, J., Eds.; Intergovernmental Panel on Climate Change: Geneva, Switzerland, 2023. [Google Scholar] [CrossRef]
  4. Zhou, K.; Li, Y. Carbon finance and carbon market in China: Progress and challenges. J. Clean. Prod. 2019, 214, 536–549. [Google Scholar] [CrossRef]
  5. Li, Y.; Wang, X.; Gong, T.; Wang, H. Breaking out of the pandemic: How can firms match internal competence with external resources to shape operational resilience? J. Oper. Manag. 2023, 69, 384–403. [Google Scholar] [CrossRef]
  6. Essuman, D.; Boso, N.; Annan, J. Operational resilience, disruption, and efficiency: Conceptual and empirical analyses. Int. J. Prod. Econ. 2020, 229, 107762. [Google Scholar] [CrossRef]
  7. Liu, X.; Tse, Y.K.; Wang, S.; Sun, R. Unleashing the power of supply chain learning: An empirical investigation. Int. J. Oper. Prod. Manag. 2023, 43, 1250–1276. [Google Scholar] [CrossRef]
  8. Chen, Y.; Li, B.; Huo, B. Building operational resilience through digitalization: The roles of supply chain network position. Technol. Forecast. Soc. Change 2025, 211, 123918. [Google Scholar] [CrossRef]
  9. Pankratz, N.M.C.; Schiller, C.M. Climate Change and Adaptation in Global Supply-Chain Networks. Rev. Financ. Stud. 2024, 37, 1729–1777. [Google Scholar] [CrossRef]
  10. Mehling, M.A.; Van Asselt, H.; Das, K.; Droege, S.; Verkuijl, C. Designing Border Carbon Adjustments for Enhanced Climate Action. Am. J. Int. Law 2019, 113, 433–481. [Google Scholar] [CrossRef]
  11. Hu, S.; Cao, L.; Shi, Y.; Wang, H. Green manufacturing pioneers: Unveiling the carbon dioxide reduction effect of China’s green factories. Econ. Anal. Policy 2025, 85, 1645–1662. [Google Scholar] [CrossRef]
  12. Conway, D.; Nicholls, R.J.; Brown, S.; Tebboth, M.G.L.; Adger, W.N.; Ahmad, B.; Biemans, H.; Crick, F.; Lutz, A.F.; De Campos, R.S.; et al. The need for bottom-up assessments of climate risks and adaptation in climate-sensitive regions. Nat. Clim. Change 2019, 9, 503–511. [Google Scholar] [CrossRef]
  13. Teece, D.J. Explicating dynamic capabilities: The nature and microfoundations of (sustainable) enterprise performance. Strateg. Manag. J. 2007, 28, 1319–1350. [Google Scholar] [CrossRef]
  14. Kolk, A.; Pinkse, J. Market Strategies for Climate Change. Eur. Manag. J. 2004, 22, 304–314. [Google Scholar] [CrossRef]
  15. Busch, T.; Hoffmann, V.H. How Hot Is Your Bottom Line? Linking Carbon and Financial Performance. Bus. Soc. 2011, 50, 233–265. [Google Scholar] [CrossRef]
  16. Slawinski, N.; Bansal, P. A Matter of Time: The Temporal Perspectives of Organizational Responses to Climate Change. Organ. Stud. 2012, 33, 1537–1563. [Google Scholar] [CrossRef]
  17. Bernstein, A.; Gustafson, M.T.; Lewis, R. Disaster on the horizon: The price effect of sea level rise. J. Financ. Econ. 2019, 134, 253–272. [Google Scholar] [CrossRef]
  18. Balvers, R.; Du, D.; Zhao, X. Temperature shocks and the cost of equity capital: Implications for climate change perceptions. J. Bank. Financ. 2017, 77, 18–34. [Google Scholar] [CrossRef]
  19. Sun, G.; Fang, J.; Li, T.; Ai, Y. Effects of climate policy uncertainty on green innovation in Chinese enterprises. Int. Rev. Financ. Anal. 2024, 91, 102960. [Google Scholar] [CrossRef]
  20. Heo, Y. Climate Change Exposure and Firm Cash Holdings; SSRN Scholarly Paper 3795298; Social Science Research Network: Rochester, NY, USA, 2021; p. 3795298. [Google Scholar] [CrossRef]
  21. Chen, X.; Chen, X.; Xu, L.; Wen, F. Attention to climate change and downside risk: Evidence from China. Risk Anal. 2023, 43, 1011–1031. [Google Scholar] [CrossRef]
  22. Javadi, S.; Masum, A.-A. The impact of climate change on the cost of bank loans. J. Corp. Financ. 2021, 69, 102019. [Google Scholar] [CrossRef]
  23. Nguyen, D.D.; Ongena, S.; Qi, S.; Sila, V. Climate Change Risk and the Cost of Mortgage Credit*. Rev. Financ. 2022, 26, 1509–1549. [Google Scholar] [CrossRef]
  24. Teece, D.J.; Pisano, G.; Shuen, A. Dynamic Capabilities and Strategic Management. Strateg. Manag. J. 1997, 18, 509–533. [Google Scholar] [CrossRef]
  25. Er-Kara, M.; Ghadge, A.; Bititci, U. Modelling the Impact of Climate Change Risk on Supply Chain Performance. SSRN Electron. J. 2020. [Google Scholar] [CrossRef]
  26. Mao, Y.; Li, P.; Li, Y. The relationship between slack resources and organizational resilience: The moderating role of dual learning. Heliyon 2023, 9, e14044. [Google Scholar] [CrossRef]
  27. Barney, J. Firm Resources and Sustained Competitive Advantage. J. Manag. 1991, 17, 99–120. [Google Scholar] [CrossRef]
  28. Ricciardi, G.; Callegari, G. Digital Twins for Climate-Neutral and Resilient Cities. State of the Art and Future Development as Tools to Support Urban Decision-Making. In Technological Imagination in the Green and Digital Transition; Arbizzani, E., Cangelli, E., Clemente, C., Cumo, F., Giofrè, F., Giovenale, A.M., Palme, M., Paris, S., Eds.; Springer International Publishing: Cham, Switzerland, 2023; pp. 617–626. [Google Scholar]
  29. Wieland, A.; Durach, C.F. Two perspectives on supply chain resilience. J. Bus. Logist. 2021, 42, 315–322. [Google Scholar] [CrossRef]
  30. Stiglitz, J.E.; Weiss, A. Credit rationing in markets with imperfect information. Am. Econ. Rev. 1981, 71, 393–410. [Google Scholar]
  31. Task Force on Climate-related Financial Disclosures. Recommendations of the Task Force on Climate-Related Financial Disclosures; Financial Stability Board: Basel, Switzerland, 2017; Available online: https://www.fsb.org/uploads/P290617-5.pdf (accessed on 10 January 2025).
  32. Zhang, W.; Zhao, Y.; Meng, F. ESG performance and green innovation of Chinese enterprises: Based on the perspective of financing constraints. J. Environ. Manag. 2024, 370, 122955. [Google Scholar] [CrossRef]
  33. Li, Y.; Ju, G.; Miao, H.; Zhou, J.; Liu, Y.; Ullah, I. Analyzing the Effect of Carbon Emission Regulations and Policy Tools in China on Reducing Emissions. Sustainability 2024, 16, 10016. [Google Scholar] [CrossRef]
  34. Dikau, S.; Volz, U. Central bank mandates, sustainability objectives and the promotion of green finance. Ecol. Econ. 2021, 184, 107022. [Google Scholar] [CrossRef]
  35. Al Janabi, M.A.M. Insights into Liquidity Dynamics: Optimizing Asset Allocation and Portfolio Risk Management with Machine Learning Algorithms. In Liquidity Dynamics and Risk Modeling: Navigating Trading and Investment Portfolios Frontiers with Machine Learning Algorithms; Al Janabi, M.A.M., Ed.; Springer Nature: Cham, Switzerland, 2024; pp. 257–303. [Google Scholar] [CrossRef]
  36. Liu, W.; Lin, G.; He, Q. Enhanced management information disclosure responsibilities and corporate risk-taking: Evidence from the accountability system for errors in China. Int. Rev. Econ. Financ. 2024, 89, 511–531. [Google Scholar] [CrossRef]
  37. Teece, D.J. Dynamic capabilities as (workable) management systems theory. J. Manag. Organ. 2018, 24, 359–368. [Google Scholar] [CrossRef]
  38. Zhou, X.; Zhu, Q.; Xu, L.; Wang, K.; Yin, X.; Mangla, S.K. The effect of carbon tariffs and the associated coping strategies: A global supply chain perspective. Omega 2024, 122, 102960. [Google Scholar] [CrossRef]
  39. Al-Sammak, K.A.; Al-Gburi, S.H.; Marghescu, I.; Drăgulinescu, A.-M.C.; Marghescu, C.; Martian, A.; Al-Sammak, N.A.H.; Suciu, G.; Alheeti, K.M.A. Optimizing IoT Energy Efficiency: Real-Time Adaptive Algorithms for Smart Meters with LoRaWAN and NB-IoT. Energies 2025, 18, 987. [Google Scholar] [CrossRef]
  40. Porter, M.E.; van der Linde, C. Toward a New Conception of the Environment-Competitiveness Relationship. J. Econ. Perspect. 1995, 9, 97–118. [Google Scholar] [CrossRef]
  41. Zhang, X.; Wang, M.; Zang, H. Renewable energy technology innovation, climate risk, and carbon emission reduction: A Cross-Country Analysis. Renew. Energy 2025, 240, 122136. [Google Scholar] [CrossRef]
  42. Jensen, M.C.; Meckling, W.H. Theory of the firm: Managerial behavior, agency costs and ownership structure. J. Financ. Econ. 1976, 3, 305–360. [Google Scholar] [CrossRef]
  43. Zhang, Y.; Yuan, L.; Ibrahim, I.; Omar, R. Sustainability in Question: Climate Risk, Environment, Social and Governance Performance, and Tax Avoidance. Sustainability 2025, 17, 1400. [Google Scholar] [CrossRef]
  44. Wang, M.; Li, Y.; Cao, X. How enterprise climate risk perception affects organizational resilience: A green technology innovation perspective. Stoch. Environ. Res. Risk Assess. 2024, 38, 4369–4391. [Google Scholar] [CrossRef]
  45. DesJardine, M.; Bansal, P.; Yang, Y. Bouncing Back: Building Resilience Through Social and Environmental Practices in the Context of the 2008 Global Financial Crisis. J. Manag. 2019, 45, 1434–1460. [Google Scholar] [CrossRef]
  46. John, K.; Litov, L.; Yeung, B. Corporate Governance and Risk-Taking. J. Financ. 2008, 63, 1679–1728. [Google Scholar] [CrossRef]
  47. Acharya, V.V.; Amihud, Y.; Litov, L. Creditor rights and corporate risk-taking. J. Financ. Econ. 2011, 102, 150–166. [Google Scholar] [CrossRef]
  48. Lei, L.; Zhang, D.; Ji, Q.; Guo, K.; Wu, F. A text-based managerial climate attention index of listed firms in China. Financ. Res. Lett. 2023, 55, 103911. [Google Scholar] [CrossRef]
  49. Hadlock, C.J.; Pierce, J.R. New Evidence on Measuring Financial Constraints: Moving Beyond the KZ Index. Rev. Financ. Stud. 2010, 23, 1909–1940. [Google Scholar] [CrossRef]
  50. Rothaermel, F.T.; Deeds, D.L. Alliance type, alliance experience and alliance management capability in high-technology ventures. J. Bus. Ventur. 2006, 21, 429–460. [Google Scholar] [CrossRef]
  51. Hoang, H.; Rothaermel, F.T. Leveraging internal and external experience: Exploration, exploitation, and R&D project performance. Strateg. Manag. J. 2010, 31, 734–758. [Google Scholar] [CrossRef]
  52. Lee, H. Does ESG Performance Drive Firm-Level Innovation? Evidence from South Korea. Sustainability 2025, 17, 1727. [Google Scholar] [CrossRef]
  53. Petersen, M.A. Estimating Standard Errors in Finance Panel Data Sets: Comparing Approaches. Rev. Financ. Stud. 2009, 22, 435–480. [Google Scholar] [CrossRef]
  54. Sun, G.; Li, T.; Ai, Y.; Li, Q. Digital finance and corporate financial fraud. Int. Rev. Financ. Anal. 2023, 87, 102566. [Google Scholar] [CrossRef]
  55. Keller, K.; Helgeson, C.; Srikrishnan, V. Climate risk management. Annu. Rev. Earth Planet. Sci. 2021, 49, 95–116. [Google Scholar] [CrossRef]
  56. Wu, H.; Chen, J.; Jiao, H. Dynamic capabilities as a mediator linking international diversification and innovation performance of firms in an emerging economy. J. Bus. Res. 2016, 69, 2678–2686. [Google Scholar] [CrossRef]
  57. Zhang, C.; Zhou, X.; Zhou, B.; Zhao, Z. Impacts of a mega sporting event on local carbon emissions: A case of the 2014 Nanjing Youth Olympics. China Econ. Rev. 2022, 73, 101782. [Google Scholar] [CrossRef]
  58. Ma, Y.-R.; Liu, Z.; Ma, D.; Zhai, P.; Guo, K.; Zhang, D.; Ji, Q. A news-based climate policy uncertainty index for China. Sci. Data 2023, 10, 881. [Google Scholar] [CrossRef]
  59. Wang, Z.; Sun, X.; Li, W. Cultural diversity and green innovation: Evidence from China. Financ. Res. Lett. 2023, 58, 104379. [Google Scholar] [CrossRef]
  60. Jiang, C.; Li, Y.; Zhang, X.; Zhao, Y. Climate risk and corporate debt decision. J. Int. Money Financ. 2025, 151, 103261. [Google Scholar] [CrossRef]
  61. Huang, S.; Wang, X.; Xue, Y.; Zhang, X. CEOS’climate risk perception bias and corporate debt structure. J. Int. Money Financ. 2025, 151, 103254. [Google Scholar] [CrossRef]
  62. Wang, T.; Liu, X.; Wang, H. Green bonds, financing constraints, and green innovation. J. Clean. Prod. 2022, 381, 135134. [Google Scholar] [CrossRef]
  63. Wu, Y. The impact of climate risks on green technology innovation: An empirical study based on panel data of 269 cities in China. Front. Environ. Sci. 2025, 12, 1510883. [Google Scholar] [CrossRef]
  64. Xia, H.; Liu, M.; Wang, P.; Tan, X. Strategies to enhance the corporate innovation resilience in digital era: A cross-organizational collaboration perspective. Heliyon 2024, 10, e39132. [Google Scholar] [CrossRef]
  65. Huang, H.H.; Kerstein, J.; Wang, C. The impact of climate risk on firm performance and financing choices: An international comparison. J. Int. Bus. Stud. 2018, 49, 633–656. [Google Scholar] [CrossRef]
  66. Lee, K.-H.; Min, B.; Yook, K.-H. The impacts of carbon (CO2) emissions and environmental research and development (R&D) investment on firm performance. Int. J. Prod. Econ. 2015, 167, 1–11. [Google Scholar] [CrossRef]
  67. Huo, M.; Li, C.; Liu, R. Climate policy uncertainty and corporate green innovation performance: From the perspectives of organizational inertia and management internal characteristics. Manag. Decis. Econ. 2024, 45, 34–53. [Google Scholar] [CrossRef]
  68. Al Balushi, M. How internal transparency impacts organizational resilience. Int. J. Qual. Reliab. Manag. 2021, 38, 1246–1263. [Google Scholar] [CrossRef]
  69. Weber, M.M.; Pedell, B.; Rötzel, P.G. Resilience-oriented management control systems: A systematic review of the relationships between organizational resilience and management control systems. J. Manag. Control 2024, 563–620. [Google Scholar] [CrossRef]
  70. Li, H.; Chang, Y.; Wang, X.; Zhang, N. Institutional Complexity and Corporate Environmental Investments: Evidence from China’s Mixed-Ownership Reform of State-Owned Enterprises. Manag. Organ. Rev. 2024, 20, 716–747. [Google Scholar] [CrossRef]
  71. Liu, X.; Huang, N.; Su, W.; Zhou, H. Green innovation and corporate ESG performance: Evidence from Chinese listed companies. Int. Rev. Econ. Financ. 2024, 95, 103461. [Google Scholar] [CrossRef]
  72. Ng, S.H.; Yang, Y.; Lee, C.C.; Ong, C.Z. Nexus of financing constraints and supply chain finance: Evidence from listed SMEs in China. Int. J. Financ. Stud. 2023, 11, 102. [Google Scholar] [CrossRef]
  73. Cuervo-Cazurra, A.; Li, C. State ownership and internationalization: The advantage and disadvantage of stateness. J. World Bus. 2021, 56, 101112. [Google Scholar] [CrossRef]
  74. Xu, S.; Chen, S.; Jiao, W.; Chen, M. State-owned enterprises shareholders and innovation of private enterprises: Evidence from China. Technovation 2025, 140, 103144. [Google Scholar] [CrossRef]
  75. Li, J.; Wang, K.; Mei, Y. State-Owned Capital Participation and Corporate Environmental, Social, and Governance Performance: Evidence from Chinese Private Firms. J. Knowl. Econ. 2024, 1–28. [Google Scholar] [CrossRef]
  76. Liu, Y.; Huang, H.; Mbanyele, W.; Li, X.; Balezentis, T. Harnessing supply chain digital innovation for enhanced corporate environmental practices and sustainable growth. Energy Econ. 2025, 142, 108161. [Google Scholar] [CrossRef]
  77. Deng, Q.; Huang, G.; Li, D.; Yang, S. The impact of climate risk on corporate innovation: An international comparison. J. Multinatl. Financ. Manag. 2024, 75, 100870. [Google Scholar] [CrossRef]
  78. Dai, L.; Zhang, R. Environmental Regulation and Green Investment Efficiency: Threshold and Spatial Spillover Analysis for China. Sustainability 2025, 17, 2934. [Google Scholar] [CrossRef]
Figure 1. Theoretical framework of climate risk perception and corporate operational resilience.
Sustainability 17 03387 g001
Figure 2. Fitting diagram of climate risk perception and corporate operating resilience.
Sustainability 17 03387 g002
Table 1. Climate risk perception lexicon.
DimensionKeywords
Climate Physical ThreatsAir pollution, air quality, temperature, carbon dioxide, carbon emissions, climate change, extreme weather, flue gas, gas emissions, greenhouse gas emissions, global warming, natural disasters, ozone layer, sea level
Policy ResponsesCarbon neutrality, carbon price, carbon sink, carbon tax, carbon peak, Kyoto Protocol, Paris Agreement, carbon reduction, electric vehicles
Clean EnergyEnergy transition, clean energy, forest land, clean water, clean air, carbon energy, low-carbon, zero-carbon, energy environment, environmental sustainability, renewable energy, thermal energy, solar energy, water resources, wave energy, tidal energy, wind energy, biomass energy, new energy, energy efficiency
Table 2. Detailed description of key variables.
Variable TypeVariable NameSymbolDefinition
Dependent variableCorporate operational resilience C O R The standard deviation of the firm’s EBITDA over a 4-year rolling period. For ease of interpretation, the negative value of this measure is used in the regression analysis.
Independent variableClimate risk perception C R P The Climate Risk Manager Attention Index from the GCRID
Mediator variableFinancing constraints a b s S A The absolute value of the SA index
Technological innovation R D P The proportion of R&D personnel
Internal controls I C D The presence of internal control deficiencies
Control variableCorporate size s i z e The logarithm of the company’s total assets at year end
The proportion of fixed assets t a n The ratio of fixed assets to total assets at year end
The fixed assets growth rate t a g r The fixed assets growth rate
The debt-to-asset ratio l e v The proportion of total debt to total assets
The cash growth rate c a s h The growth rate of cash and cash equivalents
Ownership concentration t o p 1 The ratio of shares held by the largest shareholder.
The proportion of independent directors i n d e p The ratio of independent directors to the total number of directors
Chairman–CEO duality d u a l A binary variable, where a value of 1 indicates that the Chairman and CEO are the same person and 0 indicates the roles are filled by separate people.
Table 3. Descriptive statistics of key variables.
VariableSample SizeMeanStandard DeviationMinimumMaximum
C O R 19,081−0.0450.052−0.305−0.003
C R P 19,0810.0230.04600.247
s i z e 19,08122.6951.31320.00826.516
t a n 19,0810.2000.1520.0020.695
t a g r 19,0810.1050.212−0.3171.076
l e v 19,0810.1810.1210.0160.601
c a s h 19,0810.4610.1960.0700.892
t o p 1 19,0810.3200.1450.0790.724
i n d e p 19,0810.3770.05400.3330.571
d u a l 19,0810.2600.43901
Table 4. Baseline regression result.
Variables(1)
COR
(2)
COR
(3)
COR
C R P 0.0426 ***0.0589 ***0.0577 ***
(0.0103)(0.0104)(0.0104)
s i z e −0.0035 ***−0.0032 ***
(0.0004)(0.0004)
t a n 0.0139 ***0.0132 ***
(0.0033)(0.0033)
t a g r 0.0059 ***0.0063 ***
(0.0020)(0.0020)
l e v −0.0029−0.0043
(0.0039)(0.0039)
c a s h 0.0050 *0.0048 *
(0.0026)(0.0026)
t o p 1 −0.0090 ***
(0.0030)
i n d e p 0.0065
(0.0070)
d u a l −0.0022 **
(0.0009)
Year FEYESYESYES
Industry FEYESYESYES
Observation19,08119,08119,081
R-squared0.08230.08910.0899
*, **, and *** denote statistical significance at 10%, 5%, and 1% levels, respectively; the numbers shown in parentheses are the robust standard errors.
Table 5. Robustness check result.
Variables(1)
COR1
(2)
COR
(3)
COR
(4)
COR
C R P 0.0295 ***
(0.0062)
C P U 0.0014 **
(0.0006)
C R P t 1 0.0579 ***
(0.0120)
C R P t 2 0.0577 ***
(0.0146)
C o n t r o l s YESYESYESYES
Year FEYESNoYESYES
Industry FEYESYESYESYES
Observation19,08119,08115,74113,263
R-squared0.98110.08490.09630.1110
**, and *** denote statistical significance at 5%, and 1% levels, respectively; the numbers shown in parentheses are the robust standard errors.
Table 6. Endogeneity discussion result.
Variables(1)
COR
(2)
COR
(3)
CRP
(4)
COR
C R P 0.0577 ***0.0544 *** 0.3976 **
(0.0104)(0.0114) (0.1795)
C R P _ o t h e r s 0.3828 ***
(0.0613)
C o n t r o l s YESYESYESYES
Year FEYESYESYESYES
Industry FEYESYESYESYES
Observation19,08119,08119,08119,081
R-squared0.08990.09300.30610.0928
**, and *** denote statistical significance at 5%, and 1% levels, respectively; the numbers shown in parentheses are the robust standard errors.
Table 7. Mechanism analysis result.
Variables(1)
absSA
(2)
COR
(3)
RDP
(4)
COR
(5)
ICD
(6)
COR
C R P −0.3760 ***0.0577 ***0.0633 ***0.0531 ***0.3740 ***0.0568 ***
(0.0430)(0.0104)(0.0208)(0.0109)(0.0957)(0.0104)
a b s S A −0.0029 *
(0.0016)
R D P 0.0076 *
(0.0044)
I C D 0.0022 ***
(0.0007)
C o n t r o l s YESYESYESYESYESYES
Year FEYESYESYESYESYESYES
Industry FEYESYESYESYESYESYES
Observation19,08119,08112,03712,03719,08119,081
R-squared0.29700.08930.45340.08910.08330.0904
* and *** denote statistical significance at 10% and 1% levels, respectively; the numbers shown in parentheses are the robust standard errors.
Table 8. Heterogeneous analysis result.
Variables(1)
COR
(2)
COR
(3)
COR
(4)
COR
(5)
COR
(6)
COR
C R P 0.0497 ***0.0957 ***0.0486 ***0.0406 ***0.0908 ***0.0482 ***
(0.0108)(0.0270)(0.0123)(0.0130)(0.0263)(0.0110)
C o n t r o l s YESYESYESYESYESYES
Year FEYESYESYESYESYESYES
Industry FEYESYESYESYESYESYES
Observation14,205487610,6518430402215,059
R-squared0.11210.10780.09200.08630.04940.1052
*** denote statistical significance at 1% levels, respectively; the numbers shown in parentheses are the robust standard errors.
Disclaimer/Publisher’s Note: The statements, opinions and data contained in all publications are solely those of the individual author(s) and contributor(s) and not of MDPI and/or the editor(s). MDPI and/or the editor(s) disclaim responsibility for any injury to people or property resulting from any ideas, methods, instructions or products referred to in the content.

