Article

Closed-Circuit Reverse Osmosis Performance Evaluation in a High-Recovery-Rate Water Reclamation Pilot Project

1
Department of Civil Engineering, College of Engineering, California State Polytechnic University, 3801 West Temple Avenue, Pomona, CA 91768, USA
2
Department of Interior, Research and Development Office, Bureau of Reclamation, Denver, CO 80215, USA
3
Eastern Municipal Water District, 2270 Trumble Rd., Perris, CA 92570, USA
*
Author to whom correspondence should be addressed.
Sustainability 2025, 17(8), 3388; https://doi.org/10.3390/su17083388
Submission received: 16 March 2025 / Revised: 7 April 2025 / Accepted: 8 April 2025 / Published: 10 April 2025
(This article belongs to the Section Waste and Recycling)

Abstract

:
Reusing treated effluent from municipal wastewater treatment plants is essential for addressing freshwater scarcity, a key objective of the United Nations Sustainable Development Goals (SDGs). While closed-circuit reverse osmosis (CCRO) has shown promise in municipal reuse facilities, the comprehensive assessment of water quality parameters, especially at higher recovery rates, is lacking. In this study, at the San Jacinto Valley Regional Water Reclamation Facility (SJVRWRF), we evaluated the performance of CCRO in treating municipal wastewater tertiary effluent, focusing on high recovery rates. Our analysis of selected chemical parameters across recovery rates ranging from 90% to 95% revealed the effective removal of suspended particles by CCRO. However, variations in removal rates were observed among ions, with chloride removal at 96.3% and nitrate removal at 79.6%, contrasting with fluoride’s complete removal and sulfate’s 99.7% removal rate. Divalent ions like calcium and magnesium exhibited better rejection than monovalent ions such as sodium and potassium. Additionally, the removal efficiency of total dissolved solids (TDSs), alkalinity, chloride, nitrate, sodium, and potassium decreased with an increasing recovery rate, while sulfate, calcium, and magnesium removal rates remained stable. These findings enhance our understanding of membrane treatment processes, providing valuable insights for future water reclamation projects to combat freshwater resource scarcity.

1. Introduction

More regions worldwide are grappling with water stress, driven by factors like population growth, expanding economic activities, and the rise of unsustainable water-intensive industries [1]. Additionally, overexploitation has led to the depletion of groundwater and surface water resources, while climate change and extreme weather events further exacerbate water scarcity in many water systems around the world [2]. In response to these challenges, the adoption of non-conventional water sources, including treated municipal wastewater, brackish and saline groundwater, and seawater, has emerged as a viable solution in many regions [3].
Wastewater reclamation has emerged as a practical solution to augment water supplies in water-stressed or densely populated regions worldwide [2]. Reverse osmosis (RO) technology is increasingly being employed to treat municipal and certain industrial wastewaters, driven by the escalating water demand in urban areas [4]. Large-scale commercial pressure-driven membrane treatment plants, exemplified by those in Southern California [5], attest to the reliability and cost-effectiveness of RO systems for water purification in wastewater reclamation facilities. Despite the challenges posed by synthetic organic materials and dissolved ions in wastewater treatment, RO membranes have demonstrated remarkable efficacy in removing dissolved substances [6].
While RO processes boast high efficacy in removing a diverse range of ions along with specific organic and inorganic contaminants, certain contaminants remain unaffected by RO systems [6,7,8]. For instance, RO units exhibit limited effectiveness in removing certain organic compounds (e.g., formaldehyde, methanol, acetonitrile, methyl ethyl ketone, etc.), chlorine by-products (e.g., chloroform, dichlorobromomethane, dibromochloromethane, and bromoforms), or dissolved gasses (e.g., ammonia, carbon dioxide, oxygen, hydrogen sulfide, etc.) [8,9,10]. Studies suggest that the removal rates of constituents by RO membranes may be influenced by molecular properties such as hydrophobicity and molecular weight [10,11,12]. Additionally, it has also been reported that RO water, which is ion-free, is unsuitable for long-term drinking purposes [13,14]. For this reason, many RO facilities are used for groundwater replenishment instead [15,16].
Furthermore, while RO is highly effective in reducing the microorganism population in water, these microbes may populate the membrane, leading to the formation of biofilms or premature membrane failure [17]. Wastewaters, in particular, pose a risk of membrane fouling due to mineral scaling, colloidal fouling, biofouling, and the adsorption of organic materials onto the membrane surface [18]. Fouling on RO membranes diminishes permeate flux, increases transmembrane pressure (TMP) drop, reduces energy efficiency, and necessitates more extensive pretreatment and frequent membrane replacements [9,19]. Although RO systems typically operate at recovery rates of 75–85%, potable reuse applications and wastewater treatment plants can achieve up to an 85% recovery rate [5,16,20,21]. However, increasing the recovery rate in RO processes heightens the risk of fouling and scaling [9,17]. In conventional continuous RO systems, membrane elements positioned toward the end of the train may be exposed to supersaturated solutions for prolonged periods between cleanings [17]. Therefore, there remains ample room for improving pressure-driven membrane processes to enhance efficiencies, notably by augmenting RO recovery rates and mitigating membrane fouling and scaling, thereby reducing the costs associated with membrane cleanup and maintenance.
To overcome the above-mentioned issues, a semi-batch process called closed-circuit reverse osmosis (CCRO) was introduced. Unlike conventional continuous RO, CCRO systems involve continuous blending of the recirculating brine with lower-salinity feed, ensuring no part of the membrane train remains in contact with supersaturated solutions for an extended duration [19]. As brine is recirculated and periodically purged, it prevents the buildup of scaling and biofouling by flushing out concentrated contaminants before they reach critical levels [22]. Moreover, by lowering the average osmotic pressure across the membrane, CCRO processes are capable of decreasing energy consumption in comparison to conventional RO processes [23]. Additionally, CCRO systems often integrate intelligent monitoring and automated cleaning mechanisms that detect early signs of fouling, adjusting operating parameters or initiating cleaning cycles before performance degradation occurs [22].
Furthermore, CCRO systems have demonstrated advantages over many other existing desalination technologies. Compared to electrodialysis reversal (EDR), the energy consumption of CCRO varies depending on feedwater salinity [24]. EDR tends to be more energy-efficient for low- to moderate-salinity waters as it operates via ion migration rather than hydraulic pressure, but at higher salinities, CCRO can become more efficient due to the increasing electrical resistance in EDR [24]. Forward osmosis (FO), on the other hand, is often promoted as an energy-efficient alternative to RO because it does not require high hydraulic pressures for water transport [25]. However, FO systems require a draw solution regeneration step, which can be energy-intensive depending on the separation technology used (e.g., thermal or membrane-based processes) [25]. In practical applications, CCRO tends to be more energy-efficient than FO when considering the total system energy input, including post-treatment requirements [19,23]. Overall, while EDR and FO have advantages in specific scenarios, CCRO provides a compelling balance of energy efficiency, high recovery rates, and operational simplicity, making it a competitive choice for advanced water treatment applications.
CCRO technology has undergone successful piloting at various municipal reuse facilities in California, yielding positive outcomes [22]. In January 2014, the Los Angeles County Sanitation Districts (LACSDs) commissioned the first municipal reuse CCRO pilot, achieving a sustained RO system recovery of 93% while treating tertiary effluent [26]. Subsequently, the City of Los Angeles [27] and the Padre Dam Municipal Water District [28] initiated similar pilots, demonstrating that more than 95% recovery was sustainable by incorporating CCRO to treat tertiary effluent intended for potable reuse. In 2017, the Orange County Water District (OCWD) implemented a CCRO pilot system to evaluate and showcase its capability to enhance recovery from 85% to 93% at the Groundwater Replenishment System (GWRS) Advanced Water Purification Facility (AWPF) [22]. The OCWD pilot system evaluated CCRO performance in terms of contaminant removal using 11 water quality parameters (Ca2+, Na+, K+, Silica, NH4+, Boron, Cl, SO42−, NO3, total dissolved solids (TDSs), and total organic carbon (TOC)) at a 92% recovery rate. Most parameters exhibited a rejection rate exceeding 90% at this recovery rate [22]. However, the comprehensiveness of water quality parameters and testing at higher recovery rates (i.e., greater than 93%) are lacking, thus impeding the ability to predict CCRO’s performance at high recovery rates in pilot-scale operations.
In this study, we investigated the viability of utilizing CCRO to process tertiary effluent from municipal wastewater, employing a high-recovery-rate setup. This pilot initiative took place at the San Jacinto Valley Regional Water Reclamation Facility (SJVRWRF), operated by the Eastern Municipal Water District (EMWD) [29]. We conducted a more comprehensive analysis of conventional water quality parameters across recovery rates ranging from 90% to 95%. The CCRO permeate was designated for use in groundwater replenishment. The CCRO pilot-scale testing had two primary objectives: first, to evaluate the feasibility of reclaiming additional water from the treated tertiary effluent at the wastewater treatment plant by investigating higher recovery rates and minimizing the volume of the concentrate stream; second, to scrutinize the performance of the CCRO process in eliminating conventional water quality constituents at elevated recovery rates.

2. Materials and Methods

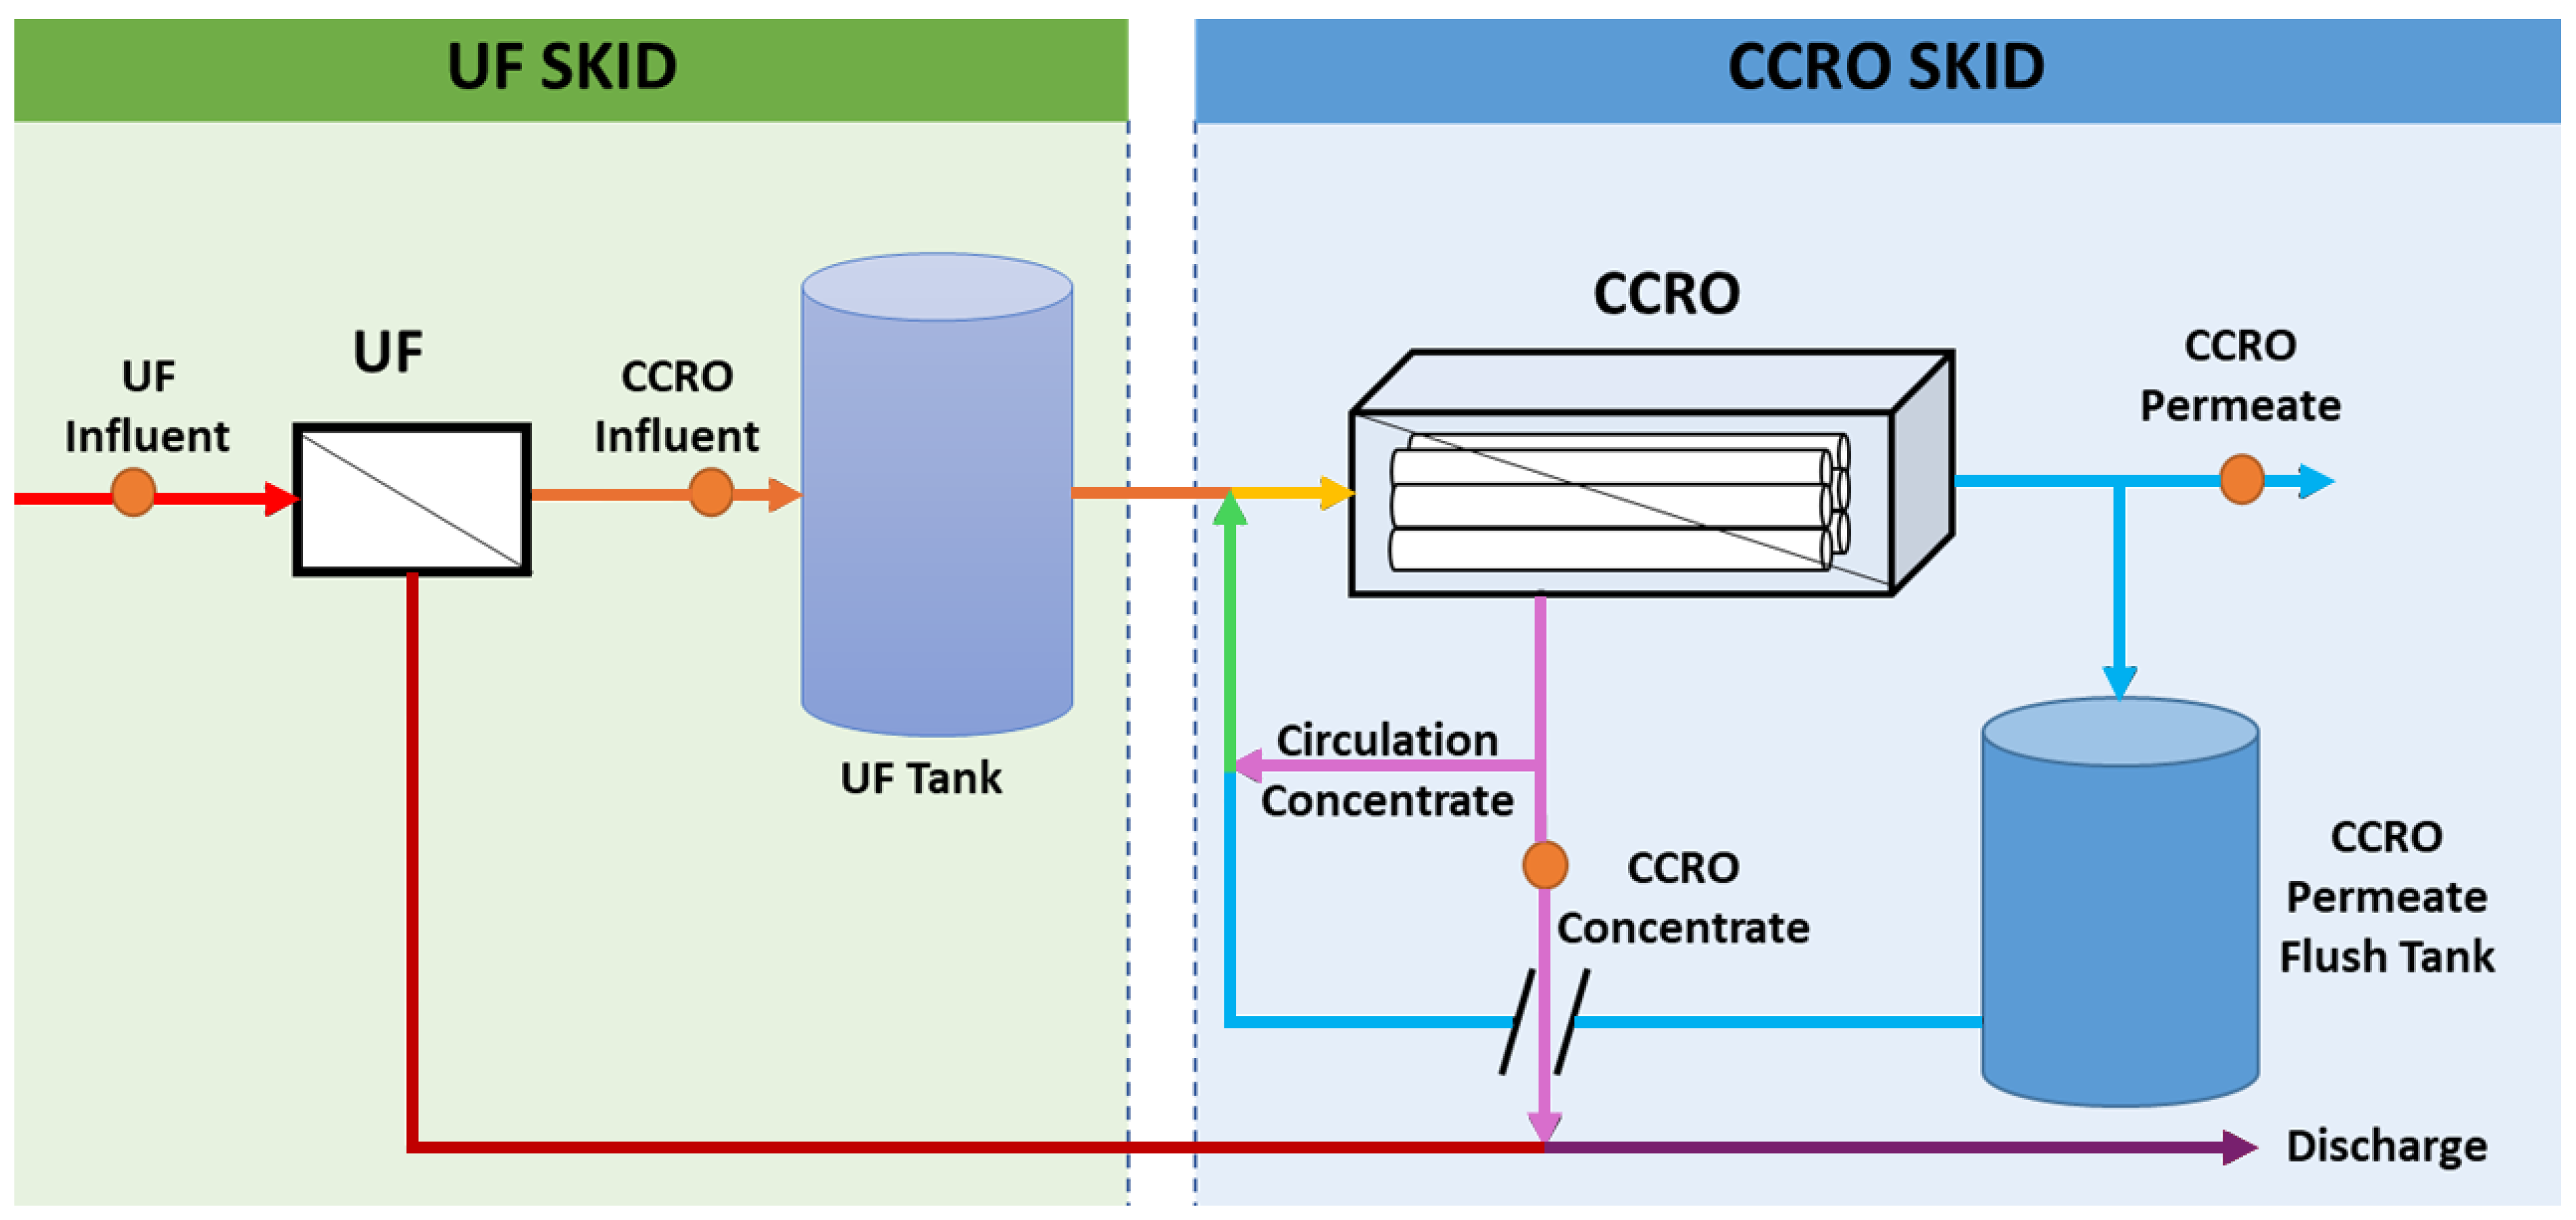
2.1. The Pilot Project

The Purified Water Replenishment Brine Concentration Pilot Project was executed at the San Jacinto Valley Regional Water Reclamation Facility (SJVRWRF) within the Eastern Municipal Water District (EMWD) to support EMWD’s Purified Water Replenishment (PWR) program, aimed at minimizing the concentrate stream. This pilot initiative was tailored to treat SJVRWRF’s tertiary effluent. As shown in Figure 1, the process involved the use of ultrafiltration (UF) membrane modules for pretreatment, an equalization tank, and a CCRO system designed and provided by Desalitech. EMWD provided the tertiary effluent as the feed for the UF treatment, which served to eliminate particulate contaminants before the flow was directed to the CCRO system [29]. Notably, UF offers several distinct advantages over conventional techniques [22]. First, UF provides a significantly higher level of filtration efficiency by effectively removing suspended solids, bacteria, and viruses, which conventional coagulation/sedimentation alone may not fully eliminate. This leads to better protection of the CCRO membranes, reducing membrane fouling and extending their operational lifespan [17]. Second, UF ensures a more consistent and reliable water quality with lower turbidity and silt density index (SDI), which is crucial for maintaining the performance of CCRO systems [30]. Third, UF has a smaller footprint and often requires fewer chemicals compared to conventional pretreatment, leading to lower chemical consumption and sludge production [31]. This not only reduces operational costs but also minimizes environmental impacts associated with chemical usage and sludge disposal [31].
During this study, the CCRO system functioned in two distinct modes: closed-circuit desalination (CCD) and plug-flow desalination (PFD). During CCD mode, the concentrate stream was entirely recirculated, mixed with the raw feed, and processed again until the predefined setpoints were reached. Once the setpoint was achieved, the system transitioned to PFD mode, where a concentrate discharge valve opened to remove the concentrated solution, which was then replaced by fresh feed. The UF backwash, RO permeate, and RO concentrate flows were all directed back to the headworks of the SJVRWRF.
Fieldwork began in October 2020 and concluded in May 2021, with Figure 1 depicting a schematic diagram of the pilot plant utilized in this study. The UF process employed 8 UF membrane modules with a total surface area of 576 m2 (6200 ft2) and operated under a maximum flux of 1.06 m3/m2/d (26 gal/ft2/d). The CCRO process utilized 25 RO elements in one stage, with a total membrane surface area of approximately 929 m2 (10,000 ft2). Each of the 25 elements had 37.1 m2 (400 ft2) in the RO process. In the pilot configuration, the feed capacity was approximately 16 m3/h (70 gal/min)), with a flux of 0.41 m3/m2-d (10 gal/ft2-d). The technical data of UF and RO elements are detailed in Table 1. The recovery rate was the primary variable and incrementally increased from 90% to 95% in various stages.

2.2. Samples and Parameters

The CCRO pilot study commenced at a 90% recovery rate before this was incrementally raised to a 95% recovery rate, as outlined in Table 2. Throughout the study, the UF and CCRO feed flow rates were maintained at 28.2 m3/h (124 gal/min) and 15.9 m3/h (70 gal/min), respectively; the UF and CCRO flux were kept at 47.8 L/m2/h (28.8 gal/ft2/d) and 16.6 L/m2/h (10 gal/ft2/d), respectively. During each operational phase, water quality samples were systematically collected from the CCRO pilot skid, including UF influent, CCRO influent, CCRO permeate, and CCRO concentrate, as shown in Figure 1. Samples of UF influent and CCRO influent were directly obtained from their respective valves during each sampling event. For the CCRO permeate and CCRO concentrate, samples were collected in four-gallon, high-quality stainless-steel containers over two consecutive CCRO operating cycles to ensure accuracy and then transferred into clean glass jars. The samples were immediately stored in an icebox and delivered the same day to a local certified water quality laboratory for analysis. On-site measurements were taken for parameters like temperature, pH, electrical conductivity (EC), and TDSs using a calibrated handheld probe (Myron L® Company, Carlsbad, CA, USA). A detailed test plan timeline, including sampling dates, feed temperature, CCRO permeate flow rate, CCRO concentrate flow rate, and recovery rate for each operational condition, is provided in Table 2.
A total of 29 conventional parameters were selected for this study, as listed in Table S1. These parameters encompassed 9 general water quality parameters (pH, temperature, EC, TDSs, TSS, TOC, alkalinity, turbidity, and UV254), 9 anions (free residual chlorine, total residual chlorine, Cl, F, NH4, NO3, PO43−, SO42− and SiO2), 9 cations (Ba2+, Ca2+, Mg2+, Mn4+, Na+, K+, Fe3+, Al3+, and Si2+), and 2 microorganism indicators (Escherichia coli (E. coli) and total coliform). The test methods utilized for each parameter adhered to the United States Environmental Protection Agency (USEPA) guidelines, as indicated in Table S1.

2.3. Data Analyses

Percent recovery indicates the fraction of water recovered as high-quality permeate. A higher recovery percentage means that the CCRO system is diverting less water to the drain as concentrate, thereby preserving more permeate water. The formula for calculating percent recovery is as follows:
R e c o v e r y   ( % ) = P e r m e a t e   F l o w   R a t e   ( i n   G P M ) F e e d   F l o w   R a t e   ( i n   G P M ) × 100
The concentration factor (CF) in the RO system measures the degree to which dissolved solids in the RO feedwater are concentrated in the concentrate flow. It is defined as follows:
C o n c e n t r a t i o n   F a c t o r   ( C F ) = 1 / ( 1 % R e c o v e r y )
The performance of the CCRO system was evaluated by measuring the pollutant concentrations in the permeate and the membrane’s rejection efficiency. The rejection rate of the RO membrane was determined using the following calculation:
R e j e c t i o n   % = C F e e d C P e r m e a t e C F e e d × 100 %
where CFeed (in mg/L) is the feed concentration, and CPermeate (in mg/L) is the permeate concentration.
The concentration gradient across the membrane refers to the difference in the concentration of a dissolved substance in a solution between a region of high density and one of lower density, as shown in Equation (4):
C o n c e n t r a t i o n   G r a d i e n t = C F e e d   s i d e C P e r m e a t e
where CFeed side (in mg/L) is the feed concentration, and CPermeate (in mg/L) is the permeate concentration.

2.4. Statistical Analyses

Each measurement was at least triplicated. Statistical analyses were conducted using SPSS (Version 28.0.1.1) for Windows 14.0 to compute means and errors. Due to the large quantity of data collected and the similarity of data under each mode of operational recovery, in this paper, only a representative subset of the recorded data is presented for clarity and conciseness.

3. Results and Discussion

3.1. CCRO Rejection at 90% Recovery Rate

In practice, 90% is the typical upper limit recovery set for CCRO and has the greatest operational significance. Therefore, the initial performance analysis was focused on this recovery level. The water quality parameters of UF influent, CCRO influent, CCRO permeate, and CCRO concentrate at a 90% recovery rate are displayed in Table 3. At this recovery rate, the concentration factor was 10, indicating that the brine concentration was 10 times higher than the CCRO influent concentration for the same parameter. In the CCRO system, the brine concentrations for most parameters were approximately 9 times higher than their respective CCRO influent concentrations, as shown Table 3, indicating the effective operation of the CCRO system. The removal efficiencies of EC, TDSs, TOC, and alkalinity were 94.3%, 95.1%, 92.6%, and 84.8%, respectively, as also shown in Table 3. Additionally, TSS and turbidity were below detection limits in all collected samples for both CCRO influent and CCRO concentrate, indicating the successful removal of suspended particles by the UF pretreatment system.
The pH values measured in the CCRO influent, CCRO permeate, and CCRO concentrate streams were 6.3, 5.5, and 7.1, respectively, with corresponding temperatures of 20.9 °C, 19.6 °C, and 19.3 °C, as shown in Table 3. It is notable that the pH value in the CCRO permeate stream was slightly lower compared to the pH values in the CCRO influent and CCRO concentrate streams. This difference can be attributed to the inefficiency of the RO system in removing gasses such as CO2, which can permeate through the RO membrane due to their low molecular weight and lack of ionization in aqueous solutions [32]. Consequently, the pH level in the CCRO permeate is influenced by the CO2 levels in the feed water, as the CO2 content is converted into carbonic acid (H2CO3).
In terms of anions, both chloride and fluoride fall under the category of halogens, with the CCRO removal rates of chloride and fluoride recorded as 96.3% and 100%, respectively, as shown in Table 3. Despite chloride having a larger atomic radius and a molecular weight of 35.4 g/mol compared to fluoride’s molecular weight of 19.0 g/mol, the CCRO removal rate of chloride was lower than that of fluoride. This disparity may be attributed to the larger concentration gradient of chloride ions across the RO membrane compared to fluoride ions [32]. In the CCRO influent, the concentration of chloride ions was 120 mg/L, which was significantly higher than the 0.18 mg/L concentration of fluoride ions. Consequently, in the CCRO permeate flow, chloride was detected at 4.4 mg/L while fluoride was below the detection limit. The concentration gradient of chloride ions was notably higher at 115.6 mg/L, which was approximately 600 times greater than that of fluoride.
The removal rate of nitrate was recorded at 79.6%, which was lower than the 99.7% removal rate of sulfate. This discrepancy can be elucidated by differences in the atomic radii and ionic charges of these ions, as detailed in Table 2. Sulfate, being divalent with a higher molecular weight of 96 g/mol, exhibits a higher removal rate compared to nitrate, which is monovalent with a molecular weight of 62 g/mol. Generally, RO membranes demonstrate better rejection rates against divalent ions than monovalent ions [33].
In terms of cations, the study revealed a better rejection of divalent ions (e.g., Ca2+ and Mg2+) compared to monovalent ions (e.g., Na+ and K+). The CCRO removal rates of calcium and magnesium were recorded at 99.7% and 100%, respectively, whereas the removal rates of sodium and potassium were slightly lower at 93.0% and 92.9%, respectively, as shown in Table 3. RO membranes reject contaminants based on their size (atomic radius) and valency [34]. Contaminants with higher molecular weights are less likely to pass through the RO membrane [32]. Additionally, solutes with higher ionic valence are less likely to permeate the membrane efficiently [35]. Sodium and potassium ions, being monovalent, are not rejected as efficiently as calcium and magnesium, which are divalent. The CCRO removal rate of magnesium, in particular, was noted as 100%, possibly due to its lower concentration gradient (6.92 mg/L) compared to sodium (102.3 mg/L) and potassium (15.8 mg/L) [35].

3.2. Performance of CCRO Removal at Increased Recovery Rates

As anticipated, the removal of EC, TDS, alkalinity, Cl, NO3, Na+, and K+ exhibited a decrease with the increase in recovery rate, as evidenced in Table 4 and Table 5. Notably, the study revealed a sharp decline in the rejection efficiency of alkalinity, reaching a relatively low value of 19% on 3 February 2021, at the 95% recovery rate. This decline could be attributed to the concentration gradient of alkalinity across the membrane, which measured 1.5 mg/L on 3 February 2021, and 0.2 mg/L on 17 February 2021. Similarly, the diminished concentration gradient resulted in inaccuracies for alkalinity and fluoride measurements (Table 4 and Table 5). The skewed alkalinity data may also be attributed to increasing CO2 levels in the feed water, as dissolved CO2 is converted into H2CO3. Since alkalinity is defined based on the equivalent concentrations of carbonate (CO32−) and bicarbonate (HCO3), fluctuations in CO2 levels can influence alkalinity measurements.
The removal rate of TOC was noted as 100% and 90% at recovery rates of 95% and 94%, respectively, as outlined in Table 4. With respect to fluoride, all rejection rates ranged from 90% to 95%. Recovery rates were recorded as 100%, except for the 95% recovery rate observed on 3 February 2021 (Table 4). Despite the anticipated 100% rejection rate due to the lower concentration gradient, occasional errors were encountered.
Furthermore, this study underscored the CCRO system’s superior removal rate for divalent cations and anions compared to monovalent ions. Similarly, contaminants with larger ionic sizes were less likely to permeate the RO membrane. The membrane effectively removed almost all available sulfate, calcium, and magnesium across all recovery rates, demonstrating stable recovery rates for these parameters without any discernible downward trend (Table 5).

3.3. Influence of Elevated Recovery Rate on General Water Quality Parameters

Across the four tested water quality parameters, it was observed that increasing the recovery rate during CCRO operation generally led to a decrease in removal from the water (Table 6). As the recovery rate increased, the concentration of contaminants in the concentrate stream also increased. This heightened concentration at the membrane surface can lead to concentration polarization, where the concentration of contaminants near the membrane surface becomes higher than that in the bulk solution. This can reduce the driving force for mass transfer across the membrane, decreasing the removal efficiency of chemicals [36]. Meanwhile, at higher recovery rates, there is a greater likelihood of reaching the saturation point of the membrane, where it becomes unable to effectively reject additional contaminants. This saturation can occur more rapidly when the concentration of contaminants in the feedwater is higher, as is the case with increased recovery rates, leading to reduced removal [37].
The influence of the increased recovery rate was particularly significant for alkalinity (Table 6). Alkalinity is often present in water as HCO3, CO32−, and OH, which are weakly basic. These ions can easily pass through the RO membrane due to their relatively small size and low charge. As the recovery rate increases, the concentration of alkalinity ions in the feed water also rises, leading to a higher flux of these ions through the membrane and reduced removal efficiency [19]. In addition, alkalinity acts as a buffer in water, helping to resist changes in pH. Higher concentrations of alkalinity ions in the feed water can increase the buffering capacity, making it more challenging for the RO system to remove alkalinity effectively at elevated recovery rates [5].

3.4. Influence of Elevated Recovery Rate on the Removal of Various Ions

The elevated recovery rate during CCRO operation also exerted a detrimental effect on the removal of various cations and anions, which is particularly noticeable for NO3 (Table 7). The intensified recovery rates can foster heightened competition among ions for sorption sites on the membrane surface, resulting in the diminished uptake of specific ions, such as NO3, as they contend with others for binding sites. Consequently, this competition may reduce the removal efficiency [38]. Furthermore, escalated recovery rates may induce alterations in membrane properties, such as charge characteristics or surface chemistry. These modifications can disrupt the membrane’s affinity for specific ions, potentially leading to decreased removal efficiency for certain species like NO3 [39].
At the same time, it is noteworthy that the removal rates of Ca2+, Na+, SO42−, and F were minimally affected by the increased recovery rate. Ca2+ and Na+ ions are commonly found in water as divalent and monovalent cations, respectively. They possess relatively large ionic radii and moderate charge densities, rendering them less susceptible to concentration polarization near the membrane surface compared to smaller ions [37]. Additionally, Ca2+ and Na+ ions may not readily adhere to the membrane or precipitate as scaling compounds, thus resulting in minimal impact on their removal efficiency with increasing recovery rate [40,41]. Fluoride ions (F), despite their small size and negative charge, may have limited interactions with the RO membrane [42]. Recent studies have demonstrated the efficient removal of SO42− by UF processes at a rate of 99% [43]. In this study, the feed water underwent UF treatment prior to CCRO, effectively removing SO42− ions and significantly reducing the likelihood of fouling or scaling under high-recovery conditions.

4. Conclusions

This pilot study successfully demonstrated the feasibility of operating a water reclamation membrane process using tertiary effluent at high recovery rates. Notably, the results highlighted the UF pretreatment system’s efficacy in eliminating all suspended particles from the CCRO influent stream. Moreover, the study underscored that pressure-driven CCRO membrane processes exhibit superior rejection against divalent ions compared to monovalent ions. The concentration gradient emerged as a potential factor influencing the removal rate of contaminants; lower concentration gradients facilitated higher rejection rates for the constituents under study. Interestingly, while recovery rates ranged from 90% to 95%, not all parameter rejection rates decreased with increasing recovery rates. Overall, the CCRO system operated efficiently, exhibiting robust performance in the removal of particles, anions, and cations.
This work contributes meaningfully to the advancement of sustainable water management by promoting the reuse of treated wastewater—a critical solution to address global freshwater scarcity. By demonstrating the technical feasibility of achieving high recovery rates with consistent water quality, the study supports the development of more resource-efficient water reuse systems that align with the United Nations Sustainable Development Goals (SDGs), particularly those related to clean water and sanitation (SDG 6), sustainable cities (SDG 11), and climate action (SDG 13). From a socio-economic perspective, improving water recovery efficiency helps to reduce dependence on energy-intensive freshwater sources, thus lowering operational costs and expanding access to affordable reclaimed water. The findings offer valuable insights into membrane process optimization and contaminant behavior, supporting integrated approaches to water resource management that balance environmental protection and economic viability.

Supplementary Materials

The following supporting information can be downloaded at: https://www.mdpi.com/article/10.3390/su17083388/s1, Table S1. General information and test methods for twenty-nine conventional parameters.

Author Contributions

Conceptualization, M.S.; methodology, J.H., S.S., D.A. and M.S.; software, J.H., S.L., D.A. and M.S.; validation, J.H., S.L., S.S., D.A. and M.S.; formal analysis, J.H. and D.A.; investigation, J.H. and M.S.; resources, S.D., S.S., D.A., J.M. and M.S.; data curation, J.H., S.L. and M.S.; writing—original draft preparation, J.H. and S.L.; writing—review and editing, S.L., S.D., S.S., D.A., J.M. and M.S.; visualization, J.H. and S.L.; supervision, S.L., D.A. and M.S.; project administration, S.S., D.A., J.M. and M.S.; funding acquisition, S.D., J.M. and M.S. All authors have read and agreed to the published version of the manuscript.

Funding

This research study was funded by the Eastern Municipal Water District (Perris, CA, USA) through Agreement No. 119632 and by the United States Bureau of Reclamation (USBR) through Agreement No. R20AC00007 to California State Polytechnic University Pomona (Pomona, CA, USA).

Institutional Review Board Statement

Not applicable.

Informed Consent Statement

Not applicable.

Data Availability Statement

The raw data supporting the conclusions of this article will be made available by the authors on request.

Acknowledgments

The authors are grateful for the generous support provided by the EMWD and the USBR. The authors are also grateful to the anonymous reviewers and academic editor for the improvements achieved from their insightful suggestions throughout the revision of the paper.

Conflicts of Interest

The authors declare no conflicts of interest. The funders had no role in the design of the study; in the collection, analyses, or interpretation of data; in the writing of the manuscript; or in the decision to publish the results.

References

  1. Cordoba, S.; Das, A.; Leon, J.; Garcia, J.M.; Warsinger, D.M. Double-acting batch reverse osmosis configuration for best-in-class efficiency and low downtime. Desalination 2021, 506, 114959. [Google Scholar] [CrossRef]
  2. Capodaglio, A.G. Urban Water Supply Sustainability and Resilience under Climate Variability: Innovative Paradigms, Approaches and Technologies. ACS EST Water 2024, 4, 5185–5206. [Google Scholar] [CrossRef]
  3. Angelakis, A.N.; Tchobanoglous, G.; Capodaglio, A.G.; Tzanakakis, V.A. The importance of nonconventional water resources under water scarcity. Water 2024, 16, 1015. [Google Scholar] [CrossRef]
  4. Okampo, E.J.; Nwulu, N. Optimisation of renewable energy powered reverse osmosis desalination systems: A state-of-the-art review. Renew. Sustain. Energy Rev. 2021, 140, 110712. [Google Scholar] [CrossRef]
  5. Edalat, A.; Hoek, E.M. Techno-economic analysis of RO desalination of produced water for beneficial reuse in California. Water 2020, 12, 1850. [Google Scholar] [CrossRef]
  6. Sun, W.; Zhang, Y.; Lu, Z.; Ke, Y.; Wang, X.; Wu, J. Fate of naturally dissolved organic matter and synthetic organic compounds subjected to drinking water treatment using membrane, activated carbon, and UV/H2O2 technologies. Environ. Sci. Technol. 2023, 57, 5558–5568. [Google Scholar] [CrossRef]
  7. Kim, D.-H.; Park, S.; Yoon, Y.; Park, C.M. Removal of total dissolved solids from reverse osmosis concentrates from a municipal wastewater reclamation plant by aerobic granular sludge. Water 2018, 10, 882. [Google Scholar] [CrossRef]
  8. Chen, A.S.; Wang, L.; Sorg, T.J.; Lytle, D.A. Removing arsenic and co-occurring contaminants from drinking water by full-scale ion exchange and point-of-use/point-of-entry reverse osmosis systems. Water Res. 2020, 172, 115455. [Google Scholar] [CrossRef]
  9. Warsinger, D.M.; Swaminathan, J.; Guillen-Burrieza, E.; Arafat, H.A. Scaling and fouling in membrane distillation for desalination applications: A review. Desalination 2015, 356, 294–313. [Google Scholar] [CrossRef]
  10. Linge, K.L.; Blair, P.; Busetti, F.; Rodriguez, C.; Heitz, A. Chemicals in reverse osmosis-treated wastewater: Occurrence, health risk, and contribution to residual dissolved organic carbon. J. Water Supply Res. Technol.—AQUA 2012, 61, 494–505. [Google Scholar] [CrossRef]
  11. Tawalbeh, M.; Qalyoubi, L.; Al-Othman, A.; Qasim, M.; Shirazi, M. Insights on the development of enhanced antifouling reverse osmosis membranes: Industrial applications and challenges. Desalination 2023, 553, 116460. [Google Scholar] [CrossRef]
  12. Plakas, K.V.; Karabelas, A.J. Removal of pesticides from water by NF and RO membranes—A review. Desalination 2012, 287, 255–265. [Google Scholar] [CrossRef]
  13. Capodaglio, A.G. Fit-for-purpose urban wastewater reuse: Analysis of issues and available technologies for sustainable multiple barrier approaches. Crit. Rev. Environ. Sci. Technol. 2021, 51, 1619–1666. [Google Scholar] [CrossRef]
  14. Sedlak, D.L. The unintended consequences of the reverse osmosis revolution. Environ. Sci. Technol. 2019, 53, 3999–4000. [Google Scholar] [CrossRef]
  15. Markus, M.R.; Deshmukh, S.S. World Environmental and Water Resources Congress 2010: Challenges of Change. In An Innovative Approach to Water Supply—The Groundwater Replenishment System; American Society of Civil Engineers: Reston, VA, USA, 2010; pp. 3624–3639. [Google Scholar]
  16. Tang, C.Y.; Yang, Z.; Guo, H.; Wen, J.J.; Nghiem, L.D.; Cornelissen, E. Potable water reuse through advanced membrane technology. Environ. Sci. Technol. 2018, 52, 10215–10223. [Google Scholar] [CrossRef]
  17. Maddah, H.; Chogle, A. Biofouling in reverse osmosis: Phenomena, monitoring, controlling and remediation. Appl. Water Sci. 2017, 7, 2637–2651. [Google Scholar] [CrossRef]
  18. Ikehata, K.; Zhao, Y.; Kulkarni, H.V.; Li, Y.; Snyder, S.A.; Ishida, K.P.; Anderson, M.A. Water recovery from advanced water purification facility reverse osmosis concentrate by photobiological treatment followed by secondary reverse osmosis. Environ. Sci. Technol. 2018, 52, 8588–8595. [Google Scholar] [CrossRef]
  19. Warsinger, D.M.; Tow, E.W.; Nayar, K.G.; Maswadeh, L.A. Energy efficiency of batch and semi-batch (CCRO) reverse osmosis desalination. Water Res. 2016, 106, 272–282. [Google Scholar] [CrossRef]
  20. Gu, H.; Polanco, J.; Ishida, K.P.; Plumlee, M.H.; Boyd, M.; Desormeaux, E.; Juby, G.J.; Shad, M.F. Permeate quality, advanced oxidation process treatability, and cost for two concentrate treatment technologies to enhance recovery for potable reuse. Water Reuse 2023, 13, 305–318. [Google Scholar] [CrossRef]
  21. Gu, H.; Plumlee, M.H.; Li, M.; Mohseni, A.; Erlitzki, R. Enhancing municipal potable reuse recovery with flow-reversal RO: Pilot study, challenges, and retrofit considerations. Desalination 2025, 601, 118594. [Google Scholar] [CrossRef]
  22. Gu, H.; Plumlee, M.H.; Boyd, M.; Hwang, M.; Lozier, J.C. Operational optimization of closed-circuit reverse osmosis (CCRO) pilot to recover concentrate at an advanced water purification facility for potable reuse. Desalination 2021, 518, 115300. [Google Scholar] [CrossRef]
  23. Li, S.; Duran, K.; Delagah, S.; Mouawad, J.; Jia, X.; Sharbatmaleki, M. Energy efficiency of staged reverse osmosis (RO) and closed-circuit reverse osmosis (CCRO) desalination: A model-based comparison. Water Supply 2020, 20, 3096–3106. [Google Scholar] [CrossRef]
  24. Nayar, K.G. Brackish water desalination for greenhouse agriculture: Comparing the costs of RO, CCRO, EDR, and monovalent-selective EDR. Desalination 2020, 475, 114188. [Google Scholar] [CrossRef]
  25. Giagnorio, M.; Morciano, M.; Zhang, W.; Hélix-Nielsen, C.; Fasano, M.; Tiraferri, A. Coupling of forward osmosis with desalination technologies: System-scale analysis at the water-energy nexus. Desalination 2022, 543, 116083. [Google Scholar] [CrossRef]
  26. Mansell, B.; Ackman, P.; Tang, C.; Friess, P. Pilot-Scale Evaluation of the Closed-Circuit Desalination Process for Minimizing RO Concentrate Disposal Volume. In Proceedings of the WateReuse California Annual Conference, Los Angeles, CA, USA, 15–17 March 2015. [Google Scholar]
  27. Wang, S.; Aflaki, R.; Ruiz, M.; Broley, W.; Ingalsbe, M.; Trussell, B. How much concentrate can you squeeze with closed circuit desalination and what to consider. In Proceedings of the American Water Works Association/American Membrane Technology Association Membrane Technology Conference & Exposition, West Palm Beach, FL, USA, 12 March 2018. [Google Scholar]
  28. Idica, E.; Faulkner, B.; Sen, S.; Trussell, R. RO Brine Minimization for Potable Reuse at Padre Dam Municipal Water District. In Proceedings of the IWA 2017 Annual Conference, Long Beach, CA, USA, 23–27 July 2017. [Google Scholar]
  29. Huang, J.; Li, S.; Delagah, S.; Stone, S.; Mouawad, J.; Sharbatmaleki, M. Assessing closed-circuit reverse osmosis (CCRO) efficiency in removing contaminants of emerging concern (CECs) in a high-recovery water reclamation pilot study. Water Pract. Technol. 2025, 20, 314–323. [Google Scholar] [CrossRef]
  30. Cha, D.; Park, H.; Kim, S.; Lim, J.-L.; Kang, S.; Kim, C.-H. A statistical approach to analyze factors affecting silt density index. Desalination Water Treat. 2012, 45, 276–283. [Google Scholar] [CrossRef]
  31. Anis, S.F.; Hashaikeh, R.; Hilal, N. Reverse osmosis pretreatment technologies and future trends: A comprehensive review. Desalination 2019, 452, 159–195. [Google Scholar] [CrossRef]
  32. Liu, W.; Livingston, J.L.; Wang, L.; Wang, Z.; del Cerro, M.; Younssi, S.A.; Epsztein, R.; Elimelech, M.; Lin, S. Pressure-driven membrane desalination. Nat. Rev. Methods Primers 2024, 4, 10. [Google Scholar] [CrossRef]
  33. Shin, M.G.; Kwon, S.J.; Park, H.; Park, Y.-I.; Lee, J.-H. High-performance and acid-resistant nanofiltration membranes prepared by solvent activation on polyamide reverse osmosis membranes. J. Membr. Sci. 2020, 595, 117590. [Google Scholar] [CrossRef]
  34. Cui, Y.; Liu, X.-Y.; Chung, T.-S.; Weber, M.; Staudt, C.; Maletzko, C. Removal of organic micro-pollutants (phenol, aniline and nitrobenzene) via forward osmosis (FO) process: Evaluation of FO as an alternative method to reverse osmosis (RO). Water Res. 2016, 91, 104–114. [Google Scholar] [CrossRef]
  35. Nativ, P.; Fridman-Bishop, N.; Nir, O.; Lahav, O. Dia-nanofiltration-electrodialysis hybrid process for selective removal of monovalent ions from Mg2+ rich brines. Desalination 2020, 481, 114357. [Google Scholar] [CrossRef]
  36. Mousavi, S.S.; Kargari, A. Water recovery from reverse osmosis concentrate by commercial nanofiltration membranes: A comparative study. Desalination 2022, 528, 115619. [Google Scholar] [CrossRef]
  37. Alshami, A.; Taylor, T.; Ismail, N.; Buelke, C.; Schultz, L. RO system scaling with focus on the concentrate line: Current challenges and potential solutions. Desalination 2021, 520, 115370. [Google Scholar] [CrossRef]
  38. Tepuš, B.; Simonič, M.; Petrinić, I. Comparison between nitrate and pesticide removal from ground water using adsorbents and NF and RO membranes. J. Hazard. Mater. 2009, 170, 1210–1217. [Google Scholar] [CrossRef] [PubMed]
  39. Asadollahi, M.; Bastani, D.; Musavi, S.A. Enhancement of surface properties and performance of reverse osmosis membranes after surface modification: A review. Desalination 2017, 420, 330–383. [Google Scholar] [CrossRef]
  40. Rahman, F. Calcium sulfate precipitation studies with scale inhibitors for reverse osmosis desalination. Desalination 2013, 319, 79–84. [Google Scholar] [CrossRef]
  41. Ashfaq, M.Y.; Al-Ghouti, M.A.; Da’na, D.A.; Qiblawey, H.; Zouari, N. Effect of concentration of calcium and sulfate ions on gypsum scaling of reverse osmosis membrane, mechanistic study. J. Mater. Res. Technol. 2020, 9, 13459–13473. [Google Scholar] [CrossRef]
  42. Damtie, M.M.; Woo, Y.C.; Kim, B.; Hailemariam, R.H.; Park, K.-D.; Shon, H.K.; Park, C.; Choi, J.-S. Removal of fluoride in membrane-based water and wastewater treatment technologies: Performance review. J. Environ. Manag. 2019, 251, 109524. [Google Scholar] [CrossRef]
  43. Fersi, C.; Dhahbi, M. Treatment of textile plant effluent by ultrafiltration and/or nanofiltration for water reuse. Desalination 2008, 222, 263–271. [Google Scholar] [CrossRef]
Figure 1. Process flow diagram of Purified Water Replenishment Brine Concentration Pilot Project. Orange dots indicate sampling points.
Sustainability 17 03388 g001
Table 1. Technical data of ultrafiltration (UF) and reverse osmosis (RO) elements.
Parameters/DescriptionsUltrafiltration (UF) ElementsReverse Osmosis (RO) Elements
Quantity825 (in one-stage CCRO module)
Manufacturer and module nameToray Membrane, HFU-2020ANDuPont, FilmTecTM FortilifeTM CR100
Membrane materialPVDF (polyvinylidene fluoride)Polyamide thin-film composite
Dimensions (in mm)Length: 2160; inner diameter: 216Length: 1016; inner diameter: 29
Nominal pore size (in µm)0.010.0001
Membrane active area (m2)7237.1
Nominal operating TMP (in kPa)0–200 0–103 (min. 4 elements per pressure vessel)
Maximum inlet pressure (in kPa)3004137
Maximum temperature (in °C)4045
pH range1–10 (during filtration)2–11 (continuous operation)
Maximum air flow (Nm3/h)9.0n/a
Maximum filtrate flow (m3/h)12.017.0
Table 2. Feed water temperature, CCRO permeate flow rate, and concentrate flow rate recorded at various recovery rates. Due to the large quantity of data, and the small variation therein, under each targeted recovery rate, here, only a representative subset of the recorded data is presented for clarity and conciseness.
Sample DateRecovery Rate (%)Feed Water Temperature
(°C)
CCRO Permeate Flow Rate (m3/h)CCRO Concentrate Flow Rate (m3/h)
28 October 20209020.514.3322.30
4 November 20209023.614.4122.28
2 December 20209019.414.2622.21
16 December 20209219.214.6321.99
22 December 20209219.114.7021.73
4 January 20219218.414.5122.08
11 January 20219318.614.8128.44
16 January 20219318.914.7428.23
20 January 20219318.714.7928.25
23 January 20219417.214.9729.09
27 January 20219417.614.9429.14
1 February 20219417.314.8829.02
3 February 20219520.015.1029.53
17 February 20219519.115.1129.51
1 May 20219525.615.2429.80
Table 3. The water quality and removal efficiency (when applicable) in the CCRO system at 90% recovery rate.
Parameters and UnitsUF InfluentCCRO InfluentCCRO PermeateCCRO ConcentrateCCRO Removal (%)Concentration GradientCBrine/CInfluent
pH7.376.35.57.12NANANA
Temperature, °C19.420.919.619.3NANANA
Electrical conductivity (EC), µs/cm959101858725094.39607.1
Total dissolved solids (TDSs), mg/LNS59029550095.15619.3
Total suspended solids (TSS), mg/LNSNDNSNDNANANA
Total organic carbon (TOC), mg/LNS4.70.354792.64.3510.0
Alkalinity, mg/L as CaCO3NS629.444084.852.67.1
Turbidity, NTU0.35NDNDNDNANANA
UV 254, % transmission80.280.597.7NSNANANA
Free chlorine residual, mg/L as Cl22.40.43NSNSNANANA
Total chlorine residual, mg/L as Cl23.91.3NSNSNANANA
Total chloride (Cl), mg/LNS1204.4120096.3115.610.0
Total fluoride (F), mg/LNS0.18ND2.2100.00.1812.2
Nitrate, mg/L as NO3-NNS9.31.97579.67.48.1
Total phosphorus, mg/L as PO43−NS0.56NS8.3NANANA
Sulfate, mg/L as SO42−NS1800.5180099.7179.510.0
Total silica, mg/L as SiO2NS23NS210NANANA
Ammonia, mg/L as NH4+-NNS8.9NS1.3NANANA
Total barium (Ba2+), mg/LNS0.036NS0.36NANANA
Total Calcium (Ca2+), mg/LNS50.70.13350399.750.69.9
Total magnesium (Mg2+), mg/LNS6.92ND64.9100.06.929.4
Total manganese (Mn4+), mg/LNS0.0051NS0.076NANANA
Total sodium (Na+), mg/LNS1107.799093.0102.39.0
Total potassium (K+), mg/LNS171.216092.915.89.4
Total iron (Fe3+), mg/LNS0.052NS0.43NANANA
Total aluminum (Al3+), mg/LNSNDNSNDNANANA
Total strontium (Si2+), mg/LNS0.31NS3NANANA
E. coli, MPN/100 mLNDNDNDNSNANANA
Total coliform, MPN/100 mLNDNDNDNSNANANA
NA: not applicable; ND: not detected; NS: not sampled; MPN: most probable number.
Table 4. Removal rates of general water quality parameters across various recovery rates.
ParametersConductivityTotal Dissolved SolidsTotal Organic CarbonAlkalinity as CaCO3
DateRecovery RateECTDSTOC-
28 October 202090%84.3%95.3%93.9%89.3%
4 November 202090%92.8%95.7%94.2%88.1%
2 December 202090%94.3%95.1%92.6%84.8%
16 December 202092%93.3%96.1%84.1%91.6%
22 December 202092%92.8%94.8%89.0%86.3%
4 January 202192%91.3%94.7%89.5%84.7%
11 January 202193%90.3%92.5%86.3%75.7%
16 January 202193%91.1%91.3%88.9%78.5%
20 January 202193%92.7%92.2%89.6%72.4%
23 January 202194%90.1%90.2%89.2%73.3%
27 January 202194%92.4%91.7%88.1%77.7%
1 February 202194%89.7%90.4%89.1%76.3%
3 February 202195%90.8%89.5%-19.0%
17 February 202195%90.9%90.0%92.4%-
1 May 202195%87.3%88.6%89.8%23.8%
Table 5. Removal rates of anions and cations at various recovery rates.
ParametersChloride, TotalFluoride, TotalNitrate as NSulfate as SO42−Calcium, TotalMagnesium, TotalSodium, TotalPotassium, Total
DateRecovery RateClFNO3SO42−Ca2+Mg2+Na+K+
28 October 202090%96.0%100.0%78.7%99.6%99.5%100.0%92.5%90.5%
4 November 202090%95.9%100.0%76.4%99.6%99.6%100.0%91.5%91.1%
2 December 202090%96.3%100.0%79.6%99.7%99.7%100.0%93.0%92.9%
16 December 202092%95.9%100.0%75.0%99.5%99.7%100.0%91.5%92.0%
22 December 202092%96.1%100.0%75.9%99.7%99.6%100.0%92.2%92.3%
4 January 202192%95.8%100.0%75.2%99.5%99.6%100.0%91.3%91.8%
11 January 202193%94.1%100.0%69.6%99.8%99.8%100.0%91.6%90.7%
16 January 202193%94.5%100.0%68.8%99.7%99.7%100.0%90.5%91.1%
20 January 202193%94.2%100.0%69.2%99.7%99.7%100.0%89.1%90.5%
23 January 202194%93.2%100.0%66.5%99.6%99.8%100.0%89.7%90.2%
27 January 202194%93.8%100.0%65.0%99.6%99.7%100.0%90.0%90.5%
1 February 202194%93.5%100.0%65.7%99.4%99.8%100.0%90.5%90.1%
3 February 202195%92.0%-60.8%99.6%100.0%100.0%86.4%86.5%
17 February 202195%90.7%100.0%56.3%99.5%100.0%100.0%85.5%85.8%
1 May 202195%91.1%100.0%58.1%99.5%100.0%100.0%85.9%85.1%
Table 6. Impact of elevated recovery rate on major general water quality parameters.
Recovery Rate (%)EC Removal (%)TDS Removal (%)TOC Removal (%)Alkalinity Removal (%)
9093.55 ± 2.6495.37 ± 1.9393.57 ± 1.5487.40 ± 4.21
9293.30 ± 1.8696.10 ± 2.9184.10 ± 3.6991.60 ± 3.72
9392.70 ± 2.0192.20 ± 2.1789.60 ± 2.9672.40 ± 5.56
9492.40 ± 1.3791.70 ± 1.8588.10 ± 3.1377.70 ± 3.18
9590.85 ± 1.7589.75 ± 2.2196.20 ± 2.7219.00 ± 2.13
Table 7. Impact of elevated recovery rates on the removal of various cations and anions.
Recovery Rate (%)Cl Removal (%)F Removal (%)NO3 Removal (%)SO42− Removal (%)Ca2+ Removal (%)Na+ Removal (%)
9096.07 ± 2.5199.75 ± 0.2178.23 ± 3.2899.63 ± 0.3299.60 ± 0.1299.83 ± 0.13
9295.90 ± 1.8399.72 ± 0.1875.00 ± 2.7799.50 ± 0.2799.71 ± 0.1799.77 ± 0.18
9394.20 ± 2.1899.61 ± 0.3169.20 ± 3.0399.70 ± 0.1899.70 ± 0.2399.81 ± 0.15
9493.80 ± 1.5799.63 ± 0.2865.00 ± 2.8599.60 ± 0.2199.68 ± 0.2299.75 ± 0.20
9591.35 ± 1.9199.58 ± 0.2458.55 ± 3.1299.55 ± 0.2399.87 ± 0.1499.68 ± 0.31
Disclaimer/Publisher’s Note: The statements, opinions and data contained in all publications are solely those of the individual author(s) and contributor(s) and not of MDPI and/or the editor(s). MDPI and/or the editor(s) disclaim responsibility for any injury to people or property resulting from any ideas, methods, instructions or products referred to in the content.

