Review

Application of GIS in the Maritime-Port Sector: A Systematic Review

by
Crismeire Isbaex
1,
Francisco dos Reis Fernandes Costa
2 and
Teresa Batista
1,*
1
MED—Mediterranean Institute for Agriculture, Environment and Development & CHANGE—Global Change and Sustainability Institute, Institute for Advanced Research and Training, University of Évora, P.O. Box 94, 7002-544 Évora, Portugal
2
GEOPOINT, 1250-096 Lisboa, Portugal
*
Author to whom correspondence should be addressed.
Sustainability 2025, 17(8), 3386; https://doi.org/10.3390/su17083386
Submission received: 6 March 2025 / Revised: 2 April 2025 / Accepted: 7 April 2025 / Published: 10 April 2025

Abstract

:
In port management, the integration of geographic information systems (GIS) is essential for geospatial analysis in a complex environment shaped by digitalisation and energy transition. Although the adoption of GIS and spatial data infrastructures (SDI) are growing, their use remains with challenges in interoperability and collaborative data management. This study conducts a systematic review to identify the main publications from the past 10 years on the use of GIS and SDI in the maritime sector, using the Scopus and Web of Science databases. The results revealed an annual growth of 8.59% in scientific publications over the past decade, with a focus on environmental monitoring, machine learning, and digitalisation. The findings also suggest the limited use of SDI in the maritime sector, reinforcing the need for future research on interoperability and spatial data integration. Nevertheless, the main trends include the integration of GIS with machine learning, advanced spatial applications, and artificial intelligence, showing an increasing focus on sustainability, environmental monitoring, and innovative management systems.

1. Introduction

Maritime transportation, responsible for over 80% of global trade in 2022, is a strategic sector that demands constant monitoring of cargo, passenger, and tourism activities by stakeholders [1]. In the maritime environment, management and control are conducted through digital port management systems that can integrate information from terrestrial, maritime, aerial sensors, and satellites. In this context, geographic information systems (GIS) have been widely used to enhance management systems and collaborative platforms, increasing port visibility, reliability, and efficiency, and promoting regulatory compliance and transparency, which results in a competitive advantage [1,2,3]. GIS is fundamental in collecting and processing heterogeneous data in real time to optimise operations, monitor traffic, coastal development, security, and environmental protection. The integration of GIS in spatial data infrastructures, WebGIS, interactive maps, and monitoring dashboards is one of the ways to ensure interoperability and transparency among stakeholders.
In the maritime sector, GIS has evolved beyond being just a visualisation resource, mapping tool, or navigability analysis system. This tool has expanded its capacity to simultaneously integrate and share multiple resources and heterogeneous data among several stakeholders [4]. In the literature, GIS has been applied to optimise diverse areas, such as maritime spatial planning (MSP) to enhance facilities and key asset management, navigation safety, environmental protection, combating piracy and terrorism, and economic efficiency [5,6,7]. With geospatial analysis tools combined with a comprehensive geographic visualisation interface, maritime GIS facilitates port infrastructure planning, special economic zone administration, and the integration of crucial data, such as ship tracking [8], navigation routes [9], including decision support systems such as TurboRouter, used for fleet route planning [10], real-time maritime traffic control [11,12], container monitoring [13,14,15], security [16,17], maritime ecosystem protection [18,19], bathymetry [20], weather conditions [21], port management decision making [22,23], and also through the adoption of new trends such as smartport, greenport, smartberth, and digital twins [24,25]. With advances in energy transition and digitalisation optimising stakeholder decision making, maritime GIS enables the simulation of future scenarios, supporting renewable energy integration projects and carbon footprint management, fundamental elements for building smart ports [26,27].
GIS provides comprehensive visualisation of port operations. This includes inventory control, interface functions, navigation, and analytical activities that help monitor and optimise logistics and intermodal operations [4]. Monitoring and analysing information in the maritime context can integrate various data sources through Port Community Systems (PCS) [28], such as data from AIS (Automatic Identification System) [29], ECDIS (Electronic Chart Display and Information System) [30], MDA (Maritime Domain Awareness), and MSIL (Maritime Situational Indication Linkage) [31]. In the online Maritime Information System (MIS), for example, users can obtain information from several sources, such as Electronic Navigational Charts (ENC)/Digital Navigational Chart (DNC), C-Map server, Global Climate Observing System (GCOS), the Global Ocean Observing System (GOOS), and the Global Terrestrial Observing System (GTOS) [32]. These monitoring systems operate under the supervision of global entities such as the World Meteorological Organisation (WMO), UNESCO’s Intergovernmental Oceanographic Commission (IOC), the United Nations Environment Programme (UNEP), and the International Council for Science (ICSU) [32]. In this sense, the use of GIS resources to promote transparency in the management of port activities has emerged as a collective demand, being perceived as an ethical and political need associated with goals such as responsibility, inclusion, legitimacy, substantiation, efficient governance, and socially responsible impacts.
The value of geographic information has grown due to advances in remote sensing, telecommunications, and global positioning systems, which, integrated with the internet, facilitate the sharing of spatial data in real time or through large central databases [16,33]. In ports, which deal with large volumes of geolocated information, this represents a challenge in the analysis of large-scale geodata [34]. To manage this complexity, one solution is to adopt a spatial data infrastructure (SDI), which facilitates efficient access, use, and management of geospatial data between organisations and users, supporting decision making and planning [35,36]. Known as marine SDI, this system facilitates data management, analysis, and interoperability, with web-based functionalities, enabling fast and accurate decisions by port authorities in real time [37,38]. The digital transition and Industry 4.0 changes are also putting pressure on ports to digitise themselves in order to face competitiveness, environmental management, and traffic challenges [39], since everything that happens in a port is related to a specific geographical location. Despite advances, port management systems still face difficulties in geospatial integration, especially in communicating and sharing data in real time, which limits efficient data filtering and decision making with cartographic tools [40].
Initiatives such as the partnerships between the Port of Rotterdam and Erasmus University in the SmartPort Rotterdam project [41], the Port of Sines in Portugal and the University of Évora in the Geographical Identification and Information System—SIIG, and Agenda Nexus projects [42,43], as well as actions by the Hamburg Port Authority with Smartport [44], the optimised management of maritime schedules at the Port of Tangier [45], and the implementation of Digital Twin to monitor and optimise cargo and logistics management in the port areas of Barcelona, Algeciras, and Valencia in Spain [46], demonstrate the growing interest of the port community in driving research and the development of innovative solutions for digital transformation. These transformations have introduced new ways of managing port systems, which encompass concepts such as smart port [47], smart berth [48], and green port [25]. Digital transformation in the maritime sector encompasses the digitisation of physical assets and their integration with the internet, using advanced technologies such as blockchain [49], the Internet of Things (IoT) [50], digital twins [51], and human–machine interfaces and cyber-physical systems (CPS) [52]. These innovations enable real-time visualisation, the automation of port operations, and quasi-autonomous decision making based on big data analysis [47]. When well managed by collaborative and marine SDI systems, diverse data can be accessed by a wide range of users. However, information sharing faces challenges due to the fragmentation and complexity of marine data and observations at different scales [38]. Despite the advantages of new technologies, their adoption is not uniform among global ports, reflecting inequalities in the technological infrastructures of different regions.
In this sense, digitalisation has become a fundamental factor in maintaining and improving the competitive position of ports in the international scenario. The use of SDI and GIS in port management systems presents itself as an essential tool to achieve efficiency and sustainability. This research aims to identify the main publications from the past 10 years on the use of geographic information systems and spatial data infrastructures in the maritime sector.
The article is structured as follows. Section 2 presents the methodological development stages of the bibliometric review. Section 3 exposes the research results and discussion based on analyses performed with bibliometrix and the main scientific findings on the application of SDI and GIS in the maritime-port sector, including recommendations for future developments. Finally, Section 4 presents the main conclusions of the study, as well as perspectives and directions for future research work.

2. Materials and Methods

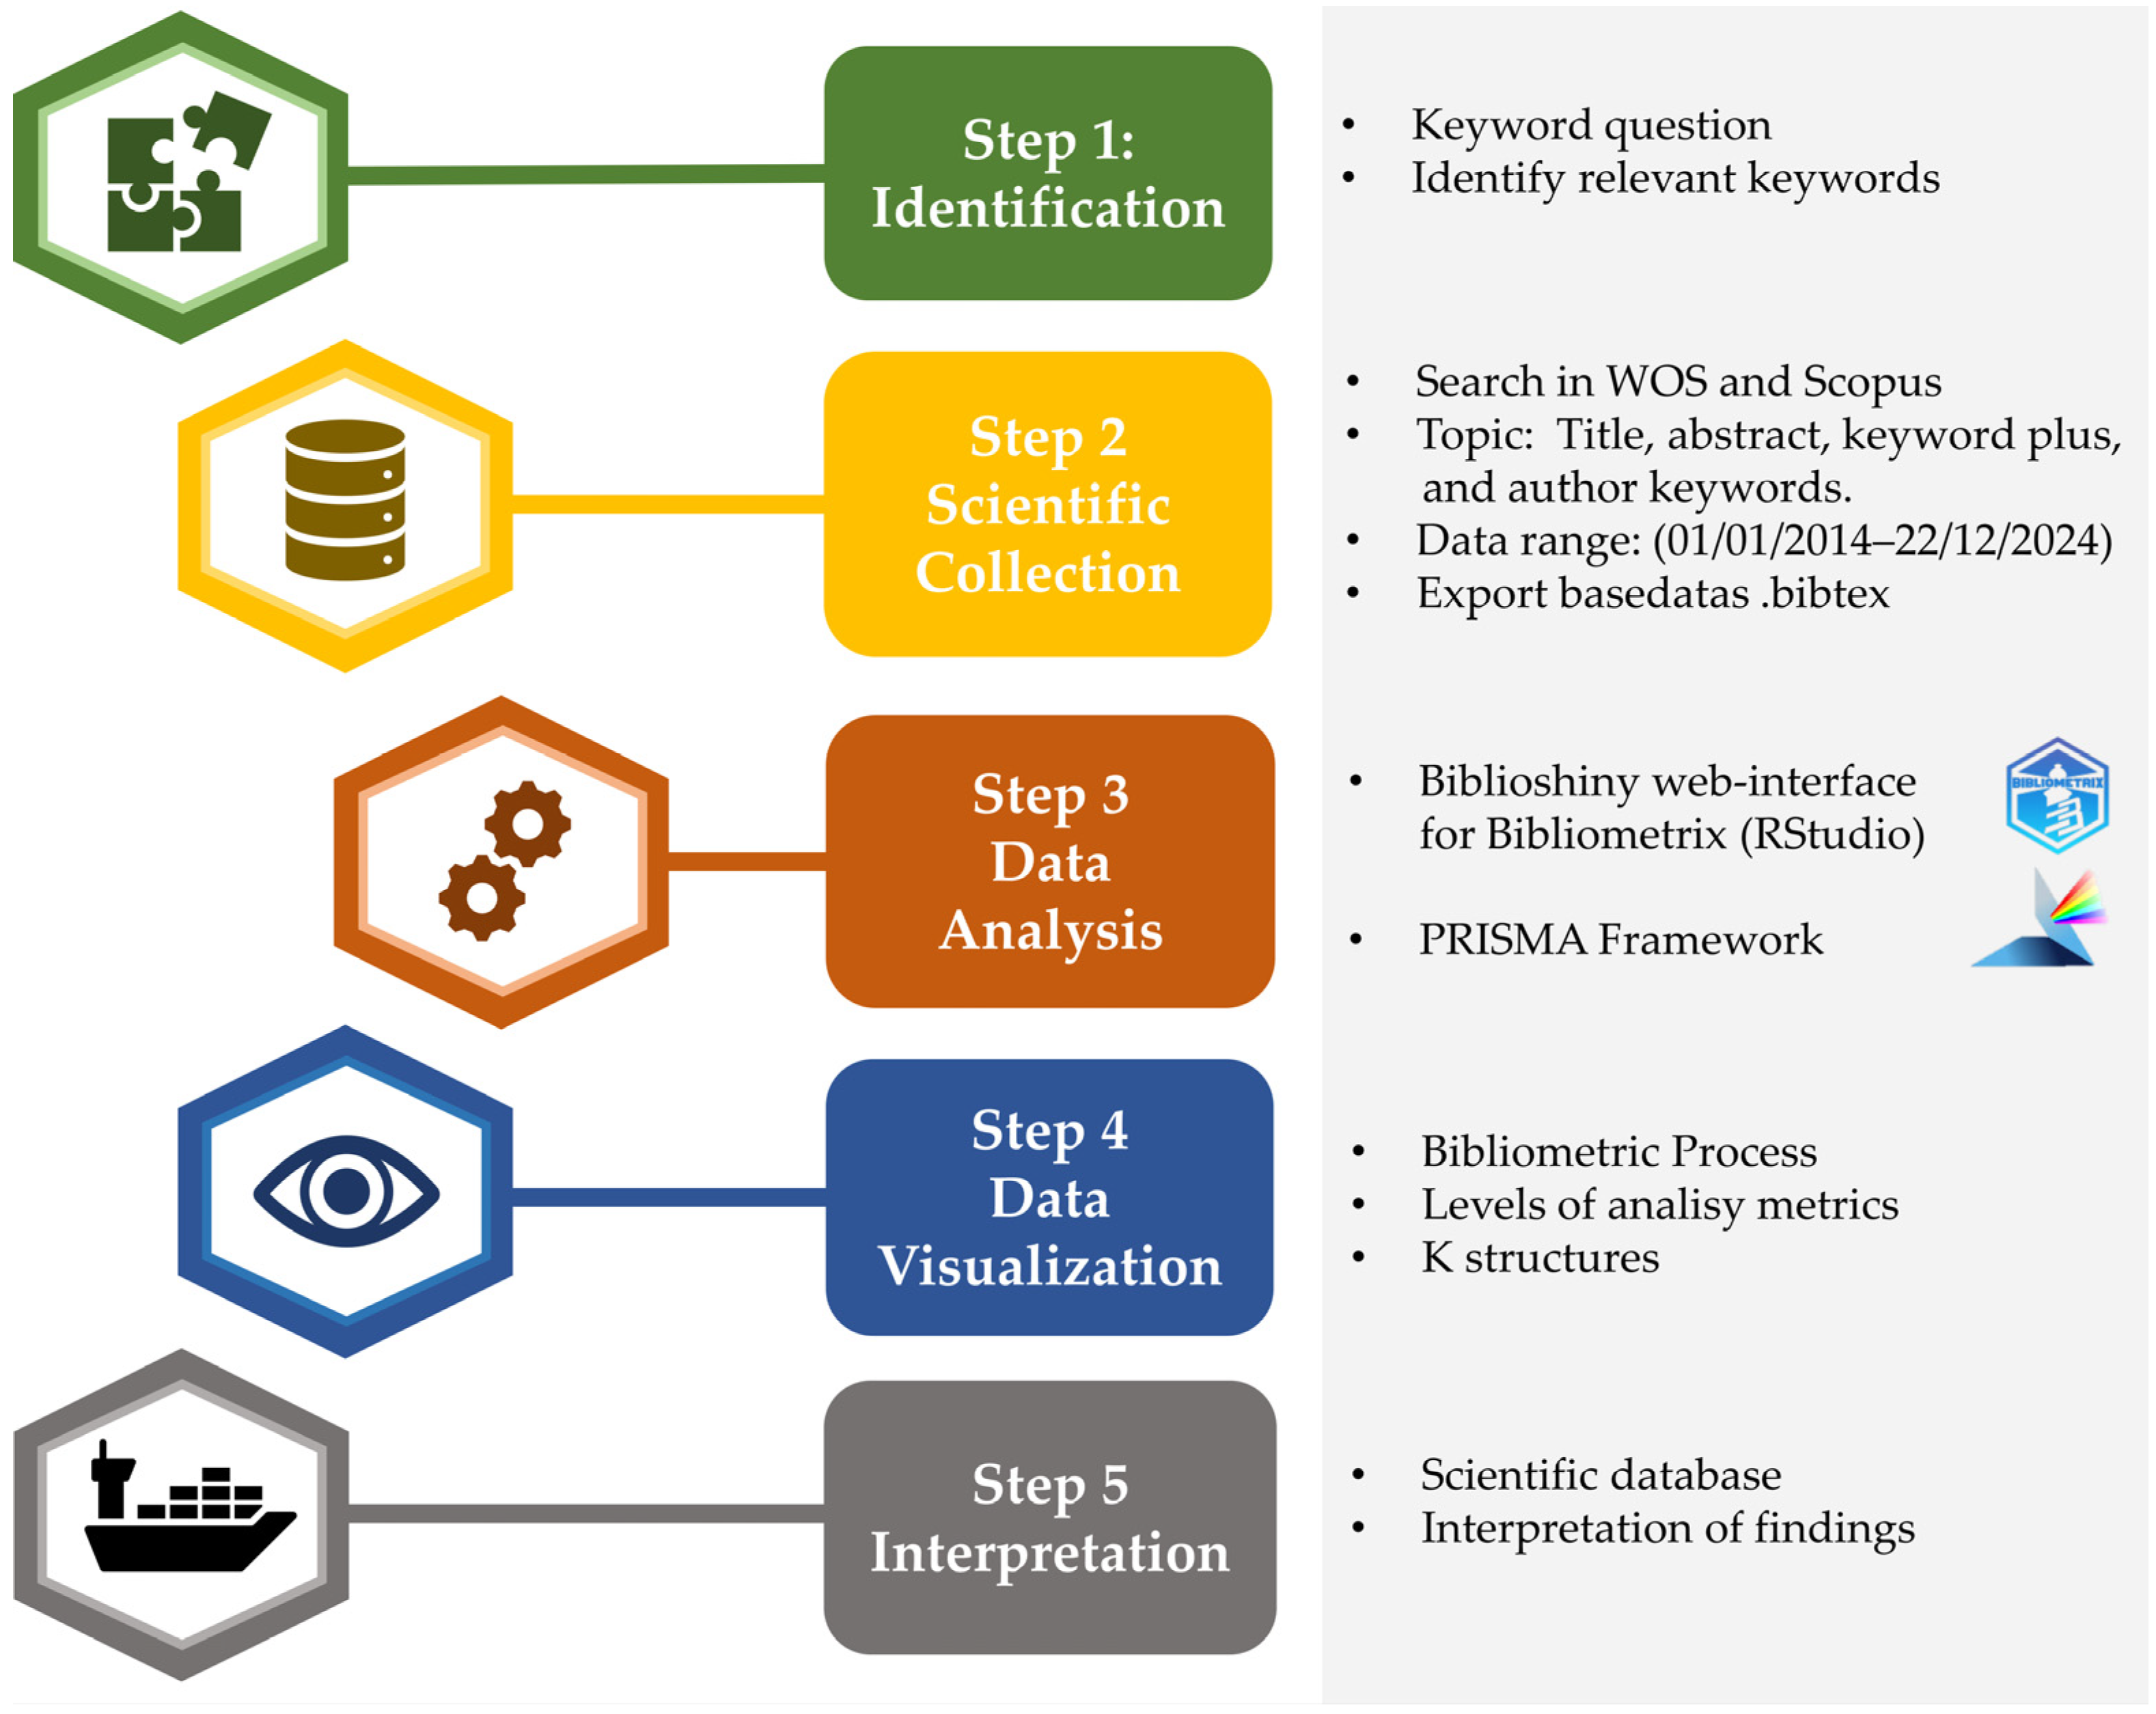
2.1. Bibliometric Method

To analyse large volumes of data in literature reviews, the bibliometric method has gained popularity among researchers as an effective tool [53]. The development of bibliometric software, such as Bibliometrix (R package), along with access to comprehensive scientific databases, such as Web of Science (WoS) and Scopus, has enabled more robust and comprehensive systematic reviews. These tools allow researchers to identify patterns, trends, and insights more efficiently, as well as to evaluate evidence based on predefined criteria [54,55]. In other words, the systematic approach allows for the identification of a broad set of relevant publications and facilitates the careful selection of a subset of papers that meet specific parameters. In this sense, the analyses derived from this methodology provide a solid basis for guiding future research, identifying gaps in current knowledge, and promising areas for further research [55].
The bibliometric analysis was conducted in five main stages that include the definition of the research questions; search and collection in databases using key terms; analysis of relevant documents; and visualisation and interpretation based on predetermined criteria [56,57] as shown in Figure 1.

2.1.1. Step 1: Search Strategy

In bibliometric analysis, the design of the study and the identification of the search terms are fundamental steps, allowing extensive scientific knowledge to be examined through qualitative and quantitative analysis without influencing the results [58,59]. In this context, this methodology was applied to identify relevant keywords and publications related to the applications of geographic components in the maritime sector.
The systematic review of the databases sought to identify general trends in publications related to the application of GIS in maritime logistics, management, and port operations, as well as to identify existing knowledge gaps. One way to develop a bibliometric analysis is by defining key questions that determine the formulation of the research objective [60]. The questions contribute to appropriate search strategies and concentrate the published evidence to structure the systematic review.
In this study the key question developed, covering the main aspects of the set of keywords used in the search across the different databases, was:
  • Key question: “In the maritime-port logistics interface, how are spatial data infrastructures (SDI) and geographic information systems (GIS) integrated into collaborative geovisualisation platforms?”.
In this systematic review, the key question aims to provide a holistic understanding of the theoretical and practical aspects and ideas of the application of GIS in the monitoring, sensing, and analysis of maritime spatial management to support researchers and experts in identifying future research directions.

2.1.2. Step 2: Data Collection

In this second phase, the scientific databases to be consulted were defined. In the systematic review process, the scientific databases Web of Science (WoS) from Clarivate Analytics [61] and Scopus from Elsevier [62] were used. The Web of Science (WoS) and Scopus databases were selected for this bibliometric analysis due to their complementary characteristics [63]. WoS, a pioneer in bibliometric analysis since 1900, stands out for the scope and impact of its publications [64,65]. Scopus, the largest database of peer-reviewed abstracts and citations, covers multiple areas of knowledge with more than 20,000 journals [66]. This methodological approach chose to combine both databases for greater analysis completeness in order to identify research gaps and inform future research, as recommended [55,67,68].
Based on recent systematic review studies [69,70,71], a Boolean equation with specific inclusion criteria was adapted for the filtering process in the databases. To ensure transparency and replicability, the search period was delimited to 10 years, including publications between 1 January 2014 and 22 December 2024. In addition, the time restriction covers the most recent and relevant publications on the topic, considering the rapid evolution of GIS technologies and spatial data infrastructures in the port context. In this period, the search for publications in WoS was based on the keywords included in the title, abstract, and keywords of the publications, defined by the advanced search and using the Topic option (searches title, abstract, keyword plus, and author keyword). The advanced search in Scopus also respected the same time restriction criteria and was carried out using the title, abstract, and keywords fields (TITLE-ABS-KEY). The search was delimited to include only publications from 2014 onwards, applying the filter “AND PUBYEAR AFT 2014” to the base query.
The systematic identification strategy was developed based on keywords, focusing on the central research question. In the databases, the identification structure was organised into four main keyword groups to comprehensively and systematically cover the topic. The first group focused on geospatial technologies, including fundamental terms such as spatial data infrastructure and geographic information systems, such as “spatial data infrastructure”, “marine sdi”, “geogra* information system”, “gis*” or “geospatial data integration”. The second group addresses the port and maritime context, subdivided into three categories: main terms related to ports, concepts of smart ports, and specific elements of port operations such as “seaport”, “port”, “smart”, “green”, “intelligent”, “automated”, and “port*”, “maritime*”, “logistic*”, “terminal*”, “ship*”, “vessel*”, “berth*”, “container*”. The third group covered technological aspects, with a focus on interoperability, visualisation and digital platforms using the keywords “interoperability”, “visualiz*”, “stakeholder*”, “open data”, “digital*”, “web” and “map”, “service”, “gis”, “based gis”. Finally, the fourth group covered tools and data, including elements such as “map*”, “dataset”, “tool”, “ais”, “iot”. This hierarchical organisation allows for a systematic search that combines geospatial, maritime, technological, and tooling aspects, ensuring the retrieval of publications relevant to the study of the application of GIS and spatial data infrastructures in seaports. The four groups were connected by the logical operator AND, ensuring that the publications identified simultaneously addressed geospatial, maritime, technological, and tooling aspects. Within each group, the keywords were separated by the logical operator OR, allowing a variety of related terms to be included, which increased the scope of the search. The use of asterisks (*) after a keyword made it possible to include variations of the terms to broaden the scope of the search. This systematic structure contributes to a comprehensive search of the most relevant publications for the study of the application of GIS and spatial data infrastructures in seaports.
The first criterion was to select only publications in English, considering its predominance in international scientific literature and its role as a global scientific language. The second criterion was limited to including documents classified as ‘article’ and ‘review article’, as these categories are uniformly available in both databases and represent substantial, peer-reviewed scientific contributions [72]. In order to refine the results in the WOS and Scopus databases, a limitation by research area was applied, excluding fields not pertinent to maritime GIS and SDI, such as biomedical sciences, medicine, veterinary science, psychology, and related areas. This process made it possible to concentrate the analysis on publications effectively related to the scope of the research. The search in the selected databases identified 687 research works, 399 in WOS and 288 in Scopus (Table 1). Table 1 shows the Boolean equation and the inclusion criteria applied to each database.

2.1.3. Step 3: Data Analysis

In the third phase of the study, a descriptive bibliometric analysis was carried out on the 687 publications discovered, with the support of the open-source statistical software R (version 4.4.2). The files exported in BibTeX format (.bib) were checked for duplicates (identifying 157 publications) and consolidated into a single database, which was then converted into .xlsx format in RStudio (version 2023.03.1). This compilation and standardisation of the data made it easier to load and process the Biblioshiny interactive application, which is available for free via the Bibliometrix package, version 4.1 (http://www.bibliometrix.org, accessed on 28 December 2024).
The Bibliometrix package is equipped with a set of scientometric tools developed specifically to identify patterns and perform an initial evaluation and screening of articles in a bibliometric analysis [73]. The package includes an application developed in Shiny, which offers a point-and-click graphical interface that provides advanced visualisation and quantitative analysis capabilities for scientific data, making it easier to understand trends in a field of research [74,75]. This feature is particularly useful for users interested in exploring the tool without the need for programming knowledge in the R language. In the literature, the Biblioshiny application is widely used in bibliometric studies due to its usability, agility, and ability to analyse large volumes of data, overcoming traditional manual review methods [76,77,78,79,80,81].
In this study, a total of 530 documents were imported into the Biblioshiny application for analysis. The main metrics evaluated were used to answer the research questions in a global way through the main information, annual scientific production, keyword co-occurrence networks, citation networks, production by country, thematic maps, and thematic evolution maps [82]. The integration of these methodological tools made it possible to systematically visualise the scientific panorama, revealing not only the current scenario but also the main aspects of research and emerging challenges in the application of geographic components in the maritime sector.
Although Biblioshiny helps to filter articles based on initial criteria, the refinement and final selection of articles for inclusion in a systematic review usually require more detailed manual analysis. This is because the Biblioshiny application requires complete sets of mandatory metadata from the Web of Science (WoS) or Scopus [83]. Files exported from reference managers, such as .bib, .ris, .csv, and .txt, are not compatible with the tool due to the lack of metadata standardisation, which generates execution errors and makes more detailed analyses of publications impossible [83]. To this end, the database of 530 documents was imported into the Zotero 7.0.7 reference manager.
In systematic review articles, several authors use the Preferred Reporting Items for Systematic reviews and Meta-Analysis (PRISMA) [84], due to its clear structure and ease of application, especially for the careful selection of articles to be included in the review [83]. In this study, we adapted the PRISMA methodology to answer the key research question presented in Section 2.1.1 In this sense, the systematic review and meta-analysis in scoping reviews (PRISMA-SCR) methodology was applied to carry out a robust search of the database [85,86]. The application of the search strategy resulted in a sample of 78 scientific articles. In addition, three complementary sources from the websites of international organisations were consulted to support the analysis. The steps carried out in PRISMA-SCR allow future research to be replicated and updated [87], as shown in the PRISMA-SCR flowchart (Figure 2).

2.1.4. Data Visualisation

The integration of these methodological tools enabled a systematic visualisation of the scientific landscape, revealing not only the current scenario but also the main research statistics and trends and emerging challenges in the application of geographic components in the maritime-port sector. Based on the systematic review studies carried out by [88,89,90], using Bibliometrix, the metadata were extracted from the database to analyse various aspects of the literature. Due to its efficient statistical algorithms and integrated visualisation features, this tool was used to the interpretation of the research field in question [56]. The key information obtained includes data types, document content, authors and their collaborations, and document types. The number of documents and citations per year proved valuable in identifying research progress in our field of study and determining the most relevant journals in the subject area.
The methodology also consists of identifying knowledge structures through visualisation techniques such as word clouds, thematic maps, tree maps, three-field maps, and network analysis. For the keyword analysis using tree maps and word clouds, the choice of author keywords was preferred as they represent the terms that researchers considered most relevant and representative of their work. The analysis of international collaborations between authors was crucial in identifying the main research hubs and understanding how research on this topic is distributed globally. Based on a geographic file generated by the R package biblioshiny, the mapping of these collaboration networks enabled the visualisation of not only the number of publications per country but also the connections established between different nations, revealing the most influential centers and strategic partnerships in the topic of scientific production.
Finally, an analysis of key themes and trends throughout the studied decade was conducted. Following the methodology described by [91,92,93], thematic maps were generated to visualise research topics. These maps are constructed as bi-dimensional graphs based on two fundamental parameters: centrality and density. Centrality, expressed on the x-axis-horizontal, denotes the level of engagement of a particular cluster of networks compared to other clusters, thus showing the importance of the research topic. Density measures the intensity within a cluster network as an indication of the developing stage of the subject, and it is plotted on the vertical axis (y). These two dimensions give important insights about each cluster’s significance and cohesion [91]. In the thematic map, each topic cluster is represented by a bubble with a distinct color, whose size corresponds to the number of word occurrences in the cluster. The thematic map can be divided into quadrants to indicate the stage and characteristic research theme [93]. The first quadrant (Q1) is considered the central and developed, which becomes the motor themes that are defined as high centrality and density. These refer to research topics that are already established in the field. The second quadrant (Q2), described as niche themes (peripheral and developed), includes papers studying issues where emerging promising questions for research need to be flagged as potential motor themes in the future or as transfer points between networks of different yet connected forms. The third quadrant (Q3) includes areas pertaining to a topic already established in the literature (basic themes) and periphery, and the fourth quadrant (Q4) identifies topics that are newly emerging or alternatively declining in the field of research [92].

2.1.5. Step 4. Interpretation

The concluding phase needs a comprehensive interpretation of the bibliometric findings. The data processing unveiled thematic structures, chronological patterns, and knowledge clusters within the investigated field. The identification of these structures facilitated the delineation of the principal themes of the scholarly works, the emergence of topics that signify novel research frontiers, and the evolutionary pathways illustrating the progression of themes over time [94].
The interpretation combines quantitative bibliometric indicators with targeted qualitative analysis. While computational methodologies facilitated the preliminary data extraction and processing throughout stages 2–4, the conclusive analysis demands human expertise to effectively contextualise the findings. This interpretative effort transcended mere numerical metrics, aiming to comprehend the conceptual interconnections among several thematic clusters, as well as the identification of potential deficiencies and avenues for future research opportunities.

3. Results and Discussion

3.1. Bibliometric Analysis

In this section are presented the main results and it is discussion of the bibliometric analysis which covered four fundamental aspects: (1) the descriptive statistics of publications, providing an overview of the dataset; with the evolution of annual scientific production, indicating the temporal trends of publication and the distribution of articles by scientific journals, identifying the main dissemination vehicles; (2) authors’ keywords; (3) the global distribution of publications and the visualisation of international collaboration networks between countries, highlighting the main research centres and their interactions; and (4) the thematic evolution of the research field, revealing the main trends and changes in the areas of interest over time.

3.1.1. Descriptive Bibliometric Analysis

A descriptive analysis of the 530 documents published between 2014 and 2024 revealed a significant growth trend in scientific production in the field of GIS applications, techniques, and tools in the maritime-port sector. Table 2 shows an increase in scientific production with an average annual growth rate of 8.59%, reflecting the interest and relevance of GIS technologies in the maritime sector.

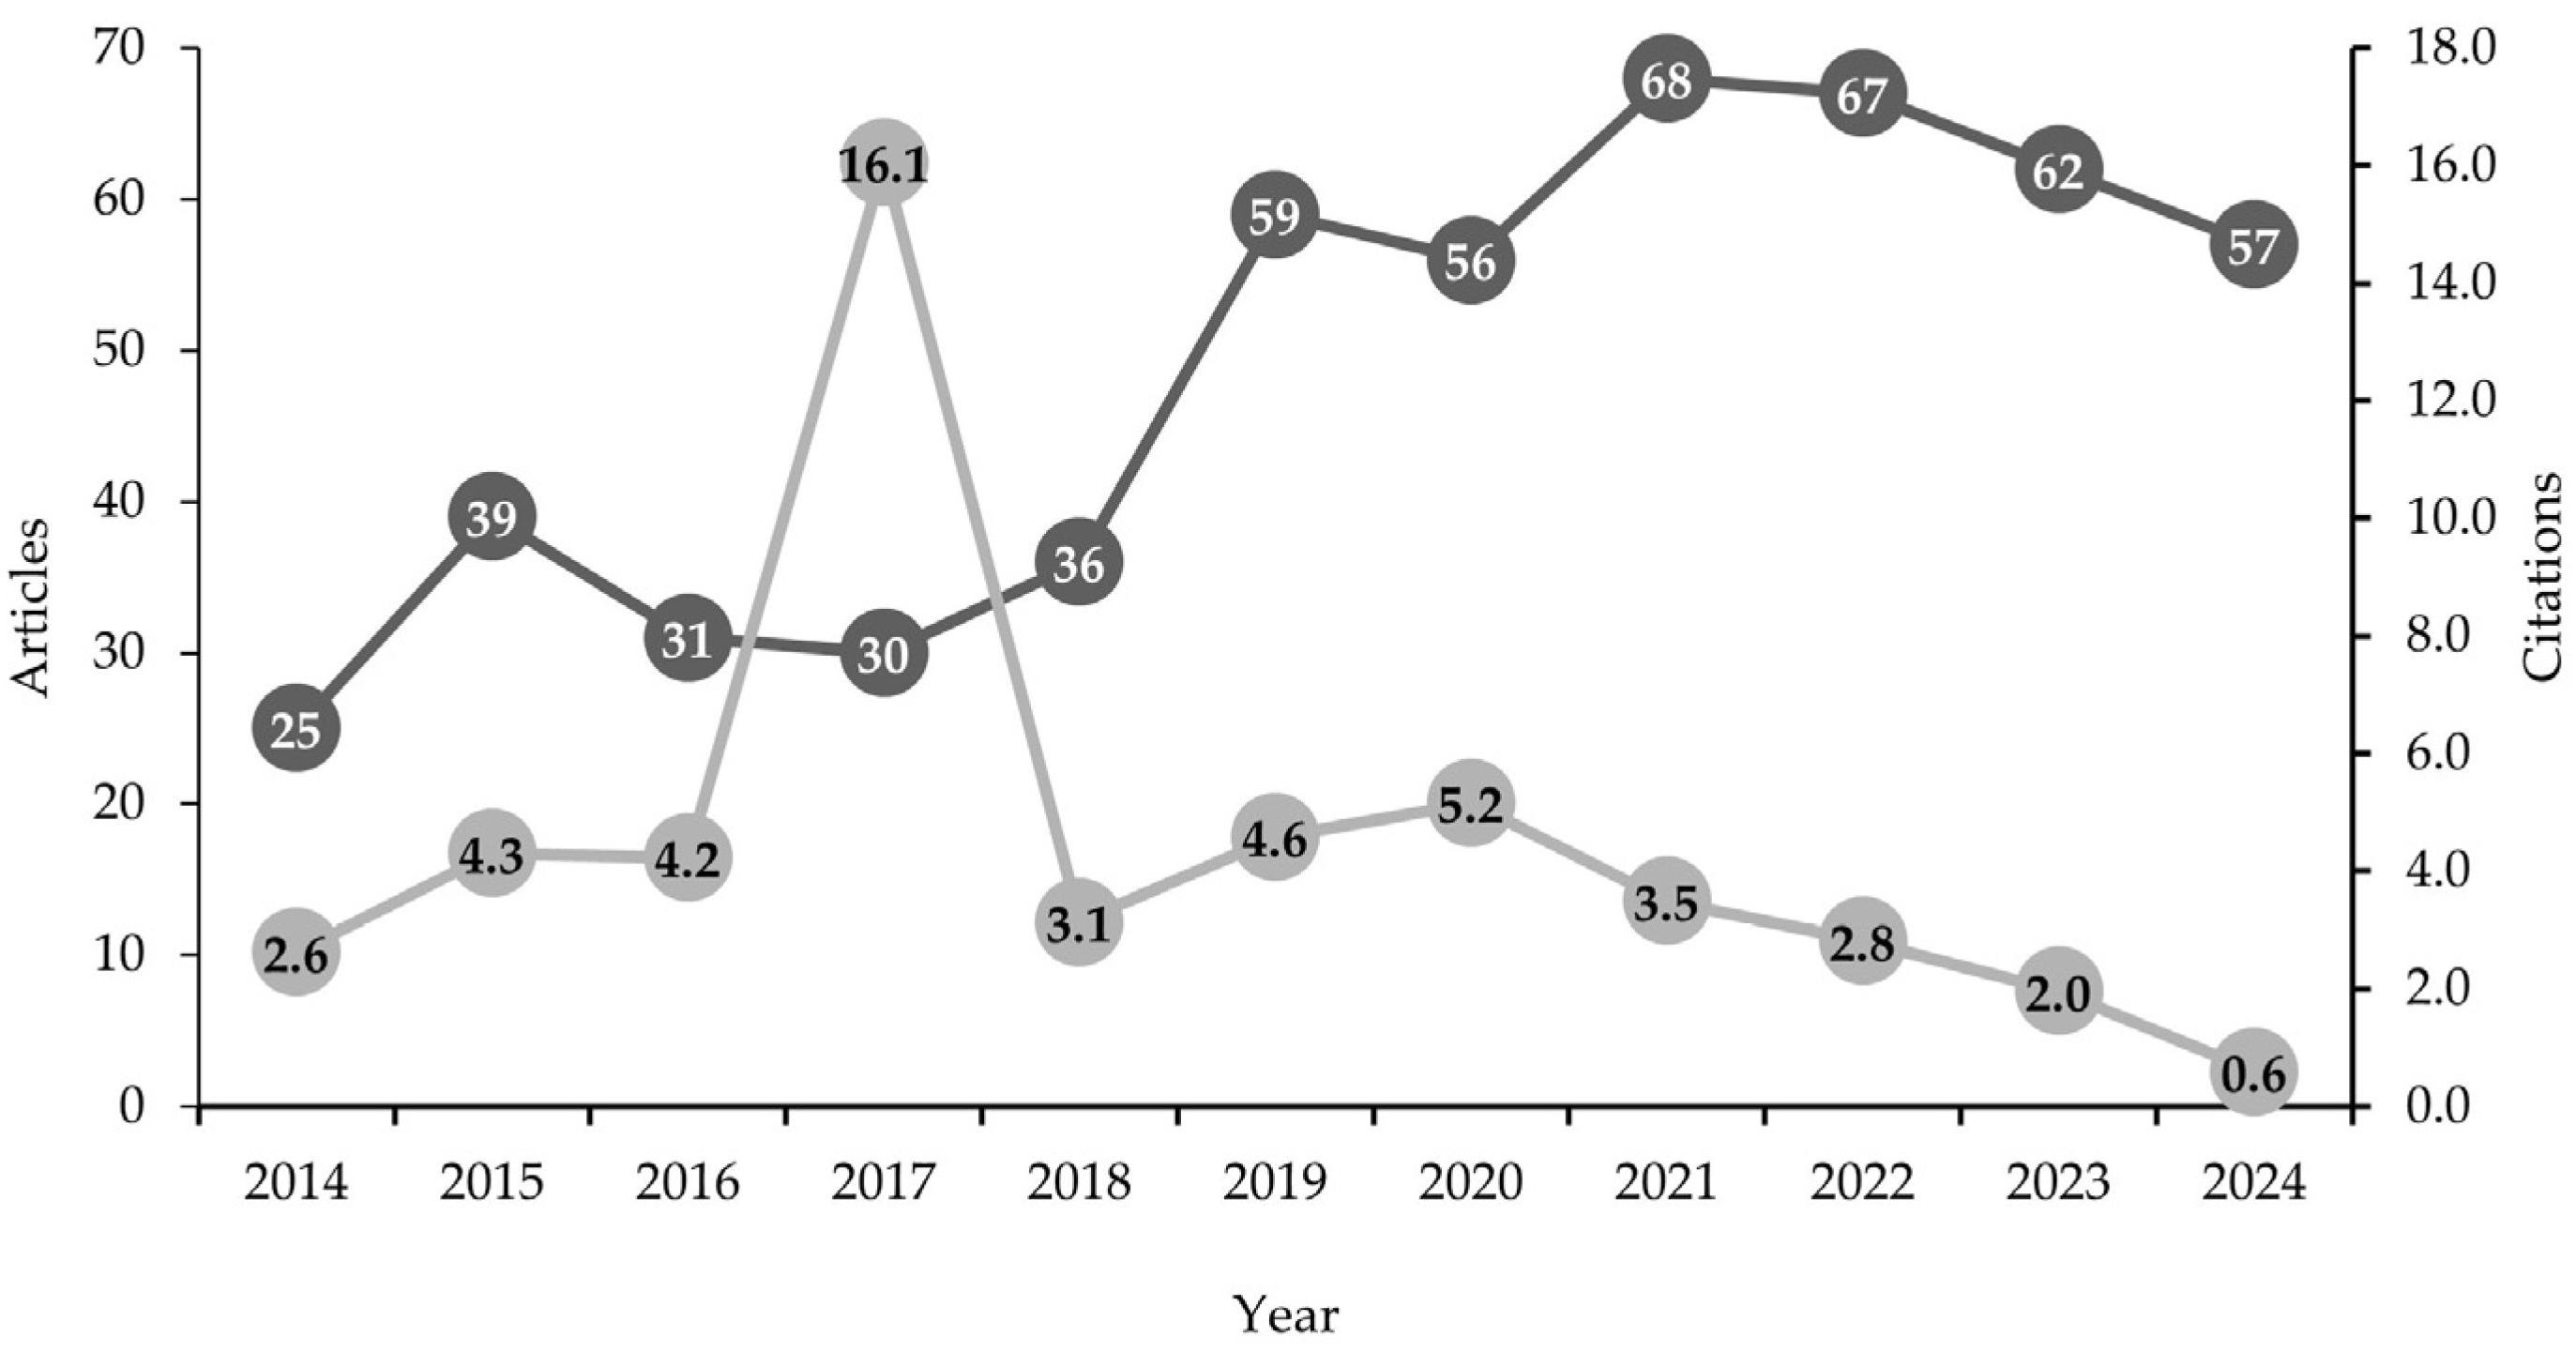
3.1.2. Distribution of Annual Documents and Citations

In this study, the 530 documents found were distributed among 514 articles (89.7%), 10 reviews (2.9%), and 6 early access (1.7%). The analysis revealed 2205 researchers involved in scientific production, with a Collaboration Index (CI) of 4.83 authors per jointly authored or co-authored article, showing a strong preference for collaborative work over individual publications. International partnerships accounted for 24.72% of collaborations, showing significant transnational cooperation in the development of maritime GIS research. Over the course of ten years, there has been an upward trend in scientific production in the area, with an annual average of 48.82 publications, reaching a peak of 68 documents in the 2021–2022 biennium. The significant growth in scientific publications over the last decade highlights the growing importance of integrating GIS into maritime-port management. This evolution has provided significant advances not only for the scientific community but also for various sectors of the port complex, providing a solid scientific basis for the development of public policies and technological innovations in the sector.
In terms of academic impact, in 2016 it stood out with the highest citation average of 16.1, followed by a significant decline in subsequent years, reaching just 2.0 citations in 2023 and 0.6 in 2024. The reduction in citation averages can be attributed to the specificity of the area of study, considering that the integration of GIS in port and maritime environments constitutes a highly specialised domain at the intersection between geospatial technologies and port operations. The intrinsic complexity of the sector requires expertise in both geographic systems and port operations, the barriers to accessing port data, often considered strategic or confidential by port authorities, the concentration of research in a few centers specializing in maritime studies, and the limited number of professionals working simultaneously in the areas of geotechnology and port management. This represents a significant barrier to the development of comprehensive research in this field. These factors can restrict the number of researchers and institutions capable of developing studies in this area. This challenge highlights the importance of new research that can fill this knowledge gap. Figure 3 illustrates the evolution of annual scientific publications and the average citation of articles per year.

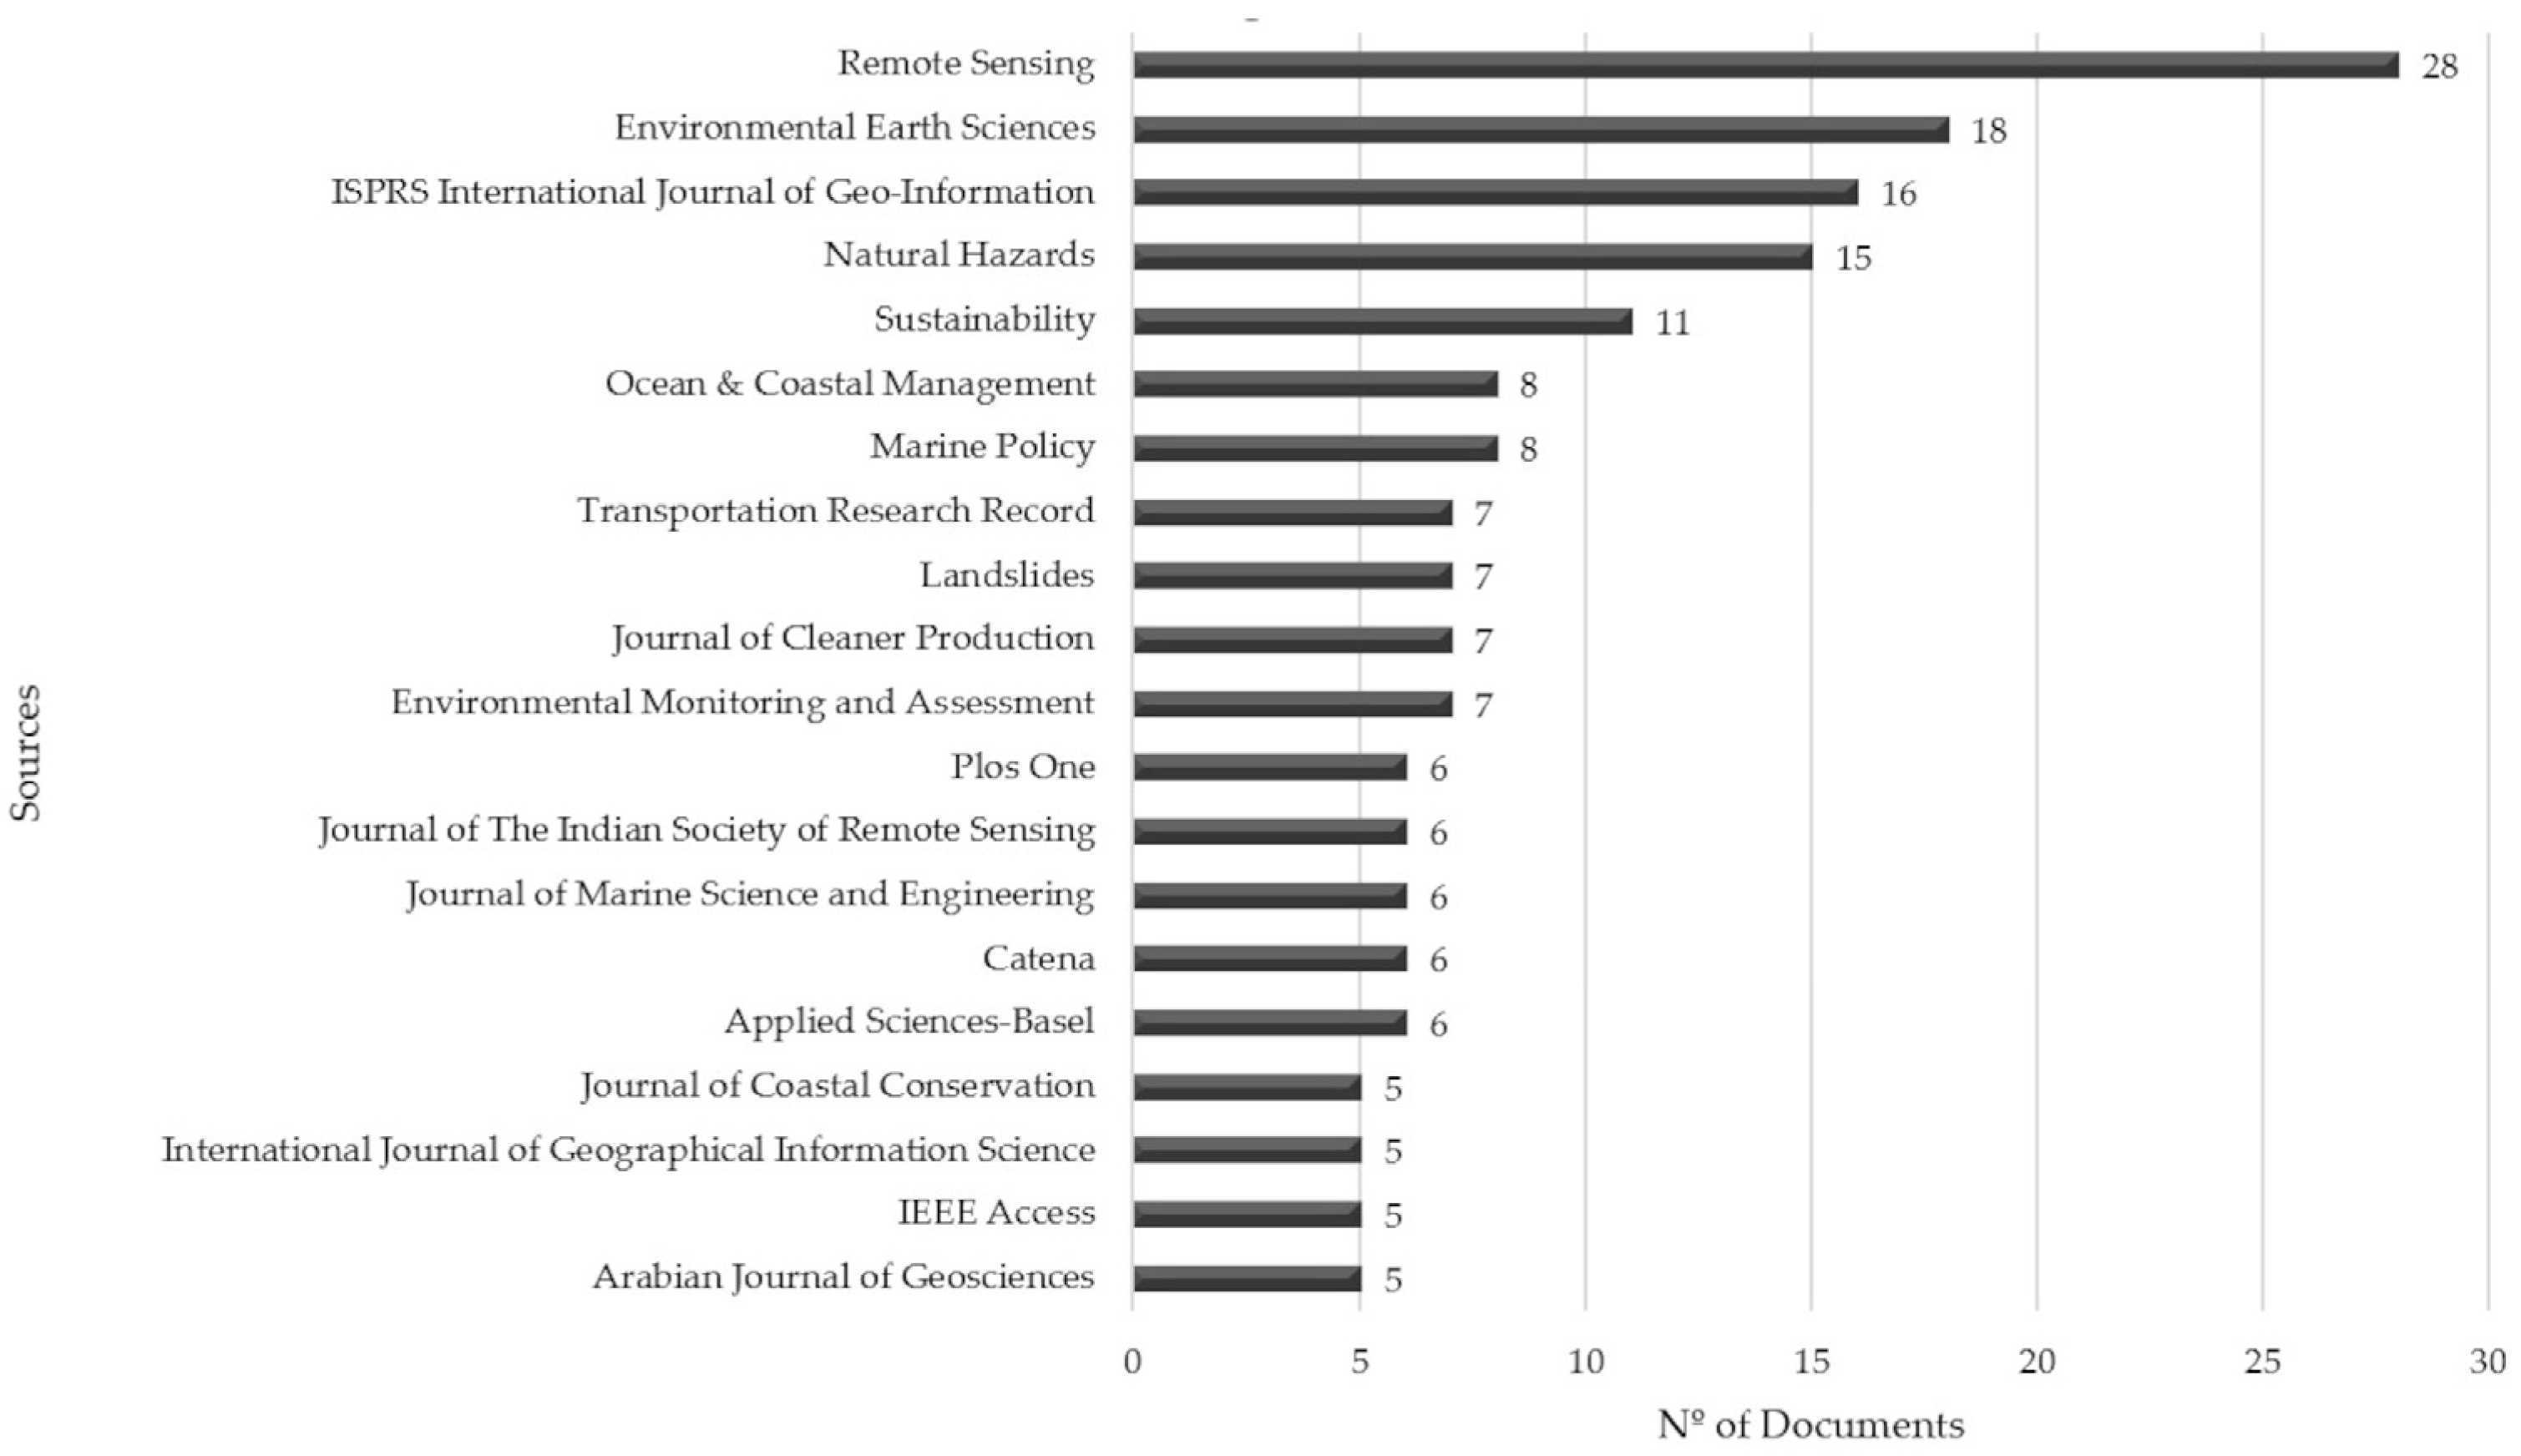
3.1.3. Most Influential Journals

In this study, the five most relevant journals accounted for 47.8% of the publications among the 20 leading scientific journals analysed. Remote Sensing, specializing in remote sensing and terrestrial observation, coastal monitoring (15.2%); Environmental Earth Sciences, focused on earth sciences and environmental impacts (9.8%); ISPRS International Journal of Geo-Information, dedicated to geographic information systems and geomatics (8.7%); Natural Hazards, focused on studies of risks and natural disasters (8.2%); and Sustainability, with an emphasis on sustainable development and environmental management (6.0%), were the journals with the highest frequency and importance. Figure 4 shows the distribution of the number of documents published among the top 20 peer-reviewed journals.

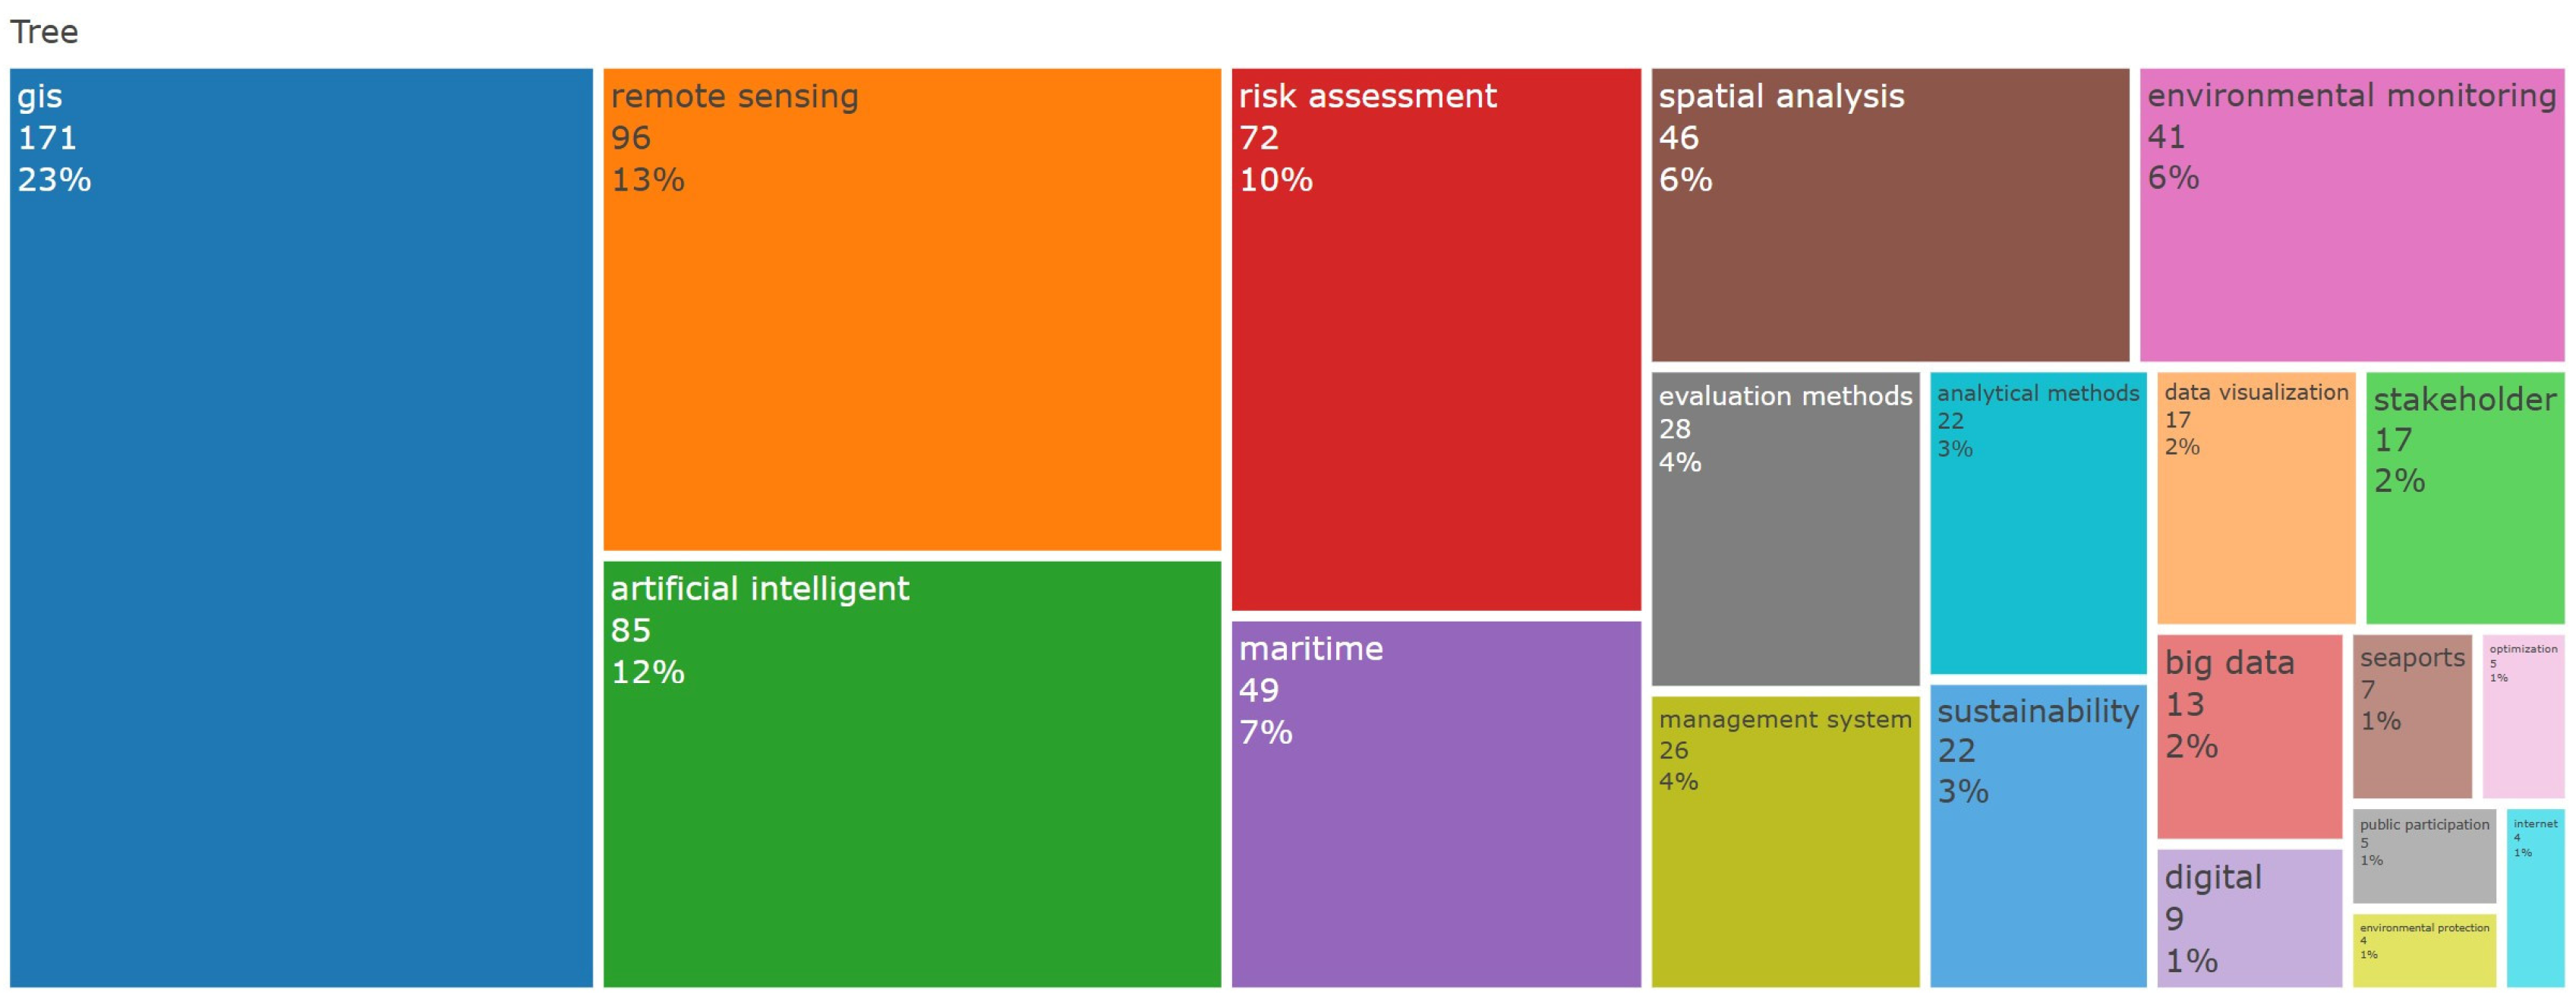
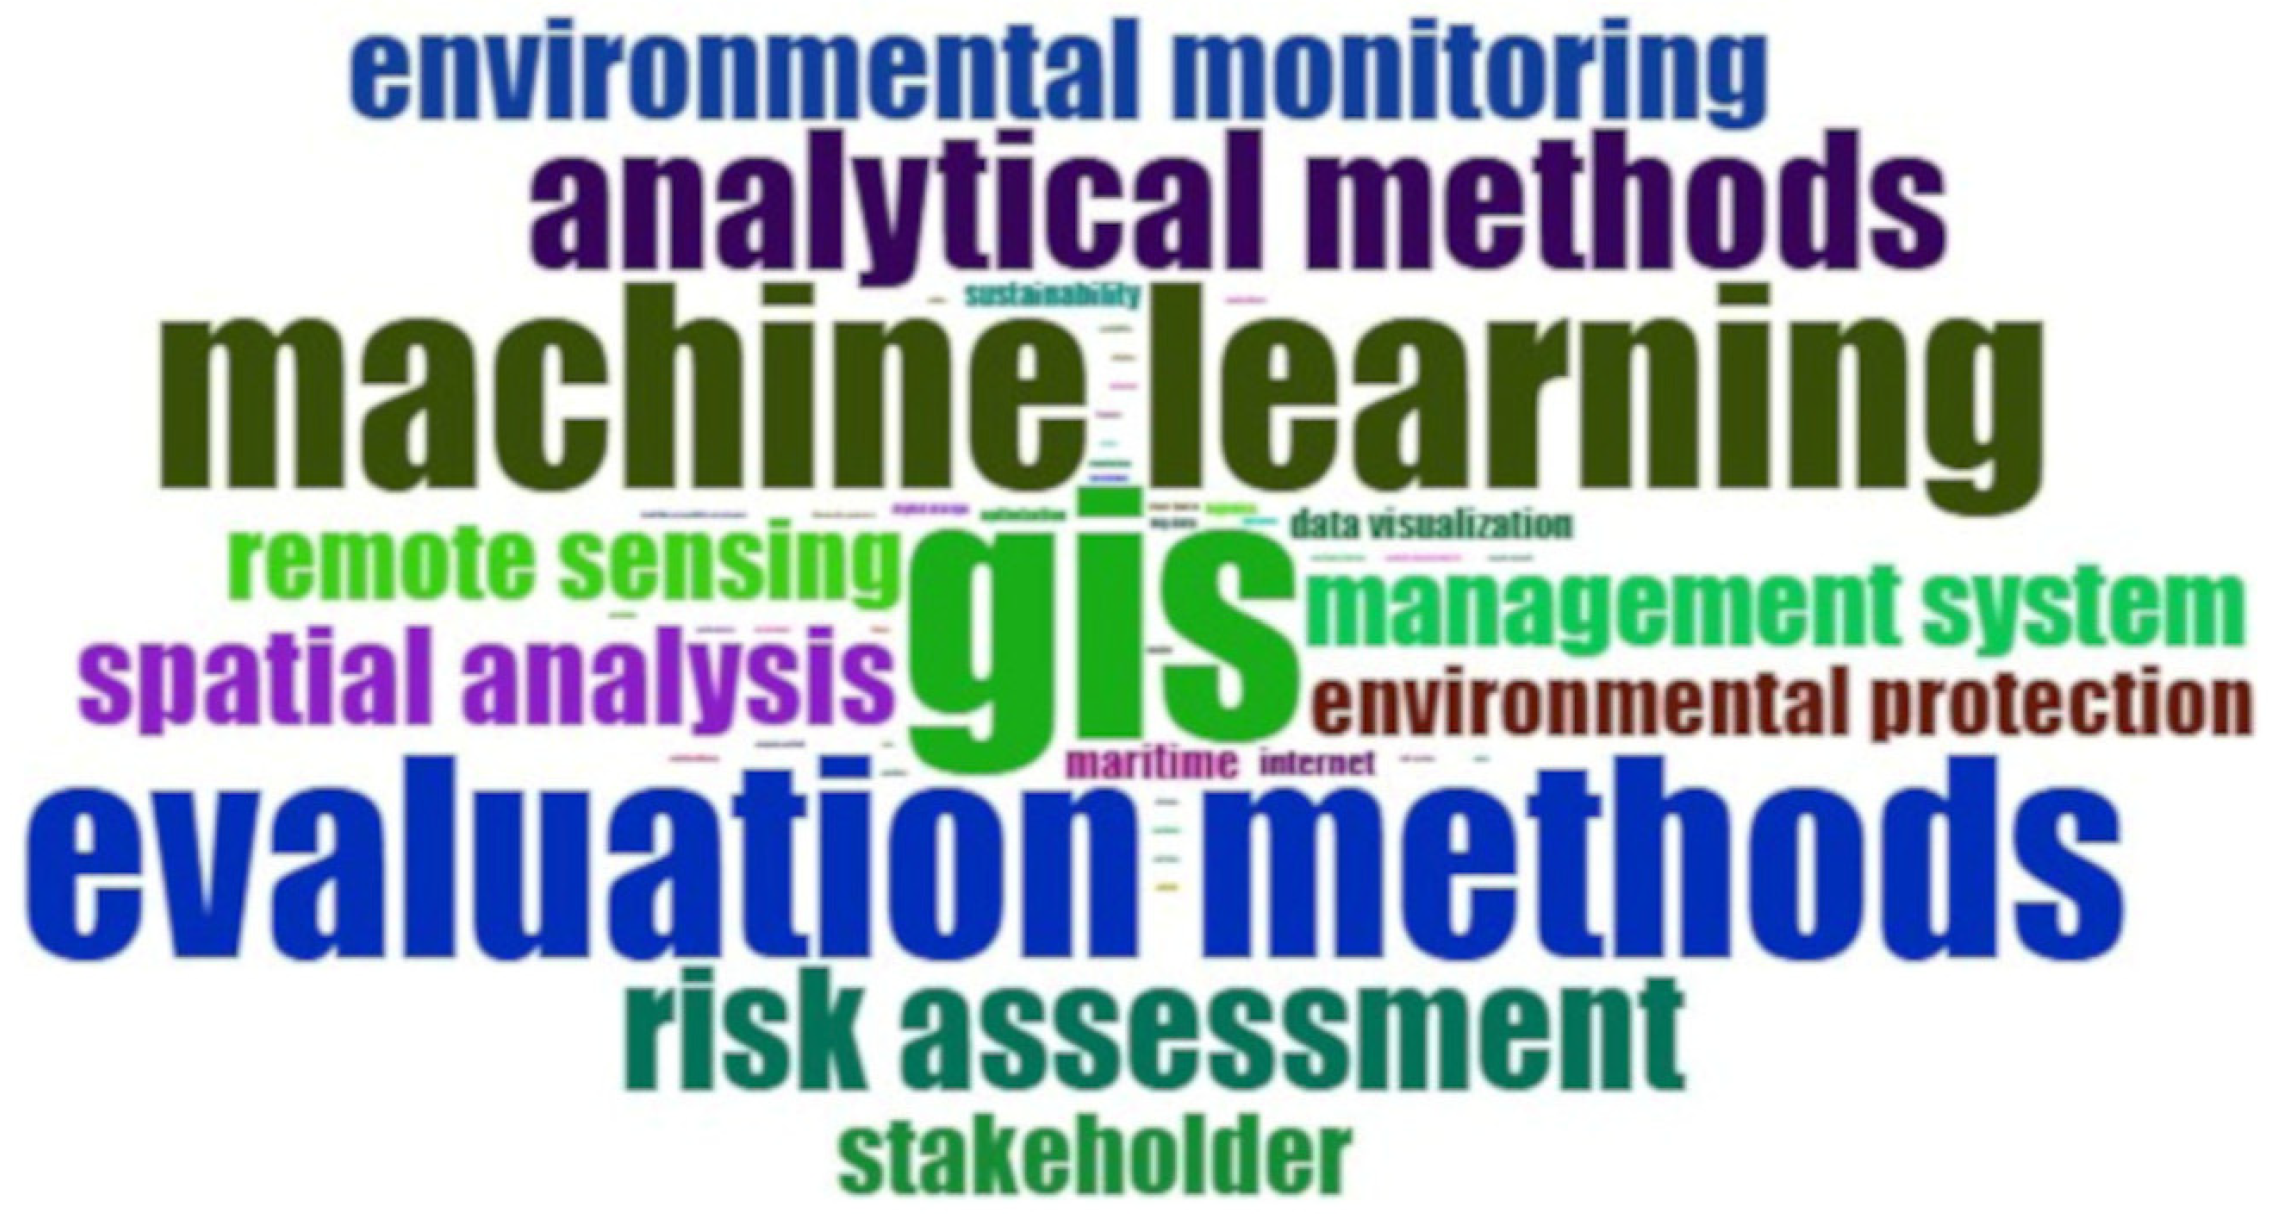
3.1.4. Authors’ Keywords

This section presents an analysis of the correlations between keywords per author extracted from databases on geographic information systems in the maritime-port sector. Mapping these keywords made it possible to identify the main research trends in the area, reveal possible research gaps, and point to future research. For a more meaningful analysis, synonymous keywords were grouped together; for example, the keyword “gis” encompassed the group of terms “geographic information”, “geographic information systems”, “geographic information system”, “geographic information system (gis)”, “geographic information systems (gis)”, “qgis”, “ppgis”, “arcgis”, “geographical information system”, and “geographical information systems”. The list of synonyms was imported in .txt format into Bibliometrix’s Text Editing option panel. This standardisation was essential to avoid terminological dispersion, allowing similar or related terms to be identified and categorised. This grouping facilitated an understanding of the trends and thematic relations addressed in the literature.
GIS appeared as a central axis in the tree map of the 20 most frequent keywords used by authors, considering the grouping of synonyms into a single keyword. Among the most mentioned keywords are “gis”, “remote sensing”, and “machine learning”, which together account for 47% of the occurrences in the literature analysed. The keyword “stakeholder” is in 14th place (2%), while “seaport”, “optimization”, “public participation”, “environmental protection”, and “internet” occupy the last five positions with an occurrence of 1%, respectively (Figure 5). In this search for publications related to the use of spatial data infrastructures in the maritime-port sector, we found a low relevance of this keyword, which was not identified in any publication considered significant.
The overall analysis of the 530 documents using the authors’ keyword cloud reveals the significant application of GIS in the maritime port context (Figure 6). The size of the font in the word cloud is directly related to the frequency of use of the terms, with the most frequently used words appearing in larger fonts. The most prominent term was GIS in four key areas, such as spatial analysis, environmental monitoring, remote sensing, and data management.
In both Figure 5 and Figure 6, the absence of synonyms related to the keyword “SDI” reveals the low frequency of these keywords in the database [95]. In this context, the keyword “remote sensing”, which encompasses image analysis techniques such as satellites, LiDAR, and digital elevation models, can be used for detecting ships, monitoring maritime pollution, and classifying images. The “spatial analysis” grouping highlights the application of spatial planning and cartography, which includes web mapping (WebGIS) and spatial forecasting, allowing an integrated approach to geographical analysis.
The “machine learning” group focuses on advanced techniques such as artificial neural networks (ANN), random forest (RF), and deep learning, which are essential for predictive analysis and the automation of complex big data analysis processes. The keyword “analytical methods” includes algorithms, such as the analytical hierarchy process (AHP) and fuzzy logic, often used in numerical modelling and quantitative analysis. The “evaluation methods” keywords group includes methods such as validation by receiver operating characteristic (ROC) curves, cross-validation, and bivariate models, guaranteeing greater precision in analysis and forecasts. These methods are particularly useful in “environmental monitoring” studies, which address issues such as climate change, coastal erosion, and ecosystem monitoring, as well as linking to “environmental protection” strategies focused on biodiversity conservation and water quality management.
In the “risk assessment” field, the studies focus on risk assessments associated with landslides, coastal hazards, and susceptibility to natural disasters, while the “sustainability” cluster explores topics such as renewable energy, circular economy, and sustainable development, highlighting green solutions in the maritime-port sector. The “stakeholder” group highlights the importance of information management and decision support to engage different stakeholders in maritime projects. In the technological sphere, the “big data” and “digital” group addresses topics such as digital twins, IoT, and data mining, driving technological innovation in the sector. The keywords in the “data visualization” group focus on the presentation of information through 3D visualisations and localisation, improving the interpretation of complex data. The “management system” keyword cluster discusses the use of integrated systems and technologies such as cloud computing for process management and decision support, especially in maritime contexts. The “internet” keyword group connects digital applications and website selection, while the “maritime” grouping encompasses maritime spatial planning, safety, and accidents, emphasizing the impact of sea level changes and the importance of bathymetry. Finally, the “seaports” group directly addresses port infrastructure, logistics, and the management of ports and terminals, which are fundamental to global maritime trade.

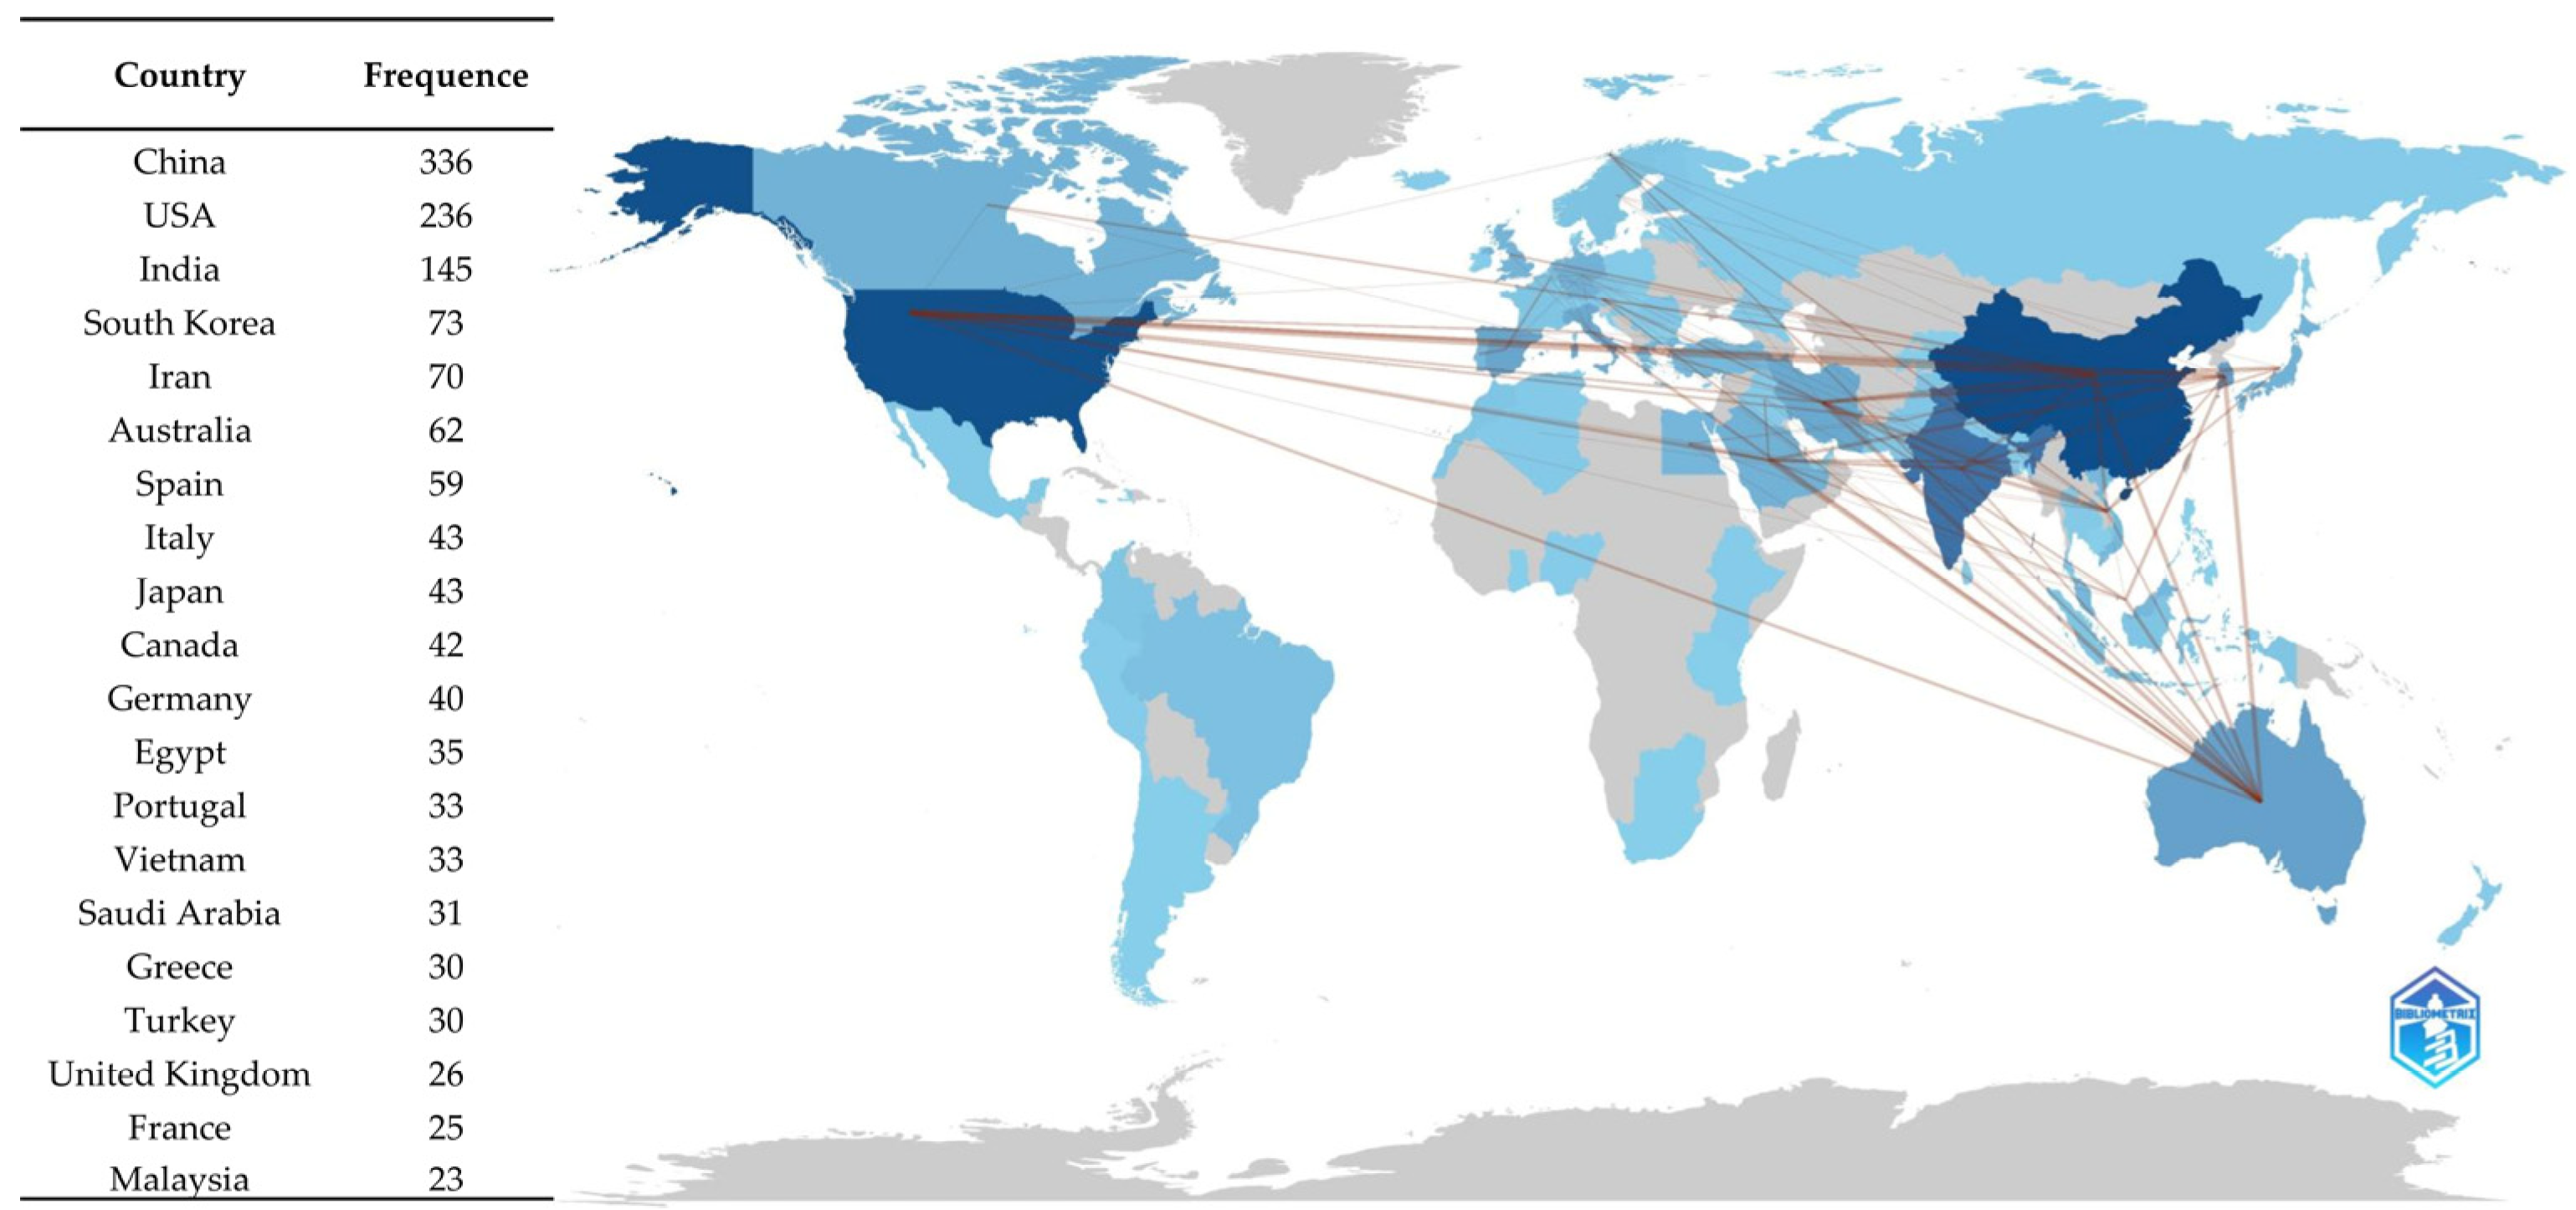
3.1.5. Mapping Scientific Collaboration Between Countries

The analysis of the geographical distribution of the 530 publications was based on data from the countries’ scientific production, which presents the frequency of publications by country. This methodology measures the number of “author appearances by country affiliation”, resulting in a sum of frequencies greater than the total number of items in the collection [83]. In this context, China, the United States, and India lead the scientific production in GIS applied to the maritime sector, with a publication frequency of 336, 236, and 145, respectively. The results show that these three nations represent 50.7% of the frequency of scientific production among the 20 most productive countries, establishing themselves as research hubs in the sector. Developed countries dominate the ranking, indicating that they have greater investment in research on the application of GIS to the maritime-port sector. Figure 7 presents the frequency of scientific production by country and the collaboration and networking map within the scope of our study.
In the assessment of the social structure of publications, the global collaboration map revealed significant patterns of scientific interaction. This map displays connection lines that represent the link between two or more countries, indicating the state of collaboration between them [73]. The scale of cooperation is represented by the thickness of the line and different shades of blue, with darker shades indicating stronger cooperation and lighter shades indicating weaker collaboration [73]. In this case, the study results revealed the level of international collaboration among countries, with China (73), the USA (51), and India (48) exhibiting the highest collaboration rates, represented by a darker blue colour. This is evidenced by their substantial number of publications involving multiple countries. In contrast, Australia (48), South Korea (41), Iran (41), Spain (18), and Malaysia (7) are among the countries with medium shades of blue. The rest of the countries with frequencies of less than seven collaborative publications corresponded to lighter shades of blue. On the other hand, countries with a greyer colour did not exhibit collaborations in the publications analysed (Figure 7).

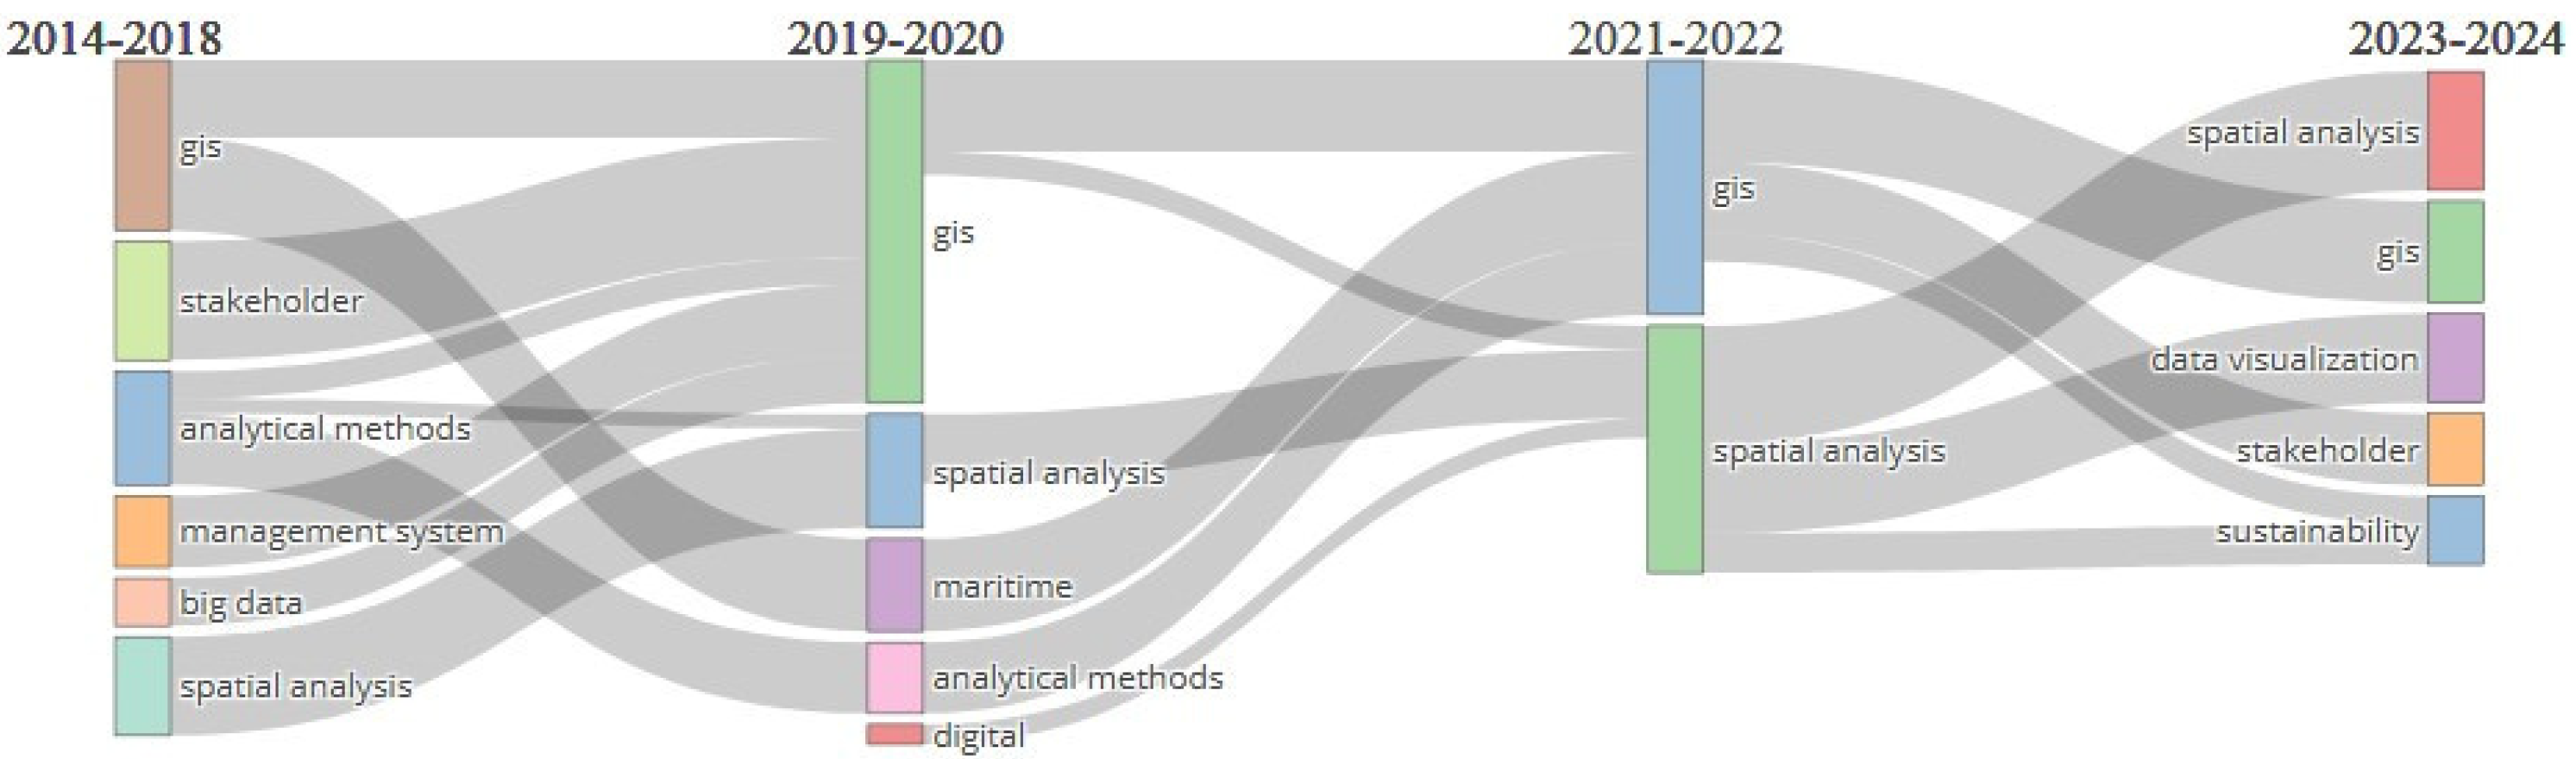
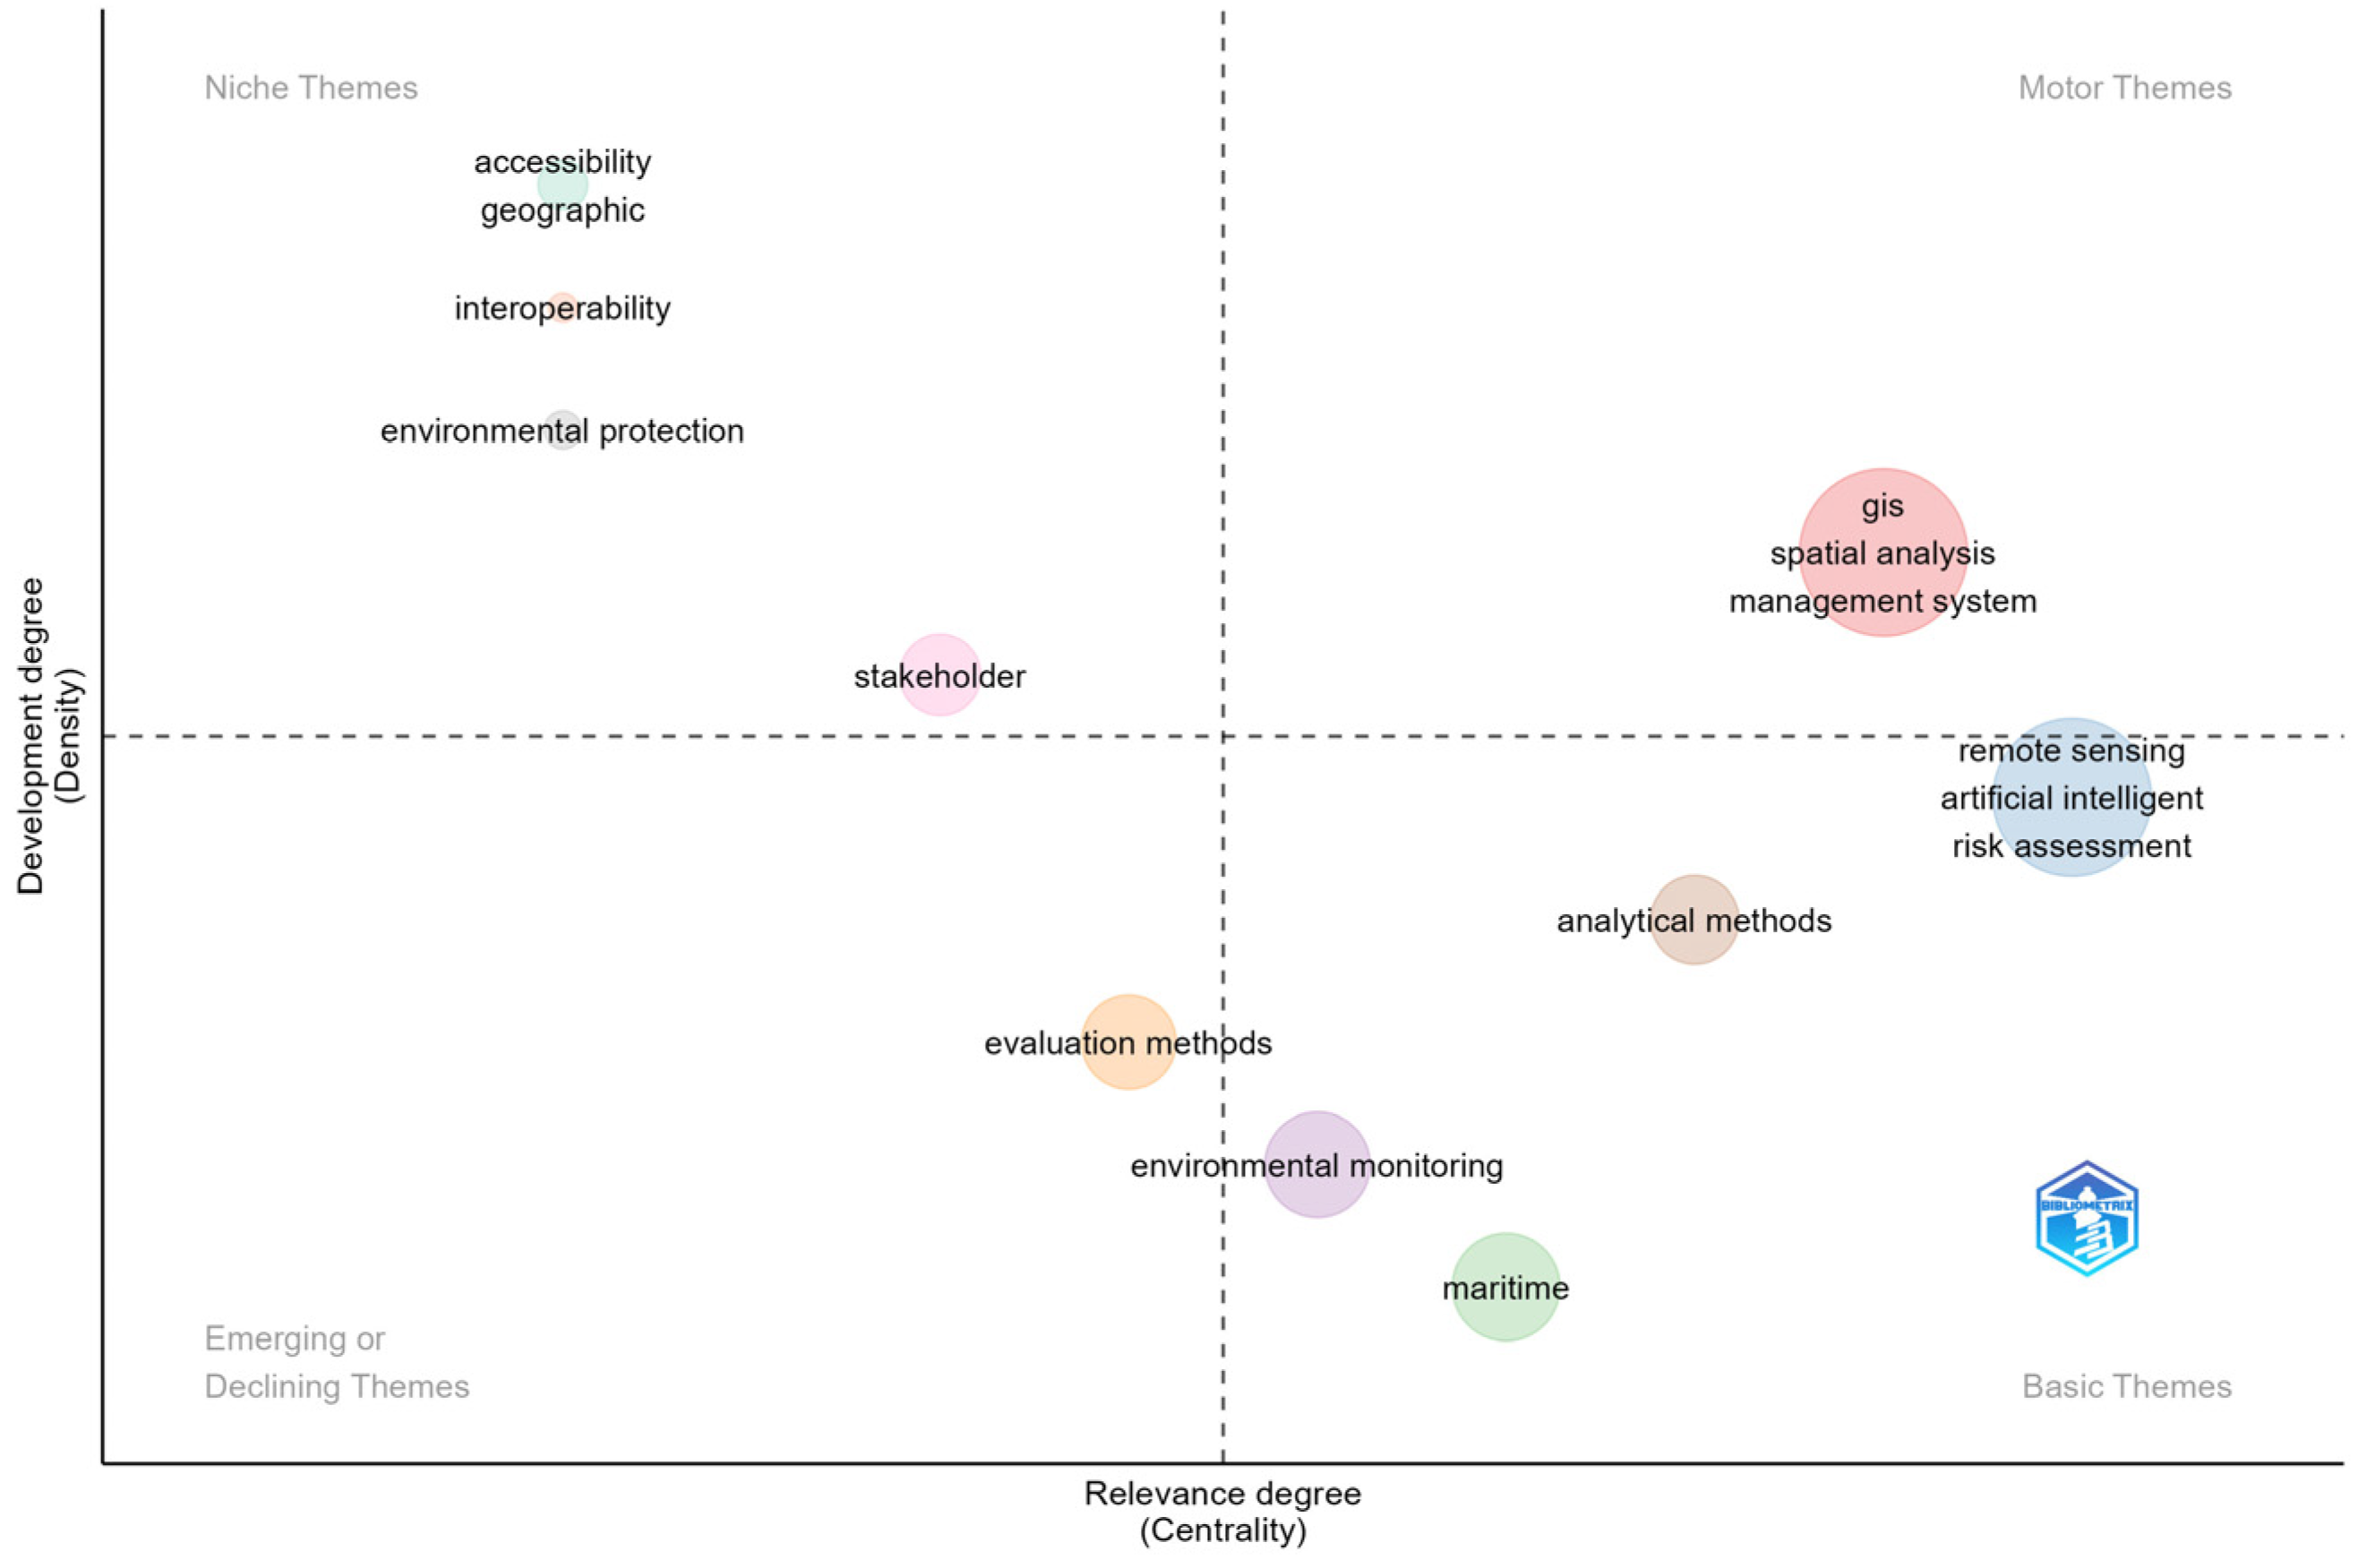
3.1.6. Evolution of the Main Themes and Trends

In the thematic evolution, no relevant publications were identified regarding the use of SDI in the integration of GIS in maritime-port management. However, GIS applications in the maritime-port sector were mapped using a Sankey diagram, which illustrates the evolution of keywords in studies related to the sector between 2014 and 2024 (Figure 8). The analysis in the Bibliometrix software was segmented into four key periods using three cut-off points: 2018, 2020, and 2022. In addition, the standard parameters used were a word count of 250 words, a minimum frequency of five occurrences per thousand documents, weighting based on the inclusion index per occurrence, a minimum weight of 0.1, assignment of three labels per group, and implementation of the WalkTrap algorithm for clustering [96].
Over a period of 10 years, certain themes have shown a tendency to merge, evolve into sub-themes, or, in some cases, lose relevance over time. During the 2014–2018 period, predominant terms included “gis”, “stakeholder”, “analytical methods”, “management system”, “big data”, and “spatial analysis”, indicating an initial focus on integrating spatial analysis tools and data management, with attention to stakeholders and large-scale data analysis. Between 2019 and 2020, themes such as “gis”, “spatial analysis”, and “analytical methods” became more consolidated, while new terms like “maritime” and “digital” emerged, suggesting greater specialisation in the maritime sector and the adoption of digital technologies. This period was also marked by the intensification of digitalisation in the maritime domain, expanding the use of emerging technologies such as IoT and digital twins, representing a pivotal moment in technological transfer and supporting spatial planning and safety practices [45,48]. From 2021 to 2022, themes merged into the core topics of “gis” and “spatial analysis”, while in 2023–2024, they subdivided, with “stakeholders”, “data visualisation”, and “sustainability” emerging as key areas of interest. This reflects a growing concern for data visualisation and sustainability in the sector. The term “sustainability” has emerged as an evolving priority in this latest period, addressing the paradigm shift towards more sustainable practices in the sector, as demonstrated by the energy transition and the development of green and smart ports. Additionally, the term “stakeholders” has reinforced the importance of information management and the engagement of multiple actors in decision-making processes.
In Figure 9, we present a strategic diagram illustrating the evolution of research topics within the scope of the study (2014–2024). The analysis was conducted by applying a clustering algorithm to the authors’ keyword network, enabling the identification and characterisation of the main themes in the field [96]. To enhance the comprehension of the thematic map featuring time segments, an analysis of the three predominant terms within each map grouping was conducted, allowing for more accessible interpretation of the keyword patterns and their temporal evolution [97]. The strategic diagram positions the topics based on their importance (centrality) and their level of development (density) in the thematic network.
The thematic map visually organises topics and keywords into four quadrants: Q1 (motor themes—top right), Q2 (niche themes—top left), Q3 (basic themes—bottom right), and Q4 (emerging or declining themes—bottom left). In Q1, influential and well-developed themes within the studied context are characterised by high relevance and high density. Topics such as “gis”, “spatial analysis”, and “management system” play a central role in research and show strong interconnections with other themes. Q2 consists of clusters with high density but lower relevance compared to the other quadrants. Keywords such as “accessibility”, “geographic”, “interoperability”, “environmental protection”, and “stakeholder” stand out in this section. These themes indicate well-explored areas with a certain level of development but have not yet achieved significant impact or centrality within the overall study context. This suggests that, while they are important and hold considerable potential, they still lack greater integration or recognition to become more relevant in the maritime sector.
In Q3, the cluster with the terms “remote sensing”, “artificial intelligence”, and “risk assessment” is close to the border with the upper right quadrant (Motor Theme), indicating a transition between consolidated and emerging themes. The large size of this cluster’s bubble suggests that these areas are gaining relevance and density, standing out as promising technologies and methodologies for the sector, driving innovation and advanced applications in the maritime-port sector. The “analytical methods”, “environmental monitoring”, and “maritime” clusters indicate that these areas are recognised as important but still need further development and integration with emerging technologies to achieve a more significant impact on the maritime-port sector. The evolution of these themes can be driven by the adoption of advanced technologies and integration with clusters that are already transitioning to the motor quadrant.
Finally, in Q4, the “evaluation methods” indicated that although it has a relatively low density, it has moderate relevance. “Evaluation methods” are recognised as important in the context of the study but have not yet been widely explored or developed. This cluster indicates that this topic has the potential to gain greater prominence in the future, especially if there is an increase in the application of artificial intelligence in the maritime sector. Although the term ‘interoperability’ appears in Q2 and could be related to IDS, the absence of IDS in the figure suggests that this term has not been widely cited for the integration of GIS in the maritime-port sector, highlighting a possible gap in the literature or in its adoption.

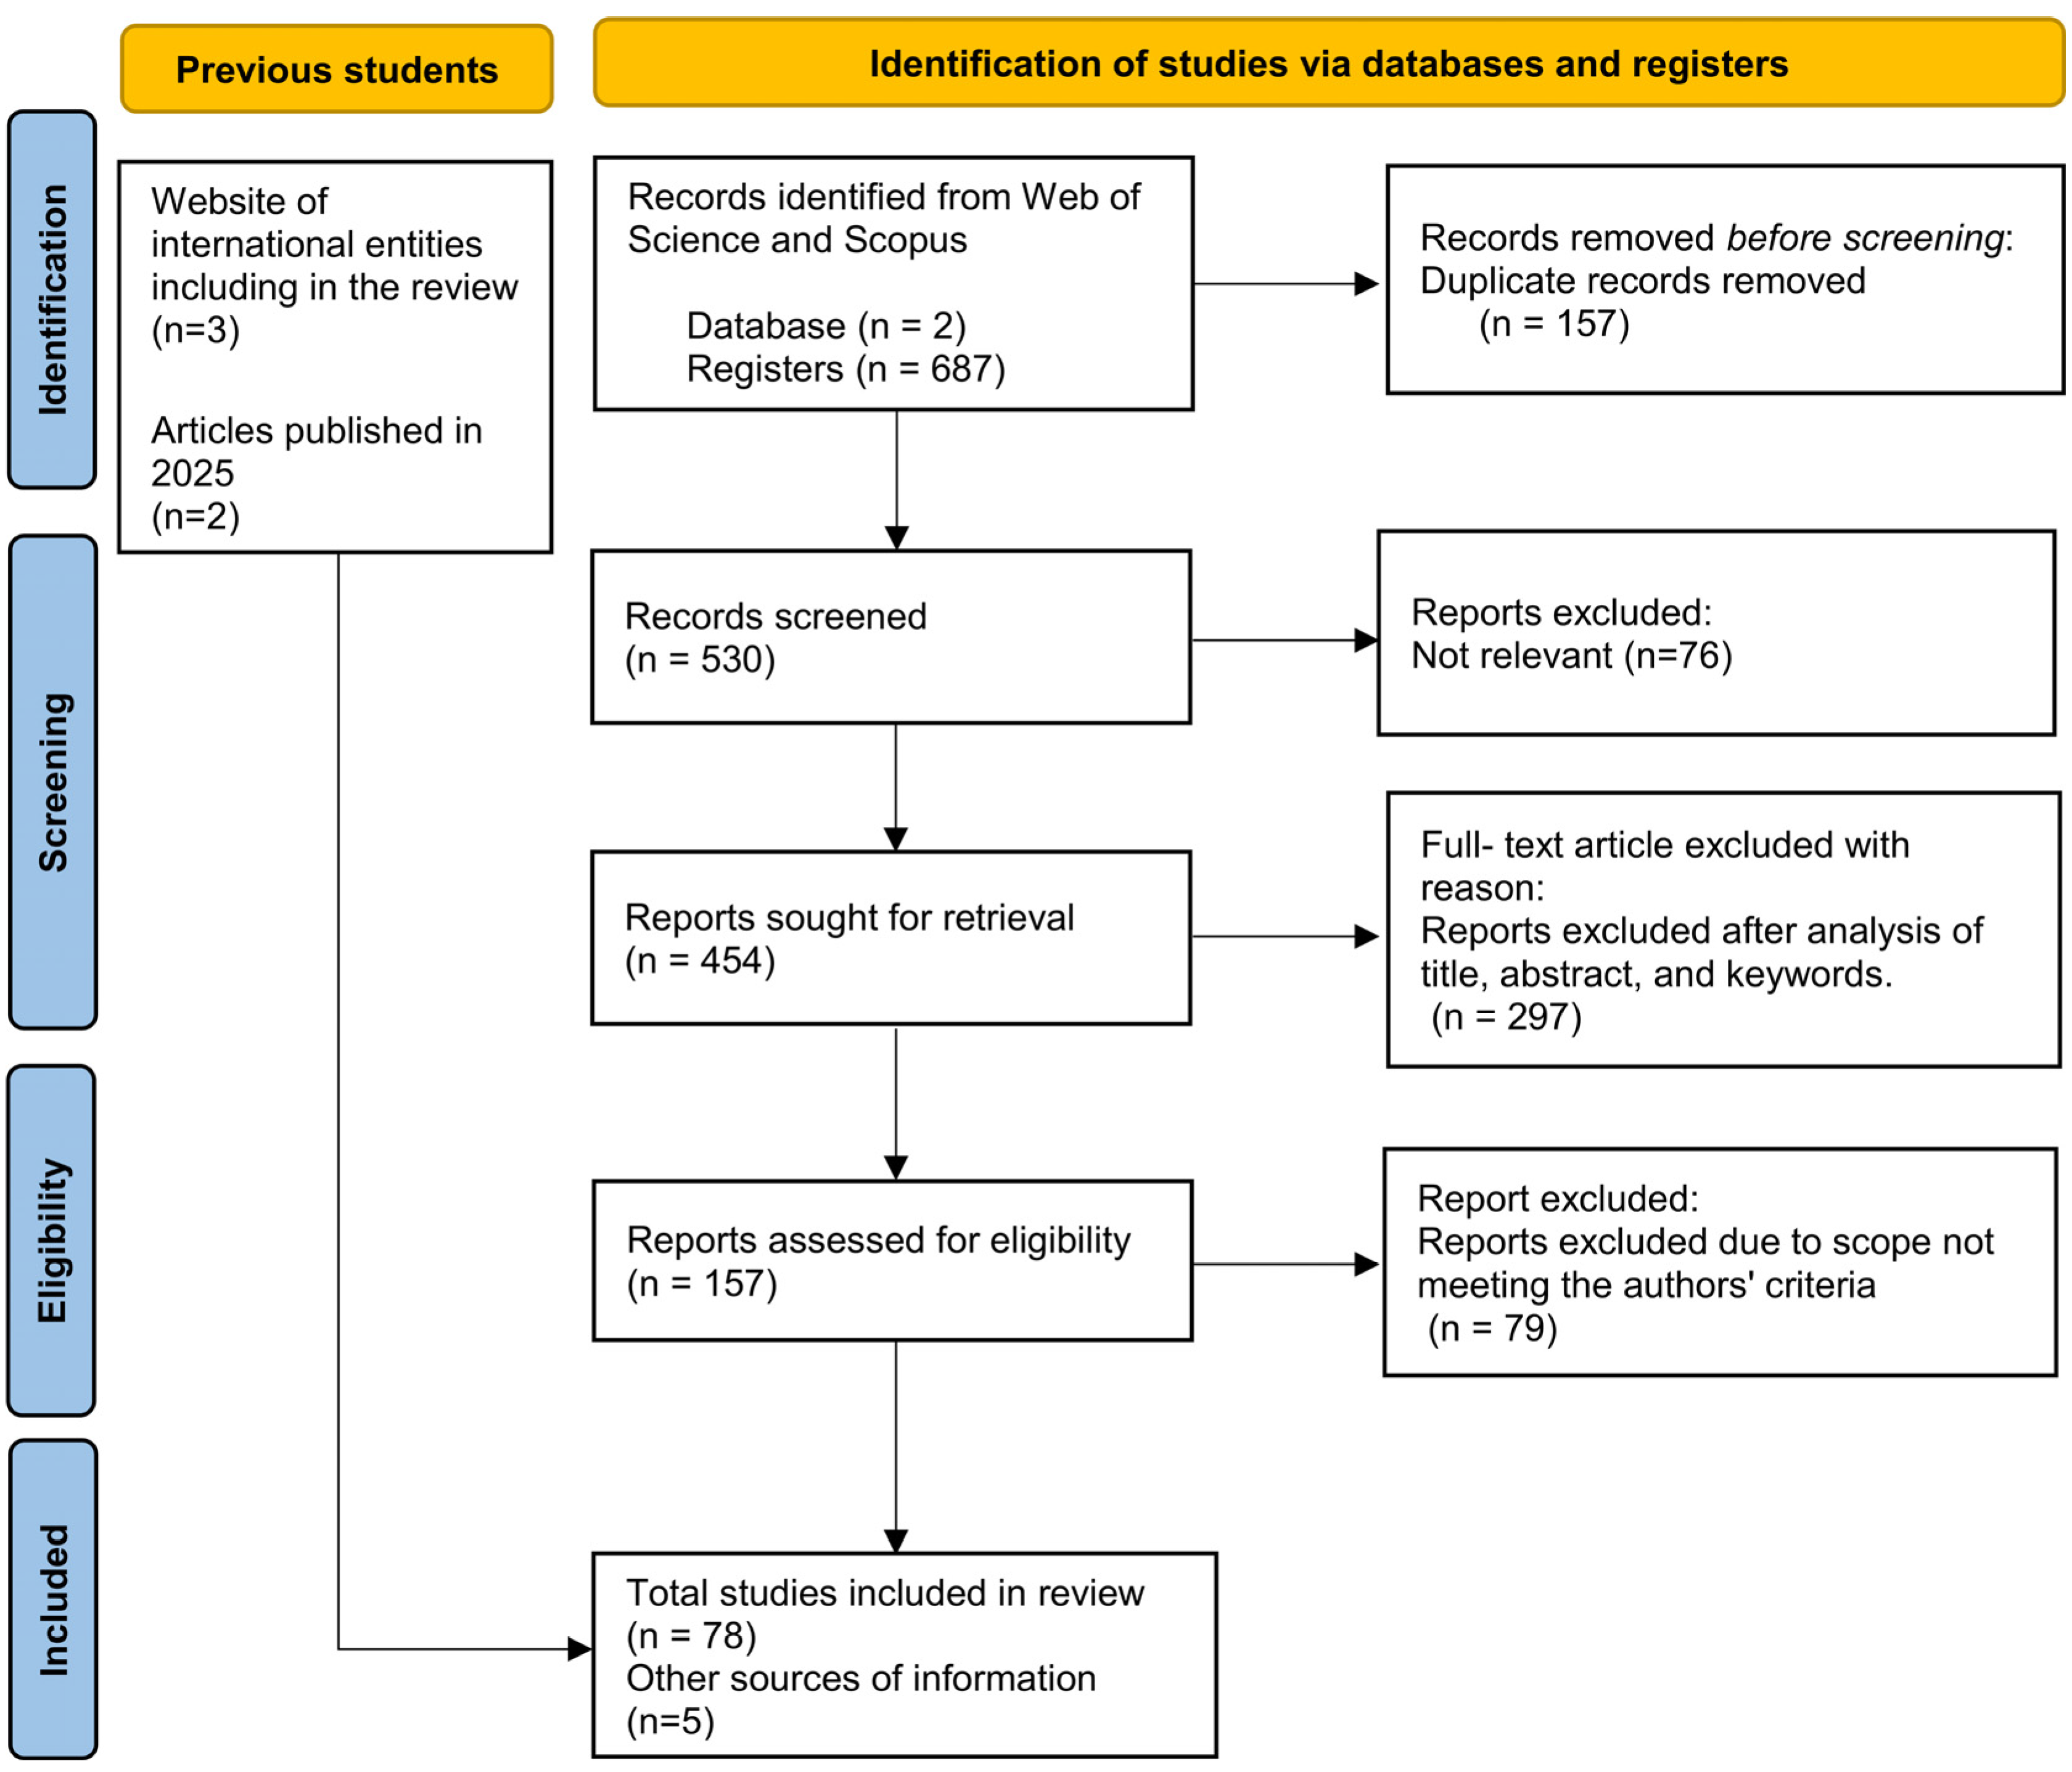
3.2. PRISMA Analysis

In this section, it is presented the detailed analysis of the articles identified by the use of the PRISMA methodology.

3.2.1. Spatial Data Infrastructures (SDI) in the Maritime-Port Sector

Sarabia-Jácome et al. [28] presented the Seaport Data Space (SDS), developed based on the Industrial Data Space (IDS) reference architecture model in the port of Valencia, Spain. The SDS provided secure communication between port stakeholders, overcoming limitations of traditional Electronic Data Interchange (EDI) systems and Port Community Systems (PCS). In it is architecture, technologies such as the software PostGIS, the Python package pandas, and the JavaScript library Leaflet enabled the integration and visualisation of geographical data. The results demonstrate significant improvements in coordination between stakeholders, reduction of operational costs, reuse of information and optimisation of ship transit time [28]. Although this literature represents a significant advance in the joint implementation of SDI and GIS, it was one of the few studies that most closely aligned with the objectives of the present review. To expand this analysis, the research conducted in Greece is explored, where the application of SDI along the coast represented an efficient alternative solution for the organisation and for the distribution of geospatial information through the Web [98]. In this context, the stakeholders obtain access to high-quality spatial data through a customised open-source platform on marine and coastal activities [98]. Furthermore, another approach in Greece, based on marine spatial planning (MSP) using the SMEP (Smart Marine Ecosystem-based Planning) method, integrates SDI to promote more dynamic and participatory marine governance [99]. The researchers developed a Marine SDI with practical implementation guidelines, where GIS played a crucial role in the management and analysis of the spatial data. Within the SDI framework, GIS was essential for managing and analysing spatial data, ensuring interoperability to apply the International Hydrographic Organisation’s (IHO) S-100 data model [99]. These works highlight the strategic importance of SDIs in the maritime-port sector, demonstrating how the integration of technologies such as GIS and standards like the IHO’s S-100 can optimise geospatial data management, promote participatory governance, and expand access to critical information for decision making.
The relevance of SDIs in the maritime context can also be observed in several studies on marine spatial data (marine SDI), in which the European Union’s Infrastructure for Spatial Information in the European Union (INSPIRE Directive) was applied. These studies analysed, for example, the detection of Ireland’s MSP [100], the effectiveness of the INSPIRE Directive in sharing marine data that support MSP [101], the risks and vulnerability of coastal regions to hurricanes [102], water chemistry in European maritime basins [103], and mapping of underwater cultural heritage [104]. Additionally, research explored the adaptation of the SDI concept, proposed by the INSPIRE directive, for maritime navigation [105]. In this scenario, GIS played an essential role in managing spatial information, contributing to navigation safety and efficiency. A relevant example was the comparative analysis of geoportals from Poland (Geoportal 2) and Italy (Il Nuovo Visualizzatore-Geoportale Nazionale), which, despite the geoportals having good technical, organisational and legal quality, the authors face challenges such as fragmentation and lack of data harmonisation, limiting full interoperability in the European SDI [106]. Another case of Marine SDI implementation was in Croatia, developed in compliance with INSPIRE, which offers access to high-quality marine spatial data via geoportal [35]. This study proposed a methodology for prioritising thematic data (hydrographic, oceanographic, maritime and biological) within the SDI, reinforcing the importance of stakeholder engagement to align the system with user needs and ensure its effectiveness [35].
Marine SDI has emerged as a fundamental strategic approach for the integration and management of geospatial data, based on international policies and standards such as INSPIRE, United Nations Guide for Global Geospatial Information Management Standards (UNGGIM), and Open Geospatial Consortium (OGC). The successful implementation of SDI crucially depends on the harmonisation of protocols, active stakeholder involvement, and the adoption of advanced technological platforms that enable the sharing and analysis of high-quality geographic information across different sectors and regions. Despite its relevance, this study identified a scarcity of publications specifically addressing the integration between SDI and GIS in port management, based on the types of geographic datasets and priority functionalities for interoperability among stakeholders such as port authorities, concessionaires, and the external public.

3.2.2. GIS in the Maritime-Port Sector

The global maritime sector faces complex challenges, which include issues ranging from traffic control, security, and geopolitical concerns to human rights and maritime pollution. In this context, the use of advanced technologies, such as GIS, has been fundamental for the management and monitoring of these issues. In the case of maritime traffic monitoring at the Port of Yeosu, South Korea, a pilot software “V-REMO” was developed based on ship movement analysis using one of the existing approaches in GIScience, the RElative MOtion (REMO) approach, for the visualisation of results on two-dimensional electronic navigation charts [107]. GIS was fundamental in visualising ship movement patterns and providing effective support to the maritime traffic control system [107]. In another study, the Ship Navigation Information Service System (SNISS), GIS was also used as a real-time visualisation platform for the Northeast Passage (NEP) Route in the Arctic [108]. Using a 3D GIS platform and Big Earth Data (an earth observation data platform) in Cesium software, SNISS provides intelligent and interactive navigation analyses, processing sea ice and weather data in real time to optimise routes [108].
In the field of maritime safety, Chou et al. [109] analysed the integration of AIS data, GIS, and e-chart (electronic maritime navigation chart) to identify the main causes of maritime accidents in the port of Kaohsiung, Taiwan. The study showed that the synergy of the three systems was efficient in revealing that most accidents occurred within the port’s jurisdiction area [109]. Studies conducted in China show that a GIS-based intelligent algorithm optimised maritime traffic safety in the Bohai Sea, calculating relative positions and probabilities of encounters between ships. This system, based on a traffic simulation model, allows efficient management of maritime transport through scenario analysis [110]. Spatial analysis of data from the Global Integrated Shipping Information System (GISIS) was also used to assess maritime accidents between 2010 and 2019, applying advanced techniques such as density mapping and hotspot analysis [111].
In conflict contexts, QGIS was used as a visual tool to assess the impact of war on the Al Hudaydah container terminal in Yemen, revealing the lack of reliable information in some ports for monitoring port activities [112]. Additionally, AIS and GIS data were useful for mapping the movement of fishing ships in Taiwan, aiming to identify situations of forced labour and labour abuses [113].
In the environmental area, several studies explore the application of remote detection techniques in identifying and tracking different types of maritime pollution. These studies range from monitoring pollutant gas plumes from ships [114,115,116,117], through the detection of oil spills on navigation routes [118,119,120] and garbage islands [121,122], to ocean water quality [123,124]. GIS-based models were developed to mitigate the impact of shipping emissions on dugong habitats in the Strait of Malacca and to assess pollution risks and simulate sustainable navigation scenarios [125]. Based on the Ship Emission Scenario Simulation Model (SESSM), which integrated AIS data, ship emission models, and GIS, they were also essential for real-time spatial analysis and estimating emissions from maritime traffic at the port of Keelung, Taiwan [126].
Based on these studies, GIS has played a fundamental role in driving energy transition and promoting sustainability in the maritime sector, offering detailed analyses on monitoring, risk prevention, and improving safety in the maritime-port sector, as well as the environmental impacts of port activity and maritime logistics. Through advanced modelling and spatial analysis techniques, GIS enables the development of mitigation strategies, providing stakeholders with a valuable decision-making tool for environmental impact analysis and sustainability projections. GIS thus becomes a fundamental tool in guiding investments in clean technologies, green infrastructure, and low-carbon operational practices in the complex maritime logistics ecosystem.

3.2.3. Web Tools for Geospatial Data Sharing

At the maritime-port interface, various studies have explored innovative solutions to visualise, manipulate, and manage spatial data in response to the digitalisation of maritime information, with emphasis on web-based tools that integrate stakeholders in shared data ecosystems. In coastal planning, the integration of communities and stakeholders in environmental and urban decisions has been accomplished through Public Participation GIS systems (PPGIS). In Norway, an online PPGIS facilitates public participation in aquaculture management [127], whilst in Australia (Kimberley), the system identifies coastal areas vulnerable to climate change and prioritises conservation zones [128]. In the Gulf of Mexico, PPGIS assists in raising awareness about environmental risks and developing adaptive strategies [129]. In Naples, its integration with the InterACT methodology optimised port-city planning, offering the port authority a collaborative platform with intuitive spatial visualisation, capable of combining cultural preservation and strategic decision making [130]. Kalyvas et al. [131] conducted a study to gather official sources of 19 classes of online maritime geospatial data, whose free accessibility (96.3% of the datasets) reflects the demand for transparency and collaboration in the sector. The study identified several main applications, such as support for the maritime industry, environmental monitoring, ship tracking, nautical weather forecasting, navigation aid systems, port information, and naval cartographic data.
SeaCharts is an open-source Python API designed for accessible and simplified visualisation and manipulation of Electronic Nautical Charts (ENC) along the Norwegian coast [132]. The API allows programmable access to spatial data, improving autonomous navigation and decision making by optimising GIS functionalities. SeaCharts offers 2D functionalities such as polygon manipulation in-depth data, interactive control and simulation (route planning, collision prevention and risk analysis) and route optimisation for autonomous and remotely controlled ships [132]. Additionally, a GIS system was used to manage electronic navigation service data, based on the IHO S-100 model. This platform efficiently organises and shares large volumes of geographical data between ships and land facilities, optimising performance through indexed data collections for internal stakeholders [133]. Based on specialised solutions for nautical data manipulation, such as SeaCharts and systems based on the S-100 model, WebGIS platforms have emerged as strategic tools to democratise access to geospatial information in the maritime sector.
WebGIS has also been widely used in the maritime context as platforms for sharing geographical information. These platforms use web technology for communication between a server and a client, offering an interface that allows users to visualise, integrate, process, and analyse geospatial data [134]. With the use of interactive maps, different users and organisations can share geographical data through computers, browsers, or web applications [135,136]. WebGIS can be developed on various platforms, such as ArcGIS Online, Carto, Mapbox, and GIS Cloud [137]. Several official websites of international port authorities have made these platforms available to external stakeholders, providing access to detailed interactive maps about the port area and activities, as is the case with Ports of Paraná (Brazil) [138], Hamburg (Germany) [139], and Oslo (Norway) [140]. An additional example is Greece, which has a WebGIS application developed in ArcGIS, integrated with an electronic awareness platform for ship emergencies (ES.AVE), aiming to alert the public on land about maritime pollution [141]. In Poland, the marine cadastre was entirely composed of geographical data, which were integrated and disseminated through the GeoServer server [142]. These examples highlight the growing importance of WebGIS as a strategic tool for the efficient sharing of geographical information in the maritime sector, promoting more collaborative and informed management of port and maritime activities.
Other work carried out by Fernández et al. [143] and Fernández et al. [144] stands out as pioneering contributions to the integration of GIS in port data management platforms. The integration of WebGIS with open-source computer architecture was essential for optimising various operations, such as real-time monitoring of operations, data visualisation, management of large volumes of information, and strategic decision support [143]. An example of this is the GIS integrated into the Future Internet Platform (FIWARE) at the Port of Las Palmas de Gran Canaria, which uses Big Data and IoT to optimise data management and improve operational decisions. The SmartPort, developed with FIWARE, uses the Glob3 Mobile (G3M) framework for interactive three-dimensional visualisation of real-time port data [144]. Additionally, Markris et al. [145] developed an operational forecasting platform (OFP) in WebGIS (Accu-Waves) to monitor and predict waves and sea conditions in 50 international ports. The platform offers interactive GIS maps accessible to ships, with forecasts updated every three hours and a three-day forecast for port basins [145]. These examples illustrate how the integration of web tools in the port sector not only enhances the visualisation and analysis of geospatial data but also contributes to more dynamic and efficient port management. However, despite the advantages, these platforms may present limitations, such as unstable versions, limited support, high costs, restricted access, and challenges related to visualisation quality and ease of use.

3.2.4. Implementation of Digital Technologies and Artificial Intelligence Models

In the integration of GIS into the port sector, DTs and IoT have improved efficiency, automation, and interconnectivity in the maritime sector and have played a fundamental role in improving operational efficiency, process automation and intelligent connectivity, promoting a more dynamic and interconnected port environment. In the context of Industry 4.0, DTs enable the transformation of physical systems into detailed digital models, which, when combined with simulators and machine learning (ML), allow for the prediction of failures and optimisation of operations in container terminals and ports [46,146]. IoT has been widely applied in Maritime Monitoring Systems (MMS), optimising naval traffic management in exclusive economic zones (EEZ) [147], as well as enabling satellite communication for monitoring and tracking refrigerated containers [148] and contributing to risk analysis, vulnerability identification, and security enhancement in port environments [149,150]. Recent studies have reviewed the impact of IoT in the maritime sector and concluded that the Fourth Industrial Revolution, driven by IoT, AI, big data analytics, and cloud Computing, has reshaped this industry [149,150,151]. In this context, the integration of GIS with these technologies enables near real-time analysis of large volumes of spatial data, enhancing port management through more precise forecasts, process automation, and pattern detection. This advancement results in greater information security, operation optimisation, improved interoperability, and increasing integration of AI and ML, boosting efficiency and automation in the sector [152].
With the advancement of AI, machine learning models are gaining reliability among stakeholders, as they are tools capable of processing and analysing different types of data and interacting with various devices (interoperability) in a port environment [153]. ML is capable of processing large volumes of data and multiple variables simultaneously, based on learning, making it an essential tool for spatial data analysis [154]. In the maritime-port sector, machine learning (ML) has been employed, especially when considering the growing challenges in logistics data management and modelling, security, and sustainability faced by modern ports. In the literature, ML has established itself as a tool that offers innovative solutions to analyse complexity in management and significant opportunities to optimise productivity, operational efficiency, and sustainability [155]. When integrated with GIS, these technologies have shown to be a trend in various areas of port operations. Table 3 presents several studies that have applied GIS alongside machine learning, highlighting the role of advanced computational techniques in optimising port operations, demand forecasting, maritime risk assessment, and enhancing supply chain management.
The integration of technologies such as GIS, predictive models, machine learning, and remote sensing has proven to be fundamental for resolving challenges in the maritime-port sector. The combination of these technologies allows for the prediction of congestion, optimisation of logistical flows, and development of customised solutions for green and sustainable ports, considering local specificities [157]. Additionally, the use of models such as LSTM for congestion forecasting facilitates operational planning, optimises infrastructure, and reduced costs [158]. GIS also improves logistical resilience, enabling the visualisation of disruptions and vulnerability analysis, which contributes to faster and more effective decisions [172]. GIS also improves logistical resilience, enabling the visualisation of disruptions and vulnerability analysis, which contributes to faster and more effective decisions [172]. Despite the advances, studies on the integrated implementation of GIS across all sectors involved in the strategic and operational planning of maritime ports are still lacking.

3.2.5. Challenges and Trends in Maritime GIS

The implementation of SDI and GIS in the maritime sector varies according to the stage of digital transition and planning of each port, resulting in uneven technological adoption [173]. In Greece, the main challenge in the marine SDI was in building common understanding, consensus, and partnerships among stakeholders in the integration of marine information and data. Furthermore, difficulties with the integration of heterogeneous data in different formats (printed and digital copies), fragmented and with different degrees of quality (description and accuracy), and the dispersion of data across various institutions caused delays and difficulties in data availability [98]. The absence of standard models and procedures in geospatial data acquisition, coupled with the lack of adequate metadata, the impact of the pandemic, and long data homogenisation processes, also hindered the implementation of marine SDI [98].
The effective implementation of GIS depends on access to robust databases, especially for handling real-time data such as storage, modelling, analysis and visualisation [33]. This implementation faces challenges due to the fact that GIS architectures are traditionally optimised for static data, making their adaptation to dynamic phenomena more complex [174,175]. The implementation of GIS in dynamic environments, such as port monitoring, presents specific challenges such as the complexity in representing and analysing multidimensional data in real time, integration of heterogeneous information from different sensors with varied formats and protocols, and scalability limitations in processing large volumes of data. Additionally, hardware and software restrictions impact infrastructure costs and requirements, whilst interoperability problems and the need for technical training hinder its adoption [143]. In 3D route analysis, difficulties were also faced in integrating sea ice data in irregular grids, which cannot be displayed directly on 3D GIS platforms such as Cesium software [108]. The diversity of formats and resolutions of these data made analysis and visualisation more complex, whilst the high processing required by Big Earth Data imposed significant barriers to real-time navigation. Additionally, 2D maps proved to be inadequate for the Arctic due to area distortions and navigation difficulties. In this challenging context, the 3D GIS of the SNISS platform was essential to optimise routes with cloud computing support [108], demonstrating that three-dimensional solutions can overcome some of the limitations inherent to traditional two-dimensional systems.
In commercial platforms such as ArcGIS Server, GeoMedia and WebMap, data interoperability continues to be a significant obstacle due to the diversity of geospatial models and representations [176]. Effective information sharing in the maritime-port sector is hindered by a combination of complex factors such as lack of knowledge about existing datasets, intellectual property issues, pricing, and deficiencies in the structuring and availability of metadata [150]. These limitations are intensified by incompatibility between different technological systems, the absence of institutional incentives, organisational barriers such as resistance to change and the lack of adequate guidelines for integrating different types of data. Gourmelon et al. [177] emphasise that the integration of GIS with traditional maritime monitoring systems requires a complete redesign to improve operational efficiency and meet contemporary demands. This transformation is necessary in big data management and in the development of dynamic and interactive platforms that can respond in real time to the needs of the maritime-port sector. Despite these obstacles, when properly implemented, this integration allows corporate data to be converted into georeferenced layers, enabling sophisticated spatial analyses such as identification of distribution patterns, proximity analyses and scenario modelling in interactive digital maps. This approach transforms the way organisations and stakeholders visualise and interpret their strategic information.
These limitations manifest themselves in various practical applications. Fernández et al. [144], when developing a big data management platform with FIWARE, identified limitations in reliability, scalability and data processing speed to support the user interface. Similarly, in maritime traffic simulation modelling, the intelligent GIS-based algorithm for finding ships, which required a computationally intensive process with slow execution, limited the application in scenarios requiring fast responses [110]. In another application involving container terminals, GIS presented limitations in the availability and quality of input data, such as high-resolution satellite images and precise navigation information for capturing the mobility and content of cargo [112]. In this study, GIS was primarily restricted to spatial occupation analysis, allowing geographical comparisons but not enabling direct analyses in terms of TEUs (Twenty-foot Equivalent Units), a fundamental metric for efficient management of port terminals. In addition to technical challenges in terms of data protection, the integration of geospatial technologies faces critical cybersecurity challenges, especially in international contexts where systems with artificial intelligence operate under different regulatory jurisdictions. Vulnerabilities include breaches in communication systems and sensor manipulation, a situation aggravated by the lack of unified legal standards for cross-border autonomous operations [178]. This scenario requires urgent solutions on three fronts, such as international regulatory harmonisation, strengthening of cybersecurity and development of resilient infrastructure to mitigate emerging risks [178].
Environmental analysis in the maritime sector requires qualified professionals to manage the complexity of geospatial data integration, particularly given technological limitations and the need for accurate and up-to-date information. In environmental monitoring, challenges include obtaining reliable geospatial data and assessing the impact of nitrogen dioxide (NO2) emissions from the maritime sector, which is hindered by the scarcity of monitoring stations, especially in remote areas [114]. Additionally, ship emissions analysis faces obstacles such as the need for specialised technical training, the unavailability of updated data, and the limitations of GIS in considering dynamic factors like operational costs and real-time weather conditions [126]. Similarly, Sentinel-1 SAR-based monitoring has demonstrated limitations, as although it is effective in detecting oil spills, its accuracy is reduced in adverse conditions such as fog and darkness, requiring complementary data sources such as maritime traffic information [179].
Despite advancements in the integration of GIS into maritime data management systems, the complexity of maritime information systems still hinders improvements in data analysis quality, security, and adaptation to technological innovations. There are limitations in areas such as accessibility, visualisation, and spatial data manipulation, as well as a lack of up-to-date and reliable information to support critical decision making in the sector. The integration of efficient SDI and GIS is essential for expanding access to and the use of large volumes of data, yet the literature shows little application in the port sector, particularly in the development of collaborative and integrative software for information transparency among stakeholders, a crucial element for coordinated and efficient operations. Furthermore, legal and operational restrictions limit the effectiveness of these tools, highlighting the need for technological and methodological advancements to optimise the monitoring of maritime activities in an increasingly complex regulatory environment.

3.2.6. Future Perspectives of GIS in the Maritime-Port Sector

The literature review highlights the challenges in managing maritime information systems, particularly regarding data quality, interoperability, and security, as well as adaptation to technological innovations. While SDIs and GIS are essential tools for efficiently managing large volumes of data, there remains a significant gap in the development of integrated and collaborative solutions that promote transparency and information sharing among various stakeholders in the maritime-port sector.
Future trends point towards the development of tools more aligned with the sector’s needs, aiming not only to enhance port management efficiency but also to drive a comprehensive digital transformation in the logistics and transport industries. This progress extends beyond operational optimisation, contributing to environmental sustainability by enabling more efficient processes and data-driven decision making, which are essential for the sector’s modernisation and global competitiveness.
In this context, the integration of multi-criteria analysis (MCA) into decision support systems emerges as a strategic approach for improving marine SDI planning and increasing stakeholder engagement [101,109]. MCA allows for the simultaneous assessment of multiple factors, optimising planning quality and ensuring that data are more useful for all parties involved. As nearly all stakeholders are also data producers, adopting this method aims to maximise the operational efficiency of marine SDIs at all stages of development, ensuring greater coherence in information management. Additionally, studies indicate advancements in data transfer rates and the usability of GIS systems, as well as the implementation of predictive solutions and automated control, leveraging existing data infrastructures [144].
In the maritime-port context, the enhancement of tools such as PPGIS for public participation, intelligent algorithms for maritime traffic management, and models for environmental monitoring represent promising fields. However, challenges remain, including high computational time, issues related to scale and spatial resolution, and the need to improve data reliability, particularly in complex scenarios involving security and conflicts. When visualising multiple simultaneous ship movements, maritime traffic control operators must interpret data through clear and intuitive visual representations, which are essential for quick and accurate decision making. Although AIS data are available in real time, its integration with GIS, meteorological, and tidal information could enrich the understanding of navigation conditions and maritime safety [107].
This study identified that integrating GIS with emerging technologies, such as artificial intelligence and machine learning, can enhance pattern detection, risk prediction, and route optimisation, always considering ethical and cybersecurity aspects in the collection and processing of maritime geospatial data. Although the currently available data are not yet sufficient to fully support European MSP processes, the application of INSPIRE is expected to strengthen data interoperability in the coming years [101]. The integration of MSP plans through national SDIs could improve planning coordination and minimise issues related to data updating and consistency [101].
Another growing trend is the integration of GIS into management platforms, aligning with the energy and digital transition that is fundamentally transforming the maritime-port sector. This development strengthens the creation of innovative solutions that meet stakeholder needs, driving operational efficiency, safety, and decision making with environmental sustainability in the logistics, transport, and mobility sectors. This evolution represents not only an incremental improvement but a paradigm shift in how geospatial data are utilised to optimise processes and promote more sustainable practices in the global maritime industry.

4. Conclusions

The bibliometric analysis, conducted based on scientific articles from the past decade on GIS and SDI in the maritime-port sector, provided a comprehensive overview of the main areas of geospatial data application in the maritime-port sector. The statistics extracted using bibliometrix revealed an annual growth rate of 8.59%, demonstrating an upward trend in the adoption of geospatial technologies for risk analysis, operational efficiency, and sustainable planning in the sector.
The thematic map analysis revealed that topics such as “GIS”, “spatial analysis”, and “management systems” are highly relevant and well developed in the maritime-port sector, playing a central role in research. Meanwhile, topics such as “accessibility”, “interoperability”, and “environmental protection” show potential but still lack greater integration and impact in the sector. Emerging technologies such as “remote sensing”, “artificial intelligence”, and “risk assessment” are on the rise and are expected to become drivers of innovation. However, assessment methods, although recognised, are still underexplored, suggesting future opportunities, especially with the advancement of artificial intelligence. Furthermore, the absence of the term “SDI” in the map suggests a possible gap in the literature or its practical adoption in the maritime-port sector, reinforcing the need for future research on interoperability and spatial data integration.
The bibliometric analysis revealed that, despite its strategic relevance, implementation of the Marine SDI remains limited, especially in relation to its potential for interoperability and integrated data analysis. GIS has been underused, being employed mainly for visualisation and monitoring, with few studies exploring its integration into collaborative data management platforms. Although it is essential for various applications in the maritime industry, such as ship monitoring, global accidents and impact assessments, the potential of GIS is not yet being fully utilised in port data management systems.
In future research, the authors intend to take a more comprehensive approach to geospatial data management and information sharing between stakeholders in ports. Interviews with Port Authority representatives and experts in the field will be conducted in order to investigate how geographic information is managed and which data are prioritised in internal port management systems. The proposal aims to understand the different hierarchical levels of visualisation of geographical components, both for the general public and for internal port stakeholders. In this context, port websites will also be analysed as initial points of access to information for external stakeholders, allowing an in-depth investigation into how these digital platforms can be used strategically to promote institutional transparency. This approach shows great potential for optimising port asset management, expanding levels of organisational transparency and contributing to port digital transition analyses. It also supports environmental sustainability strategies and maximises value for stakeholders and society in general.

Author Contributions

C.I. and T.B. provided the initial concept, research design, data collection, and analysis approach and wrote the manuscript; C.I. and F.d.R.F.C. helped with data collection and analysis approach; C.I. and T.B. helped revise the manuscript. All authors have read and agreed to the published version of the manuscript.

Funding

The contents of this article were produced within the scope of the Agenda “NEXUS—Pacto de Inovação— Transição Verde e Digital para Transportes, Logística e Mobilidade”, financed by the Portuguese Recovery and Resilience Plan (PRR), with no. C645112083-00000059 (investment project no. 53).

Institutional Review Board Statement

Not applicable.

Informed Consent Statement

Not applicable.

Data Availability Statement

The original contributions presented in the study are included in the article, further inquiries can be directed to the corresponding author.

Acknowledgments

We express our sincere gratitude to the NEXUS Agenda for enabling our participation in this significant project.

Conflicts of Interest

The authors declare no conflicts of interest.

References

  1. United Nations. Global Maritime Trade Could Suffer Biggest Decline in Decades in 2023. Available online: https://news.un.org/en/ (accessed on 26 December 2024).
  2. Wu, F.; Bai, J.; Zhu, B.; Ma, W.; Sun, J.; Zheng, G. Reviewing Geo-Information Science for Port Information Management in China. In Proceedings of the ICTIS 2013: Improving Multimodal Transportation Systems—Information, Safety, and Integration, Wuhan, China, 29 June–2 July 2013; American Society of Civil Engineers: Reston, VA, USA, 2013; pp. 2139–2145. [Google Scholar] [CrossRef]
  3. Ray, C.; Dréo, R.; Camossi, E.; Jousselme, A.-L.; Iphar, C. Heterogeneous Integrated Dataset for Maritime Intelligence, Surveillance, and Reconnaissance. Data Brief 2019, 25, 104141. [Google Scholar] [CrossRef] [PubMed]
  4. Zrodowski, C.; Kniat, A.; Pyszko, R. Geographic Information System (GIS) Tools for Aiding Development of Inland Waterways. Fleet. Pol. Marit. Res. 2006, 13, 102–112. [Google Scholar]
  5. McCabe, R.; Flynn, B. Under the radar: Ireland, maritime security capacity, and the governance of subsea infrastructure. Eur. Secur. 2023, 33, 324–344. [Google Scholar] [CrossRef]
  6. Ovando, D.; Bradley, D.; Burns, E.; Thomas, L.; Thorson, J.T. Simulating Benefits, Costs and Trade-offs of Spatial Management in Marine Social-ecological Systems. Fish Fish. 2024, 25, 218–234. [Google Scholar] [CrossRef]
  7. Bonnevie, I.M.; Hansen, H.S.; Schrøder, L. SEANERGY—A Spatial Tool to Facilitate the Increase of Synergies and to Minimise Conflicts Between Human Uses at Sea. Environ. Model. Softw. 2020, 132, 104808. [Google Scholar] [CrossRef]
  8. Kao, S.-L.; Chang, K.-Y.; Hsu, T.-W. A Marine GIS-based Alert System to Prevent Vessels Collision with Offshore Platforms. J. Mar. Sci. Technol. 2021, 29, 597–608. [Google Scholar] [CrossRef]
  9. Wang, L.; Zhang, Z.; Zhu, Q.; Ma, S. Ship Route Planning Based on Double-Cycling Genetic Algorithm Considering Ship Maneuverability Constraint. IEEE Access 2020, 8, 190746–190759. [Google Scholar] [CrossRef]
  10. Fagerholt, K.; Lindstad, H. TurboRouter: An Interactive Optimization-Based Decision Support System for Ship Routing and Scheduling. Mar. Econ. Logist. 2007, 9, 214–233. [Google Scholar] [CrossRef]
  11. Dong, Z.; Zhou, Y.; Bao, X. A Short-Term Vessel Traffic Flow Prediction Based on a DBO-LSTM Model. Sustainability 2024, 16, 5499. [Google Scholar] [CrossRef]
  12. Huang, I.-L.; Lee, M.-C.; Chang, L.; Huang, J.-C. Development and Application of an Advanced Automatic Identification System (AIS)-Based Ship Trajectory Extraction Framework for Maritime Traffic Analysis. J. Mar. Sci. Eng. 2024, 12, 1672. [Google Scholar] [CrossRef]
  13. Veldman, S.; Buckmann, E. A model on container port competition: An application for the West European container hub-ports. Marit. Econ. Logist. 2003, 5, 3–22. [Google Scholar] [CrossRef]
  14. Benedecti, R.C.; Silva, V.M.D.; da Costa, G.A.A. Integrated simulation of an inland container terminal and waterway service for enhancing the maritime supply chain connectivity between Joinville and Itapoá Port. Lat. Am. Transp. Stud. 2024, 2, 100019. [Google Scholar] [CrossRef]
  15. Önden, İ.; Pamucar, D.; Deveci, M.; As, Y.; Birol, B.; Yıldız, F.Ş. Prioritization of transfer centers using GIS and fuzzy Dombi Bonferroni weighted Assessment (DOBAS) model. Expert Syst. Appl. 2024, 238, 121827. [Google Scholar] [CrossRef]
  16. Claramunt, C.; Devogele, T.; Fournier, S.; Noyon, V.; Petit, M.; Ray, C. Maritime GIS: From monitoring to simulation systems. In Information Fusion and Geographic Information Systems; Popovich, V.V., Schrenk, M., Korolenko, K.V., Eds.; Lecture Notes in Geoinformation and Cartography; Springer: Berlin/Heidelberg, Germany, 2007; pp. 34–44. [Google Scholar] [CrossRef]
  17. Chen, Q.; Zhang, H.; Lau, Y.-Y.; Liu, K.; Ng, A.K.Y.; Chen, W.; Liao, Q.; Dulebenets, M.A. A Geographic Information System (GIS)-Based Investigation of Spatiotemporal Characteristics of Pirate Attacks in the Maritime Industry. J. Mar. Sci. Eng. 2023, 11, 2295. [Google Scholar] [CrossRef]
  18. Halder, B.; Juneng, L.; Abdul Maulud, K.N.; Banik, P.; Yaseen, Z.M. Remote Sensing-Based Decadal Landform Monitoring in Island Ecosystem. J. Coast. Conserv. 2024, 28, 74. [Google Scholar] [CrossRef]
  19. Guo, Z.; Qiao, Y.; Umprasoet, W.; Sun, Y.; Plathong, S.; Jantharakhantee, C.; Zhang, Z. Integrating Issue-Oriented Solution of Marine Spatial Planning (MSP): A Case Study of Koh Sichang in Thailand. Ocean Coast. Manag. 2024, 258, 107381. [Google Scholar] [CrossRef]
  20. Huang, Z.; Nanson, R.A.; McNeil, M.; Wenderlich, M.; Gafeira, J.; Post, A.L.; Nichol, S.L. Rule-Based Semi-Automated Tools for Mapping Seabed Morphology from Bathymetry Data. Front. Mar. Sci. 2023, 10, 123678. [Google Scholar] [CrossRef]
  21. Parra, L. Remote Sensing and GIS in Environmental Monitoring. Appl. Sci. 2022, 12, 8045. [Google Scholar] [CrossRef]
  22. Photis, M.; Panayides, M.; Song, D.-W. Port Integration in Global Supply Chains: Measures and Implications for Maritime Logistics. Int. J. Logist. Res. Appl. 2009, 12, 133–145. [Google Scholar] [CrossRef]
  23. Manikandan, J.; Mangaiyarkarasi, V.; Mahalakshmi, S.; Karthigeyan, S.; Varsha, G. Development of an Integrated Water Body Surveillance System for Environmental Monitoring and Resource Management. In Proceedings of the 2024 International Conference on Communication, Computing and Internet of Things (IC3IoT), Chennai, India, 17–18 April 2024; pp. 1–5. [Google Scholar] [CrossRef]
  24. Kaklis, D.; Varlamis, I.; Giannakopoulos, G.; Varelas, T.J.; Spyropoulos, C.D. Enabling Digital Twins in the Maritime Sector through the Lens of AI and Industry 4.0. Int. J. Inf. Manag. Data Insights 2023, 3, 100178. [Google Scholar] [CrossRef]
  25. Zhang, Z.; Song, C.; Zhang, J.; Chen, Z.; Liu, M.; Aziz, F.; Yap, P.S. Digitalization and Innovation in Green Ports: A Review of Current Issues, Contributions and the Way Forward in Promoting Sustainable Ports and Maritime Logistics. Sci. Total Environ. 2024, 912, 169075. [Google Scholar] [CrossRef] [PubMed]
  26. Hasan, K.R.; Zhang, W.; Shi, W. A Sustainable Port-Hinterland Container Transport System: The Simulation-Based Scenarios for CO2 Emission Reduction. Sustainability 2023, 15, 9444. [Google Scholar] [CrossRef]
  27. Buonomano, A.; Del Papa, G.; Giuzio, G.F.; Palombo, A.; Russo, G. Future Pathways for Decarbonization and Energy Efficiency of Ports: Modelling and Optimization as Sustainable Energy Hubs. J. Clean. Prod. 2023, 420, 138389. [Google Scholar] [CrossRef]
  28. Sarabia-Jácome, D.; Palau, C.E.; Esteve, M.; Boronat, F. Seaport Data Space for Improving Logistic Maritime Operations. IEEE Access 2020, 8, 4372–4382. [Google Scholar] [CrossRef]
  29. Marine Traffic—AIS Data. Available online: https://www.marinetraffic.com/ (accessed on 30 April 2024).
  30. ECDIS. Maritime Navigation Specialists. Available online: https://ecdis.org/ (accessed on 30 April 2024).
  31. MDA. Situational Indication Linkages. Available online: https://www.msil.go.jp/msil/htm/main.html?Lang=1 (accessed on 30 April 2024).
  32. Lam, S.Y.W.; Yip, T.L. The Role of Geomatics Engineering in Establishing the Marine Information System for Maritime Management. Marit. Policy Manag. 2008, 35, 53–60. [Google Scholar] [CrossRef]
  33. Schmidt, S.; Maudire, G.; Nys, C.; Sudre, J.; Harscoat, V.; Dibarboure, G.; Huynh, F. Streamlining Data and Service Centers for Easier Access to Data and Analytical Services: The Strategy of ODATIS as the Gateway to French Marine Data. Front. Mar. Sci. 2020, 7, 548126. [Google Scholar] [CrossRef]
  34. Emani, C.K.; Cullot, N.; Nicolle, C. Big Data Understandable: A Survey. Comput. Sci. Rev. 2015, 17, 70–81. [Google Scholar] [CrossRef]
  35. Tavra, M.; Jajac, N.; Cetl, V. Marine Spatial Data Infrastructure Development Framework: Croatia Case Study. ISPRS Int. J. Geo-Inf. 2017, 6, 117. [Google Scholar] [CrossRef]
  36. Scarlat, C.; Ioanid, A.; Andrei, N. Use of the Geospatial Technologies and Its Implications in the Maritime Transport and Logistics. Int. Marit. Transp. Logist. J. 2023, 12, 19–30. [Google Scholar] [CrossRef]
  37. Fernández, P.; Santana, J.M.; Ortega, S.; Trujillo, A.; Suárez, J.P.; Domínguez, C.; Santana, J.; Sánchez, A. SmartPort: A Platform for Sensor Data Monitoring in a Seaport Based on FIWARE. Sensors 2016, 16, 417. [Google Scholar] [CrossRef]
  38. Thomas, R.; Idol, T. Development of Spatial Data Infrastructures for Marine Data Management; OGC-IHO Marine SDI Concept Development Study (CDS). Available online: https://repository.oceanbestpractices.org/handle/11329/1551 (accessed on 30 April 2024).
  39. Lu, B.; Xu, X. Digital Transformation and Port Operations: Optimal Investment Under Incomplete Information. Transp. Policy 2024, 151, 134–146. [Google Scholar] [CrossRef]
  40. Lytra, I.; Vidal, M.-E.; Orlandi, F.; Attard, J. A Big Data Architecture for Managing Oceans of Data and Maritime Applications. In Proceedings of the ICE/ITMC 2017: 2017 International Conference on Engineering, Technology and Innovation, Madeira, Portugal, 27–29 June 2017; pp. 1216–1226. [Google Scholar] [CrossRef]
  41. Erasmus University. SmartPort. Available online: https://www.erim.eur.nl/smartporterasmus/ (accessed on 30 April 2024).
  42. Batista, T.; Carreira, D.; Moutinho, E. Os SIG na gestão portuária: O caso do porto de Sines. In Aplicaciones Tig en el Análisis Territorial—Transferencia a Universidad, Sector Público y Empresas; Nieto Masot, A., Ed.; Universidad de Extremadura: Cáceres, Spain, 2015; pp. 43–54. ISBN 978-84-608-2535-7. Available online: http://hdl.handle.net/10662/4435 (accessed on 1 April 2024).
  43. Nexus Lab. Nexus Agenda Project. Available online: https://nexuslab.pt/ (accessed on 30 April 2024).
  44. Hamburg Port Authority. SmartPORT Logistics. Available online: https://www.hamburg-port-authority.de/en/hpa-360/smartport (accessed on 30 April 2024).
  45. Tanger Med Port Authority. Vessel Reception Services. Available online: https://www.tangermedport.com/en/service/vessel-reception/ (accessed on 30 April 2024).
  46. González-Cancelas, N.; Orive, A.C.; Cabrero, J.V.; Flores, F.S. Digital Transformation in Spanish Port System. In Advances in Digital Transformation—Rise of Ultra-Smart Fully Automated Cyberspace; IntechOpen: London, UK, 2024. [Google Scholar] [CrossRef]
  47. Paraskevas, A.; Madas, M.; Zeimpekis, V.; Fouskas, K. Smart Ports in Industry 4.0: A Systematic Literature Review. Logistics 2024, 8, 28. [Google Scholar] [CrossRef]
  48. Jiang, M.; Feng, J.; Zhou, J.; Zhou, L.; Ma, F.; Wu, G.; Zhang, Y. Multi-Terminal Berth and Quay Crane Joint Scheduling in Container Ports Considering Carbon Cost. Sustainability 2023, 15, 5018. [Google Scholar] [CrossRef]
  49. Farah, M.B.; Ahmed, Y.; Mahmoud, H.; Shah, S.A.; Al-Kadri, M.O.; Taramonli, S.; Bellekens, X.; Abozariba, R.; Idrissi, M.; Aneiba, A. A survey on blockchain technology in the maritime industry: Challenges and future perspectives. Future Gener. Comput. Syst. 2024, 157, 618–637. [Google Scholar] [CrossRef]
  50. Bashir, K.; Rawat, D.B.; Wu, J.; Imran, M.A. Guest Editorial: Security, Reliability, and Safety in IoT-Enabled Maritime Transportation Systems. IEEE Trans. Intell. Transp. Syst. 2023, 24, 2275–2281. [Google Scholar] [CrossRef]
  51. Zeneli, M.; Marinova, G. Navigating the Future: Digital Twin in Maritime Industry. In Proceedings of the 2024 International Conference on Broadband Communications for Next Generation Networks and Multimedia Applications (CoBCom), Graz, Austria, 9–11 July 2024; pp. 1–6. [Google Scholar] [CrossRef]
  52. Kavallieratos, G.; Diamantopoulou, V.; Katsikas, S.K. Shipping 4.0: Security Requirements for the Cyber-Enabled Ship. IEEE Trans. Ind. Inform. 2020, 16, 6617–6625. [Google Scholar] [CrossRef]
  53. Donthu, N.; Kumar, S.; Mukherjee, D.; Pandey, D.; Weng, M.L. How to Conduct a Bibliometric Analysis: An Overview and Guidelines. J. Bus. Res. 2021, 133, 285–296. [Google Scholar] [CrossRef]
  54. Denyer, D.; Tranfield, D. Producing a systematic review. In The Sage Handbook of Organizational Research Methods; Buchanan, D., Bryman, A., Eds.; Sage Publications Ltd.: London, UK, 2009; pp. 671–689. Available online: https://books.google.com.br/books?hl=ptPT&lr=&id=vVs2EoDjm78C&oi=fnd&pg=PP1&dq=In+The+Sage+Handbook+of+Organizational+Research+Methods&ots=8S17tOPDUJ&sig=vKV7t8ZfSWr3FlEXcUbnMVJLphU (accessed on 30 April 2024).
  55. Pranckutė, R. Web of Science (WoS) and Scopus: The Titans of Bibliographic Information in Today’s Academic World. Publications 2021, 9, 12. [Google Scholar] [CrossRef]
  56. Aria, M.; Cuccurullo, C. Bibliometrix: An R-Tool for Comprehensive Science Mapping Analysis. J. Informetr. 2017, 11, 959–975. [Google Scholar] [CrossRef]
  57. Ampah, J.D.; Yusuf, A.A.; Afrane, S.; Jin, C.; Liu, H. Reviewing Two Decades of Cleaner Alternative Marine Fuels: Towards IMO’s Decarbonization of the Maritime Transport Sector. J. Clean. Prod. 2021, 320, 128871. [Google Scholar] [CrossRef]
  58. Gutiérrez-Salcedo, M.; Martínez, M.Á.; Moral-Muñoz, J.A.; Herrera-Viedma, E.; Cobo, M.J. Some Bibliometric Procedures for Analyzing and Evaluating Research Fields. Appl. Intell. 2018, 48, 1275–1287. [Google Scholar] [CrossRef]
  59. Fadiga, A.; Ferreira, L.M.D.; Bigotte, J.F. Decarbonising maritime ports: A systematic review of the literature and insights for new research opportunities. J. Clean. Prod. 2024, 452, 142209. [Google Scholar] [CrossRef]
  60. Linnenluecke, M.K.; Marrone, M.; Singh, A.K. Conducting Systematic Literature Reviews and Bibliometric Analyses. Aust. J. Manag. 2020, 45, 175–194. [Google Scholar] [CrossRef]
  61. Web of Science—WoS. WoS Search. Available online: https://www.webofscience.com/ (accessed on 23 December 2024).
  62. Scopus. Scopus Search. Available online: https://www.sciencedirect.com/ (accessed on 23 December 2024).
  63. Caputo, A.; Kargina, M. A User-Friendly Method to Merge Scopus and Web of Science Data During Bibliometric Analysis. J. Mark. Anal. 2022, 10, 82–88. [Google Scholar] [CrossRef]
  64. Chadegani, A.A.; Salehi, H.; Md Yunus, M.M.; Farhadi, H.; Fooladi, M.; Farhadi, M.; Ale Ebrahim, N. A Comparison between Two Main Academic Literature Collections: Web of Science and Scopus Databases. Asian Soc. Sci. 2013, 9, 18–26. [Google Scholar] [CrossRef]
  65. Mingers, J.; Leydesdorff, L. A Review of Theory and Practice in Scientometrics. Eur. J. Oper. Res. 2015, 246, 1–19. [Google Scholar] [CrossRef]
  66. Fahimnia, B.; Sarkis, J.; Davarzani, H. Green Supply Chain Management: A Review and Bibliometric Analysis. Int. J. Prod. Econ. 2015, 162, 101–114. [Google Scholar] [CrossRef]
  67. Tranfield, D.; Denyer, D.; Smart, P. Towards a Methodology for Developing Evidence-Informed Management Knowledge by Means of Systematic Review. Br. J. Manag. 2003, 14, 207–222. [Google Scholar] [CrossRef]
  68. Mongeon, P.; Paul-Hus, A. The Journal Coverage of Web of Science and Scopus: A Comparative Analysis. Scientometrics. 2016, 106, 213–228. [Google Scholar] [CrossRef]
  69. Santos, J.S.d.; Parise, C.K.; Duarte, L.; Teodoro, A.C. Bibliometric Analysis of Global Research on Port Infrastructure Vulnerability to Climate Change (2012–2023): Key Indices, Influential Contributions, and Future Directions. Sustainability 2024, 16, 8622. [Google Scholar] [CrossRef]
  70. Barianaki, E.; Kyvelou, S.S.; Ierapetritis, D.G. How to Incorporate Cultural Values and Heritage in Maritime Spatial Planning: A Systematic Review. Heritage 2024, 7, 380–411. [Google Scholar] [CrossRef]
  71. Jović, M.; Tijan, E.; Brčić, D.; Pucihar, A. Digitalization in Maritime Transport and Seaports: Bibliometric, Content and Thematic Analysis. J. Mar. Sci. Eng. 2022, 10, 486. [Google Scholar] [CrossRef]
  72. Morales-Alarcón, C.H.; Bodero-Poveda, E.; Villa-Yánez, H.M.; Buñay-Guisñan, P.A. Blockchain and Its Application in the Peer Review of Scientific Works: A Systematic Review. Publications 2024, 12, 40. [Google Scholar] [CrossRef]
  73. Bibliometrix. Bibliometrix Home. Available online: https://www.bibliometrix.org/home/ (accessed on 26 December 2024).
  74. Moral-Muñoz, J.; Herrera-Viedma, E.; Santisteban-Espejo, A.; Cobo, M. Software Tools for Conducting Bibliometric Analysis in Science: An Up-to-Date Review. Prof. Inf. 2020, 29, e290103. [Google Scholar] [CrossRef]
  75. McLaren, C.D.; Bruner, M.W. Citation Network Analysis. Int. Rev. Sport Exerc. Psychol. 2022, 15, 179–198. [Google Scholar] [CrossRef]
  76. Abafe, E.A.; Bahta, Y.T.; Jordaan, H. Exploring Biblioshiny for Historical Assessment of Global Research on Sustainable Use of Water in Agriculture. Sustainability 2022, 14, 10651. [Google Scholar] [CrossRef]
  77. Kumar, R.; Rani, S.; Awadh, M.A. Exploring the Application Sphere of the Internet of Things in Industry 4.0: A Review, Bibliometric and Content Analysis. Sensors 2022, 22, 4276. [Google Scholar] [CrossRef]
  78. Thangavel, P.; Chandra, B. Two Decades of M-Commerce Consumer Research: A Bibliometric Analysis Using R Biblioshiny. Sustainability 2023, 15, 11835. [Google Scholar] [CrossRef]
  79. Sheela, S.; Alsmady, A.A.; Tanaraj, K.; Izani, I. Navigating the Future: Blockchain’s Impact on Accounting and Auditing Practices. Sustainability 2023, 15, 16887. [Google Scholar] [CrossRef]
  80. David, L.O.; Nwulu, N.; Aigbavboa, C.; Adepoju, O. Towards Global Water Security: The Role of Cleaner Production. Clean. Eng. Technol. 2023, 10, 100695. [Google Scholar] [CrossRef]
  81. Alka, T.A.; Raman, R.; Suresh, M. Research Trends in Innovation Ecosystem and Circular Economy. Discov. Sustain. 2024, 5, 323. [Google Scholar] [CrossRef]
  82. Silva, M.d.S.T.; de Oliveira, V.M.; Correia, S.É.N. Scientific Mapping in Scopus with Biblioshiny: A Bibliometric Analysis of Organizational Tensions. Context. Rev. Contemp. Econ. Gestão 2022, 20, 54–71. [Google Scholar] [CrossRef]
  83. Bibliometrix. Frequently Asked Questions. Available online: https://www.bibliometrix.org/home/index.php/faq# (accessed on 30 December 2024).
  84. Systematic Reviews and Meta-Analyses (PRISMA). PRISMA Statement. Available online: https://www.prisma-statement.org/ (accessed on 26 December 2024).
  85. Yusop, S.R.M.; Rasul, M.S.; Mohamad Yasin, R.; Hashim, H.U.; Jalaludin, N.A. An Assessment Approaches and Learning Outcomes in Technical and Vocational Education: A Systematic Review Using PRISMA. Sustainability 2022, 14, 5225. [Google Scholar] [CrossRef]
  86. Moher, D.; Shamseer, L.; Clarke, M.; Ghersi, D.; Liberati, A.; Petticrew, M.; Shekelle, P.; Stewart, L.A.; Prisma-P Group. Preferred Reporting Items for Systematic Review and Meta-Analysis Protocols (PRISMA-P) 2015 Statement. Syst. Rev. 2015, 4, 1. [Google Scholar] [CrossRef]
  87. Page, M.J.; McKenzie, J.E.; Bossuyt, P.M.; Boutron, I.; Hoffmann, T.C.; Mulrow, C.D.; Shamseer, L.; Tetzlaff, J.M.; Akl, E.A.; Brennan, S.E.; et al. The PRISMA 2020 Statement: An Updated Guideline for Reporting Systematic Reviews. BMJ 2021, 372, n71. [Google Scholar] [CrossRef]
  88. Moshiul, A.M.; Mohammad, R.; Hira, F.A.; Maarop, N. Alternative Marine Fuel Research Advances and Future Trends: A Bibliometric Knowledge Mapping Approach. Sustainability 2022, 14, 4947. [Google Scholar] [CrossRef]
  89. Lee, S.H.; Kim, H.; Kwon, S. Fishing Vessel Risk and Safety Analysis: A Bibliometric Analysis, Clusters Review and Future Research Directions. Appl. Sci. 2024, 14, 10439. [Google Scholar] [CrossRef]
  90. Vrdoljak, L.; Racetin, I.; Zrinjski, M. Bibliometric Analysis of Remote Sensing over Marine Areas for Sustainable Development: Global Trends and Worldwide Collaboration. Sustainability 2024, 16, 6211. [Google Scholar] [CrossRef]
  91. Callon, M.; Courtial, J.P.; Laville, F. Co-Word Analysis as a Tool for Describing the Network of Interactions Between Basic and Technological Research: The Case of Polymer Chemistry. Scientometrics 1991, 22, 155–205. [Google Scholar] [CrossRef]
  92. Cobo, M.J.; López-Herrera, A.G.; Herrera-Viedma, E.; Herrera, F. An Approach for Detecting, Quantifying, and Visualizing the Evolution of a Research Field: A Practical Application to the Fuzzy Sets Theory Field. J. Informetr. 2011, 5, 146–166. [Google Scholar] [CrossRef]
  93. Meyer, N.; Ben Said, F.; Alkathiri, N.A.; Soliman, M. A Scientometric Analysis of Entrepreneurial and the Digital Economy Scholarship: State of the Art and an Agenda for Future Research. J. Innov. Entrep. 2023, 12, 70. [Google Scholar] [CrossRef]
  94. Szomszor, M.; Adams, J.; Fry, R.; Gebert, C.; Pendlebury, D.A.; Potter, R.W.K.; Rogers, G. Interpreting Bibliometric Data. Front. Res. Metr. Anal. 2021, 5, 628703. [Google Scholar] [CrossRef] [PubMed]
  95. Moro, A.; Boelman, E.; Joanny, G.; Garcia, J.L. A Bibliometric-Based Technique to Identify Emerging Photovoltaic Technologies in a Comparative Assessment with Expert Review. Renew. Energy 2018, 123, 407–416. [Google Scholar] [CrossRef]
  96. CRAN. Bibliometrix: Comprehensive Science Mapping Analysis. Available online: https://cran.r-project.org/web/packages/bibliometrix/bibliometrix.pdf (accessed on 22 March 2025).
  97. Aria, M.; Misuraca, M.; Spano, M. Mapping the Evolution of Social Research and Data Science on 30 Years of Social Indicators Research. Soc. Indic. Res. 2020, 149, 803–831. [Google Scholar] [CrossRef]
  98. Vaitis, M.; Kopsachilis, V.; Tataris, G.; Michalakis, V.I.; Pavlogeorgatos, G. The Development of a Spatial Data Infrastructure to Support Marine Spatial Planning in Greece. Ocean Coast. Manag. 2022, 218, 106025. [Google Scholar] [CrossRef]
  99. Contarinis, S.; Nakos, B.; Pallikaris, A. Introducing Smart Marine Ecosystem-Based Planning (SMEP)—How SMEP Can Drive Marine Spatial Planning Strategy and Its Implementation in Greece. Geomatics 2022, 2, 197–220. [Google Scholar] [CrossRef]
  100. O’Connor, H.M.; Cooper, J.A.G. On the Centrality of Tenure in Spatial Data Systems for Coastal/Marine Management: International Exemplars versus Emerging Practice in Ireland. Ocean Coast. Manag. 2024, 257, 1–17. [Google Scholar] [CrossRef]
  101. Abramic, A.; Bigagli, E.; Barale, V.; Assouline, M.; Lorenzo-Alonso, A.; Norton, C. Maritime Spatial Planning Supported by Infrastructure for Spatial Information in Europe (INSPIRE). Ocean Coast. Manag. 2018, 152, 23–36. [Google Scholar] [CrossRef]
  102. Taramelli, A.; Valentini, E.; Sterlacchini, S. A GIS-Based Approach for Hurricane Hazard and Vulnerability Assessment in the Cayman Islands. Ocean Coast. Manag. 2015, 108, 116–130. [Google Scholar] [CrossRef]
  103. Giorgetti, A.; Partescano, E.; Barth, A.; Buga, L.; Gatti, J.; Giorgi, G.; Wenzer, M. EMODnet Chemistry Spatial Data Infrastructure for Marine Observations and Related Information. Ocean Coast. Manag. 2018, 166, 9–17. [Google Scholar] [CrossRef]
  104. Mamode, S.A.H.; Runghen, H.; Munnaroo, S.; Bissessur, D.; Coopen, P.; Arnim, Y.V. Mapping of Underwater Cultural Heritage: The Geophysical Survey and Data Management of HMS Sirius Shipwreck. In Proceedings of the OCEANS 2022—Chennai, Chennai, India, 21–24 February 2022; pp. 1–7. [Google Scholar] [CrossRef]
  105. Kazimierski, W. On Using Spatial Data Infrastructure Concept for Exchange of Navigational Information on Ships. In Proceedings of the 2017 Baltic Geodetic Congress (Geomatics), Gdansk, Poland, 22–25 June 2017; pp. 267–272. [Google Scholar] [CrossRef]
  106. Ogryzek, M.; Tarantino, E.; Rząsa, K. Infrastructure of the Spatial Information in the European Community (INSPIRE) Based on Examples of Italy and Poland. ISPRS Int. J. Geo-Inf. 2020, 9, 755. [Google Scholar] [CrossRef]
  107. Ban, H.; Kim, H.J. Analysis and Visualization of Vessels’ Relative Motion (REMO). ISPRS Int. J. Geo-Inf. 2023, 12, 115. [Google Scholar] [CrossRef]
  108. Wu, A.; Che, T.; Li, X.; Zhu, X. A Ship Navigation Information Service System for the Arctic Northeast Passage Using 3D GIS Based on Big Earth Data. Big Earth Data 2022, 6, 453–479. [Google Scholar] [CrossRef]
  109. Chou, C.C.; Wang, C.N.; Hsu, H.P.; Ding, J.F.; Tseng, W.J.; Yeh, C.Y. Integrating AIS, GIS, and E-Chart to Analyze the Shipping Traffic and Marine Accidents at the Kaohsiung Port. J. Mar. Sci. Eng. 2022, 10, 1543. [Google Scholar] [CrossRef]
  110. Zhao, M.; Yao, X.; Sun, J.; Zhang, S.; Bai, J. GIS-Based Simulation Methodology for Evaluating Ship Encounters Probability to Improve Maritime Traffic Safety. IEEE Trans. Intell. Transp. Syst. 2019, 20, 323–337. [Google Scholar] [CrossRef]
  111. Wang, H.; Liu, Z.; Liu, Z.; Wang, X.; Wang, J. GIS-Based Analysis on the Spatial Patterns of Global Maritime Accidents. Ocean Eng. 2022, 245, 110569. [Google Scholar] [CrossRef]
  112. Guiziou, F.H. Assessing the Effects of a War on a Container Terminal: Lessons from Al Hudaydah, Yemen. TransNav 2024, 18, 195–204. [Google Scholar] [CrossRef]
  113. Rudolph, T.A. Seeing Like an Algorithm: The Limits of Using Remote Sensing to Link Vessel Movements with Worker Abuse at Sea. Marit. Stud. 2024, 23, 13. [Google Scholar] [CrossRef]
  114. Alahmadi, S.; Al-Ahmadi, K.; Almeshari, M. Spatial Variation in the Association between NO2 Concentrations and Shipping Emissions in the Red Sea. Sci. Total Environ. 2019, 676, 131–143. [Google Scholar] [CrossRef]
  115. Kim, J.; Emmerich, M.T.M.; Voors, R.; Ording, B.; Lee, J.-S. A Systematic Approach to Identify Shipping Emissions Using Spatio-Temporally Resolved TROPOMI Data. Remote Sens. 2023, 15, 3453. [Google Scholar] [CrossRef]
  116. Ma, J.; Ma, R.; Pan, Q.; Liang, X.; Wang, J.; Ni, X. A Global Review of Progress in Remote Sensing and Monitoring of Marine Pollution. Water 2023, 15, 3491. [Google Scholar] [CrossRef]
  117. Saliba, M.; Azzopardi, F.; Muscat, R.; Grima, M.; Smyth, A.; Jalkanen, J.-P.; Johansson, L.; Deidun, A.; Gauci, A.; Galdies, C.; et al. Trends in Vessel Atmospheric Emissions in the Central Mediterranean over the Last 10 Years and during the COVID-19 Outbreak. J. Mar. Sci. Eng. 2021, 9, 762. [Google Scholar] [CrossRef]
  118. Wei, L.; Hu, Z.; Dong, L.; Zhao, W. A Damage Assessment Model of Oil Spill Accident Combining Historical Data and Satellite Remote Sensing Information: A Case Study in Penglai 19-3 Oil Spill Accident of China. Mar. Pollut. Bull. 2015, 91, 258–271. [Google Scholar] [CrossRef] [PubMed]
  119. Baghdady, S.M.; Abdelsalam, A.A. Ten Years of Oil Pollution Detection in Eastern Mediterranean Shipping Routes Opposite the Egyptian Coast Using Remote Sensing Techniques. Sci. Rep. 2024, 14, 18057. [Google Scholar] [CrossRef]
  120. Belhadj, C.; Rifi, M.; Mohamed, A.B.; Rebai, N.; Shili, A. An Integrated GIS, Remote Sensing, Geochemical, and Ecological Approach for Correlating and Identifying Oil Contamination Sources of Tunisia’s Northern Coast. Reg. Stud. Mar. Sci. 2024, 69, 103320. [Google Scholar] [CrossRef]
  121. Salgado-Hernanz, P.M.; Bauzà, J.; Alomar, C.; Compa, M.; Romero, L.; Deudero, S. Assessment of Marine Litter through Remote Sensing: Recent Approaches and Future Goals. Mar. Pollut. Bull. 2021, 168, 112347. [Google Scholar] [CrossRef]
  122. Topouzelis, K.; Papageorgiou, D.; Suaria, G.; Aliani, S. Floating Marine Litter Detection Algorithms and Techniques Using Optical Remote Sensing Data: A Review. Mar. Pollut. Bull. 2021, 170, 112675. [Google Scholar] [CrossRef]
  123. Mohseni, F.; Saba, F.; Mirmazloumi, S.M.; Amani, M.; Mokhtarzade, M.; Jamali, S.; Mahdavi, S. Ocean Water Quality Monitoring Using Remote Sensing Techniques: A Review. Mar. Environ. Res. 2022, 180, 105701. [Google Scholar] [CrossRef]
  124. Quang, N.H.; Dinh, N.T.; Dien, N.T.; Son, L.T. Calibration of Sentinel-2 Surface Reflectance for Water Quality Modelling in Binh Dinh’s Coastal Zone of Vietnam. Sustainability 2023, 15, 1410. [Google Scholar] [CrossRef]
  125. Hadipour, M.; Morteza, N.; Mokhtar, M.; Ern, L.K. Geospatial Analyzing of Straits Shipping Paths for Integration of Air Quality and Marine Wildlife Conservation. J. Wildl. Biodivers. 2021, 5, 63–80. [Google Scholar] [CrossRef]
  126. Kao, S.L.; Chung, W.C.; Chen, C.W. AIS-Based Scenario Simulation for the Control and Improvement of Ship Emissions in Ports. J. Mar. Sci. Eng. 2022, 10, 129. [Google Scholar] [CrossRef]
  127. Salminen, E.A.; Murguzur, F.J.A.; Ollus, V.M.S.; Engen, S.; Hausner, V.H. Using Public Participation GIS (PPGIS) to Relate Local Concerns over Growth in Tourism and Aquaculture to Integrated Coastal Zone Management in the Tromsø Region, Norway. Ocean Coast. Manag. 2025, 261, 107510. [Google Scholar] [CrossRef]
  128. Brown, G.; Strickland-Munro, J.; Kobryn, H.; Moore, S.A. Stakeholder Analysis for Marine Conservation Planning Using Public Participation GIS. Appl. Geogr. 2016, 67, 77–93. [Google Scholar] [CrossRef]
  129. Morse, W.C.; Cox, C.; Anderson, C.J. Using Public Participation Geographic Information Systems (PPGIS) to Identify Valued Landscapes Vulnerable to Sea Level Rise. Sustainability 2020, 12, 6711. [Google Scholar] [CrossRef]
  130. Ettorre, B.; Daldanise, G.; Giovene di Girasole, E.; Clemente, M. Co-Planning Port–City 2030: The InterACT Approach as a Booster for Port–City Sustainable Development. Sustainability 2023, 15, 15641. [Google Scholar] [CrossRef]
  131. Kalyvas, C.; Kokkos, A.; Tzouramanis, T. A Survey of Official Online Sources of High-Quality Free-of-Charge Geospatial Data for Maritime Geographic Information Systems Applications. Inf. Syst. 2017, 65, 36–51. [Google Scholar] [CrossRef]
  132. Johansen, T.; Blindheim, S.; Torben, T.R.; Utne, I.B.; Johansen, T.A.; Sørensen, A.J. Development and Testing of a Risk-Based Control System for Autonomous Ships. Reliab. Eng. Syst. Saf. 2023, 234, 109195. [Google Scholar] [CrossRef]
  133. Park, D.; Park, S. E-Navigation-Supporting Data Management System for Variant S-100-Based Data. Multimed. Tools Appl. 2015, 74, 6573–6588. [Google Scholar] [CrossRef]
  134. Agrawal, S.; Gupta, R.D. Web GIS and Its Architecture: A Review. Arab. J. Geosci. 2017, 10, 518. [Google Scholar] [CrossRef]
  135. Patera, A.; Pataki, Z.; Kitsiou, D. Development of a WebGIS Application to Assess Conflicting Activities in the Framework of Marine Spatial Planning. J. Mar. Sci. Eng. 2022, 10, 389. [Google Scholar] [CrossRef]
  136. Ichimura, Y.; Dalaklis, D.; Kitada, M.; Christodoulou, A. Shipping in the Era of Digitalization: Mapping the Future Strategic Plans of Major Maritime Commercial Actors. Digit. Bus. 2022, 2, 100022. [Google Scholar] [CrossRef]
  137. Fast, V.; Hossain, F. An Alternative to Desktop GIS? Evaluating the Cartographic and Analytical Capabilities of WebGIS Platforms for Teaching. Cartogr. J. 2020, 57, 175–186. [Google Scholar] [CrossRef]
  138. Ports of Paraná. Logistica Inteligente. Available online: https://www.portosdoparana.pr.gov.br (accessed on 24 March 2025).
  139. Port of Hamburg. Interactive Port of Hamburg. Available online: https://www.hafen-hamburg.de/en/portmap/ (accessed on 24 March 2025).
  140. KYSTINFO. Oslo Port Live Traffic Map. Available online: https://kystinfo.no/share/8281b01e5d7f (accessed on 24 March 2025).
  141. Thanopoulou, H.; Patera, A.; Moresis, O.; Georgoulis, G.; Lioumi, V.; Kanavos, A.; Papadimitriou, O.; Zervakis, V.; Dagkinis, I. Supporting Informed Public Reactions to Shipping Incidents with Oil Spill Potential: An Innovative Electronic Platform. Sustainability 2023, 15, 15035. [Google Scholar] [CrossRef]
  142. Dawidowicz, A.; Kulawiak, M. The Potential of Web-GIS and Geovisual Analytics in the Context of Marine Cadastre. Surv. Rev. 2017, 50, 501–512. [Google Scholar] [CrossRef]
  143. Fernández, P.; Santana, J.M.; Ortega, S.; Trujillo, A.; Suárez, J.P.; Santana, J.A.; Domínguez, C. Web-Based GIS Through a Big Data Open-Source Computer Architecture for Real-Time Monitoring Sensors of a Seaport. In The Rise of Big Spatial Data; Springer: Cham, Switzerland, 2017; pp. 41–53. [Google Scholar] [CrossRef]
  144. Fernández, P.; Suárez, J.P.; Trujillo, A.; Domínguez, C.; Santana, J.M. 3D-Monitoring Big Geo Data on a Seaport Infrastructure Based on FIWARE. J. Geogr. Syst. 2018, 20, 139–157. [Google Scholar] [CrossRef]
  145. Makris, C.; Papadimitriou, A.; Baltikas, V.; Spiliopoulos, G.; Kontos, Y.; Metallinos, A.; Androulidakis, Y.; Chondros, M.; Klonaris, G.; Malliouri, D.; et al. Validation and Application of the Accu-Waves Operational Platform for Wave Forecasts at Ports. J. Mar. Sci. Eng. 2024, 12, 220. [Google Scholar] [CrossRef]
  146. Neugebauer, J.; Heilig, L.; Voß, S. Digital Twins in the Context of Seaports and Terminal Facilities. Flex. Serv. Manuf. J. 2024, 36, 821–917. [Google Scholar] [CrossRef]
  147. Freire, W.P.; Melo, W.S., Jr.; do Nascimento, V.D.; Nascimento, P.R.M.; de Sá, A.O. Towards a Secure and Scalable Maritime Monitoring System Using Blockchain and Low-Cost IoT Technology. Sensors 2022, 22, 4895. [Google Scholar] [CrossRef]
  148. Monzon Baeza, V.; Ortiz, F.; Herrero Garcia, S.; Lagunas, E. Comunicações aprimoradas em sistemas de IoT baseados em satélite para dar suporte a serviços de transporte marítimo. Sensors 2022, 22, 6450. [Google Scholar] [CrossRef]
  149. Argyriou, I.; Tsoutsos, T. Assessing Critical Entities: Risk Management for IoT Devices in Ports. J. Mar. Sci. Eng. 2024, 12, 1593. [Google Scholar] [CrossRef]
  150. Durlik, I.; Miller, T.; Cembrowska-Lech, D.; Krzemińska, A.; Złoczowska, E.; Nowak, A. Navigating the Sea of Data: A Comprehensive Review on Data Analysis in Maritime IoT Applications. Appl. Sci. 2023, 13, 9742. [Google Scholar] [CrossRef]
  151. Rathore, M.M.; Shah, S.A.; Shukla, D.; Bentafat, E.; Bakiras, S. The Role of AI, Machine Learning, and Big Data in Digital Twinning: A Systematic Literature Review, Challenges, and Opportunities. IEEE Access 2021, 9, 32030–32052. [Google Scholar] [CrossRef]
  152. de la Peña Zarzuelo, I.; Freire Soeane, M.J.; López Bermúdez, B. Industry 4.0 in the Port and Maritime Industry: A Literature Review. J. Ind. Inf. Integr. 2020, 20, 100173. [Google Scholar] [CrossRef]
  153. Diaz, R.; Ungo, R.; Smith, K.; Haghnegahdar, L.; Singh, B.; Phuong, T. Applications of AI/ML in Maritime Cyber Supply Chains. Procedia Comput. Sci. 2024, 232, 3247–3257. [Google Scholar] [CrossRef]
  154. Zhou, X. Spatial Risk Assessment of Maritime Transportation in Offshore Waters of China Using Machine Learning and Geospatial Big Data. Ocean Coast. Manag. 2024, 247, 106934. [Google Scholar] [CrossRef]
  155. Cioffi, R.; Travaglioni, M.; Piscitelli, G.; Petrillo, A.; De Felice, F. Artificial Intelligence and Machine Learning Applications in Smart Production: Progress, Trends, and Directions. Sustainability 2020, 12, 492. [Google Scholar] [CrossRef]
  156. Thill, J.-C.; Venkitasubramanian, K. Multi-Layered Hinterland Classification of Indian Ports of Containerized Cargoes Using GIS Visualization and Decision Tree Analysis. Marit. Econ. Logist. 2014, 17, 265–291. [Google Scholar] [CrossRef]
  157. Zhuang, X.; Li, W.; Xu, Y. Port Planning and Sustainable Development Based on Prediction Modelling of Port Throughput: A Case Study of the Deep-Water Dongjiakou Port. Sustainability 2022, 14, 4276. [Google Scholar] [CrossRef]
  158. Peng, W.; Bai, X.; Yang, D.; Yuen, K.F.; Wu, J. A Deep Learning Approach for Port Congestion Estimation and Prediction. Marit. Policy Manag. 2023, 50, 835–860. [Google Scholar] [CrossRef]
  159. Irannezhad, E.; Prato, C.G.; Hickman, M. An Intelligent Decision Support System Prototype for Hinterland Port Logistics. Decis. Support Syst. 2020, 130, 113227. [Google Scholar] [CrossRef]
  160. Alizadeh, D.; Alesheikh, A.A.; Sharif, M. Vessel Trajectory Prediction Using Historical Automatic Identification System Data. J. Navig. 2020, 1, 1–19. [Google Scholar] [CrossRef]
  161. Huang, I.-L.; Lee, M.-C.; Nieh, C.-Y.; Huang, J.-C. Ship Classification Based on AIS Data and Machine Learning Methods. Electronics 2024, 13, 98. [Google Scholar] [CrossRef]
  162. Nakashima, M.; Shibasaki, R. Can AIS Data Improve the Short-Term Forecast of Weekly Dry Bulk Cargo Port Throughput? A Machine-Learning Approach. Marit. Policy Manag. 2023, 51, 1788–1804. [Google Scholar] [CrossRef]
  163. Reggiannini, M.; Salerno, E.; Bacciu, C.; D’Errico, A.; Lo Duca, A.; Marchetti, A.; Martinelli, M.; Mercurio, C.; Mistretta, A.; Righi, M.; et al. Remote Sensing for Maritime Traffic Understanding. Remote Sens. 2024, 16, 557. [Google Scholar] [CrossRef]
  164. Sedaghat, A.; Arbabkhah, H.; Jafari Kang, M.; Hamidi, M. Deep Learning Applications in Vessel Dead Reckoning to Deal with Missing Automatic Identification System Data. J. Mar. Sci. Eng. 2024, 12, 152. [Google Scholar] [CrossRef]
  165. Rawson, A.; Brito, M. Developing Contextually Aware Ship Domains Using Machine Learning. J. Navig. 2021, 74, 515–532. [Google Scholar] [CrossRef]
  166. Rawson, A.; Brito, M.; Sabeur, Z. Spatial Modeling of Maritime Risk Using Machine Learning. Risk Anal. 2022, 42, 2291–2311. [Google Scholar] [CrossRef]
  167. Rawson, A.; Sabeur, Z.; Brito, M. Intelligent Geospatial Maritime Risk Analytics Using the Discrete Global Grid System. Big Earth Data. 2021, 6, 294–322. [Google Scholar] [CrossRef]
  168. Yang, Y.; Shao, Z.; Hu, Y.; Mei, Q.; Pan, J.; Song, R.; Wang, P. Geographical Spatial Analysis and Risk Prediction Based on Machine Learning for Maritime Traffic Accidents: A Case Study of Fujian Sea Area. Ocean Eng. 2022, 266, 113106. [Google Scholar] [CrossRef]
  169. Rawson, A.; Brito, M.; Sabeur, Z.; Tran-Thanh, L. A Machine Learning Approach for Monitoring Ship Safety in Extreme Weather Events. Saf. Sci. 2021, 141, 105336. [Google Scholar] [CrossRef]
  170. Najafizadegan, S.; Danesh-Yazdi, M. Variable-Complexity Machine Learning Models for Large-Scale Oil Spill Detection: The Case of Persian Gulf. Mar. Pollut. Bull. 2023, 195, 115459. [Google Scholar] [CrossRef]
  171. Le, L.T. Discovering Supply Chain Operation Towards Sustainability Using Machine Learning and DES Techniques: A Case Study in Vietnam Seafood. Marit. Bus. Rev. 2024, 9, 243–262. [Google Scholar] [CrossRef]
  172. Novaes Mathias, T.; Sugimura, Y.; Kawasaki, T.; Akakura, Y. Topological Resilience of Shipping Alliances in Maritime Transportation Networks. Logistics 2025, 9, 6. [Google Scholar] [CrossRef]
  173. Pagano, P.; Antonelli, S.; Tardo, A. C-Ports: A Proposal for a Comprehensive Standardization and Implementation Plan of Digital Services Offered by the “Port of the Future”. Comput. Ind. 2022, 134, 103556. [Google Scholar] [CrossRef]
  174. Hatlas-Sowinska, P.; Wielgosz, M. Ontology-Based Approach in Solving Collision Situations at Sea. Ocean Eng. 2022, 260, 111941. [Google Scholar] [CrossRef]
  175. Zhou, C.; Wen, K.; Zhao, J.; Bian, Z.; Lu, T.; Ko Ko Latt, M.; Wang, C. Ontology-Based Method for Identifying Abnormal Ship Behavior: A Navigation Rule Perspective. J. Mar. Sci. Eng. 2024, 12, 881. [Google Scholar] [CrossRef]
  176. Zhang, C.; Zhao, T.; Li, W. Geospatial Data Interoperability, Geography Markup Language (GML), Scalable Vector Graphics (SVG), and Geospatial Web Services. In Geospatial Semantic Web; Springer: Cham, Switzerland, 2015. [Google Scholar] [CrossRef]
  177. Gourmelon, F.; Le Guyader, D.; Fontenelle, G. A Dynamic GIS as an Efficient Tool for Integrated Coastal Zone Management. ISPRS Int. J. Geo-Inf. 2014, 3, 391–407. [Google Scholar] [CrossRef]
  178. Andrei, N.; Scarlat, C.; Ioanid, A. Transforming E-Commerce Logistics: Sustainable Practices through Autonomous Maritime and Last-Mile Transportation Solutions. Logistics 2024, 8, 71. [Google Scholar] [CrossRef]
  179. El-Magd, I.A.; Mohamed, Z.; Elham, M.A.; Abdulaziz, M.A. An Open-Source Approach for Near-Real-Time Mapping of Oil Spills along the Mediterranean Coast of Egypt. Remote Sens. 2021, 13, 2733. [Google Scholar] [CrossRef]
Figure 1. Methodological stage.
Sustainability 17 03386 g001
Figure 2. Literature review methodology phases based on the PRISMA-SCR review.
Sustainability 17 03386 g002
Figure 3. Distribution of annual scientific publications and average article citation per year. Source: Authors’ elaboration using Bibliometrix and Biblioshiny R packages.
Sustainability 17 03386 g003
Figure 4. The top twenty scientific journals. Source: Authors’ elaboration using Bibliometrix and Biblioshiny R packages.
Sustainability 17 03386 g004
Figure 5. The 20 most frequent authors’ keywords. Source: Authors’ elaboration using Bibliometrix and Biblioshiny R packages.
Sustainability 17 03386 g005
Figure 6. Authors’ keyword cloud. Source: Authors’ elaboration using Bibliometrix and Biblioshiny R packages.
Sustainability 17 03386 g006
Figure 7. Frequency of scientific production by country and global distribution of international collaboration networks among countries. Source: Authors’ elaboration using Bibliometrix and Biblioshiny R packages.
Sustainability 17 03386 g007
Figure 8. Thematic evolution of research. Source: Authors’ elaboration using Bibliometrix and Biblioshiny R packages.
Sustainability 17 03386 g008
Figure 9. Thematic evolution from 2014 to 2024. Source: Authors’ elaboration using Bibliometrix and Biblioshiny R packages.
Sustainability 17 03386 g009
Table 1. Inclusion criteria in the WOS and Scopus.
Screening WOSScopus
Final Boolean EquationTS = (((“spatial data infrastructure” OR “marine sdi” OR “geogra* information system” OR “gis*” OR “geospatial data integration”) AND (“seaport” OR “port” OR ((“smart” OR “green” OR “intelligent” OR “automated “) AND “port*”) OR “maritime*” OR “logistic*” OR “terminal*” OR “ship*” OR “vessel*” OR “berth*” OR “container*”) AND (“interoperability” OR “visualiz*” OR “open data” OR “digital*” OR (“web” AND (“map” OR “service” OR “gis” OR “based gis”)) AND (“map*” OR “dataset” OR “tool” OR “ais” OR “iot”))))TITLE-ABS-KEY ((“spatial data infrastructure” OR “marine sdi” OR “geogra* information system” OR “gis*” OR “geospatial data integration”) AND (“seaport” OR “port” OR ((“smart” OR “green” OR “intelligent” OR “automated “) AND “port*”) OR “maritime*” OR “logistic*” OR “terminal*” OR “ship*” OR “vessel*” OR “berth*” OR “container*”) AND (“interoperability” OR “visualiz*” OR “stakeholder*” OR “open data” OR “digital*” OR (“web” AND (“map” OR “service” OR “gis” OR “based gis”)) AND ( “map*” OR “dataset” OR “tool” OR “ais” OR “iot”))) AND PUBYEAR AFT 2014
LanguagesEnglishEnglish
Document TypesArticles and review articleArticles and review article
Research AreasEnvironmental Sciences Ecology, Engineering, Water Resources, Remote Sensing, Computer Science, Imaging Science Photographic Technology, Science Technology Other Topics, Meteorology Atmospheric Sciences, Oceanography, Geography, Transportation, Marine Freshwater Biology, Biodiversity Conservation, Energy Fuels, Operations Research Management Science.Environmental science, Earth and Planetary Sciences, Engineering, Agricultural and Biological Sciences, Computer Science, Energy, Business, Management and Accounting, Decision Sciences e Multidisciplinary.
Table 2. Main information elaborated using the Bibliometrix and Biblioshiny R packages.
TypeDescriptionResults
Main information about data
PeriodYears of publication2014:2024
Sources (Journals, Books, etc)Frequency distribution of sources as journals279
DocumentsTotal number of documents530
Annual Growth Rate %Average number of annual growth8.59
Document Average AgeAverage age of the document5.14
Average citations per docAverage total number of citations per document28.65
Document contents
Keywords Plus (ID)Total number of phrases that frequently appear in the title of an article’s references2429
Author’s Keywords (DE)Total number of keywords2194
Authors
AuthorsTotal number of authors2205
Authors of single-authored docsNumber of single authors per article26
Authors collaboration
Single-authored docsNumber of documents written by a single author26
Co-Authors per DocAverage number of co-authors in each document4.72
International co-authorships %Average number of international co-authorships24.72
Document types
ArticleNumber of articles514
Article; early accessNumber of early access articles6
ReviewNumber of review articles10
Table 3. Studies on GIS and machine learning in maritime logistics, focusing on port optimisation, forecasting, and risk assessment.
Study Objective [Reference]Models UsedKey Findings and Impact
Investigate the logistical dynamics and competitiveness of major Indian ports in container transportation [156].Decision tree model with advanced GIS techniques to map the hinterland port structure and dynamics.Accuracy of 75.7% (error 0.243), identifying inter-port competition in three dimensions: spatial distribution, cargo diversity, and shipment variations. Reveals strategic connections between production centers and logistics infrastructure.
Forecast demand and productivity at Dongjiakou Port, China [157].Grey model and principal component analysis to predict throughput from 2021 to 2025.High accuracy with deviations within ±5% until 2018. Significant deviation (23.07%) in 2020 due to COVID-19. The grey model demonstrated robustness and forecasts 72.9 million tons of cargo for 2025. GIS and spatial autocorrelation analysis link port growth to economic development.
Predict port congestion in Shanghai, Singapore, and Ningbo [158].Deep learning model, long short-term memory (LSTM), an advanced variant of recurrent neural network (RNN), and AIS data, tested across four scenarios.Shanghai exhibited the highest accuracy (RMSE < 6.26; MAE < 3.62), demonstrating that incorporating data from other ports improves long-term forecasting.
Intelligent decision support systems within the Brisbane Port PCS (Australia) [159].Geoprocessing in ArcGIS, Tabu Search algorithm, and reinforcement learning in a multi-agent system for logistics optimisation.Cost reduction of >50% when all agents adhere to the solution. PCS web integration optimizes the container supply chain in the port hinterland.
Ship trajectory prediction to prevent collisions in the Juan de Fuca/Georgia Strait (USA) [160].Point-based similarity search prediction (PSSP), trajectory-based similarity search prediction (TSSP), and trajectory-based similarity search prediction (TSSPL) models using LSTM to dynamically predict spatial distances.TSSPL model reduced prediction error by up to 55.8% (for 10 to 40 min intervals), improving accuracy by leveraging LSTM-estimated spatial distances.
Monitoring and classification of navigation patterns in the Changhua Wind Farm Channel [161].GIS integrated with machine learning algorithms logistic regression (LR), decision tree (DT), K-nearest neighbor (KNN), linear discriminant analysis (LDA), naive gaussian bayes (GNB), support vector machines (SVM), random forest (RF), and Xtreme gradient boosting (XGBoost).XGBoost and RF achieved 97% accuracy in detecting anomalous navigation behaviors, demonstrating the effectiveness of machine learning in maritime analytics.
Short-term prediction of dry bulk cargo movement at Port Hedland, Australia [162].LSTM-based models: LSTM-Base (weekly cargo fluctuations in similar ports) and LSTM-AIS (observed data at Hedland)AIS-integrated LSTM improved accuracy (MAPE: 10.7%, RMSE: 1.36) over baseline model (MAPE: 15.6%, RMSE: 1.88). GIS played a key role in processing ship position data using Geohash.
Maritime traffic assessment using optical and radar data, integrated into WebGIS and OSIRIS system [163].RF classification using OpenSARShip dataset (Sentinel-1)Overall accuracy: 64%. Balanced accuracy per class: bulk carriers 0.70, cargo ships 0.76, container ships 0.86, tankers 0.70.
Development of an online real-time maritime traffic prediction system in the Gulf Intracoastal Waterway, Texas [164].LSTM modelModel implemented in a user interface, achieving high predictive performance (R2 = 0.99, MAE = 0.0046). Further integration of advanced ML techniques can enhance predictive capabilities.
Maritime collision prediction and risk analysis [165].RF algorithms for predicting critical passing distances under multiple conditions (Puget Sound, Washington—Vancouver Island)RF validation model fit: R2 = 0.69.
Annual vessel accident and grounding prediction in the UK [166].GIS-based spatial risk models using LR, SVM, XGBoost, and RFRF achieved high accuracy (93%), excelling in collision risk identification for commercial and recreational ships.
Spatial maritime risk modelling using DGGS for ship grounding prediction in the US [167].RF algorithmRF effectively estimated high-risk grounding locations (R2 = 0.55, MSE = 0.002). GIS-generated risk maps supported mitigation strategies.
Maritime accident prediction using GIS-based analysis in Fujian Sea [168].RF, Adaboost, GBDT, Stacking model, LSTM, convolutional neural network (CNN), SVMGIS analysed AIS spatial distribution and accident patterns. Classification accuracy: RF (0.77), Adaboost (0.75), GBDT (0.77), Stacking (0.77).
Predictive models for ship safety monitoring during Atlantic hurricane season (US) [169].Historical incident, ship traffic, geographic, and metocean data integrated via DGGS; models: LR, SVM, RF, XGBoost, stochastic gradient descent (SGD)—optimized SVM, multi-layer perception (MLP)RF had the highest accuracy (0.99) and lowest false positives (7), but lowest recall (0.29), missing many positive cases.
Marine ecosystem monitoring via ML-based oil spill detection in the Persian Gulf [170].SAR image classification (Sentinel-1) using SVM, RF, CNNRF classifier achieved high accuracy: 99.81% (kappa 0.99) in training, 86.01% (kappa 0.69) in testing, proving model robustness.
Supply chain dynamics analysis in Vietnam using advanced ML simulation [171].GIS-integrated artificial neural networks (ANNs), converting geospatial data for supply chain analysisANN3 showed superior performance (RMSPE: 16.1%, MPE: 1.15%, MAPE: 7.03%), confirming effectiveness in fuel consumption prediction and sustainable navigation.
Disclaimer/Publisher’s Note: The statements, opinions and data contained in all publications are solely those of the individual author(s) and contributor(s) and not of MDPI and/or the editor(s). MDPI and/or the editor(s) disclaim responsibility for any injury to people or property resulting from any ideas, methods, instructions or products referred to in the content.

