1. Introduction
The International Energy Agency (IEA) estimates that the electricity and heat sector contributed 14.9 Gt of carbon dioxide (CO
2) emissions in 2021, reaching an unprecedented level. With an additional 900 Mt, it is the sector which recorded the highest increase in emissions in comparison with 2020 [
1]. Therefore, decarbonising heat and electricity production is an important milestone to reach net-zero energy systems by 2050. Combined heat and power (CHP) plants running on renewable fuels can play an important role in the energy transition by decarbonising a process, increasing the efficiency and capacity factor.
In Luxembourg, heat and electricity production is highly limited by tensions on land use. Combined heat and power (CHP) plants are particularly important in this case, as they attain high efficiencies (65 to 85%) and capacity factors (up to 85%), i.e., the same installed capacity allows a higher production than wind or solar farms [
2,
3]. Currently, the Luxembourgish cogeneration plants are running mainly on wood pellets or natural gas. Even though the European Union (EU) is the world’s largest wood pellet market, import bans for wood pellets from Russia, adopted in the first trimester of 2022, created tensions in the market [
4]. Moreover, in their most recent gas market report, the IEA emphasised that the EU’s natural gas balance remains fragile due to limited supply growth and ongoing geopolitical tensions [
5]. These uncertainties show the need to research alternatives to decarbonise existing fossil fuel-based power plants, as diversity in production technologies improves resilience to temporary market tensions.
Luxembourg’s Ministry of Energy presented its hydrogen (H
2) strategy in 2021 [
6]. A hydrogen valley project, LuxHyVal, was launched in June 2024 to support the country’s energy transition by enabling the production of green hydrogen by 2026 and reducing industrial hydrogen consumption. In November 2024, the Ministry launched a call for projects to encourage the production of renewable hydrogen, offering operational support and investment aid for the construction and operation of new electrolysers, reflecting Luxembourg’s dedication to fostering a sustainable hydrogen ecosystem. In March 2025, Luxembourg’s parliament approved a law establishing a legal framework for planning and developing hydrogen transport infrastructure. This legislation aims to support a European market for renewable hydrogen, essential for addressing climate challenges and reducing dependence on fossil fuels. It includes provisions for appointing a national hydrogen network manager and classifies hydrogen-related projects as public utilities, simplifying land acquisition processes for such developments.
Meanwhile, projects regarding hydrogen transport facilities to Luxembourg are being developed. One of these projects, MosaHYc (Moselle Saar Hydrogen Conversion), is an international joint project by Luxembourgish, German, and French actors in the Greater Region. The goal is to create a 100 km long cross-border hydrogen island network by converting an existing natural gas pipeline network (70 km) and building new infrastructure (30 km). The project is expected to be commissioned in 2027 [
7]. Furthermore, the HY4Link project aims to establish a 230 km pipeline infrastructure to integrate the hydrogen network across Belgium, Luxembourg, France, and Germany. The project, expected to be phased into operation by 2030, will complement existing and planned hydrogen initiatives, strengthening the regional hydrogen supply network and enhancing energy security. On a larger scale, the European Hydrogen Backbone (EHB) plans to establish a European pipeline network using existing (75%) and new infrastructure. By 2040, it is planned to have an almost 40,000 km long pipeline network in Europe [
8].
Yu et al. presented a review on hydrogen-based combined heat and power systems [
9], and while previous studies explore the role of fuel cell solutions in the decarbonisation of the building sector [
10,
11], our study revolves around an existing CHP plant in Luxembourg, which currently runs with a natural gas-fuelled internal combustion engine (ICE), with solutions that can be applied to the existing infrastructure to reduce carbon emissions.
This study focuses on evaluating the opportunity to prepare existing CHP plants for the use of hydrogen in the near future, leveraging the long-term engine life that would be required for any case. By retrofitting engines to be hydrogen-ready, the plants could reduce their carbon emissions once hydrogen becomes available, without the need for costly and disruptive full infrastructure replacement. This approach provides a more affordable and practical pathway for decarbonisation, reducing investment barriers and enhancing the feasibility of transition strategies.
Three scenarios are considered in the article:
The “Business as Usual” scenario assumes that no changes in the power plant operation are made. Therefore, the plant continues running on natural gas.
The “Retrofitting for H2” assumes that the existing engine is adapted to work with hydrogen and natural gas blends or pure hydrogen.
The “New engine for H2” assumes that the existing engine is replaced by a different model to work with hydrogen and natural gas blends or pure hydrogen.
Promising advances in the hydrogen supply chain raise interest in investing into hydrogen applications. Using hydrogen in internal combustion engines (ICEs) is not a recent technology. Extensive research work has been performed in the past 20 years on the understanding of hydrogen use in ICEs, and its combustion properties and performance [
12,
13,
14,
15]. A study by Onorati et al. from 2022 [
16] emphasises the important role hydrogen could play in future energy systems, especially as a complementary storage system. Although the technology has already been researched, a technical and economic analysis of retrofitting an existing CHP plant is still lacking.
The main characteristics of the analysed power plant are given in
Table 1.
Through this study case, we demonstrate that several technical options for integrating hydrogen into an existing natural gas-fuelled CHP plant in Luxembourg are already widely available and technically feasible. However, despite these advancements, the broader implementation of hydrogen applications remains limited due to the underdeveloped hydrogen infrastructure. This creates a cyclical challenge: while investments in infrastructure are critical, they are unlikely to be approved without viable applications. Our study aims to address this gap by exploring practical, cost-effective pathways to retrofit existing infrastructure, making it hydrogen-ready and thereby accelerating the transition to decarbonised energy systems.
2. Materials and Methods
2.1. Hydrogen Production
In 2023, the production of hydrogen amounted to 97 Mt, with natural gas, oil and coal accounting for more than 80% of this production. This contributed to total carbon dioxide (CO
2) emissions of 920 Mt. Carbon capture, utilisation, and storage (CCUS) is sometimes used to reduce carbon emissions, but its part remains marginal, representing less than 1% of the production. Industrial production is therefore mainly based on steam methane reforming (SMR) by using natural gas, coal gasification, or electrolysis by using electricity and water [
17].
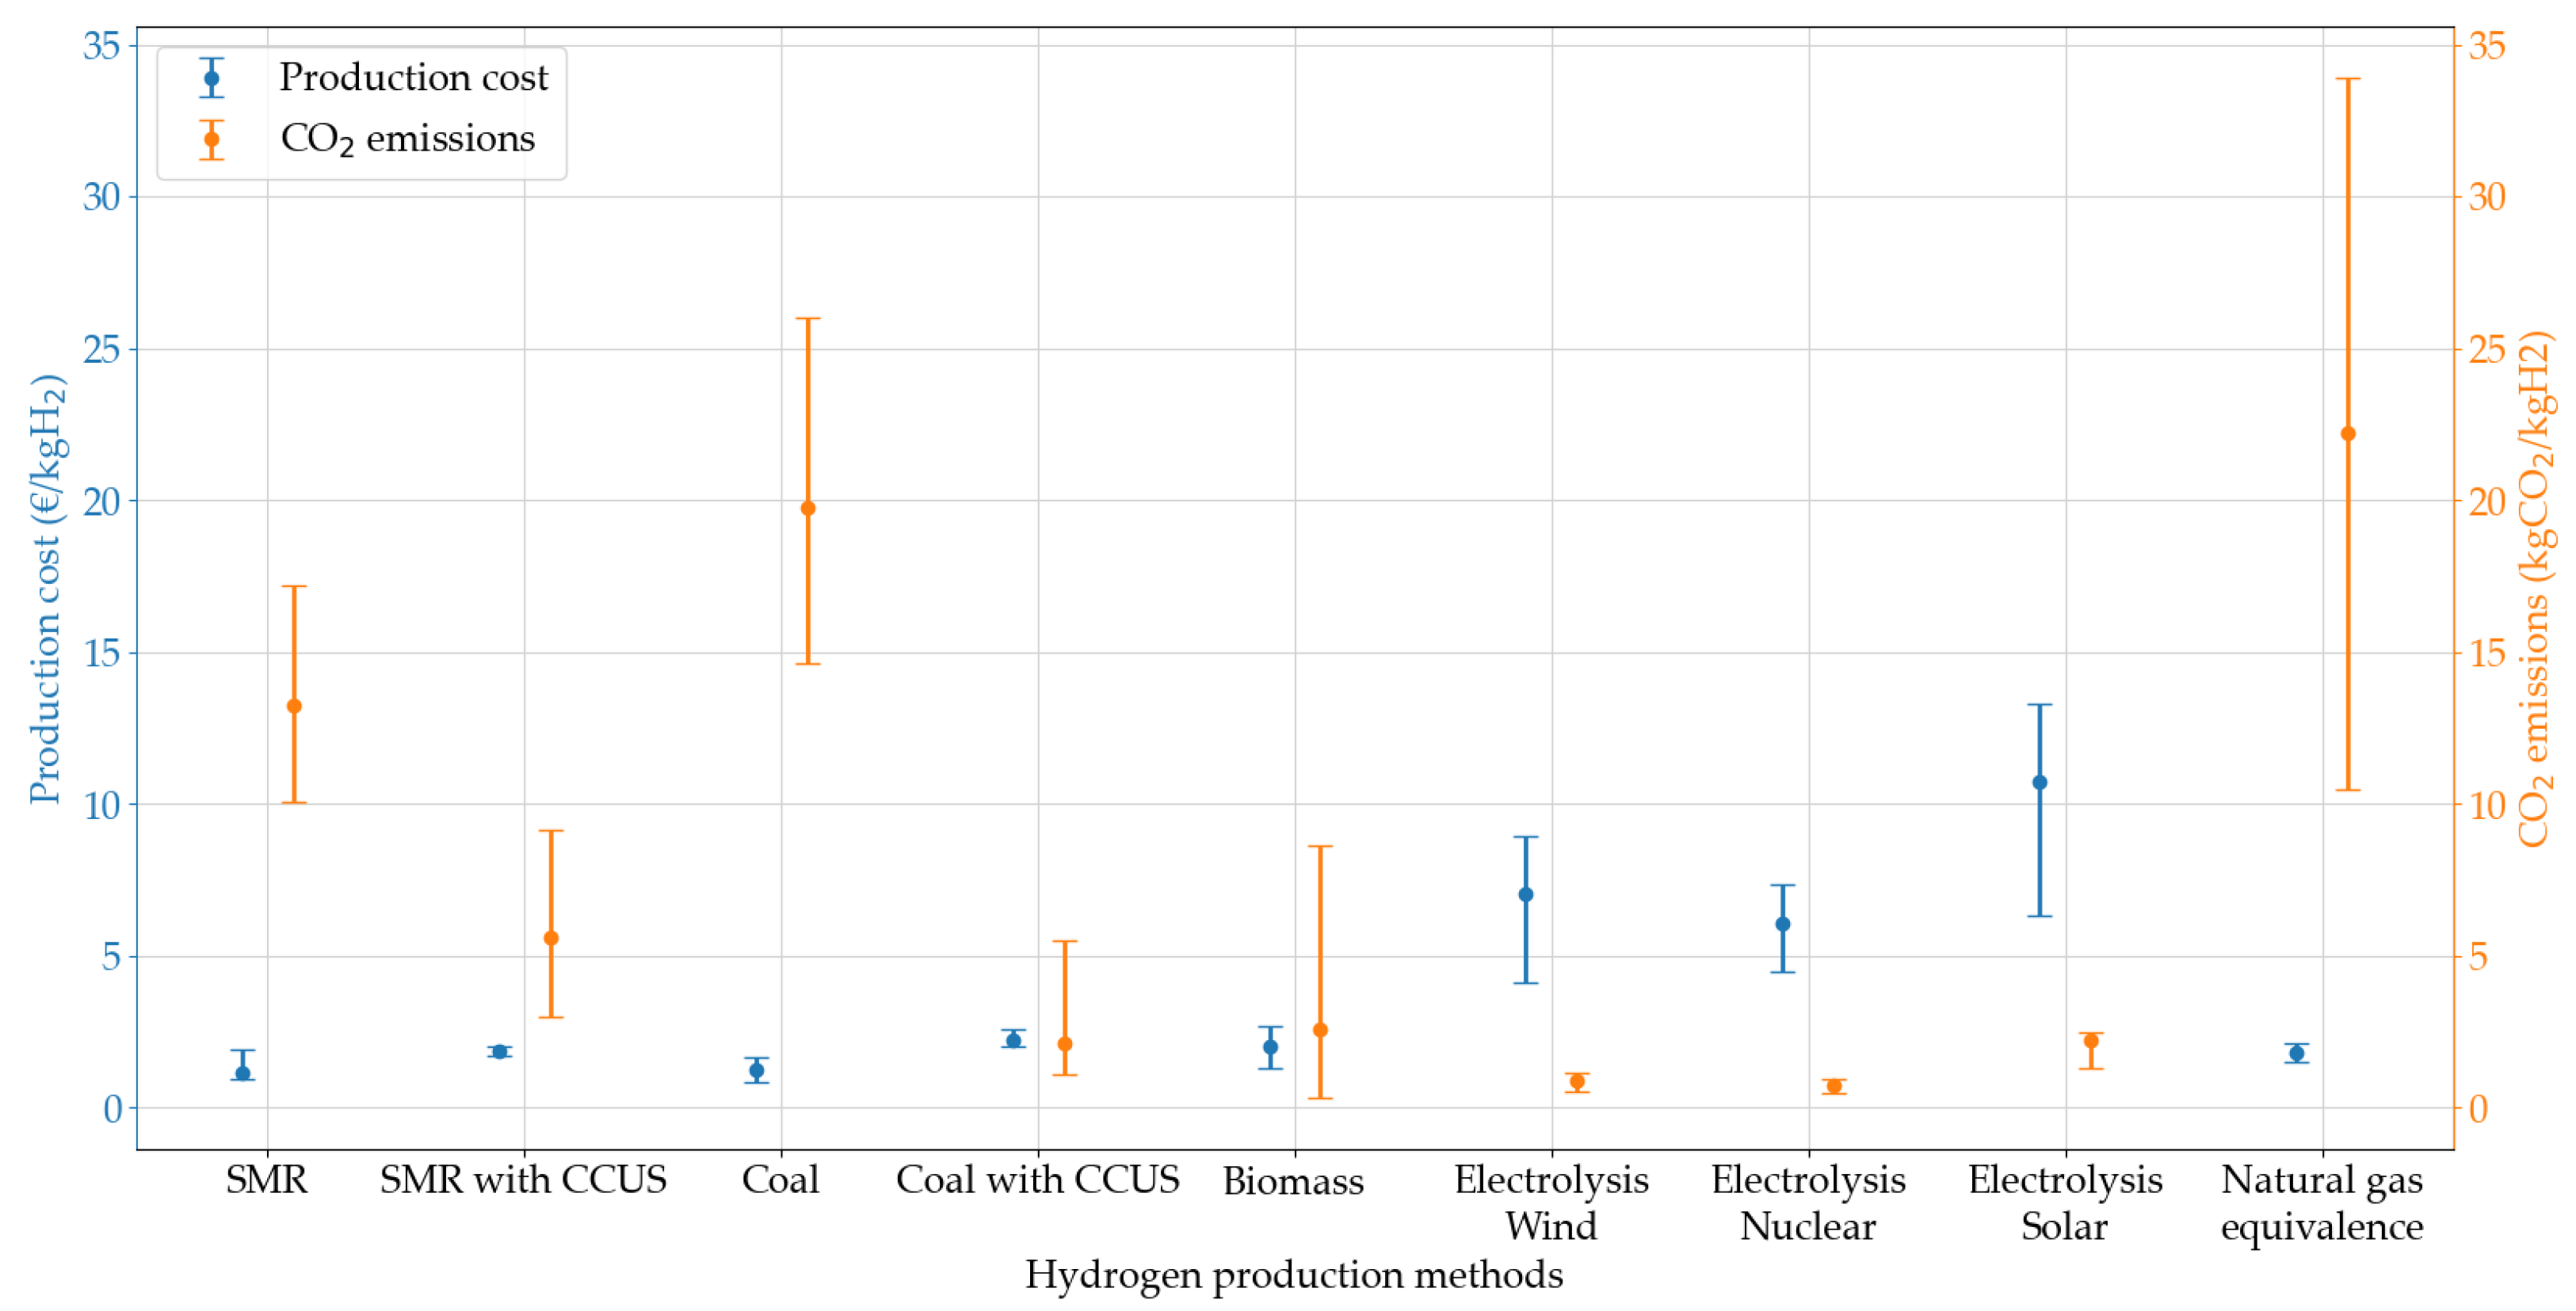
In order to evaluate the different types of hydrogen from an environmental and economic point of view,
Table 2 and
Figure 1 summarise the main characteristics of different hydrogen production methods.
Production costs can vary depending on the geographical location and availability of fossil fuels. Generally, technologies using fossil fuels still remain less expensive than electrolysis with renewable energy, but have a much more important carbon footprint.
The CO
2 emissions of electrolysis using electricity from the grid cannot be easily generalised, as they strongly depend on the electricity mix of the country of production. For hydrogen production from electrolysis, 52 kWh of electricity are needed to generate 1 kg of hydrogen [
18], preferably from low-carbon electricity to reduce emissions. The same hydrogen quantity has a higher heating value of 39.4 kWh (referenced in
Table 3), which leads to a total maximum process efficiency of 75%. Therefore, 25% are losses, mostly terminal heat losses during production, which can be minimised through sector coupling, in the case of large hydrogen production facilities being located near urban areas. Low-temperature district heating, for instance, could then benefit from these losses, further raising the attractiveness of using electrolysis [
22].
Figure 1.
Production cost and CO
2 emissions of different hydrogen production methods (based on data from the
Energy and Environmental Science journal, 2019 [
19]). The natural gas equivalence is established for this specific case study as a comparison between hydrogen and natural gas. To determine the equivalent production cost, the average non-household price for natural gas of 0.05 EUR/kWh in 2020 [
23] is multiplied by hydrogen’s heating value (referenced in
Table 3). The CO
2 footprint of natural gas-fired power plants is assumed to be between 0.29 and 0.93 kgCO
2/kWh, as given by the IPCC [
24]. Hydrogen’s heating value is used again to establish a comparison per kg of hydrogen.
Table 3.
Comparison of the combustion properties of hydrogen and methane. If not specified, values are given at normal temperature and pressure (NTP, i.e., 293.15 K and 1 atm).
Table 3.
Comparison of the combustion properties of hydrogen and methane. If not specified, values are given at normal temperature and pressure (NTP, i.e., 293.15 K and 1 atm).
| Property | Unit | Hydrogen | Methane | References |
|---|
| Density (1 bar, 298 K) | kg/m3 | 0.0813 | 0.643 | [25,26] |
| Lower heating value (LHV) | MJ/kg | 120 | 50 | [26] |
| LHV | kWh/kg | 33.3 | 13.9 | [26] |
| Higher heating value (HHV) | MJ/kg | 142 | 55.5 | [27,28] |
| HHV | kWh/kg | 39.4 | 15.4 | [27,28] |
| Heat of combustion | MJ/kgair | 3.48 | 2.90 | [26] |
| Adiabatic flame temperature with air | K | 2318 | 2148 | [26] |
| Flame velocity | m/s | 2.65–3.25 | 0.37–0.45 | [26] |
| Diffusion coefficient in air (1 bar, 273 K) | m2/s | 8.5 × 10⁻⁶ | 1.9 × 10⁻⁶ | [29] |
| Flammability range | volumetric % in air | 4–75 | 4.3–15 | [26] |
| Minimum ignition energy | mJ | 0.02 | 0.29 | [26] |
| Auto-ignition temperature | °C | 585 | 540 | [26] |
| Stoichiometric composition in air | volumetric % in air | 29.53 | 9.48 | [26] |
| Stoichiometric air–fuel ratio | mass basis | 34.12 | 17.23 | [26] |
| Quenching distance | mm | 0.64 | 2.1 | [26] |
| Research octane number (RON) | - | >130 | 120 | [28,30] |
| Motor octane number (MON) | - | - | 120 | [28] |
2.2. Combustion Properties
In order to understand the impact of hydrogen on an engine, its combustion properties must be assessed.
Table 3 summarises the main differences between hydrogen and methane, the main component of natural gas.
When evaluating the replacement of natural gas with hydrogen in cogeneration plants, it is crucial to consider the distinct combustion properties of hydrogen, as these can significantly impact both the technical performance and environmental outcomes. Hydrogen has a lower energy density compared to methane, which can reduce the power output of internal combustion engines (ICEs) due to the decreased energy content of the fuel mixture. However, hydrogen’s higher adiabatic flame temperature, faster flame velocity, and broader flammability range allow for more efficient combustion, leading to better combustion efficiency and a quicker formation of a homogeneous air–fuel mixture. These characteristics, while beneficial for engine performance, also present challenges such as increased thermal NOX emissions, particularly when hydrogen is blended at higher concentrations.
Another key consideration is hydrogen’s low ignition energy, which facilitates combustion but also increases the risk of premature ignition or flashbacks, especially in engines with nearly closed intake valves. Additionally, the higher auto-ignition temperature of hydrogen allows for higher compression ratios, which could enhance engine performance but also necessitate adjustments to prevent knocking. Moreover, hydrogen’s smaller flame quenching distance compared to methane raises concerns about potential backfiring and the quicker evaporation of oil lubricants, leading to increased emissions of carbon oxides.
Furthermore, the blending of hydrogen with natural gas influences NOX emissions. For lower blending percentages (under 30%), NOX emissions tend to decrease, but higher blending rates can lead to an increase in these emissions due to hydrogen’s higher flame temperature. Strategies such as lean-burn combustion, which reduces the air–fuel ratio and thereby lowers the combustion temperature, can help mitigate this issue. Ensuring a homogeneous air–fuel mixture and optimizing spark ignition timing can also reduce NOX emissions.
In conclusion, when considering the replacement of natural gas with hydrogen in CHP plants, it is essential to evaluate the combustion properties—such as energy density, ignition characteristics, flame behaviour, and emissions—since they directly impact engine performance, emission control, and the overall feasibility of the transition. These factors must be carefully addressed to optimize the technical and environmental outcomes of hydrogen retrofitting in existing plants.
2.3. Resources Needed for Operation
Evaluating the resources necessary to fulfil the demand, most notably to produce the required amounts of hydrogen through electrolysis with low-carbon electricity, allows the overall potential of the project to be judged.
2.3.1. Required Quantities of Hydrogen
The necessary quantities of gas to convert a natural gas power plant into a plant using hydrogen and natural gas,
and
, respectively, at pressure
P and temperature
T, are determined based on LHVs with Equations (
1) and (
2).
where
E is the total amount of energy to produce, with the reference value here being the energy currently produced by the power plant when running on 100% natural gas, which is 19 GJ.
and
are the lower heating values of natural gas and hydrogen at pressure
P and temperature
T, referenced in
Table 3.
is the efficiency ratio between the natural gas and hydrogen power plant, equal to 1.005. The efficiencies taken into account are those discussed in Table 5.
is the density of the gas in
. The value used here for hydrogen is 0.73
, which corresponds to the density at approximately 8 barg and room temperature, determined with a chart provided by H
2 Tools [
25]. Hydrogen’s pressure is chosen according to values used in the HanseWerk Natur pilot project, described in
Section 3.4.1. This pressure can only be considered when pure hydrogen is used. For hydrogen and natural gas blends, equal conditions must be considered.
is the volumetric percentage of hydrogen.
2.3.2. Required Resources for Low-Carbon Hydrogen Production
Given the needs for hydrogen, an estimation of the amount of water and electricity necessary to produce enough gas can now be computed. Moreover, an estimation is deployed for the installed capacity necessary to produce the corresponding low-carbon electricity. The following assumptions are approximations and the goal is solely to obtain an order of magnitude estimate of the required resources. The following assumptions have been made:
The model computes the installed capacity necessary to cover the daily required production in less than 24 h on average. For the electricity production, three different standard-sized power plants are considered.
For nuclear energy, the computations are made with a 1450 MW pressurised water reactor and a capacity factor of 0.80 [
31].
For wind energy, an off-shore wind park composed of 6 MW turbines, such as in Saint-Nazaire in France, has been chosen. The capacity factor is 0.40 [
31].
The solar power plant is composed of 400 W modules with a capacity factor of 0.13 [
31].
It is assumed here that, on average, the power plant must be able to produce at least as much electricity as needed in 24 h to avoid shortages. Some days, production will be lower, especially for wind and solar, which are variable. Some days, production will exceed the needs and the surplus can be stored in tanks, creating a daily and seasonal energy storage.
The conversion between hydrogen needs and production are made with the following data:
The efficiency of the electrolyser is set to an average of 75% [
18].
Hydrogen pressure is set to 10 bar at −60 °C (these are the temperature and pressure used by other industrial hydrogen consumers in Luxembourg in their infrastructure and represent a higher density than room temperature hydrogen) and the corresponding density is determined with a chart provided by H
2 Tools [
25].
The hydrogen mass m is computed with the density and volume V according to the formula .
According to the IEA, per kg of hydrogen, 52 kWh of electricity and 9 L of water are needed [
18].
The required number of production units
n are determined by the following formula:
E is the required electric energy (in kWh), P the capacity of one unit (in kW), the capacity factor, and t the production duration (in h).
2.4. Straight-Line Method to Estimate the Residual Value of a Used Engine
In this case study, the current engine in the power plant is still operating. Hence, the provider might decide to sell it to replace it with a more recent model. To determine its residual value after 14 years of operation, the straight-line method is used, which assumes that the value of the power plant decreases linearly each year [
32].
It is assumed here that after an average lifetime of 20 years, the power plant has no residual value. These assumptions are pessimistic, as the life-time of the plant might be extended over 20 years, depending on the operating hours. Moreover, the residual value is unlikely to be 0, as some components could still be sold. However, this allows the upcoming need for a major overhaul of the engine to be taken into consideration, which could have a negative impact on its value.
2.5. Fuel Cost Projections
It is essential to analyse the likeliness of renewable hydrogen becoming competitive with natural gas before 2050 to evaluate the long-term benefits of investing in this technology.
2.5.1. Natural Gas Price Projection
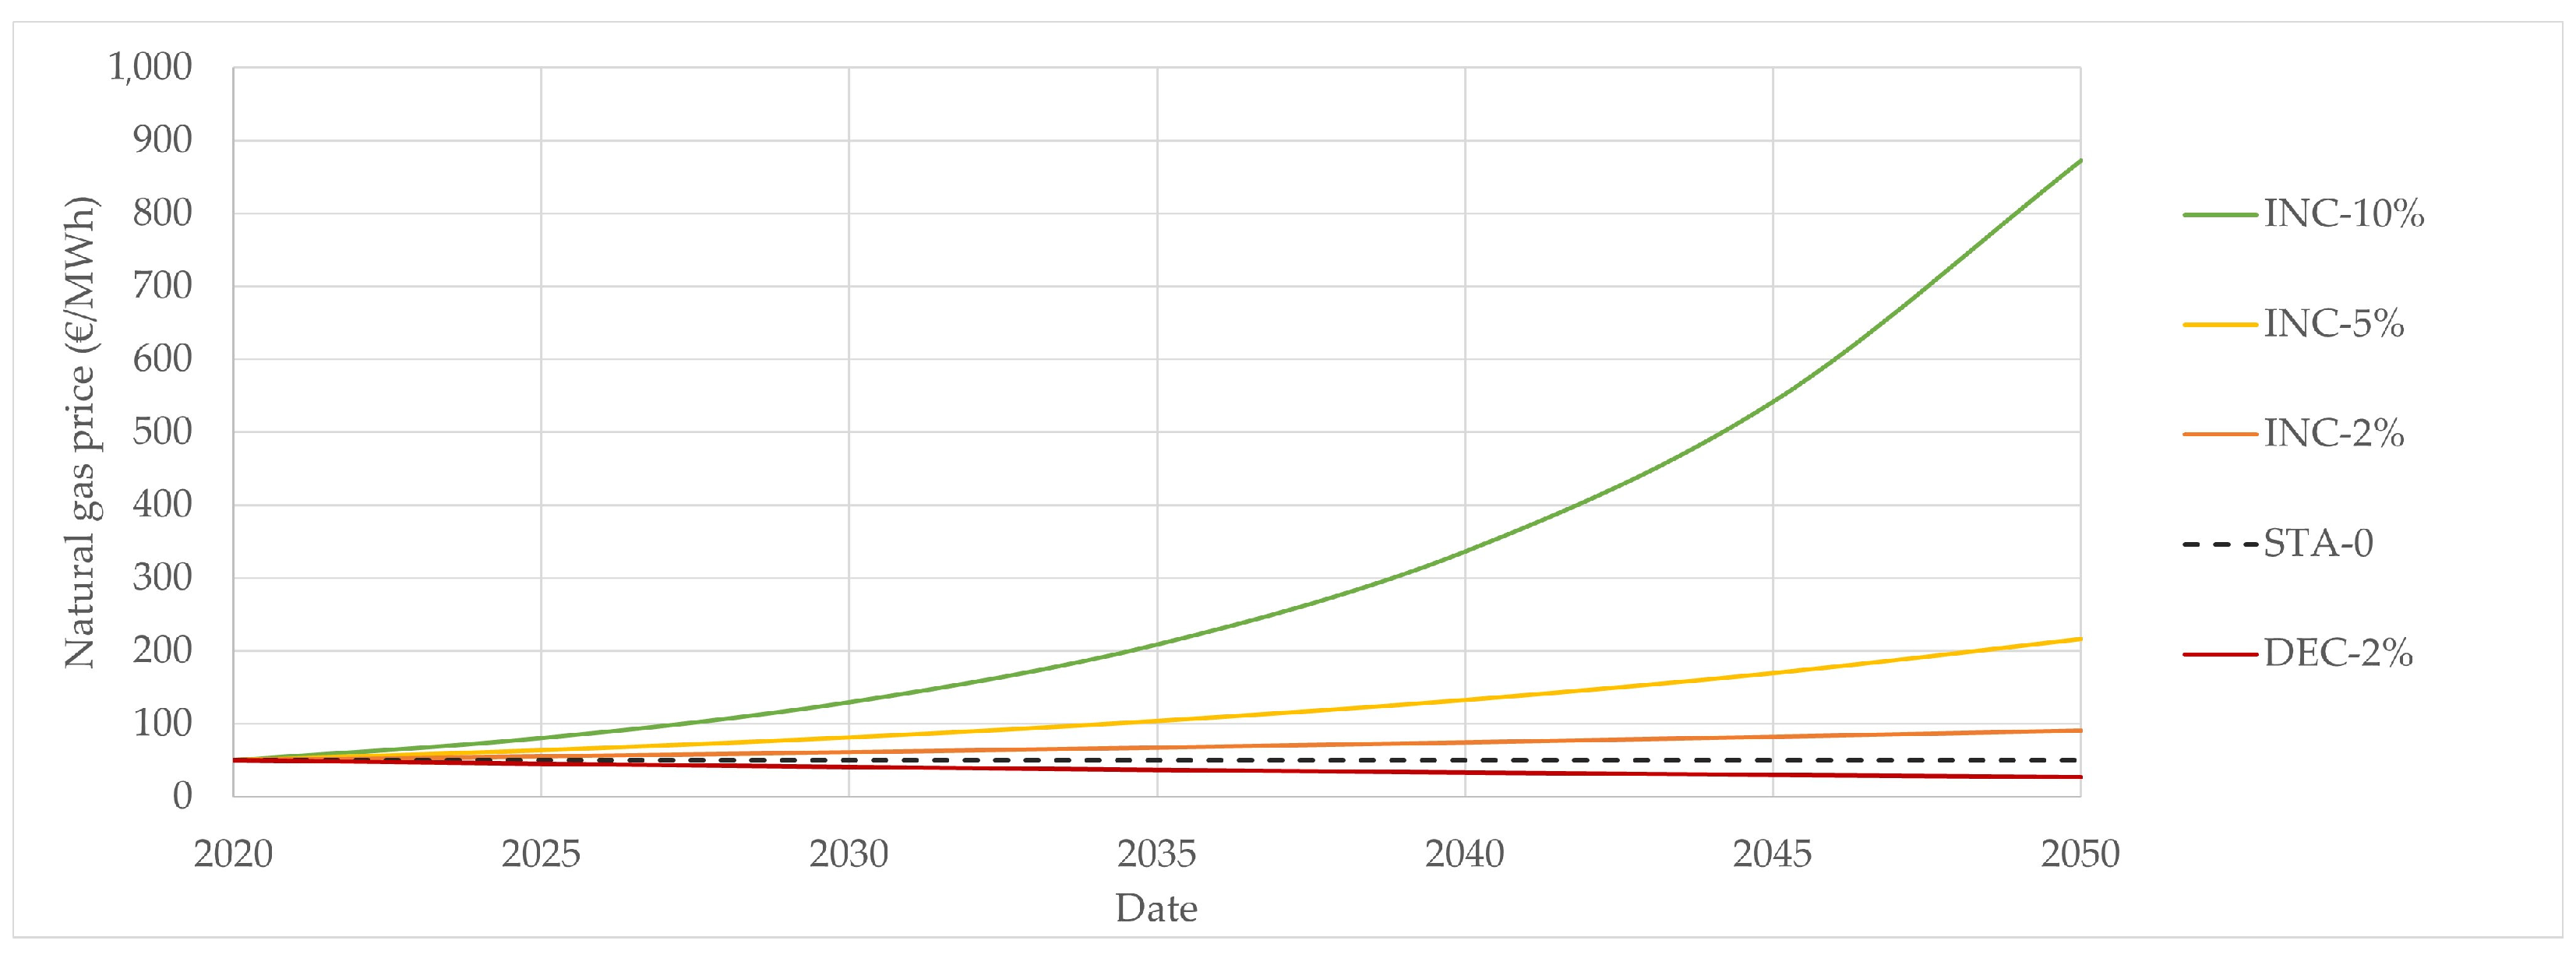
Figure 2 illustrates the scenarios chosen for the possible price evolution of natural gas until 2050. These scenarios allow the necessary requirements for a more profitable evolution of green hydrogen to be assessed. For example, if the projections show that in 2050 green hydrogen is only more profitable than a scenario in which natural gas increases by 10% yearly, we can conclude that it is unlikely that hydrogen will become profitable in the near future.
The following scenarios were chosen:
DEC-2%: An average yearly decrease in the natural gas price of 2% is assumed. This is possible if no CO2 or other geopolitical taxes are introduced. Natural gas-exporting countries might choose to decrease their prices to encourage further investments.
STA-0: This scenario assumes a stagnation of the average natural gas prices for non-household consumers in the Euro zone in 2020 at 50 EUR/MWh (excluding value-added tax (VAT) and other recoverable taxes and levies) [
23].
INC-2%: An average yearly increase of 2% is assumed. Scenarios in which the price for natural gas increases are made possible with rising CO2 taxes to encourage investments in low-carbon alternatives, but also by sanctions due to geopolitical tensions.
INC-5%: An average yearly increase of 5% is assumed.
INC-10%: An average yearly increase of 10% is assumed.
The scenarios which assume an increase in natural gas prices can be justified by the introduction of carbon pricing. In fact, the continuous use of fossil fuels has been associated with consequences such as an ever-rising atmospheric CO
2 concentration, which in turn leads to global rising temperatures and climate change. Burning fossil fuels leads to external costs, which are mainly caused by air, soil, and water pollution and their associated negative impact on biodiversity, human health, and agriculture among others. Costs also arise due to the consequences and damages of extreme weather events, which are more likely to occur and more severe in a warming climate. The consequences caused by CO
2 emissions are also referred to as the social cost of carbon [
33,
34]. These external costs can be internalised through carbon pricing, which gives emitters the choice to either continue their business as usual but pay for their emissions, or upgrade their installations to be carbon-neutral and avoid paying.
2.5.2. Hydrogen Price Projection
Figure 3 includes the projections for renewable hydrogen prices. The projections are largely based on an analysis realised by the International Renewable Energy Agency (IRENA) in 2020 (Figure ES2 p.11) [
35].
The different scenarios for hydrogen prices are defined using the following criteria, with AC referring to electricity cost and EL to electrolyser cost:
High AC: High electricity prices are set by the IRENA to 65 USD/MWh (57 EUR/MWh).
High EL: High electrolyser cost describes a scenario in which in 2020, electrolysers cost 1000 USD/kW (877 EUR/kW), and in 2050, 307 USD/kW (269 EUR/kW) for a 1 TW installed capacity.
Low AC: Low electricity prices are set by the IRENA to 20 USD/MWh (18 EUR/MWh).
Low EL: Low electrolyser cost describes a scenario in which in 2020, electrolysers cost 650 USD/kW (570 EUR/kW), and in 2050, 130 USD/kW (114 EUR/kW) for a 5 TW installed capacity.
Some adjustments have been made to adapt IRENA’s analysis to the current case study. First of all, costs have been converted from USD/kgH
2 to EUR/MWh using the average currency exchange rate from 2020 (according to the European Central Bank, the average currency exchange rate in 2020 was 1 EUR = 1.1422 USD) and hydrogen’s LHV value in kWh/kg (
Table 3). In the IRENA analysis, prices refer to hydrogen production cost. However, the previously defined natural gas price range is based on market prices, i.e., selling prices. In order to make a comparison between hydrogen and natural gas, a conversion factor between hydrogen production cost and final price, including transport and distribution, is defined.
The conversion factor is determined by readjusting the projection by the IRENA to the current tendency in Europe, in order to match the “High AC” scenarios to current hydrogen market prices. Therefore, the hydrogen costs determined by the IRENA are doubled to take the aforementioned factors into consideration. This also leads to an accordance with projections made by Schnuelle et al. in March 2022 [
36].
3. Results
3.1. Choice of the Hydrogen Source
The analysed engine runs on natural gas. To achieve a greater independence from fossil energy sources, and to minimise emissions during power generation, the right choice of hydrogen is essential.
First of all, replacing natural gas by hydrogen produced by SMR would be a mistake. In fact, if hydrogen is produced from natural gas, there would be no reduction whatsoever in the CO
2 emissions over the entire life cycle, which means that there would be no real environmental advantage. Emissions might even be higher overall since SMR only has a production efficiency of 65 to 75% (see
Table 2) [
19]. Moreover, each step, such as hydrogen production, transport, and use, adds more losses and therefore increases the overall cost [
18].
Using hydrogen produced by SMR with CCUS would reduce emissions during production [
19], but would once again not be as cost-efficient as the current power plant, since the cost of this hydrogen is also tied to the market price of natural gas. Therefore, if the cost of natural gas skyrockets, hydrogen produced by methane with an additional CCUS would also increase.
Another possibility would be to generate hydrogen by electrolysis with electricity from the grid. Once more, if natural gas power plants are used to generate part of the electricity injected into the grid, the production cost for hydrogen would still be highly dependent on the financial evolution of natural gas.
Therefore, if the plant was to be run on hydrogen, it must be assured that the hydrogen production is low-carbon, preferably from electrolysis with renewable or even nuclear energy. This can guarantee low CO
2 emissions during production and use [
19], as well as a better economic independence from natural gas prices.
3.2. Hydrogen Compatibility of the Power Plant
In order to ensure that a given cogeneration plant is ready to accommodate hydrogen, several considerations must be taken into account to guarantee feasibility and safety. Adapting the plant allows a quick and easy transition to hydrogen-based fuels in the future.
3.2.1. Plant Infrastructure
Retrofitting a conventional power plant to be adapted to hydrogen requires some adjustments. Pressure changes might require widening of pipes and changes in materials (see
Section 3.2.2 on hydrogen damage). Hydrogen has a lower energy density, meaning that it takes up more space to provide the same energy content at equal pressure [
37].
In the absence of pipelines, or if emergency supplies are needed, hydrogen tanks require additional space, as they need to be surrounded by safety zones. However, in a power plant located near densely populated or busy areas, obtaining legal permission to use and store hydrogen is often a difficult process. In Luxembourg, the Inspectorate of Labour and Mines has established the safety requirements for storing hydrogen [
38]. One of the legal requirements is that the storage tank must be located in a 10 m wide and 2 m tall safety zone in which there are no inhabited or busy areas.
3.2.2. Safety Measures and Hydrogen Damage
Since H
2 is a small molecule, it might diffuse through certain materials, possibly increasing risk of failure, and can escape through joints and mechanical seals. Although hydrogen is a non-toxic gas, its wide flammability range and quick diffusion can increase the risk of explosion. Moreover, the flame is not visible to the naked eye, meaning that additional flame and gas detectors must be added for safety reasons [
37].
Furthermore, in a hydrogen-rich environment and under high pressure, high temperature, and mechanical stress, several mechanisms can lead to mechanical failures and damage. The most commonly known phenomena to take into account are high-temperature hydrogen attacks, hydride and hydrogen embrittlement, hydrogen blistering, and stress cracking. The choice of materials and protective coatings can help prevent corrosive damage [
39].
In some plants, including the CHP plants considered in this case study, some joints and welds are made from copper and copper alloys, such as brass. Ammonia corrosion is an important issue when dealing with copper-based materials. In these facilities, hydrogen has to be separated from potential ammonia-based carriers to avoid mechanical failures [
40].
3.2.3. Combustion
Implementing hydrogen into an ICE requires technical changes, since hydrogen and methane, the main component of natural gas, have different physical and chemical combustion properties (
Table 3). Therefore, to avoid mechanical failures, safety issues, output decrease, and an increase in harmful emissions, the engine has to be adapted to the fuel change. These adjustments are discussed in the following section.
3.3. Technical Adjustments of the Engine
The main changes required for a hydrogen-fuelled ICE are listed below. The list is non-exhaustive and varies depending on the characteristics of the retrofitted engine.
3.3.1. Ignition
Hydrogen’s minimum ignition energy is more than 10 times lower than that of methane. For this reason, ignition has to be adapted to avoid hot spots in the combustion chamber, which could eventually lead to pre-ignition and backfire. Engine knocking can also be a cause and consequence of backfire [
41]. To avoid this issue, the combustion can be triggered by a glow plug, a resistance hot wire, or a spark plug which is kept as cold as possible. The spark plugs should not have platinum tips, because platinum acts as a catalyst for hydrogen oxidation [
41,
42].
3.3.2. Crankcase Ventilation
Hydrogen can enter the crankcase by leaking through the piston rings on hydrogen-fuelled ICEs. To avoid safety risks linked to the presence of unburnt hydrogen due to its low ignition energy, pressure relief valves must be installed in the crankcase. Furthermore, good ventilation must be ensured to avoid exhaust gases, in the case of a hydrogen engine mainly water vapour, condensing in the crankcase, reducing the effect of oil lubricants [
42].
3.3.3. Hydrogen Injection
ICEs use different types of fuel injection to introduce the fuel into the combustion chamber. Central injection forms the air–fuel mixture during the intake stroke and introduces the fuel at the inlet of the air intake manifold. Port fuel injection (PFI) introduces the fuel into each intake manifold. The air is injected separately. Direct injection (DI) forms the air–fuel mixture inside the combustion chamber and introduces the fuel when the intake valve is closed, which avoids backfiring [
42].
Table 4 summarises the main advantages and challenges of different fuel injection techniques for ICEs.
Table 4.
Main properties of hydrogen injection techniques in ICEs [
29,
42].
Table 4.
Main properties of hydrogen injection techniques in ICEs [
29,
42].
| Fuel Injection | Advantages | Inconveniences |
|---|
| Central Injection | | |
| Port Fuel Injection | | |
| Direct Injection | | Pre-ignition still possible in combustion chamber Air–fuel mixture can be heterogeneous, which leads to higher NOX emissions
|
3.3.4. Engine Control Unit: Control of Air–Fuel Ratio (AFR) and Sensors
In an ICE using hydrogen as a fuel, using lean-burn combustion is essential. The most important advantage of this is that it lowers the process temperature, counteracting hydrogen’s higher flame temperature. This has a positive impact on NO
X emissions, since they decrease with temperature. In fact, for H
2–natural gas blending percentages under 30%, NO
X emissions are expected to decline, but for higher blending rates, there can be an increase in thermal NO
X emissions due to hydrogen’s higher flame temperature [
43].
Lean-burn combustion refers to the air–fuel ratio (AFR) , which expresses the mass ratio of air to fuel. In lean-burn combustion, is greater than 1, meaning that combustion takes place with an excess of air. The advantage of increasing is that it decreases the process temperature, which counteracts hydrogen’s higher flame temperature and therefore lowers NOX emissions.
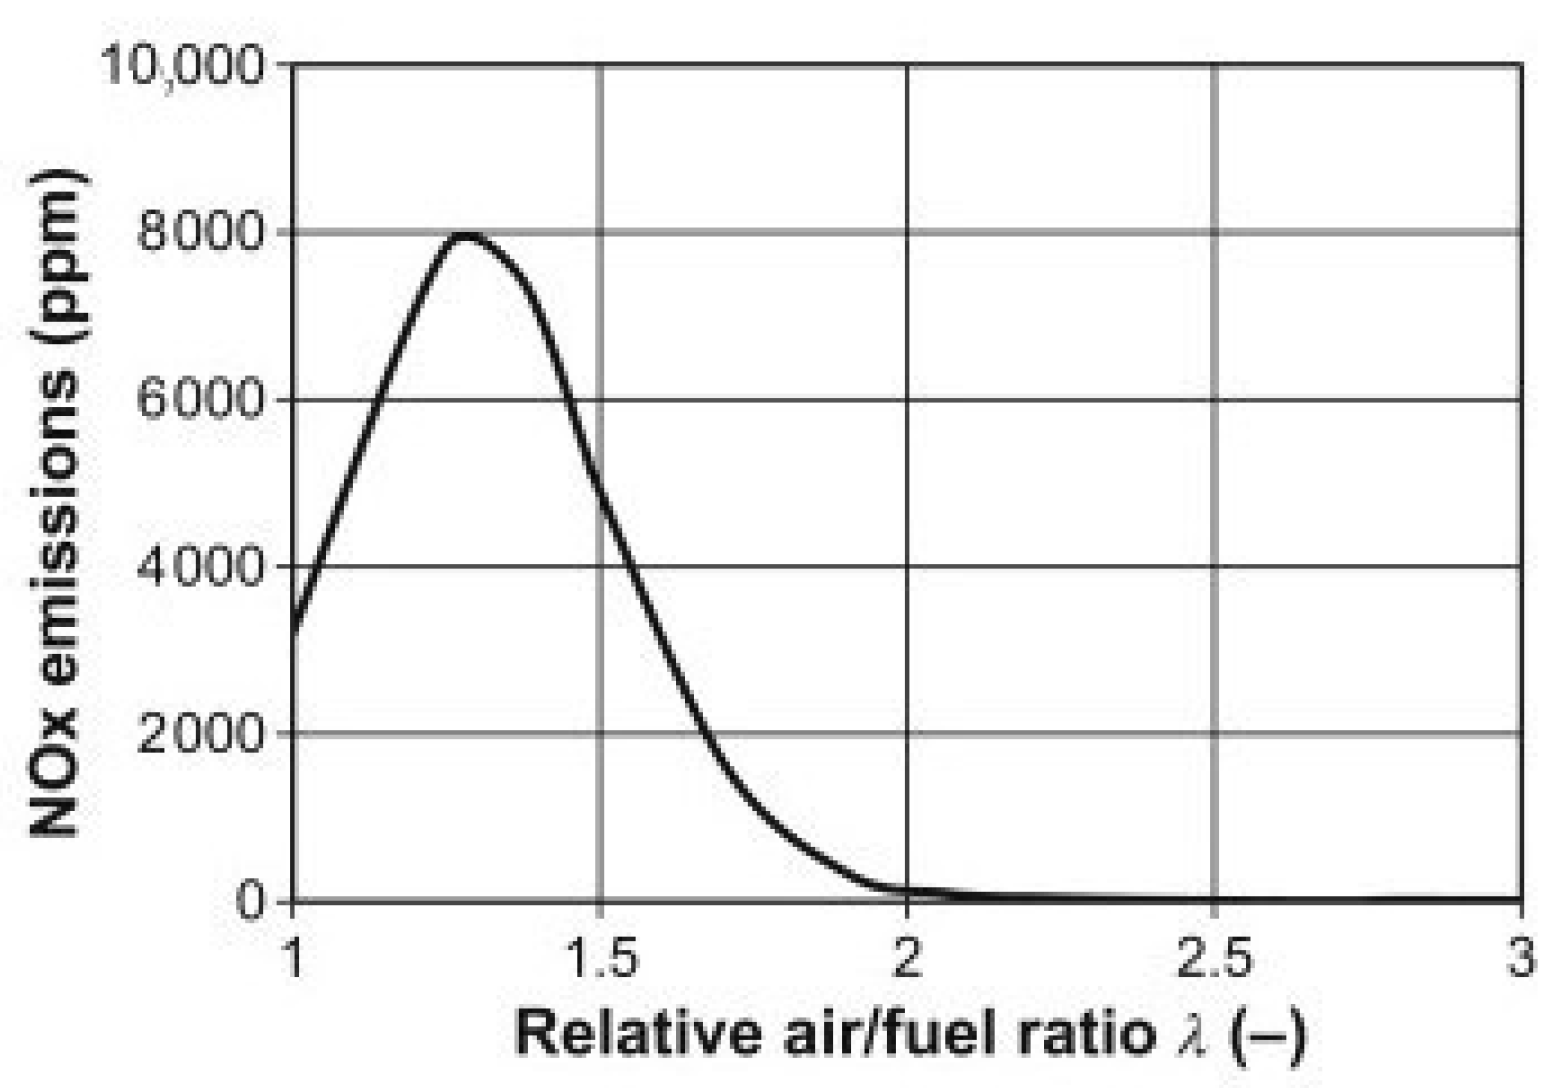
Figure 4 illustrates the evolution of NO
X emissions as a function of the AFR for an ICE powered with hydrogen in a study by Verhelst et al. For
greater than 2, NO
X emissions are close to non-existent [
44].
Moreover, decreasing the process temperature increases the flame quenching distance. The flame quenching distance refers to the closest a flame can approach to a surface before being extinguished [
28]. Hydrogen has a smaller quenching distance than methane, meaning the flame travels closer to the cylinder walls before being extinguished. This can cause oil lubricants to evaporate quicker, leading to the emission of carbon oxides and increasing the probability of backfire, where combustion takes place outside the combustion chamber, because the flame can escape through an open valve. As lean-burn combustion increases flame quenching distance, the above-mentioned issues can be resolved [
29,
42].
3.3.5. Exhaust Gas Recirculation
Another adjustment to further reduce NO
X emissions in addition to lean-burn combustion is to use exhaust gas recirculation (EGR). EGR allows fuel–air mixtures closer to the stoichiometric ratio to be used if desired. The principle is to reinject part of the exhaust gases back into the cylinder. This allows for better efficiency by controlling the output, because the decrease in the proportion of oxygen slows down the combustion process. The thermal inertia of exhaust gases therefore reduces the temperature in the cylinders, thus reducing NO
X emissions as well [
45].
3.3.6. Turbocharging System
The role of the turbocharging system is to force additional compressed air into the combustion chamber. To assure lean-burn combustion, it is important to add extra air. Adapting the turbocharger is therefore necessary to ensure a safe and efficient combustion process [
41].
3.3.7. Compression Ratio
The compression ratio is the ratio of the volume
V1 of the cylinder when the piston is in the bottom position (bottom, dead centre) to the volume
V2 of the cylinder when the piston is in the top position (top, dead centre). The power output increases with an increasing compression ratio. The theoretical thermal efficiency of a spark ignition engine is given by [
28,
42]
with
the compression ratio and
the ratio of specific heats. Since hydrogen has a higher auto-ignition temperature, the compression ratio, which is directly linked to the temperature increase in the cylinder, can be increased to allow better efficiency and greater output [
46].
Hydrogen also has a higher octane number, making it technically more resistant to knocking combustion than other fuels under the same conditions, which allows the use of higher compression ratios [
29,
42].
3.4. Overall Technical Feasibility
3.4.1. Engine Adaptation
Existing natural gas-fuelled engines must be either retrofitted, by adapting different components, or replaced by a new engine manufactured to run with hydrogen. Hydrogen blends can also be used, i.e., the engine can run with a hydrogen and natural gas blend from 0 up to 100%.
In the present case study, the installed engine can run with hydrogen blends up to 60%, leading to a reduction in CO
2 emissions of approximately 30% [
43]. However, the installed engine has been running since 2007 and is approaching a major overhaul in about 10,000 operating hours (oph). The overhaul will extend the engine’s lifetime by 33%, from 60,000 oph, at which stage the overhaul is conducted, to 80,000 oph [
47]. For this reason, the engine supplier suggests replacing the existing engine with a more recent model.
Manufacturers such as INNIO Jenbacher offer hydrogen-ready engines which can run with both hydrogen and natural gas, as well as any blend in between. Jenbacher retrofitted their first hydrogen engine at an industrial scale in the HanseWerk Natur CHP plant in Hamburg at the end of 2020. It is their first engine converted at the megawatt-scale and an important step in the learning process of converting natural gas engines to hydrogen.
Table 5 summarises the technical data of the efficiencies obtained by INNIO in their HanseWerk Natur project. It can be observed that with hydrogen, the electrical output is smaller, though the overall efficiencies remain similar [
48].
3.4.2. Resources for Operating with 100% Hydrogen
Table 6 gives an estimation of the amount of hydrogen necessary to fulfil the demand of power and heat. The methodology is described in
Section 2.3.
Generally, when switching from natural gas to hydrogen, experimental trials have shown that a loss in performance can be expected. However, hydrogen has a higher heating value per mass unit (
Table 3). By using hydrogen at a higher pressure, total gas consumption can be expected to decrease.
For the daily required hydrogen needs of approximately 590 m
3 at 10 bar and −60 °C (these are the temperature and pressure used by other industrial hydrogen consumers in Luxembourg in their infrastructure and represent a higher density than room temperature hydrogen), less than one off-shore wind turbine or almost 28,000 solar modules of 400 W can generate enough electricity to generate the required amount of hydrogen on average. One nuclear reactor can generate enough electricity for almost 1000 equal CHP plants, as presented in
Table 7.
To simplify the estimation, it is assumed here that the power plant requires the same amount of hydrogen daily. While this is not accurate, as daily and seasonal variations exist, hydrogen can be stored in tanks to compensate variations. Therefore, for the needs of this particular power plant, generating enough electricity to produce low-carbon hydrogen is feasible and realistic with nuclear or wind power. For solar power, a higher capacity per unit and capacity factor are needed to reduce the required number of units.
3.5. Capital Expenditure Estimation
Capital expenditure (CAPEX) groups long-term investments, such as property, plants and equipment [
49]. The following prices exclude the value-added tax (VAT). The final CAPEX costs are scaled to the natural gas base scenario, i.e., if the plant continues to run on natural gas.
3.5.1. Natural Gas Reference Case
The current configuration of the power plant is used as a reference case. As in about 10,000 operating hours the installed engine will need a major overhaul, an investment of EUR 100,000 is to be expected if no modifications in terms of operation mode are made. The overhaul extends the engine’s lifetime by 20,000 oph, meaning that the “business as usual” reference case leads to a cost of 5 EUR/oph, excluding fuel.
3.5.2. Plant Infrastructure
Changes to the plant infrastructure might be necessary to adapt to the use of hydrogen. Safety assessments must be made by an external organisation specialised in hydrogen in order to confirm the suitability of the pipes and materials.
The cost for adapting the power plant depends on the required modifications. In 2021, SIEMENS Energy concluded that retrofitting existing pipelines to adjust to hydrogen can cost between 10 and 15% of the initial investment cost of a new installation [
50]. Therefore, it is assumed here that adapting the plant infrastructure will cost around 10 to 15% of a new CHP plant.
In 2007, the cost of installing the CHP plant, without the engine, was estimated at EUR 70,000. Since then, the construction price index, which measures the yearly price changes for construction in Luxembourg, has constantly increased. All in all, between 2007 and 2021, the increase is approximately 32% [
51], leading to an updated cost of about EUR 92,000. Together with the cost of a new engine, detailed in
Section 3.5.4, a new CHP plant would therefore cost around EUR 680,000.
Since the cost of a new power plant has been evaluated at approximately EUR 680,000, the cost of adapting the plant infrastructure is estimated at around EUR 70,000 to 100,000.
3.5.3. Retrofitting
According to cost estimates made by the engine supplier, retrofitting the engine is expected to cost at least EUR 150,000.
However, the retrofitting cost could exceed expectations if additional components need to be replaced due to the planned overhaul, which is necessary to extend the lifespan of the engine by 20,000 oph. In this case study, according to the provided information, an investment cost between EUR 150,000 and 250,000 for the engine can be expected.
This means that in comparison with the natural gas base scenario, an extra EUR 50,000 to 150,000 might have to be invested in order to make the engine hydrogen-ready. By adding the cost for the plant infrastructure, this leads to an operational cost of 6 to 13 EUR/oph, excluding fuel.
3.5.4. Engine Replacement
The engine supplier estimated that a new engine, without a waste-gas heat exchanger, costs around EUR 588,000. This price does not include delivery and assembly in the power plant.
Since the current engine is still operating, it can be considered that the investment cost might be partly amortised by selling the engine or its components. This can help cover part of the costs, such as delivery and assembly. The residual value is determined with the straight-line method, described in
Section 2.4. The initial purchasing price of the engine in 2007 was EUR 290,000. In this case, to reach a residual value of EUR 0 after 20 years, the plant loses EUR 14,500 of value each year. In 2022, the remaining value is therefore approximately EUR 87,000.
According to the previous information, an investment cost of around EUR 600,000 to 680,000 can be expected. This means that in comparison with the natural gas base scenario, an extra 500,000 to EUR 580,000 might have to be invested in order to make the power plant hydrogen-ready.
However, it is to be noted that the life span of a new engine is longer than that of a retrofitted or overhauled engine, meaning that the additional investment cost is amortised over a longer period of time. In fact, the installed engine has 20,000 oph left, whereas a new engine still has 60,000 to 80,000 h left. If the current engine is replaced by a new model with a life expectancy of 80,000 oph, including an overhaul, its operational cost would be 8 to 10 EUR/oph excluding fuel.
3.6. Operating Expense Estimation
The operating expense (OPEX) groups the day-to-day expenses of a company required for the business to run, such as maintenance, fuel costs and workers [
49]. For both scenarios, retrofitting and engine replacement, the OPEX is expected to be identical in the present study.
The goal here is not to compute an estimation for the complete OPEX, but rather to estimate the increase in OPEX in comparison with the current situation. In fact, some of the expenses, such as salaries of the workers, will remain roughly the same.
3.6.1. Current Fuel Cost
The fuel cost depends on the number of operating hours of the power plants. It is assumed here that whether the plant runs with natural gas or hydrogen, the number of operating hours remains similar.
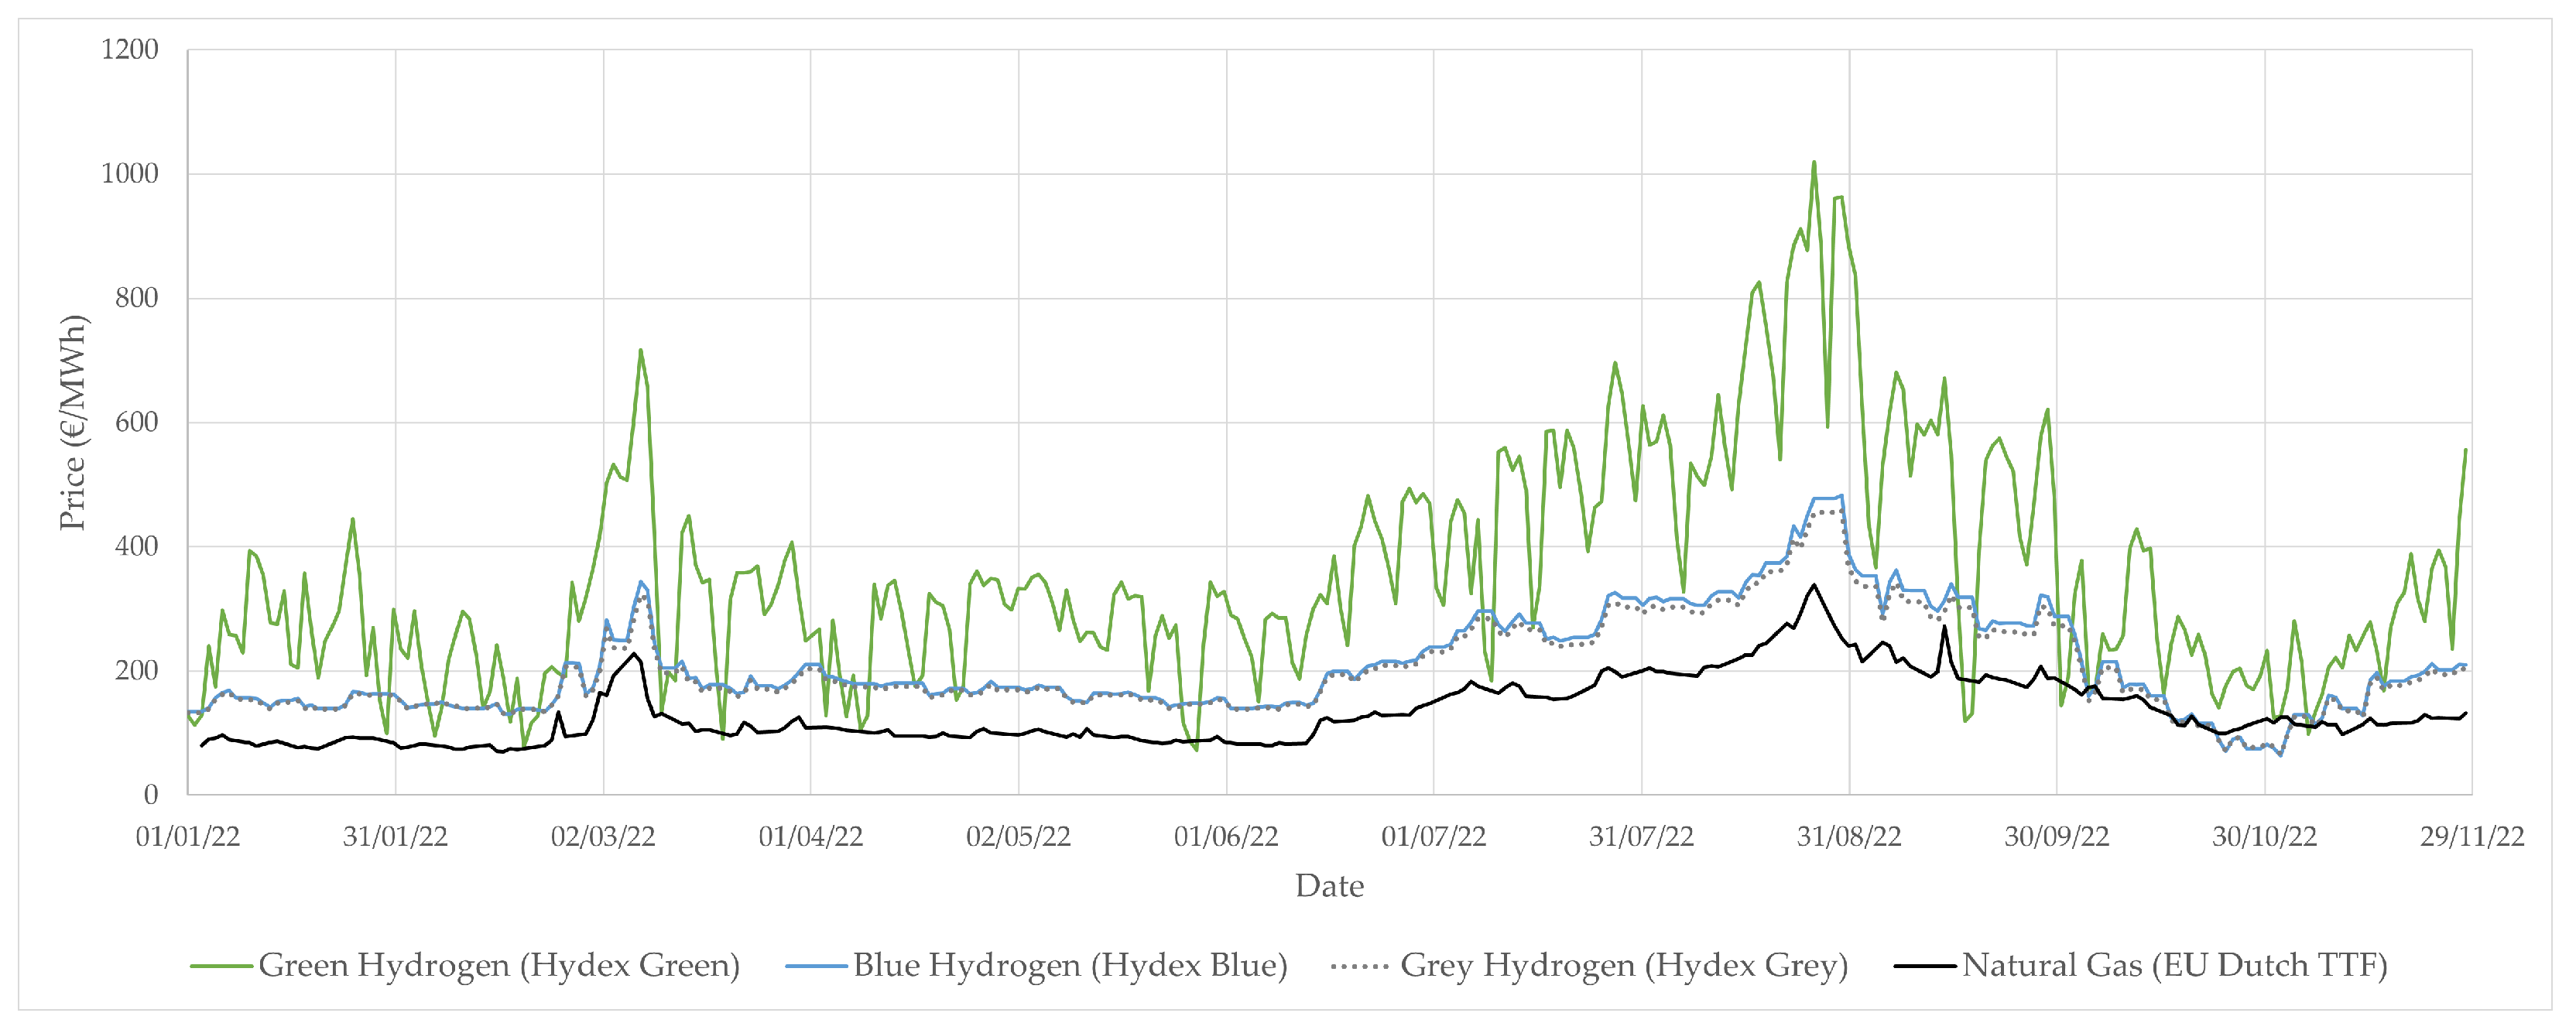
Figure 5 shows the price of natural gas and hydrogen in Europe from January to November 2022. Green hydrogen refers to hydrogen produced from renewable sources, blue hydrogen is produced from fossil fuels with CCUS, and grey hydrogen is produced from fossil fuels without CCUS.
Hydrogen produced from natural gas has become slightly less competitive due to rising natural gas prices. For some periods of time, green hydrogen became highly competitive and sometimes even less expensive than its fossil-fuel-based counterparts. Nonetheless, on average, green hydrogen is still two to three times more expensive than natural gas per MWh. Therefore, as of December 2022, replacing natural gas by hydrogen leads to an increase of approximately 100 to 200% in fuel costs, but fluctuations are very important.
3.6.2. Fuel Cost Projections
The projections illustrated in
Figure 3 show that there is a realistic likeliness that hydrogen will become competitive with natural gas in the near future. In fact, for the low-electricity-price scenario, hydrogen will be competitive with a 2% natural gas scenario before 2045 and around 2035 for a 5% scenario. If electricity prices remain high, hydrogen will become competitive with the 5% natural gas scenario around 2045.
Even if the timeline is highly speculative, the recent evolution of natural gas prices show that the energy market can fluctuate very quickly in favour of alternatives.
This analysis also backs up the projections of how the production costs of different types of hydrogen production methods might evolve. As natural gas becomes less competitive, fossil-based production methods will lose the economic benefit that they currently thrive on.
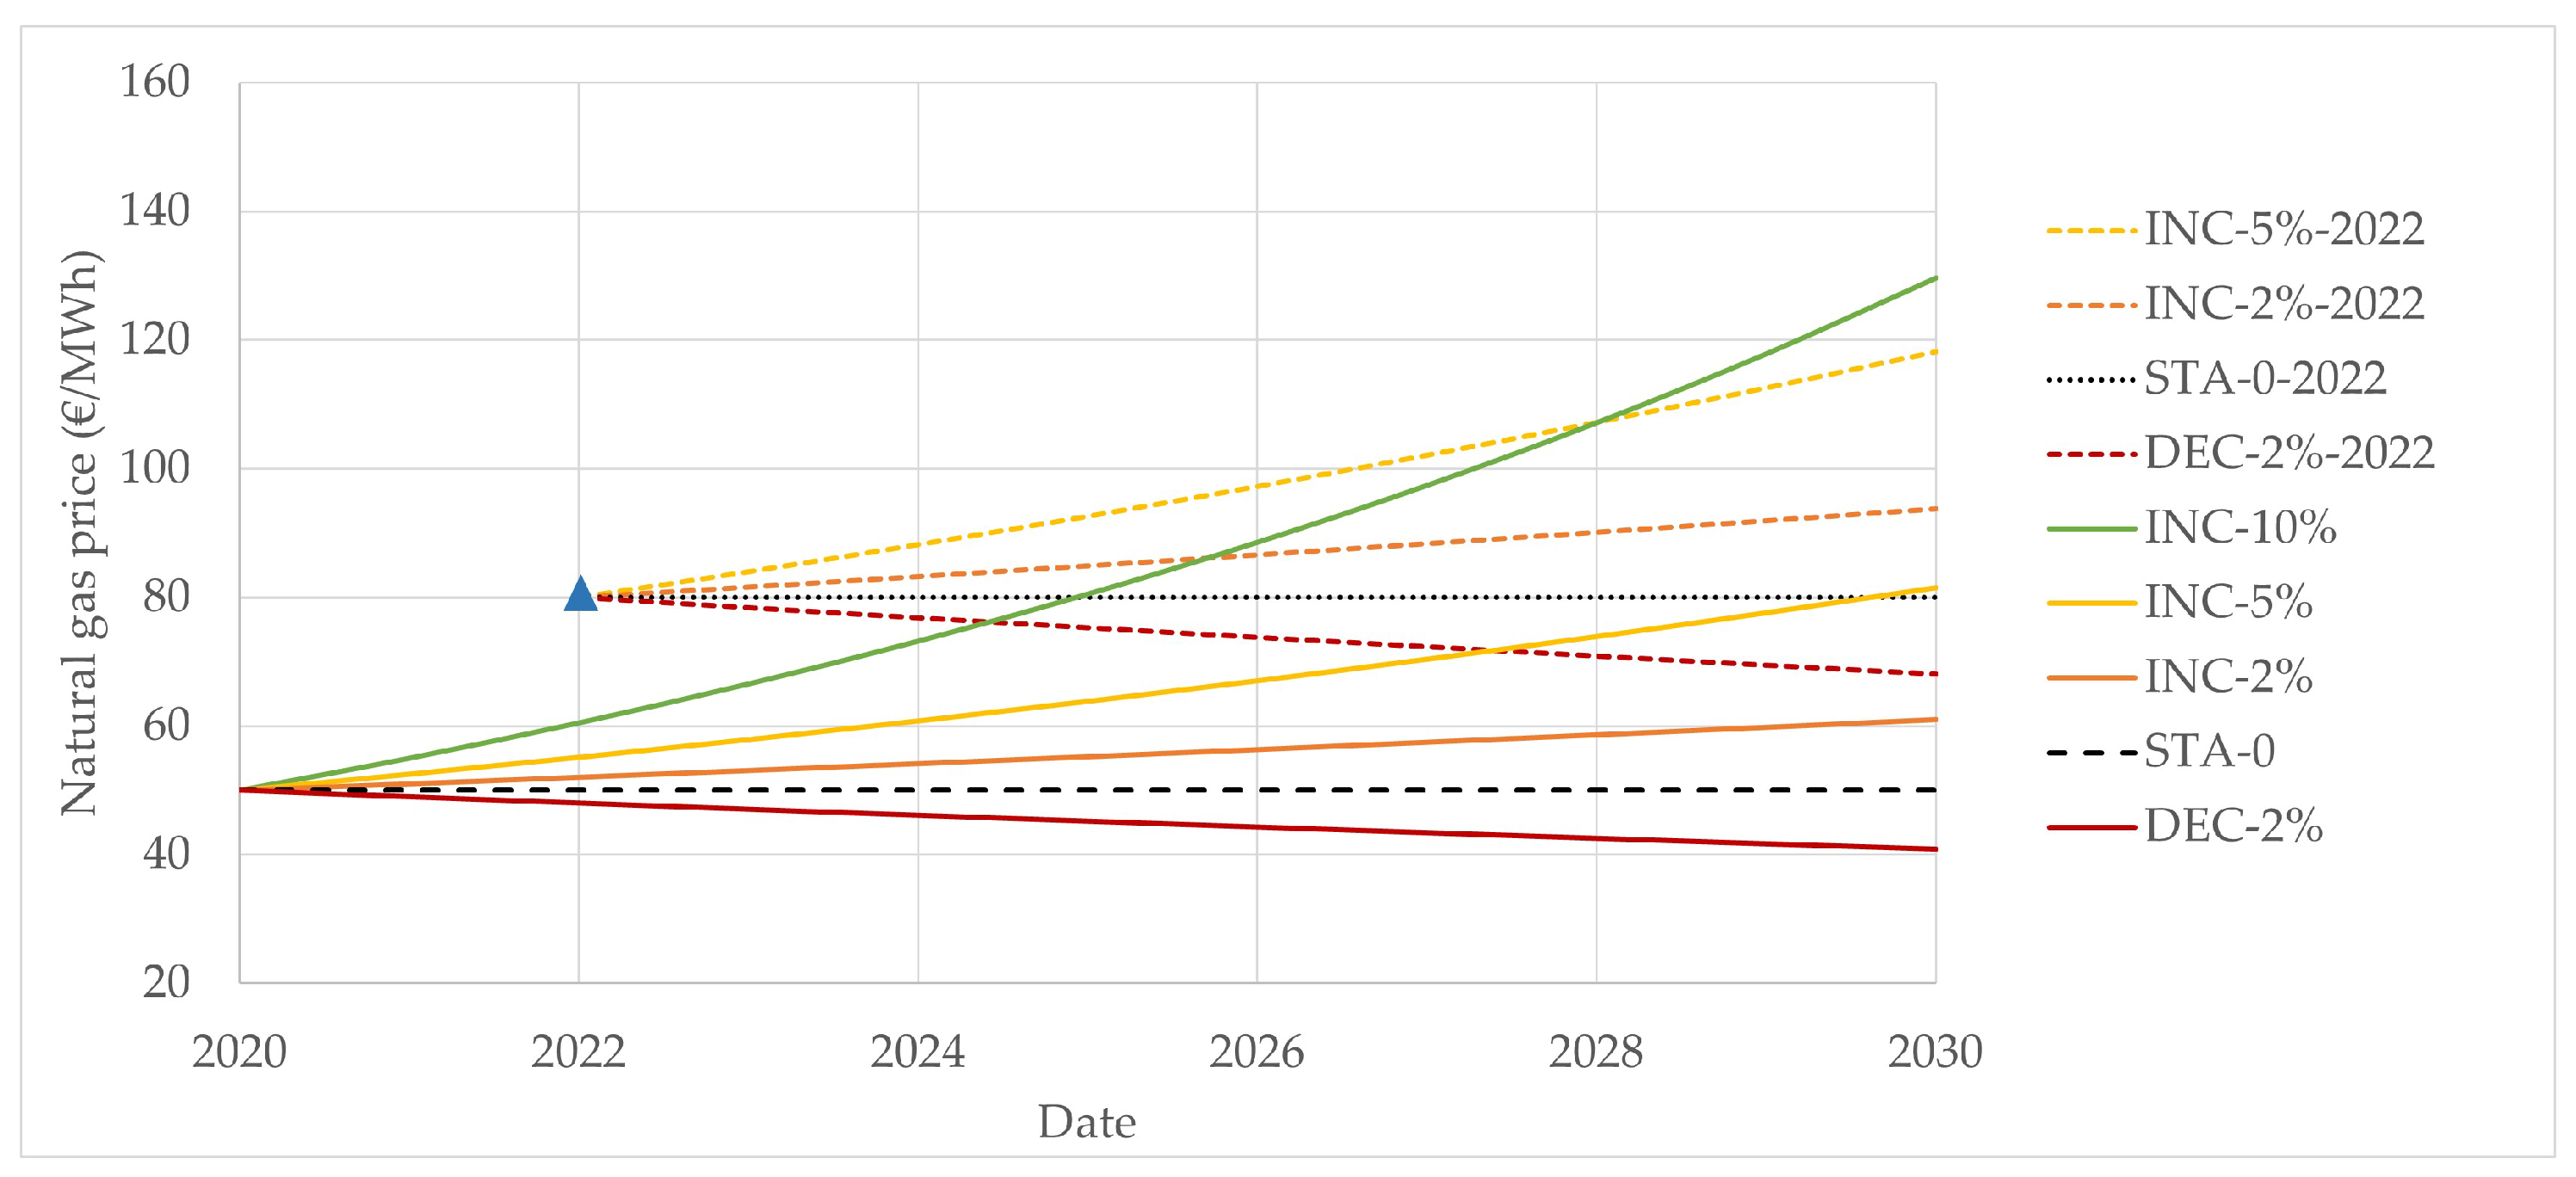
3.6.3. Influence of Local Peaks
It is to be noted that due to geopolitical tensions surrounding the natural gas supply from Russia, prices skyrocketed in the first quarter of 2022. The EU Dutch Title Transfer Facility (TTF) gas prices, the leading European benchmark for natural gas prices, peaked at almost 340 EUR/MWh in August 2022, whereas prices had remained mostly under 25 EUR/MWh in the 10 previous years [
53]. In
Figure 6, the blue triangle represents the average cost of natural gas for non-household consumers in the Euro zone in the first semester of 2022, which has almost doubled since 2020 [
23]. If the 2022 price is used as a starting point for the previously defined scenarios, it can be observed that by 2030, even a 2% yearly decrease in the 2022 scenario still leads to higher prices than the scenario with a 2% increase from 2020.
This shows that the projections are very sensitive to local peaks, which can be, as in 2022, due to political conflicts, but also possibly due to the internalisation of negative fossil fuel consequences, through carbon taxes, for instance.
3.6.4. Staff Training
Staff training is essential to ensure that adequate safety measures are undertaken. This expense is independent of the operating hours of the power plant. Staff would most likely be required to take courses about hydrogen sensitisation and handling. Depending on the courses and certification companies, whether they are online or in person, prices can range from about EUR 500 to 1000 per course and per worker [
54].
If it is assumed that each worker requires on average training costing EUR 1000 per year, and with a monthly net salary of EUR 2500, training represents an increase of approximately 3% in expenses. In reality, workers would require several training courses at the beginning, which then do not need to be constantly repeated. This means that the increase due to training will most likely remain well below 3%.
4. Discussion
The findings of this study demonstrate that, technically, retrofitting a natural gas-fuelled CHP plant for hydrogen use is feasible, with available solutions allowing for a gradual transition while maintaining similar efficiencies [
12,
13,
14,
15]. The current engine can be adapted by the manufacturer to accommodate up to 60% hydrogen blending—twice the level examined by Glanville et al. [
43]. However, economic constraints remain a significant challenge, as hydrogen prices are still higher than natural gas, increasing operational costs. In this study, higher blending percentages are assessed to maximise CO
2 emission reductions.
For hydrogen blending beyond 60%, substantial modifications to the engine and plant infrastructure are required, leading to investment costs between EUR 220,000 and 780,000 in this case study.
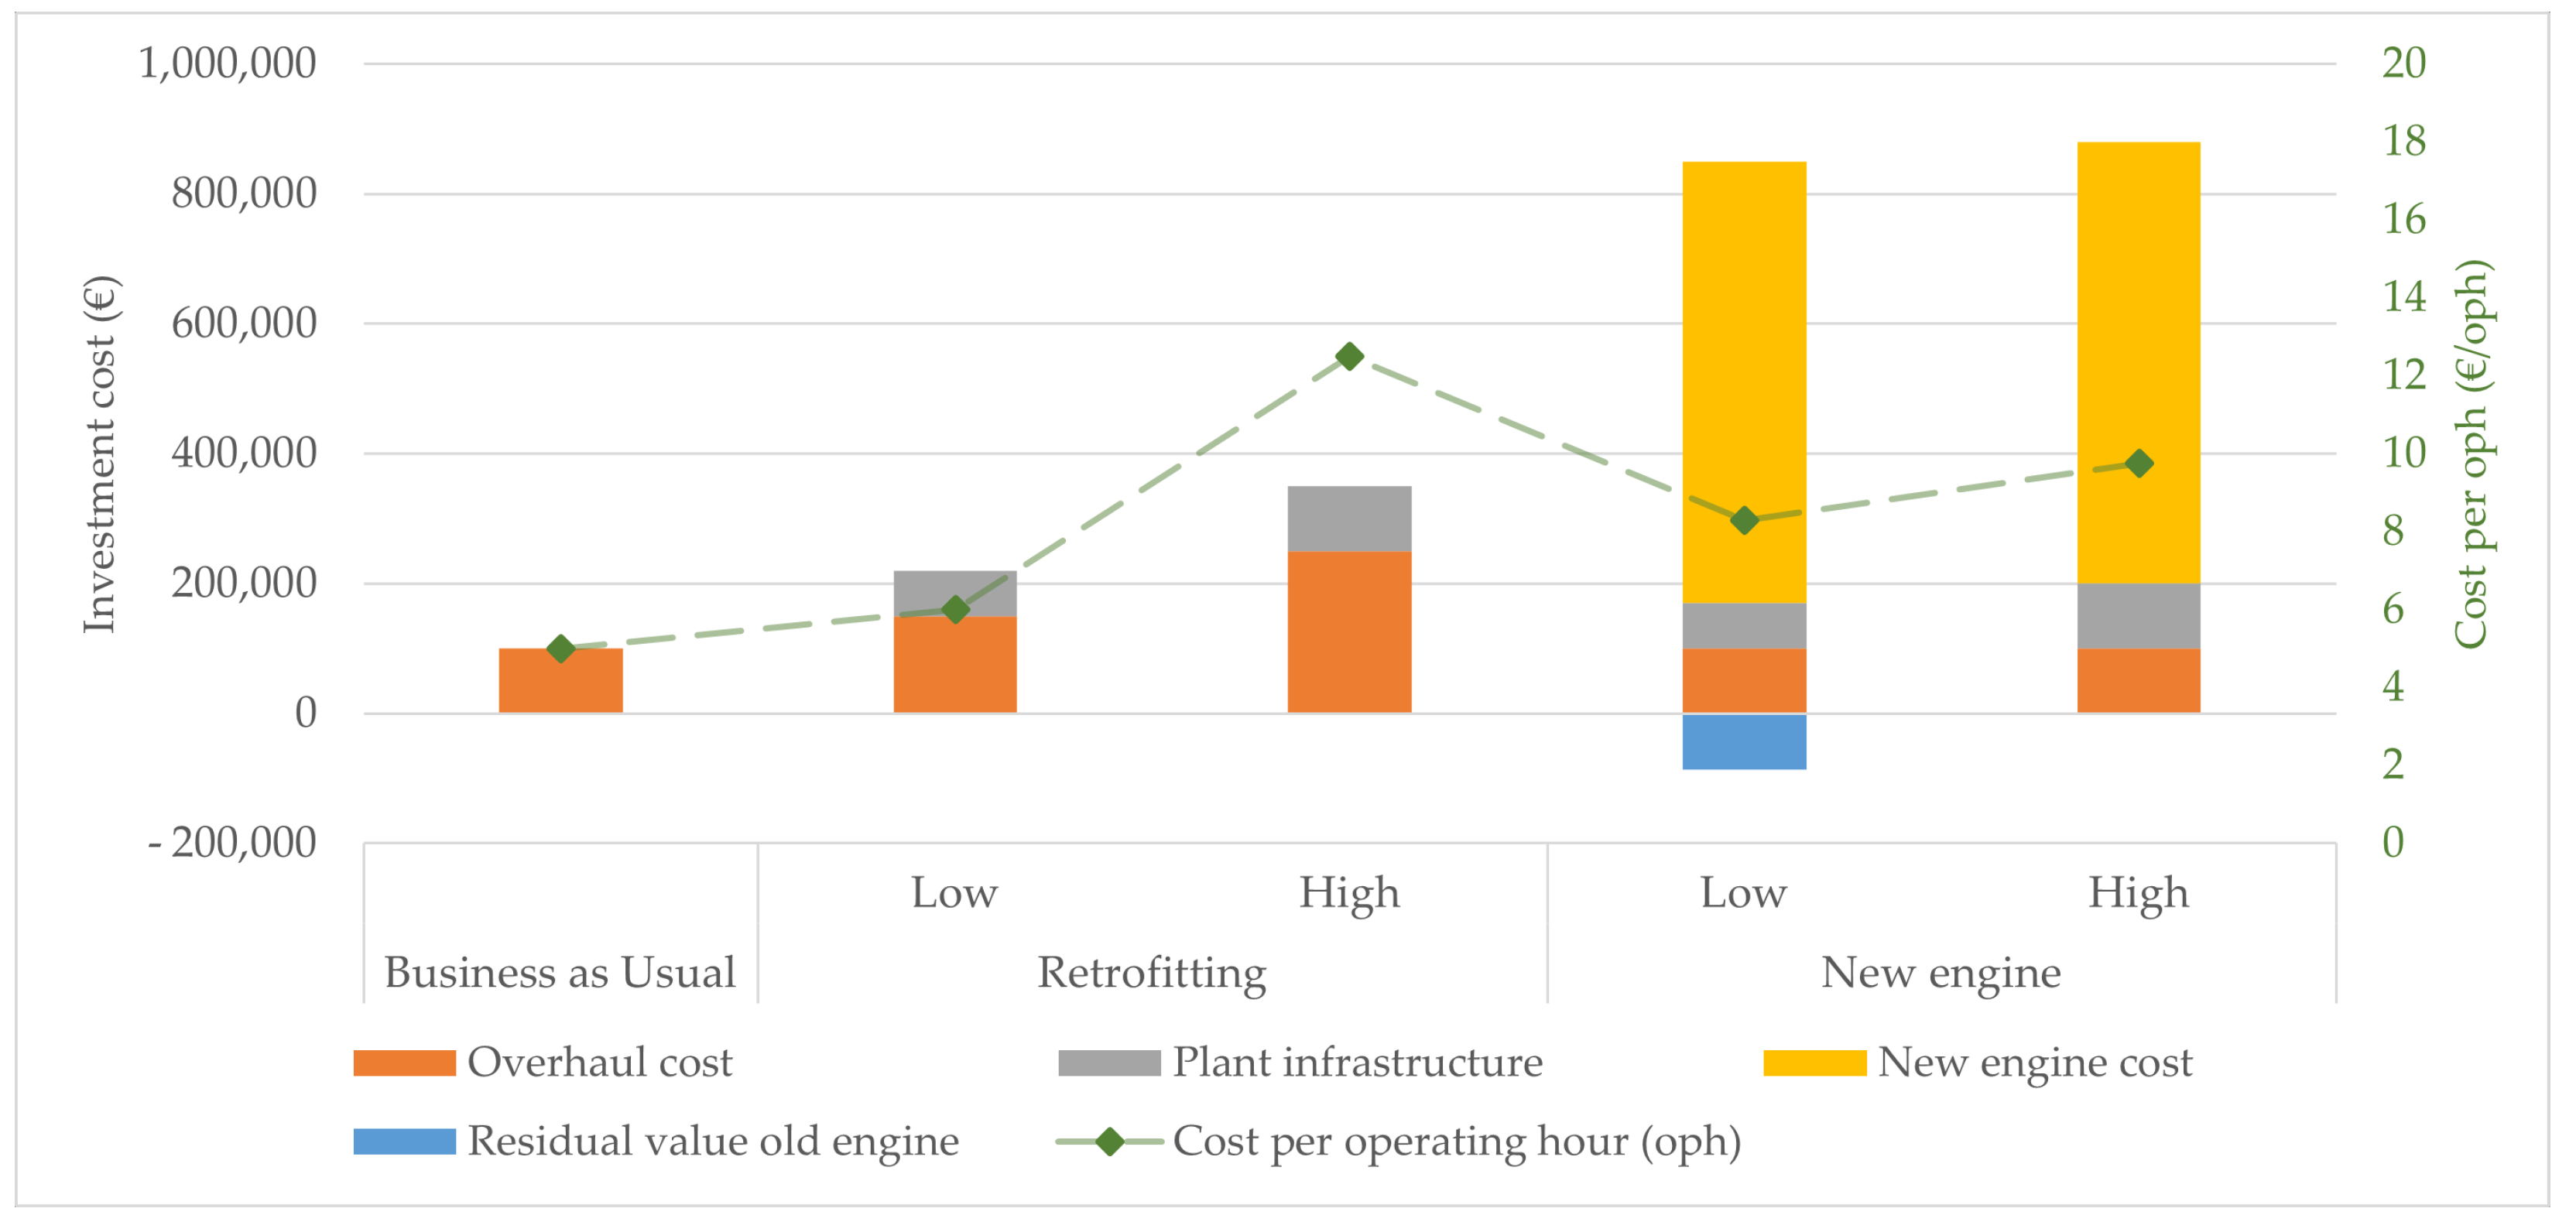
Table 8 and
Figure 7 summarise the results of the three analysed scenarios “Business as Usual”, where the existing engine remains operational until the end of its lifetime; “Retrofitting”, which upgrades the engine and infrastructure to a hydrogen-ready version; and “New Engine”, which involves replacing the existing unit with a hydrogen-compatible model.
The total cost per operating hour (oph) indicates that retrofitting is economically viable only if infrastructure adaptation costs remain low. Furthermore, the operational costs also increase due to the fuel prices, as renewable hydrogen is still two to three times more expensive than natural gas on average, reinforcing the findings from Yu et al. [
9] regarding the need for infrastructure to reach competitiveness. It is to be noted that the total cost per oph for the “Retrofitting” and “New Engine” scenarios are computed considering the fact that the expenses of the overhaul cost of the “Business as Usual” scenario are saved. If the overhaul is still undertaken and a new engine is acquired afterwards, then the effective operating costs are higher.
Nevertheless, considering the availability of hydrogen, as well as the economic aspects, the most economically interesting option at the present time is to keep the current engine and undertake the overhaul to extend its lifetime, i.e., the “Business as Usual” scenario. When the engine reaches its end of life, then the provider might consider investing in a new hydrogen-ready engine, which will be able to work with natural gas and then gradually switch to hydrogen. The decision to retrofit the power plant infrastructure will depend on the availability and prices of hydrogen in Luxembourg.
The results highlight that hydrogen retrofitting is already technically possible and can be applied to similar power plants elsewhere. However, financial support and policy incentives remain critical for widespread adoption. As technological advancements and economic conditions continue to improve, retrofitting existing plants during scheduled maintenance and upgrades could provide a practical pathway for integrating hydrogen into the energy transition.
Although this study focuses on a specific CHP plant in Luxembourg, its findings have broader implications, and can be extended to other similar plants by considering key influencing factors. The feasibility of hydrogen retrofitting depends on the type of fuel currently used, the existing infrastructure, the engine model, and the availability of hydrogen supply networks. These elements determine the technical compatibility and necessary modifications for integrating hydrogen. Additionally, although economic conditions, including energy prices and policy incentives, vary across regions, the methodology developed in this study provides a structured approach to assessing the viability of hydrogen adoption in other CHP plants. By adapting this framework to local conditions, other facilities can evaluate their pathways to decarbonisation, considering both technical constraints and financial feasibility.
5. Conclusions
Decarbonising natural gas-fired cogeneration plants can be achieved through two primary approaches: pre-combustion, by replacing natural gas with a carbon-neutral alternative; or post-combustion, by capturing and storing or utilising emitted CO2. This study focused on the former, evaluating the feasibility of hydrogen retrofitting as a pathway to reduce emissions.
The findings demonstrate that blending up to 60% hydrogen with natural gas is technically feasible using the existing infrastructure, requiring no major additional investment beyond operational adjustments. However, achieving a higher hydrogen share or a full transition necessitates significant modifications to the engine and plant infrastructure, with associated costs ranging between EUR 220,000 and 780,000 in the analysed case. While technological solutions are available, economic viability remains a key challenge due to the high cost of renewable hydrogen compared to natural gas. Without financial support mechanisms, such as subsidies for low-carbon infrastructure and technologies or the internalisation of external costs, large-scale implementation is unlikely in the near term.
The study also highlights the need for policy and regulatory support to address the challenges for hydrogen adoption in CHP plants. The long-term competitiveness of renewable hydrogen depends on decreasing renewable electricity costs, evolving market conditions, and policy frameworks that incentivise its production and use. Current projections suggest that hydrogen prices could become competitive between 2035 and 2045, especially if natural gas prices rise and renewable energy costs continue to decline. However, uncertainty in policy direction and infrastructure development remains a barrier to investment.
The approach presented in this study is not limited to the examined case but can serve as a reference for similar retrofitting assessments in different regions. While variations in infrastructure, hydrogen availability, and economic conditions will influence the outcomes, the methodology can be adapted to evaluate hydrogen readiness in other CHP plants.
The limitations of this study include the reliance on current market conditions, which are subject to fluctuations. The analysis focuses on the technical and economic feasibility of retrofitting a specific CHP plant to be hydrogen-ready, but due to the novelty of hydrogen applications in this context, many assumptions had to be made. These assumptions may change as new technological developments, market trends, and policy measures emerge. Future research should address these uncertainties, expand the analysis to different plant configurations and geographical locations, and explore the integration of hydrogen storage and distribution infrastructure, which will be crucial for large-scale deployment.
Finally, it is important to recognise the external costs of fossil fuels, which remain inadequately accounted for in economic assessments. As emphasised in the IPCC’s Sixth Assessment Report, the consequences of climate change will lead to escalating economic and societal costs. Policymakers play a critical role in accelerating the transition by implementing effective carbon pricing, enforcing polluter-pays principles, and providing targeted support for carbon-neutral alternatives. Only with such measures can hydrogen-ready CHP solutions transition from technical feasibility to widespread adoption, facilitating a cost-effective and sustainable energy transition.
Author Contributions
Conceptualization, C.R., B.D. and S.M.; methodology, C.R. and B.D.; software, C.R.; validation, B.D. and S.M.; formal analysis, C.R. and B.D.; investigation, C.R. and B.D.; resources, C.R. and B.D.; data curation, C.R., B.D. and J.S.; writing—original draft preparation, C.R.; writing—review and editing, C.R., B.D. and S.M.; visualization, C.R.; supervision, B.D. and S.M.; project administration, B.D.; funding acquisition, S.M. All authors have read and agreed to the published version of the manuscript.
Funding
This research received no external funding.
Data Availability Statement
The original contributions presented in this study are included in the article. Further inquiries can be directed to the corresponding author.
Conflicts of Interest
Author John Sliepen was employed by the company LuxEnergie S.A. The remaining authors declare that the research was conducted in the absence of any commercial or financial relationships that could be construed as a potential conflict of interest.
Abbreviations
The following abbreviations are used in this manuscript:
| AFR | Air–fuel ratio |
| CCUS | Carbon capture, utilisation, and storage |
| CHP | Combined heat and power |
| CO2 | Carbon dioxide |
| DI | Direct injection |
| EHB | European Hydrogen Backbone |
| EGR | Exhaust gas recirculation |
| H2 | Hydrogen |
| HHV | Higher heating value |
| IC | Internal combustion |
| ICE | Internal combustion engine |
| IEA | International Energy Agency |
| IPCC | Intergovernmental Panel on Climate Change |
| IRENA | International Renewable Energy Agency |
| LHV | Lower heating value |
| NOX | Nitrogen oxides |
| NTP | Normal temperature and pressure |
| oph | Operating hour |
| PFI | Port fuel injection |
| SI | Spark ignition |
| SMR | Steam methane reforming |
| wt% | Weight percentage |
References
- IEA. Global Energy Review: CO2 Emissions in 2021; Technical Report; IEA: Paris, France, 2022; Available online: https://www.iea.org/reports/global-energy-review-co2-emissions-in-2021-2 (accessed on 27 February 2025).
- Darrow, K.; Tidball, R.; Wang, J.; Hampson, A. Catalog of CHP Technologies. Technical Report, U.S. Environmental Protection Agency Combined Heat and Power Partnership, U.S. Department of Energy. 2017. Available online: https://www.epa.gov/sites/default/files/2015-07/documents/catalog_of_chp_technologies.pdf (accessed on 27 February 2025).
- Kirshbaum, L.A.; Sherman, W.; Dougherty, C.; Santos, N. Combined Heat and Power and a Changing Climate: Reducing Emissions and Improving Resilience. Technical Report, Combined Heat and Power Alliance. 2021. Available online: https://chpalliance.org/resources/chp-and-a-changing-climate-reducing-emissions-and-improving-resilience/ (accessed on 27 February 2025).
- Flach, B.; Bolla, S. EU Wood Pellet Annual. Technical Report, United States Department of Agriculture Foreign Agricultural Service, The Hague. 2022. Available online: https://apps.fas.usda.gov/newgainapi/api/Report/DownloadReportByFileName?fileName=EU%20Wood%20Pellet%20Annual_The%20Hague_European%20Union_E42022-0049.pdf (accessed on 27 February 2025).
- IEA. Global Gas Security Review 2024; Technical Report; IEA: Paris, France, 2024; Available online: https://www.iea.org/reports/global-gas-security-review-2024 (accessed on 27 February 2025).
- Losch, P.; Reding, G. Stratégie Hydrogène du Luxembourg. Technical Report, Ministère de L’énergie et de L’aménagement du Territoire, Le Gouvernement du Grand-Duché de Luxembourg. 2021. Available online: https://gouvernement.lu/dam-assets/documents/actualites/2021/09-septembre/27-turmes-hydrogene/Strategie-hydrogene-LU-fr.pdf (accessed on 27 February 2025).
- MosaHYc Creos/Encevo/GRTgaz. 2021. Available online: https://grande-region-hydrogen.eu/en/projects/mosahyc/ (accessed on 25 September 2023).
- Gas for Climate. European Hydrogen Backbone. 2021. Available online: https://gasforclimate2050.eu/ehb/ (accessed on 25 September 2023).
- Yu, S.; Fan, Y.; Shi, Z.; Li, J.; Zhao, X.; Zhang, T.; Chang, Z. Hydrogen-based combined heat and power systems: A review of technologies and challenges. Int. J. Hydrogen Energy 2023, 48, 34906–34929. [Google Scholar] [CrossRef]
- Renau, J.; García, V.; Domenech, L.; Verdejo, P.; Real, A.; Giménez, A.; Sánchez, F.; Lozano, A.; Barreras, F. Novel Use of Green Hydrogen Fuel Cell-Based Combined Heat and Power Systems to Reduce Primary Energy Intake and Greenhouse Emissions in the Building Sector. Sustainability 2021, 13, 1776. [Google Scholar] [CrossRef]
- Roy, D.; Samanta, S.; Roy, S.; Smallbone, A.; Roskilly, A.P. Technoeconomic and environmental performance assessment of solid oxide fuel cell-based cogeneration system configurations. Energy 2024, 310, 133145. [Google Scholar] [CrossRef]
- White, C.; Steeper, R.; Lutz, A. The hydrogen-fueled internal combustion engine: A technical review. Int. J. Hydrogen Energy 2006, 31, 1292–1305. [Google Scholar] [CrossRef]
- Ciniviz, M.; Köse, H. Hydrogen Use in Internal Combustion Engine: A Review. Int. J. Automot. Eng. Technol. 2012, 1, 1–15. Available online: https://dergipark.org.tr/en/download/article-file/89368 (accessed on 27 February 2025).
- Verhelst, S.; Sierens, R. Hydrogen engine-specific properties. Int. J. Hydrogen Energy 2001, 26, 987–990. [Google Scholar] [CrossRef]
- Mohammadi, A.; Shioji, M.; Nakai, Y.; Ishikura, W.; Tabo, E. Performance and combustion characteristics of a direct injection SI hydrogen engine. Int. J. Hydrogen Energy 2007, 32, 296–304. [Google Scholar] [CrossRef]
- Onorati, A.; Payri, R.; Vaglieco, B.; Agarwal, A.; Bae, C.; Bruneaux, G.; Canakci, M.; Gavaises, M.; Günthner, M.; Hasse, C.; et al. The role of hydrogen for future internal combustion engines. Int. J. Engine Res. 2022, 23, 529–540. [Google Scholar] [CrossRef]
- IEA. Global Hydrogen Review 2024; Technical Report; IEA: Paris, France, 2024; Available online: https://www.iea.org/reports/global-hydrogen-review-2024 (accessed on 27 February 2025).
- IEA. The Future of Hydrogen; Technical Report; IEA: Paris, France, 2019; Available online: https://www.iea.org/reports/the-future-of-hydrogen (accessed on 27 February 2025).
- Parkinson, B.; Balcombe, P.; Speirs, J.F.; Hawkes, A.D.; Hellgardt, K. Levelized cost of CO2 mitigation from hydrogen production routes. Energy Environ. Sci. 2019, 12, 19–40. [Google Scholar] [CrossRef]
- IEA. Global Hydrogen Demand by Production Technology in the Net Zero Scenario, 2020–2030. 2022. Available online: https://www.iea.org/data-and-statistics/charts/global-hydrogen-demand-by-production-technology-in-the-net-zero-scenario-2020-2030 (accessed on 25 September 2023).
- Greenhouse Gas Emission Intensity of Electricity Generation in Europe. 2021. Available online: https://www.eea.europa.eu/ims/greenhouse-gas-emission-intensity-of-1 (accessed on 25 September 2023).
- Van Nuffel, L.; Gorenstein Dedecca, J.; Smit, T.; Rademaekers, K. Sector Coupling: How Can It Be Enhanced in the EU to Foster Grid Stability and Decarbonise? Technical Report; European Parliament: Strasbourg, France, 2018; Available online: https://www.europarl.europa.eu/RegData/etudes/STUD/2018/626091/IPOL_STU(2018)626091_EN.pdf (accessed on 27 February 2025).
- Eurostat. Gas Prices for Non-Household Consumers—Bi-Annual Data (from 2007 Onwards). 2022. Available online: https://ec.europa.eu/eurostat/databrowser/view/NRG_PC_203__custom_4166048/default/table?lang=en (accessed on 25 September 2023).
- Bruckner, T.; Bashmakov, I.A.; Mulugetta, Y.; Chum, H. Energy Systems. In Climate Change 2014: Mitigation of Climate Change. Contribution of Working Group III to the Fifth Assessment Report of the Intergovernmental Panel on Climate Change; Technical Report; IPCC: Geneva, Switzerland, 2014; Available online: https://www.ipcc.ch/site/assets/uploads/2018/02/ipcc_wg3_ar5_chapter7.pdf (accessed on 27 February 2025).
- Hydrogen Density at Different Temperatures and Pressures. Available online: https://h2tools.org/hyarc/hydrogen-data/hydrogen-density-different-temperatures-and-pressures (accessed on 25 September 2023).
- Alrazen, H.A.L.; Ahmad, K.A. HCNG fueled spark-ignition (SI) engine with its effects on performance and emissions. Renew. Sustain. Energy Rev. 2018, 82, 324–342. [Google Scholar] [CrossRef]
- Abdin, Z.; Zafaranloo, A.; Rafiee, A.; Mérida, W.; Lipiński, W.; Khalilpour, K.R. Hydrogen as an energy vector. Renew. Sustain. Energy Rev. 2020, 120, 109620. [Google Scholar] [CrossRef]
- McAllister, S.; Chen, J.Y.; Fernandez-Pello, A.C. Fundamentals of Combustion Processes; Springer: Berlin/Heidelberg, Germany, 2011; pp. 127+244. [Google Scholar] [CrossRef]
- Stępień, Z. A Comprehensive Overview of Hydrogen-Fueled Internal Combustion Engines: Achievements and Future Challenges. Energies 2021, 14, 6504. [Google Scholar] [CrossRef]
- Mazloomi, K.; Gomes, C. Hydrogen as an energy carrier: Prospects and challenges. Renew. Sustain. Energy Rev. 2012, 16, 3024–3033. [Google Scholar] [CrossRef]
- Grand, D.; Le Brun, C.; Vidil, R. Intermittence des Énergies Renouvelables et Mix Électrique. Techniques de L’Ingénieur Ressources Énergétiques et Stockage; Base Documentaire: TIP202WEB. 2015. Available online: https://www.techniques-ingenieur.fr/base-documentaire/energies-th4/conversion-et-transport-d-energie-42206210/intermittence-des-energies-renouvelables-et-mix-electrique-in301/ (accessed on 27 February 2025).
- Bang, S.; Park, S. Effect of Depreciation Method for Long-Term Tangible Assets on Sustainable Management: From a Nuclear Power Generation Cost Perspective under the Nuclear Phase-Out Policy. Sustainability 2021, 13, 5270. [Google Scholar] [CrossRef]
- Masson-Delmotte, V.; Zhai, P.; Pirani, A.; Connors, S.; Péan, C.; Chen, Y.; Goldfarb, L.; Gomis, M. Climate Change 2021: The Physical Science Basis. Contribution of Working Group I to the Sixth Assessment Report of the Intergovernmental Panel on Climate Change, Summary for Policymakers; Technical Report; IPCC: Geneva, Switzerland, 2021; Available online: https://www.ipcc.ch/report/ar6/wg1/#SPM (accessed on 27 February 2025).
- Markandya, A.; Saygin, D.; Miketa, A.; Gielen, D.; Wagner, N. The True Cost of Fossil Fuels: Saving on the Externalities of Air Pollution and Climate Change; Technical Report; IRENA: Masdar City, United Arab Emirates, 2016; Available online: https://www.irena.org/-/media/files/irena/agency/publication/2016/irena_remap_externality_brief_2016.pdf (accessed on 27 February 2025).
- Taibi, E.; Blanco, H.; Miranda, R.; Carmo, M. Green Hydrogen Cost Reduction: Scaling Up Electrolysers to Meet the 1.5 °C Climate Goal; Technical Report; IRENA: Masdar City, United Arab Emirates, 2020; Available online: https://www.irena.org/publications/2020/Dec/Green-hydrogen-cost-reduction (accessed on 27 February 2025).
- Schnuelle, C.; Wassermann, T.; Stuehrmann, T. Mind the Gap: A Socio-Economic Analysis on Price Developments of Green Hydrogen, Synthetic Fuels, and Conventional Energy Carriers in Germany. Energies 2022, 15, 3541. [Google Scholar] [CrossRef]
- Mulder, S. Ready for the Energy Transition: Hydrogen Considerations for Combined Cycle Power Plants. 2021. Available online: https://www.powermag.com/ready-for-the-energy-transition-hydrogen-considerations-for-combined-cycle-power-plants/ (accessed on 25 September 2023).
- Inspection du Travail et des Mines. ITM-CL 355.3: Appareils Sous Pression Fixes Dans Lesquels Est Emmagasiné de L’Hydrogène Gazeux. 2005. Available online: https://itm.public.lu/dam-assets/fr/securite-sante/conditions-types/itm-cl-301-400/ITM-CL-355-3.pdf (accessed on 27 February 2025).
- Khoshnaw, F.; Gubner, R. Part II: Corrosion Topics. In Corrosion Atlas Case Studies; Corrosion Atlas Series; Amsterdam, The Netherlands, 2022; pp. xliii–lxviii. [CrossRef]
- Barbery, J. Traitements Thermiques du Cuivre et de ses Alliages. Techniques de L’Ingénieur Traitements Thermiques Des Aciers, Des Alliages et Des Fontes; Base Documentaire: TIB364DUO. 1991. Available online: https://www.techniques-ingenieur.fr/base-documentaire/materiaux-th11/traitements-thermiques-des-aciers-des-alliages-et-des-fontes-42364210/traitements-thermiques-du-cuivre-et-de-ses-alliages-m1295/ (accessed on 27 February 2025).
- Gao, J.; Wang, X.; Song, P.; Tian, G.; Ma, C. Review of the backfire occurrences and control strategies for port hydrogen injection internal combustion engines. Fuel 2022, 307, 121553. [Google Scholar] [CrossRef]
- College of the Desert. Hydrogen Fuel Cell Engines and Related Technologies, Module 3: Hydrogen Use in Internal Combustion Engines; Technical Report; Office of Energy Efficiency and Renewable Energy, U.S. Department of Energy. 2001. Available online: https://www1.eere.energy.gov/hydrogenandfuelcells/tech_validation/pdfs/fcm03r0.pdf (accessed on 27 February 2025).
- Glanville, P.; Fridlyand, A.; Sutherland, B.; Liszka, M.; Zhao, Y.; Bingham, L.; Jorgensen, K. Impact of Hydrogen/Natural Gas Blends on Partially Premixed Combustion Equipment: NOx Emission and Operational Performance. Energies 2022, 15, 1706. [Google Scholar] [CrossRef]
- Verhelst, S.; Demuynck, J.; Sierens, R.; Scarcelli, R.; Matthias, N.S.; Wallner, T. Chapter 16—Update on the Progress of Hydrogen-Fueled Internal Combustion Engines. In Renewable Hydrogen Technologies; Gandía, L.M., Arzamendi, G., Diéguez, P.M., Eds.; Elsevier: Amsterdam, The Netherlands, 2013; pp. 381–400. [Google Scholar] [CrossRef]
- Verhelst, S.; Maesschalck, P.; Rombaut, N.; Sierens, R. Increasing the power output of hydrogen internal combustion engines by means of supercharging and exhaust gas recirculation. Int. J. Hydrogen Energy 2009, 34, 4406–4412. [Google Scholar] [CrossRef]
- Bhasker, J.P.; Porpatham, E. Effects of compression ratio and hydrogen addition on lean combustion characteristics and emission formation in a Compressed Natural Gas fuelled spark ignition engine. Fuel 2017, 208, 260–270. [Google Scholar] [CrossRef]
- INNIO Jenbacher. Lifetime Extension for Jenbacher Type 2, 3 and 4 Gas Engines. 2019. Available online: https://www.innio.com/images/medias/files/567/innio_fs_lifetimeextension_2_3_4_a4_en_screen2_ijb-218013-en.pdf (accessed on 25 September 2023).
- First H2 Engine in Industrial Scale. 2022. Available online: https://www.innio.com/fr/solutions/production-d-energie/production-d-electricite-a-partir-d-hydrogene/premier-moteur-a-l-hydrogene-a-l-echelle-industrielle (accessed on 25 September 2023).
- Cook, M. Petroleum Economics and Risk Analysis; Elsevier Science: Amsterdam, The Netherlands, 2020; pp. 15–16. [Google Scholar]
- Adam, P.; Heunemann, F.; Thiemann, T.; Engelshove, S. Hydrogen Infrastructure—The Pillar of Energy Transition; Technical Report; SIEMENS Energy: Erlangen, Germany, 2021; Available online: https://assets.siemens-energy.com/siemens/assets/api/uuid:3d4339dc-434e-4692-81a0-a55adbcaa92e/200915-whitepaper-h2-infrastructure-en.pdf (accessed on 27 February 2025).
- Short-Term Indicators: Output Price Index in Construction—A2. 2022. Available online: https://statistiques.public.lu/fr/themes/economie-finances/indicateurs-court-terme.html (accessed on 25 September 2023).
- Hydrogen Price Index Hydex. Available online: www.e-bridge.de (accessed on 27 February 2025).
- EU Natural Gas. Available online: https://tradingeconomics.com/commodity/eu-natural-gas (accessed on 25 September 2023).
- Wasserstofftechnologie—Seminare zum Richtigen Umgang mit Wasserstoff. 2022. Available online: https://www.tuvsud.com/de-de/store/akademie/seminare-technik/wasserstofftechnologie (accessed on 25 September 2023).
| Disclaimer/Publisher’s Note: The statements, opinions and data contained in all publications are solely those of the individual author(s) and contributor(s) and not of MDPI and/or the editor(s). MDPI and/or the editor(s) disclaim responsibility for any injury to people or property resulting from any ideas, methods, instructions or products referred to in the content. |
© 2025 by the authors. Licensee MDPI, Basel, Switzerland. This article is an open access article distributed under the terms and conditions of the Creative Commons Attribution (CC BY) license (https://creativecommons.org/licenses/by/4.0/).


