Abstract
New urbanization (NU) and low-carbon energy transition (LCET) are important issues of Chinese-style modernization, with the necessity and possibility of coordinated development. By using panel data for 30 provinces from 2013 to 2022, this paper adopted the entropy method, principal component analysis, and coupled coordination model to evaluate the coupled coordination degree (CCD) of NU and LCET, and applied the Dagum Gini coefficient, kernel density estimation, and spatial Durbin model to reveal the regional differences and spatial effects of coupled coordination. Research found that the comprehensive levels of NU and LCET exhibit growing trends, with regional variations. The overall coupling coordination index steadily increased, accompanied by polarization. The intra-regional disparities are biggest in the west and smallest in the central region, while the inter-regional differences (except the central and northeast) show narrowing trends. The coupling coordination level shows a positive spillover effect. As for influencing factors, the levels of economic development, social consumption, energy consumption, and R&D intensity have an inhibitory effect on neighboring regions, while digital economy and environmental regulation intensity have a positive spatial spillover effect on neighboring provinces. Finally, countermeasures are proposed to promote the coordinated development of the two systems.
1. Introduction
Urbanization is a fundamental driver of economic and social advancement [1], and as a result, cities around the world have grown rapidly, but have unintentionally been putting pressure on social and environmental sustainability at the same time [2]. China’s urbanization is policy-driven, with extremely fast speed and enormous scale. As a result, in 2012, the urbanization rate nearly tripled by 34.67% and reached 52.57%. However, this rapid urban expansion was accompanied by industry hollowing, serious air pollution, the prominent dual structure, and a widening gap between urban and rural areas, posing challenges to environmental, economic, and social sustainability [3]. Therefore, in view of long-term development, in 2012, the Chinese government proposed to take a new urbanization path. So far, the new urbanization has gone through three stages: initial exploration, rapid development, and quality improvement. Distinguished from traditional urbanization characterized by attaching more importance to scale over quality [4], the people-oriented China new urbanization adheres to pursuing equality, happiness, sustainability, and efficiency, which emphasizes coordinated development among regions and pays more attention to the simultaneous and harmonious growth of society and the environment while promoting high-quality economic development [5]. The projections of the United Nations’ 2030 Agenda for Sustainable Development indicate that by 2030, around 60% of the global population will be residing in cities [6], and urbanization is advancing irresistibly. However, at present, there is no doubt that compared with other developed countries, China’s new urbanization still has a long way to go [7]. Specifically, the massive movement of capital and labor among different regions and city construction inevitably leads to huge energy consumption and CO2 emissions [8], which is bad for carbon neutrality. Therefore, it is necessary to emphasize energy transition while implementing the new urbanization strategy.
Climate change has affected countries all over the world, and energy is a significant contributor to carbon dioxide (CO2) emissions. To achieve environmental sustainability, all nations have taken actions like replacing high-carbon fossil fuels with low-carbon clean energy like solar, wind, hydro, bioenergy, and geothermal, especially in northern Europe, South America, Iceland, and Norway [9]. Similarly, China has announced that it will realize “peak carbon dioxide emissions” in 2030 and “carbon neutrality” in 2060, which is a very time-intensive task. Therefore, promoting low-carbon energy transition is imperative to realize this goal; that is, to achieve sustainable low-carbon economic growth and ecological development with energy consumption control and restructuring, a downward carbon emission growth rate, etc. [10]. More importantly, energy transition is expected to positively affect socio-economic development [11], such as the transition of the production organization mode and technological breakthroughs [12], job creation and employment [13], greater energy self-sufficiency, and reduced energy poverty [11], together with the ecological effects of mitigating climate change [14]. Consequently, promoting efficient and low-carbon energy-related activities emerges as a critical pathway for China’s sustainability [15] and may be beneficial for China’s new urbanization.
Therefore, in this paper: Firstly, a comprehensive evaluation system is developed and applied to evaluate the progress of two interconnected subsystems, NU and LCET, and the mechanism of how the two systems are coupled and coordinated is sufficiently elucidated. Secondly, it employs an enhanced formula for coupling coordination calculation to determine the level of coordination between these subsystems. Thirdly, it conducts a detailed analysis of the spatio-temporal heterogeneity of coupling coordination, identifying intra-regional and inter-regional disparities. Lastly, employing a spatial Durbin model, the paper conducts an in-depth quantitative analysis of the factors influencing the interconnected progress of NU and LCET. Targeted policy recommendations and implementation strategies are developed through the analysis, thus providing valuable insights for practical application.
The paper’s structure is as follows: Part two comprises a literature review concerning new urbanization and low-carbon energy transition. Part three states the mechanism of coupling coordination. Part four focuses on constructing indicator systems and models utilized within this study. Part five presents empirical investigations, comprising analysis and explanation of the comprehensive development level of both subsystems, the evolution trends of the coupling coordination degree (CCD) across various regions, and the spatial driving factors of the coordinated development. Part six summarizes the empirical findings and presents policy suggestions.
2. Literature Review
2.1. Research on New Urbanization
Academic discourse on urbanization predominantly revolves around two principal facets. One pertains to the exploration of urbanization optimization [16,17]. Within this domain, scholars investigate various aspects of urbanization’s developmental models, encompassing its typologies, trajectories, and adaptability, aiming to offer informed guidance for urbanization’s progression, blending theoretical frameworks with empirical insights. Additionally, scholars scrutinize pivotal determinants [18], such as policy directives, resource allocations, and demographic movements, within the urbanization continuum, aiming to elucidate their catalyzing or constraining influences on urbanization. On the other hand, the interdisciplinary examination of urbanization presents a significant dimension within scholarly discourse. This mode of inquiry transcends disciplinary confines, integrating urbanization with various fields such as ecological dynamics [19,20], land utilization [21], and industrial progress [22,23].
2.2. Research on Low-Carbon Energy Transition
Energy constitutes a foundational pillar for both economic prosperity and societal progress, a reality widely acknowledged within academic discourse. The connotation of the low-carbon energy transition has been gradually enriched by containing more elements like energy equity and justice [24], energy safety and governance [11], public engagement [25], etc., which is in line with the characteristics of China’s Modern Energy System of “clean, low-carbon, safe, and efficient”. The transition towards low-carbon energy represents a multifaceted endeavor aimed at harmonizing three primary objectives: ensuring safety and reliability, enhancing economic viability, and fostering environmental sustainability [26]. Some scholars argue that the transition not only signifies a paradigm shift in the traditional energy framework but also embodies a novel approach to energy development, especially promoting green energy production, and consumption, and improving energy eco-efficiency [27]. Moreover, the low-carbon energy transition plays a pivotal role in addressing critical issues related to energy security [28], poverty [29], and inequality [30]. Furthermore, research on energy transition at the micro level is also a hot topic, such as battery storage in the electricity industry [31], and energy resource management in the transport sector [32], as well as applications of different energy storage technologies [33]. Therefore, further investigations are essential to develop a comprehensive and scientifically grounded theoretical framework for low-carbon energy transition, which can provide robust guidance for practical implementation.
2.3. Research on the Relationship Between New Urbanization and Low-Carbon Energy Transition
Contemporary research on the interconnection between NU and LCET navigates through intricate interactions. On the one hand, about NU’s effect on LCET. Firstly, from the macro perspective, scholars embark on investigating urbanization’s correlation with energy consumption or energy efficiency, yielding a spectrum of perspectives. Despite certain inquiries emphasizing urbanization’s negative effects on energy consumption and efficiency, remedial measures within the ecological framework are also proposed [34]. Additional research suggests that the new urbanization can contribute to improving efficient energy and resource utilization at the provincial level [4] and city level [5]. As a result, some researchers propose that there is a nonlinear relationship between them [35]. Secondly, from the mesoscopic perspective, high population and growth rates are the main contributors to increasing transport energy consumption [32]. However, when the urban population passes a specific turning point, transport sector-based carbon dioxide emissions decrease [36]. In the construction industry, the rapid expansion of urbanization leads to an increase in building energy consumption intensity, but the increase is not an inevitable result of urbanization in Eastern developed regions [37]. Similarly, urbanization can positively impact energy consumption for central heating, particularly in underdeveloped regions [38]. Lastly, from the micro perspective, residential energy usage in urbanization is widely studied. Some scholars believe that urbanization increases residential energy consumption in total, but it shifts energy consumption away from coal and toward electricity and gas [39]. Some scholars have pointed out that urbanization in developing countries leads to a decrease in aggregate residential energy consumption in the accelerating stage, while in developed regions, the situation is the opposite [40]. Other scholars propose that there is a U-shape relationship between residential direct energy consumption and urbanization rate [41].
For another, the literature about LCET’s effect on NU is relatively scarce. There is indeed a two-way causal relationship between urbanization and energy consumption [42]. The nexus of energy consumption and urbanization is indeed nonlinear, and the promotion of energy consumption structure would strengthen the positive effect [43]. As a part of the energy transition, renewable energy consumption can promote urbanization through technical effects, scale effects, and structure effects [44]. Moreover, renewable energy technology innovation can positively affect urbanization by improving the industrial structure, productivity effectiveness, and rural income [45]. In all, there is no consensus on the relationship between NU and LCET. Additionally, various relevant factors such as economic development [42], foreign direct investment [46], and levels of governmental intervention [10] are concluded when investigating the connection between urbanization and the transition to low-carbon energy sources.
In summary, scholars have increasingly investigated the intersections of new urbanization and the promotion of low-carbon energy. Nevertheless, existing research presents several limitations: firstly, the goal requirements of LCET under the construction of an NU system receive relatively little attention. There remains a dearth of research exploring the reciprocal influence of energy consumption on urbanization dynamics and their nuanced interactions. Secondly, the construction of a traditional energy transition system always focuses on specific metrics such as energy structure, efficiency, or poverty, while the connotation of energy transition needs to be expanded in the Chinese new urbanization context, with consideration of energy accessibility, equality, safety, etc. Additionally, the construction of the NU system also needs to contain urban–rural integration, which is consistent with the requirement of the National New-Type Urbanization Plan (2021–2025). Thirdly, China’s regional urbanization and energy endowments are quite different, but the regional disparities are not well presented. Therefore, by adopting a framework of regional interconnectedness and synchronization, this study concentrates on 30 Chinese regions. Spanning the years 2013 to 2022, it aims to conduct a comprehensive examination of the parameters influencing NU and LCET. The objective is to elucidate the characteristics, mechanisms, and spatial influential factors driving the synchronized advancement of these domains and subsequently propose viable pathways for their coordinated progress.
3. The Coupling Coordination Mechanism Between NU and LCET
3.1. The Influence of NU on LCET
Firstly, in terms of industrial and economic urbanization, the traditional production mode of urbanization is extensive, and it relies heavily on traditional energy sources such as coal and oil, with low energy utilization efficiency and significant environmental externalities [4]. While population and industries are concentrated in cities, the new urbanization will further optimize the spatial layout and promote the energy demand from the decentralized and inefficient rural energy consumption model to the centralized and efficient urban energy consumption model [42]. The in-depth implementation of the new urbanization strategy will lead to the transformation of the industrial structure from labor-intensive and resource-dependent to technology-driven and service-oriented, drive the green transformation of energy-consuming industries [47] and the vigorous development of the tertiary industry, continue to upgrade the industrial structure, and promote technological innovation and energy efficiency [5,48]. Additionally, policy-oriented industrial upgrading and business model innovation have also opened up a broad market for new energy and clean energy industries, forming strong support for a low-carbon economy [49].
Second, in the process of social and population urbanization, according to the energy ladder theory [50], with improvement in economic development and the urbanization level, the energy consumption structure will shift from inefficient and highly polluting traditional energy (such as coal and biomass energy) to efficient and clean modern energy (such as natural gas, electric energy, and renewable energy). New urbanization accelerates this process by boosting economic growth and improving living standards [51]. At the same time, excellent educational resources in cities and towns are conducive to improving human capital, popularizing the concept of green consumption, and providing a good market environment for the research, development, and application of creative energy technologies [48]. In addition, the new urbanization will further promote the construction of energy infrastructure such as charging piles, smart grids, and public transportation networks, and the absorption capacity of renewable energy will be further improved. With the promotion of green building standards in the construction and maintenance of urban housing and public facilities, unnecessary energy waste in the construction process will also be greatly reduced [52].
Thirdly, regarding rural revitalization and urban–rural integration, urban–rural integration provides strong support for the coordinated low-carbon energy transition between urban and rural areas by promoting optimal allocation of resources, scientific and technological innovation, low-carbon lifestyle dissemination, and policy coordination [53]. According to the urban–rural dual theory, the urban–rural dual structure leads to a significant gap in energy consumption, and new-type urbanization narrows this gap by promoting urban–rural integrated development [54]. By integrating urban and rural energy infrastructure, urban–rural integration accelerates the rational flow and efficient allocation of energy resources between regions, strengthens the exchange and application of scientific and technological innovation achievements in urban and rural areas [48], promotes the spread of low-carbon urban lifestyle to villages [55], and promotes a more equal energy transition. Moreover, on the back of urban–rural integration, the government can more effectively formulate and implement a unified low-carbon development strategy.
3.2. The Influence of LCET on NU
The core of new urbanization is industrial transformation and upgrading and optimization of layout [5], and low-carbon energy transformation can drive technological innovation [56] and industrial upgrading [47].
First of all, from the perspective of economic development, this energy transformation has spawned the development of a green economy such as energy conservation, environmental protection, and new energy [57]. The introduction of venture capital and advanced technology helps to achieve energy technology research and development and innovation [56]. The construction of large-scale wind power photovoltaic bases and the commissioning of renewable energy bases such as new energy power generation projects, provide new economic growth points for urbanization [58].
Second, in terms of the industrial structure, energy transformation has promoted the vigorous development of green trading platforms, phased out backward production capacity, and promoted the green transformation and upgrading of traditional energy-intensive industries [56]. The emerging energy industry will attract capital, technology, and other production factors, and the relatively complete industrial chain provides a resource base for the cultivation of high-tech industries, promotes the adjustment and change of the industrial structure, and finally promotes the high-level development of economic urbanization [59].
Third, low-carbon energy transition can meet the modern service needs of urban and rural residents. The energy transformation will further improve the construction of clean energy infrastructure [52] and carry out the “green transformation” of urbanization. The increasing popularity of clean energy vehicles and photovoltaic street lights has promoted the green transformation of urban consumption patterns. In addition, through the integration of digital technology and the energy industry, the energy system has gradually developed into an intelligent, low-carbon, and efficient direction [56]. The construction of clean energy facilities such as smart grids, charging stations, distributed energy systems, and rural grids can also promote the equalization of energy services, improve the accessibility and affordability of clean energy, and alleviate inequalities in access to energy resources.
Finally, new energy forms and business model innovation can promote urban and rural prosperity. Rural areas have huge space resources and renewable energy resources, which are important for realizing the zero-carbon energy system of the future. At the same time, the energy industry has become a strategic emerging industry for local development [57], which will drive the development of electric vehicle manufacturing, wind power, photovoltaic, new materials, and other related supply chains, and make outstanding contributions to the integration of urban and rural elements, industrial integration, investment, and employment [47]. In addition, booming digital energy technologies have transformed the traditional role of farmers as single consumers, enabling new business models that integrate production and consumption [60]. The “photovoltaic +” model has promoted the development of the village collective economy, driving farmers to increase income and get rich together [61].
4. Data and Methods
4.1. Construction of Indication Systems
NU is a process inseparable from population, economy, and social service, and now pays more attention to the coordinated development of cities and ecology [4,7,18]. Moreover, industrial transformation is also an essential support for NU [60]. When facilitating the Chinese path to modernization, the National New-Type Urbanization Plan (2021–2025) announced that NU is closely related to urban and rural integration [62]. Thus, this paper constructed the NU subsystem from aspects of the urbanization of the population, economy, society, ecology, and industry, and urban–rural integration, containing seventeen indicators. Apart from the requirements of the 14th Five-Year Plan for Modern Energy Systems of “clean, low-carbon, safe, and efficient”, it is found that energy equity and justice [24] and energy accessibility [63] are attracting researchers’ attention. Therefore, referring to the relevant literature [11,64], the LCET index system is constructed, including five aspects of “environmentally friendly, green and low-carbon, resilience and safety, efficient, and equity” and fifteen indicators in total, as shown in Table 1. The indictor attributes of +/− represent positive and negative influences respectively. These subsystems were developed following principles of scientific rigor, systematic organization, practical applicability, and adaptability over time.

Table 1.
Indicator system for the level of NU/LCET.
Referring to the common practice of provincial panel data, this paper opted for a sample encompassing 30 regions across China [8], including provinces of Hebei, Shanxi, Liaoning, Jilin, Heilongjiang, Zhejiang, Jiangsu, Fujian, Jiangxi, Anhui, Hunan, Hubei, Henan, Shandong, Guangdong, Guangxi, Hainan, Sichuan, Yunan, Guizhou, Shaanxi, Qinghai, Xinjiang, Gansu, municipalities of Beijing, Tianjin, Shanghai, Chongqing, and autonomous regions of Inner Mongolia and Ningxia, and with Tibet, Hongkong, Macao, and Taiwan being deleted because of data unavailability. “New urbanization” is an important strategic policy first proposed by the 18th CPC National Congress in 2012, and for the authority of data, some of the indicator data from national databases are only updated to 2022, especially energy-related data in China Energy Statistical Yearbook; hence, the timeframe under examination spanning from 2013 to 2022 is determined. The dataset was sourced from various outlets, such as the China Statistical Yearbook (2014–2023) [65,66,67,68,69,70,71,72,73,74], China Energy Statistical Yearbook (2014–2023) [75,76,77,78,79,80,81,82,83,84], and China Statistical Yearbook on Environment (2014–2023) [85,86,87,88,89,90,91,92,93,94]. To address individual missing data points, linear interpolation techniques were employed.
4.2. Research Methodology
This logic of the methodology is as follows. Firstly, in the evaluation stage, the comprehensive index of NU and LCET was estimated by the entropy weight method and principal component analysis to ensure the objectivity and comparability of the two system evaluations. Secondly, in the stage of difference diagnosis, the sources of the spatial differences of the coordination degree were deconstructed based on the Dagum Gini coefficient, and the shortcomings of regional cooperation were identified. Finally, in the mechanism analysis stage, the SDM is used to identify the joint influence of the two systems on the spatial overflow of neighboring regions and reveal the driving path of the “regional coordination dilemma”. This progressive analysis chain, taking into account “static evaluation—dynamic evolution—causal inference”, conforms to the mainstream research paradigm of complex systems research [95].
4.2.1. Index Evaluation Methods
This paper employed the entropy method to assign weights to NU and the PCA method to assign weights to LCET, respectively. It is necessary to normalize the unprocessed data before assigning weights to indicators, as shown in Equations (1) and (2):
Here, t represents time (t = 1, 2, …, n), which corresponds to the number of samples. j denotes the number of indicators (j = 1, 2, …, m). The variable z denotes the condition of standardized metrics.
- Entropy weight method
The NU system covers economic, population, ecological, social, and other multi-dimensional indicators, among which there may be nonlinear relationships and information overlaps. The entropy weight method determines the weight by calculating the dispersion of the index information entropy, which can objectively reflect the fluctuation of the data itself and avoid the subjective weighting bias (such as the AHP method relying on expert scoring). It is especially suitable for the dynamic evaluation of multi-dimensional complex systems. It is pointed out that the entropy weight method is widely used in urbanization quality assessment because of its objectivity and inclusiveness of heterogeneity indicators, especially when dealing with dynamically evolving complex systems [4,8]. The calculation process is as follows:
The weight of indicator j in year t (Equation (3)).
The entropy of indicator j (Equation (4))
Here, ; therefore, .
Information entropy redundancy (Equation (5))
Weight of each indicator (Equation (6))
The comprehensive score of each sample under indicator m (Equation (7))
- 2.
- Principal component analysis method (PCA)
The LCET system involves highly relevant indicators such as carbon emission intensity, clean energy proportion, and energy efficiency, which is prone to multicollinearity problems. The results of the Spearman test and VIF test indicated that there are relatively strong interrelationships among some indicators. Therefore, to address this problem, the principal component analysis (PCA) method is applied here. The PCA method extracts uncorrelated principal components through orthogonal transformation and eliminates redundant information on the premise of retaining more than 85% variance of the original data [96]. The principal components extracted in this paper, such as “low-carbon technology efficiency” and “clean energy structure”, can effectively characterize the core characteristics of regional energy transformation and ensure comparability with the urbanization system. Specific steps are as follows:
Kaiser–Meyer–Olkin (KMO) test and Bartlett’s sphericity test were used to decide whether PCA is suitable.
Determination of factor numbers according to the cumulative contribution rate (85%).
Weight of each indicator (Equation (8))
The comprehensive score of LCET (Equation (9))
4.2.2. Coupling Coordination Degree Model
The mechanism analysis indicates that NU and LCET are complex systems, and these two systems exhibit a complex coupling relationship, rather than a simple linear or nonlinear relation. The coupling coordination degree model is commonly used to measure the strength and reflect the extent of coupling and coordination between systems [96,97,98]. The computational procedure follows the steps listed below in Equations (10)–(12):
Here, U1 and U2 represent the overall score indices for new urbanization and low-carbon energy transition, respectively; C ∈ [0, 1], the C value stands for the coupling degree of the two systems. T is the coordination indicator between the two systems; α and β are specific weights, α + β = 1 and α = β = 0.5, in the paper; and D ∈ [0, 1], where the closer D is to 1, the higher coupling coordination degree of the two, and vice versa. The coupling coordination degree (CCD) levels were categorized based on the D value, as indicated in Table 2, according to pertinent research [97].
Table 2.
Division of the coupling coordination degree level.
4.2.3. Kernel Density Estimation
It is appropriate to apply the Kernel density estimation method [95] to portray the dynamic change in CCD of NU and LECT (Equation (13)).
where D was mentioned before; indicates the average value of D; n counts the number of samples; K is kernel density function; and h is bandwidth.
4.2.4. Dagum Gini Coefficient
The traditional Gini coefficient can only measure the total difference, while the Dagum Gini coefficient can further decompose the difference into “intra-regional difference”, “inter-regional difference”, and “super-variable density”, and accurately identify the root cause of spatial disequilibrium [99], as described below (Equations (14)–(18)). Considering that there are great differences in economic development and energy endowment in China regions, and the government advocates the coordinated development of regions, the Dagum Gini method is used here. By dissolving the contribution rate of the spatial difference of the coordination degree, it is clear whether the “regional coordination shortboard” comes from the unbalanced development within the group or the resource barrier between the groups, so as to provide a targeted basis for differentiated policies [95].
Here, G is the overall Gini coefficient; k means 4 regions divided; n stands for 30 regions; ( is CCD of I (r) province in j (h) region; is averaged by D; ( is the number of provinces in a region correspondingly; is intra-regional gap; is inter-regional gap; is hypervariable density; denotes intra-regional variation; denotes inter-regional variation; and , .
4.2.5. Spatial Econometric Model
The coupling coordination degree of NU and LCET has a significant spatial dependence, and its driving factors include two types of spatial interaction: dependent variable spillover: The region with a high coordination degree promotes the coordinated improvement of surrounding regions through technology diffusion (such as clean energy technology) and policy demonstration (such as carbon trading pilot). Independent variable spillover: Urbanization processes in neighboring regions (like infrastructure investment) may affect local coordination through factor flows (like labor migration) or environmental competition (like pollution transfer). Thus, it is necessary to use a spatial econometric model to explore the influencing effects.
- Spatial autocorrelation model
The research initially estimated the global Moran’s I to assess the spatial dependence of CCD of the two variables (Equation (19)):
where n denotes the research samples. x represents the observed values at spatial positions. The selected spatial weight is an adjacency matrix, if the spaces are adjacent, = 1; otherwise, = 0.
Next, the LISA statistics of the local Moran’s I were calculated and applied to determine the clustering and heterogeneity characteristics of local spatial elements using the formula (Equation (20)):
- 2.
- Spatial Durbin model
The common spatial regression models include the Spatial Error Model (SEM), Spatial Lag Model (SLM), and Spatial Durbin Model (SDM), in which SEM uses a spatial autocorrelation design with error terms to solve the unobservable spatial dependence. SLM introduces the spatial lag term of the dependent variable to reflect the spatial spillover effect of the explained variable, while SDM can quantify both types of spillover effects simultaneously, while SAR/SEM can capture only one of them [27]. Additionally, this study conducted a likelihood ratio test between SDM and SAR/SEM, and the results showed that LR statistics were significant at a 1% level (p = 0.003), rejecting the simplified hypothesis of SAR/SEM and confirming that SDM was the optimal model. Here, in this paper, to effectively analyze the interregional spillovers, SDM was constructed as Equation (21) [95]:
Here, represents the region, is the time, and is the spatial weight matrix. represents the spatial lag variable and the influence of spatial distance on regional behavior. is the spatial lag term of the control variable, representing its influence on neighboring regions. is generally called the spatial autoregressive coefficient. represents a series of control variables, and and are the regression coefficient and spatial autocorrelation coefficient of the control variables. is the fixed effect and is the error term.
The study focused on the relationship between NU and LCET. Explanatory variables such as R&D intensity and economic development level were chosen based on prior discussions and literature sources [10,42,46]. The data were examined to comprehend their influence on the level of coordination and collected through the databases mentioned before. Table 3 presents indications that characterize all variables.
Table 3.
Variable indicators description.
5. Findings Analysis
5.1. Comprehensive Evaluation and Analysis of New Urbanization and Low-Carbon Energy Transition Subsystems
The indices for NU and LCET in 30 regions in China were established using the calculating methodologies indicated before, and these regions were divided into four groups [6]. As for the NU system, the trajectory of NU levels in all regions, as shown in Figure 1, demonstrates a steady and progressive increase tendency. The annual growth rate shows Central China (5.02%) > West China (4.76%) > Northwest China (2.43%) > East China (2.37%). On the whole, the average level increased from 0.382 to 0.505 due to reasons such as strong economic growth, continuous improvement of the industrial structure, and the advancement of integrated urban–rural development. The NU level of East China is much higher than any other part of China due to economic and demographic advantages, while other regions’ NU levels are always below the China average due to their backward economies and infrastructure. The overall regional differences exhibit East China > Central China > West China > Northeast China. As for the LCET system, the index displayed in Figure 1 has been reasonably consistent generally, with a significant increase observed. The annual growth rate of LCET shows West China (10.34%) > Central China (6.12%) > Northwest China (3.76%) > East China (3.25%). The nationwide LCET level increased from 1.398 to 2.077 due to national-level actions, which provided clear strategic guidance and policy support for the energy transition. The LCET levels of the eastern and central parts of China are above the nationwide average level, while the western and northwest regions are below the average level always, and with relatively large space for development. Within the study period, the overall LCET levels were different as East China > Central China > West China > Northeast China.
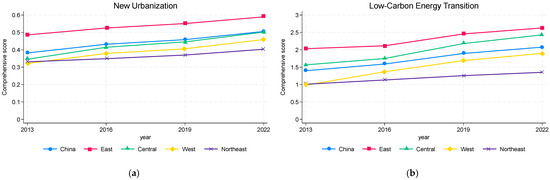
Figure 1.
(a) The NU indexes of areas in China from 2013 to 2022; (b) The LCET indexes of areas in China from 2013 to 2022.
5.2. Spatiotemporal Analysis of Coupling Coordination Level
Limited to space, some representative years (2013, 2016, 2019, 2022) were selected for data enumeration and analysis according to the principle of quartering. The comprehensive evaluation values (D) of NU and LCET were analyzed using the CCD model to derive the temporal and spatial evolution characteristics across 30 regions in China.
Table 4 and Figure 2 show that, during the study period, although there were small fluctuations in the CCD in a few regions, on the whole, the numerical value showed a steady upward trend, and the national average rose from 0.571 to 0.759. Specifically, as of 2022, the D value of the Beijing, Tianjin, Jiangsu, and Zhejiang regions is relatively high, reaching the level of high-quality coordination, while the Gansu and Heilongjiang regions only reach the level of barely coordinated, and most of the remaining provinces are mostly in the primary, middle, and good levels of coordination, which needs to be further optimized and upgraded.
Table 4.
Examining the level of integration between NU and LCET in Chinese regions from 2013 to 2022.
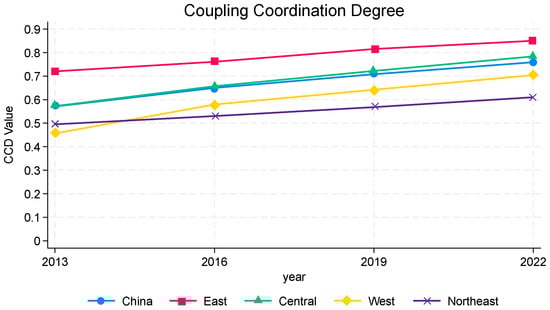
Figure 2.
Evolution trend of coupling coordination level.
Dividing the country into four regions, the eastern area has achieved progress from intermediate coordination to good coordination, increasing from 0.72 in 2013 to 0.85 in 2022, growing more than 2% a year. Provinces in eastern China are more economically developed and have the capability to provide sufficient financial and material support for promoting NU and LCET. The central region realized a two-stage improvement from bare coordination to intermediate coordination, from 0.572 to 0.784, increasing by 4.12% annually. Drawing on the successful experience of the eastern neighbors in developing NU and LCET, along with relatively good economic strength, the central region has made remarkable progress. The western region had the lowest CCD value initially, but it successfully jumped from near imbalance to intermediate coordination, and is the region with the largest improvement, from 0.456 in 2013 to 0.704 in 2022, showing an average growth rate of 6.04% a year. Although the western region’s CCD value in 2013 was slightly lower than that of the northeast region, in recent years, with its rich clean energy endowment like water, wind, and solar, coupled with the rapid development of green energy investment and clean energy base construction, it has driven the local industrial and economic and social development, and the coupling coordination level has also caught up with the northeast region. The northeast region has also realized the transformation from the near imbalance to primary coordination, with CCD from 0.495 to 0.610, and annual growth over 2.5%, but there is still a gap between the northeast region and the other regions. The northwest part is rich in fossil energy and highly dependent on fossil energy, especially in heating. As a result, there may be some problems like carbon locking in some high-energy-consuming industries, posing challenges to the collaborative development of the two systems. In general, all regions showed an increasing trend year by year, and CCD was as follows: eastern regions > central regions > national average > western regions > northeast regions.
5.3. Characterization of the Evolution of Regional Disparities
To characterize the evolution of CCD in various regions, cross-sectional data from 2013, 2016, 2019, and 2022 were selected to depict the kernel density curve, as shown in Figure 3. Firstly, the center of the distribution moves to the right, obviously manifesting that the CCD value is increasing. Secondly, the peak of the CCD distribution exhibits an upward trend, and the main peak shape of the wave develops from “a wide peak” to “a sharp peak”, with the overall performance from gentle to steep. This shows that the absolute difference in CCD is gradually shrinking. Thirdly, concerning the number of peaks of the curve, some years take on the form of “a single main peak plus weak side peak”, demonstrating that the variations among provinces are characterized by polarization. Taking the years 2016 and 2019 as examples, polarization is obvious, with the left peak value higher than the right peak value. The improvement in the CCD level puts forward requirements for many factors such as regional economic level, government support, policy guidance, etc.; hence, the regions that do not meet the corresponding requirements are blocked by gradient effects. Finally, considering the kernel density curve width, it is observed that the width decreased gradually, showing that the regional variations in the coupling coordination degree reduce continuously. To sum up, the average level of the CCD of NU and LCET rose, and the gap between provinces narrowed.
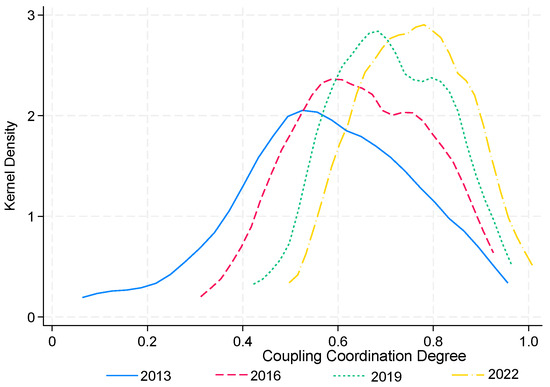
Figure 3.
Kernel density curve.
5.4. Regional Spatial Differences and Decomposition
5.4.1. Overall and Intra-Regional Disparity Analysis
As Figure 4 displays, the Dagum Gini coefficient of CCD in China is between 0.176 and 0.084, with an average value of 0.118. It exhibits a fluctuating downward trend, with a decrease of 52.27%. Policies and measures have achieved remarkable results, and to a certain degree narrowed the differences between the coupling and coordinated development of NU and LCET across the country. Specifically, the intra-regional differences between the four parts showed a trend of fluctuation and decline. The Dagum Gini coefficient in the western region fell obviously from 0.184 to 0.060, with a decrease of 67.4%. In northeast China, the reduction is 56.82%, and is slightly smaller. The eastern region sees the smallest drop of 42.2%. It shows that the spatial disequilibrium of CCD in the western and northeastern regions has improved, while CCD among provinces in the eastern region has a bottleneck period, which makes the regional decline change not obvious. In terms of the variations, the western and eastern regions show significant intra-group differences, with average values of 0.095 and 0.081, respectively, followed by the northeast (0.067) and central regions (0.054). The differences in development basis, economic level, energy factor distribution, and other aspects may cause the formation of regional disparities.
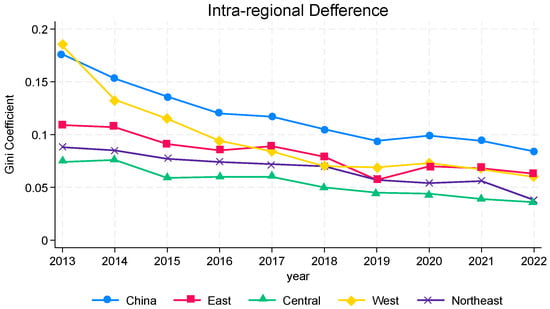
Figure 4.
Evolution of the Dagum Gini coefficient in the region.
5.4.2. Inter-Regional Disparities Analysis
The inter-regional inequality of the Gini coefficient is portrayed in Figure 5. The variations show East–Northeast > East–West > Central–West, as 0.0192, 0.160, 0.098, respectively, indicating that there is an obvious “gap” between the eastern, the western, and the northeast region, while the regional difference between the central region and the northeast region is not distinct. Moreover, the difference in CCD among all regions (except the central and northeast) reveals a downward trend. Among them, the most obvious reduction in inter-regional disparity is east–west, the decrease is 58.03%, followed by the east–central, west–northeast, and eastern–northeast as the smallest. In general, the western region has shown rapid development in new-type urbanization construction and low-carbon energy transformation, constantly “catching up” with the eastern region. At present, the radiation of national special policies from the eastern region to the inland is greater than that from the northeast region, resulting in the widening of the inter-regional disparities between the central and northeast regions. Nevertheless, the gap between east–northeast and east–west regions is gradually narrowing, and CCD is gradually changing to the relatively balanced development of the region generally.
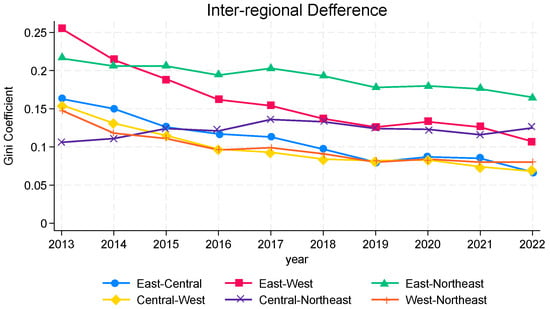
Figure 5.
Evolution of the Dagum Gini coefficient between regions.
5.4.3. Decomposition and Analysis of Regional Variations
Table 5 reports the sources and contributions of the overall difference in CCD from 2013 to 2022. From the perspective of contribution rate, the overall difference in CCD comes from inter-regional difference > intra-regional difference > hypervariable density, and the average contribution rate is 63.43%, 20.71%, and 15.85%, respectively. As for evolution trends, the contribution rates of both intra-regional and hypervariable density emerge a decreasing trend. The intra-regional contribution rate descends from 21.97% in 2013 to 20.71% in 2022, with a decrease of 6.88%; the contribution rate of hypervariable density falls from 17.31% in 2013 to 11.81% in 2022, with the biggest decrease of 31.79%. However, the contribution rate between regions shows an overall trend of fluctuation, which rises from 60.72% in 2013 to 67.74% in 2022, with an increase of 11.55%. In summary, inter-regional differences account for a substantial part of overall differences in CCD in the future, but their impact is gradually alleviating.
Table 5.
Dagum Gini coefficient and its decomposition.
5.5. Spatial Effects Analysis
5.5.1. Global Spatial Autocorrelation Analysis
Analysis of global spatial patterns shows clear regional differences in the relationship between the integration of NU and LCET. The research paper utilized Global Moran’s I to examine the spatial correlation of this coupling coordination connection. Table 6 shows that Moran’s I is consistently above zero and statistically significant at a 1% level from 2013 to 2022. This indicates a strong positive relationship in the spatial aspect between NU and LCET. The average global Moran’s I value between 2013 and 2022 is 0.5, indicating the general dynamic trend. The trajectory exhibits an M-shaped pattern with alternating phases of increase, decrease, and then increase and decrease again.
Table 6.
Test results of Global Moran’s I.
The spatial distribution of CCD varies across different provinces, showing either dispersion or concentration in specific areas. Here, the Moran scatterplot was used, and the results are shown in Figure 6. This scatterplot is useful for evaluating the spatial relationships between coupling coordination degrees in various places. The categorization into four quadrants (QI to QIV) represents different forms of spatial autocorrelation, each demonstrating diverse spatial connections between locations. QI represents regions with high values and similar neighboring regions, known as high–high (H-H), showing a positive spatial autocorrelation. Most of the eastern and central provinces, which have good geographical conditions and relatively high levels of social and economic development, exhibit high values and closely clustered neighboring observations, suggesting coordinated regional development and a strong spatial clustering effect. QII has places with low values surrounded by high values, known as low–high (L-H), demonstrating negative spatial autocorrelation. Scant areas are located in this quadrant, suggesting little observation in that region, which is not strategically located in high-value areas and lacks spatial coordination due to its adjacent regions. QIII shows regions with low values surrounded by other low values, known as low–low (L-L), and also displays positive spatial autocorrelation. Throughout the study period, most provinces in the northeast and western regions of China were located in this quadrant, indicating a prevalent lack of coordination and little mutual influence. A strong diffusion effect has not occurred yet. QIV represents regions with high values surrounded by low values, known as high–low (H-L), and also suggests negative spatial autocorrelation. Regions in this part may be limited to development. There are just a small number of areas in this quadrant. Compared with 2013, due to growing urbanization and the shift to low-carbon energy, regions gradually gathered in QI and QIII, moving from QIII to QI, with overall convergent line aggregation.
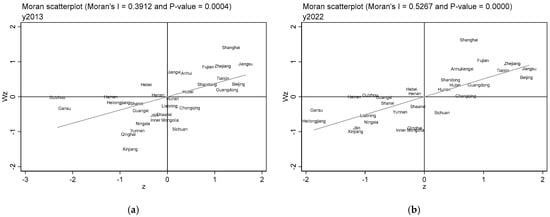
Figure 6.
(a) Moran scatterplot of CCD in various regions in 2013; (b) Moran scatterplot of CCD of NU and LCET in various regions in 2022.
5.5.2. Identification and Testing of Spatial Effects Models
Table 7 shows that the statistics of LM-lag and LM-err both pass the significance tests, and the spatial lag and spatial error effects coexist. Therefore, the SDM model is constructed in this paper. The outcome of the Hausman test is significant at the statistical level of 1%, which suggests choosing a fixed effect model. Moreover, both Wald and LR tests are significant at the 1% level, suggesting that the spatial Durbin model will degenerate into SEM and SLM. Finally, this paper carried on the spatial econometric analysis under the spatial adjacency and economic distance matrix.
Table 7.
Model selection tests.
5.5.3. SDM Estimation Results and Analysis
The coefficient of rho tells whether the dependent variable has a spatial spillover effect. It is obvious that in Table 8, no matter what kind of matrix, the rho is positively significant. That is, the CCD of each province is positively and significantly influenced by adjacent regions or regions with similar economic conditions, and there is a diffusion effect. More specifically from each influencing factor:
Table 8.
SDM estimation results.
The influence coefficient of economic development level (RGDP) is positive, indicating that economic prosperity can stimulate its own CCD. Its spatial lag coefficient is negative; that is, improvement in the local economic development level will cause a decrease in the coupled coordination value in the neighboring region. Its spatial lag term coefficient of R&D intensity (RDTY) is significantly negative, indicating that an increase in R&D intensity in the local region will lead to a decrease in the coupled coordination value in the neighboring region. The spatial lag coefficient of the social consumption level (CON) is negative, which shows that the rise of the local social consumption level will result in a decrease in the coupled coordination value in the neighboring region. The influence coefficient of the level of openness on the outside world (OPEN) is significantly positive. The opening attitude positively influences the local coupling coordination level. The industrial structure rationalization (TL) has a significant negative coefficient. Because TL is expressed by the Thiel index, the negative relationship just shows that the more reasonable the industrial structure, the more conducive it is to improving CCD. The influence coefficient of environmental regulation intensity (ENN) is negative, indicating that intensive environmental regulation in the region will restrain the growth of the coupled coordination value.
5.5.4. Spatial Effects Decomposition
Some scholars believed that the model estimation coefficient has limitations in reflecting the marginal effect of independent variables on dependent variables [100]. Therefore, the influence of each variable on CCD is decomposed in this part. The direct effect represents the influence of the change in the independent variable of each region on its own CCD, while the indirect effect represents the potential influence of the neighboring region through spatial interaction. Therefore, the indirect effect can be considered as a spillover effect. Table 9 lists the detailed results.
Table 9.
Effect decomposition.
Taking the outcomes of the economic distance matrix as an example, in terms of RGDP, the direct effect shows that an economic boom can significantly promote the increase in CCD, and the regression coefficient (0.116) passes the 1% confidence level test. The indirect coefficient is negative (−0.137), at a 10% statistical level, which means it has an inhibitory effect on neighboring regions. A flourishing of the local economy will have a siphon effect, causing the inflow of talents, resources, funds, and other elements, thus bringing adverse effects on the development of neighboring regions.
The direct effect of RDTY on regional coordination development is negative (−2.221), at a 5% statistical level. The negative coefficient is inconsistent with conventional cognition, and the reason for this phenomenon may be that the increase in the R&D intensity “technology rebound effect” causes additional energy consumption and then reduces the regional coupling coordination value. Its spatial effect coefficient is negative at a 1% significance level. The CCD value not only depends on the intensity of research and development, but it also needs to improve the innovation ecosystem, scientific research cooperation mechanism, and the corresponding supporting institutional environment.
Regarding CON, the direct coefficient is positive but has no significance. However, CON has a negative spatial spillover effect. The gradual optimization of the social consumption structure is crucial to its coupling and coordination development, but the expansion of the social consumption scale may prompt some production capacity to be transferred to nearby regions, causing complex changes in the supply chain.
For OPEN, the regression coefficient (0.102) is positive on the direct effect, and the greater intensity of opening up in the region can significantly promote the growth of CCD in the region. However, there is no significant spatial spillover effect.
TL negatively affects the CCD of the region, with a direct effect coefficient of −0.124, significant at a 1% statistical level. The result means industrial rationalization in a region will prominently promote the growth of its coupled and coordinated development. Industrial rationalization through the introduction of new technologies improves production methods and product quality, so that traditional industries have higher added value and technical content. Especially in the process of the transformation and upgrading of traditional industries to green, high-end, and intelligent, it can greatly reduce the damage, protect the environment, raise the efficiency of energy utilization, and help the coordinated development of cities and the environment, creating conditions for high-quality development. Nevertheless, the indirect effect coefficient is not significant.
As for DIG, the direct effect is not significant, but the indirect effect regression coefficient of 0.011 is significant at the 10% confidence level. The digital economy’s rapid development can positively raise the CCD of neighboring regions.
Concerning ECS, the direct effects are not statistically significant, while the indirect effect coefficient is negative (−1.215), significant at a 1% statistical level. The local energy consumption structure may be improved due to the expense of the optimization of the neighboring energy structure, resulting in a decreased CCD of the neighboring regions.
The coefficient of ENN’s direct effect is −1.721, which is significant at a 10% confidence level. A greater intensity of environmental regulation in the region will inhibit the growth of the coupled coordination value in the province. The “crowding-out effect” produced by environmental regulations is greater than the “incentive effect”, which fails to effectively promote regional innovation, energy conservation, and emission reduction capabilities, thus hindering the coupling coordination value of the region. Meanwhile, ENN has a positive spatial spillover effect on the coordination development of neighboring land.
6. Conclusions and Suggestions
6.1. Conclusions
Based on the theoretical mechanism analysis of how NU and LCET are coupled and coordinated, this paper calculates and analyzes the coupling coordination degree of NU and LCET, the spatio-temporal characteristics, and the spatial spillover effects in 30 regions in China from 2013 to 2022. The conclusions are listed below:
Firstly, both NU and LCET levels show an upward trend, with inequality exhibiting East China > Central China > West China > Northeast China.
Secondly, the interaction between NU and LCET has a complex mechanism for coordinated development. The outcome of the CCD model shows that the overall and different regions’ coupling coordination indices reveal a stable upward trajectory, with East China progressing from intermediate (level 8) to good coordination (level 9), Central China from bare (level 6) to intermediate coordination (level 8), West China from near imbalance (level 5) to intermediate coordination (level 8), and Northeast from near imbalance (level 5) to primary coordination (level 7). The western region has a weak foundation, but it has made remarkable progress. The low degree of coordination in some regions, especially the northeast part, may be related to potential factors such as risk of energy price fluctuations and technology substitution, as well as insufficient absorption capacity of renewable energy. In all, different economic conditions, energy endowments, policies implementation, etc., have led to variations.
Thirdly, the outcomes of the Dagum Gini coefficient show that the intra-regional disparities exhibit: West > East > Northeast > Central, and the inter-regional disparities exhibit East–Northeast > East–West > Central–West, which reveals the leading role of the eastern region. Additionally, the decomposition results point out that the inter-regional differences greatly hinder the coordinated development of regions. Moreover, there are significant internal differences within the eastern region. Although the overall CCD in East China exhibits a good performance, the unbalanced development within the region remains prominent, which may also need attention.
Lastly, the CCD value exhibits strong spatial autocorrelation, having a positive spatial spillover effect. As for influencing factors, the level of economic development and opening up can promote the local CCD, but economic development will inhibit the CCD of neighboring regions. The R&D intensity may prohibit the coupling and coordination of both local and neighboring areas. Social consumption level and energy consumption level prominently restrain the increase in the CCD value of neighboring land. Environmental regulation intensity inhibits the increase in local coupling and coordination level, while facilitating the level of neighboring provinces. In general, some factors can enhance the CCD in the region, while they may have an adverse impact on the CCD of neighboring regions. The findings may challenge some conventional views like the overflow effect. Here, the inhibitory effect of economic development on neighboring regions may come from the siphon effect, which attracts elements such as talent, resources, and capital. In all, collaborative planning among regions is necessary.
6.2. Suggestions
Drawing from the primary conclusions outlined above, this paper proposes the following recommendations:
First, accelerate low-carbon energy transformation in light of local conditions and narrow regional differences. For the western regions with abundant renewable energy resources, green tax incentives, financial subsidies, and green credit policies can stimulate the market vitality of renewable energy development and utilization. Through policy guidance and technological innovation drive the transformation of high-energy-consuming industries into clean energy industries, and foster new energy industrial clusters to form new economic growth points. For other regions where clean energy is relatively scarce, make the best of capital, talent, and technology to accelerate the cultivation of new green industries and promote the comprehensive green transformation of economic development models and consumption patterns.
Second, establish a sound mechanism for the coordinated development of NU and LCET. First, strengthen the overall planning of urbanization, energy consumption, and carbon emissions, integrate low-carbon development into the whole process of urban planning, and advocate the construction of green city layouts and transportation networks. At the same time, promote high standards for green building design and construction, use eco-friendly materials and smart technologies to avoid energy waste and carbon emissions, and enhance the ecological efficiency and sustainability of urban infrastructure. Prioritize the deployment of shared energy storage facilities and improve the matching ability of energy subsystems and urbanization needs by calming the volatility of renewable energy. Second, improve the construction of new energy systems, accelerate the development and utilization of renewable energy, and promote energy efficiency upgrading. Support the creation of renewable energy conversion technologies, combine them with smart grid technologies to optimize energy distribution and storage, and ensure clean and efficient energy supply. In high-energy-consuming areas such as industrial production, transportation, and building operation and maintenance, energy-saving technologies and equipment are widely used to improve the overall efficiency of energy utilization. The third is policy incentives and social mobilization, building a policy framework that includes multiple incentive mechanisms such as carbon trading market, green fiscal and tax incentives, and green credit, effectively stimulating low-carbon behaviors through economic leverage, and implementing necessary supervision and constraints on behaviors with high energy consumption and high emissions. On this basis, strengthen public environmental awareness education, promote low-carbon practices at the community level, form a multi-dimensional co-governance pattern featuring macro government guidance, efficient operation of market mechanisms, and active participation of all sectors of society, and jointly promote the deep integration and continuous progress of NU and LCET.
Third, there is a need to achieve differentiated regional development under local conditions. The urbanization rate of the eastern region is already high, and based on maintaining its advantages in human capital, innovation, government support, and digital economy, it will focus on transforming to greener economic models and social consumption modes, meanwhile upgrading the industrial structure. As a key area of energy consumption and economic development, the eastern region can actively promote the development of distributed energy in areas where conditions exist, on the one hand, to improve the rate of energy self-sufficiency, and on the other hand, to promote new forms of energy, and promote urban–rural integration and rural revitalization to lay a good foundation. As the strategic rear of energy security and a gathering place for renewable energy, the western region should fully use the favorable carbon emission dual control policy and take advantage of the latecomer advantage. The urbanization rate in the western region is relatively low. It should grasp the principle of both incremental and stock, by increasing the popularity of renewable energy in the spatial layout of “incremental” urbanization, building a high-level clean energy base, and forming an emerging industrial chain and new energy industry cluster, and, at the same time, speed up the green transformation of old city infrastructure and promote the green transformation of social consumption model. The northeast and central regions have neither the abundant clean energy of the western region nor the superior hardware and software resources of the eastern region, and the coupling coordination level in the northeast region is at the bottom of all regions. Therefore, these regions should steadily advance, strengthening the construction of the innovation system, and enabling the coordinated development of NU and LCET with high-quality, efficient, and green innovation capabilities.
6.3. Limitation and Future Research
Due to data limitations, this paper researched the coupling and coordination degree between the NU and LCET systems at the provincial level. In the future, it is advisable to use city-level or even county-level data to conduct research, because new urbanization is related more to urban areas, and cities are the main subjects of economic development and energy consumption. Moreover, exploring the causality between CCD and various variables can also be a perspective for future research.
Author Contributions
Conceptualization, X.W.; methodology, X.W.; software, L.W.; validation, L.W. and X.C.; formal analysis, X.C.; investigation, J.W.; resources, X.W.; data curation, X.C., J.W. and Z.Y.; writing—original draft preparation, X.C. and L.W.; writing—review and editing, X.W.; visualization, L.W.; supervision, X.W.; project administration, X.W.; funding acquisition, X.W. All authors have read and agreed to the published version of the manuscript.
Funding
This research was funded by the National Social Science Foundation of China (24XJY024).
Institutional Review Board Statement
Not applicable.
Informed Consent Statement
Not applicable.
Data Availability Statement
Data are contained within the article.
Conflicts of Interest
Author Zhibo Yu was employed by the company Southwest Oil and Gas Field Company Natural Gas Economic Research Institute. The remaining authors declare that the research was conducted in the absence of any commercial or financial relationships that could be construed as a potential conflict of interest.
References
- Liu, Y.; Yang, M.; Cui, J. Urbanization, economic agglomeration and economic growth. Heliyon 2024, 10, e23772. [Google Scholar] [CrossRef] [PubMed]
- Ríos-Ocampo, J.P.; Gary, M.S. Urban growth strategy in Greater Sydney leads to unintended social and environmental challenges. Nat. Cities 2025, 2, 223–233. [Google Scholar] [CrossRef]
- Li, S.; Wang, Y.; Dincer, H.; Yuksel, S.; Yu, D. The effects of new urbanization pilot city policies on urban innovation: Evidence from China. Sustainability 2023, 15, 11352. [Google Scholar] [CrossRef]
- Yu, B. Ecological effects of new-type urbanization in China. Renew. Sust. Energ. Rev. 2021, 135, 110239. [Google Scholar] [CrossRef]
- Cheng, Z.; Wang, L. Can new urbanization improve urban total-factor energy efficiency in China? Energy 2023, 266, 126494. [Google Scholar] [CrossRef]
- Zhou, Z.; Cao, L.; Zhao, K.; Li, D.; Ding, C. Spatio-Temporal Effects of Multi-Dimensional Urbanization on Carbon Emission Efficiency: Analysis Based on Panel Data of 283 Cities in China. Int. J. Environ. Res. Public Health 2021, 18, 12712. [Google Scholar] [CrossRef]
- Peng, J.; Liu, Y.; Wang, Q.; Tu, G.; Huang, X. The impact of new urbanization policy on in situ urbanization—Policy test based on difference-in-differences model. Land 2021, 10, 178. [Google Scholar] [CrossRef]
- Chen, C.; Qin, Y.; Gao, Y. Does new urbanization affect CO2 emissions in China: A spatial econometric analysis. Sust. Cities Soc. 2023, 96, 104687. [Google Scholar] [CrossRef]
- Tian, J.; Yu, L.; Xue, R.; Zhuang, S.; Shan, Y. Global low-carbon energy transition in the post-COVID-19 era. Appl. Energy 2022, 307, 118205. [Google Scholar] [CrossRef]
- Su, X.; Tan, J. Regional energy transition path and the role of government support and resource endowment in China. Renew. Sustain. Energy Rev. 2023, 174, 113150. [Google Scholar] [CrossRef]
- Yang, Y.; Xia, S.; Huang, P.; Qian, J. Energy transition: Connotations, mechanisms and effects. Energy Strateg. Rev. 2024, 52, 101320. [Google Scholar] [CrossRef]
- Majewski, S.; Mentel, U.; Salahodjaev, R.; Cierpiał-Wolan, M. Electricity consumption and economic growth: Evidence from South Asian Countries. Energies 2022, 15, 1327. [Google Scholar] [CrossRef]
- Ram, M.; Osorio-Aravena, J.C.; Aghahosseini, A.; Bogdanov, D.; Breyer, C. Job creation during a climate compliant global energy transition across the power, heat, transport, and desalination sectors by 2050. Energy 2022, 238, 121690. [Google Scholar] [CrossRef]
- Pereira, G.; Bell, M.L.; Honda, Y.; Lee, J.T.; Morawska, L.; Jalaludin, B. Energy transitions, air quality and health. Environ. Res. Lett. 2021, 16, 020202. [Google Scholar] [CrossRef]
- Dong, K.; Jiang, Q.; Shahbaz, M.; Zhao, J. Does low-carbon energy transition mitigate energy poverty? The case of natural gas for China. Energy Econ. 2021, 99, 105324. [Google Scholar] [CrossRef]
- Kuddus, M.A.; Tynan, E.; McBryde, E. Urbanization: A problem for the rich and the poor? Public Health Rev. 2020, 41, 1. [Google Scholar] [CrossRef]
- Song, Y.; Chen, B.; Ho, H.C.; Kwan, M.P.; Liu, D.; Wang, F.; Wang, J.; Cai, J.; Li, X.; Xu, Y. Observed inequality in urban greenspace exposure in China. Environ. Int. 2021, 156, 106778. [Google Scholar] [CrossRef]
- Zhang, H.; Chen, M.; Liang, C. Urbanization of county in China: Spatial patterns and influencing factors. J. Geogr. Sci. 2022, 32, 1241–1260. [Google Scholar] [CrossRef]
- Montero-Martínez, M.J.; Andrade-Velázquez, M. Effects of Urbanization on Extreme Climate Indices in the Valley of Mexico Basin. Atmosphere 2022, 13, 785. [Google Scholar] [CrossRef]
- Sharma, A.; Kale, G.D. Assessment of urbanization impact on urban heat island effect and rainfall for the Surat city. Acta Geophys. 2022, 70, 243–264. [Google Scholar] [CrossRef]
- Egidi, G.; Salvati, L.; Falcone, A.; Quaranta, G.; Salvia, R.; Vcelakova, R.; Giménez-Morera, A. Re-framing the latent nexus between land-use change, urbanization and demographic transitions in advanced economies. Sustainability 2021, 13, 533. [Google Scholar] [CrossRef]
- Azam, M.; Rehman, Z.U.; Ibrahim, Y. Causal nexus in industrialization, urbanization, trade openness, and carbon emissions: Empirical evidence from OPEC economies. Environ. Dev. Sustain. 2022, 24, 13990–14010. [Google Scholar] [CrossRef]
- Khan, S.; Majeed, M.T. Toward economic growth without emissions growth: The role of urbanization & industrialization in Pakistan. J. Environ. Stud. Sci. 2023, 13, 43–58. [Google Scholar] [PubMed]
- Kime, S.; Jacome, V.; Pellow, D.; Deshmukh, R. Evaluating equity and justice in low-carbon energy transitions. Environ. Res. Lett. 2023, 18, 123003. [Google Scholar] [CrossRef]
- Chilvers, J.; Bellamy, R.; Pallett, H.; Hargreaves, T. A systemic approach to mapping participation with low-carbon energy transitions. Nat. Energy 2021, 6, 250–259. [Google Scholar] [CrossRef]
- Cai, S.; Zheng, Z.; Wang, Y.; Yu, M. The impact of green credits on high-quality energy development: Evidence from China. Environ. Sci. Pollut. Res. Int. 2023, 30, 57114–57128. [Google Scholar] [CrossRef]
- Wang, F.; Wang, R.; He, Z. The impact of environmental pollution and green finance on the high-quality development of energy based on spatial Dubin model. Resour. Policy 2021, 74, 102451. [Google Scholar] [CrossRef]
- Motz, A. Security of supply and the energy transition: The households’ perspective investigated through a discrete choice model with latent classes. Energy Econ. 2021, 97, 105179. [Google Scholar] [CrossRef]
- Wei, T.; Duan, Z.; Xie, P. Spatial disparities and variation sources decomposition of energy poverty in China. J. Clean. Prod. 2023, 421, 138498. [Google Scholar] [CrossRef]
- Sun, S.; Tong, K. Rural-urban inequality in energy use sufficiency and efficiency during a rapid urbanization period. Appl. Energy 2024, 364, 123133. [Google Scholar] [CrossRef]
- Schill, W.P. Electricity storage and the renewable energy transition. Joule 2020, 4, 2059–2064. [Google Scholar] [CrossRef]
- Greim, P.; Solomon, A.A.; Breyer, C. Assessment of lithium criticality in the global energy transition and addressing policy gaps in transportation. Nat. Commun. 2020, 11, 4570. [Google Scholar] [CrossRef] [PubMed]
- Rahman, M.M.; Oni, A.O.; Gemechu, E.; Kumar, A. Assessment of energy storage technologies: A review. Energy Conv. Manag. 2020, 223, 113295. [Google Scholar] [CrossRef]
- Chen, Z.; Zhou, M. Urbanization and energy intensity: Evidence from the institutional threshold effect. Environ. Sci. Pollut. Res. Int. 2021, 28, 11142–11157. [Google Scholar] [CrossRef]
- Feng, Y.; Liu, Y.; Yuan, H. The spatial threshold effect and its regional boundary of new-type urbanization on energy efficiency. Energy Policy 2022, 164, 112866. [Google Scholar] [CrossRef]
- Awan, A.; Alnour, M.; Jahanger, A.; Onwe, J.C. Do technological innovation and urbanization mitigate carbon dioxide emissions from the transport sector? Technol. Soc. 2022, 71, 102128. [Google Scholar] [CrossRef]
- Wang, R.; Ren, H.; Cai, W.; Shi, Q. Effects of various stages and modes of urbanization on building energy consumption intensity in China. J. Environ. Plan. Manag. 2023, 66, 1147–1166. [Google Scholar] [CrossRef]
- Wang, Z.; Yang, Z.; Zhang, B.; Li, H.; He, W. How does urbanization affect energy consumption for central heating: Historical analysis and future prospects. Energy Build. 2022, 255, 111631. [Google Scholar] [CrossRef]
- Xie, L.; Yan, H.; Zhang, S.; Wei, C. Does urbanization increase residential energy use? Evidence from the Chinese residential energy consumption survey 2012. China Econ. Rev. 2020, 59, 101374. [Google Scholar] [CrossRef]
- Wang, Q.; Lin, J.; Zhou, K.; Fan, J.; Kwan, M.P. Does urbanization lead to less residential energy consumption? A comparative study of 136 countries. Energy 2020, 202, 117765. [Google Scholar] [CrossRef]
- Wu, W.; Lin, Y. The impact of rapid urbanization on residential energy consumption in China. PLoS ONE 2022, 17, e0270226. [Google Scholar] [CrossRef] [PubMed]
- Liu, W.; Zhan, J.; Zhao, F.; Wei, X.; Zhang, F. Exploring the coupling relationship between urbanization and energy eco-efficiency: A case study of 281 prefecture-level cities in China. Sust. Cities Soc. 2021, 64, 102563. [Google Scholar] [CrossRef]
- Abbasi, M.A.; Parveen, S.; Khan, S.; Kamal, M.A. Urbanization and energy consumption effects on carbon dioxide emissions: Evidence from Asian-8 countries using panel data analysis. Environ. Sci. Pollut. Res. 2020, 27, 18029–18043. [Google Scholar] [CrossRef] [PubMed]
- Zhang, Y.; Liu, Z.; Song, B.; Gao, S.; Ren, S. Impact of renewable energy consumption on the development of new urbanization: A study based on dynamic panel threshold model. China Soft Sci. 2023, 6, 215–224. [Google Scholar]
- Chen, S. Renewable energy technology innovation and urbanization: Insights from China. Sust. Cities Soc. 2024, 102, 105241. [Google Scholar] [CrossRef]
- Kim, S. The effects of foreign direct investment, economic growth, industrial structure, renewable and nuclear energy, and urbanization on Korean greenhouse gas emissions. Sustainability 2020, 12, 1625. [Google Scholar] [CrossRef]
- Ma, Q.; Shi, F. New urbanization and high-quality urban and rural development: Based on the interactive coupling analysis of industrial green transformation. Ecol. Indic. 2023, 156, 111044. [Google Scholar] [CrossRef]
- Asghar, M.; Ali, S.; Hanif, M.; Ullah, S. Energy transition in newly industrialized countries: A policy paradigm in the perspective of technological innovation and urbanization. Sustain. Futures 2024, 7, 100163. [Google Scholar] [CrossRef]
- Xu, B.; Lin, B. Investigating the determinants of the growth of the new energy industry: Using quantile regression approach. Energy J. 2023, 44, 241–258. [Google Scholar] [CrossRef]
- Aung, T.; Jagger, P.; Hlaing, K.T.; Han, K.K.; Kobayashi, W. City living but still energy poor: Household energy transitions under rapid urbanization in Myanmar. Energy Res. Soc. Sci. 2022, 85, 102432. [Google Scholar] [CrossRef]
- Liang, L.; Chen, M.; Lu, D. Revisiting the relationship between urbanization and economic development in China since the reform and opening-up. Chin. Geogr. Sci. 2022, 32, 1–15. [Google Scholar] [CrossRef]
- Schnidrig, J.; Cherkaoui, R.; Calisesi, Y.; Margni, M.; Maréchal, F. On the role of energy infrastructure in the energy transition. Case study of an energy independent and CO2 neutral energy system for Switzerland. Front. Energy Res. 2023, 11, 1164813. [Google Scholar] [CrossRef]
- Li, G.F.; Zhang, X.E. The Spatial-Temporal Characteristics and Driving Forces of the Coupled and Coordinated Development between New Urbanization and Rural Revitalization. Sustainability 2023, 15, 16487. [Google Scholar] [CrossRef]
- Jiang, C.; Li, J.; Liu, J. Does urbanization affect the gap between urban and rural areas? Evidence from China. Socio Econ. Plan. Sci. 2022, 82, 101271. [Google Scholar] [CrossRef]
- Wiegels, R.; Chapa, F.; Hack, J. High resolution modeling of the impact of urbanization and green infrastructure on the water and energy balance. Urban CLim. 2021, 39, 100961. [Google Scholar] [CrossRef]
- Cao, L.; Hu, P.; Li, X.; Sun, H.; Zhang, J.; Zhang, C. Digital technologies for net-zero energy transition: A preliminary study. Carbon Neutrality 2023, 2, 7. [Google Scholar] [CrossRef]
- Murshed, M.; Ahmed, Z.; Alam, M.S.; Mahmood, H.; Rehman, A.; Dagar, V. Reinvigorating the role of clean energy transition for achieving a low-carbon economy: Evidence from Bangladesh. Environ. Sci. Pollut. Res. 2021, 28, 67689–67710. [Google Scholar] [CrossRef]
- Zhu, J.; Lin, N.; Zhu, H.; Liu, X. Role of sharing economy in energy transition and sustainable economic development in China. J. Innov. Knowl. 2023, 8, 100314. [Google Scholar] [CrossRef]
- Chang, T.H.; Ma, K.M.; Chang, S.L. Towards green growth: Industry structure and energy transition in OECD countries. Energy Environ. 2024, 35, 833–847. [Google Scholar] [CrossRef]
- Luo, S.; Chishti, M.Z.; Beata, S.; Xie, P. Digital sparks for a greener future: Unleashing the potential of information and communication technologies in green energy transition. Renew. Energy 2024, 221, 119754. [Google Scholar] [CrossRef]
- Tinta, A.A.; Okoko, A.; Lankouande, E. From Light to Income: Solar PV Technology. J. Knowl. Econ. 2024, 15, 1–23. [Google Scholar] [CrossRef]
- Fang, C.; Zhao, W. Facilitating Chinese path to modernization through new-type urbanization and integrated urban-rural development. Econ. Geogr. 2023, 43, 10–16. [Google Scholar]
- Murshed, M.; Ozturk, I. Rethinking energy poverty reduction through improving electricity accessibility: A regional analysis on selected African nations. Energy 2023, 267, 126547. [Google Scholar] [CrossRef]
- Pingkuo, L.; Huan, P. What drives the green and low-carbon energy transition in China? An empirical analysis based on a novel framework. Energy 2022, 239, 122450. [Google Scholar] [CrossRef]
- National Bureau of Statistics. China Statistical Yearbook; China Statistics Press: Beijing, China, 2014. [Google Scholar]
- National Bureau of Statistics. China Statistical Yearbook; China Statistics Press: Beijing, China, 2015. [Google Scholar]
- National Bureau of Statistics. China Statistical Yearbook; China Statistics Press: Beijing, China, 2016. [Google Scholar]
- National Bureau of Statistics. China Statistical Yearbook; China Statistics Press: Beijing, China, 2017. [Google Scholar]
- National Bureau of Statistics. China Statistical Yearbook; China Statistics Press: Beijing, China, 2018. [Google Scholar]
- National Bureau of Statistics. China Statistical Yearbook; China Statistics Press: Beijing, China, 2019. [Google Scholar]
- National Bureau of Statistics. China Statistical Yearbook; China Statistics Press: Beijing, China, 2020. [Google Scholar]
- National Bureau of Statistics. China Statistical Yearbook; China Statistics Press: Beijing, China, 2021. [Google Scholar]
- National Bureau of Statistics. China Statistical Yearbook; China Statistics Press: Beijing, China, 2022. [Google Scholar]
- National Bureau of Statistics. China Statistical Yearbook; China Statistics Press: Beijing, China, 2023. [Google Scholar]
- Department of Energy Statistics of National Bureau of Statistics. China Energy Statistical Yearbook; China Statistics Press: Beijing, China, 2014. [Google Scholar]
- Department of Energy Statistics of National Bureau of Statistics. China Energy Statistical Yearbook; China Statistics Press: Beijing, China, 2015. [Google Scholar]
- Department of Energy Statistics of National Bureau of Statistics. China Energy Statistical Yearbook; China Statistics Press: Beijing, China, 2016. [Google Scholar]
- Department of Energy Statistics of National Bureau of Statistics. China Energy Statistical Yearbook; China Statistics Press: Beijing, China, 2017. [Google Scholar]
- Department of Energy Statistics of National Bureau of Statistics. China Energy Statistical Yearbook; China Statistics Press: Beijing, China, 2018. [Google Scholar]
- Department of Energy Statistics of National Bureau of Statistics. China Energy Statistical Yearbook; China Statistics Press: Beijing, China, 2019. [Google Scholar]
- Department of Energy Statistics of National Bureau of Statistics. China Energy Statistical Yearbook; China Statistics Press: Beijing, China, 2020. [Google Scholar]
- Department of Energy Statistics of National Bureau of Statistics. China Energy Statistical Yearbook; China Statistics Press: Beijing, China, 2021. [Google Scholar]
- Department of Energy Statistics of National Bureau of Statistics. China Energy Statistical Yearbook; China Statistics Press: Beijing, China, 2022. [Google Scholar]
- Department of Energy Statistics of National Bureau of Statistics. China Energy Statistical Yearbook; China Statistics Press: Beijing, China, 2023. [Google Scholar]
- Department of Ecology and Environment of National Bureau of Statistics. China Statistical Yearbook on Environment; China Statistics Press: Beijing, China, 2014. [Google Scholar]
- Department of Ecology and Environment of National Bureau of Statistics. China Statistical Yearbook on Environment; China Statistics Press: Beijing, China, 2015. [Google Scholar]
- Department of Ecology and Environment of National Bureau of Statistics. China Statistical Yearbook on Environment; China Statistics Press: Beijing, China, 2016. [Google Scholar]
- Department of Ecology and Environment of National Bureau of Statistics. China Statistical Yearbook on Environment; China Statistics Press: Beijing, China, 2017. [Google Scholar]
- Department of Ecology and Environment of National Bureau of Statistics. China Statistical Yearbook on Environment; China Statistics Press: Beijing, China, 2018. [Google Scholar]
- Department of Ecology and Environment of National Bureau of Statistics. China Statistical Yearbook on Environment; China Statistics Press: Beijing, China, 2019. [Google Scholar]
- Department of Ecology and Environment of National Bureau of Statistics. China Statistical Yearbook on Environment; China Statistics Press: Beijing, China, 2020. [Google Scholar]
- Department of Ecology and Environment of National Bureau of Statistics. China Statistical Yearbook on Environment; China Statistics Press: Beijing, China, 2021. [Google Scholar]
- Department of Ecology and Environment of National Bureau of Statistics. China Statistical Yearbook on Environment; China Statistics Press: Beijing, China, 2022. [Google Scholar]
- Department of Ecology and Environment of National Bureau of Statistics. China Statistical Yearbook on Environment; China Statistics Press: Beijing, China, 2023. [Google Scholar]
- Zhang, R.; Bao, Q. Evolutionary characteristics, regional differences and spatial effects of coupled coordination of rural revitalization, new-type urbanization and ecological environment in China. Front. Environ. Sci. 2024, 12, 1510867. [Google Scholar] [CrossRef]
- Liu, Y.; Yang, R.; Sun, M.; Zhang, L.; Li, X.; Meng, L.; Wang, Y.; Liu, Q. Regional sustainable development strategy based on the coordination between ecology and economy: A case study of Sichuan Province, China. Ecol. Indic. 2022, 134, 108445. [Google Scholar] [CrossRef]
- Liu, S.C.; Wu, P.J. Coupling coordination analysis of urbanization and energy eco-efficiency: A case study on the Yangtze River Delta Urban Agglomeration. Environ. Sci. Pollut. Res. Int. 2023, 30, 63975–63990. [Google Scholar] [CrossRef]
- Xu, X.Y.; Tian, X.X. Dynamic Evolution and Trend Prediction in Coupling Coordination between Energy Consumption and Green Development in China. Sustainability 2023, 15, 13885. [Google Scholar] [CrossRef]
- Dagum, C. A new approach to the decomposition of the Gini income inequality ratio. Empir. Econ. 1997, 22, 515–531. [Google Scholar] [CrossRef]
- LeSage, J.P. Bayesian estimation of spatial autoregressive models. Int. Reg. Sci. Rev. 1997, 20, 113–129. [Google Scholar] [CrossRef]
Disclaimer/Publisher’s Note: The statements, opinions and data contained in all publications are solely those of the individual author(s) and contributor(s) and not of MDPI and/or the editor(s). MDPI and/or the editor(s) disclaim responsibility for any injury to people or property resulting from any ideas, methods, instructions or products referred to in the content. |
© 2025 by the authors. Licensee MDPI, Basel, Switzerland. This article is an open access article distributed under the terms and conditions of the Creative Commons Attribution (CC BY) license (https://creativecommons.org/licenses/by/4.0/).