
Balancing Act on the Third Pole: Three Decades of Ecological-Economic Synergy and Emerging Disparities Along the Qinghai–Tibet Railway, China


Abstract
1. Introduction
2. Literature Review
3. Materials and Methods
3.1. Study Area
3.2. Improved Ecosystem Services Value Assessment
3.3. Ecological-Economic Coordination Analysis
3.4. Data
4. Results
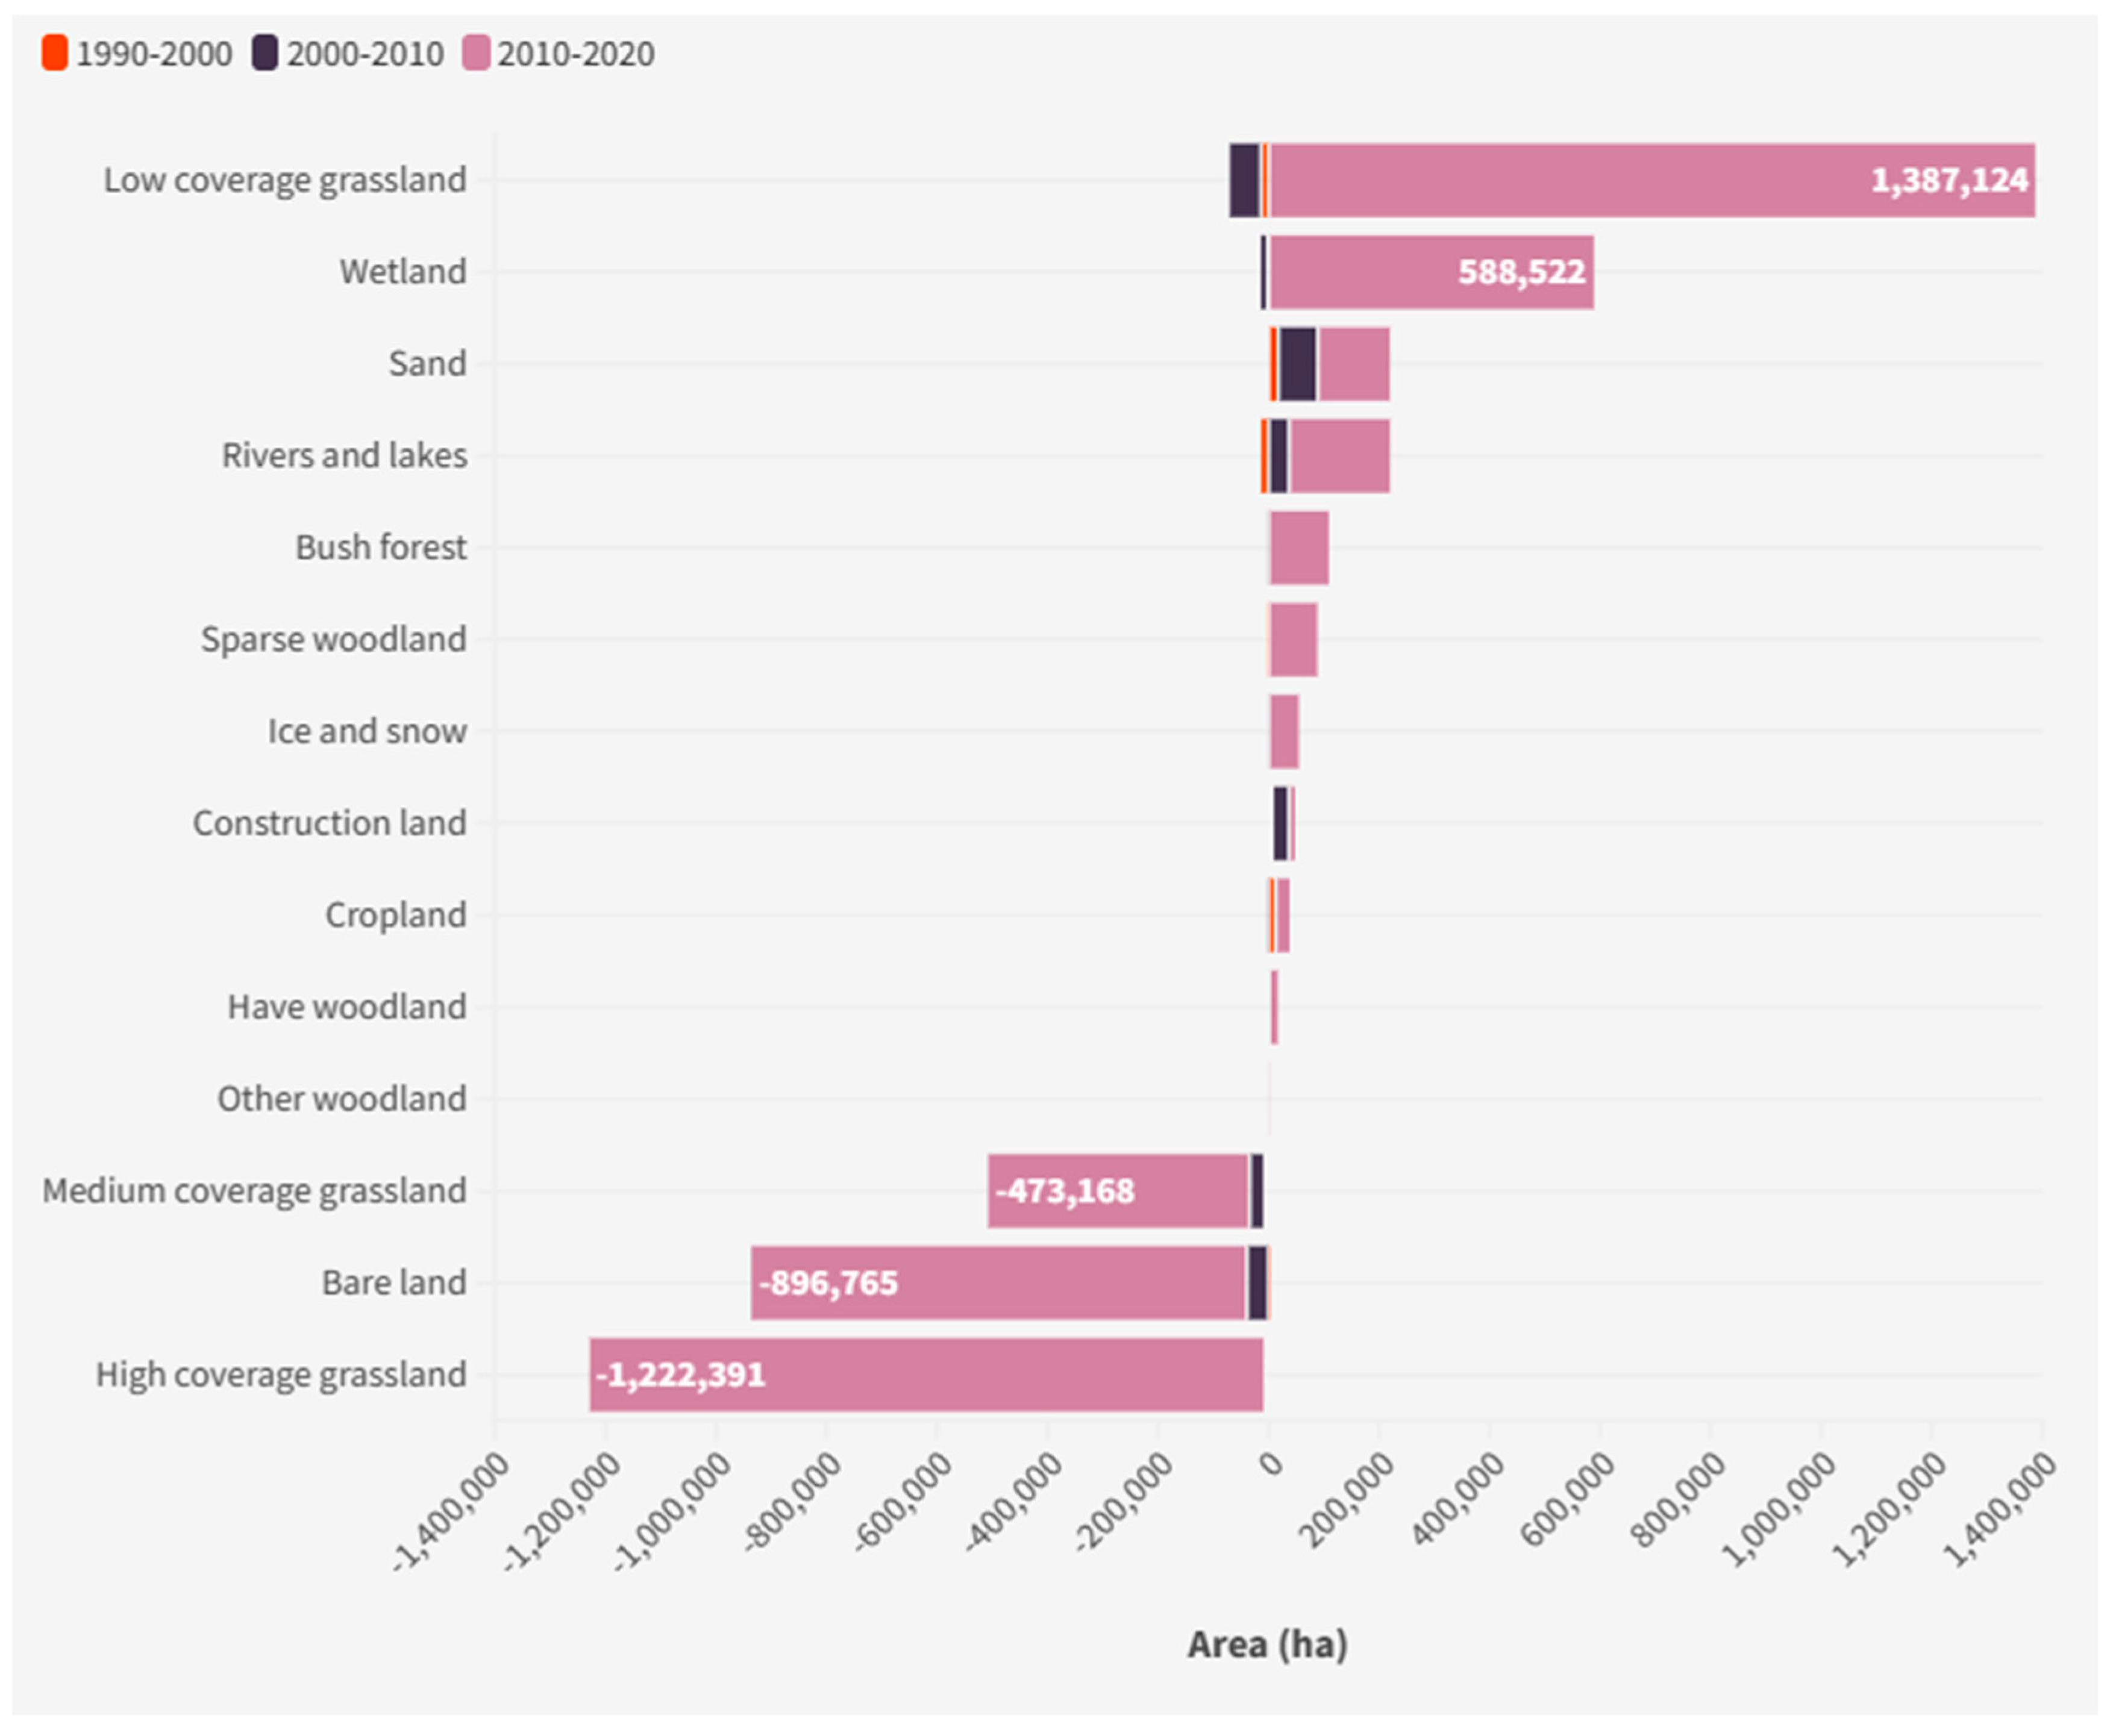
4.1. LUC Change
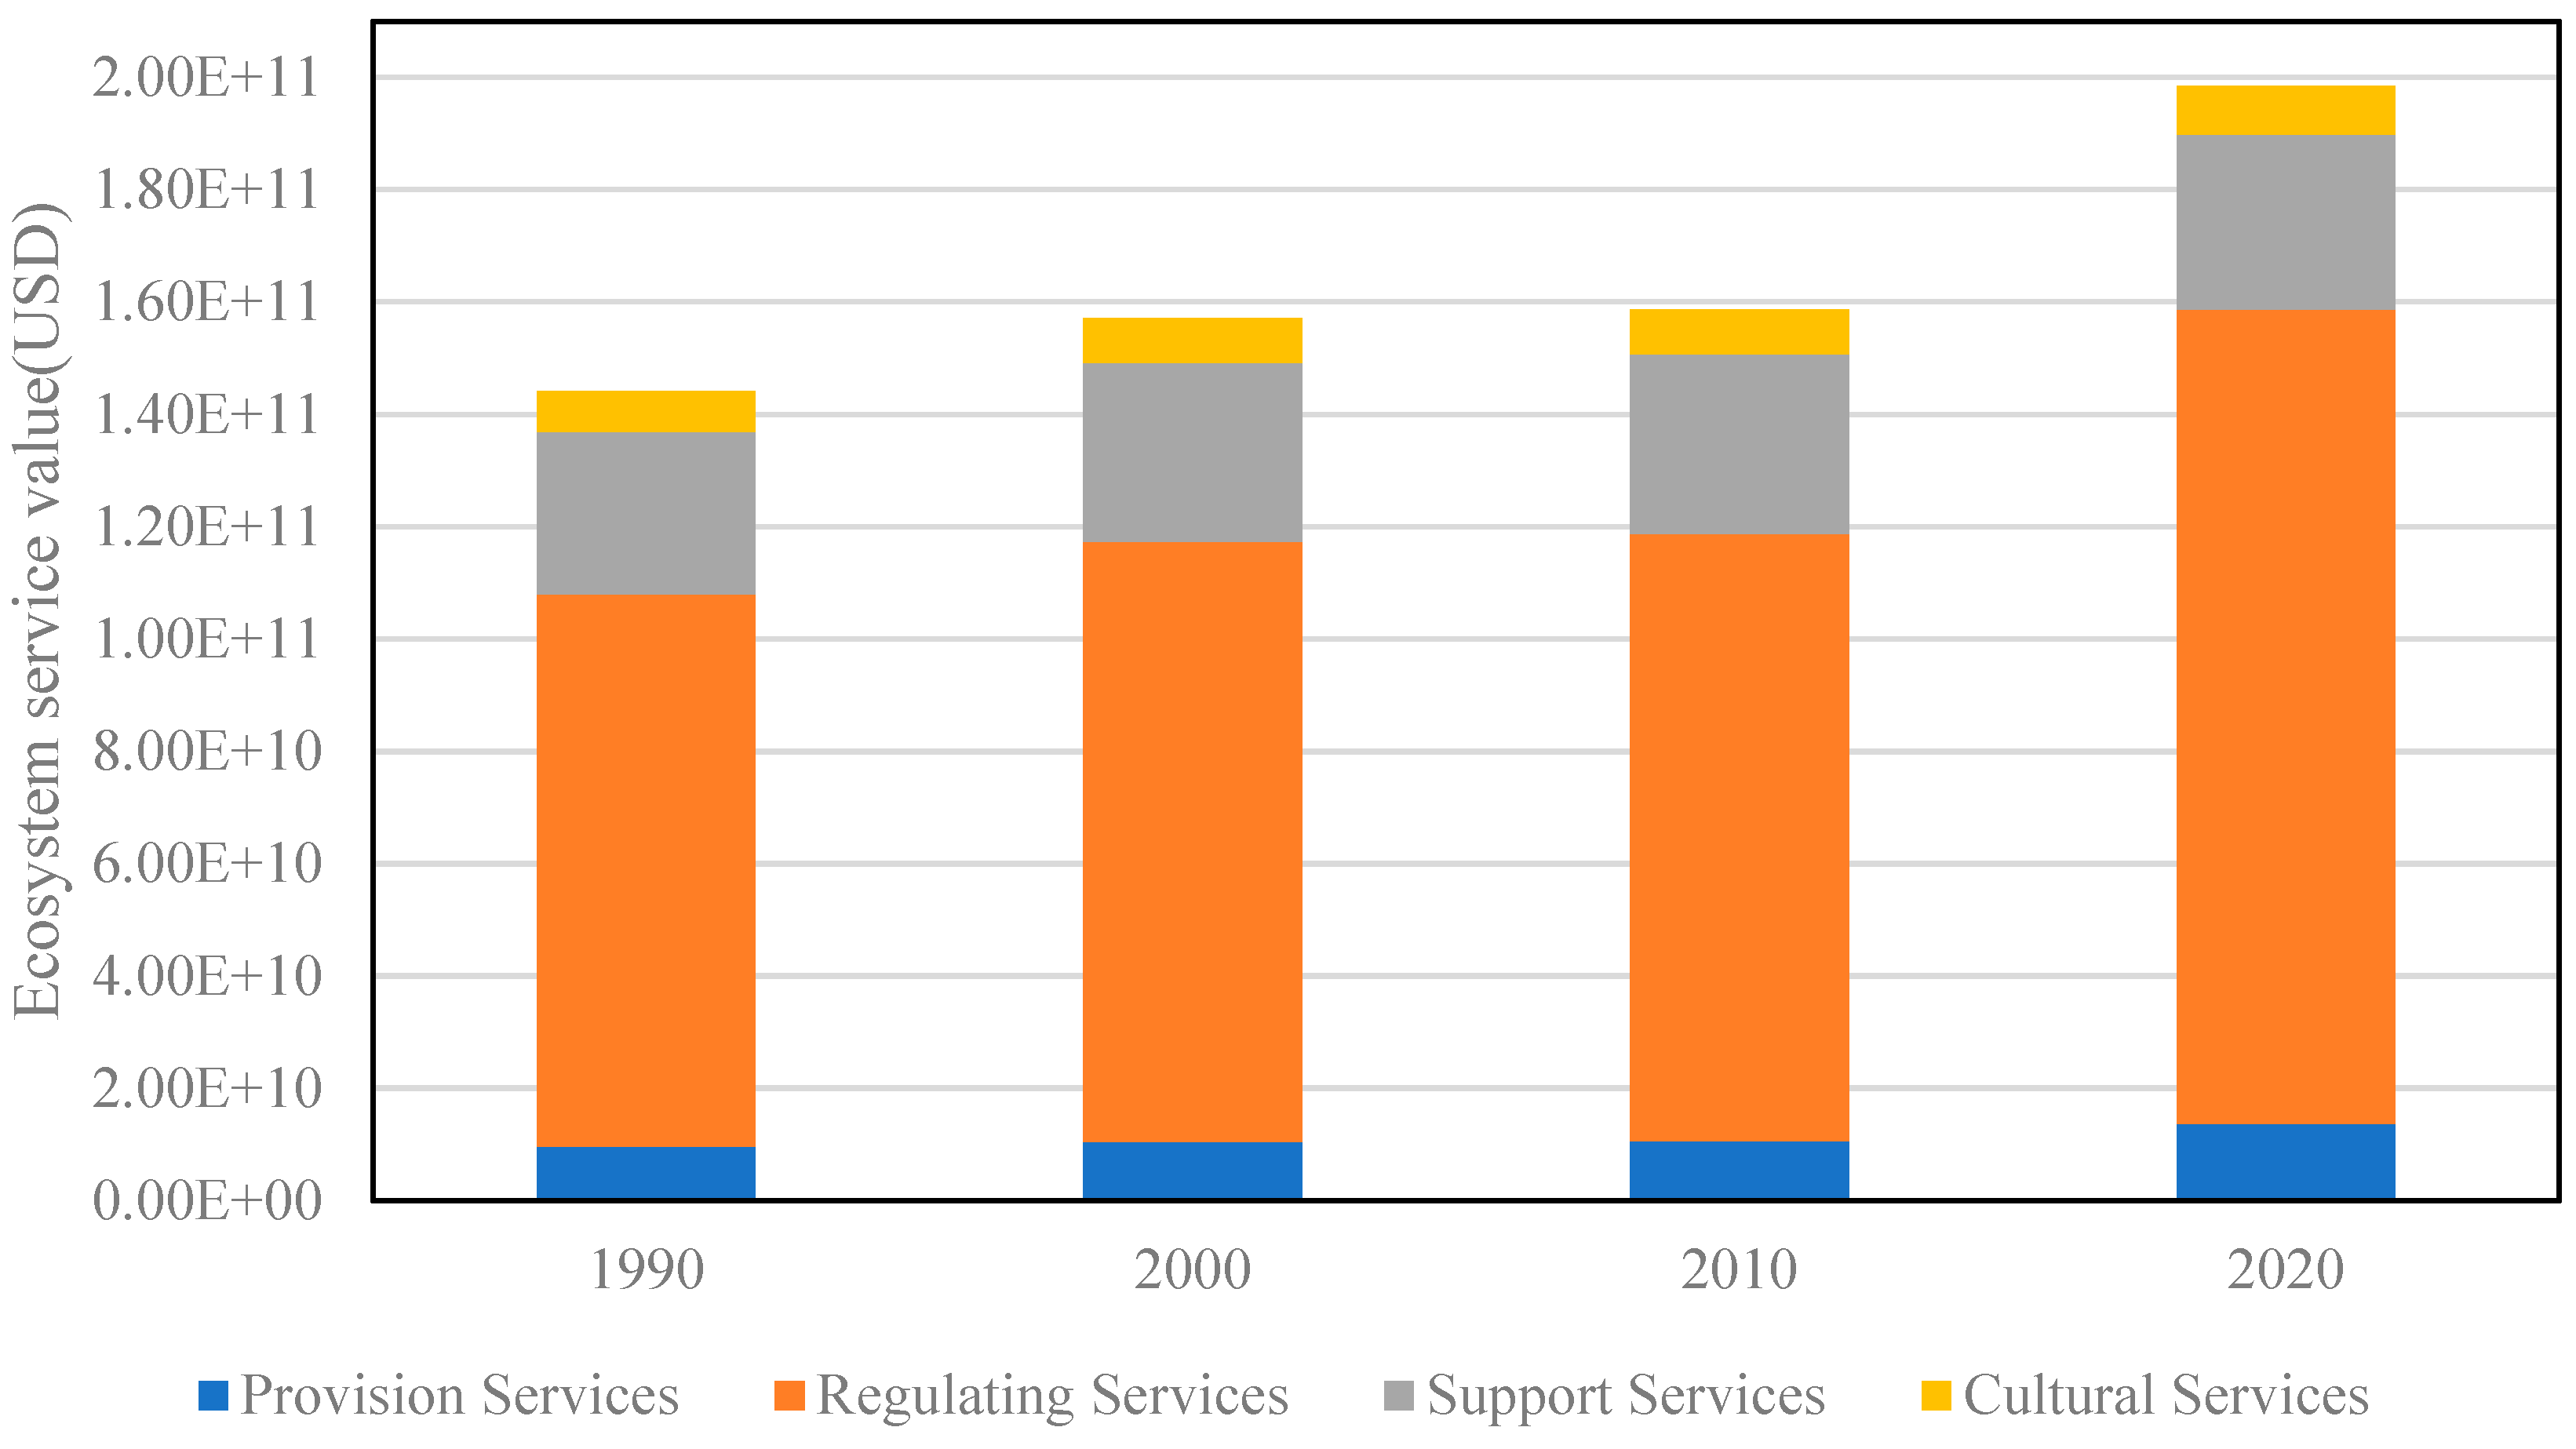
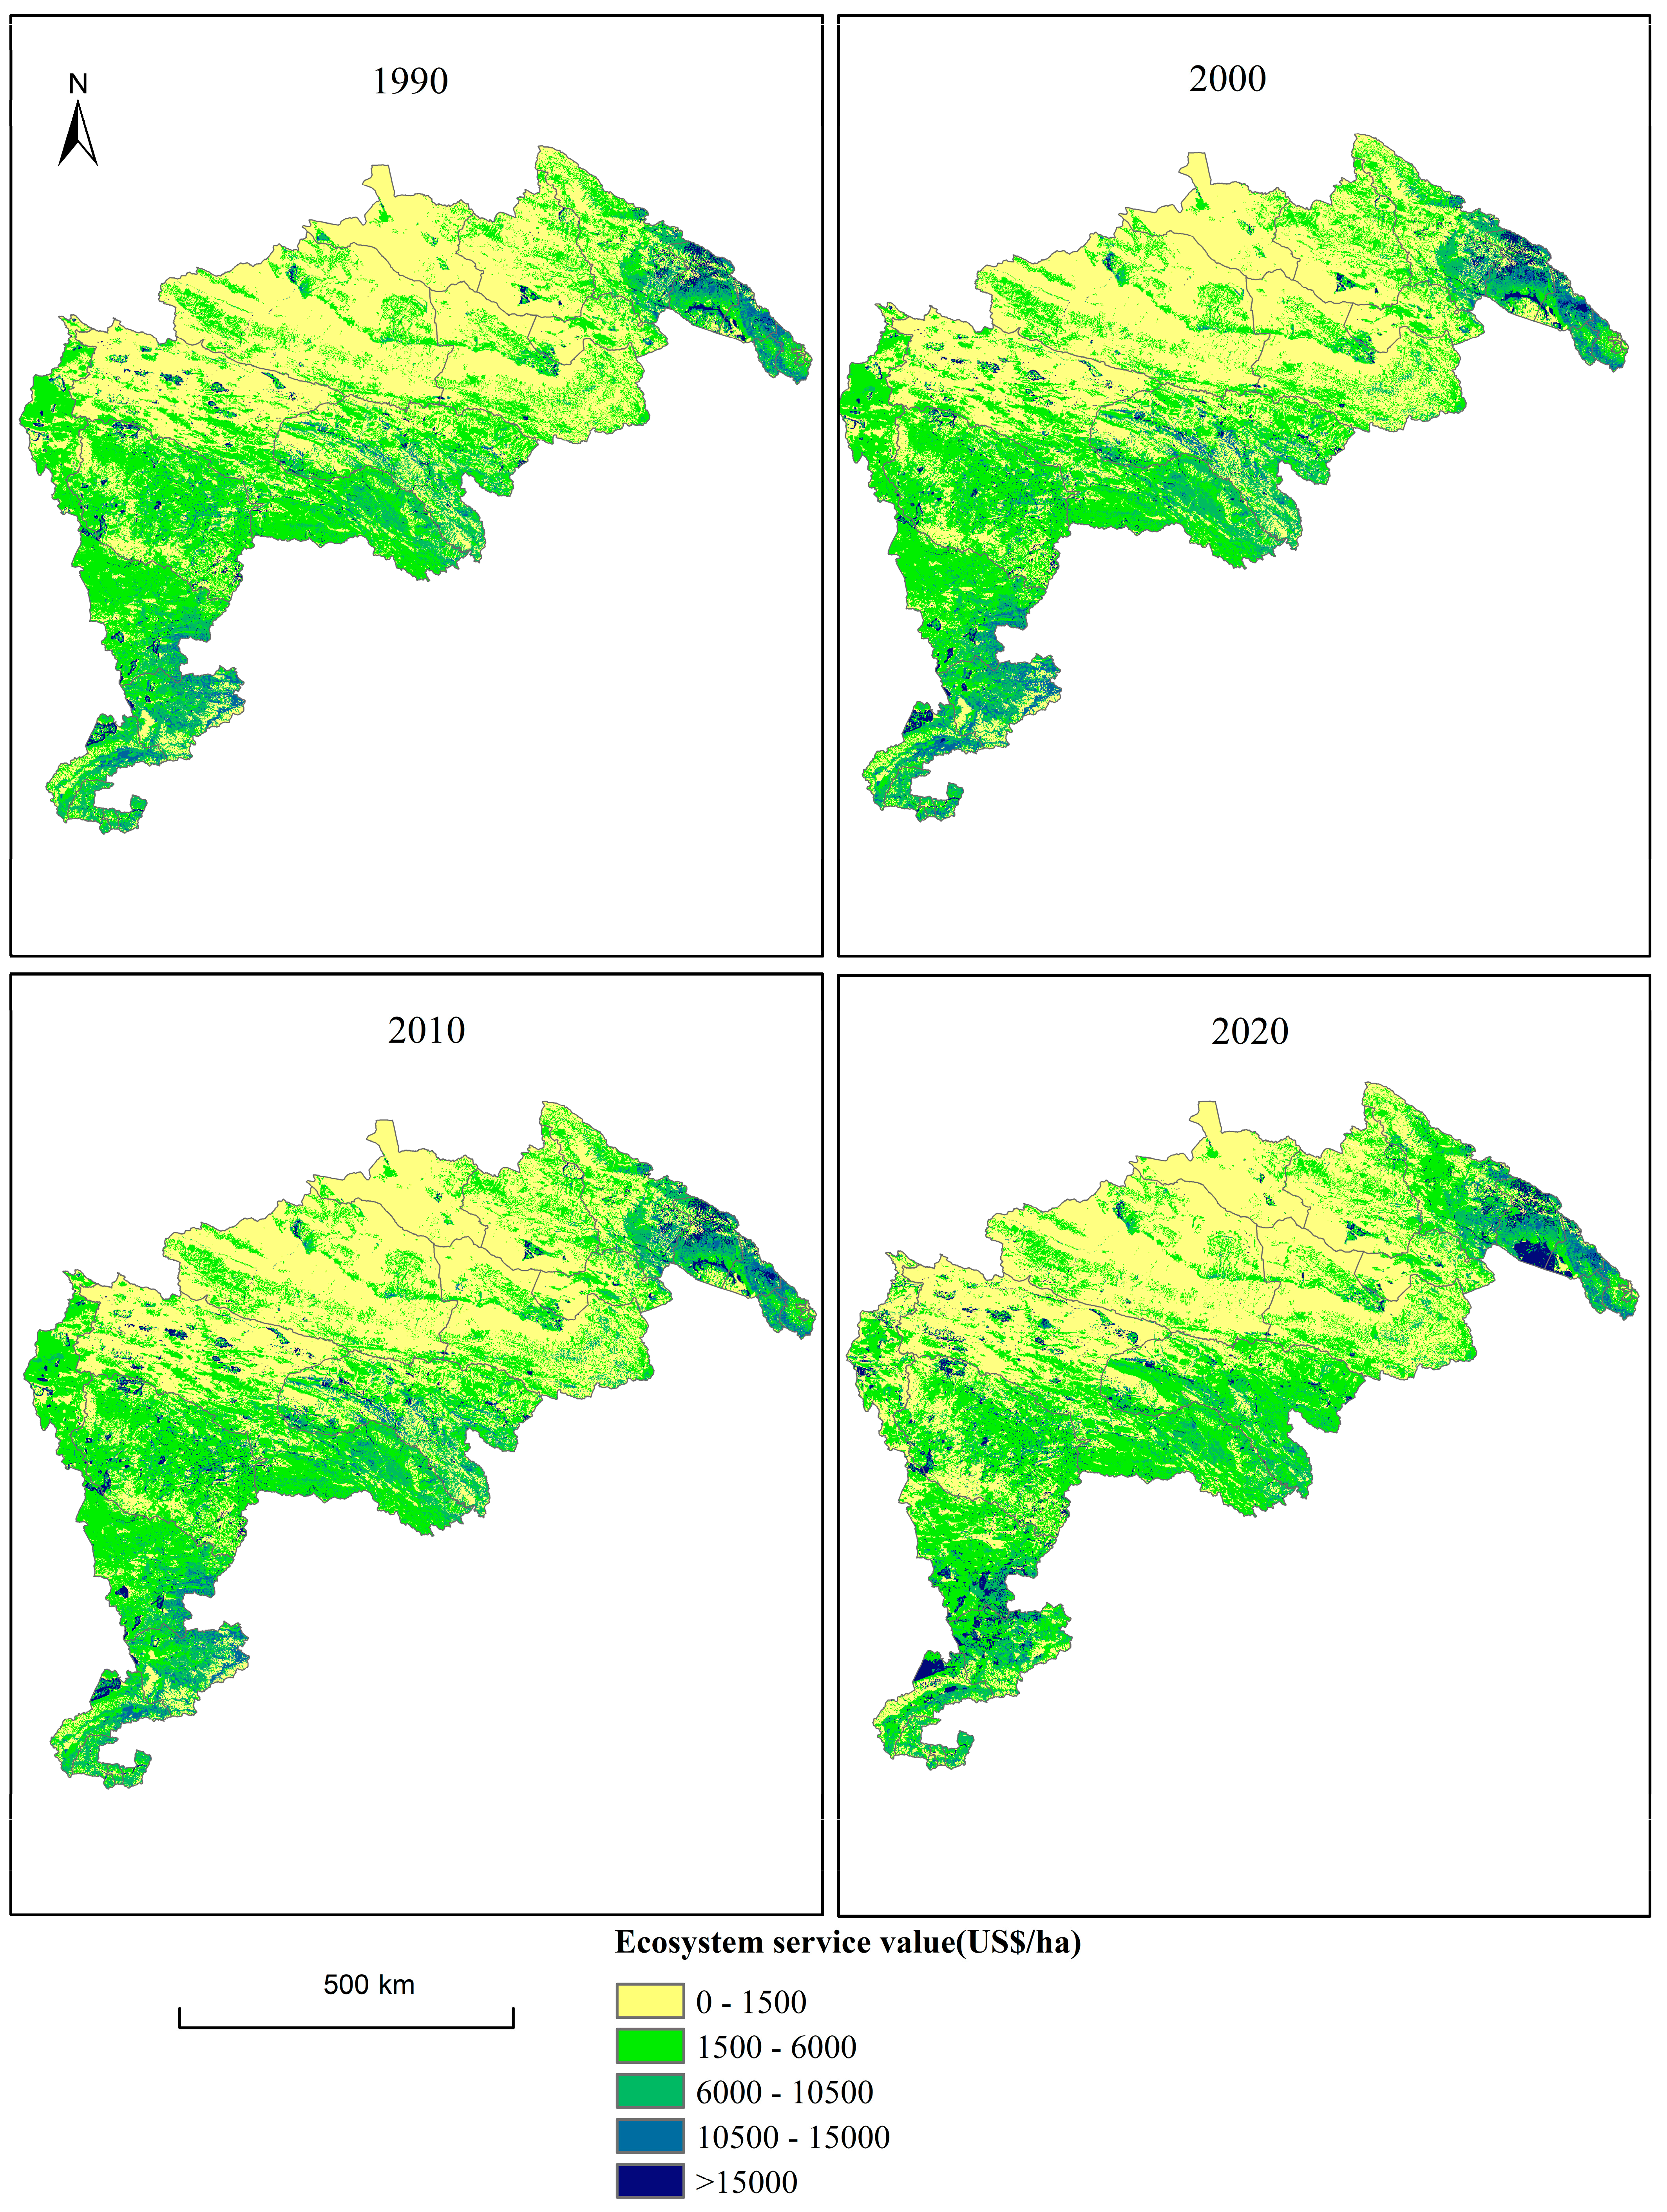
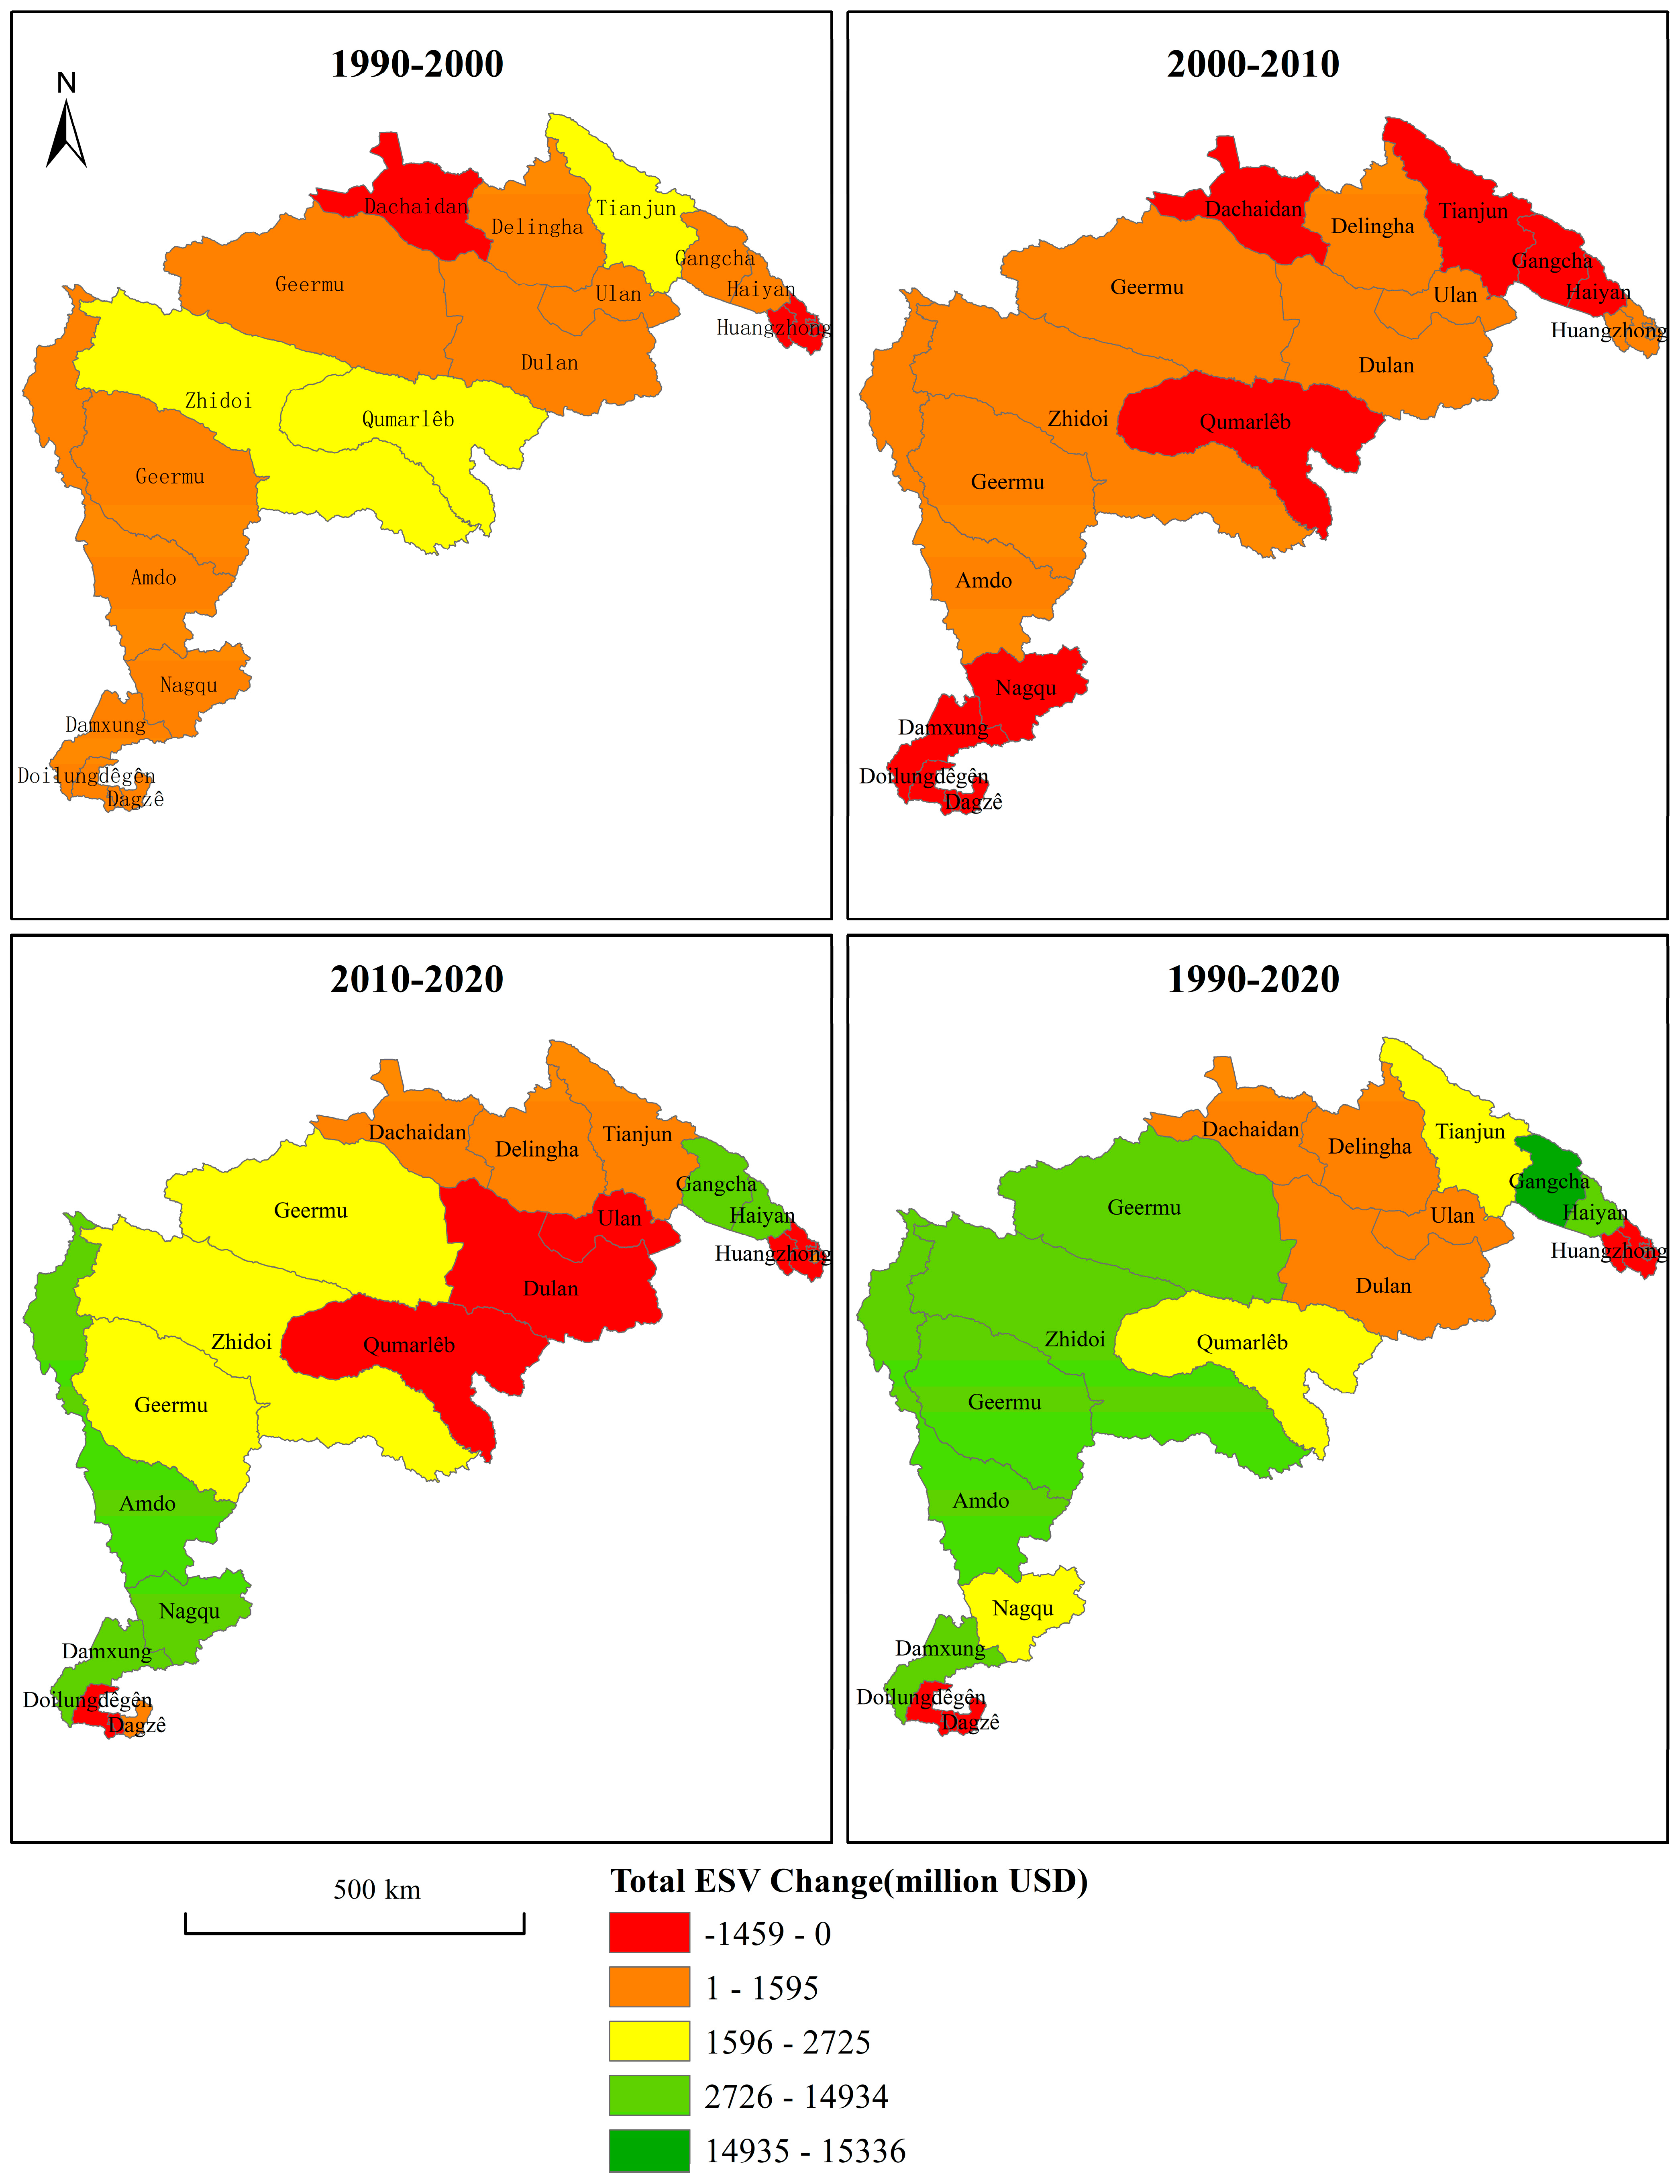
4.2. Spatial-Temporal Evolution of ESV
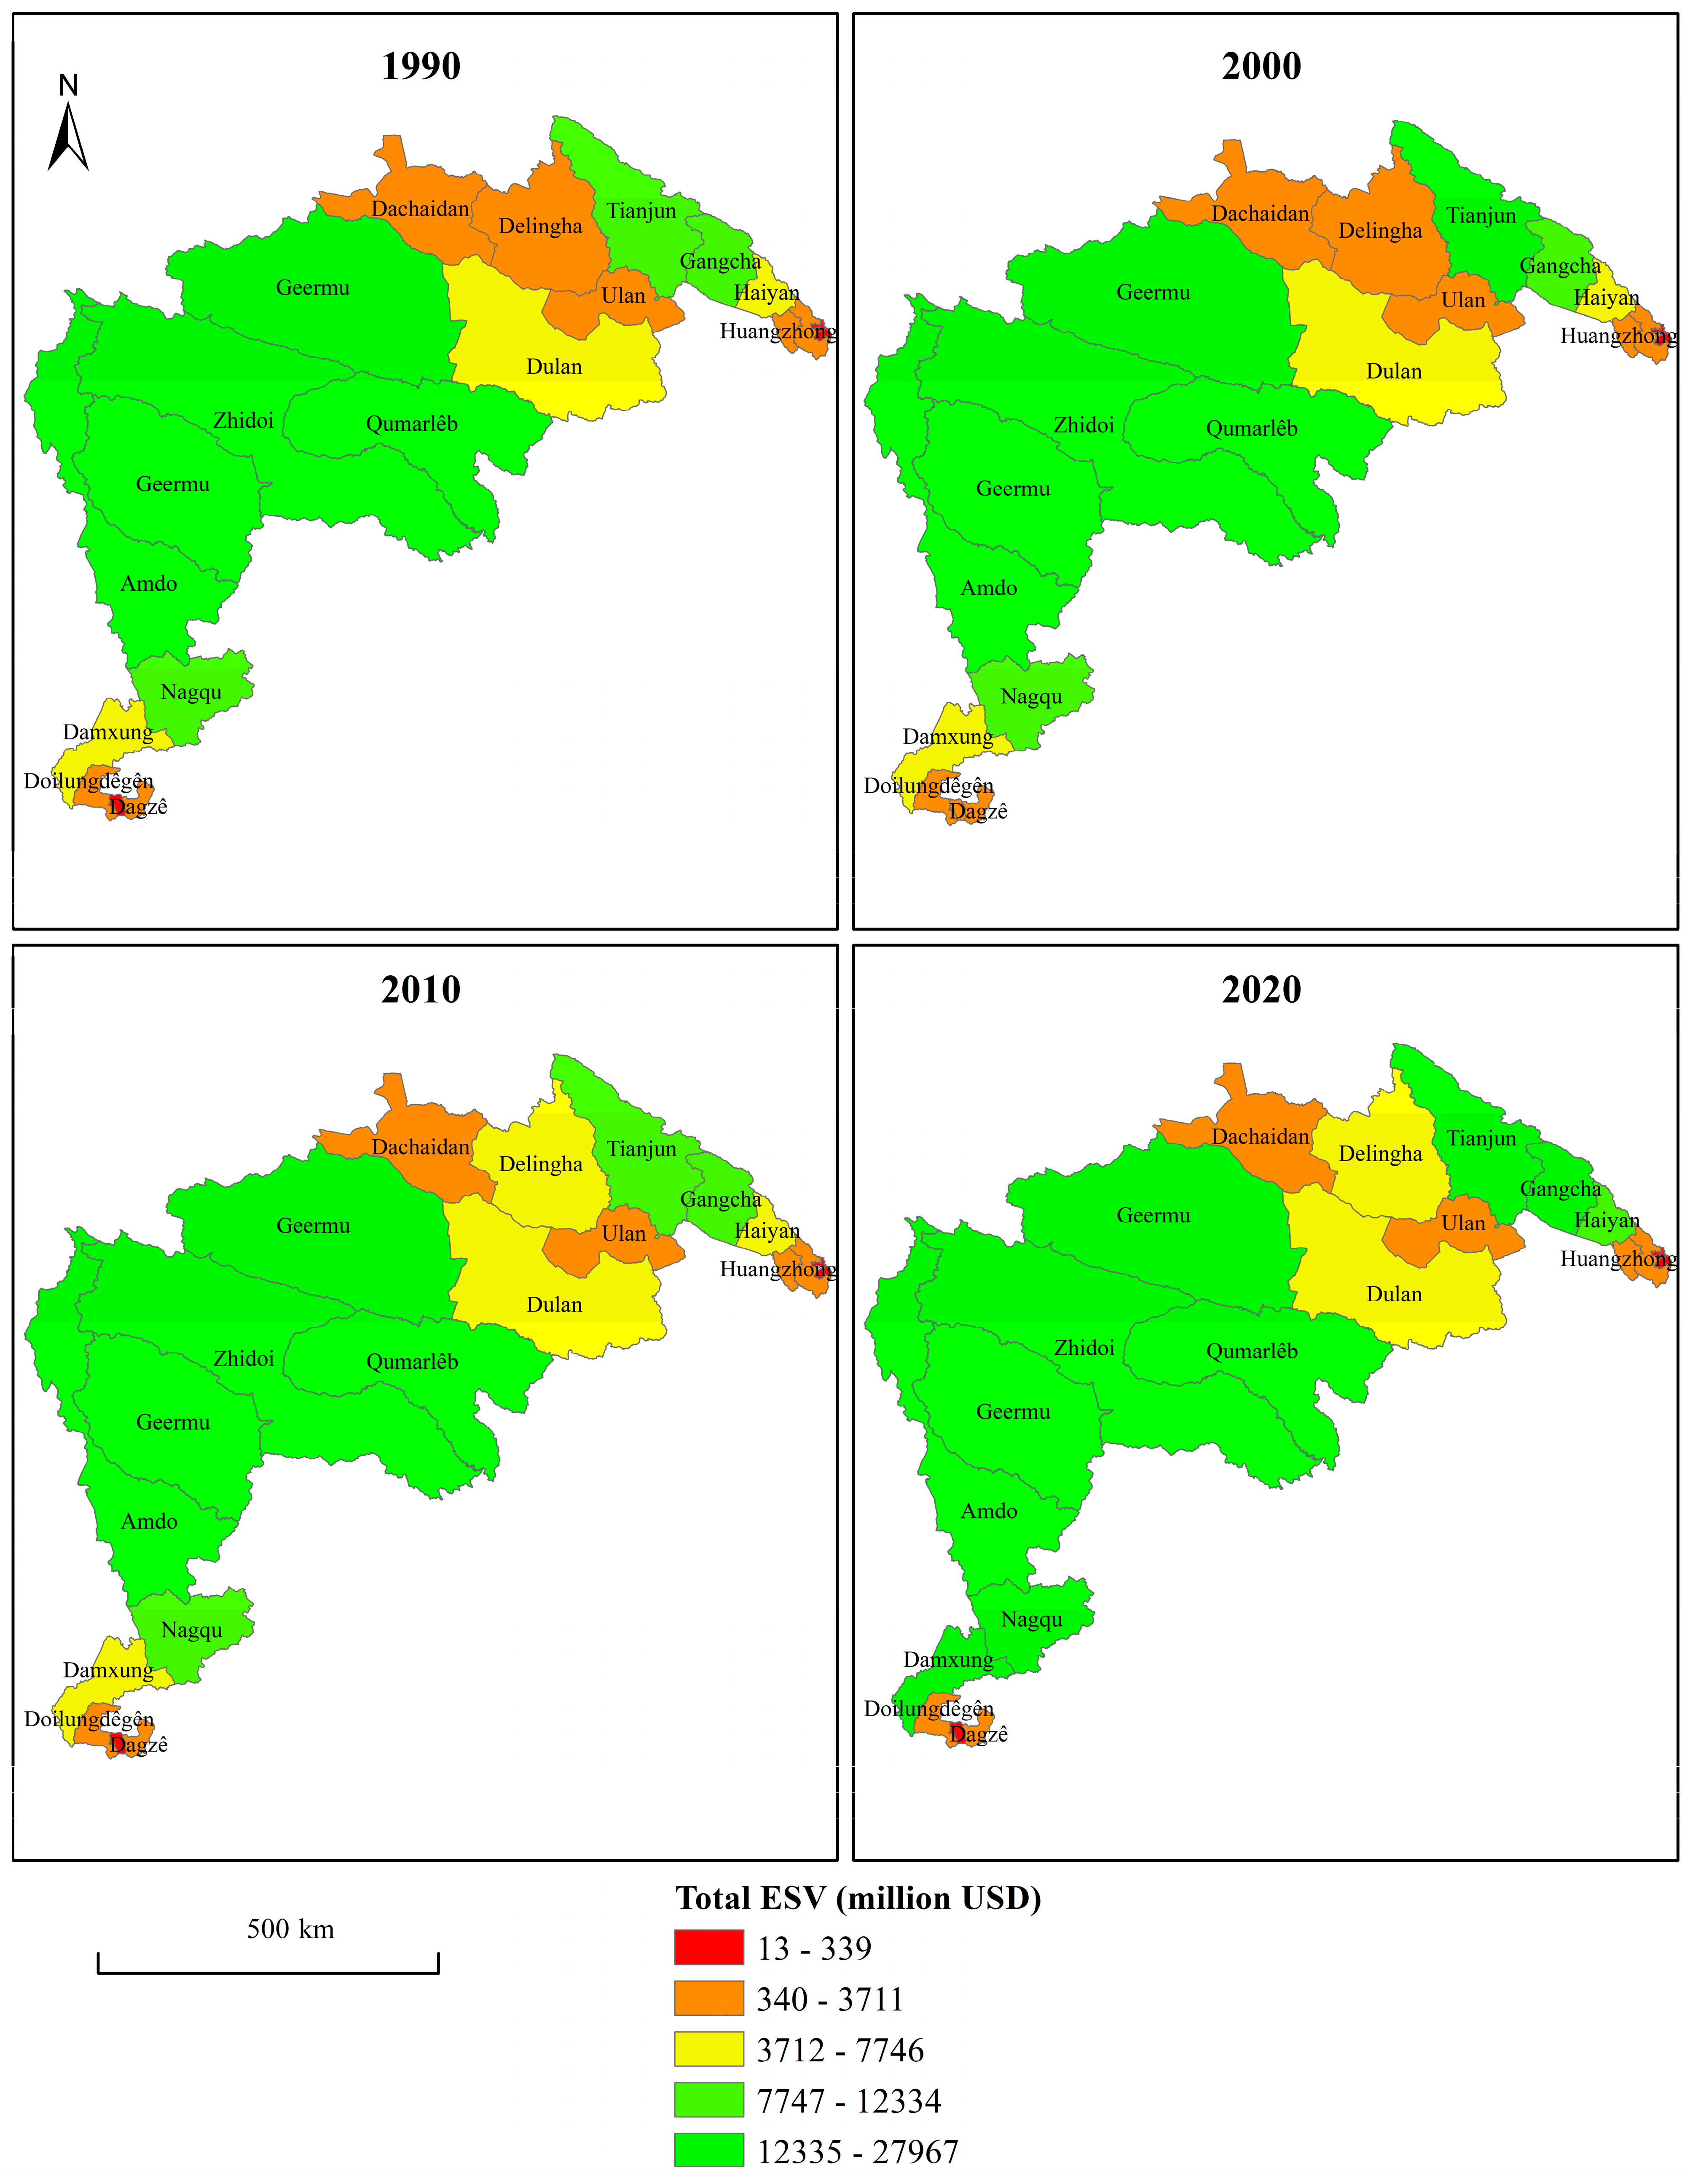
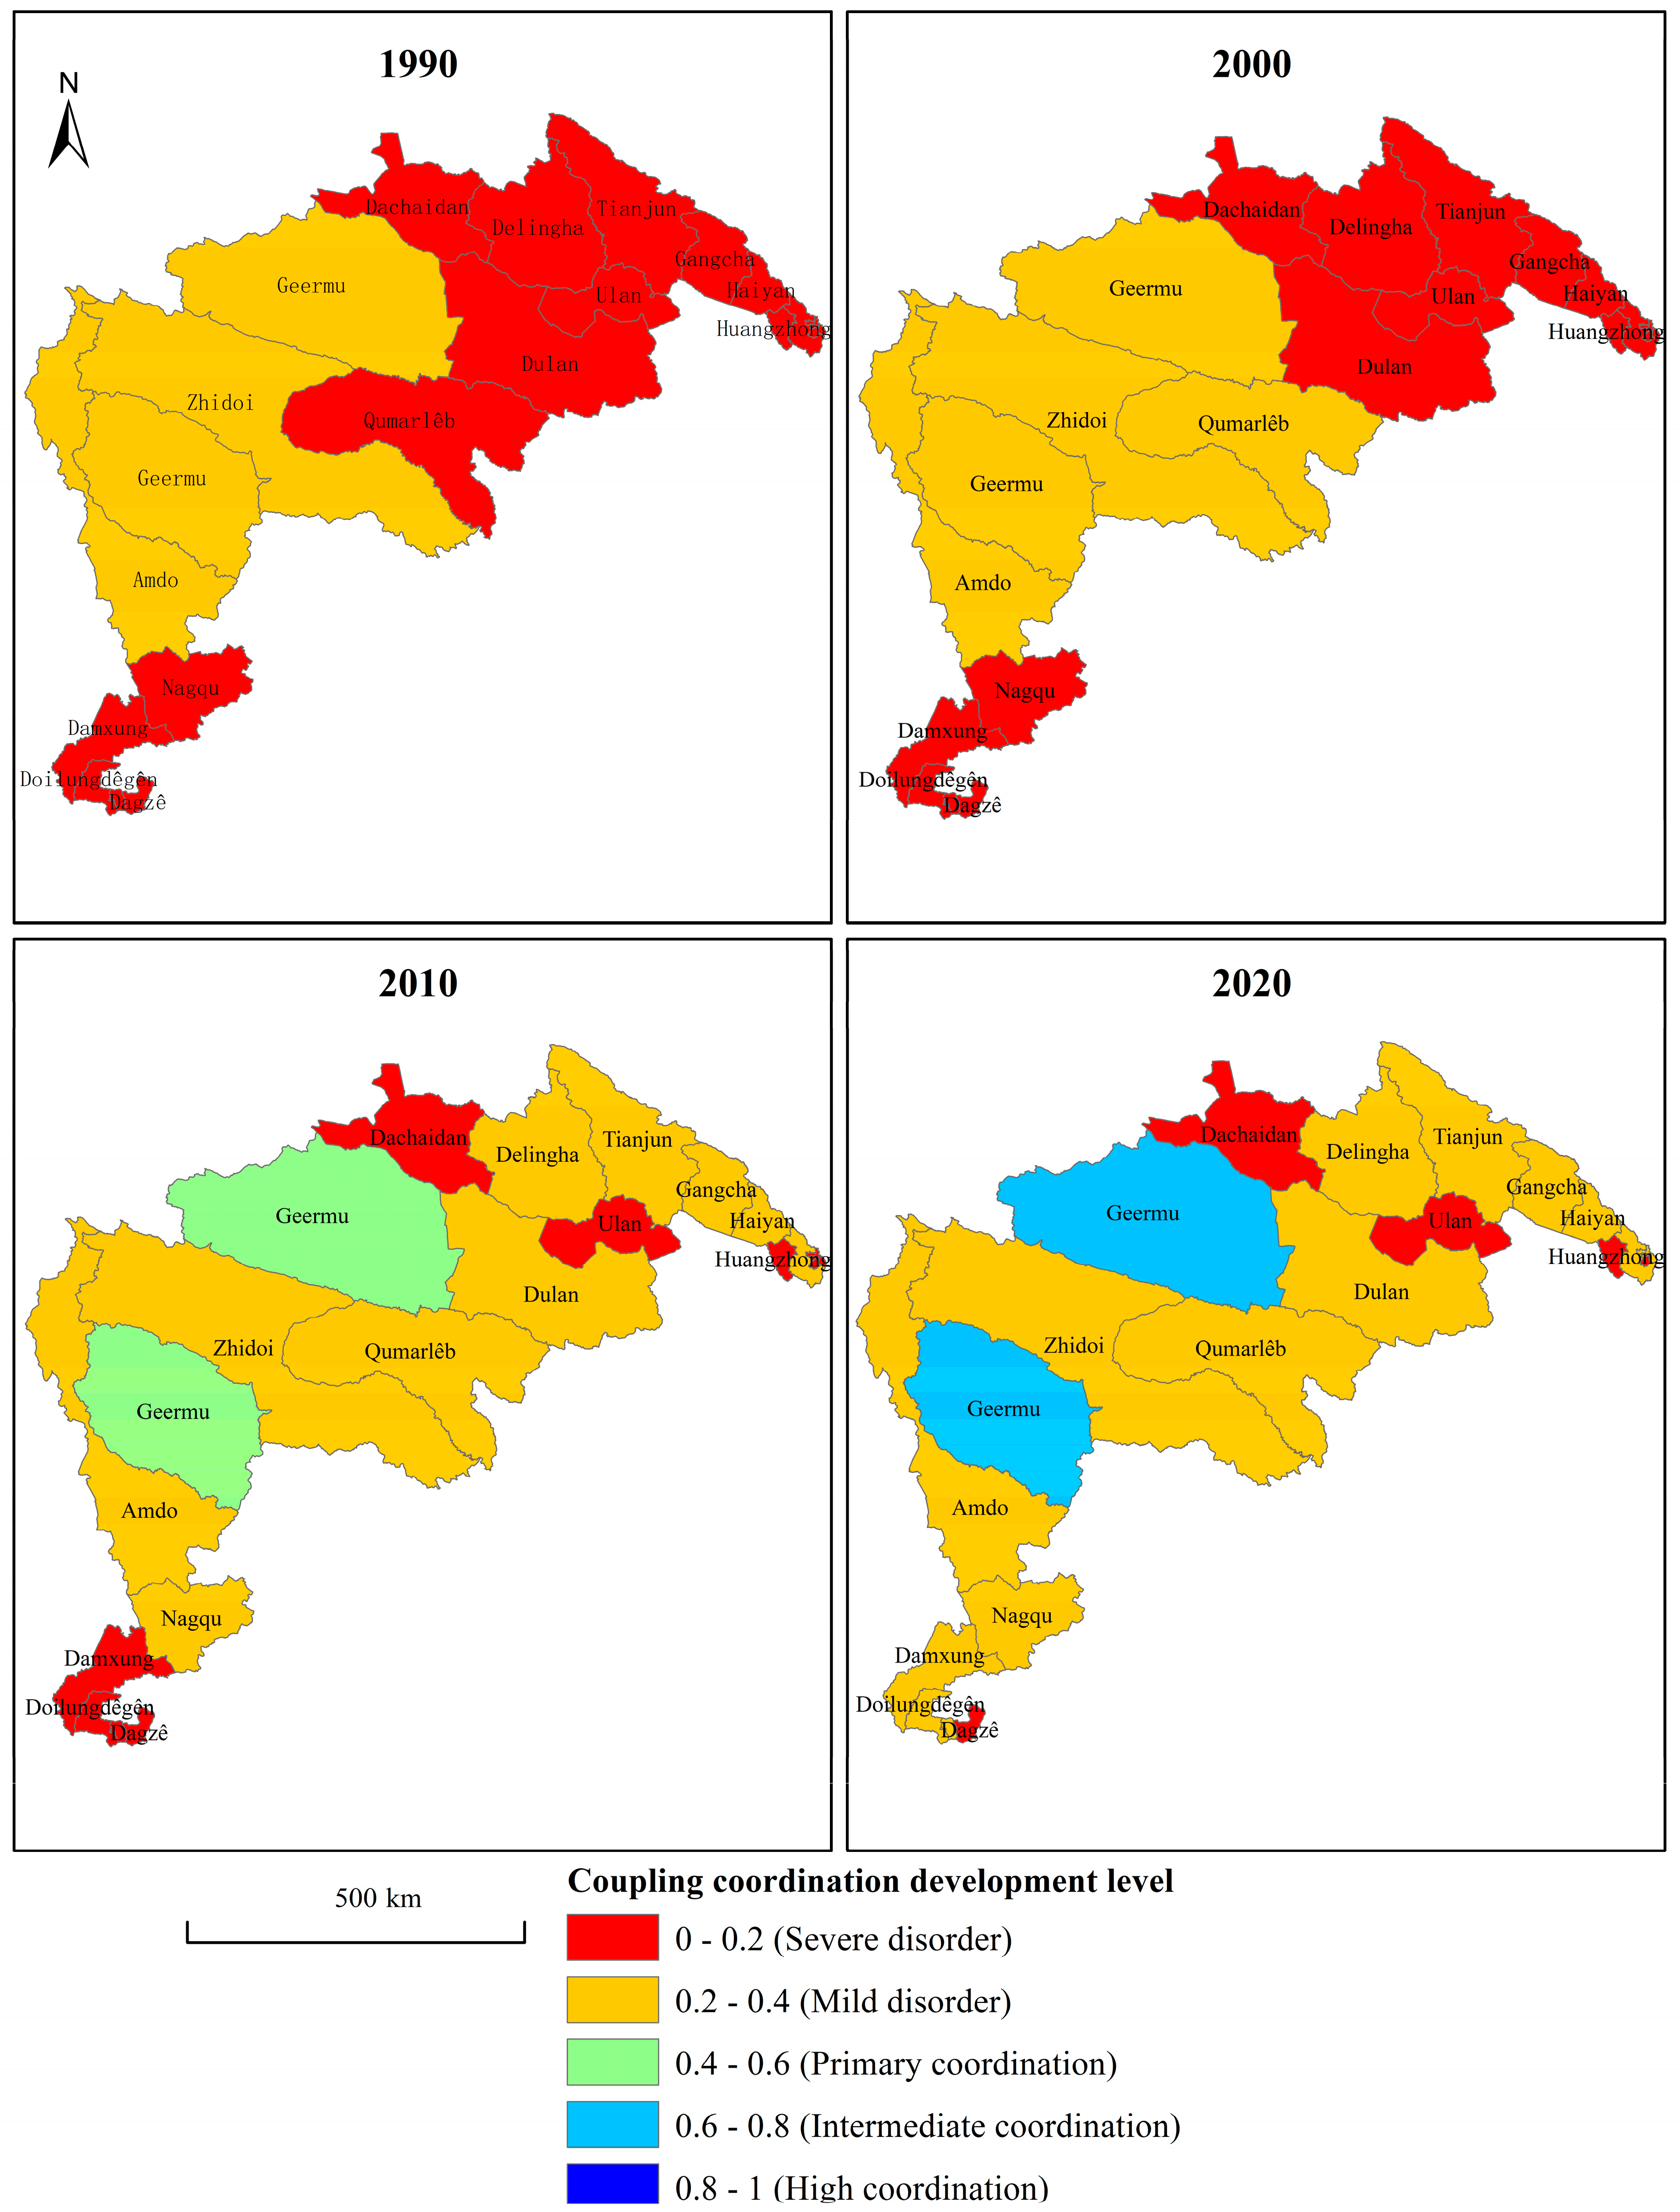
4.3. Coordination Development Between Eco-Environment and Economy
5. Discussion and Policy Implications
5.1. Discussion
5.2. Policy Implications
6. Conclusions
- The ecosystem service value (ESV) in the Qinghai–Tibet Railway Region (QTRR) increased significantly from 1.44 × 10¹¹ to 1.98 × 10¹¹ USD between 1990 and 2020, with grasslands contributing the largest share (42.45%) and regulating services accounting for 73.03% of the total ESV in 2020.
- The 11 categories of ESV exhibited distinct trends during this period: hydrological regulation and water provision showed the highest growth, while nutrient cycling and material provision experienced lower increases.
- Spatially, ESV per unit area was generally lower in the middle and higher areas along the edges, with the highest values concentrated in the southwest and northeast regions of the QTRR.
- Ecological-economic coordination has improved across all counties, with Geermu advancing to the intermediate coordination stage. However, the overall coordination level remains low, and economic growth still exerts pressure on the ecological system, posing sustainability challenges.
- While the overall ESV has increased, this growth is primarily driven by the expansion of water bodies rather than broad improvements in ecosystem health. Grassland degradation and land desertification remain major ecological concerns.
- Effective ecological restoration and grassland protection policies must be reinforced to enhance degraded grassland ecosystems and sustain ecosystem service capacity.
- Comprehensive management strategies are required to mitigate the impact of grassland degradation, including limiting overgrazing, enhancing natural grassland protection, and adopting sustainable animal husbandry practices.
- A multi-faceted approach integrating desertification control, grazing regulation, and grassland conservation is essential to halt degradation and ensure long-term ecological stability in the QTRR.
Supplementary Materials
Author Contributions
Funding
Institutional Review Board Statement
Informed Consent Statement
Data Availability Statement
Conflicts of Interest
Abbreviations
| LUC | Land use/cover |
| ESV | Ecosystem service value |
| QTP | Qinghai–Tibet Plateau |
| NDVI | Normalized Difference Vegetation Index |
| QTR | Qinghai–Tibet Railway |
| QTRR | Qinghai–Tibet Railway Region |
Appendix A

| LUC | Provision Services | Regulating Services | Support Services | Cultural Services | |||||||
|---|---|---|---|---|---|---|---|---|---|---|---|
| Food Supply | Materials Supply | Water Supply | Gas Regulation | Climate Regulation | Waste Treatment | Hydrological Regulation | Erosion Prevention | Nutrient Cycling | Habitat Services | Cultural and Amenity Services | |
| Cropland | 0.85 | 0.40 | 0.02 | 0.67 | 0.36 | 0.10 | 0.27 | 1.03 | 0.12 | 0.13 | 0.06 |
| Have woodland | 0.29 | 0.66 | 0.34 | 2.17 | 6.50 | 1.93 | 4.74 | 2.65 | 0.20 | 2.41 | 1.06 |
| Bush forest | 0.31 | 0.71 | 0.37 | 2.35 | 7.03 | 1.99 | 3.51 | 2.86 | 0.22 | 2.60 | 1.14 |
| Sparse woodland | 0.22 | 0.52 | 0.27 | 1.70 | 5.07 | 1.49 | 3.34 | 2.06 | 0.16 | 1.88 | 0.82 |
| Other woodland | 0.19 | 0.43 | 0.22 | 1.41 | 4.23 | 1.28 | 3.35 | 1.72 | 0.13 | 1.57 | 0.69 |
| High coverage grassland | 0.38 | 0.56 | 0.31 | 1.97 | 5.21 | 1.72 | 3.82 | 2.40 | 0.18 | 2.18 | 0.96 |
| Medium coverage grassland | 0.22 | 0.33 | 0.18 | 1.14 | 3.02 | 1.00 | 2.21 | 1.39 | 0.11 | 1.27 | 0.56 |
| Low coverage grassland | 0.10 | 0.14 | 0.08 | 0.51 | 1.34 | 0.44 | 0.98 | 0.62 | 0.05 | 0.56 | 0.25 |
| Rivers and lakes | 0.80 | 0.23 | 8.29 | 0.77 | 2.29 | 5.55 | 102.24 | 0.93 | 0.07 | 2.55 | 1.89 |
| Ice and snow | 0.00 | 0.00 | 2.16 | 0.18 | 0.54 | 0.16 | 7.13 | 0.00 | 0.00 | 0.01 | 0.09 |
| Wetland | 0.51 | 0.50 | 2.59 | 1.90 | 3.60 | 3.60 | 24.23 | 2.31 | 0.18 | 7.87 | 4.73 |
| Sand | 0.01 | 0.03 | 0.02 | 0.11 | 0.10 | 0.31 | 0.21 | 0.13 | 0.01 | 0.12 | 0.05 |
| Bare land | 0 | 0 | 0 | 0.02 | 0.00 | 0.10 | 0.03 | 0.02 | 0.00 | 0.02 | 0.01 |
References
- Fan, Y.; Fang, C. Measuring Qinghai-Tibet plateau’s sustainability. Sustain. Cities Soc. 2022, 85, 104058. [Google Scholar] [CrossRef]
- Zou, F.; Hu, Q.; Liu, Y.; Li, H.; Zhang, X.; Liu, Y. Spatiotemporal Changes and Driving Analysis of Ecological Environmental Quality along the Qinghai–Tibet Railway Using Google Earth Engine—A Case Study Covering Xining to Jianghe Stations. Remote Sens. 2024, 16, 951. [Google Scholar] [CrossRef]
- Zhou, G.; Liu, W.; Xie, C.; Song, X.; Zhang, Q.; Li, Q.; Liu, G.; Li, Q.; Luo, B. Accelerating thermokarst lake changes on the Qinghai–Tibetan Plateau. Sci. Rep. 2024, 14, 2985. [Google Scholar] [CrossRef]
- Zhao, Z.; Dai, E. Vegetation cover dynamics and its constraint effect on ecosystem services on the Qinghai-Tibet Plateau under ecological restoration projects. J. Environ. Manag. 2024, 356, 120535. [Google Scholar] [CrossRef]
- Burke, T.; Rowland, C.S.; Whyatt, J.D.; Blackburn, G.A.; Abbatt, J. Spatially targeting national-scale afforestation for multiple ecosystem services. Appl. Geogr. 2023, 159, 103064. [Google Scholar] [CrossRef]
- Chen, T.; Li, M.; Luo, L.; Deng, S.; Zhou, R.; Chen, D. Simulating the effects of land urbanization on regional meteorology and air quality in Yangtze River Delta, China. Appl. Geogr. 2020, 120, 102228. [Google Scholar] [CrossRef]
- Sun, M.; Wang, J.; He, K. Analysis on the urban land resources carrying capacity during urbanization—A case study of Chinese YRD. Appl. Geogr. 2020, 116, 102170. [Google Scholar] [CrossRef]
- Gao, X.; Wang, B.; Sun, D. Do railways improve territorial cohesion of the Tibetan Plateau? A case study of the Qinghai-Tibet Railway. Appl. Geogr. 2022, 144, 102720. [Google Scholar] [CrossRef]
- Chandel, S.P.K. Impacts of tourism on environment. Cent. Asian J. Innov. Tour. Manag. Financ. 2022, 3, 90–98. [Google Scholar]
- Li, L.; Fan, Z.; Feng, W.; Yuxin, C.; Keyu, Q. Coupling coordination degree spatial analysis and driving factor between socio-economic and eco-environment in northern China. Ecol. Indic. 2022, 135, 108555. [Google Scholar] [CrossRef]
- Ford, J.D.; King, N.; Galappaththi, E.K.; Pearce, T.; McDowell, G.; Harper, S.L. The resilience of indigenous peoples to environmental change. One Earth 2020, 2, 532–543. [Google Scholar] [CrossRef]
- Rautela, R.; Arya, S.; Vishwakarma, S.; Lee, J.; Kim, K.-H.; Kumar, S. E-waste management and its effects on the environment and human health. Sci. Total. Environ. 2021, 773, 145623. [Google Scholar] [CrossRef]
- Kumar, M.; Xiong, X.; He, M.; Tsang, D.C.; Gupta, J.; Khan, E.; Harrad, S.; Hou, D.; Ok, Y.S.; Bolan, N.S. Microplastics as pollutants in agricultural soils. Environ. Pollut. 2020, 265, 114980. [Google Scholar] [CrossRef]
- Saini, J.; Dutta, M.; Marques, G. A comprehensive review on indoor air quality monitoring systems for enhanced public health. Sustain. Environ. Res. 2020, 30, 6. [Google Scholar] [CrossRef]
- Omri, A.; Hadj, T.B. Foreign investment and air pollution: Do good governance and technological innovation matter? Environ. Res. 2020, 185, 109469. [Google Scholar] [CrossRef]
- Hermundsdottir, F.; Aspelund, A. Competitive sustainable manufacturing-Sustainability strategies, environmental and social innovations, and their effects on firm performance. J. Clean. Prod. 2022, 370, 133474. [Google Scholar] [CrossRef]
- Buckley, R.; Chauvenet, A. Six caveats to valuing ecosystem services. Nature 2021, 592, 188. [Google Scholar] [CrossRef]
- Cord, A.F.; Seppelt, R.; Turner, W. Monitor ecosystem services from space. Nature 2015, 525, 33. [Google Scholar] [CrossRef]
- Millennium Ecosystem Assessment. Ecosystems and Human Well-Being; Island Press: Washington, DC, USA, 2005; Volume 5. [Google Scholar]
- Sangha, K.K.; Preece, L.; Villarreal-Rosas, J.; Kegamba, J.J.; Paudyal, K.; Warmenhoven, T.; RamaKrishnan, P.S. An ecosystem services framework to evaluate indigenous and local peoples’ connections with nature. Ecosyst. Serv. 2018, 31, 111–125. [Google Scholar] [CrossRef]
- Masiero, M.; Franceschinis, C.; Mattea, S.; Thiene, M.; Pettenella, D.; Scarpa, R. Ecosystem services’ values and improved revenue collection for regional protected areas. Ecosyst. Serv. 2018, 34, 136–153. [Google Scholar] [CrossRef]
- Dhal, L.; Kansal, M.L. An ecohydrological approach to assess water provisioning and supporting ecosystem services in the Budhabalanga River Basin, India. Environ. Monit. Assess. 2024, 196, 688. [Google Scholar] [CrossRef]
- Schmidt, S.; Seppelt, R. Information content of global ecosystem service databases and their suitability for decision advice. Ecosyst. Serv. 2018, 32, 22–40. [Google Scholar] [CrossRef]
- Cueva, J.; Yakouchenkova, I.A.; Fröhlich, K.; Dermann, A.F.; Dermann, F.; Köhler, M.; Grossmann, J.; Meier, W.; Bauhus, J.; Schröder, D.; et al. Synergies and trade-offs in ecosystem services from urban and peri-urban forests and their implication to sustainable city design and planning. Sustain. Cities Soc. 2022, 82, 103903. [Google Scholar] [CrossRef]
- Aziz, T. Changes in land use and ecosystem services values in Pakistan, 1950–2050. Environ. Dev. 2021, 37, 100576. [Google Scholar] [CrossRef]
- Correa, A.; Forero, J.; Marco Renau, J.; Lizarazo, I.; Mulligan, M.; Codato, D. Advancing spatial decision-making in a transboundary catchment through multidimensional ecosystem services assessment. Ecosyst. Serv. 2023, 64, 101554. [Google Scholar] [CrossRef]
- Taelman, S.E.; Schaubroeck, T.; De Meester, S.; Boone, L.; Dewulf, J. Accounting for land use in life cycle assessment: The value of NPP as a proxy indicator to assess land use impacts on ecosystems. Sci. Total. Environ. 2016, 550, 143–156. [Google Scholar] [CrossRef]
- Ouyang, Z.; Zheng, H.; Xiao, Y.; Polasky, S.; Liu, J.; Xu, W.; Wang, Q.; Zhang, L.; Xiao, Y.; Rao, E.M.; et al. Improvements in ecosystem services from investments in natural capital. Science 2016, 352, 1455–1459. [Google Scholar] [CrossRef]
- Zhang, B.A.; Li, W.H.; Xie, G.D. Ecosystem services research in China: Progress and perspective. Ecol. Econ. 2010, 69, 1389–1395. [Google Scholar] [CrossRef]
- Akber, M.A.; Patwary, M.M.; Islam, M.A.; Rahman, M.R. Storm protection service of the Sundarbans mangrove forest, Bangladesh. Nat. Hazards 2018, 94, 405–418. [Google Scholar] [CrossRef]
- Hu, X.S.; Hong, W.; Qiu, R.Z.; Hong, T.; Chen, C.; Wu, C.Z. Geographic variations of ecosystem service intensity in Fuzhou City, China. Sci. Total. Environ. 2015, 512, 215–226. [Google Scholar] [CrossRef] [PubMed]
- Song, W.; Deng, X.Z. Land-use/land-cover change and ecosystem service provision in China. Sci. Total. Environ. 2017, 576, 705–719. [Google Scholar] [CrossRef] [PubMed]
- Sun, X.; Li, F. Spatiotemporal assessment and trade-offs of multiple ecosystem services based on land use changes in Zengcheng, China. Sci. Total. Environ. 2017, 609, 1569–1581. [Google Scholar] [CrossRef]
- Ning, Z.H.; Chambers, R.; Abdollahi, K. Modeling air pollutant removal, carbon storage, and CO2 sequestration potential of urban forests in Scotlandville, Louisiana, USA. Iforest 2016, 9, 860–867. [Google Scholar] [CrossRef]
- Johnson, A.C.; Bellmore, J.R.; Haught, S.; Medel, R. Quantifying the Monetary Value of Alaska National Forests to Commercial Pacific Salmon Fisheries. N. Am. J. Fish. Manag. 2019, 39, 1119–1131. [Google Scholar] [CrossRef]
- Romero-Duque, L.P.; Trilleras, J.M.; Castellarini, F.; Quijas, S. Ecosystem services in urban ecological infrastructure of Latin America and the Caribbean: How do they contribute to urban planning? Sci. Total. Environ. 2020, 728, 138780. [Google Scholar] [CrossRef]
- Yadav, A.; Kansal, M.L.; Singh, A. Land use and land cover dynamics in the Upper Ganga Riverine Wetland: Unraveling ecosystem services over two decades. Environ. Monit. Assess. 2024, 196, 590. [Google Scholar] [CrossRef]
- Bastien-Olvera, B.A.; Moore, F.C. Use and non-use value of nature and the social cost of carbon. Nat. Sustain. 2021, 4, 101–108. [Google Scholar] [CrossRef]
- Costanza, R.; de Groot, R.; Sutton, P.; van der Ploeg, S.; Anderson, S.J.; Kubiszewski, I.; Farber, S.; Turner, R.K. Changes in the global value of ecosystem services. Glob. Environ. Chang. 2014, 26, 152–158. [Google Scholar] [CrossRef]
- Xie, G.D.; Zhang, C.X.; Zhen, L.; Zhang, L.M. Dynamic changes in the value of China’s ecosystem services. Ecosyst. Serv. 2017, 26, 146–154. [Google Scholar] [CrossRef]
- Enríquez-de-Salamanca, Á.; Díaz-Sierra, R.; Martín-Aranda, R.M.; Santos, M.J. Environmental impacts of climate change adaptation. Environ. Impact Assess. Rev. 2017, 64, 87–96. [Google Scholar] [CrossRef]
- Du, X.; Huang, Z. Ecological and environmental effects of land use change in rapid urbanization: The case of Hangzhou, China. Ecol. Indic. 2017, 81, 243–251. [Google Scholar] [CrossRef]
- Montero, A.; Marull, J.; Tello, E.; Cattaneo, C.; Coll, F.; Pons, M.; Infante-Amate, J.; Urrego-Mesa, A.; Fernández-Landa, A.; Vargas, M. The impacts of agricultural and urban land-use changes on plant and bird biodiversity in Costa Rica (1986–2014). Reg. Environ. Chang. 2021, 21, 48. [Google Scholar] [CrossRef]
- Gomes, E.; Abrantes, P.; Banos, A.; Rocha, J.; Buxton, M. Farming under urban pressure: Farmers’ land use and land cover change intentions. Appl. Geogr. 2019, 102, 58–70. [Google Scholar] [CrossRef]
- Song, X.P.; Hansen, M.C.; Stehman, S.V.; Potapov, P.V.; Tyukavina, A.; Vermote, E.F.; Townshend, J.R. Global land change from 1982 to 2016. Nature 2018, 560, 639–643. [Google Scholar] [CrossRef] [PubMed]
- Navarro, J.J.P.; Rodriguez-Estrella, R.; Gonzalez-Abraham, A. Human Activity and Geographical Factors Influence Vegetation and Plant Richness in Vanishing Oases of Baja California Peninsula. Nat. Areas J. 2019, 39, 409–419. [Google Scholar] [CrossRef]
- Peng, W.; Wagner, F.; Ramana, M.V.; Zhai, H.B.; Sma, M.J.; Dalin, C.; Zhang, X.; Mauzerall, D.L. Managing China’s coal power plants to address multiple environmental objectives. Nat. Sustain. 2018, 1, 693–701. [Google Scholar] [CrossRef]
- Gao, Y.; Zhou, F.; Ciais, P.; Miao, C.Y.; Yang, T.; Jia, Y.L.; Zhou, X.D.; Klaus, B.B.; Yang, T.T.; Yu, G.R. Human activities aggravate nitrogen-deposition pollution to inland water over China. Natl. Sci. Rev. 2020, 7, 430–440. [Google Scholar] [CrossRef] [PubMed]
- Hou, D.Y.; O’Connor, D.; Igalavithana, A.D.; Alessi, D.S.; Luo, J.; Tsang, D.C.W.; Sparks, D.L.; Yamauchi, Y.; Rinklebe, J.; Ok, Y.S. Metal contamination and bioremediation of agricultural soils for food safety and sustainability. Nat. Rev. Earth Environ. 2020, 1, 366–381. [Google Scholar] [CrossRef]
- Kumar, N.; Singh, S.K. Soil erosion assessment using earth observation data in a trans-boundary river basin. Nat. Hazards 2021, 107, 1–34. [Google Scholar] [CrossRef]
- Dang, H.; Li, J.; Zhou, Z. Revealing the supply-demand relationship of urban cultural ecosystem services: The combination of open-source spatial model and topic model. Appl. Geogr. 2024, 167, 103288. [Google Scholar] [CrossRef]
- Sallustio, L.; Quatrini, V.; Geneletti, D.; Corona, P.; Marchetti, M. Assessing land take by urban development and its impact on carbon storage: Findings from two case studies in Italy. Environ. Impact Assess. Rev. 2015, 54, 80–90. [Google Scholar] [CrossRef]
- Huang, Q.; Zhao, X.; He, C.; Yin, D.; Meng, S. Impacts of urban expansion on wetland ecosystem services in the context of hosting the Winter Olympics: A scenario simulation in the Guanting Reservoir Basin, China. Reg. Environ. Chang. 2019, 19, 2365–2379. [Google Scholar] [CrossRef]
- Bryan, B.A.; Gao, L.; Ye, Y.Q.; Sun, X.F.; Connor, J.D.; Crossman, N.D.; Stafford-Smith, M.; Wu, J.G.; He, C.Y.; Yu, D.Y.; et al. China’s response to a national land-system sustainability emergency. Nature 2018, 559, 193–204. [Google Scholar] [CrossRef]
- Perminova, T.; Sirina, N.; Laratte, B.; Baranovskaya, N.; Rikhvanov, L. Methods for land use impact assessment: A review. Environ. Impact Assess. Rev. 2016, 60, 64–74. [Google Scholar] [CrossRef]
- Fanfani, D.; Duží, B.; Mancino, M.; Rovai, M. Multiple evaluation of urban and peri-urban agriculture and its relation to spatial planning: The case of Prato territory (Italy). Sustain. Cities Soc. 2022, 79, 103636. [Google Scholar] [CrossRef]
- Su, D.; Cao, Y.; Dong, X.; Wu, Q.; Fang, X.; Cao, Y. Evaluation of ecosystem services budget based on ecosystem services flow: A case study of Hangzhou Bay area. Appl. Geogr. 2024, 162, 103150. [Google Scholar] [CrossRef]
- Jiang, W.; Lü, Y.; Liu, Y.; Gao, W. Ecosystem service value of the Qinghai-Tibet Plateau significantly increased during 25 years. Ecosyst. Serv. 2020, 44, 101146. [Google Scholar] [CrossRef]
- Liang, Y.; Song, W. Integrating potential ecosystem services losses into ecological risk assessment of land use changes: A case study on the Qinghai-Tibet Plateau. J. Environ. Manag. 2022, 318, 115607. [Google Scholar] [CrossRef]
- Wan, H.; He, G.; Li, B.; Zeng, J.; Cai, Y.; Shen, X.; Yang, Z. Coupling coordination relationship between urbanization and water environment in China. J. Clean. Prod. 2024, 472, 143423. [Google Scholar] [CrossRef]
- Zhang, L.; Wu, M.; Bai, W.; Jin, Y.; Yu, M.; Ren, J. Measuring coupling coordination between urban economic development and air quality based on the Fuzzy BWM and improved CCD model. Sustain. Cities Soc. 2021, 75, 103283. [Google Scholar] [CrossRef]
- Tomal, M. Evaluation of coupling coordination degree and convergence behaviour of local development: A spatiotemporal analysis of all Polish municipalities over the period 2003–2019. Sustain. Cities Soc. 2021, 71, 102992. [Google Scholar] [CrossRef]
- Cheng, X.; Long, R.; Chen, H.; Li, Q. Coupling coordination degree and spatial dynamic evolution of a regional green competitiveness system—A case study from China. Ecol. Indic. 2019, 104, 489–500. [Google Scholar] [CrossRef]
- Waseem, S.; Khayyam, U. Loss of vegetative cover and increased land surface temperature: A case study of Islamabad, Pakistan. J. Clean. Prod. 2019, 234, 972–983. [Google Scholar] [CrossRef]
- Li, Y.; Li, Y.; Zhou, Y.; Shi, Y.; Zhu, X. Investigation of a coupling model of coordination between urbanization and the environment. J. Environ. Manag. 2012, 98, 127–133.66. [Google Scholar] [CrossRef] [PubMed]
- Liu, J.; Kuang, W.; Zhang, Z.; Xu, X.; Qin, Y.; Ning, J.; Zhou, W.; Zhang, S.; Li, R.; Yan, C. Spatiotemporal characteristics, patterns, and causes of land-use changes in China since the late 1980s. J. Geogr. Sci. 2014, 24, 195–210. [Google Scholar] [CrossRef]
- Ning, J.; Liu, J.; Kuang, W.; Xu, X.; Zhang, S.; Yan, C.; Li, R.; Wu, S.; Hu, Y.; Du, G. Spatiotemporal patterns and characteristics of land-use change in China during 2010–2015. J. Geogr. Sci. 2018, 28, 547–562. [Google Scholar] [CrossRef]
- de Groot, R.; Brander, L.; van der Ploeg, S.; Costanza, R.; Bernard, F.; Braat, L.; Christie, M.; Crossman, N.; Ghermandi, A.; Hein, L.; et al. Global estimates of the value of ecosystems and their services in monetary units. Ecosyst. Serv. 2012, 1, 50–61. [Google Scholar] [CrossRef]
- Kraaijenbrink, P.D.A.; Bierkens, M.F.P.; Lutz, A.F.; Immerzeel, W.W. Impact of a global temperature rise of 1.5 degrees Celsius on Asia’s glaciers. Nature 2017, 549, 257–260. [Google Scholar] [CrossRef]
- Yao, T.-d.; Yao, Z.-j. Impacts of glacial retreat on runoff on Tibetan Plateau. Chin. J. Nat. 2010, 32, 4–8. [Google Scholar]
- Wu, X.; Zhang, J.; Geng, X.; Wang, T.; Wang, K.; Liu, S. Increasing green infrastructure-based ecological resilience in urban systems: A perspective from locating ecological and disturbance sources in a resource-based city. Sustain. Cities Soc. 2020, 61, 102354. [Google Scholar] [CrossRef]
- Zambon, I.; Colantoni, A.; Carlucci, M.; Morrow, N.; Sateriano, A.; Salvati, L. Land quality, sustainable development and environmental degradation in agricultural districts: A computational approach based on entropy indexes. Environ. Impact Assess. Rev. 2017, 64, 37–46. [Google Scholar] [CrossRef]

| Year | 1990 | 2000 | 2010 | 2020 | ||||
|---|---|---|---|---|---|---|---|---|
| Land Type | Area (ha) | Percent | Area (ha) | Percent | Area (ha) | Percent | Area (ha) | Percent |
| Cropland | 224,070 | 0.47% | 236,619 | 0.50% | 234,761 | 0.50% | 260,018 | 0.55% |
| Forestland | 14,383 | 0.03% | 14,364 | 0.03% | 15,293 | 0.03% | 30,841 | 0.07% |
| Shrubland | 348,503 | 0.74% | 348,125 | 0.74% | 346,943 | 0.73% | 455,752 | 0.96% |
| Sparse woodland | 162,119 | 0.34% | 160,189 | 0.34% | 160,189 | 0.34% | 248,167 | 0.53% |
| Other woodland | 584 | 0% | 1735 | 0% | 1687 | 0% | 2,922 | 0.01% |
| High coverage grassland | 3,242,632 | 6.86% | 3,238,567 | 6.85% | 3,236,788 | 6.85% | 2,014,397 | 4.26% |
| Medium coverage grassland | 7,952,007 | 16.83% | 7,945,336 | 16.82% | 7,917,914 | 16.76% | 7,444,746 | 15.76% |
| Low coverage grassland | 13,201,754 | 27.94% | 13,188,245 | 27.91% | 13,131,880 | 27.79% | 14,519,004 | 30.73% |
| Rivers and lakes | 1,161,537 | 2.46% | 1,148,711 | 2.43% | 1,185,821 | 2.51% | 1,368,343 | 2.90% |
| Ice and snow | 430,237 | 0.91% | 430,299 | 0.91% | 429,607 | 0.91% | 484,073 | 1.02% |
| Wetlands | 2,045,804 | 4.33% | 2,044,210 | 4.33% | 2,032,360 | 4.30% | 2,620,882 | 5.55% |
| Sand | 2,092,898 | 4.43% | 2,110,497 | 4.47% | 2,181,978 | 4.62% | 2,312,367 | 4.89% |
| Bare land | 16,317,267 | 34.54% | 16,320,450 | 34.54% | 16,281,559 | 34.46% | 15,384,794 | 32.56% |
| Construction land | 54,156 | 0.11% | 60,604 | 0.13% | 91,171 | 0.19% | 101,644 | 0.22% |
| Total | 47,247,951 | 100% | 47,247,951 | 100.00% | 47,247,951 | 100% | 47,247,951 | 100% |
Disclaimer/Publisher’s Note: The statements, opinions and data contained in all publications are solely those of the individual author(s) and contributor(s) and not of MDPI and/or the editor(s). MDPI and/or the editor(s) disclaim responsibility for any injury to people or property resulting from any ideas, methods, instructions or products referred to in the content. |
© 2025 by the authors. Licensee MDPI, Basel, Switzerland. This article is an open access article distributed under the terms and conditions of the Creative Commons Attribution (CC BY) license (https://creativecommons.org/licenses/by/4.0/).
Share and Cite
Fan, Y.; Zhang, C.; Fang, C. Balancing Act on the Third Pole: Three Decades of Ecological-Economic Synergy and Emerging Disparities Along the Qinghai–Tibet Railway, China. Sustainability 2025, 17, 3345. https://doi.org/10.3390/su17083345
Fan Y, Zhang C, Fang C. Balancing Act on the Third Pole: Three Decades of Ecological-Economic Synergy and Emerging Disparities Along the Qinghai–Tibet Railway, China. Sustainability. 2025; 17(8):3345. https://doi.org/10.3390/su17083345
Chicago/Turabian StyleFan, Yupeng, Chao Zhang, and Chuanglin Fang. 2025. "Balancing Act on the Third Pole: Three Decades of Ecological-Economic Synergy and Emerging Disparities Along the Qinghai–Tibet Railway, China" Sustainability 17, no. 8: 3345. https://doi.org/10.3390/su17083345
APA StyleFan, Y., Zhang, C., & Fang, C. (2025). Balancing Act on the Third Pole: Three Decades of Ecological-Economic Synergy and Emerging Disparities Along the Qinghai–Tibet Railway, China. Sustainability, 17(8), 3345. https://doi.org/10.3390/su17083345