Article

A Hybrid Prospect–Regret Decision-Making Method for Green Supply Chain Management Under the Interval Type-2 Trapezoidal Fuzzy Environment

1
School of Transportation Science and Engineering, Beihang University, Beijing 102206, China
2
Chongqing Key Laboratory of Vehicle Emission and Economizing Energy, Chongqing 401122, China
3
Key Laboratory of High Efficiency and Clean Mechanical Manufacture (Ministry of Education), School of Mechanical Engineering, Shandong University, Jinan 250061, China
4
College of Automotive and Mechanical Engineering, Changsha University of Science & Technology, Changsha 410205, China
*
Author to whom correspondence should be addressed.
Sustainability 2025, 17(8), 3323; https://doi.org/10.3390/su17083323
Submission received: 23 February 2025 / Revised: 3 April 2025 / Accepted: 3 April 2025 / Published: 8 April 2025

Abstract

:
The concept of green supply chain management (GSCM) describes how to reduce the negative impact of the supply chain on the environment while balancing the economic and social benefits of a company being in the supply chain. Selecting the optimal multi-dimensional GSCM scheme, a typical multi-criteria decision-making (MCDM) problem, is a crucial step in implementing the GSCM concept. Therefore, this paper constructs a multi-dimensional GSCM index system for the comprehensive analysis of the important influencing factors of GSCM. Then, cross-entropy combining the interval type-2 trapezoidal fuzzy set (IT2TFS) is adopted to determine the weight distribution of GSCM indices, and a hybrid MCDM method integrating the IT2TFS prospect–regret method is proposed to analyze the psychological behaviors of decision makers who are selecting the best GSCM scheme. Moreover, the case study, comparative analysis, and sensitivity analysis are presented to verify the effectiveness and reasonableness of the proposed MCDM method. The results affirm the validity of the proposed MCDM method, with A4 identified as the optimal GSCM scheme, demonstrating its effectiveness and applicability in MCDM problems.

1. Introduction

Green supply chain management (GSCM) is a systematic management approach to develop economic sustainability by balancing environmental impact and economic development of companies [1]. Currently, inadequate control of waste emissions and uncontrolled natural resource consumption in supply chain stages (e.g., manufacturing and logistics) under green production frameworks are exacerbating ecological degradation. In addition, supply chain management is a complex supply chain network that includes multiple stages, multiple dimensions, and huge data information. Therefore, how to minimize the environmental impact of each link in the supply chain is a challenge for GSCM.
To improve the green performance of GSCM practice and keep the economic benefits of companies, the optimal GSCM scheme with comprehensive performance is the key to the development of enterprises. Thus, constructing the multi-dimensional GSCM system needs the multi-criterion decision-making (MCDM) method as support [2]. Then, many researchers adopted the MCDM to analyze the network for GSCM, e.g., TODIM [3], Choquet integral [4], and GRA [5]. To promote the development of agriculture, the TBL-based AHP-CODAS method under the spherical fuzzy environment was proposed to select the best fertilizer supplier [6]. A multi-objective optimization model was developed to obtain the Pareto set for the best order number and a hybrid method integrating the fuzzy AHP and fuzzy TOPSIS to rank the suppliers [7]. However, the above MCDM methods lack the analysis of the psychological behavior of groups at different stages and cannot reflect the psychological gap between consumers or enterprises in different GSCM schemes.
Prospect theory [8] and regret theory are typical behavioral decision-making methods which describe the expectation of a good scheme and the avoidance of a bad scheme, respectively [9]. To fully analyze customer psychology, many scholars applied the prospect theory or regret theory to solve the selection issue of GSCM schemes. Qin et al. proposed a prospect-based TODIM method combining a new distance based on the fuzzy logic and α-cuts of the IT2FSs to determine the optimal green supplier [10,11]. Ali et al. proposed Archimedean Bonferroni mean operators to analyze the interrelationship between the criteria and extended the prospect-based TODIM to the q-ROFSs fuzzy environment [12]. The results of the minimax-regret theory illustrated that the higher remanufacturing production cost, lower actual yield, and production cost can promote the development of remanufacturing [13], but the analysis of decision makers about GSCM only considers a single psychological behavior, which cannot fully acquire the psychological transformation of customers.
Although the traditional multi-criteria decision-making method is widely used in GSCM, its weight allocation often has difficulty effectively dealing with multi-dimensional uncertainty information in the interval type-2 trapezoidal fuzzy set (IT2TFS) environment due to the non-synergistic optimization of subjective and objective information. For this reason, this paper introduces the cross-entropy model based on IT2TFS. Compared with the traditional entropy weighting method, cross-entropy not only considers the ambiguity but also captures the gap between the upper and lower subordinate means through the interval factor, so as to fit the actual decision-making scenario better.
On the other hand, the analysis of decision makers’ psychological behavior in existing GSCM studies is mostly limited to a single theoretical framework, which makes it difficult to comprehensively portray the complex psychological transitions of decision makers between gains and losses (e.g., amplifying the perception of losses due to risk aversion or over-correcting preferences due to regret aversion). In this paper, we combine prospect theory and regret theory to construct a hybrid model with a value function and weight function to dynamically simulate the irrational behavior of decision makers, so as to reflect the psychological trade-offs more realistically.
The key contributions of this paper can be summarized as follows:
(i)
The proposed model, which integrates the interval type-2 trapezoidal fuzzy set (IT2TFS) into cross-entropy, is applied to determine the weight distribution of the GSCM index.
(ii)
A novel approach for multi-criteria decision analysis, which utilizes the prospect theory incorporating the regret method under the IT2TFS environment, is applied to consider people’s psychological changes and further rank the GSCM schemes.
(iii)
The feasibility and applicability of the research methodology are demonstrated using the scheme of GSCM.
The rest of this paper is arranged as follows. Section 2 reviews the relevant research on GSCM. Section 3 introduces the concept of the IT2TFS and the proposed MCDM method (i.e., IT2TFS prospect–regret method). Section 4 conducts a case study of five GSCM schemes. Sensitivity analysis and comparative analysis are performed to verify the effectiveness of the proposed method. Finally, Section 5 summarizes this paper and draws up some future research directions.

2. Literature Reviews

GSCM aims to minimize environmental pollution at all life-cycle stages (e.g., green manufacturing, green packaging, and reverse logistics) [14]. Manufacturers and organizations must work in unison across the complete closed-loop cycle to ensure the effective performance of GSCM [15]. Moreover, enterprises do not need to sacrifice their benefits to protect the environment. Contrary to the perception of environmental initiatives as a cost burden, empirical evidence suggests that optimizing eco-efficiency while minimizing environmental footprints can deliver dual financial benefits, reducing costs and increasing profits for companies [16]. Therefore, to obtain the optimal GSCM scheme, researchers fully analyzed all stages of GSCM, e.g., transportation [17,18] and reverse logistics [19]. This section presents an extensive literature review of GSCM decision making, which mainly includes MCDM methods in GSCM, prospect and regret theory, and fuzzy theory in GSCM.

2.1. MCDM Methods in GSCM

To reconcile environmental and economic objectives, researchers have developed diverse MCDM (multi-criteria decision-making) methods for GSCM scheme selection, including MABACODAS [20], TOPSIS [21], QUALIFLEX [22], and TODIM [23]. Rostamzadeh et al. adopted the intuitionistic VIKOR method to analyze the six aspects of GSCM including eco-design, green products, green purchasing, green recycling, green transportation, and green warehousing [24]. Guohua Qu et al. proposed a framework for selecting green suppliers in fuzzy environments, which combines the fuzzy TOPSIS and ELECTRE I methods and is a useful tool to help companies select suitable green suppliers [21]. Tseng et al. found that the research on GSCM lacked consideration of the costs and benefits and proposed an IVTFN-GRA weight method to handle the criteria information [2]. A grey-based hybrid method was proposed to monitor the environmental performance at each stage of the supply chain in developing countries [25]. Liou et al. adopted the DEMATEL-ANP-MOORA-AS method by analyzing data to determine the weight distribution and the gap of schemes [26,27]. However, the classical MCDM methods lack consideration for decision behaviors, which do not apply to the environmental performance task evaluation at the consumer satisfaction or consumer market stage of GSCM.

2.2. Prospect and Regret Theory

To improve customer satisfaction and expand the market, prospect theory and regret theory have been proven to be effective means of analyzing the psychological behavior of customers [28]. Song et al. considered the psychological behavior and the time factors to deal with customers’ psychological reactions to manufacturing products at different stages [29]. To fully analyze the risk aversion of decision makers, the CPT-GLDS method under the probabilistic hesitant fuzzy environment was proposed to assist medical device manufacturers with selecting sustainable suppliers [30]. A Pythagorean AHP-VIKOR-MRM method was verified, which can balance group utility and personal regret [31]. Reverse logistics is the last important procedure needed to realize closed-loop GSCM. Therefore, Xu et al. adopted the prospect theory to determine the recycling price, which balanced the relationship between cost and benefits for recyclers and remanufacturers [19]. Taking an automobile manufacturing enterprise as an example, the effectiveness and feasibility of the selection framework for sustainable suppliers combining the regret-based QUALIFLEX method were verified [22]. Zhao and Zhou combined the positive profit into the minimax-regret theory to overcome the conservatism of the minimax-regret theory, which relied on the Stackelberg framework to promote the harmonious transformation of supply chain management [13].
Prospect–regret theory is able to characterize the psychology of prospect preference for optimal utility and the psychology of avoidance in unfavorable scenarios in the decision-making process of “human beings”. Therefore, an integrated behavioral decision-making approach is proposed to select the most appropriate GSCM solution for a company.

2.3. Fuzzy Theory in GSCM

Based on the purpose of better describing the uncertainty information of the GSCM process, scholars adopted fuzzy theories to solve the selection issue for GSCM schemes. Then, the triangle fuzzy number [2], intuitionistic fuzzy set [32], and q-rung orthopair fuzzy set were applied to the GSCM field [33], and the results proved that MCDM methods with fuzzy theories were more rational. Furthermore, due to exceptional expression of uncertain information of the type-2 fuzzy set, type-2 fuzzy set theory is extensively applied in GSCM fields, e.g., inventory management, the selection of green suppliers, and pricing [34,35]. Wu et al. proposed the type-2 BWM and type-2 VIKOR methods to look for a green supplier of long-term electronic components [36]. The WASPAS-Entropy weighting method under the type-2 fuzzy environment can deal with the ambiguity of incomplete information well, which obtained the more reasonable weight vector of green supplier criteria [37]. Liu et al. adopted the type-2 Bonferroni mean by combining the QFD to analyze the relationship between customer demands and technical criteria for GSCM [38]. The IT2FS TOPSIS with the Hamming distance determined the weight distribution and ranking results [39].
A key advantage of the type-2 fuzzy set is its ability to hand more complex ambiguities, especially when the uncertainty of the input data is high. Based on the aforementioned analysis, it is beneficial to integrate the MCDM method under type-2 fuzzy information, which solves the problem of GSCM with incompletable and uncertain decision information. Therefore, a novel integrated MCDM methodology is proposed under the type-2 fuzzy set environment to address a complex problem in GSCM.

3. Method

Before starting this subsection, it is important to know the meaning of some important symbols in order to better understand the subsequent formulas, as shown in Table 1.

3.1. Interval Type-2 Fuzzy Set

Definition 1 
([40]). Let X be the universe of discourse. A type-2 fuzzy set (T2FS) A on X is expressed as follows:
A = { ( ( x , u ) , u A ( x , u ) ) | x ϵ X , u ϵ J x [ 0,1 ] ,   0 u A ( x , u ) 1 }
where  u A  is the membership function of A, and A can be denoted as follows:
A = x ϵ X u ϵ J x u A ( x , u ) / ( x , u ) = x ϵ X ( u ϵ J x u A ( x , u ) / u ) / x
such that  u ϵ J x [ 0,1 ] .
Definition 2 
([40]). An interval type-2 trapezoidal fuzzy set (IT2TFS) is defined as follows:
A = [ A U , A L ] = [ ( a 1 U , a 2 U , a 3 U , a 4 U ; h A U ) , ( a 1 L , a 2 L , a 3 L , a 4 L ; h A L ) ]
where  ( a 1 U , a 2 U , a 3 U , a 4 U )  and  ( a 1 L , a 2 L , a 3 L , a 4 L )  are trapezoidal fuzzy numbers such that  a 1 U a 1 L  and  a 4 L a 4 U . Additionally, A L A U , and their membership functions are expressed as shown below:
u A U x ( x a 1 U ) h A U a 2 U a 1 U     a 1 U x a 2 U h A U                                       a 2 U x a 3 U a 4 U x h A U a 4 U a 3 U     a 3 U x a 4 U 0                                     o t h e r w i s e      
u A L ( x ) ( x a 1 L ) h A L a 2 L a 1 L     a 1 L x a 2 L h A L                                       a 2 L x a 3 L ( a 4 L x ) h A L a 4 L a 3 L     a 3 L x a 4 L 0                                     o t h e r w i s e      
such that  0 A L A U 1 .
Definition 3 
([40]). Assuming that A = [ A U , A L ] = [ ( a 1 U , a 2 U , a 3 U , a 4 U ; h A U ) , ( a 1 L , a 2 L , a 3 L , a 4 L ; h A L ) ] and B = [ B U , B L ] = [ ( b 1 U , b 2 U , b 3 U , b 4 U ; h B U ) , ( b 1 L , b 2 L , b 3 L , b 4 L ; h B L ) ] are IT2TFSs, the operation equations are shown as follows:
A + B = [ ( a 1 U + b 1 U , a 2 U + b 2 U , a 3 U + b 3 U , a 4 U + b 4 U ; m i n ( h A U , h B U ) ) , ( a 1 L + b 1 L , a 2 L + b 2 L , a 3 L + b 3 L , a 4 L + b 4 L ; m i n ( h A L , h B L ) ) ]
A B = [ ( a 1 U b 4 U , a 2 U b 3 U , a 3 U b 2 U , a 4 U b 1 U ; m i n ( h A U , h B U ) ) , ( a 1 L b 4 L , a 2 L b 3 L , a 3 L b 2 L , a 4 L b 1 L ; m i n ( h A L , h B L ) ) ]
A · B = [ ( a 1 U · b 1 U , a 2 U · b 2 U , a 3 U · b 3 U , a 4 U · b 4 U ; m i n ( h A U , h B U ) ) , ( a 1 L · b 1 L , a 2 L · b 2 L , a 3 L · b 3 L , a 4 L · b 4 L ; m i n ( h A L , h B L ) ) ]
A B = [ ( a 1 U b 4 U , a 2 U b 3 U , a 3 U b 2 U , a 4 U b 1 U ; m i n ( h A U , h B U ) ) , ( a 1 L b 4 L , a 2 L b 3 L , a 3 L b 2 L , a 4 L b 1 L ; m i n ( h A L , h B L ) ) ]
q · A = [ ( q · a 1 U , q · a 2 U , q · a 3 U , q · a 4 U ; h A U ) , ( q · a 1 L , q · a 2 L , q · a 3 L , q · a 4 L ; h A L ) ] ,   q > 0 [ ( q · a 4 U , q · a 3 U , q · a 2 U , q · a 1 U ; h A U ) , ( q · a 4 L , q · a 3 L , q · a 2 L , q · a 1 L ; h A L ) ] ,   q < 0
A q = [ ( ( a 1 U ) q , ( a 2 U ) q , ( a 3 U ) q , ( a 4 U ) q ; h A U ) , ( ( a 1 L ) q , ( a 2 L ) q , ( a 3 L ) q , ( a 4 L ) q ; h A L ) ]
Definition 4 
([10]). Assuming that  A = [ A U , A L ] = [ ( a 1 U , a 2 U , a 3 U , a 4 U ; h A U ) , ( a 1 L , a 2 L , a 3 L , a 4 L ; h A L ) ]  is IT2TFS, the distance between  A  and [(0,0,0,0;1),(0,0,0,0;1)] is shown as follows:
d ( A , 0 ) = 1 8 | a 1 L + a 2 L + a 3 L + a 4 L + 4 a 1 U + 2 a 2 U + 2 a 3 U + 4 a 4 U + 3 ( a 2 U + a 3 U a 1 U a 4 U ) h A L h A U |
Definition 5: 
Assuming that  A i = [ A i U , A i L ] = [ ( a 1 U i , a 2 U i , a 3 U i , a 4 U i ; h A U i ) , ( a 1 L i , a 2 L i , a 3 L i , a 4 L i ; h A L i ) ]  is IT2TFS and  i = 1 n w i = 1 , the weighting operator is shown as follows:
I T 2 T F S W A ( A i ) = [ ( i = 1 n w i · a 1 U i , i = 1 n w i · a 2 U i , i = 1 n w i · a 3 U i , i = 1 n w i · a 4 U i ; m i n ( h A U i ) ) ; ( i = 1 n w i · a 1 L i , i = 1 n w i · a 2 L i , i = 1 n w i · a 3 L i , i = 1 n w i · a 4 L i ; m i n ( h A L i ) ) ]

3.2. Fuzzy Cross-Entropy of IT2TFSs

Definition 6 
([41]). Assuming that  A = [ A U , A L ] = [ ( a 1 U , a 2 U , a 3 U , a 4 U ; h A U ) , ( a 1 L , a 2 L , a 3 L , a 4 L ; h A L ) ]  is IT2TFS, the fuzzy factor ( Δ A ), hesitant factor ( σ A ), and interval factor ( τ A ) can be expressed as follows:
Δ A = ( 1 | X | a 1 U a 4 U | A U 1 2 | d x ) 2 + ( 1 | X | a 1 L a 4 L | A L 1 2 | d x ) 2 2
σ A = ( 1 | X | a 1 U a 4 U | A U u U | d x ) 2 + ( 1 | X | a 1 L a 4 L | A L u L | d x ) 2 2
where  u U = 1 | X | a 1 U a 4 U A U d x  and  u L = 1 | X | a 1 L a 4 L A L d x  represent the upper means and lower means, respectively.
τ A = 1 | X | ( a 1 U a 4 U A U d x a 1 L a 4 L A L d x ) = u U u L
Definition 7 
([41]). Assuming that A and B are IT2TFSs, the fuzzy cross-entropy (CE) between A and B can be expressed as follows:
C E ( A , B ) = | Δ A l n Δ A 1 2 ( Δ A + Δ B ) + σ A l n σ A 1 2 ( σ A + σ B ) + τ A l n τ A 1 2 ( τ A + τ B ) + Δ B l n Δ B 1 2 ( Δ A + Δ B ) + σ B l n σ B 1 2 ( σ A + σ B ) + τ B l n τ B 1 2 ( τ A + τ B ) |
This subsection adopts cross-entropy of IT2TFSs to determine the objective weight vector of the index. Then, the criterion of cross-entropy of IT2TFSs is as follows: if under an attribute, the smaller the information difference between the final decision and the positive ideal object, the corresponding attribute weight should be larger and vice versa. Based on this criterion combined with fuzzy cross-entropy, a nonlinear programming model is developed as follows:
m i n   F = j = 1 n i = 1 m w j 2 · C E ( a i j , o j ) s . t .   j = 1 n w j = 1
where o j is the positive point extracted in the decision matrix.
To solve the nonlinear programming model, the Lagrangian function was constructed as shown in Equation (19); then, two partial derivatives were used to solve the Lagrange function as shown in Equation (20).
L ( w , λ ) = j = 1 n i = 1 m w j 2 · C E ( a i j , o j ) + λ ( j = 1 n w j 1 )
L ( w , λ ) w j = 2 w j i = 1 m C E ( a i j , o j ) + λ = 0 L ( w , λ ) λ = ( j = 1 n w j 1 ) = 0
Finally, the weight vector was calculated through Equation (21).
w j = ( i = 1 m C E ( a i j , o j ) ) 1 j = 1 m ( i = 1 m C E ( a i j , o j ) ) 1

3.3. The Framework of the Proposed Approach

A hybrid MCDM methodology is presented to solve the selection issue of GSCM schemes. The detailed procedure can be summarized in two stages, as shown in Figure 1.
Stage 1: Construct the multi-dimensional index system of GSCM and collect the evaluation information.
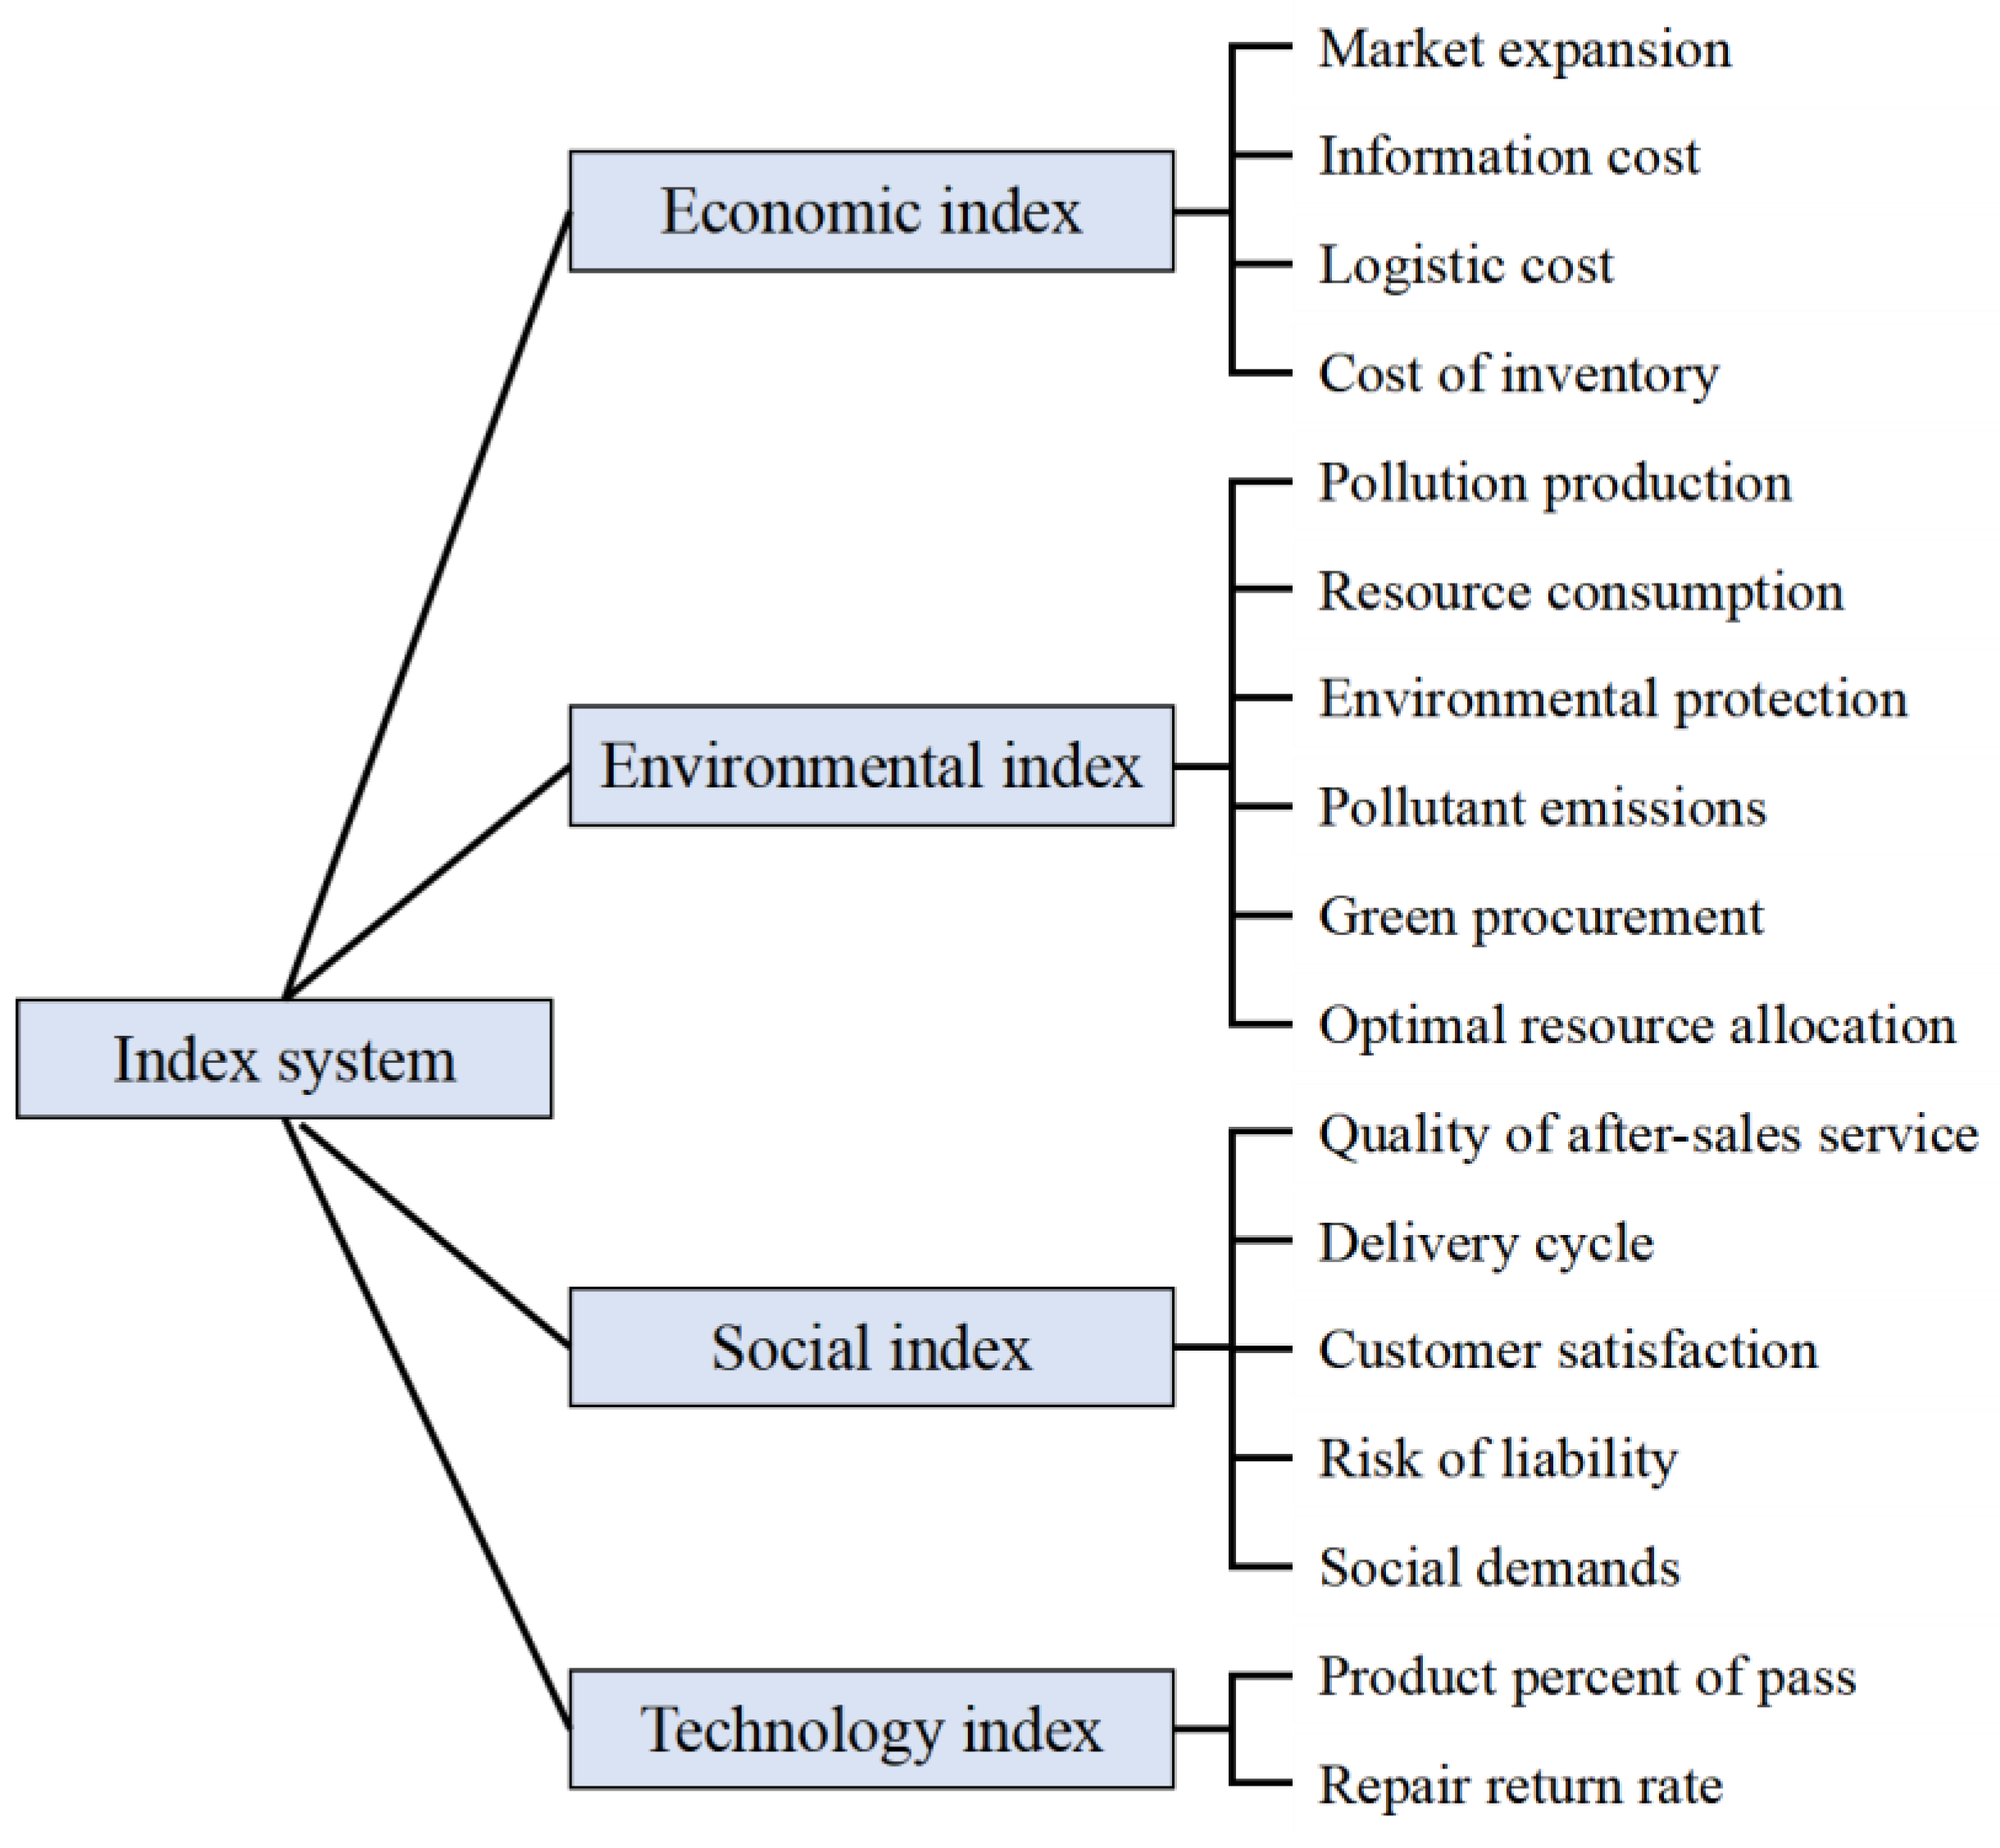
The multi-dimensional index system is constructed considering economic, environmental, social, and technological factors by analyzing literature reviews. Based on the index system, evaluation information is collected using questionnaires that are obtained from experts according to the linguistic term.
Stage 2: Obtain the weight distribution of the GSCM index via IT2TFS cross-entropy.
Based on the decision-making matrices, the fuzzy factor ( Δ A ), hesitant factor ( σ A ), and interval factor ( τ A ) for each index are calculated through Equations (14)–(16) in Section 3.2. The IT2TFS cross-entropy between schemes is computed by Equation (17) to analyze the gaps between the GSCM indices. Determining the positive point under each GSCM index is the basis for establishing the nonlinear programming model, which is adopted to obtain the weight distribution of GSCM indices.
Stage 3: Determine the ranking of the GSCM schemes by the IT2TFS-based prospect–regret method.
The normalized matrix is obtained by Equations (13) and (22), which are adopted to determine the distance matrix. According to the distance matrix, the IT2TFS gain set and loss set can be classified to determine the positive prospect matrix and negative prospect matrix. Then, the positive and negative weights of each index are calculated through Equations (27) and (28), and the weights are calculated by Stage 2. The DRG values are obtained from the regret values and rejoice values in Section 3.3. Therefore, the final rank and the optimal GSCM scheme can be determined based on the DRG values.

3.4. Prospect–Regret Theory of IT2TFSs

The assessment information is collected in the form of interval type-2 trapezoidal fuzzy set by the fuzzy linguistic variables shown in Table 1. To determine the scheme ranking, a prospect–regret theory based on IT2TFSs is introduced. The MCDM method analyzes the decision yearning for the optimal scheme and the avoidance of the worst scheme to select the best scheme, and the main steps are shown as follows.
Step 1: Establish the evaluation matrix Ai = [aij] according to the evaluation information obtained from experts and use Equation (13) to obtain the comprehensive evaluation matrix based on the IT2TFS linguistic term as shown in Table 2.
Step 2: The comprehensive evaluation matrix was standardized by using Equation (22) to obtain the normalized matrix A ^ = [ a ^ i j ] .
a ^ i j = a i j                                                                                                               , a i j   i s   b e n e f i t   i n d e x [ ( 1,1 , 1,1 ; 1 ) , ( 1,1 , 1,1 ; 1 ) ] a i j , a i j   i s   e c o n o m i c   i n d e x
Step 3: Based on A ^ , construct the distance matrix between A ^ and [(0,0,0,0;1), (0,0,0,0;1)].
Step 4: Determine the positive ideal point for each index P = [ max i d i j ] and negative ideal point for each index N = [ min i d i j ]. Then, the gain set (S+) and loss set (S) are calculated by Equations (23) and (24).
S + = { S i j + = a ^ i j N j ; d ( a ^ i j ) d ( N j ) > 0 }
S - = { S i j = a ^ i j P j ; d ( a ^ i j ) d ( P j ) < 0 }  
Step 5: The value function (as shown in Equations (25) and (26)) of each index was calculated to construct the positive prospect matrix V+ = [ v i j + ] and negative prospect matrix V = [ v i j ].
v i j + = (   S i j + ) ψ
v i j = λ   (   S i j ) φ
Here, ψ , φ ∈ (0, 1) represent the concave surface of the value function in the area of gain and loss, which reflects the sensitivity of the decision maker to gain and loss. The value function combines prospect and regret effects. For instance, if a scheme’s environmental score exceeds the industry baseline (positive deviation), its prospect value is calculated as (   S i j + ) ψ (Equation (25)). Conversely, if the score underperforms (negative deviation), the regret value is amplified by λ   (   S i j ) φ (Equation (26)).
Step 6: Determine the positive and negative weight of each index:
π + ( w j ) = ( w j ) γ ( ( w j ) γ + ( 1 w j ) γ ) 1 γ
π ( w j ) = ( w j ) σ ( ( w j ) σ + ( 1 w j ) σ ) 1 σ
where γ , σ ∈ (0, 1) represent the degree of variation in the weight function, which indicates the different attitudes of the decision maker towards gain and loss, and wj is calculated through Equations (14)–(21).
Step 7: The positive prospect value v i + and negative prospect value v i are calculated for each scheme through Equations (29) and (30):
v i + = j = 1 m v i j +   π + ( w j )
v i = j = 1 m v i j   π ( w j )
Note that v i = v i + + v i .
Step 8: Calculate the regret value and rejoice value of scheme i relative to scheme t:
r i t = 1 e ε ( v i v t )                                     ,   v i < v t [ ( 0,0 , 0,0 ; 1 ) , ( 0,0 , 0,0 ; 1 ) ,   v i v t
g i t = 1 e ε ( v i v t )                                   ,   v i v t [ ( 0,0 , 0,0 ; 1 ) , ( 0,0 , 0,0 ; 1 ) ,   v i < v t
Step 9: The overall psychologically perceived distance (rgi) for each scheme is calculated by Equation (33):
d ( r g i ) = d ( t = 1 n r i t + t = 1 n g i t )

4. Experimental Result and Discussion

4.1. Case Study

4.1.1. Background

With the continuous development of the economy and technology, the environment cannot bear the heavy burden of massive waste discharge. Reducing carbon emissions and pollution emissions in the whole life cycle of manufacturing products and effectively realizing the closed-loop green supply chain of manufacturing products are urgent problems to be solved. GSCM is a systematic management concept to reduce the impact on the environment by realizing the green ecological design of all life cycles in the supply chain. To select the optimal GSCM scheme, an index system for GSCM that is capable of fully analyzing all stages (i.e., supplier and recycling) was constructed as shown in Table 3 and Figure 2. The multi-dimensional index system of GSCM is the basis of obtaining the weight distribution and the ranking for GSCM schemes. Table 3 summarizes the four attribute levels of automotive parts companies for GSCM in the current literature revealed in this research [2,21,26,32,36,37,42,43,44,45,46,47,48,49,50,51,52].
The automotive manufacturing industry was selected as the case study for three key reasons: (1) Complexity of Supply Chains: Automotive supply chains involve multi-tier suppliers, global logistics networks, and high resource consumption, making it a critical sector for testing GSCM strategies. (2) Environmental Impact: This industry accounts for approximately 8% of global carbon emissions [52], with significant pollution from manufacturing processes. Thus, optimizing GSCM practices here can yield substantial ecological benefits. (3) Industry Relevance: Automotive manufacturers face stringent environmental regulations and consumer demand for sustainable products, creating an urgent need for actionable GSCM frameworks.
While the case study focuses on automotive manufacturing, the proposed methodology is designed to be adaptable. The multi-dimensional index system (economic, environmental, social, technological) and behavioral decision framework (prospect–regret theory) are applicable to industries with similar supply chain complexities, such as electronics, textiles, and aerospace. For instance, green procurement (C9) and resource consumption (C6) are universally critical across sectors.

4.1.2. Data Collection

This subsection takes the automotive manufacturing industry, which integrates manufacturing, the production of engines and transmission, and sales, as the case study. In this study, four experts, including two scholars in the material selection area, one manager from a well-regarded company, and one loyal customer, were invited to determine the initial matrix.
Scheme A1 emphasizes cost-efficient green procurement through blockchain-enabled supplier audits (C9) and ISO 14001-certified packaging, while maintaining conventional manufacturing processes. Scheme A2 implements circular economy principles with AI-powered reverse logistics (C3) achieving 95% material recovery rates (C10) and carbon-neutral transportation fleets (C8). Scheme A3 focuses on clean production technologies, integrating renewable energy microgrids (C6) that reduce resource consumption by 40%, coupled with zero-liquid-discharge manufacturing systems (C5). Scheme A4 deploys IoT-enabled smart inventory management (C4) with predictive maintenance algorithms (C17), demonstrating 30% inventory cost reduction while maintaining moderate environmental certification levels. Scheme A5 prioritizes social responsibility through supplier diversity programs (C14) and community impact assessments (C15), though with baseline environmental performance [53]. The option selection process prioritized the following: (1) alignment with the proposed multi-dimensional index system; (2) representation of current industry implementation levels; and (3) technological feasibility based on automotive industry benchmarks [21,42].

4.1.3. Case Study

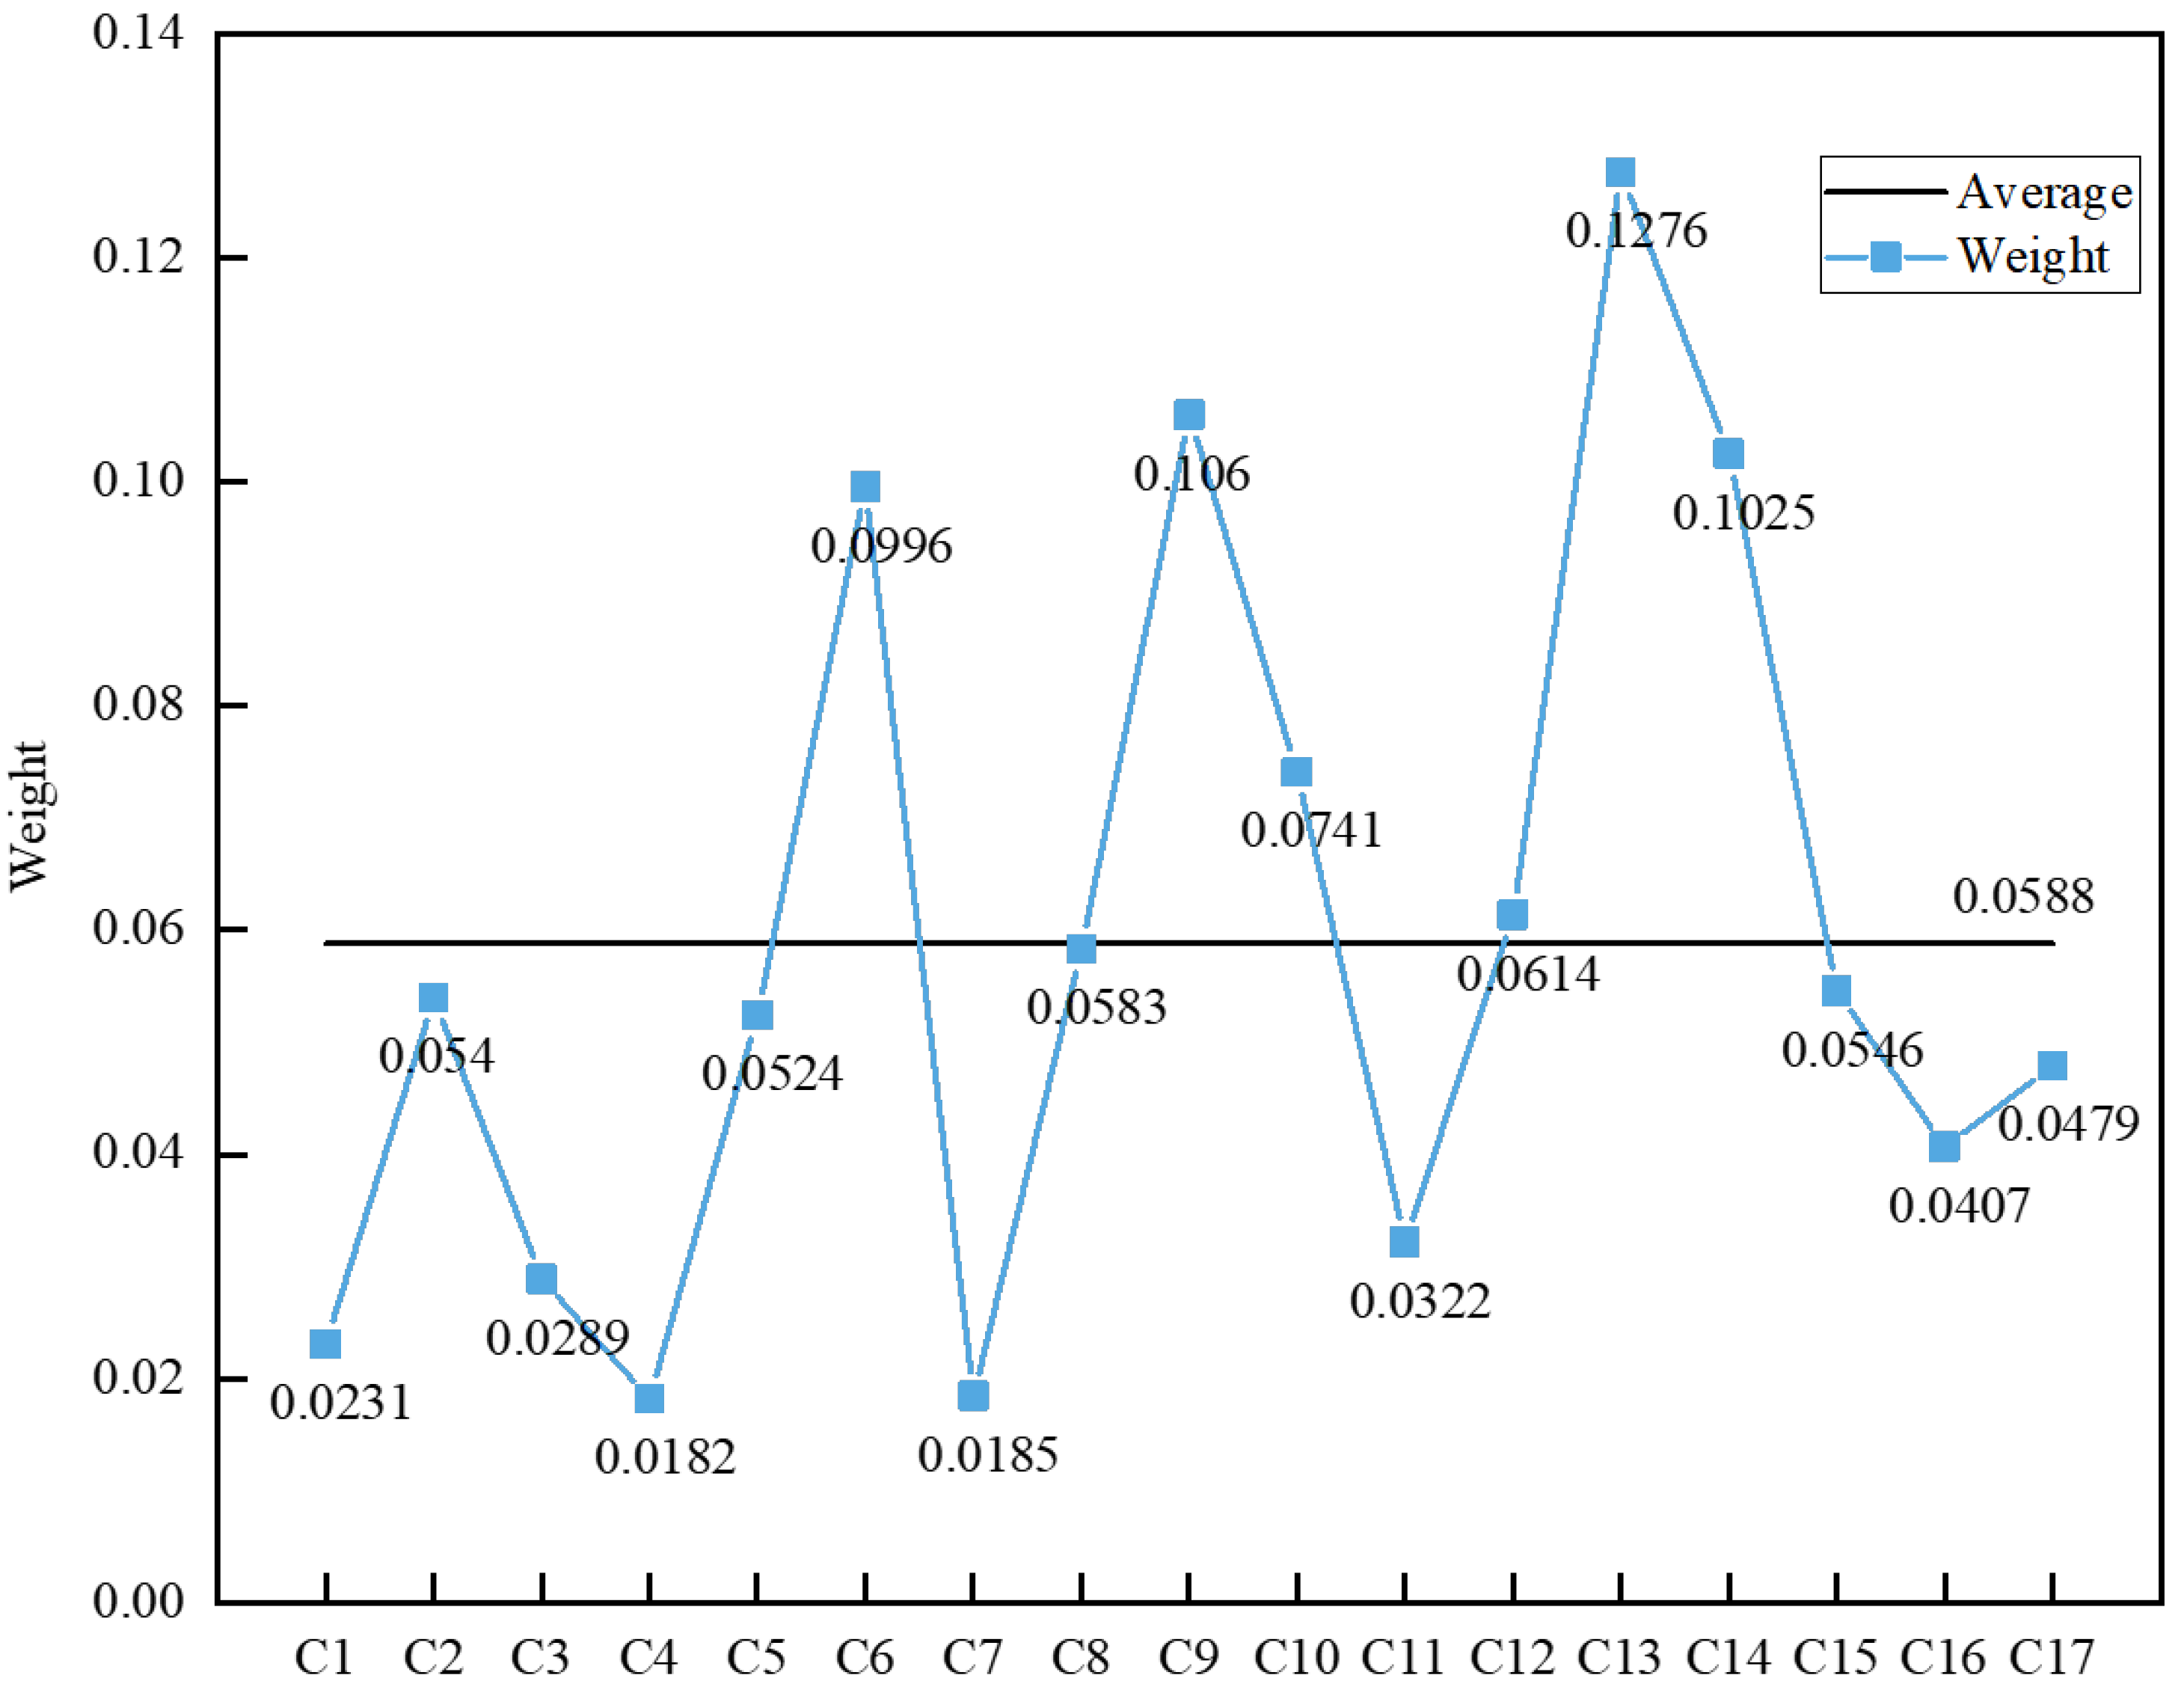
In this subsection, the case study is adopted to verify the effectiveness of the IT2TFS prospect–regret method, and the IT2TFS cross-entropy is adopted to determine the weight distribution of the GSCM index. Based on the decision-making matrices, the normalized evaluation matrix is calculated by Equations (13) and (22). The p value and N value determined by the distance matrix, which determines the gain set and loss set. The weight vector (as shown in Figure 3) of the GSCM index is calculated through Equations (13)–(20). Then, the positive and negative weights of each index are determined by Equations (27) and (28), as shown in Table 4. The positive prospect value v i + and negative prospect value v i are calculated for each scheme through Equations (25), (26), (29) and (30), as shown in Table 5. Finally, the DRG values are computed through Equations (31)–(33), as follows: [4.0937, 3.7922, 5.4538, 6.6269, 6.2321].
It can be found from Figure 3 that C6, C9, C13, and C14 have larger weight, illustrating that these indices have an important influence on the GSCM. C1, C4, and C7 have less effect on the GSCM scheme selection.

4.2. Sensitivity Analysis

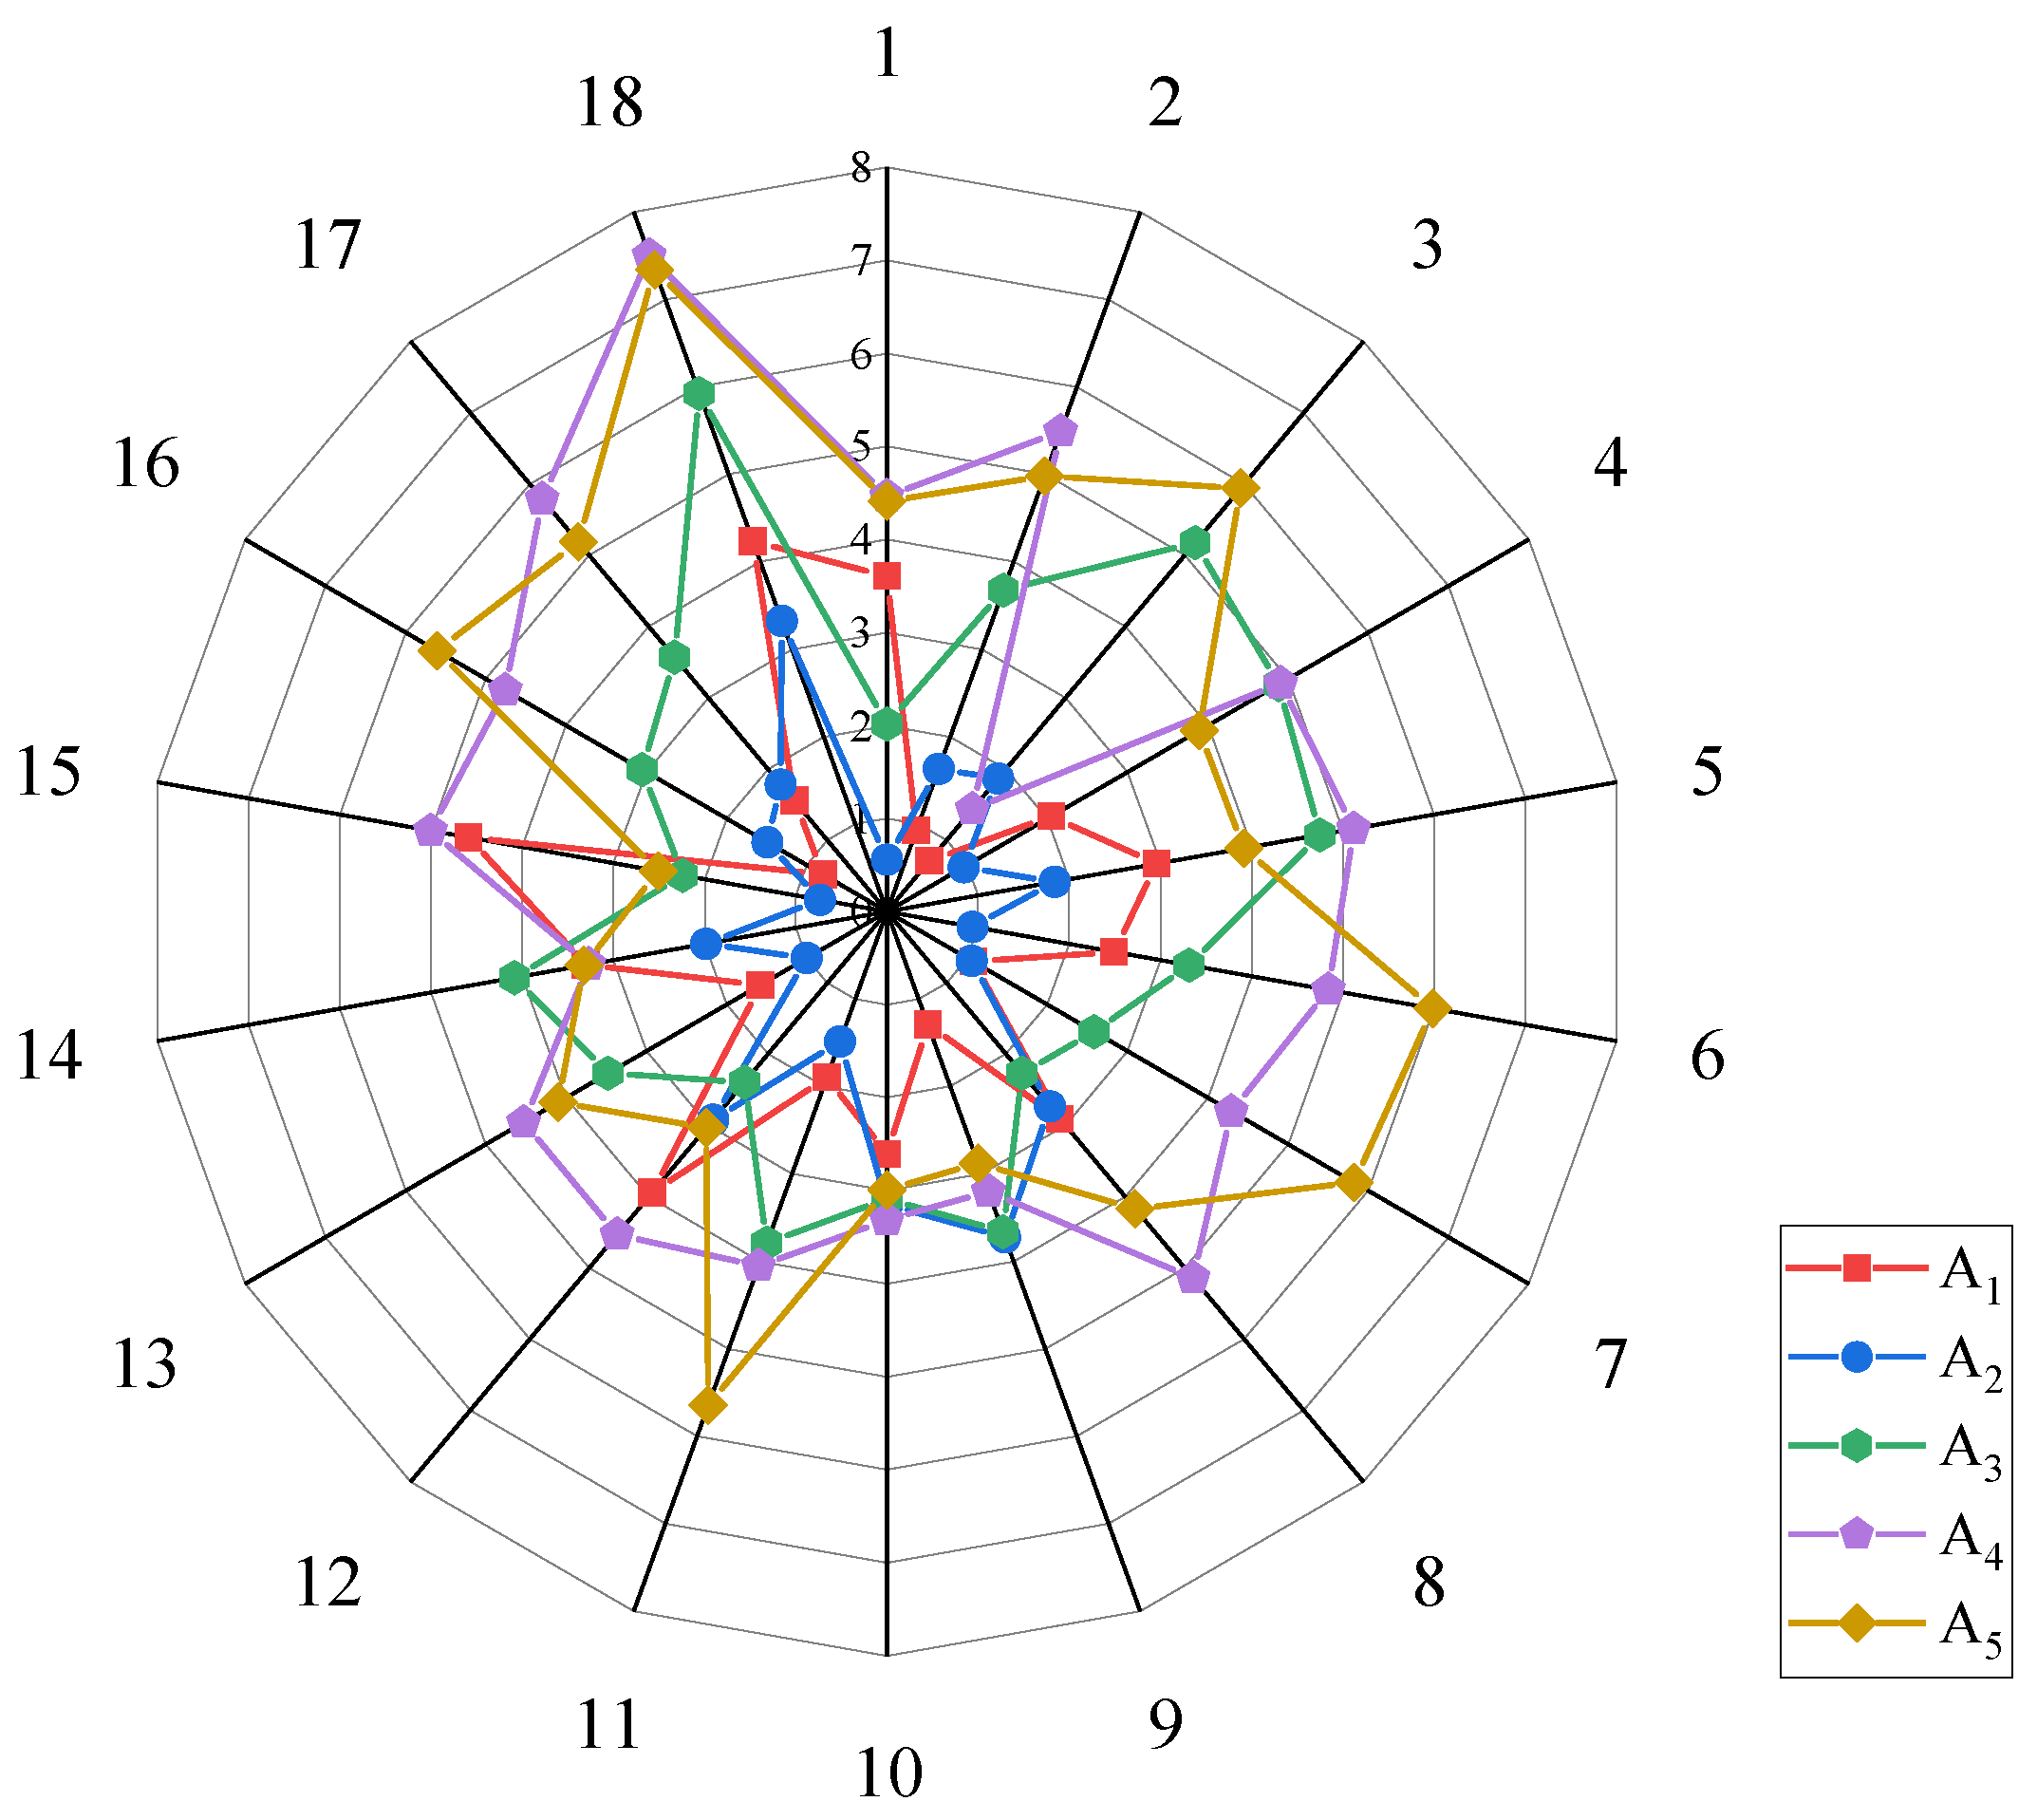
To explore the effects of criterion weight on decision results, fluctuation analysis was carried out for the criterion weight [54]. In general terms, DRG values change with the weights, which in turn affects the ranking of the alternatives. The subsection sets 18 experiments, but in the first 17 experiments the weights of each main index are set as the highest, respectively, and correspondingly other indices are set to be the same, with one experiment having the average weight for each index. The results of the 18 sensitivity analysis experiments are shown in Table 6 and Figure 4.
As seen from Table 4 and Figure 4, A4 remains the optimal GSCM scheme in the 10 sensitivity analysis experiments. In the third sensitivity analysis experiment, the weight of C4 adjusts from the lowest to the highest, leading to the ranking dropping for A4. Then, the ranking of A5 is overall higher than A4 in terms of environmental factors, which indicates that A5 has great advantages from an environmental perspective. Then, A2 and A3 have greater advantages in green procurement (C9) and risk of liability (C14), respectively. In general, the more stable the ranking of an alternative, the closer the trajectory formed by the corresponding ranking result is to a circle; on the contrary, if the trajectory formed by the ranking results of an alternative is not smooth, it indicates that the ranking of the alternative is more affected by the fluctuation of criteria weights.

4.3. Comparative Analysis

In order to verify the scientific validity and applicability of the proposed IT2TFS-based hybrid prospect–regret decision-making method, this study adopts the IT2TFS–prospect method and the IT2TFS–regret method for comparative analysis. By integrating prospect theory and regret theory, it can more comprehensively understand the regret-avoidance attitude of decision makers and their irrational behaviors in risk–return trade-offs, construct a decision-making framework that takes into account the dynamic changes in psychological behaviors, and effectively reduce decision-making risks. Under the premise of maintaining the consistency of the indicator weight distribution and assessment information matrix, the ranking results of the three MCDM methods are shown in Table 7. By comparing the stability and logical consistency of program ranking under different methods, the superiority of the hybrid model in capturing the complex psychological mechanisms of decision makers can be further verified.
It can be determined from Table 5 that the ranking results of the two comparative MCDM methods are consistent with the ranking of the proposed method, which verifies the effectiveness and scientific validity of the IT2TFS prospect–regret method. At the same time, the IT2TFS–prospect method and IT2TFS–regret method cannot distinguish the gap between the schemes well, and the proposed method can deal with the shortcoming well. Therefore, the hybrid MCDM method combining the advantage of prospect theory and regret theory is better than the single prospect method and single regret method.

4.4. Discussion

The results of the case study, comparative analysis, and sensitivity analysis are discussed in this subsection. It can be found from Figure 3 that C6, C9, C13, and C14 have the larger weight, illustrating that these indexes have an important position in the GSCM evaluation process. The ranking result of the case study shows that A4 is the optimal GSCM scheme. In addition, from the comparative analysis, the proposed MCDM method is more advantageous than the IT2TFS prospect method and IT2TFS regret method, which can enlarge the gap between schemes. Furthermore, the results of the sensitivity analysis show that A4 remains the optimal GSCM scheme in the 10 sensitivity analysis experiments, which illustrates that the decision results have relatively stable properties. Thus, the MCDM method can obtain a reasonable weight vector and ranking results in the evaluation, which can also help engineers/designers with selecting the optimal scheme for GSCM.
This study advances the theoretical foundations of green supply chain decision making by integrating prospect theory and regret theory within an interval type-2 trapezoidal fuzzy (IT2TF) framework. The hybrid method addresses the limitations of conventional fuzzy models by capturing decision makers’ bounded rationality through dynamic reference points and psychological utility functions, while IT2TF sets enhance the capability of handling uncertainties in sustainability criteria. By embedding regret aversion into the prospect–theoretic paradigm, this work bridges behavioral economics with fuzzy multi-criteria decision making, offering a novel approach to model trade-offs between economic and environmental objectives. The proposed IT2TF operators further strengthen the robustness of linguistic evaluations, contributing methodologically to fuzzy set theory in sustainability contexts.
Practically, the framework provides actionable tools for optimizing green supply chain strategies. The IT2TF-based evaluation of qualitative metrics resolves conflicts among stakeholders with divergent priorities, enabling managers to align decisions with organizational sustainability goals. By quantifying regret aversion and risk preferences, the method mitigates suboptimal choices driven by cognitive biases and enhances transparency through IT2TF-based quantification of sustainability performance. These capabilities support industries in transitioning toward circular economy models under dynamic regulatory and market pressures.
The MCDM method is a valuable tool that allows decision makers to select a GSCM scheme that meets people’s psychological expectations. Therefore, the ideas and methods of this paper can better solve the selection issue for GSCM schemes.

5. Conclusions

GSCM has attracted many researchers to develop the MCDM method to find a balance between economic development and environmental protection. However, the literature reviews on the selection issue of GSCM schemes reveal some research gaps. Therefore, this paper proposed a novel MCDM method for evaluating GSCM schemes. Firstly, this paper constructs a multi-dimensional index system for GSCM, including the economic index, environmental index, social index, and technology index, which is basis for obtaining the weight vector and optimal scheme. Then, IT2TFS cross-entropy is used to determine the weight of the index system for GSCM, which illustrates the customer satisfaction and green procurement that are the design criteria of the enterprise concerned. The IT2TFS prospect–regret method analyzing the psychological behavior of decision makers is adopted to determine the ranking of the GSCM schemes. To verify the scientific validity and effectiveness, a case study (i.e., five GSCM schemes), comparative analysis, and sensitivity analysis are adopted. The results show that A4 is the optimal GSCM scheme through the proposed MCDM method and another comparative method, and the proposed method can enlarge the gaps between GSCM schemes comparing the other two MCDM methods.
The proposed method’s novelty lies in its dual capacity to handle uncertainty and behavioral complexity, offering enterprises a decision tool for GSCM strategy alignment. Future research should focus on three directions: (1) addressing GSCM decision making in specific periods, which can achieve dynamic decisions by combining the time series (i.e., Markov chain), (2) integrating machine learning algorithms to automate weight adjustments in real-time supply chain disruptions and implanting the codes to computer programs for assessing schemes intelligently, and (3) validating the framework’s generalizability across industries with divergent sustainability challenges.

Author Contributions

S.Z.: methodology and writing—original draft. Z.M.: conceptualization and methodology. Z.H.: methodology. H.Z.: formal analysis. D.W.: writing—original draft and editing. All authors have read and agreed to the published version of the manuscript.

Funding

This research was funded by the Fund of Chongqing Key Laboratory of Vehicle Emission and Economizing Energy [grant number PFJN-11].

Institutional Review Board Statement

Ethical review and approval were waived for this study due to Legal Regulations.

Informed Consent Statement

Ethical review and approval were waived for this study due to Legal Regulations.

Data Availability Statement

The datasets used and/or analyzed during the current study are available from the corresponding author upon reasonable request. All data generated or analyzed during this study are included in this article.

Acknowledgments

This work was supported by the Fund of Chongqing Key Laboratory of Vehicle Emission and Economizing Energy [grant number PFJN-11].

Conflicts of Interest

The authors declare no competing interests.

References

  1. Ma, J.; Li, Q.; Zhao, Q.; Liou, J.; Li, C. From bytes to green: The impact of supply chain digitization on corporate green innovation. Energy Econ. 2024, 139, 107942. [Google Scholar] [CrossRef]
  2. Tseng, M.L.; Lim, M.; Wu, K.J.; Zhou, L.; Bui, D.T.D. A novel approach for enhancing green supply chain management using converged interval-valued triangular fuzzy numbers-grey relation analysis. Resour. Conserv. Recycl. 2018, 128, 122–133. [Google Scholar] [CrossRef]
  3. Zhang, H.H.; Huang, Z.W.; Tian, G.D.; Wang, W.J.; Li, Z.W. A hybrid QFD-based human-centric decision making approach of disassembly schemes under interval 2-tuple q-rung orthopair fuzzy sets. IEEE Trans. Autom. Sci. Eng. 2025, 22, 724–735. [Google Scholar] [CrossRef]
  4. Huang, Z.W.; Zhang, H.H.; Wang, D.Q.; Yu, H.; Wang, L.Y.; Yu, D.T.; Peng, Y. Preference-based multi-attribute decision-making method with spherical-Z fuzzy sets for green product design. Eng. Appl. Artif. Intell. 2023, 126, 106767. [Google Scholar] [CrossRef]
  5. My, L.T.D.; Wang, C.N.; Thanh, N.V. Fuzzy MCDM for improving the performance of agricultural supply chain. Cmc-Comput. Mater. Contin. 2022, 73, 4003–4015. [Google Scholar]
  6. Mohammed, A.; Harris, I.; Govindan, K. A hybrid MCDM-FMOO approach for sustainable supplier selection and order allocation. Int. J. Prod. Econ. 2019, 217, 171–184. [Google Scholar] [CrossRef]
  7. Chen, R.; Lepori, G.M.; Tai, C.C.; Sung, M.-C. Explaining cryptocurrency returns: A prospect theory perspective. J. Int. Financ. Mark. Inst. Money 2022, 79, 101599. [Google Scholar] [CrossRef]
  8. Zhao, Q.; Ju, Y.B.; Martinez, L.; Pedrycz, W.; Dong, P.; Wang, A. SMAA-Bicapacity-Choquet-Regret model for Heterogeneous linguistic MCDM with interactive criteria with bipolar ccale and 2-Tuple aspirations. IEEE Trans. Fuzzy Syst. 2022, 30, 4384–4398. [Google Scholar] [CrossRef]
  9. Qin, J.D.; Liu, X.W.; Pedrycz, W. An extended TODIM multi-criteria group decision making method for green supplier selection in interval type-2 fuzzy environment. Eur. J. Oper. Res. 2017, 258, 626–638. [Google Scholar]
  10. Qin, J.D.; Liu, X.W.; Pedrycz, W. A multiple attribute interval type-2 fuzzy group decision making and its application to supplier selection with extended LINMAP method. Soft Comput. 2017, 21, 3207–3226. [Google Scholar] [CrossRef]
  11. Ali, Z.; Mahmood, T.; Gwak, J.; Jan, N. A novel extended Portuguese of interactive and multi-criteria decision making and archimedean Bonferroni mean operators based on prospect theory to select green supplier with complex q-rung orthopair fuzzy information. Caai Trans. Intell. Technol. 2023, 8, 177–191. [Google Scholar]
  12. Zhao, Y.J.; Zhou, H. Remanufacturing vs. greening: Competitiveness and harmony of sustainable strategies of supply chain under uncertain yield. Comput. Ind. Eng. 2023, 179, 109233. [Google Scholar]
  13. Mumtaz, U.; Ali, Y.; Petrillo, A.; De Felice, F. Identifying the critical factors of green supply chain management: Environmental benefits in Pakistan. Sci. Total Environ. 2018, 640, 144–152. [Google Scholar]
  14. Liu, S.; Chang, Y.T. Manufacturers’ closed-loop orientation for green supply chain management. Sustainability 2017, 9, 222. [Google Scholar] [CrossRef]
  15. Zhang, D.; Shi, L.; Liu, G. Supply chain in transition navigating economic growth and environmental sustainability through education. Environ. Sci. Pollut. Res. 2024, 31, 12321–12339. [Google Scholar]
  16. Zhang, H.H.; Huang, Z.W.; Wang, D.Q.; Tian, G.D.; Wang, W.J. U-shaped disassembly line balancing problem under interval Type-2 trapezoidal fuzzy set: Modeling and solution method. Eng. Appl. Artif. Intell. 2025, 145, 110211. [Google Scholar]
  17. Tian, G.; Zhang, C.; Fathollahi-Fard, A.M.; Li, Z.; Zhang, C.; Jiang, Z. An enhanced social engineering optimizer for solving an energy-efficient disassembly dine balancing problem based on bucket brigades and cloud theory. IEEE Trans. Ind. Inf. 2023, 19, 7148–7159. [Google Scholar]
  18. Huang, Z.W.; Zhang, H.H.; Tian, G.D.; Yang, M.Z.; Wang, D.Q.; Li, Z.W. Energy-efficient human-robot collaborative U-shaped disassembly line balancing problem considering turn on-off strategy: Uncertain modeling and solution method. J. Manuf. Syst. 2025, 80, 38–69. [Google Scholar]
  19. Xu, J.; Meng, Q.; Chen, Y.; Zhao, J. Dual-channel pricing decisions for product recycling in green supply chain operations: Considering the impact of consumer loss aversion. Int. J. Environ. Res. Public Health 2023, 20, 1792. [Google Scholar] [CrossRef]
  20. Dorfeshan, Y.; Jolai, F.; Mousavi, S.M. A new risk quantification method in project-driven supply chain by MABACODAS method under interval type-2 fuzzy environment with a case study. Eng. Appl. Artif. Intell. 2023, 119, 105729. [Google Scholar]
  21. Qu, G.; Zhang, Z.; Qu, W.; Xu, Z. Green supplier selection based on green practices evaluated using fuzzy approaches of TOPSIS and ELECTRE with a case study in a Chinese internet company. Int. J. Environ. Res. Public Health 2020, 17, 3268. [Google Scholar] [CrossRef] [PubMed]
  22. Liu, L.M.; Bin, Z.L.; Shi, B.; Cao, W. Sustainable supplier selection based on regret theory and QUALIFLEX method. Int. J. Comput. Intell. Syst. 2020, 13, 1120–1133. [Google Scholar] [CrossRef]
  23. Nie, S.; Liao, H.; Wu, X.; Xu, Z. Green supplier selection with a continuous interval-valued linguistic TODIM method. IEEE Access 2019, 7, 124315–124328. [Google Scholar] [CrossRef]
  24. Tian, X.L.; Niu, M.L.; Zhang, W.K.; Li, L.; Herrera-Viedma, E. A novel TODIM based on prospect theory to select green supplier with q-rung orthopair fuzzy set. Technol. Econ. Dev. Econ. 2021, 27, 284–310. [Google Scholar] [CrossRef]
  25. Chithambaranathan, P.; Subramanian, N.; Gunasekaran, A.; Palaniappan, P.K. Service supply chain environmental performance evaluation using grey based hybrid MCDM approach. Int. J. Prod. Econ. 2015, 166, 163–176. [Google Scholar]
  26. Liou, J.J.H.; Chang, M.H.; Lo, H.W.; Hsu, M.-H. Application of an MCDM model with data mining techniques for green supplier evaluation and selection. Appl. Soft Comput. 2021, 109, 107534. [Google Scholar] [CrossRef]
  27. Liou, J.J.H.; Chuang, Y.C.; Zavadskas, E.K.; Tzeng, G.-H. Data-driven hybrid multiple attribute decision-making model for green supplier evaluation and performance improvement. J. Clean. Prod. 2019, 241, 118321. [Google Scholar]
  28. Xie, G.; Zhu, W.; Xiang, J.; Li, T.; Wu, X.; Peng, Y.; Zhang, H.; Wang, K. A behavior three-way decision approach under interval-valued triangular fuzzy numbers with application to the selection of additive manufacturing composites. Eng. Appl. Artif. Intell. 2024, 137, 109214. [Google Scholar]
  29. Song, W.; Chen, Z.Y.; Liu, A.J.; Zhu, Q.; Zhao, W.; Tsai, S.-B.; Lu, H. A Study on Green Supplier Selection in Dynamic Environment. Sustainability 2018, 10, 1226. [Google Scholar] [CrossRef]
  30. Liao, N.N.; Cai, Q.; Garg, H.; Wei, G.; Xu, X. Novel gained and lost dominance score method based on cumulative prospect theory for group decision-making problems in probabilistic hesitant fuzzy environment. Int. J. Fuzzy Syst. 2023, 25, 1414–1428. [Google Scholar] [CrossRef]
  31. Zhou, F.; Chen, T.Y. An integrated multicriteria group decision-making approach for green supplier selection under Pythagorean fuzzy scenarios. IEEE Access 2020, 8, 165216–165231. [Google Scholar] [CrossRef]
  32. Rouyendegh, B.D.; Yildizbasi, A.; Ustunyer, P. Intuitionistic Fuzzy TOPSIS method for green supplier selection problem. Soft Comput. 2020, 24, 2215–2228. [Google Scholar] [CrossRef]
  33. Liu, P.D.; Gao, H.; Ma, J.H. Novel green supplier selection method by combining quality function deployment with partitioned Bonferroni mean operator in interval type-2 fuzzy environment. Inf. Sci. 2019, 490, 292–316. [Google Scholar] [CrossRef]
  34. Panja, S.; Mondal, S.K. Sustainable production inventory management through bi-level greening performance in a three-echelon supply chain. Oper. Res. 2023, 23, 16. [Google Scholar] [CrossRef]
  35. Pei, H.L.; Liu, Y.K.; Li, H.L. Robust pricing for a dual-channel green supply chain under fuzzy demand ambiguity. IEEE Trans. Fuzzy Syst. 2023, 31, 53–66. [Google Scholar] [CrossRef]
  36. Wu, Q.; Zhou, L.G.; Chen, Y.; Chen, H. An integrated approach to green supplier selection based on the interval type-2 fuzzy best-worst and extended VIKOR methods. Inf. Sci. 2019, 502, 394–417. [Google Scholar] [CrossRef]
  37. Keshavarz Ghorabaee, M.; Zavadskas, E.K.; Amiri, M.; Esmaeili, A. Multi-criteria evaluation of green suppliers using an extended WASPAS method with interval type-2 fuzzy sets. J. Clean. Prod. 2016, 137, 213–229. [Google Scholar] [CrossRef]
  38. Liu, L.M.; Cao, W.Z.; Shi, B.; Tang, M. Large-Scale Green Supplier Selection Approach under a Q-Rung Interval-Valued Orthopair Fuzzy Environment. Processes 2019, 7, 573. [Google Scholar] [CrossRef]
  39. Mousakhani, S.; Nazari-Shirkouhi, S.; Bozorgi-Amiri, A. A novel interval type-2 fuzzy evaluation model based group decision analysis for green supplier selection problems: A case study of battery industry. J. Clean. Prod. 2017, 168, 205–218. [Google Scholar] [CrossRef]
  40. Mendel, J.M.; John, R.I.; Feilong, L. Interval Type-2 fuzzy logic systems made simple. IEEE Trans. Fuzzy Syst. 2006, 14, 808–821. [Google Scholar] [CrossRef]
  41. Yao, D.B.; Wang, C.C. Interval type-2 fuzzy information measures and their applications to attribute decision-making approach. J. Intell. Fuzzy Syst. 2017, 33, 1809–1821. [Google Scholar]
  42. Tsai, J.F.; Shen, S.P.; Lin, M.H. Applying a hybrid MCDM model to evaluate green supply chain management practices. Sustainability 2023, 15, 2148. [Google Scholar] [CrossRef]
  43. Haseli, G.; Sheikh, R.; Wang, J.Q.; Tomaskova, H.; Tirkolaee, E.B. A novel approach for group decision making based on the Best-Worst method (G-BWM): Application to supply chain management. Mathematics 2021, 9, 1881. [Google Scholar] [CrossRef]
  44. Lu, M.T.; Tsai, J.F.; Shen, S.P.; Lin, M.-H.; Hu, Y.-C. Estimating sustainable development performance in the electrical wire and cable industry: Applying the integrated fuzzy MADM approach. J. Clean. Prod. 2020, 277, 122440. [Google Scholar]
  45. Buyukozkan, G.; Cifci, G. A novel hybrid MCDM approach based on fuzzy DEMATEL, fuzzy ANP and fuzzy TOPSIS to evaluate green suppliers. Expert. Syst. Appl. 2012, 39, 3000–3011. [Google Scholar]
  46. Deng, X.; Jiang, W. Evaluating green supply chain management practices under fuzzy environment: A novel method based on D number theory. Int. J. Fuzzy Syst. 2019, 21, 1389–1402. [Google Scholar]
  47. Han, Y.T.; Zheng, H.X.; Huang, Y.C.; Li, X.W. Considering Consumers’ Green Preferences and Government Subsidies in the Decision Making of the Construction and Demolition Waste Recycling Supply Chain: A Stackelberg Game Approach. Buildings 2022, 12, 832. [Google Scholar] [CrossRef]
  48. Song, Y.; Dong, Y. Influence of resource compensation and complete information on green sustainability of semiconductor supply chains. Int. J. Prod. Econ. 2024, 271, 109227. [Google Scholar]
  49. Guarnieri, P.; Trojan, F. Decision making on supplier selection based on social, ethical, and environmental criteria: A study in the textile industry. Resour. Conserv. Recycl. 2019, 141, 347–361. [Google Scholar]
  50. Ghadikolaei, A.S.; Parkouhi, S.V.; Saloukolaei, D.D. Extension of a hybrid MABAC-DANP method under gray environment for green supplier selection. Int. J. Inf. Technol. Decis. Mak. 2022, 21, 755–788. [Google Scholar]
  51. Freeman, J.; Chen, T. Green supplier selection using an AHP-Entropy-TOPSIS framework. Supply Chain. Manag. Int. J. 2015, 20, 327–340. [Google Scholar] [CrossRef]
  52. He, J.; Lei, Y.; Fu, X. Do consumer’s green preference and the reference price effect improve green innovation? A theoretical model using the food supply chain as a case. Int. J. Environ. Res. Public Health 2019, 16, 5007. [Google Scholar] [CrossRef]
  53. Huang, S.; Zhang, H. Green supply chain management of automotive manufacturing industry considering multiperspective indices. IEEJ Trans. Electr. Electron. Eng. 2019, 14, 1787–1795. [Google Scholar] [CrossRef]
  54. Wang, D.Q.; Deng, W.G.; Hu, L.; Huang, Z.; Lu, Y.; Zhang, H. Safety assessment of intelligent vehicles considering drivers’ risk perception information under interval 2-tuple q-rung orthopair fuzzy sets. Appl. Soft Comput. 2025, 175, 112919. [Google Scholar]
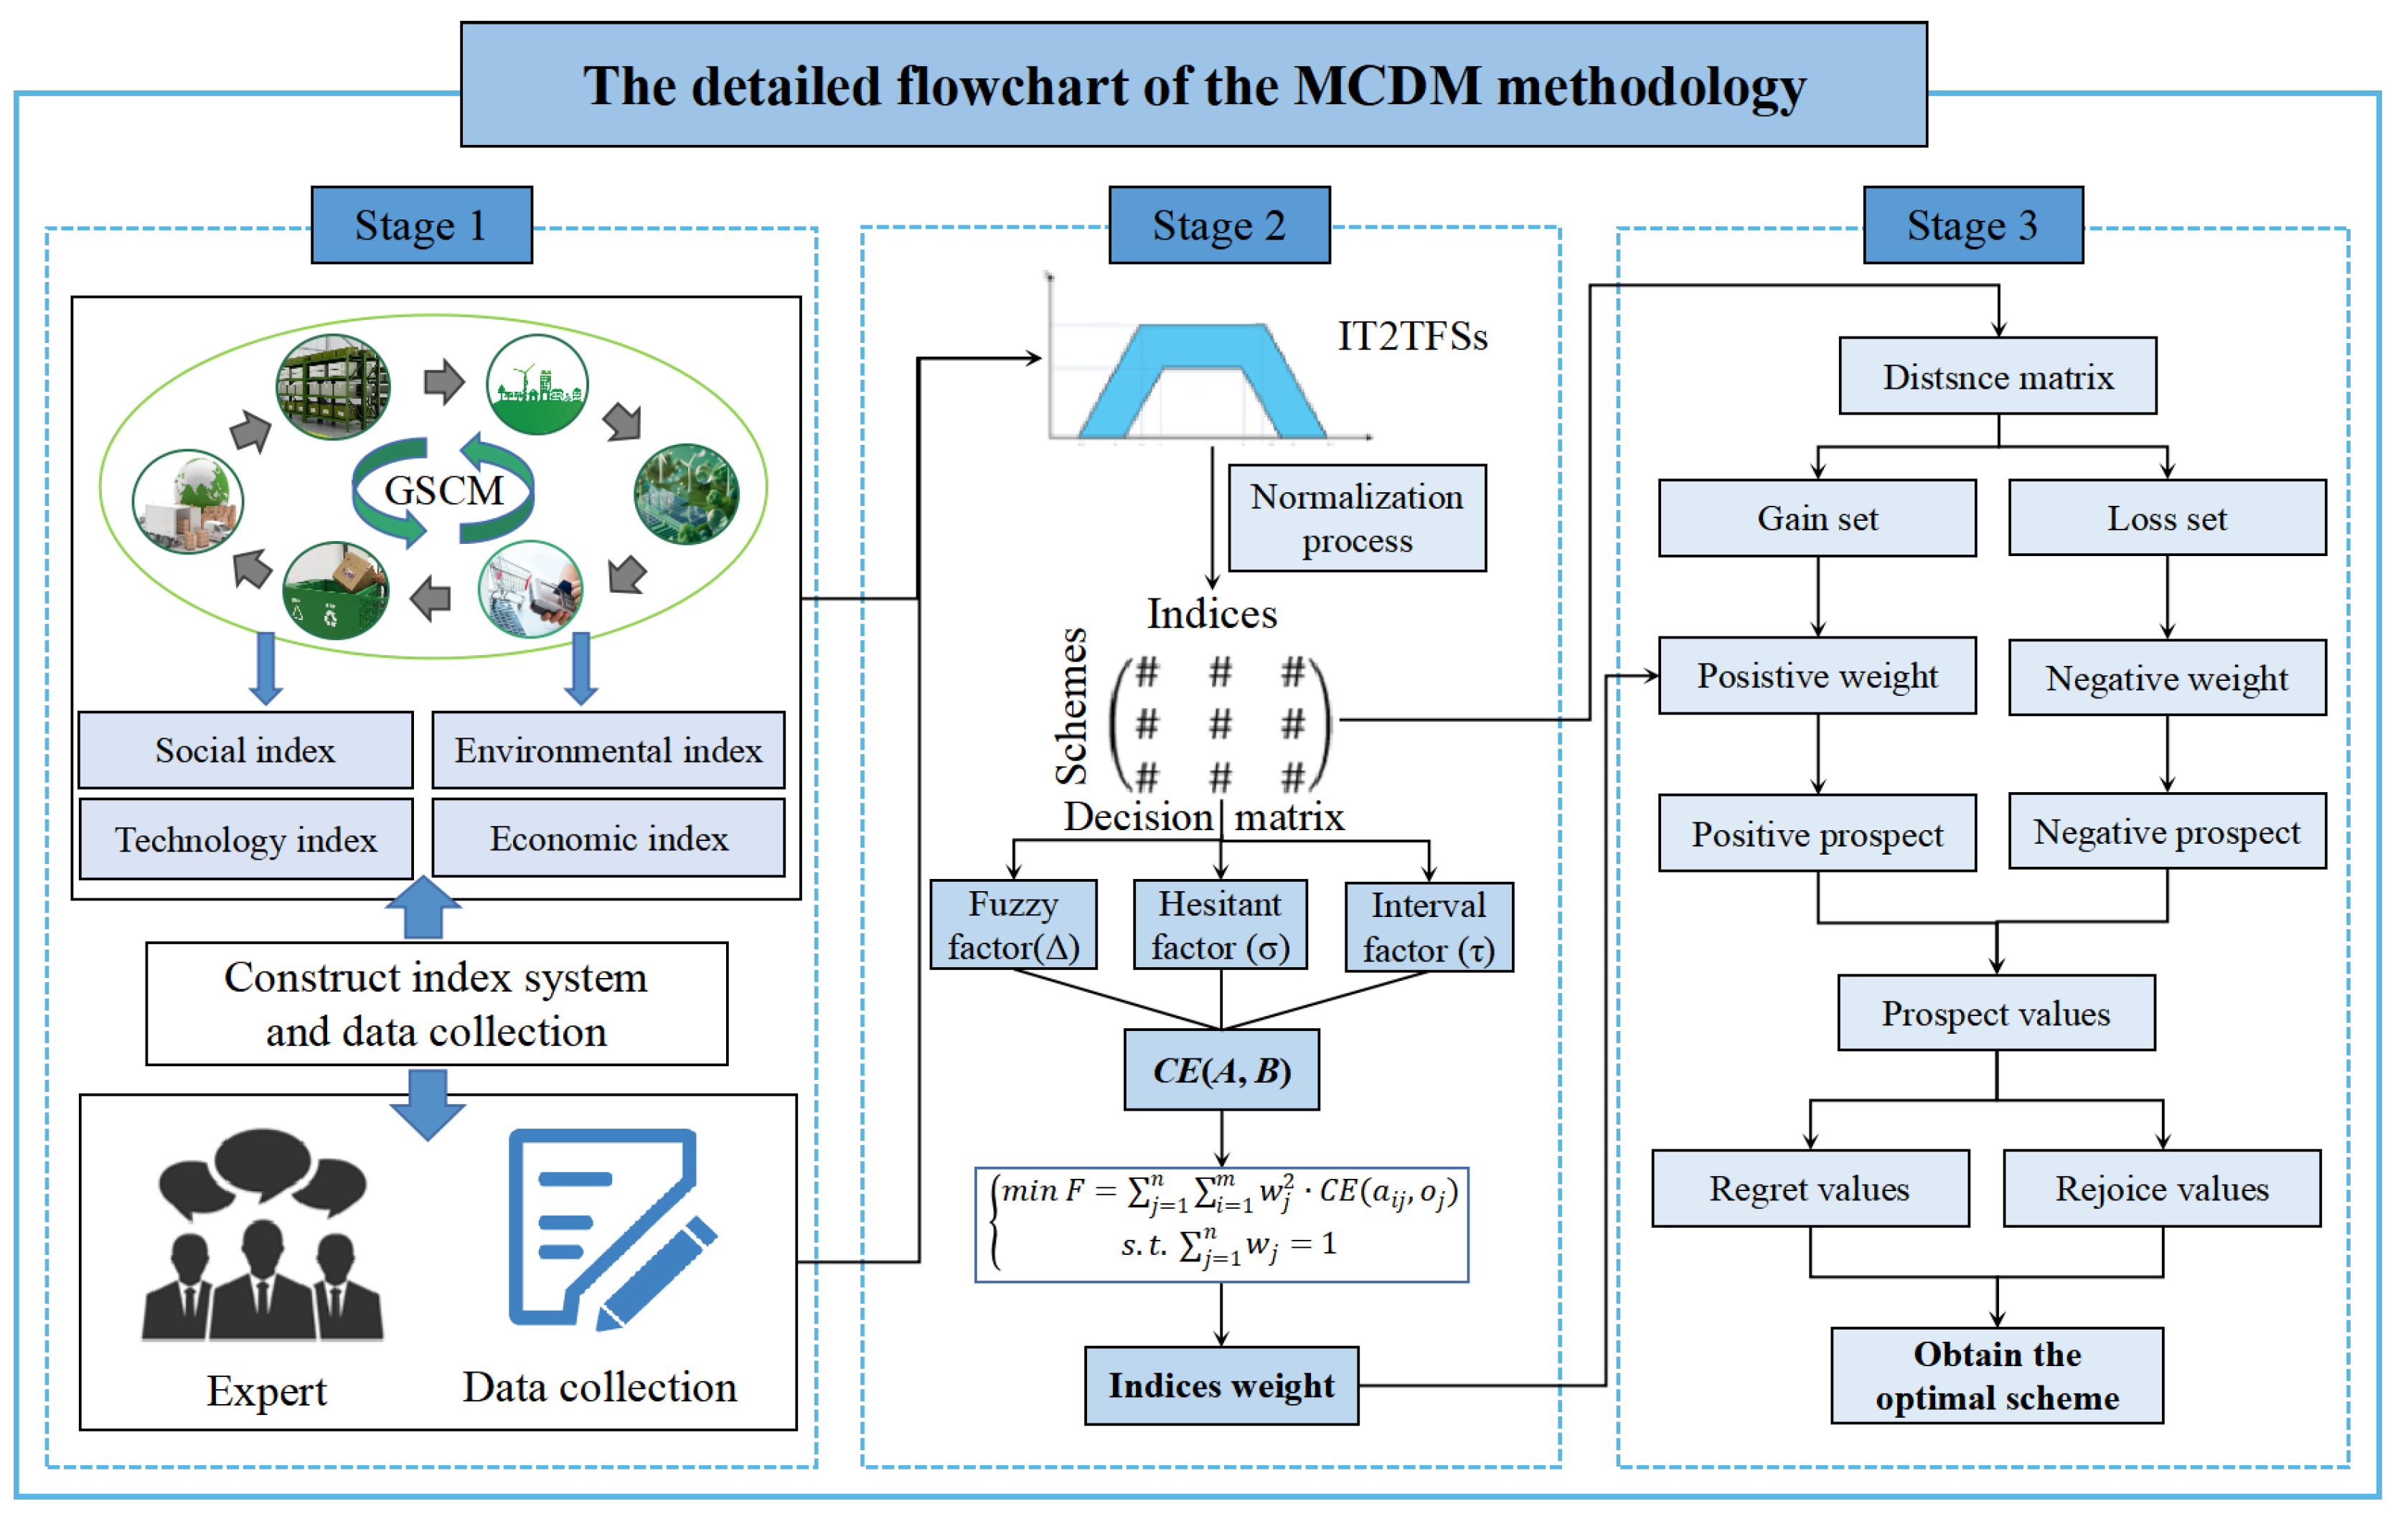
Figure 1. The detailed flowchart of the MCDM methodology.
Sustainability 17 03323 g001
Figure 2. The multi-dimensional index system for GSCM.
Sustainability 17 03323 g002
Figure 3. The weight distribution of the GSCM index.
Sustainability 17 03323 g003
Figure 4. The ranking distribution for sensitivity analysis.
Sustainability 17 03323 g004
Table 1. Key mathematical notations and definitions.
SymbolDefinition
IT2TFS A = [ A U , A L ] Interval type-2 trapezoidal fuzzy set (IT2TFS)
( a 1 U , a 2 U , a 3 U , a 4 U ) Upper trapezoidal bounds of membership function
( a 1 L , a 2 L , a 3 L , a 4 L ) Lower trapezoidal bounds of membership function
h A U , h A L Heights of upper and lower membership functions
Cross-Entropy Δ A Fuzzy factor (ambiguity in IT2TFS membership)
σ A Hesitant factor (deviation from mean membership)
τ A Interval factor (gap between upper and lower membership means)
C E ( A , B ) Cross-entropy between IT2TFSs A and B
Prospect–Regret Theory S i j + Gain deviation (positive difference from reference point)
S i j Loss deviation (negative difference from reference point)
ψ , φ Risk aversion coefficients for gains ( ψ ) and losses ( φ )
λ Loss aversion multiplier (typically λ > 1)
π + ( w j ) , π ( w j ) Weight functions for gains and losses
v i j + , v i j Prospect values for gains and losses
r i t , g i t Regret and rejoice values between alternatives r and g
Table 2. IT2TFS linguistic term.
Linguistic VariablesIT2TFSs
Very dissatisfied (VD)[(0,0,0,0.1;1), (0,0,0,0.05;0.9)]
Dissatisfied (D)[(0,0.1,0.2,0.31;1), (0.05,0.12,0.18,0.2;0.9)]
Lower dissatisfied (LD)[(0.1,0.3,0.4,0.5;1), (0.2,0.32,0.38,0.4;0.9)]
Middle (M)[(0.3,0.5,0.6,0.7;1), (0.4,0.52,0.58,0.6;0.9)]
Lower satisfied (LS)[(0.5,0.7,0.8,0.9;1), (0.6,0.72,0.78,0.8;0.9)]
Satisfied (S)[(0.7,0.9,0.95,1;1), (0.8,0.92,0.93,0.95;0.9)]
Very satisfied (VS)[(0.9,1,1,1.1;1), (0.95,1,1,1;0.9)]
Table 3. The literature on GSCM indices.
Attribute LevelIT2TFSsCodeReferences
Economic index (P1)Market expansionC1[2,26,37,47]
Information costC2[2,21,42,43,45]
Logistic costC3[42,44]
Cost of inventoryC4[32,36,45]
Environmental index (P2)Pollution productionC5[2,32,46,50,51]
Resource consumptionC6[47,48,52]
Environmental protectionC7[26,42]
Pollutant emissionsC8[42,43,49]
Green procurementC9[26,46]
Social index (P3)Optimal resource allocationC10[23,46]
Quality of after-sales serviceC11[2,26,37,47]
Delivery cycleC12[2,21,42,43]
Customer satisfactionC13[42,44]
Risk of liabilityC14[32,36,45]
Social demandsC15[2,32,46,50,51]
Technology index (P4)Product percent of passC16[47,48,52]
Repair return rateC17[26,42]
Table 4. The positive and negative weight.
C1C2C3C4C5C6C7C8C9C10C11C12C13C14C15C16C17
π+0.0880.1370.0990.0770.1350.1860.0780.1420.1920.1610.1050.1460.2100.1890.1380.1180.129
π0.0680.1170.0790.0590.1150.1700.0590.1230.1760.1420.0850.1270.1970.1730.1180.0980.109
Table 5. The prospect matrix.
Alt.v+vv
1[(−0.649, 0.320, 0.863, 1.468; 1);
(0.170, 0.551, 0.760, 1.075; 0.9)]
[(−2.669, −1.267, −0.169, 1.454; 1);
(−1.251, −0.967, −0.535, 0.143; 0.9)]
[(−3.318, −0.948, 0.694, 2.922; 1);
(−1.080, −0.416, 0.225, 1.217; 0.9)]
2[(−0.625, 0.352, 0.913, 1.545; 1);
(0.192, 0.581, 0.798, 1.115; 0.9)]
[(−2.652, −1.240, −0.082, 1.609; 1);
(−1.218, −0.935, −0.478, 0.209; 0.9)]
[(−3.278, −0.888, 0.831, 3.154; 1);
(−1.026, −0.354, 0.320, 1.324; 0.9)]
3[(−0.699, 0.219, 0.743, 1.362; 1);
(0.056, 0426, 0.644, 0.964; 0.9)]
[(−2.748, −1.466, −0.440, 1.247; 1);
(−1.466, 1.228, −0.797, −0.099; 0.9)]
[(−3.447, −1.247, 0.303, 2.609; 1);
(−1.410, −0.802, −0.152, 0.865; 0.9)]
4[(−0.749, 0.120, 0.678, 1.345; 1);
(−0.022, 0.327, 0.553, 0.879; 0.9)]
[(−2.854, −1.614, −0.585, 1.209; 1);
(−1.614, −1.397, −0.974, −0.305; 0.9)]
[(−3.603, −1.494, 0.093, 2.554; 1);
(−1.635, −1.070, −0.421, 0.575; 0.9)]
5[(−0.749, 0.150, 0.699, 1.374; 1);
(0.003, 0.352, 0.565, 0.896; 0.9)]
[(−2.834, −1.557, −0.507, 1.248; 1);
(−1.559, −1.312, −0.894, −0.248; 0.9)]
[(−3.583, −1.407, 0.1915, 2.621; 1);
(−1.556, −0.960, −0.330, 0.648; 0.9)]
Table 6. The ranking results for sensitivity analysis.
No.WeightsDRG ValueRanking
A1A2A3A4A5
1wC1 = 0.68, wC2–17 = 0.023.6060.5602.0174.4624.410A4  > A5  > A1 > A3 > A2
2wC2 = 0.68, wC1,C3–17 = 0.020.9281.6313.6755.4914.979A4 > A5 > A3 > A2 > A1
3wC3 = 0.68, wC1–2,C4–17 = 0.020.7131.8665.1791.4365.941A5 > A3 > A2 > A4 > A1
4wC4 = 0.68, wC1–3,C5–17 = 0.022.0480.9544.8844.9083.894A4 > A3 > A5 > A1 > A2
5wC5 = 0.68, wC1–4,C6–17 = 0.022.9581.8394.7485.1183.914A4 > A3 > A5 > A2 > A1
6wC6 = 0.68, wC1–5,C7–17 = 0.022.4890.9383.3134.8395.983A5 > A4 > A3 > A2 > A1
7wC7 = 0.68, wC1–6,C8–17 = 0.021.0781.0562.5804.2955.827A5 > A4 > A3 > A1 > A2
8wC8 = 0.68, wC1–7,C9–17 = 0.022.9092.7342.2715.1444.167A5 > A4 > A1 > A2 > A3
9wC9 = 0.68, wC1–8,C10–17 = 0.021.2933.7263.6643.2022.880A2 > A3 > A4 > A5 > A1
10wC10 = 0.68, wC1–9,C11–17 = 0.022.6053.1463.0853.3172.991A4 > A2 > A3 > A5 > A1
11wC11 = 0.68, wC1–10,C12–17 = 0.021.8961.4873.7924.0525.647A5 > A4 > A3 > A1 > A2
12wC12 = 0.68, wC1–11,C13–17 = 0.023.9452.9202.3924.5303.032A4 > A1 > A5 > A2 > A3
13wC13 = 0.68, wC1–12,C14–17 = 0.021.5760.9993.4774.5314.100A4 > A5 > A3 > A1 > A2
14wC14 = 0.68, wC1–13,C15–17 = 0.023.3001.9854.0853.2713.324A3 > A5 > A1 > A4 > A2
15wC15 = 0.68, wC1–14,C16–17 = 0.024.5860.7342.2415.0032.507A4 > A1 > A5 > A3 > A2
16wC16 = 0.68, wC1–15,C17 = 0.020.7981.4893.0534.7575.612A5 > A4 > A3 > A2 > A1
17wC17 = 0.68, wC1–16 = 0.021.5531.7843.5675.7895.185A4 > A5 > A3 > A2 > A1
18wC1–17 = 0.0594.2353.3265.9277.5027.340A4 > A5 > A3 > A1 > A2
Table 7. The results of the comparative analysis.
MCDM MethodsThe Values of SchemesRanking
A1A2A3A4A5
IT2TFS–prospect0.13660.30480.78081.28281.0858A4 > A5 > A3 > A2 > A1
IT2TFS–regret0.40000.29250.77380.98630.7800A4 > A5 > A3 > A1 > A2
The proposed method4.09373.79225.45386.62696.2321A4 > A5 > A3 > A1 > A2
Disclaimer/Publisher’s Note: The statements, opinions and data contained in all publications are solely those of the individual author(s) and contributor(s) and not of MDPI and/or the editor(s). MDPI and/or the editor(s) disclaim responsibility for any injury to people or property resulting from any ideas, methods, instructions or products referred to in the content.