Article

How Does the Government Policy Mix Influence the Used Battery Recycling in a New Energy Vehicle Closed-Loop Supply Chain?

School of Management Engineering, Qingdao University of Technology, Qingdao 266520, China
*
Authors to whom correspondence should be addressed.
Sustainability 2025, 17(8), 3324; https://doi.org/10.3390/su17083324
Submission received: 12 March 2025 / Revised: 2 April 2025 / Accepted: 4 April 2025 / Published: 8 April 2025

Abstract

The sales of New Energy Vehicles (NEVs) have experienced substantial growth, resulting in a significant increase in the number of used NEV batteries. Improper disposal of these used batteries can lead to pollution and resource wastage. In line with the Extended Producer Responsibility (EPR) principles, this research designs a three-level hybrid recycling closed-loop supply chain (CLSC) consisting of a manufacturer, retailer, and third-party recycler. Furthermore, Stackelberg game theory is applied to develop distinct game models for analyzing the interactions among the supply chain participants. To research the interaction among multiple policies on the hybrid recycling system, it explores the optimal pricing and the CLSC’s recycling performance under the policy mix. In addition, a coordination mechanism is devised and validated to solve the decline in members’ individual profits caused by the policy mix. The findings indicate that battery tax policy may reduce total profits, and subsidy policies could result in enterprise dependency, but the policy mix can lead to increase in both recycling price and amount. This research demonstrates the policy mix can overcome the limitations of single policy, implement a long-term and dynamically adjustable incentive mechanism and provide a crucial reference for the government’s role as the “visible hand” in recycling.

1. Introduction

Recycling end-of-life products has emerged as a global issue, garnering the attention of numerous governments, businesses, and consumers. If managed effectively, end-of-life products can transform into valuable recycled resources; however, improper handling can lead to significant environmental pollution and resource waste. One of the most critical end-of-life products is NEV batteries. By 2028, the total used battery stock is projected to surpass 548 GWh [1]. For instance, it is indicated that by the year 2030, China alone will have approximately 708,000 units of used NEV batteries [2]. The heavy metals contained in these batteries, such as lead, nickel, cobalt, and other metallic materials, possess high recycling value, but their improper disposal poses a significant threat to humans and nature [3]. Additionally, with the NEV’s rising sales, the gap between the supply and demand of metals required for new batteries remains substantial, and the recycling of used batteries is a crucial method to bridge this gap [4]. Recycling used batteries necessitates a sustainable CLSC ecosystem; however, the market’s invisible hand alone is insufficient to drive the sustainable development of this recycling ecosystem [5]. Currently, various countries have implemented distinct policies to address the recycling of used NEV batteries. For example, China has adopted a policy centered on EPR, which mandates that both car and battery manufacturers assume responsibility for recycling. To ensure comprehensive tracking throughout the battery life cycle, from production to sales, recycling, and reuse, China has established the “Power Battery Traceability Management Platform” [6]. While this policy does not specify explicit quantitative recycling targets, it places significant emphasis on full life cycle management. In contrast, the EU Battery Regulation (2023) sets clear recycling targets, requiring that by 2030, the recovery rates for cobalt, lithium, and nickel reach 90%, 50%, and 90%, respectively. Additionally, it mandates the use of specific proportions of recycled materials, such as 4% recycled lithium content by 2030. Battery manufacturers are also required to cover recycling costs and establish a recycling network spanning all member states [7]. Compared to China’s approach, the EU’s policy features more precise quantitative targets and emphasizes cross-border collaboration among member states. Some countries have also adopted multiple policies. For example, South Korea integrates incentive mechanisms with mandatory regulations by establishing a target of achieving a 70% recycling rate and providing subsidy to recycling enterprises [8]. Compared with single policy that narrowly focus on specific stages and are limited in scope, a policy mix can more comprehensively cover the entire supply chain, including production, recycling, and reuse processes. Therefore, this research aims to explore the government’s policy mix to expedite the improvement and maturation of the recycling system.
To effectively manage the disposal of used batteries, governments have implemented several targeted policies to encourage recycling and remanufacturing activities [9]. One example is the implementation of the EPR system. EPR is an environmentally friendly policy that mandates manufacturers to assume accountability not only during the manufacturing phase but throughout the entire product lifecycle phase, with particular emphasis on the recycling and disposal phases [10]. For instance, to stimulate the development of the circular utilization market for NEV batteries, the European Union enacted the Battery Regulation, which mandates that producers incorporate recycled materials into new NEV batteries by establishing minimum recycling thresholds [11]. However, the recycling rate remains overly low in developed nations and extremely low in developing nations. In EU, many EPR policies’ impacts remains ambiguous, and their applications in household appliances, NEVs, and other industries have not been standardized, presenting significant challenges for EPR adoption [12]. Furthermore, the gradual reduction in government subsidies in many countries over recent years has led to increasing skepticism regarding the efficacy of these subsidies in promoting EPR implementation [13]. To address the challenges faced by the EPR framework, exploring new and effective policies is imperative. Imposing taxes on supply chain upstream entities is considered a viable exploratory measure consistent with the EPR system. Specifically, in the context of NEV battery recycling, a battery tax could be levied on upstream enterprises [14]. So, this research takes battery tax, recycling dismantling subsidy, and reward and punishment mechanism as the policy mix to study.
Very few studies have studied policy mix and its impact on NEV battery recycling and the EPR system implementation, let alone studies on the influence of policy mix on a three-level hybrid CLSC. Therefore, this research focuses on pricing and supply chain coordination in the three-level CLSC of used batteries under the government policy mix. Three different decision scenarios are studied: decentralized decision-making without the policy mix (Model C), decentralized decision-making under the policy mix (Model T), and centralized decision-making under the policy mix (Model Y). Building upon this framework, the research investigates how government policy mix influences pricing and profit variations among CLSC members across these three scenarios. Specifically, the contributions are as follows: (1) Three decision scenarios are developed to identify the optimal one that can both enhance the recycling amount of used batteries and simultaneously maximize individual profits of supply chain members. (2) The effects of the policy mix on pricing, individual profit, and the total profit and recycling amount are separately discussed. (3) Provide a coordination mechanism that can mitigate the dual marginal effects of government policy mix without compromising the profitability of the entire supply chain, thereby achieving a Pareto improvement and sustainable development of the CLSC. Furthermore, the findings offer valuable insights for supply chain members and provide significant references for governments to adopt differentiated policies or policy mix that vary with different recycling entities and recycling modes.
The remainder of this research is outlined as follows. In Section 2, this research reviews the relevant literature. In Section 3, this research delineates three decision-making scenarios, introduces the assumptions and definitions, analyzes the models and results, and constructs a coordination mechanism based on them. Section 4 and Section 5 conduct numerical experiments and discuss them. The last section contains conclusions and future research directions.

2. Literature Review

2.1. CLSC of NEVs’ Used Batteries

To ensure the successful implementation of NEV used battery recycling, a comprehensive understanding of the CLSC of used batteries is indispensable, so we begin with a brief review. Previous research can be broadly categorized into three directions: capacity allocation in forward supply chain and dynamic decision-making and green effect in the reverse supply chain. In terms of capacity allocation, the upstream manufacturer is capable of producing batteries and assembling electric vehicles, while the downstream manufacturer can only assemble electric vehicles, research has been carried out on the equilibrium capacity allocation strategies of both in the competition for market share in the forward supply chain [15]. Several researchers have investigated the strategies adopted by the NEV manufacturers for allocating battery capacity and have conducted numerical simulations to examine the impact of key parameters on the resulting equilibrium allocation strategies [16]. In terms of dynamic decision-making, scholars used differential game models to study the supply chain with a competitive manufacturer and a retailer, found the optimal path for each decision-making variable, and analyzed the impact of manufacturer pricing on the decision-making processes of participants within the dynamic supply chain framework [17]. In terms of the green effect, there are many scholars who have explored the optimal recycling and low-carbon strategies of NEV manufacturers under the background of carbon reduction by constructing a Stackelberg game model with battery manufacturers as the leaders and downstream companies as followers [18,19]. In addition, scholars also considered the influence of consumers’ carbon emotion on the batteries recycled NEVs from the perspective of the CLSC [20]. From the above, scholars have accomplished considerable research regarding capacity allocation of upstream enterprises, dynamic decision-making, and the low-carbon CLSC. However, most of these studies have merely been established on a two-level supply chain, often lacking the participation of professional third parties.

2.2. Pricing of NEV Batteries Recycling Supply Chain

One significant area of research is pricing. According to the different participants in the CLSC of NEVs, pricing research can be divided into three categories: scenarios where the manufacturer and the remanufacturer are not the same entity, situations involving only manufacturers and retailers, and hybrid recycling models that include the third parties. Some scholars studied battery recycling and reuse where manufacturers and remanufacturers were different entities, examined three phases of the electric vehicle batteries’ recycling and reuse CLSC, developed manufacturers’ and remanufacturers’ optimal pricing strategies, and discussed the correlations among return rates, sorting rates, and recycling rates [21]. Within the supply chain formed by manufacturers and retailers, some scholars obtained the optimal pricing and production decision based on the Stackelberg game model, and they analyzed in depth the pricing optimization strategy for NEVs and the selection of channel models [22]. When retailers are competitive, the retailers can offer manufacturers joint incentives to maximize green initiative efforts and leverage the return rate as a strategic marketing tool in the battery sector [23]. Additionally, a few scholars introduced the concept of third-party recycling platforms and analyzed the relationship between the commission rates of these platforms and the recycling prices of used batteries, particularly within the context of supply and demand mismatch [24]. In the case of considering fairness issues, the recycling rate, profit, and cost of a CLSC that includes a third-party were also analyzed [25]. In the current research, the recycling pricing of the used NEV batteries are mostly dominated by supply chain entities such as manufacturers and retailers, lacking the intervention of external regulators. This reliance on internal supply chain adjustments alone is likely to prolong the time required to establish a sustainable recycling system.

2.3. The Impacts of Government Policies in Supply Chain

Another significant area of research is the influence of policies. Recently, an increasing number of studies have focused on how policies affect recycling rates, pricing strategies, and secondary utilization. Some scholars have examined subsidy and dual credit policies, revealing that the recycling rate of batteries is the most critical paramount factor influencing the competitive position of NEV manufacturers [26]. Others scholars have investigated the effects of the reward and punishment policy on recycling rate, considering six recycling models that include different stakeholders, and concluding that increasing reward and punishment intensity can help to increase recycling rates [27]. In addition, there are lots of studies focusing on policy and pricing. Several scholars examined the effect of policy on the relationship between pricing and production decision, pricing, and service levels [22,24]. Other scholars have researched the optimal pricing under the impact of policy in online and offline dual-channel battery recycling and designed a mechanism to coordinate the supply chain under various power structures [28]. Apart from the recycling rate and pricing mentioned above, policy impacts and secondary utilization have also attracted many scholars to study. For example, a study investigated government subsidy policies designed to promote the secondary use of NEV batteries. The findings indicated that subsidies would only be considered by the government when recycled batteries possess high residual power or when the remanufacturing rate is relatively low [29]. Other scholars developed an evolutionary game model that integrates battery recycling with cascading utilization to analyze competition and cooperation. Their findings suggest that the government should implement a supervised subsidy mechanism to foster stable collaboration among supply chain participants [30]. Scholars have most frequently investigated single policies in their research on the CLSC, such as subsidies, dual credit policy, and reward and punishment mechanisms. Indeed, some scholars have explored the influence of dual policies [26,30]. However, compared with the complex multi-policy environment in reality, these studies still have a significant gap, and there has been very little research on implementing EPR policies in the NEV batteries recycling field.
In conclusion, most current researchers have constructed a two-level CLSC consisting of two recyclers: the manufacturer and the retailer. Few researchers have explored the hybrid recycling CLSC that incorporates third-party recyclers. Previous research methods have focused on qualitative analysis, system dynamics, and game theory modeling approaches. Furthermore, the majority of researchers have examined the effects of a single policy on the CLSC, such as subsidies or carbon taxes. Only a limited number of them have explored dual policy mix, and systematic analyses of three-or-more policy interactions remain scarce. Additionally, there has been very little research on implementing EPR policies. Research on hybrid recycling CLSCs under multiple environmental policies is closer to reality. Given this, based on the above literature research and considering the EPR system, this research adopts the battery tax, recycling dismantling subsidy, and reward and punishment mechanism as a policy mix expanding from a single policy or dual polices to a three-policy mix to study the CLSC under the effect of multiple policies environment and designs a targeted cost–benefit-sharing contract to coordinate the CLSC to achieve the increase in both recycling amount and total profit and thus achieving a Pareto improvement. This research addresses significant gaps concerning the quantitative analysis of the interactive effects among three or more policies and designs a targeted coordination mechanism for the CLSC to effectively adapt to hybrid recycling channels and complex policy environments.

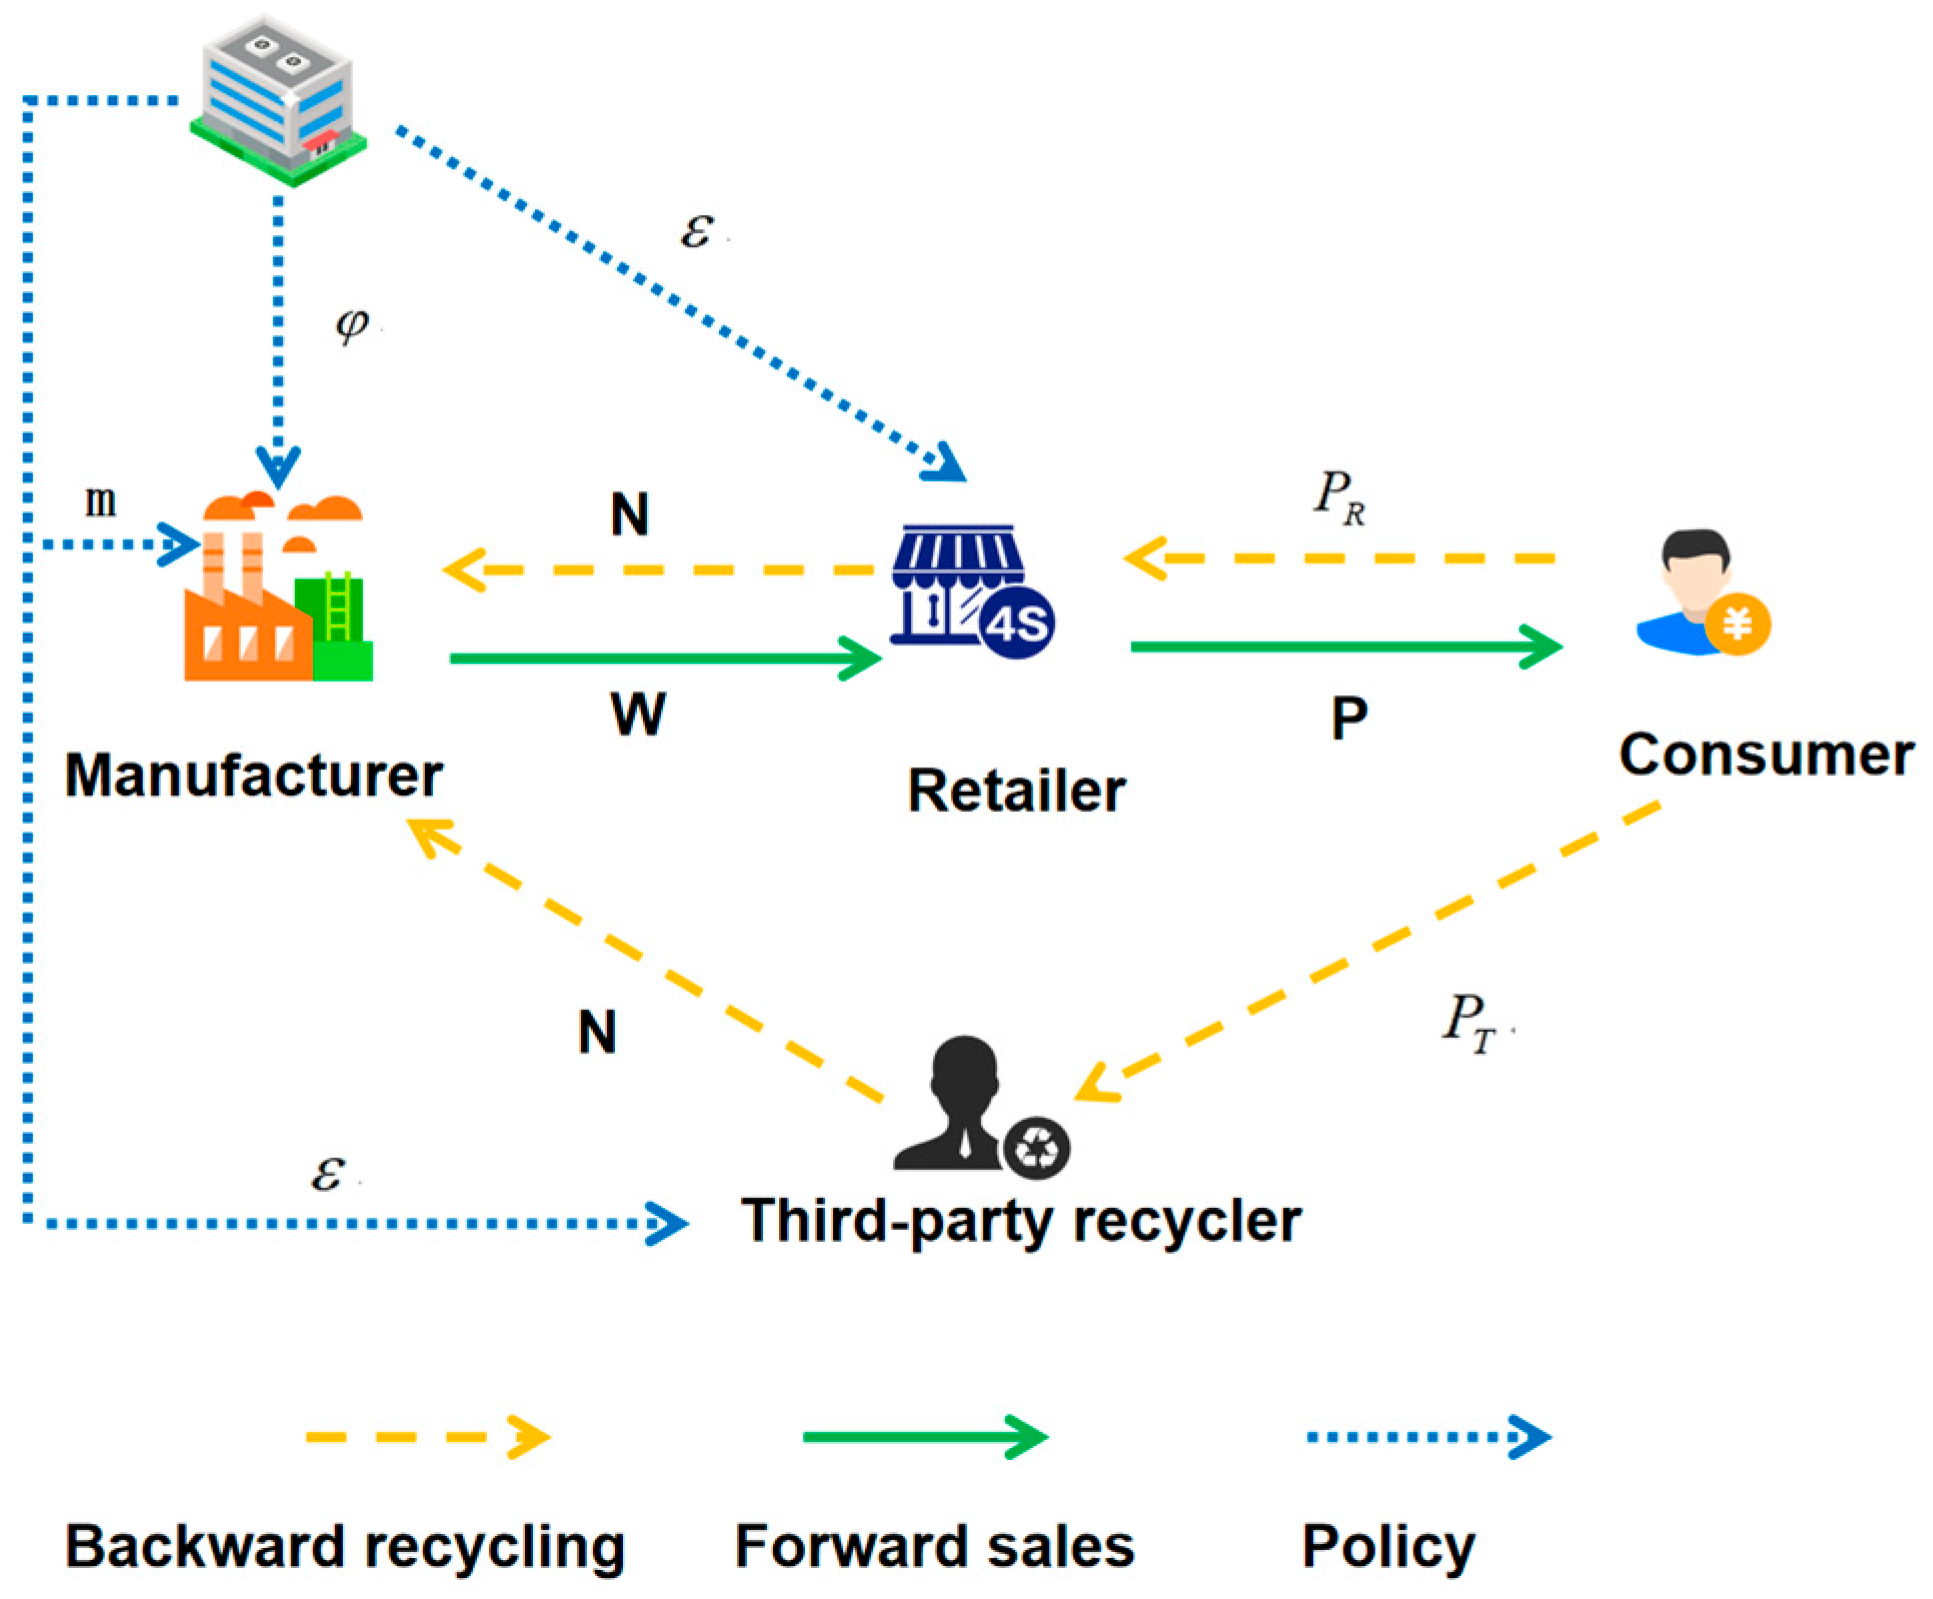
3. Model Description

3.1. Basic Assumptions and Parameter Description

Hypothesis 1. 
It is assumed that there is no information asymmetry among the manufacturer, retailer, and third-party and that their behavior is under complete information, without considering the risks associated with incomplete information.
Hypothesis 2. 
To ensure that manufacturer actively participates in the remanufacturing process, it is assumed that the manufacturer’s labor and material expenses for producing one unit of newly produced product exceeds the expenses for one unit of remanufactured product, that is,  C 1 > C 2 . This is assuming that the manufacturer’s cost savings from the remanufacturing process are pure profit, that is, Δ , Δ = C 1 C 2 , Δ > N .
Hypothesis 3. 
It is assumed that the newly produced product does not differ substantially from the remanufactured one, with identical performance, sale price, and consumer acceptance, and that the manufacturer acquires used NEV batteries from a retailer and third-party recycler at the same transfer payment price N.
Hypothesis 4. 
Assume that the NEVs market demand function is  Q = a b P + k h , without taking into account the differences in car models, assuming that each NEV is equipped with (a group of) power batteries, that is, the NEVs’ demand and power batteries market’s demand is the same, and assuming the retailer is a 4S store.
Hypothesis 5. 
Different NEV used batteries recycling channels have competitive relationships; given that the recycling amount is related to the recycling prices of recycling members in the supply chain, an increase in the recycling price enhances consumers’ willingness to participate in batteries recycling. The equation representing the retailer’s recycling amount is shown in Equation (1), the third-party recycler recycling amount is shown in Equation (2), and the total recycling amount is shown in Equation (3).
D R = B + α P R
D T = α ( P T P R )
D = B + α P T
Hypothesis 6. 
The EPR system specifies that the manufacturer should assume responsibility for recycling of used and end-of-life products. Assume that a manufacturer’s unit battery tax is levied φ . The target recycling amount is D 0 . When the recycling amount of the manufacturer exceeds the target amount, the government will give the manufacturer m ( D D 0 ) rewards. When the recycling amount of the manufacturer is lower than the target amount, the government will give the manufacturer m ( D 0 D ) punishments. Set the unit recycling dismantling subsidy for the recycling unit of NEVs’ used batteries as ε .

3.2. Problem Formulation

For ease of discussion, this research establishes a supply chain system comprising a manufacturer (M), a retailer (R), and a third-party recycling entity (T). Within this framework, the manufacturer, as the supply chain leader, sets the wholesale price and transfer payment price for recyclers. It is assumed that the manufacturer does not engage in direct recycling but instead outsources this task to the retailer and the third-party recycler. The manufacturer then utilizes the recycled materials to produce new products. The retailer purchases NEVs from the manufacturer and is also involved in recycling and subsequent sale. Furthermore, the third-party recycler provides recycling services on behalf of the manufacturer. In terms of the decision-making sequence, the manufacturer first determines both the wholesale price and the transfer payment price, while the retailer and third-party recycler respond passively. This establishes a typical hierarchical decision-making structure within the CLSC system. Furthermore, given that the manufacturer is the focal company of the NEVs and batteries within CLSC system, this research sets up a Stackelberg game with manufacturer as the leader. In addition, the relevant symbols and variables in the model are presented in Table 1.
Outside the CLSC, the government intervenes in recycling used batteries in the CLSC through a policy mix. For ease of expression, the three models of government intervention are named Model-C, Model-T, and Model-Y, as shown below.
As shown in Figure 1, Model-C comprises both forward sales and backward recycling channels. In the forward sales channel, the retailer procures NEVs from the manufacturer at the wholesale price w and subsequently sells them to consumers at the retail price p . In the backward recycling channel, the retailer and a third-party recycler recycle used batteries from consumers at respective recycling prices p r and p t . The batteries recycled by both parties are then repurchased by the manufacturer at the transfer payment price N.
As shown in Figure 2, Model-T builds upon Model-C by incorporating the intervention of the government’s policy mix. Under this model, to better implement the EPR system, the government simultaneously adopts three policies: a battery tax, a reward and punishment mechanism, and a recycling dismantling subsidy under the CLSC. First, battery tax φ per unit of used products is levied on the manufacturer. Second, the government gives manufacturer m ( D D 0 ) rewards when they recycle more than the target recycling amount D 0 and m ( D 0 D ) penalties when they recycle less than the target recycling amount D 0 . Third, the government provides a per unit recycling dismantling subsidy ε to the recycler.
As shown in Figure 3, Model-Y extends from Model-T and is centralized decision-making within a CLSC.

3.3. Solving the Models in Three Different Decision-Making Scenarios

3.3.1. Decentralized Decision-Making Without the Policy Mix

In Model-C, without government involvement, the members in the supply chain are in a natural state of the market environment; they make separate decisions to maximize their respective interests.
π M C = ( w C 1 ) ( a b P + k h ) + ( Δ N ) ( B + α P T ) π R C = ( P w ) ( a b P + k h ) + ( N P R ) ( B + α P R ) π T C = ( N P T ) α ( P T P R )
Manufacturer’s profit, retailer’s profit, and third-party recycler’s profit are denoted by π M C , π R C , and π T C , respectively. Let π denote the total profit.
As the dominant player in the supply chain, the manufacturer initially sets the wholesale price, w, and the transfer payment price, N. Subsequently, the retailer and the third-party recycler determine their respective sale prices and recycling prices, P , P R , and P T , based on the manufacturer’s established strategy. Since the manufacturer takes into account the impacts of the followers’ decisions on the decision-making process, it prioritizes solving the best response functions of the followers to achieve the Nash equilibrium.
Use the inverse solution methodology by deriving Equation ( π R C ) with respect to P C , P R C , and set the resulting partial derivative to zero, thereby obtaining the desired solution:
P C = ( a + k h + w b ) 2 b P R C = ( α N B ) 2 α
The Hessian matrix corresponding to Equation ( π R C ) with respect to the variables P C and P R C is formulated as follows:
H 1 = 2 b 0 0 2 a
Since 2 a < 0 , 2 b < 0 , so the Hessian matrix H 1 is a negative definite matrix, and there exists a unique P C and P R C such that π R C achieves the maximum value.
The same reasoning can be used to obtain the following:
w M C = a + k h + b C 1 2 b N M C = Δ α B 2 α P T C = 3 N α B 4 α
Substituting w M C and N M C into P C , P T C , and P R C obtained in the previous step gives the following:
P C = 3 a + 3 k h + b C 1 4 b P R C = Δ α 3 B 4 α P T C = 3 Δ α 5 B 8 α
By substituting the recycling prices set by the retailer and the third-party recycler into the recycling function, we can find the corresponding recycling amount:
D R C = Δ α + B 4 D T C = Δ α + B 8 D C = 3 ( Δ α + B ) 8
Then, the profits of each member and the total profit are as follows:
π M C = ( a + k h b C 1 ) 2 8 b + 3 ( Δ α + B ) 2 16 α π R C = ( a + k h b C 1 ) 2 16 b + ( Δ α + B ) 2 16 α π T C = ( Δ α + B ) 2 64 α π C = 3 ( a + k h b C 1 ) 2 16 b + 17 ( Δ α + B ) 2 64 α

3.3.2. Decentralized Decision-Making Under the Policy Mix

In the T-model, both the retailer and the third-party recycler continue to maximize their individual profits. Consequently, the functions can be derived as below:
π M T = ( w C 1 φ ) ( a b P + k h ) + ( Δ N ) ( B + α P T ) + m ( B + P α D 0 ) π R T = ( P w ) ( a b P + k h ) + ( N P R + ε ) ( B + α P R ) π T T = ( N P T + ε ) α ( P T P R )
Similarly, considering the manufacturer as the leader in the CLSC, with the retailer and third-party recycler as followers, the optimal decisions for all stakeholders involved can be determined through the application of the inverse solution method within a Stackelberg game framework:
w T = a + k h + b C 1 + φ b 2 b N T = Δ α B ε α + m α 2 α P T = 3 a + 3 k h + b C 1 + φ b 4 b P R T = Δ α 3 B + ε α + m α 4 α P T T = 3 Δ α 5 B + 3 ε α + 3 m α 8 α
Substituting Equation (12) into the recycling function, respectively, we can find that the amount of recycling is as follows:
D R T = Δ α + B + m a + ε α 4 D T T = Δ α + B + m a + ε α 8 D T = 3 ( Δ α + B + m a + ε α ) 8
Then, the profits of each member and the total profit are as follows:
π M T = ( a + k h b C 1 φ b ) 2 8 b + 3 ( Δ α + B + m α + ε α ) 2 16 α m D 0 π R T = ( a + k h b C 1 φ b ) 2 16 b + ( Δ α + B + m α + ε α ) 2 16 α π T T = ( Δ α + B + m α + ε α ) 2 64 α π T = 3 ( a + k h b C 1 φ b ) 2 16 b + 17 ( Δ α + B + m α + ε α ) 2 64 α m D 0

3.3.3. Centralized Decision-Making Under the Policy Mix

In the Y-Model, the CLSC operates as an integrated system where manufacturer, retailer, and third-party recycler work together to negotiate wholesale, sales, and recycling prices to maximize the total profit of the CLSC. Simultaneously, the government adopts a policy mix that includes a battery tax and reward and punishment mechanisms, along with a recycling dismantling subsidy. The profit function for this system can be formulated as follows:
π Y = ( P C 1 φ ) ( a b P + k h ) + ( Δ P R + ε + m ) ( B + α P T ) α ( P T P R ) 2 m D 0
Similarly, the equilibrium solution of the CLSC is as follows:
P Y = a + k h + b C 1 + φ b 2 b P R Y = Δ α 2 B + m α + α ε 3 α P T Y = 2 Δ α B + 2 m α + 2 α ε 3 α
Then, the amount of recycling and the profit is as follows:
D R Y = Δ α + B + m a + ε α 3 D T Y = Δ α + B + m a + ε α 3 D Y = 2 ( Δ α + B + m a + ε α ) 3
π Y = ( a + k h b C 1 φ b ) 2 4 b + ( Δ α + B + m α + ε α ) 2 3 α m D 0

3.3.4. Solution Results and Analysis

To more comprehensively analyze the influence of different decision-making scenarios on the CLSC, this research compares the equilibrium solutions among Model-C, Model-T and Model-Y as presented in Table 2.
(1) By comparing the decentralized decision-making under no policy mix (Model C) with the decentralized decision-making under the policy mix (Model T), the propositions can be drawn about decentralized decision-making as follows:
Proposition 1. 
w T > w C , P T > P C , P R T > P R C , P T T > P T C , D R T > D R C , D T T > D T C .
Proof. 
w T w C = φ 2 > 0 , P T P C = φ 4 > 0 w T > w C , P T > P C
P R T P R C = m + α 4 > 0 , P T T P T C = 3 ( m + α ) 8 > 0 D R T D R C = m α + α ε 4 > 0 , D T T D T C = m α + α ε 8 > 0
P R T > P R C , P T T > P T C , D R T > D R C , D T T > D T C . □
Proposition 1 suggests that when the government intervenes, the wholesale price set by manufacturer and the sale price set by retailer are higher compared to the scenario without government intervention, and the recycling price and recycling amount of the retailer and third-party recycler rise, with the total recycling amount also significantly increased. Among them, the wholesale price and sale price are only affected by the battery tax, and the battery tax in the policy mix will increase the manufacturer’s production costs. To ensure its own profit, the manufacturer will raise the wholesale price accordingly. The raise in wholesale price will lead to retailer’s cost rise, and then the retailer will raise the sale price to ensure their own profits. Moreover, the raise in the recycling price exhibits a positive correlation with the reward and punishment intensity, and the increase in the recycling amount exhibits a positive correlation with both the reward and punishment intensity and the recycling dismantling subsidy. This effectively demonstrates that government participation can promote the recycling of NEVs and effectively increase the recycling amount.
Proposition 2. 
While m > ε , N T > N C ; while m < ε , N T < N C .
Proof. 
N T N C = m ε 2 w h i l e , m > ε , N T > N C ; w h i l e , m < ε , N T < N C . □
Proposition 2 suggests that the manufacturer’s transfer payment price is affected by the recycling dismantling subsidy ε and the reward and punishment intensity m. When the reward and punishment intensity is greater than the recycling dismantling subsidy, the government-provided recycling dismantling subsidy is not sufficient to compensate the manufacturer’s punishment for failing to meet the target recycling amount, so the manufacturer will raise transfer payment price to incentivize recycling. When the reward and punishment intensity is less than the recycling dismantling subsidy, the manufacturer’s punishment for failing to meet the target recycling amount will be compensated by the recycling dismantling subsidy, so the manufacturer will not proactively improve the transfer payment price, and the manufacturer is still profitable, which results in a lower transfer payment than in the case without government involvement.
Proposition 3. 
π M f T < π M f C , π R f T < π R f C , π R r T > π R r C , π T r T > π T r C
Denote the forward supply chain by f and the reverse supply chain by  r .
W h i l e   6 ( Δ α + B ) ( m + ε ) + 3 ( m α + ε α ) 2 16 α m D 0 > 0 , π M r T > π M r C
Proof. 
π M f = π M f T π M f C = ( a + k h + b C 1 φ b ) 2 ( a + k h b C 1 ) 2 8 b < 0 π R f = π R f T π R f C = ( a + k h + b C 1 φ b ) 2 ( a + k h b C 1 ) 2 16 b < 0 π M r = π M r T π M r C = 6 ( Δ α + B ) ( m + ε ) + 3 ( m α + ε α ) 2 16 α m D 0 > 0 π R r = π R r T π R r C = 2 Δ α 3 B m ε + ( m α + ε α ) 2 16 α > 0 π T r = π T r T π T r C = ( Δ α + B + m α + ε α ) 3 ( Δ α + B ) 2 64 α > 0 . □
Proposition 3 suggests that the implementation of a policy mix leads to reduced profits for both the manufacturer and retailer in the forward supply chain, while simultaneously enhancing the retailer’s and third-party recycler’s profits in the reverse supply chain, and the manufacturer’s profit in the reverse supply chain increases only if m , ε , D 0 satisfies certain conditions, otherwise it decreases. Although the policy mix stimulates the reverse supply chain, it concurrently diminishes the profit of the forward supply chain, which may hinder the sustainable development of the CLSC, and therefore needs to be coordinated.
(2) By comparing the decentralized decision-making model under the policy mix (Model T) with the centralized decision-making model under the policy mix (Model Y), the following propositions under the policy mix can be obtained:
Proposition 4. 
W h i l e   φ < b C 1 a k h b , P Y < P T
Proof. 
P Y P T = b C 1 a k h + b φ 4 b W h i l e   φ < b C 1 a k h b , P Y < P T
Easy to know in context φ < b C 1 a k h b . □
Proposition 4 shows that centralized decision-making can result in lower sale price and stimulate market demand.
Proposition 5. 
P R Y > P R T , P T Y > P T T , D R Y > D R T , D T Y > D T T
Proof. 
P R Y P R T = Δ α + ε α + m α + B 12 α > 0 P R Y > P R T , P T Y P T T = 7 ( Δ α + ε α + m α + B ) 24 α > 0 P T Y > P T T , D R Y D R T = Δ α + ε α + m α + B 12 > 0 D R Y > D R T , D T Y D T T = 5 ( Δ α + ε α + m α + B ) 24 > 0 D T Y > D T T . □
Proposition 5 shows that centralized decision-making contributes more to the CLSC under the policy mix. In this model, the retailer and third-party recycler reap a higher recycling price and recycling amount than with decentralized decision-making, and the increase in recycling price and recycling amount is positively correlated with the recycling dismantling subsidy and the reward and punishment mechanism.
Proposition 6. 
π f Y > π f T , π r Y > π r T , π Y > π T .
Proof. 
π f Y > π f T , π r Y > π r T , π Y > π T π f = π f Y π f T = ( a + k h b C 1 φ b ) 2 16 b > 0 π f Y > π f T , π r = π r Y π r T = 13 ( Δ α + B + m α + α ε ) 2 192 α > 0 π r Y > π r T , π = π Y π T = ( a + k h b C 1 φ b ) 2 16 b + 13 ( Δ α + B + m α + α ε ) 2 192 α > 0 π Y > π T . □
Proposition 6 suggests when the government employs a policy mix to intervene in recycling, centralized decision-making facilitates the enhancement of profitability in both forward and reverse supply chains, as well as across the entire CLSC, compared to decentralized decision-making. The underlying factors can be explained as follows: in a decentralized scenario, the retailer tends to increase sales prices to maximize their profit, which leads to a reduction in market demand. Both the retailer and third-party recycler lower recycling prices to minimize costs, which diminishes consumers’ willingness to participate in recycling, leading to a decline in total recycling amount. Although the policy mix enhances total profit and recycling amount under centralized decision-making, the policy mix strengthens the reverse supply chain, reducing the profits of the manufacturer and retailer in the forward supply chain under decentralized decision-making. Therefore, to stimulate the enthusiasm of all supply chain members and ensures sustainable development, it is imperative to establish an effective coordination mechanism.
Proposition 7. 
D T ε > 0 ; D Y ε > 0 ; π T ε > 0 ; π Y ε > 0 ;
Proof. 
D T ε = 3 α 8 > 0 ; D Y ε = 2 α 3 > 0 ; π T ε = 17 32 B + α m + Δ + ε > 0 ; π Y ε = 2 3 B + α m + Δ + ε > 0 . □
Proposition 7 suggests that when the government employs a policy mix to intervene, the total recycling amount and total profit of the CLSC are positively correlated with the subsidy level. Specifically, the increase in subsidies has a significant short-term incentive effect on the recycling, leading to a simultaneous increase in both the total recycling amount and total profit. However, this positive correlation also implies a potential risk of batteries recycling becoming overly reliant on subsidy. Should the subsidies be reduced or removed, the CLSC may suffer a reduction in total profits and a decline in recycling performance.
Proposition 8. 
π T φ < 0 ; π Y φ < 0 ; w h i l e , 0 < α < 1037 B 51 m 1037 Δ + 51 ε 36 φ , α ( 0 , 1 ) , π T > π C π Y > π C > π T > π C .
Proposition 8 demonstrates that when the government implements the policy mix, the total profit is negatively correlated with the battery tax. Specifically, as the battery tax increases, the total profit decreases correspondingly. While α < 1037 B 51 m 1037 Δ + 51 ε 36 φ , α ( 0 , 1 ) the total profit under policy intervention exceeds that without intervention, where α is influenced by level of government reward and punishment m, subsidy ε , and battery tax φ . This implies that while a single battery tax policy has a negative impact on the CLSC’s total profit, a policy mix may exert a positive influence. Therefore, it justifies the importance of quantifying research on the interaction among multiple policies.

3.4. Coordination Mechanism of the Three Partners

From the analysis of equilibrium outcomes presented above, it becomes evident that centralized decision-making, coupled with the policy mix, significantly enhances total profit. Under the policy mix, while the recycling amounts for both the retailer and the third-party recycler increase, the manufacturer’s and retailer’s profits in the forward supply chain will decrease in decentralized decision-making. To address this issue, this research proposes a cost–benefit-sharing contract as a coordination mechanism. Specifically, this contract involves implementing benefit-sharing in the forward supply chain, whereby the retailer acquires NEVs from the manufacturer at a discounted wholesale price, and to make up for the manufacturer’s profit loss, the retailer allocates a predetermined ratio of its sales benefit to the manufacturer. In the reverse supply chain, cost-sharing is adopted, whereby the manufacturer bears a certain percentage of the recycling costs incurred by the retailer and the third-party recycler. The specific method is the equilibrium solution under the centralized decision-making model with a clear advantage is selected as a known quantity, the manufacturer’s share of recycling cost is ϕ , and the share of total profit is θ , 0 < ϕ < 1 , 0 < θ < 1 . The functions can be derived as below:
π M Z = ( w C 1 φ ) ( a b P + k h ) + ( Δ N ) ( B + α P T ) + m ( B + α P T D 0 ) + θ P Q ϕ P R ( B + α P R ) ϕ P T α ( P T P R ) π R Z = ( ( 1 θ ) P w ) ( a b P + k h ) + ( N ( 1 ϕ ) P R + ε ) ( B + α P R ) π T Z = ( N ( 1 ϕ ) P T + ε ) α ( P T P R )
Similarly, using the inverse solution method, let P Z = P Y , P R Z = P R Y , substituting P R Y and P Y into Equation (19) to give the following:
w Z = ( 1 θ ) ( C 1 + φ ) N Z = ( 2 Δ α + 2 m α B ) ( 1 ϕ ) ( 1 + 2 ϕ ) α ε 3 α D Z = 2 ( Δ α + m α + B + α ε ) 3
π M T = θ ( a + k h b C 1 φ b ) 2 4 b + ( 1 ϕ ) ( Δ α + B + m α + ε α ) 2 6 α m D 0 π R T = ( 1 θ ) ( a + k h b C 1 φ b ) 2 4 b + ( 1 ϕ ) ( Δ α + B + m α + ε α ) 2 9 α π T T = ( 1 ϕ ) ( Δ α + B + m α + ε α ) 2 18 α
Proposition 9. 
P Z = P Y < P T , P R Z = P R Y > P R T , P T Z = P T Y > P T T , w Z < w T ;
While  0.5 θ 0.75 , 0.125 ϕ 0.4375 , π M Z π M T , π R Z π R T .
Proposition 9 shows that the cost–benefit-sharing contract can lead to a coordinated supply chain among CLSC members, with decentralized decision-making as close as possible to the level of profitability under centralized decision-making. Even if perfect coordination cannot be achieved, there may still be a Pareto optimal solution in which each member’s profit is at least not lower than it would have been.
Upon implementing the cost–benefit-sharing contract, CLSC coordination is achieved, with the wholesale and sale price falling while the recycling price and recycling amount increases. While  0.5 θ 0.75 , 0.125 ϕ 0.4375 , manufacturer’s and retailer’s profit will increase. Consumers are capable of selling second-hand NEVs at a higher price and purchasing new cars at a discounted one, which will significantly enhance consumers’ motivation to participate in recycling activities, thereby contributing to the sustainable development of the CLSC.

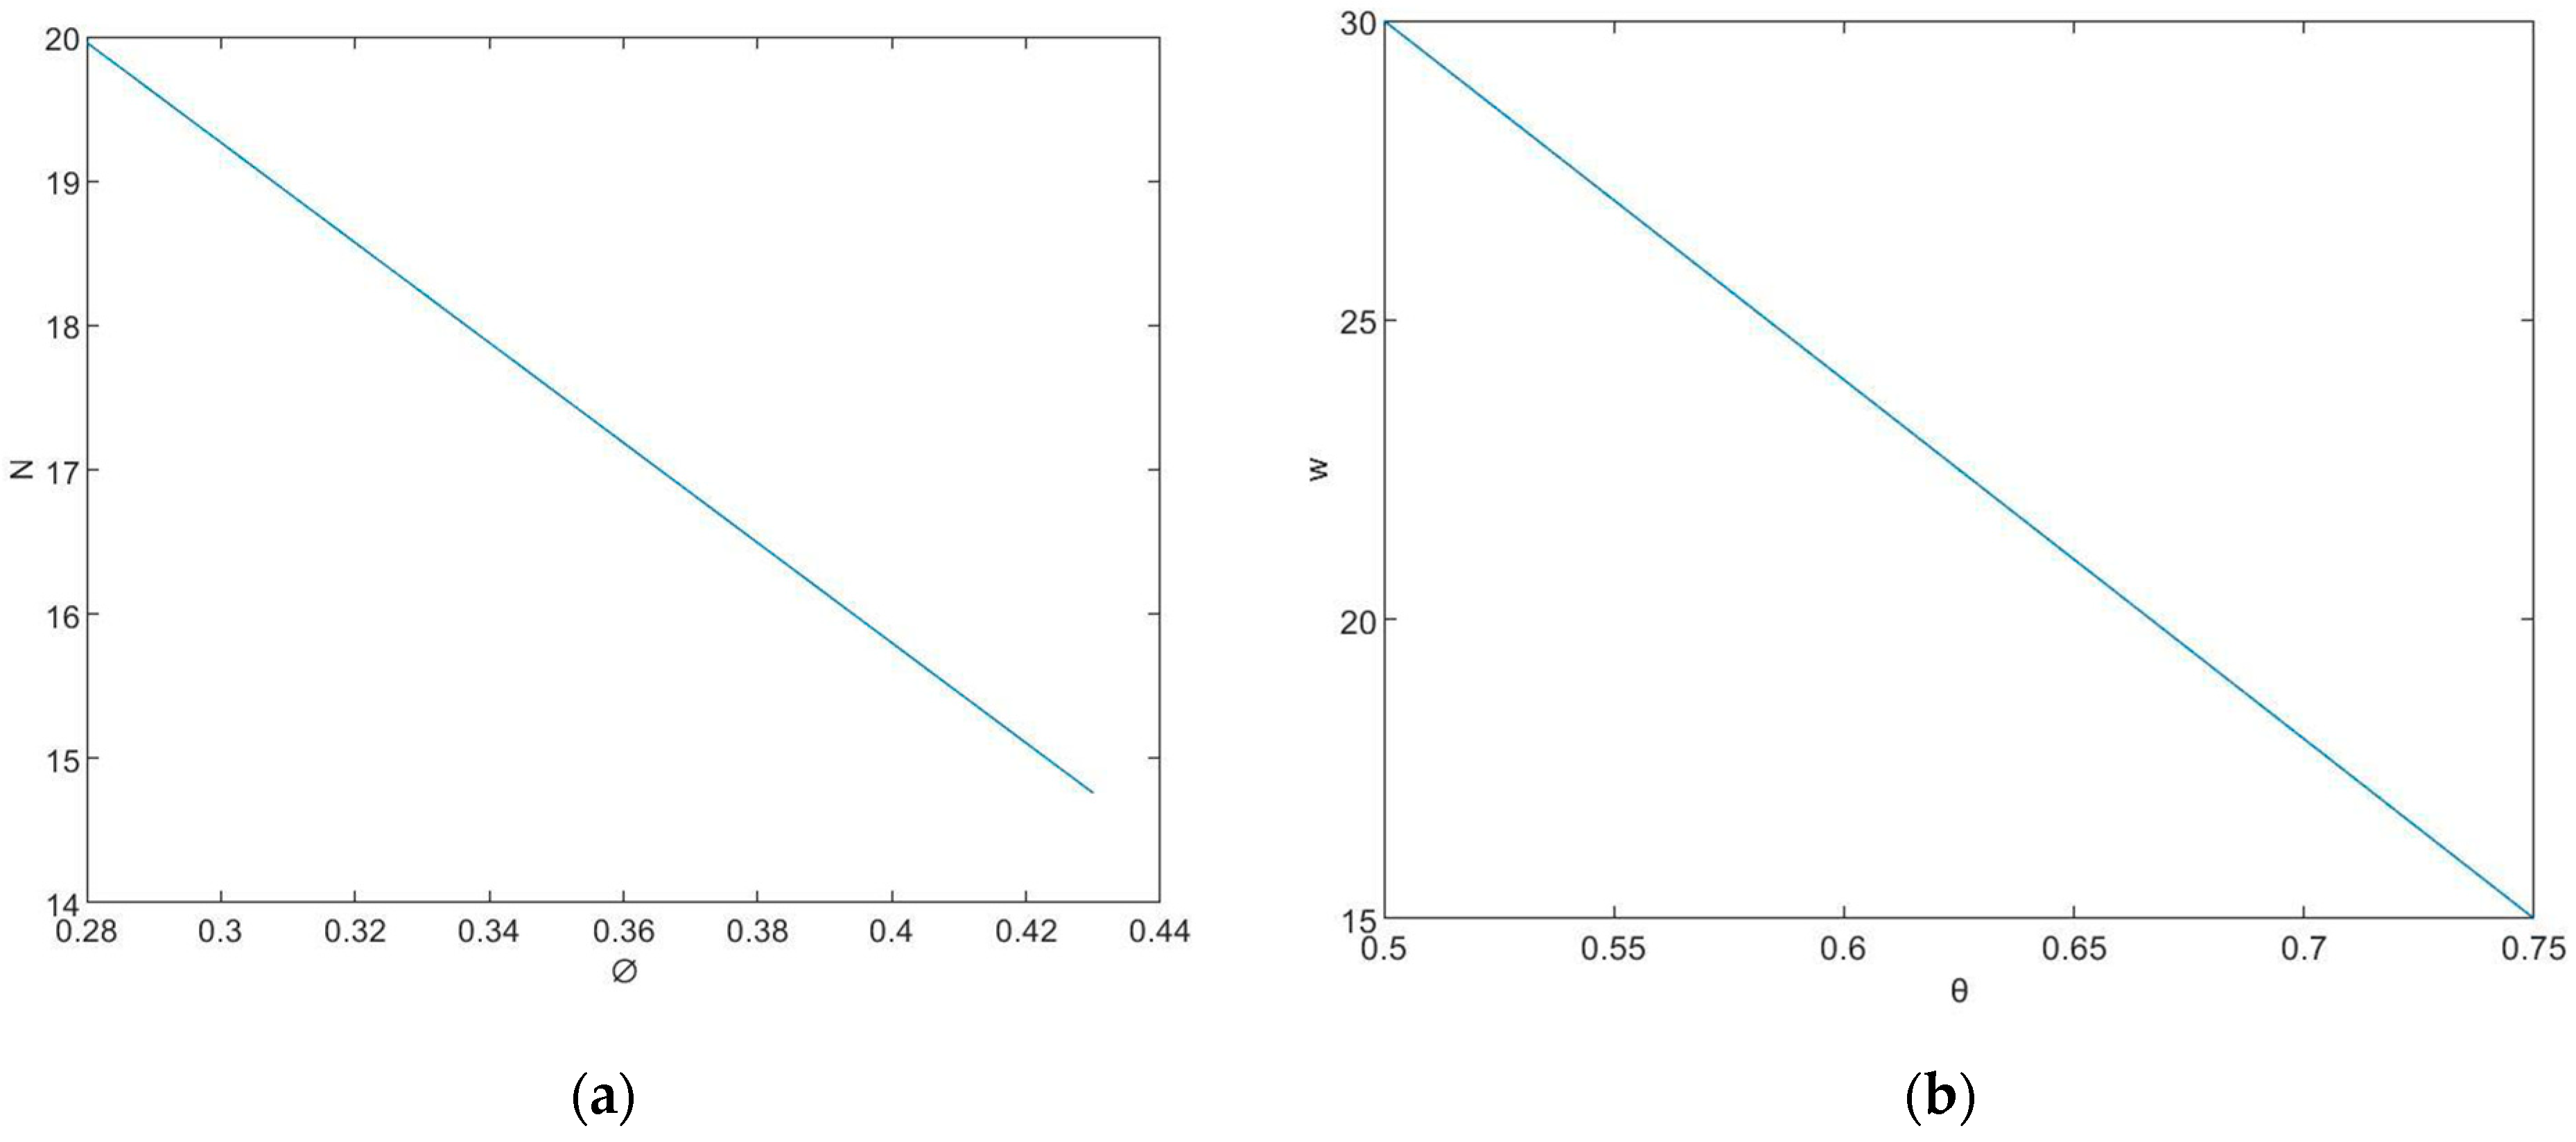
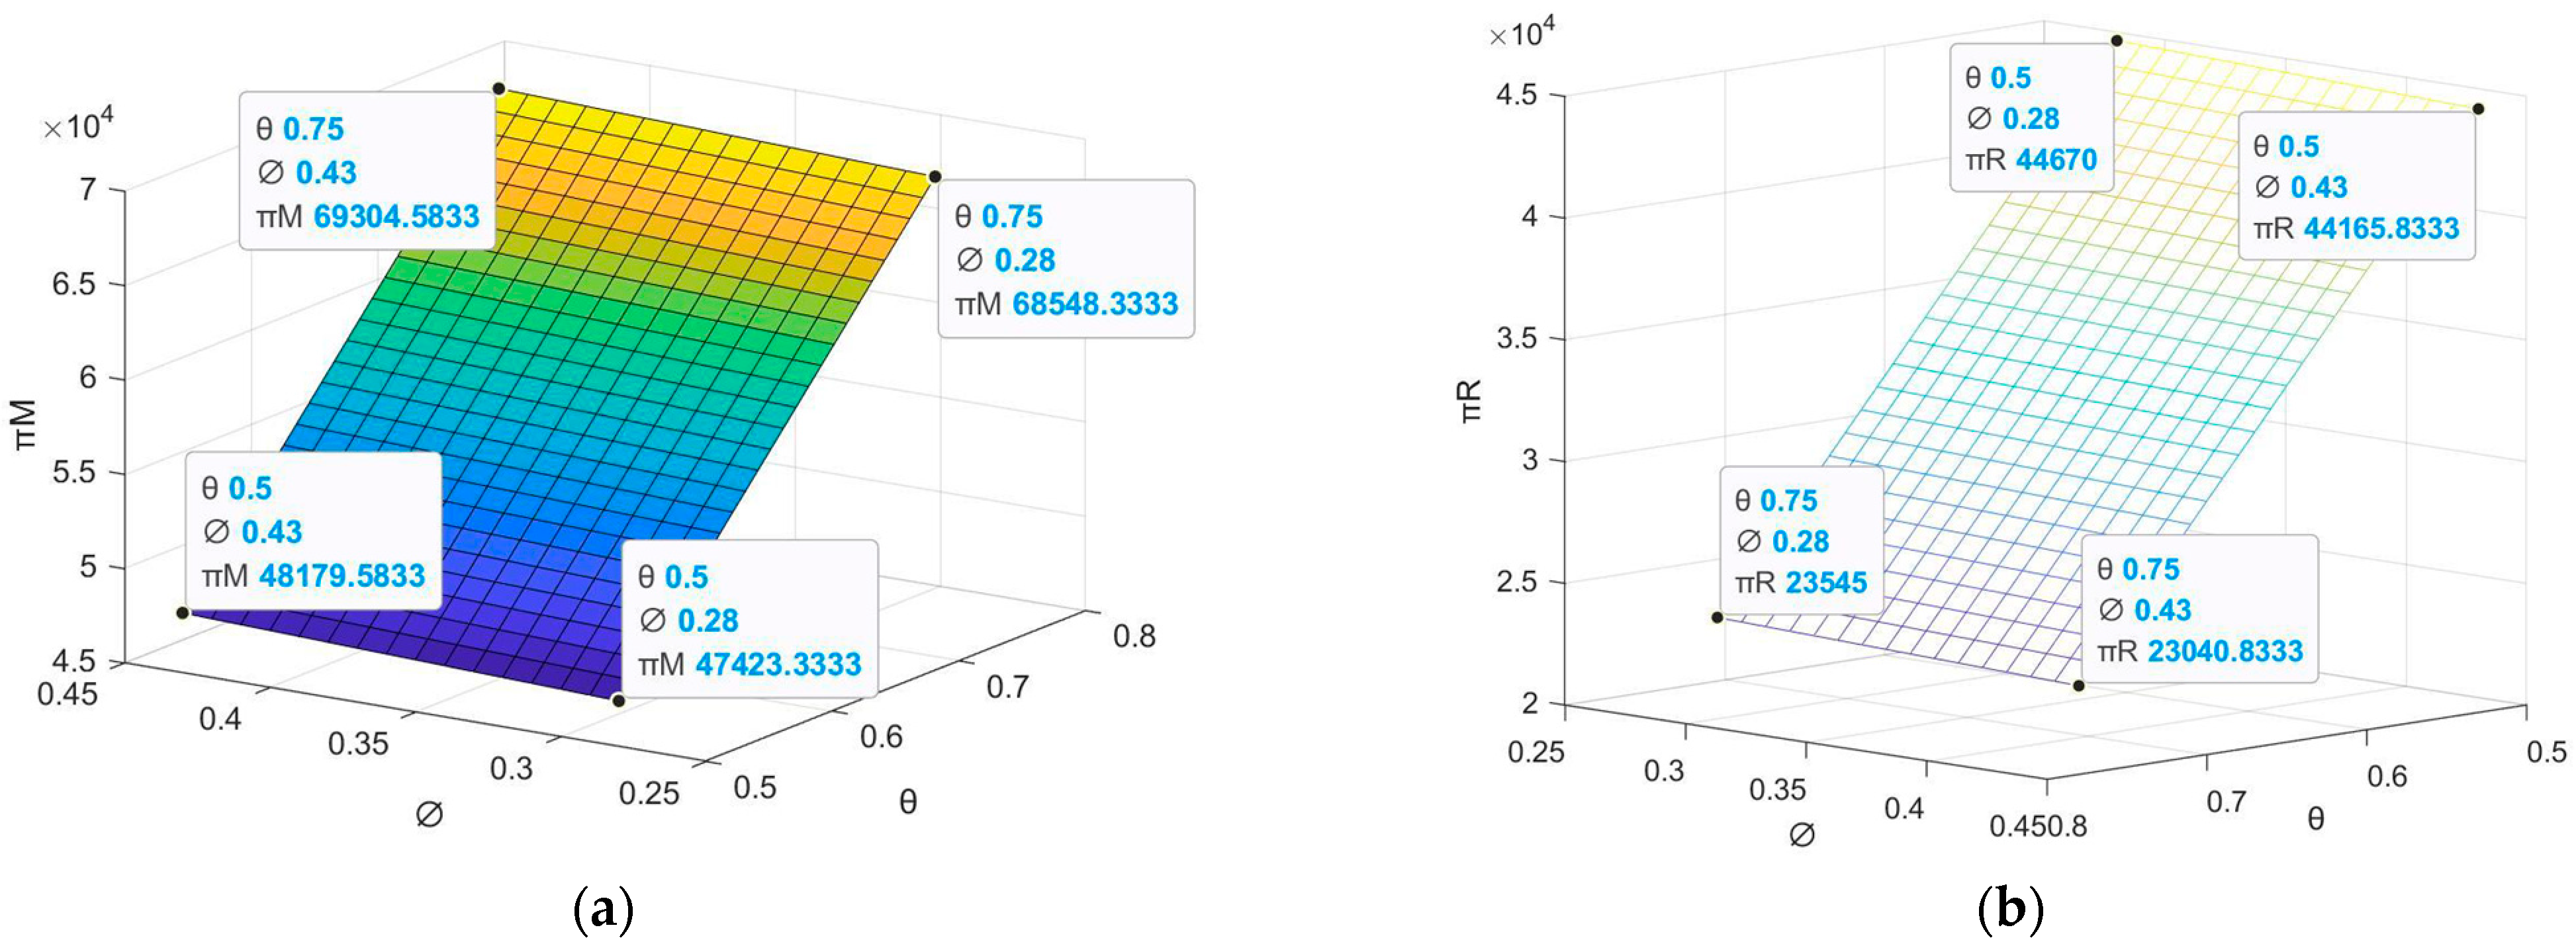
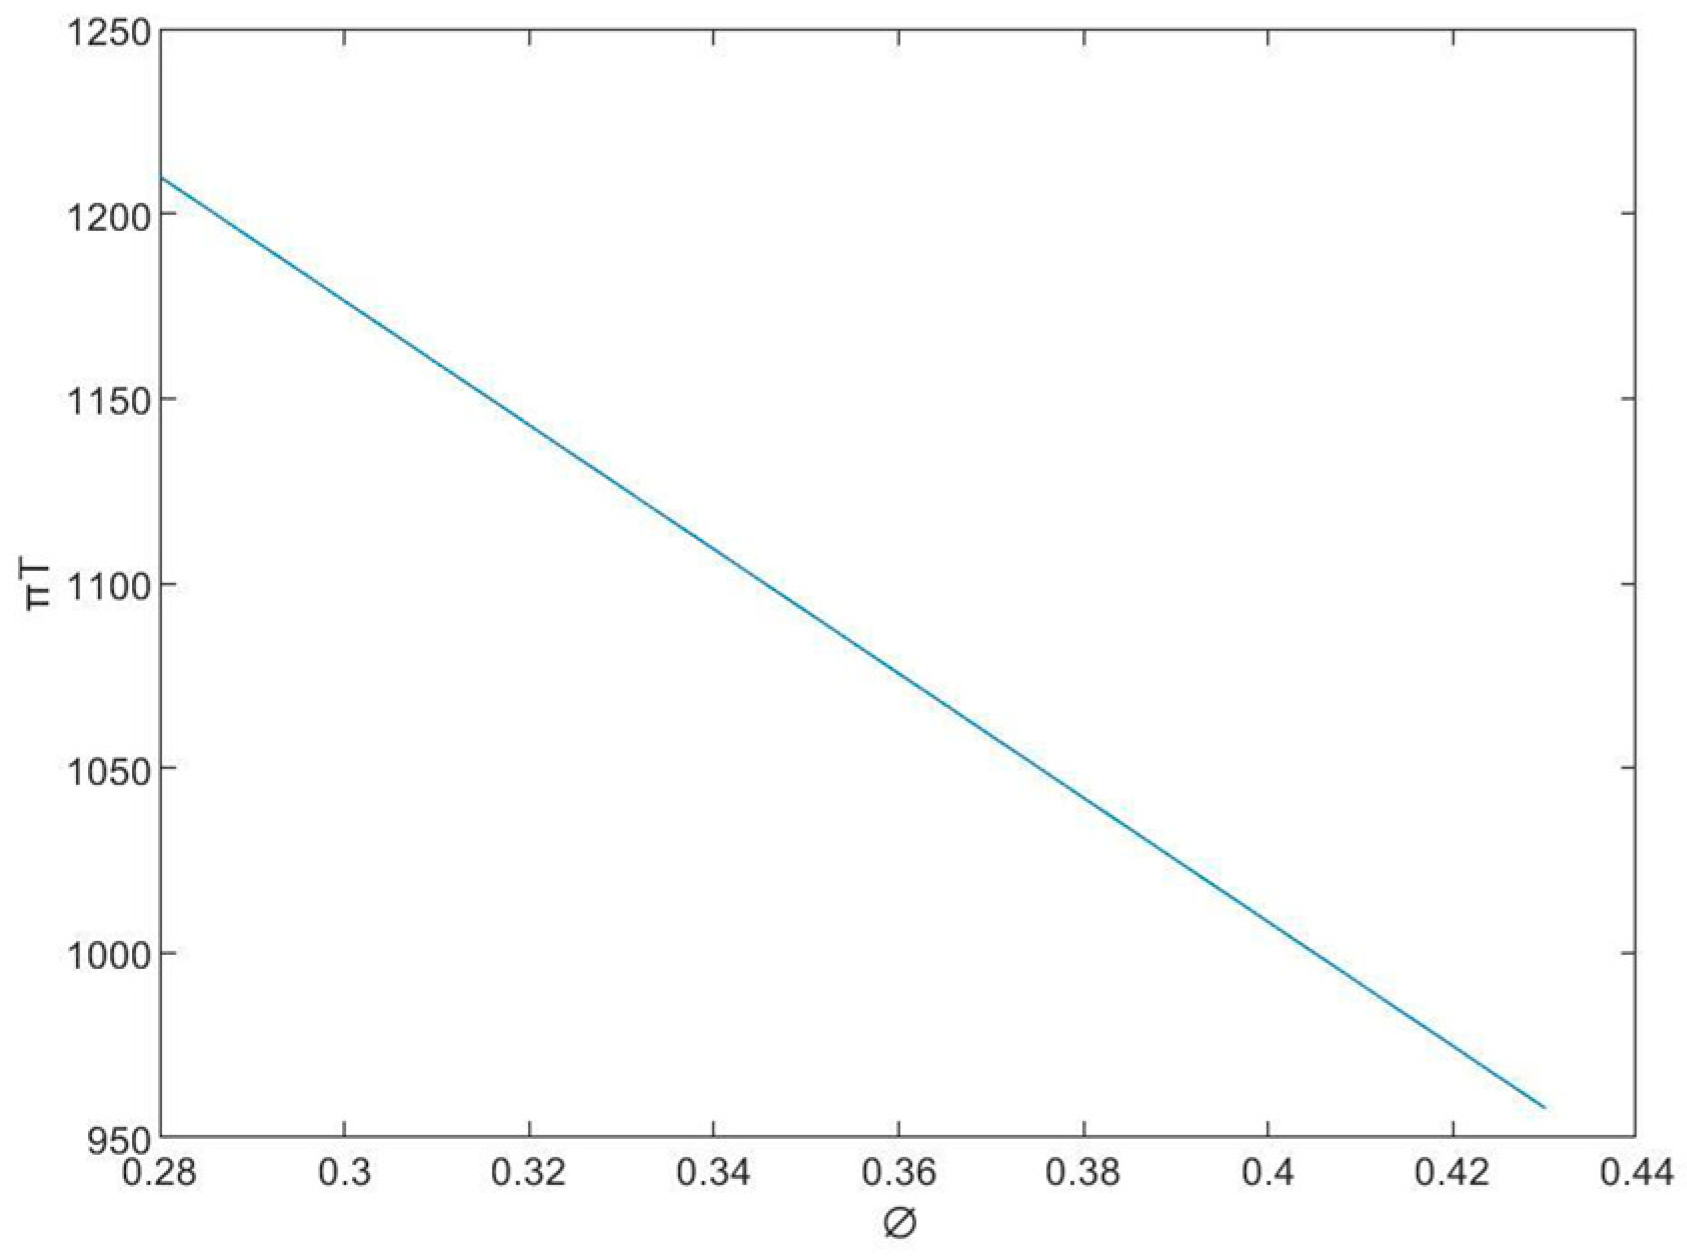
4. Numerical Analysis

To verify the reliability of the models, numerical simulation experiments are conducted to explore the equilibrium results under different decision-making models. Drawing on parallels with prior research and considering current realities, the parameters are set as Table 3 [22,24].

4.1. Profit and Recycling Price Analysis

Substituting the above assignments into the optimal solution values for every model is shown in Table 4 below:
Table 4 shows that (1) by comparing Model C with Model T, in the decentralized decision-making with the policy mix, both retailer’s and third-party recycler’s recycling price and amount increase, consistent with Proposition 1, indicating that the policy mix effectively promotes the development of the CLSC. (2) Under Model T, after the policy mix, the manufacturer’s and retailer’s profits in the forward supply chain decrease, while the total profits decrease, and the profits of all participants in the reverse supply chain improve. It shows that the government policy mix does not precisely facilitate the CLSC, which is consistent with Proposition 3’s conclusion. (3) By comparing Model T with Model Y, it can be indicated that under the influence of the policy mix, centralized decision-making leads to a reduced sale price in the forward supply chain and an increased recycling price along with a higher recycling amount in the reverse supply chain and enables the total profit to reach the optimal level. This shows that centralized decision-making has a more significant promoting impact on the CLSC.

4.2. Analysis of Coordination Mechanism

By Proposition 9, 0.5 θ 0.75 , 0.125 ϕ 0.4375 . The values of ϕ and θ are taken many times in this range, respectively, and are denoted as Contracts Ⅰ ( θ = 0.6 , ϕ = 0.3 ) , Ⅱ ( θ = 0.7 , ϕ = 0.3 ) , and Ⅲ ( θ = 0.7 , ϕ = 0.4 ) . Table 5 below presents the values of various contract variables.
As can be seen from Table 4 and Table 5 (1) in the cost–benefit-sharing contract under the policy mix, the decline of the manufacturer’s and retailer’s profit is mitigated, and the supply chain is effectively coordinated to reduce the decline in profit caused by government policies. (2) In the cost–benefit-sharing contract, the decrease in the wholesale price and sales price can effectively increase the market demand, and the retailer’s and third-party recycler’s recycling price and amount will also increase. This not only promotes the development of the forward supply chain, but also effectively promotes the development of the reverse supply chain and promotes the development of the whole value chain of NEV batteries.
It can be seen from Figure 4 that (1) under a cost–benefit-sharing contract, the manufacturer’s transfer payment price N is negatively correlated with the cost-sharing ratio ϕ and unrelated to profit-sharing ratio θ . The manufacturer’s wholesale price w is negatively correlated with profit-sharing ratio θ , but not with the cost-sharing ratio ϕ . (2) Figure 4a indicates that when the manufacturer bears a high shared ratio of recycling cost, the manufacturer will protect its profit by reducing the transfer payment price, and conversely, when the shared ratio of recycling cost is low, the manufacturer will encourage the retailer and third-party recycler to engage in recycling by raising the transfer payment price in the reverse supply chain. (3) Figure 4b indicates that when the retailer improves its profit-sharing ratio with the manufacturer, the manufacturer will reduce the wholesale price to reduce the retailer’s sales cost, thereby ensuring that the retailer can achieve a reasonable profit. Conversely, when the retailer lowers its profit-sharing ratio with the manufacturer, the manufacturer subsequently increases the wholesale price to safeguard its own profit margins.
Figure 5 shows that the following: (1) Figure 5a illustrates that under the cost–benefit-sharing contract, the manufacturer’s profit is positively correlated with the profit-sharing ratio θ and the cost-sharing ratio ϕ . Among them, the manufacturer’s profit is more affected by the profit-sharing ratio θ than by the cost-sharing ratio ϕ . This suggests that the degrees of influence exerted by the cost-sharing ratio and the profit-sharing ratio on the manufacturer’s profit differ. In actual business operations, if a manufacturer intends to enhance its recycling profits, it can prioritize increasing the profit-sharing ratio. (2) Figure 5b illustrates that retailer’ profit is negatively related to profit-sharing ratio and cost-sharing ratio. It shows that reducing the profit-sharing ratio and cost-sharing ratio can effectively increase retailer’s profit.
Figure 6 shows that under the cost–benefit-sharing contract, the profit of the third-party recycler exhibits a negative correlation with the manufacturer’s profit-sharing ratio, and it remains unrelated to the cost-sharing ratio.
In summary, transfer payment prices impact the individual profits of manufacturers, retailers, and third-party recyclers. Therefore, when entering into a cost–benefit-sharing contract, it is important to fully consider the interests of each party and adjust the values of ϕ and θ within an appropriate range.

5. Discussion and Implications

5.1. Discussion

With the growing market share of NEVs, recycling used batteries has garnered significant attention and research from numerous scholars. However, most studies primarily focus on the influence of a single policy on the recycling of used batteries. In contrast, the effects of more complex multi-policy scenarios on the CLSC of used NEV batteries are frequently overlooked. Specifically, this research examines the influence of a policy mix, integrated with the effective implementation of EPR, on the optimal pricing strategies of the member enterprises within the CLSC and the recycling price and amount of the CLSC.
This research finds that centralized decision-making does show higher efficiency in recycling. When comparing Model T with Model Y, it is evident that under centralized decision-making with the policy mix, the total profit increases by approximately 33%, the retailer’s recycling price rises by 38%, and the third-party recycler’s recycling price surges by 86%, reaching the maximum values shown in Table 4. These findings indicate that centralized decision-making effectively integrates supply chain resources, minimizes internal competition and conflicts of interest, reduces marketing costs, and consequently lowers recycling costs and sales price. These results align with real-world scenarios and previous research findings. For instance, prior studies have concluded that centralized channel systems do not exhibit the “double marginalization” effect and that centralized decision-making leads to higher profitability compared to decentralized decision-making [28,31]. Notably, this research reveals that the growth rate of recycling prices for third-party recyclers is substantially higher than that for retailers. This discrepancy may be explained by the fact that third-party recyclers specialize in battery recycling, whereas retailers primarily focus on NEV sales, with battery recycling serving as an ancillary service. Consequently, third-party recyclers typically achieve a larger recycling scale and higher efficiency, enabling them to benefit more from government subsidies and tax incentives, thereby increasing their recycling prices.
In terms of government policies, this research examines the impact relationship between wholesale price, sale price, recycling price, recycling amount, and the policy mix. This is consistent with previous research findings that policy interventions are generally positive in their impact on the recycling supply chain, such as the scenario of battery information-sharing models, where government policies can increase the profits of legitimate recyclers [19,32]. In contrast to previous research on a single policy, the study finds the influence of policies on the CLSC within a multi-policy environment is more complex. When the reward and punishment intensity exceeds the recycling dismantling subsidy, the manufacturers’ transfer price and total recycling amount increase when the government is not involved, while the total profit decreases. Conversely, when the recycling dismantling subsidy is higher than the reward and punishment intensity, the manufacturers’ transfer price and total recycling amount decrease when the government is not involved, while the total profit increases. This is consistent with Table 4, while m > ε ( 8 > 5 ) , N T > N C ( 20.5 > 19 ) , D C < D T ( 206.3 < 157.5 ) , π T < π C ( 70130.2 < 73029.4 ) . When the reward and punishment intensity are higher than the recycling dismantling subsidy, the transfer price increases by 0.3 units per unit, the total recycling amount increases by 0.1 units per unit, while the total profit decreases by 0.01 units per unit.
In addition, unlike most prior studies that have concluded that policy intervention invariably benefits recycling, this research reveals that the impacts of the policy mix on the CLSC are not uniformly positive. For instance, under a decentralized decision-making framework, when the government enacts a policy mix aimed at actively promoting battery recycling, as shown in Table 5, both the manufacturer and retailer experience a decrease in their respective profits by approximately 7% within the forward supply chain. While recycling, dismantling subsidy, and the reward and punishment mechanism in the policy mix can incentivize recycling activities, these measures may concurrently impose additional cost burdens on the manufacturer and the retailer, compressing of their profit margins. Consequently, this research proposes and validates that a cost–benefit-sharing contract can mitigate the negative effects of the policy mix on the profit reduction in the forward supply chain, thereby achieving a more equitable and rational distribution of the profit and cost associated with the recycling and remanufacturing of used NEV batteries among supply chain participants.

5.2. Implications

The theoretical significance of this research lies in its extension of the context for recycling used batteries. Precisely, it moves from a two-level reverse supply chain with a policy intervention and a recycling channel to a multi-policy, hybrid recycling, and three-level CLSC. The research framework aligns more closely with the increasingly complex real recycling scenarios and the trend of policy portfolio, thereby enriching the research on the recycling CLSC under a multi-policy environment.
The practical significance of this research lies in its demonstration of the critical role that centralized decision-making plays in reducing internal frictions within the CLSC, improving recycling efficiency, and boosting the total profit of the CLSC. It provides a clear roadmap for enhancing the practical efficiency of centralized operations and establishing a novel recycling ecosystem guided by “chain leadership”. Furthermore, this research serves as an invaluable reference for governmental bodies in designing a well-structured policy mix to effectively promote the EPR system in the domain of NEV battery recycling, such as a policy mix integrating binding policies, static incentive policies, and dynamic adjustment mechanisms. Additionally, it offers practical guidance for the pricing and recycling strategy selection of CLSC participants. The government’s policy mix will also promote active consumer participation in recycling by leveraging CLSC recycling price signals, thereby fostering the sustainable development of the CLSC of end-of-life products recycling.
However, this research develops a battery recycling model based on the Stackelberg game, assuming that all supply chain decisions are completed within a single period and that the leader and follower interact only once, thus forming a static decision-making framework. Nevertheless, given that the battery life cycle typically spans 8–10 years and the battery recycling process is relatively prolonged, a static model may fail to adequately capture temporal variations in supply and demand dynamics. Future research could explore incorporating a time dimension into the model.

6. Conclusions

To enhance the recycling of used NEV batteries, mitigate environmental pollution and resource wastage, and promote the sustainable development of the NEV industry, this research establishes a Stackelberg game model encompassing three distinct scenarios. Within each scenario, the optimal pricing, individual profits, total recycling amount, and total profit of the CLSC are thoroughly analyzed. By comparing the optimal decision-making outcomes across these scenarios, the following conclusions are drawn:
(1) The economic and ecological goals of the CLSC are best served by centralized decision-making. Decentralized decision-making under the policy mix reduces the profits of manufacturers and retailers, thus reducing the total profit of the forward supply chain. With centralized decision-making, the total profit is maximized by lower sales prices in the forward supply chain and significantly higher recycling prices and amounts in the reverse supply chain.
(2) In the CLSC under the policy mix, increases in recycling price and amount are positively correlated with recycling dismantling subsidy, reward and punishment mechanism m, and increases in wholesale price and sales price are positively correlated with battery tax φ . Increasing recycling dismantling subsidy and reward and punishment mechanism can lead to higher recycling prices, which in turn can increase recycling amount, and the level of reward and punishment mechanism can affect manufacturer’ transfer payment price, which in turn can affect the retailer’s recycling price.
(3) The subsidy policy in the policy mix can increase the total recycling amount, but it may also lead to subsequent subsidy dependence, affecting the sustainable development of the CLSC. A single battery tax policy may reduce the total profit, but implementing a policy mix can have a positive impact through the interaction of multiple policies, such as increasing the total profit of the CLSC. Therefore, policy intervention should fully consider the possible limitations of a single policy, such as inducing member’s policy-dependent behavior as well as excessive fiscal pressure. A combination of short-term static incentives and long-term dynamic adjustment mechanisms should be designed. The government’s policy mix will also encourage consumers to participate in recycling by leveraging CLSC recycling price signals and promoting the integration of environmental awareness into consumer behavior.
(4) While the policy mix can indeed lead to a notable increase in recycling prices and total recycling amount, it also results in a decrease in individual profits for each participant in the forward supply chain. The numerical analysis has confirmed that the “cost–benefit-sharing contract” proposed in this research can effectively coordinate the CLSC. This contract significantly enhances the profits of both the forward and reverse supply chains, as well as the total profit of the CLSC, thereby achieving Pareto improvement within the supply chain.
The above conclusions yield the following management implications: in actual business operations, the overall performance of the NEV used batteries CLSC under centralized decision-making is more favorable. It is necessary to cultivate a spirit of cooperation and a sense of responsibility among all CLSC participants to promote recycling and realize their economic benefits. Since the impact of the policy mix on the CLSC is not always positive, to ensure the recovery amount and the overall benefit of the CLSC, coordination mechanisms should be scientifically designed to assist the manufacturer in sharing the profits from recycling and remanufacturing with other CLSC entities on one hand and distributing the recycling costs fairly among all participants on the other hand, thereby enhancing the sustainable development of the supply chain.
Owing to the distinctive nature of the power battery, the cost of replacing a used battery with a new one is nearly equivalent to or even exceeds the residual value of the old NEVs. Currently, a new method of purchasing NEVs is anticipated to become the dominant trend. Consumers merely purchase NEVs without buying batteries; instead, they acquire the right to use the batteries through leasing, and the ownership of the batteries is held by manufacturers, retailers, or other entities. Under this model, consumers no longer own batteries, complicating and diversifying the channels for battery recycling. Therefore, in the case of NEVs that do not configure batteries, effectively recycle used batteries, and formulate corresponding policies are significant research directions for the future. Additionally, this study solely examines the recycling of NEV batteries. In the future, it can be further extended to other fields to investigate the recycling of different commodities with high residual values.

Author Contributions

Conceptualization, J.L. and Y.C.; methodology, J.L.; formal analysis, J.L.; writing—original draft preparation, J.L. and Y.C.; writing—review and editing, J.L., Y.C. and L.L. All authors have read and agreed to the published version of the manuscript.

Funding

This research was funded by major projects supported by National Social Science Foundation (Grant No. 21&ZD100); Outstanding Youth Innovation Team Foundation of Shandong Province (2022RW036), and Shandong Provincial Natural Science Foundation (Grant No. ZR2020MA028).

Institutional Review Board Statement

Not applicable.

Informed Consent Statement

Not applicable.

Data Availability Statement

The data that support the findings of this study are available from the corresponding author upon reasonable request.

Conflicts of Interest

The authors declare no conflicts of interest.

References

  1. Ambrose, H.; Gershenson, D.; Gershenson, A.; Kammen, D. Driving rural energy access: A second-life application for electric-vehicle batteries. Environ. Res. Lett. 2014, 9, 094004. [Google Scholar] [CrossRef]
  2. Wu, Y.; Yang, L.; Tian, X.; Li, Y.; Zuo, T. Temporal and spatial analysis for end-of-life power batteries from electric vehicles in China. Resour. Conserv. Recycl. 2020, 155, 104651. [Google Scholar] [CrossRef]
  3. Sobianowska-Turek, A.; Urbańska, W.; Janicka, A.; Zawiślak, M.; Matla, J. The Necessity of Recycling of Waste Li-Ion Batteries Used in Electric Vehicles as Objects Posing a Threat to Human Health and the Environment. Recycling 2021, 6, 35. [Google Scholar] [CrossRef]
  4. Liu, B.; Liu, X. Prediction of metal recovery potential of end-of-life NEV batteries in China based on GRA-BiLSTM. Waste Manag. 2024, 190, 339–349. [Google Scholar] [CrossRef]
  5. Wellten, J.; Angelis, J.; Ribeiro da Silva, E. Enabling a viable circular ecosystem for electric vehicle batteries. Technol. Forecast. Soc. Change 2025, 210, 123876. [Google Scholar] [CrossRef]
  6. Cheng, Y.; Hao, H.; Tao, S.; Zhou, Y.; Wang, T. Traceability Management Strategy of the EV Power Battery Based on the Blockchain. Sci. Program. 2021, 2021, 5601833. [Google Scholar] [CrossRef]
  7. Giosuè, C.; Marchese, D.; Cavalletti, M.; Isidori, R.; Conti, M.; Orcioni, S.; Ruello, M.L.; Stipa, P. An Exploratory Study of the Policies and Legislative Perspectives on the End-of-Life of Lithium-Ion Batteries from the Perspective of Producer Obligation. Sustainability 2021, 13, 11154. [Google Scholar] [CrossRef]
  8. Herrador, M.; de Jong, W.; Nasu, K.; Granrath, L. Circular economy and zero-carbon strategies between Japan and South Korea: A comparative study. Sci. Total Environ. 2022, 820, 153274. [Google Scholar] [CrossRef]
  9. Xu, Z.; Li, Y.; Li, F. Electric vehicle supply chain under dual-credit and subsidy policies: Technology innovation, infrastructure construction and coordination. Energy Policy 2024, 195, 114339. [Google Scholar] [CrossRef]
  10. Jia, J.; Chen, W.; Wang, Z.; Shi, L.; Fu, S. Blockchain’s role in operation strategy of power battery closed-loop supply chain. Comput. Ind. Eng. 2024, 198, 110742. [Google Scholar] [CrossRef]
  11. Seika, J.; Kubli, M. Repurpose or recycle? Simulating end-of-life scenarios for electric vehicle batteries under the EU battery regulation. Sustain. Prod. Consum. 2024, 51, 644–656. [Google Scholar] [CrossRef]
  12. Compagnoni, M. Is Extended Producer Responsibility living up to expectations? A systematic literature review focusing on electronic waste. J. Clean. Prod. 2022, 367, 133101. [Google Scholar] [CrossRef]
  13. Sierzchula, W.; Bakker, S.; Maat, K.; van Wee, B. The influence of financial incentives and other socio-economic factors on electric vehicle adoption. Energy Policy 2014, 68, 183–194. [Google Scholar] [CrossRef]
  14. Gupt, Y.; Sahay, S. Review of extended producer responsibility: A case study approach. Waste Manag. Res. J. A Sustain. Circ. Econ. 2015, 33, 595–611. [Google Scholar] [CrossRef]
  15. Zhu, M.; Liu, Z.; Li, J.; Zhu, S.X. Electric vehicle battery capacity allocation and recycling with downstream competition. Eur. J. Oper. Res. 2020, 283, 365–379. [Google Scholar] [CrossRef]
  16. Tang, Y.; Zhang, Q.; Li, Y.; Wang, G.; Li, Y. Recycling mechanisms and policy suggestions for spent electric vehicles’ power battery -A case of Beijing. J. Clean. Prod. 2018, 186, 388–406. [Google Scholar] [CrossRef]
  17. Liu, L.; Wang, L.; Huang, T.; Pang, J. The Differential Game of a Closed-Loop Supply Chain with Manufacturer Competition Considering Goodwill. Mathematics 2022, 10, 1795. [Google Scholar] [CrossRef]
  18. Sun, Q.; Chen, H.; Long, R.; Li, Q.; Huang, H. Comparative evaluation for recycling waste power batteries with different collection modes based on Stackelberg game. J. Environ. Manag. 2022, 312, 114892. [Google Scholar] [CrossRef]
  19. Zhang, M.; Wu, W.; Song, Y. Study on the impact of government policies on power battery recycling under different recycling models. J. Clean. Prod. 2023, 413, 137492. [Google Scholar] [CrossRef]
  20. Guo, R.; He, Y.; Tian, X.; Li, Y. New energy vehicle battery recycling strategy considering carbon emotion from a closed-loop supply chain perspective. Sci. Rep. 2024, 14, 688. [Google Scholar] [CrossRef]
  21. Gu, X.; Ieromonachou, P.; Zhou, L.; Tseng, M.-L. Developing pricing strategy to optimise total profits in an electric vehicle battery closed loop supply chain. J. Clean. Prod. 2018, 203, 376–385. [Google Scholar] [CrossRef]
  22. Zhang, W.; Liu, X.; Zhu, L.; Wang, W.; Song, H. Pricing and production R&D decisions in power battery closed-loop supply chain considering government subsidy. Waste Manag. 2024, 190, 409–422. [Google Scholar] [CrossRef]
  23. De Giovanni, P. A joint maximization incentive in closed-loop supply chains with competing retailers: The case of spent-battery recycling. Eur. J. Oper. Res. 2018, 268, 128–147. [Google Scholar] [CrossRef]
  24. He, H.; Zhang, C.; Wang, S.; Sun, J.; Ma, F.; Sun, Q. Dynamic optimization of battery recycling e-platforms under non-equalizing supply and demand: Recycling price and service commissions. Waste Manag. 2024, 177, 266–277. [Google Scholar] [CrossRef]
  25. Zhang, Z.; Liang, H. Research on coordination of the NEV battery closed-loop supply chain considering CSR and fairness concerns in third-party recycling models. Sci. Rep. 2023, 13, 22172. [Google Scholar] [CrossRef]
  26. Li, J.; Ku, Y.; Liu, C.; Zhou, Y. Dual credit policy: Promoting new energy vehicles with battery recycling in a competitive environment? J. Clean. Prod. 2020, 243, 118456. [Google Scholar] [CrossRef]
  27. Zhang, Q.; Tang, Y.; Bunn, D.; Li, H.; Li, Y. Comparative evaluation and policy analysis for recycling retired EV batteries with different collection modes. Appl. Energy 2021, 303, 117614. [Google Scholar] [CrossRef]
  28. Jin, L.; Zheng, B.; Huang, S. Pricing and coordination in a reverse supply chain with online and offline recycling channels: A power perspective. J. Clean. Prod. 2021, 298, 126786. [Google Scholar] [CrossRef]
  29. Gu, X.Y.; Zhou, L.; Huang, H.F.; Shi, X.T.; Ieromonachou, P. Electric vehicle battery secondary use under government subsidy: A closed-loop supply chain perspective. Int. J. Prod. Econ. 2021, 234, 108035. [Google Scholar] [CrossRef]
  30. Lyu, X.; Xu, Y.; Sun, D. An Evolutionary Game Research on Cooperation Mode of the NEV Power Battery Recycling and Gradient Utilization Alliance in the Context of China’s NEV Power Battery Retired Tide. Sustainability 2021, 13, 4165. [Google Scholar] [CrossRef]
  31. Dehghani Sadrabadi, M.H.; Makui, A.; Ghousi, R.; Jabbarzadeh, A. Optimal pricing strategy in the closed-loop supply chain using game theory under government subsidy scenario: A case study. J. Energy Storage 2024, 87, 111423. [Google Scholar] [CrossRef]
  32. Xiao, M.; Xu, C.; Xie, F. Research on the impact of information sharing and government subsidy on competitive power battery recycling. J. Clean. Prod. 2024, 467, 142989. [Google Scholar] [CrossRef]
Figure 1. Detailed description of Model-C.
Sustainability 17 03324 g001
Figure 2. Detailed description of Model-T.
Sustainability 17 03324 g002
Figure 3. Detailed description of Model-Y.
Sustainability 17 03324 g003
Figure 4. (a) Impact of profit-sharing ratio and cost-sharing ratio on transfer payment price. (b) Impact of profit-sharing ratio and cost-sharing ratio on wholesale price.
Sustainability 17 03324 g004
Figure 5. (a) Impact of profit-sharing ratio and cost-sharing ratio on manufacturer’s profit. (b) Impact of profit-sharing ratio and cost-sharing ratio on retailer’s profit.
Sustainability 17 03324 g005
Figure 6. The impact of the cost-sharing ratio on the third-party recycler’s profit.
Sustainability 17 03324 g006
Table 1. Notations and description.
NotationsDescription
Parameters
k Sensitivity of consumers to the batteries’ capacity
h Batteries’ capacity
b Sensitivity of consumers to the sale price
C 1 Production costs of new products
C 2 Production costs of reproductions
D Total recycled quantity
B Base recovery amount
φ Battery tax
ε Recycling dismantling subsidy
α Sensitivity of consumers to the recycling price
m Level of government reward and punishment
D 0 Target recovery amount
a Initial market size
Decision variables
w j Wholesale price under scenario j
N j Transfer payment price
P J Sale price
P R j Retailer recycling price under scenario j
P T j Third-party recycler recycling price under scenario j
Functions
Q Market demand
π i j Profit of different entity i under scenario j
D i j Demand of different entity i under scenario j
Superscripts
i Supply chain member, i = [M, R, T], where i = M represents the manufacturer and i = R represents the retailer, where i = M represents the third-party recycler.
j j = [C, T, Y], where j = C represents decentralized decision-making without government intervention and j = T represents decentralized decision-making under the policy mix, where j = Y represents centralized decision-making under the policy mix.
Table 2. Equilibrium solutions.
VariablesModel-CModel-TModel-Y
P 3 a + 3 k h + b C 1 4 b 3 a + 3 k h + b C 1 + φ b 4 b a + k h + b C 1 + φ b 2 b
P R Δ α 3 B 4 α Δ α 3 B + ε α + m α 4 α Δ α 2 B + m α + α ε 3 α
P T 3 Δ α 5 B 8 α 3 Δ α 5 B + 3 ε α + 3 m α 8 α 2 Δ α B + 2 m α + 2 α ε 3 α
w a + k h + b C 1 2 b a + k h + b C 1 + φ b 2 b -
N Δ α B 2 α Δ α B ε α + m α 2 α -
D R Δ α + B 4 Δ α + B + m a + ε α 4 Δ α + B + m a + ε α 3
D T Δ α + B 8 Δ α + B + m a + ε α 8 Δ α + B + m a + ε α 3
D 3 ( Δ α + B ) 8 3 ( Δ α + B + m a + ε α ) 8 2 ( Δ α + B + m a + ε α ) 3
π M ( a + k h b C 1 ) 2 8 b + 3 ( Δ α + B ) 2 16 α ( a + k h b C 1 φ b ) 2 8 b + 3 ( Δ α + B + m α + ε α ) 2 16 α m D 0 -
π T ( Δ α + B ) 2 64 α ( Δ α + B + m α + ε α ) 2 64 α -
π R ( a + k h b C 1 ) 2 16 b + ( Δ α + B ) 2 16 α ( a + k h b C 1 φ b ) 2 16 b + ( Δ α + B + m α + ε α ) 2 16 α -
π 3 ( a + k h b C 1 ) 2 16 b + 17 ( Δ α + B ) 2 64 α 3 ( a + k h b C 1 φ b ) 2 16 b + 17 ( Δ α + B + m α + ε α ) 2 64 α m D 0 ( a + k h b C 1 φ b ) 2 4 b + ( Δ α + B + m α + ε α ) 2 3 α m D 0
Table 3. Parameter values.
k h b C 1 C 2 B φ ε α m a
301002055152055108800
Table 4. The solution of each variable in the three models.
VariablesModel C Model T Model Y
P156.3157.5125
w 122.5125-
P R 8.511.816.3
P T 13.818.634.6
N 1920.5-
D R 105137.5-
D T 52.568.8-
D 157.5206.3366.7
π M f 45,562.542,250-
π M r 3307.54291.9-
π M 48,87046,641.9-
π R f 22,781.321,125-
π R r 1102.51890.6-
π R 23,883.823,015.6-
π T 275.6472.7-
π 73,029.470,130.293,303.3
Table 5. The solution of each variable in the three contracts.
VariablesContract ⅠContract ⅡContract ⅢDecentralized Centralized
P 125125125157.5125
w 18.413.820.7125
P R 16.316.316.311.816.3
P T 34.634.634.618.634.6
N 28.5828.582620.5
D 366.7366.7366.7206.3366.7
π M 55,874.164,424.164,928.346,641.9
π R 36,152.827,702.827,366.723,015.6
π T 1176.41176.41008.3472.7
π 93,303.393,303.393,303.370,130.293,303.3
Disclaimer/Publisher’s Note: The statements, opinions and data contained in all publications are solely those of the individual author(s) and contributor(s) and not of MDPI and/or the editor(s). MDPI and/or the editor(s) disclaim responsibility for any injury to people or property resulting from any ideas, methods, instructions or products referred to in the content.

