1. Introduction
Environmental quality (EQ) has taken worldwide value, which is a sign to put a balance between economic progress and environmental safety. Hence, EQ is viewed as essential to addressing pressing concerns such as climate change, health of biodiversity, and resource overexploitation. Therefore, scientists highlight the importance of adopting an interdisciplinary approach, which incorporates EQ, economic development, and TCN to develop a more sustainable solution. In this regard, several studies feature the critical role of green technologies and innovative practices in reducing environmental degradation while encouraging EQ [
1], whereas policymakers progressively acknowledge the implication of EQ in shaping long-term development strategies [
2]. As a result, global efforts like the SDGs and the Paris Agreement focus on creating policies that balance economic growth with EQ [
3]. However, the integration of GRF and sustainable industrial practices into policy agendas underlines the collective commitment in achieving ecological equilibrium. On the other hand, collaboration between scientific research and policymaking remains very important in addressing the multifaceted challenges posed by GLI, urbanization, and environmental crises [
4]. Therefore, neglecting EQ exacerbates climate change, resource depletion, and ecological degradation, with vulnerable populations disproportionately affected. This indicates that without aligning TCN, EDU, and GRF with sustainability goals, opportunities to mitigate environmental crises and foster transformative solutions are lost. Moreover, the absence of sustainability-focused education limits the development of leaders equipped to address these challenges, while insufficient GRF stifles funding for critical initiatives [
5]. Furthermore, GLI and entrepreneurial activities driven by short-term economic gains intensify ELF by underscoring the urgent need for integrated strategies to harmonize economic progress with ecological preservation. More importantly, the study uses TCN instead of green innovation for several reasons. For example, technological innovation influences environmental quality by shaping energy use and industrial processes [
6]. While green innovation targets eco-friendly technologies, this study uses total patent counts as a broader measure of technological progress. This approach is justified because (1) technological innovation enhances energy efficiency, reduces waste, and optimizes resource use, indirectly improving environmental quality [
7], and (2) green patents represent only a fraction of overall innovation. Additionally, advancements in digitalization and automation contribute to environmental outcomes, even if not classified as “green.” Thus, this study examines the broader impact of technological innovation on environmental quality.
Furthermore, considering the importance, EQ within the G20 is crucial due to the group’s significant influence on global economic, environmental, and social dynamics. The G20, made up of the world’s biggest economies, represents about 85% of the global economy, 75% of trade worldwide, and around two-thirds of the world’s population [
8]. These nations are also responsible for over 80% of global CO
2, highlighting their important role in addressing environmental challenges [
9]. The G20’s collective economic power and resource consumption place it at the forefront of mitigating environmental degradation. Therefore, by prioritizing sustainability, the G20 can drive global progress toward reducing ELF, through advancing renewable energy transitions and implementing innovative technologies. As a result, it will have far-reaching impacts on regional and global policies, influencing trade, investment, and development strategies across both developed and developing nations. Additionally, the role of G20 as a platform for multilateral collaboration enables it to set ambitious environmental agendas, promote GRF, and champion policies that align economic growth with ecological preservation [
10]. Therefore, addressing EQ in the G20 is not only essential for the group’s member countries but also for ensuring global environmental resilience and equitable development.
However, talking about the growing importance of EQ for the G20, especially in light of the current global environmental challenges, our study seeks to explore the intricate relationships between TCN, EDU, GRF, GLI, and ENT within this context. The G20 economies hold a critical role in shaping sustainable practices that can mitigate ecological degradation [
11]. Addressing these issues requires a universal approach that integrates innovation, education, finance, and entrepreneurial initiatives to drive substantial change. Therefore, the study variables TCN, EDU, GRF, GLI, and ENT are key drivers in addressing ES. Hence, by exploring how these factors interact and influence ELF, our study highlights their potential to shape effective sustainability strategies within the G20. Understanding how these variables collectively impact ELF will help design targeted policies for sustainable development, reinforcing the G20’s role in leading the transition to a greener global economy.
This study examines environmental quality (EQ), using ecological footprint (ELF) as its proxy. There are several reasons behind choosing this variable as the proxy for EQ. The ELF is a well-established indicator that measures how human activities impact the environment through tracking resource consumption and waste generation. According to the literature, ELF serves as a key tool for evaluating environmental quality across several economies [
12,
13]. Unlike previous studies that often observe these factors in isolation, this study takes a broader approach by exploring the interconnected roles of several variables including technology (TCN), education (EDU), and energy transition (ENT). As environmental concerns continue to grow, it is important to understand how different economic and policy factors—such as green finance, technological innovation, education, entrepreneurship, and globalization—affect sustainability in G20 countries. By examining these relationships, this study provides useful insights into how economies can grow while protecting the environment. These findings can help policymakers develop strategies that promote both economic progress and ecological balance.
Furthermore, this study takes into consideration the impact of the COVID-19 era, which has accelerated digital transformation in shaping environmental outcomes. Moreover, while some past studies have examined the combined influence of these variables on environmental quality, few have specifically focused on G20 economies. This work fills that gap by investigating how TCN drives cleaner energy solutions and promotes sustainable production. Another important variable of the current study is education, which plays a critical role in raising environmental awareness, as highlighted in prior findings [
14]. Taking into account the importance of environmental regulations, the study takes ENT into consideration, which is overlooked in existing studies especially in G20. According to previous literature, ENT fosters green business strategies and GRF [
15]. Beyond that, this study further expands the conversation by incorporating GLI and GRF—two vital yet underexplored aspects of sustainability transitions. Additionally, the COVID-19 crisis highlighted, on the one hand, the urgency of sustainable financial mechanisms and, on the other hand, international collaboration in tackling environmental challenges. In this regard, the previous studies show that GRF is pivotal in funding low-carbon initiatives, whereas GLI facilitates both cross-border diffusion of green technologies and sustainable practices. However, existing studies largely overlook the dual nature of GLI, which enhances sustainability while also driving environmental degradation, if not strategically aligned with GRF [
16,
17]. Therefore, in order to integrate these critical components, this study offers a novel framework that connects financial, technological, and educational drivers of sustainability. Unlike previous research, this study emphasizes their interdependence and policy implications, by providing a more comprehensive understanding of how to optimize these mechanisms for achieving long-term EQ.
Hence, this suggests that addressing EQ is crucial for securing a sustainable future, especially as the world deals with the challenges of climate change, loss of biodiversity, and resource depletion [
18]. Therefore, for G20, integrating key variables such as TCN, EDU, ENT, GRF, and GLI are essential in developing effective strategies to mitigate environmental impacts and substitute long-term sustainability [
19,
20]. Hence, our work fills a significant research gap by exploring the complex interrelationships between these factors and their collective impact on ELF, specifically within the context of the G20 economies. Therefore, by leveraging TCN, ENT, GRF, and EDU, G20 countries can create sustainable solutions for the protection of EQ. This also empowers a new generation of leaders and drives the transition to a greener economy [
21,
22]. Through this study, we aim to answer key questions about how these variables interact and influence environmental outcomes, providing valuable insights for the scientific community and policymakers.
For G20 countries, integrating key variables such as TCN, EDU, ENT, GRF, and GLI is essential for mitigating environmental impacts and fostering long-term sustainability [
23], and GLI further enhances these efforts by enabling international cooperation and the spread of sustainable practices [
24]. Based on a comprehensive literature review and the current global need for sustainable solutions, our study seeks to answer the following research questions:
How does green finance improve environmental quality in G20 economies?
In what ways does technological innovation foster environmental quality?
What is the impact of higher education on environmental quality in the G20?
How does globalization impact environmental quality in G20 countries?
How does entrepreneurship interact with environmental quality within the G20?
Hence, the current study aims to offer useful insights not only for researchers but also for policymakers, along with supporting global discussions on sustainable development and guiding policies that balance economic growth with protecting the environment. The study is structured as follows:
Section 2 reviews the relevant literature,
Section 3 explains the methodology,
Section 4 presents the results,
Section 5 discusses the findings, and
Section 6 concludes with policy recommendations.
3. Methodology
The current work examines the complex relationships between TCN, EDU, GRF, GLI, ENT, and EQ in G20 countries applying panel data during the period 2000–2020. The choice of this time frame is driven by its alignment with significant global milestones, such as the Millennium Development Goals (MDGs) and the transition to the SDGs, which began in 2015. These two decades witnessed rapid advancements in technology, a surge in global trade and investments, and increased global awareness about the need for sustainable development practices [
108]. Therefore, analyzing this period allows us to capture the evolution of very important factors influencing EQ amid substantial economic and social transformations. One reason as to why studies choose G20 is that the G20 group is particularly relevant, as this group represents the world’s largest nations, representing over 80% of global GDP, 75% of international trade, and a significant share of global GHG emissions [
109]. Hence, these countries play a very important role in shaping global sustainability outcomes due to their industrial activities, technological advancements, and policy frameworks. To investigate the relationships among the study variables, the study uses data from WDI, GFN, EIA, and KOFF (GLI and EIA). To investigate the relationships among the study variables, data were sourced from several reputable databases. Specifically, ELF data were obtained from the Global Footprint Network (GFN). TCN is measured through patent applications (both resident and nonresident), sourced from the World Development Indicators (WDI). Data on EDU, represented by government expenditure on education as a percentage of GDP, was also retrieved from WDI. GRF is captured through research and development expenditure as a percentage of GDP, sourced from WDI. The GLI index, reflecting total globalization, was taken from the KOF Globalization Index (KOFF). Finally, ENT is represented by a Principal Component Analysis (PCA) index using data on nuclear and renewable energy production, sourced from the Energy Information Administration (EIA). The study variables, their units, and sources are summarized in
Table 1. These sources provide robust and reliable data, enabling a thorough investigation of the relationships among the study variables.
While green innovation specifically accounts for environmental patents, this study employs technological innovation as a more comprehensive measure of overall technological progress. This choice is based on several key considerations. On the other hand, many non-environmental patents indirectly improve the environment by enhancing energy efficiency and advancing industrial processes. In addition, technological innovation drives changes in production and consumption, leading to the adoption of energy-efficient technologies and smart industrial systems. Furthermore, total patent counts are widely available and standardized across countries. In contrast, green patents often face classification inconsistencies and data limitations. Many technological advancements, such as AI-driven energy systems, automation, and sustainable materials, support environmental goals even if they are not officially classified as green patents. Considering these factors, this study employs technological innovation as a strong indicator of technological progress and its role in improving environmental quality.
This study looks at how different factors—like TCN, EDU, GRF, GLI, and ENT—affect EQ, using the ELF as the main indicator. Unlike just measuring CO
2 emissions, ELF gives a broader picture by considering land use, resource consumption, and overall environmental impact. In order to analyze these relationships, the study applies the CS-ARDL model, which helps capture both short-term changes and long-term trends while also accounting for CSD in panel data. Since reliability is important, the study also uses the GMM method to check the robustness of the results. Additionally, the Dumitrescu–Hurlin causality test is conducted to see how these factors influence each other over time. Hence, the study offers deeper insight into what drives environmental quality in G20 countries. The model function of the study is shown in Equation (1):
The empirical model is expressed as follows:
In Equation (2), the dependent variable (ELF) represents the ecological footprint for G20 countries. The independent variables include TCN, EDU, GRF, GLI, and ENT, all measured across the G20 nations. In Equation (2), the term β
0 represents the baseline ELF when all independent variables are zero, whereas the coefficients (β
1, β
2, β
3, β
4, and β
5) indicate how each independent variable affects ELF in G20. Additionally, the error term (ϵit) accounts for any random variations that might influence ELF but are not explicitly included in the model. For CS-ARDL, Equation (3) examines both short-term and long-term effects. It captures how these key factors shape ELF over time. Furthermore, the lagged component reflects past influences, while the ECT measures how quickly the system returns to equilibrium, ensuring stability in the model.
Moreover, in Equation (3), symbol Δ represents the first difference operator. This helps in measuring how variables change over time, whereas the symbol λ indicates how fast the system returns to balance after a disturbance. This shows the speed at which the system adjusts to long-term stability. Furthermore, the term αi accounts for country-specific effects. This can capture unique characteristics of each G20 nation that stay constant over time. However, the coefficients ϕj reflect the influence of past changes in independent variables. This also helps us to understand how these factors interact over time. Lastly, νit represents the error term, which includes any missing factors that might still impact the ELF. Hence, by structuring the model this way, the current study can examine both short-term variations and long-term stability in the relationship between key factors and ELF across G20 countries.
This study uses CS-ARDL model to explore both short- and long-term links between TCN, EDU, GRF, GLI, and ENT in advancing EQ across G20 nations. This approach is especially valuable as it captures both immediate impacts and long-term effects while considering the economic interconnections among countries. Although traditional panel estimation methods, such as fixed effects, random effects, and PMG-ARDL, have been commonly used in past research, they also have certain limitations [
110,
111,
112]. Moreover, many of these methods ignore CSD, leading to biased and inconsistent estimates. They also assume that all countries share the same coefficient values, overlooking country-specific differences. Furthermore, some approaches struggle to distinguish between short- and long-term impacts, making it difficult to understand dynamic relationships.
Therefore, in order to overcome these challenges, this work adopts CS-ARDL, which effectively handles CSD, allows slope heterogeneity, and clearly differentiates short- and long-term effects. Robustness is further ensured through GMM, which accounts for unobserved common factors and also addresses the endogeneity issues of data [
113]. Therefore, the CS-ARDL model is preferred over traditional ARDL and PMG-ARDL because it considers CSD and heterogeneous slopes, making it more suitable for complex environmental interactions in G20 economies [
114]. However, one limitation is its inability to directly address endogeneity, which can bias if variables influence each other [
115,
116]. For this purpose, the study applies the GMM technique, which corrects endogeneity by using internal instruments by ensuring more reliable estimations. Hence, by combining CS-ARDL with GMM, this study enhances the accuracy and depth of its findings. As a result, the study provides a clearer picture of how TCN, EDU, GRF, GLI, and ENT influence ELF in G20 nations.
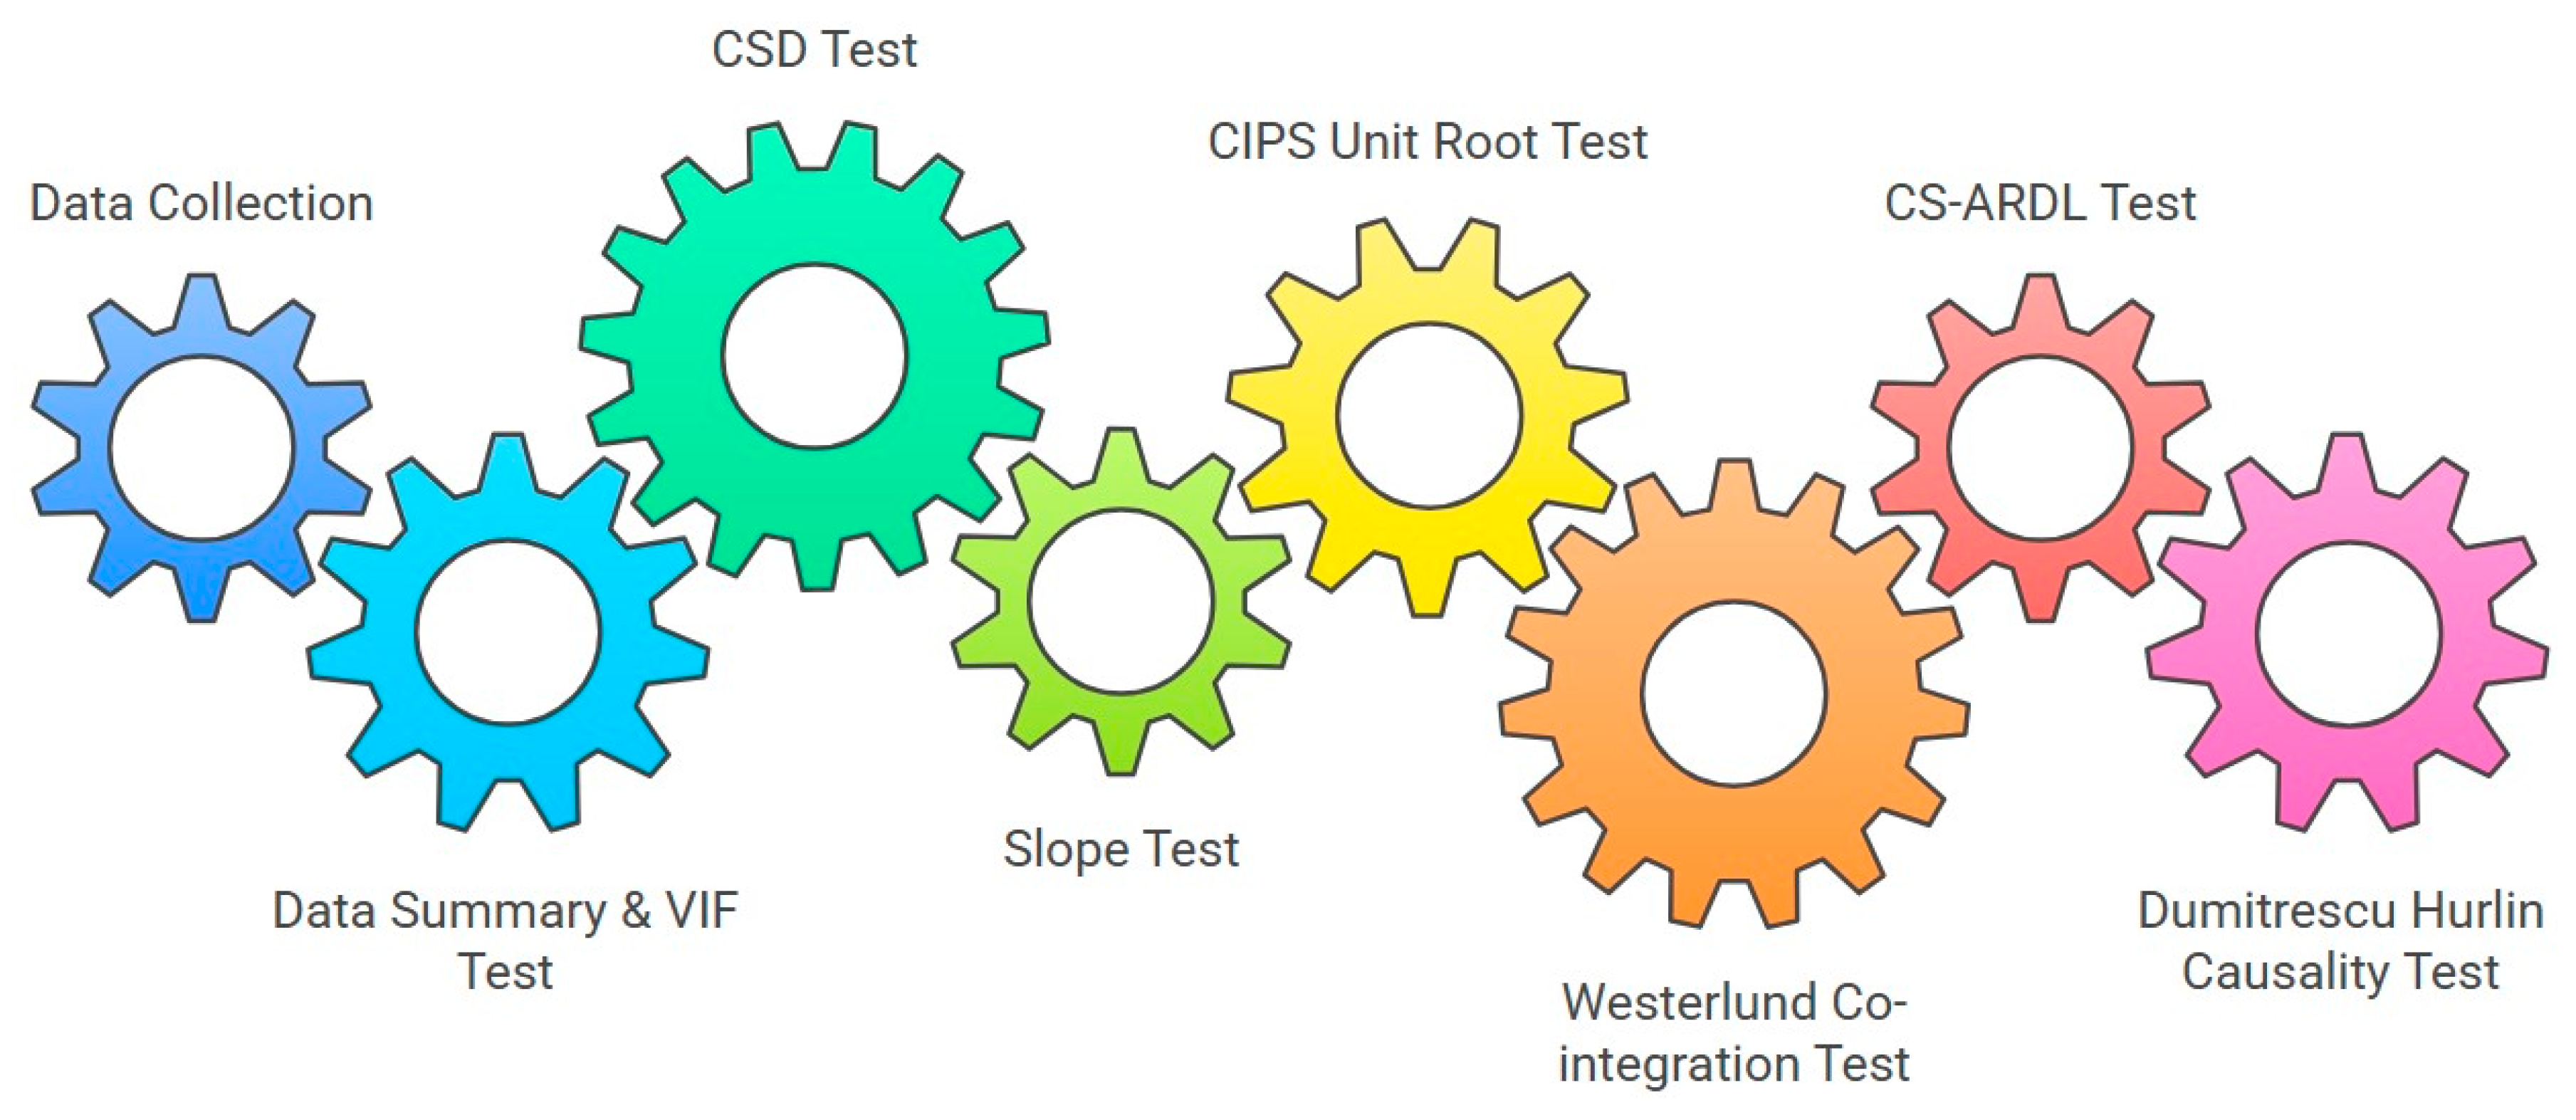
However, before applying the CS-ARDL model, the study conducts essential diagnostic tests to ensure data reliability and model stability. These include the VIF test to detect multicollinearity, the CSD test to check for cross-sectional dependence [
117], the SL test to assess slope homogeneity, and the CIPS test to examine stationarity. Furthermore, the Westerlund Co-integration Test (WCT) is used to confirm long-term relationships among the variables. These diagnostic tests are considered important tools in the case of panel data analysis. These tests also help to identify the potential issues that could misrepresent the results. They further ensure that the model’s core assumptions remain valid. Finally, the study interprets the results, explores policy implications, and provides recommendations. A structured overview of the research process is presented in
Figure 1, outlining each step of the analysis.
The study proceeds with checking the multicollinearity using the VIF test. Multicollinearity occurs when independent variables are too closely related. If multicollinearity is high, it can inflate the variance of regression coefficients which can make the results less reliable [
118]. Therefore, to measure this, the VIF value is calculated using Equation (4):
From Equation (4), the term R2 represents the coefficient of determination. It is worth noting that a VIF greater than 10 suggests high multicollinearity, indicating the need for variable selection or transformation.
The CSD test is essential in panel data models as it detects whether observations across different cross-sectional units are correlated. If cross-sectional dependence is ignored, it can lead to inconsistent and biased parameter estimates [
119]. The CSD test, such as the Pesaran CD test, tests correlation between error terms across the cross-sectional units. The null hypothesis is that there is no CSD. A significant result suggests the presence of cross-sectional dependence, which must be addressed by using models like CS-ARDL that can account for it [
120,
121]. Furthermore, the SL test checks whether the relationship between the dependent and independent variables is homogeneous across all cross-sectional units. On the other hand, it examines if the coefficients of the independent variables are the same across all units in the panel. The null hypothesis assumes slope homogeneity. If the null hypothesis is rejected, the use of the CS-ARDL model is recommended, which allows for heterogeneity [
122].
Moreover, in order to analyze the stationarity and long-term relationships in panel data, the study uses the CIPS test and the WCT. These tests help confirm whether the data are stable over time and whether the variables move together in the long run [
123,
124]. It is worth noting that the CIPS test is more useful when dealing with mixed stationarity. This situation of mixed stationarity along with CSD is common in panel data; therefore, the use of CIPS is recommended in such cases. Unlike first-generation unit root tests, CIPS considers these dependencies, which makes it more effective in panel data analysis [
125]. If the test outcomes show that a series is stationary, it shows that the data are suitable for studying long-term relationships. Equation (5) provides a way to check stationarity by averaging test statistics across different units while accounting for both time and CSD.
The study also applies to the WCT to check if there is a long-term relationship between the variables. Even if individual data series are not stable on their own, this test helps determine whether they still move together over time [
126]. The WCT is especially useful for panel data because it accounts for cross-sectional dependence (CSD) and differences between countries. If the test rejects the idea that there is no cointegration, it means a stable long-term relationship exists between the variables [
127]. This is important for understanding how factors like green finance (GRF), technological innovation (TCN), and ecological footprint (ELF) are connected in G20 economies. The standard WCT method includes four key equations, labeled (6)–(9).
Once the long- and short-run analysis is completed, the current work investigates the causality between the series. The study uses the [
128] causality test to examine the causal relationships among the study variables. This method is preferred because it is specifically designed for panel data, allowing for heterogeneous causality across cross-sectional units. Unlike traditional Granger causality tests, the Dumitrescu–Hurlin test does not require homogeneity in causal relationships, making it particularly suitable for examining complex interactions in diverse economies, such as the G20 [
129]. Additionally, it provides robust results even in the presence of CSD and varying time periods across the panel. Equation (10) represents the causal relationship as proposed by Dumitrescu and Hurlin.
The associated variables are denoted as Yi,t and Xi,t. Assuming time-invariance, the coefficients (γik and βik) vary between individual observations. The lag order is denoted by the sign K. This method facilitates comprehensive analysis while adapting to each country’s developmental stage to produce highly beneficial results.
4. Results
This section presents the findings of the study analysis in a systematic way. The section begins with a descriptive assessment of the study variables by providing an overview of their characteristics. This is followed by an evaluation of multi-collinearity using the VIF test. After that, the outcomes of the CSD and SL tests are discussed, along with the results of the CIPS unit root test. After this section, the study further includes the findings from WCT, highlighting the long-term relationships among variables. Furthermore, the core results from the CS-ARDL model are presented next, supported by robustness checks through GMM regression. Finally, the study presents the outcomes of the Dumitrescu–Hurlin causality test by providing insights into causal relationships.
The outcomes of descriptive statistics are shown in
Table 2, which highlights the significant variations among the study variables for G20. The first variable, ELF, has a mean value of 4.31, ranging from 0.09 to 10.93, reflecting notable environmental disparities. The variable EDU shows moderate progress with a mean of 4.44 and a standard deviation of 1.04, while TCN averages 10.61 with moderate variability. On the other hand, ENT exhibits the highest variation, with a mean of 16.49 and a standard deviation of 10.45, indicating uneven entrepreneurial activity for the G20 region. Furthermore, the variable GRF has a low mean of 1.48, suggesting limited adoption, whereas GLI stands out with a high average of 71.71, showcasing strong integration. These statistics show that there exist diverse socio-economic and environmental contexts within the G20. As a result, these findings provide a solid foundation for deeper analysis to identify key trends, relationships, and policy implications.
Moreover, while considering the importance of ELF in G20, we included
Figure 2, which shows ELF trends from 2000 to 2020, revealing notable disparities between developed and emerging economies. The outcomes of
Figure 2 show that developed nations such as the USA, Canada, and the UK show consistently higher ELF due to industrialization and high consumption levels, though their trends show slight stabilization or decline as well, likely reflecting the impact of environmental policies and TCN. In contrast, emerging economies like China, India, and Brazil display rising footprints, driven by rapid urbanization, industrial growth, and increased resource demand, highlighting mounting environmental challenges. Furthermore, countries such as Saudi Arabia and South Africa show fluctuations in their ELF trends, likely influenced by external factors. As a result, these trends emphasize the urgency for G20 nations to adopt sustainable practices, enhance green technology adoption, and strengthen collaborative efforts to achieve global environmental objectives.
Table 3 presents the results of the VIF test. The VIF values for all variables are below 10, indicating the study is free from multicollinearity. Among the variables, GLI has the highest VIF at 2.47, suggesting a moderate level of correlation with other variables, but still within acceptable limits. ENT and GRF both have a VIF of 1.69, reflecting relatively low multicollinearity. EDU and TCN show the lowest VIF values of 1.36 and 1.21, respectively, indicating minimal correlation with other variables. The results confirm variable independence, ensuring reliable regression estimates.
Table 4 presents the results of the CSD test, which examines whether the variables exhibit interdependence across the G20 countries. The test statistics for all variables are significant at the 1% level (
p < 0.01), as indicated by the *** notation, confirming the presence of strong CSD. The ELF has a test statistic of 3.10 (
p = 0.002), suggesting moderate dependence among countries. EDU, ENT, GRF, GLI, and TCN exhibit much higher test statistics, particularly GLI (49.79) and TCN (25.48), indicating substantial interdependence in these variables across countries. These results highlight that shared global trends or policies likely influence these variables, making it essential to account for cross-sectional dependence in further analyses to avoid biased estimates and ensure robust conclusions.
Table 5 presents the results of the slope homogeneity test, which assesses whether the relationships between variables are consistent across the G20 countries. Both the Delta and Adjusted Delta statistics are highly significant at the 1% level (
p < 0.01), as indicated by the *** notation. The significant results suggest that slope heterogeneity exists, meaning that the effects of the independent variables on the dependent variables vary across countries. This highlights the importance of using econometric models, such as CS-ARDL, which account for heterogeneity to ensure more accurate and country-specific interpretations of the results.
Table 6 presents the results of the CIPS unit root test, which checks the stationarity of the variables across the G20 countries. The test provides results for both I(0) and I(1) statistics for each variable. For EDU, TCN, and GLI, the I(0) statistics are significant at the 1% level, indicating that these variables are stationary at this level. However, for the other variables, such as ELF, ENT, and GRF, t I(0) statistics are not significant, suggesting they are non-stationary at this level. All variables become stationary at I(1), with highly significant I(1) statistics, such as ELF = −4.417, EDU = −4.258, and TCN = −5.031, which are well below the critical value of −2.42 at the 1% level. These results indicate that most variables are integrated at I(1), while EDU, TCN, and GLI are stationary at level I(0). This outcome helps with selecting appropriate econometric models, such as the CS-ARDL, which can handle mixed stationarity and avoid spurious relationships.
Furthermore,
Table 7 presents the outcomes of WCT, which examines the existence of long-run relationships between the study variables. This test involves four statistics: Gt, Ga, Pt, and Pa. According to the outcomes, Gt and Pt statistics are significant at the 1% level, with values of −3.450 and −15.427, respectively, and
p-values of 0.000. The results confirm that there is a long-term relationship among the study variables. The significant values of Gt and Pt suggest that these variables are linked in a stable way over time. However, the other two statistics, Ga and Pa, are not significant, with
p-values of 1.000 and 0.851, meaning they do not provide evidence of cointegration. Despite this, the overall significance of Gt and Pt supports the presence of long-run relationships, which is important for further analysis. This allows models like CS-ARDL to explore how these variables interact and influence each other over time.
To further validate the model fit, we employ the Akaike Information Criterion (AIC) and Bayesian Information Criterion (BIC), which help compare the relative performance of the models. As shown in
Table 8, the CS-ARDL model exhibits lower AIC (−120.53) and BIC (−115.21) values compared to the GMM model (AIC = −105.87, BIC = −100.45). The lower values indicate that CS-ARDL provides a better fit for the data while minimizing information loss. This further supports the selection of CS-ARDL as the primary estimation technique, while GMM remains useful for robustness checks and addressing potential endogeneity concerns.
Once the diagnostic tests are performed, the next step is to apply the CS-ARDL model, which is suggested by the pretests conducted in the current study. The outcomes of this model are presented in
Table 9, which includes the long-run, short-run, and Error Correction Term (ECT) estimates. The ECT in
Table 9 has a value of −1.010493, which is statistically significant at the 1% level with a
p-value of 0.0031. This negative and significant coefficient indicates that any deviation from the long-run equilibrium is corrected in the short term at a rate of approximately 1.01 units per period. The significant ECT confirms the presence of a stable long-run relationship among the variables and suggests that the system will adjust toward equilibrium over time.
In the long run, the results show that GRF, EDU, and TCN have significant negative effects on the ELF, with coefficients of −2.149796, −4.669443, and −1.101665, respectively. These negative relationships suggest that increases in GRF, EDU, and TCN contribute to EQ by reducing ELF over the long term. ENT also has a significant negative effect (−0.161545), indicating that higher levels of entrepreneurial activity help reduce ELF and improve sustainability. On the other hand, GLI shows a positive but marginal effect, suggesting that, over the long term, GLI may contribute to an increase in ELF, though this effect is weak and not statistically robust. The outcomes of the CS-ARDL analysis, as shown in
Figure 3, indicate that GRF, EDU, TCN, and ENT all exhibit negative relationships with ELF, suggesting that these factors contribute to improving ES. In contrast, GLI shows a positive association with ELF, implying that increased GLI may lead to a higher ELF.
In the short run, GRF and EDU remained significant, with coefficients of −1.174635 and −0.037126, respectively. These findings support the idea that short-term increases in GRF and EDU contribute to reducing ELF and promoting ES. This represents the negative relationship between GRF, EDU, and ELF. Additionally, the parameter ENT also shows a significant negative effect. It highlights the role of entrepreneurial activity in reducing ELF in G20 countries. However, the variable GLI has a positive but marginal effect on ELF. This suggests that its influence on ELF is more pronounced in the short term by contributing to a slight increase in ELF. This represents the portion of improvement for G20 nations. Furthermore, the variable TCN demonstrates a small but significant negative relation with ELF. This shows that TCN in the short run helps to lower the ELF, hence causing an improvement in the EQ of G20 countries. As a result, we can say that the CS-ARDL model reveals significant long-term and short-term relationships, where variables such as GRF, EDU, ENT, and TCN play a key role in reducing ELF and improving EQ in the G20 countries.
The GMM regression results, presented in
Table 10, show that TCN, Green GRF, EDU, and ENT have significant negative effects on ELF, with coefficients of −0.2100, −0.4000, −0.2200, and −0.0600, respectively. These results confirm that increases in these variables are associated with reductions in ELF, supporting the notion of ES. Conversely, GLI has a positive significant effect, indicating that higher levels of GLI may increase the ELF. Since the GMM regression produces similar results to the CS-ARDL model, these findings further validate the robustness of the outcomes, confirming the consistency and reliability of the relationships between the variables and ecological sustainability.
The results of the Dumitrescu–Hurlin causality test presented in
Table 11 reveal significant causality relationships between the variables, with varying directions of influence. There is a unidirectional causality from GRF to ELF, significant at the 5% level, indicating that an increase in GRF leads to a reduction in ELF, promoting ES. Similarly, EDU shows a unidirectional causality toward ELF, suggesting that EDU contributes to a decrease in the ELF, reinforcing its role in sustainability efforts. ENT and ELF exhibit bidirectional causality, signifying that ENT reduces the ELF while a smaller ELF may encourage entrepreneurial activity. On the other hand, GLI has a unidirectional causality to ELF, suggesting that GLI tends to increase ELF, potentially leading to more environmental challenges. Lastly, TCN also shows bidirectional causality with ELF, indicating that TCN reduces the ELF, while the ELF itself influences the direction of TCN. These findings highlight the dynamic relationships between the variables, confirming that certain factors, such as EDU, GRF, and ENT, play crucial roles in improving ES.
5. Discussions
The study findings reveal that green finance (GRF) has a negative relationship with ecological footprint (ELF) in both the long run (−2.149796) and short run (−1.174635). This suggests that a 1% increase in GRF leads to a reduction in ELF by 2.15% over the long term and 1.17% in the short term. These results highlight the crucial role of green financial investments in mitigating environmental degradation within G20 economies. By facilitating capital flows toward renewable energy projects, sustainable infrastructure, and low-carbon technologies, GRF helps reduce environmental pressures and promotes a transition toward cleaner production methods. This finding is consistent with previous studies, such as [
130,
131], which emphasize that green financing mechanisms—such as green bonds, climate funds, and ESG investments—significantly contribute to environmental sustainability by reducing reliance on fossil fuel-based industries. Similarly, ref. [
132] found that economies with strong financial commitments to sustainability tend to experience lower carbon emissions and ecological degradation, reinforcing the argument that financial incentives play a pivotal role in environmental quality improvements. However, some studies present contrasting perspectives. For instance, ref. [
133] argues that while GRF generally promotes environmental sustainability, its effectiveness depends on policy implementation, financial market development, and regulatory enforcement. Furthermore, ref. [
35] suggests that if green finance is not accompanied by strict environmental regulations and monitoring, its impact on ecological sustainability may be diluted. These results align with the study’s hypothesis (H1) that GRF contributes to improving environmental sustainability (ES) in G20 economies.
Similarly, the parameter technological innovation (TCN) also demonstrates a negative relationship with ecological footprint (ELF) both in the long run (−1.101665) and short run (−0.025403). This indicates that a 1% increase in TCN results in a reduction in ELF by 1.10% in the long term and 0.03% in the short term. These findings suggest that advancements in technology play a pivotal role in improving environmental quality by enabling more efficient resource utilization, cleaner production methods, and ultimately lower ecological pressures. In the context of G20 countries, this indicates that technological progress contributes to the reduction in environmental degradation over time, driven by innovations that promote energy efficiency, cleaner technologies, and waste reduction. This aligns with several studies, such as [
134], who argue that technology adoption is central to reducing environmental impacts, especially in energy-intensive industries. Similarly, ref. [
135] emphasizes that the digitalization of industries and the shift to renewable energy technologies contribute to lowering carbon emissions and ecological footprints. Ref. [
134] further supports these findings, stating that the development and adoption of green technologies significantly mitigate environmental degradation by improving resource efficiency and reducing pollution. However, contrasting perspectives also exist. For example, ref. [
136] cautions that the adoption of some emerging technologies may initially increase environmental pressures due to resource-intensive manufacturing processes or high energy demands, especially during the early stages of deployment. Furthermore, ref. [
137] similarly notes that while technology can drive sustainability, its impact on environmental quality is contingent upon appropriate regulatory frameworks, incentives for green innovation, and the scaling up of technologies to ensure widespread adoption. This aligns with the study’s hypothesis (H2) that TCN enhances environmental sustainability (ES) by fostering innovation that reduces ecological footprints and carbon emissions.
In contrast, globalization (GLI) exhibits a positive relationship with ecological footprint (ELF) in both the long run (0.124337) and short run (0.036422). This means that a 1% increase in GLI results in a 0.124% rise in ELF over the long run and a 0.036% increase in the short run. These findings indicate that while globalization facilitates economic growth, technological advancements, and knowledge transfer, it also contributes to higher consumption patterns, industrial expansion, and resource exploitation, leading to greater environmental degradation over time. In the G20 economies, this positive association suggests that globalization has intensified energy demand, production activities, and trade-related emissions, ultimately worsening ecological pressures. The influx of multinational corporations expanded industrialization, and increased consumerism drives deforestation, pollution, and excessive resource consumption. This aligns with the pollution haven hypothesis (PHH), which posits that globalization shifts pollution-intensive industries to countries with weaker environmental regulations, further amplifying ecological degradation [
138]. Additionally, ref. [
139] argues that globalization intensifies carbon emissions by increasing trade, transportation, and industrial production, leading to a larger environmental footprint. However, some studies offer a contrasting perspective, suggesting that globalization can enhance environmental sustainability if properly regulated. Furthermore, ref. [
140] highlights that globalization facilitates green technology transfers, allowing countries to adopt cleaner production processes and sustainable energy solutions. Similarly, ref. [
141] finds that FDI-driven globalization can encourage environmental responsibility in host countries if strict environmental regulations and green investment policies are enforced. This outcome supports the hypothesis (H4) that GLI has a significant and negative impact on ES.
On the other hand, entrepreneurship (ENT) exhibits a negative relationship with ecological footprint (ELF) in both the long run (−0.161545) and short run (−1.164862). This suggests that a 1% increase in ENT leads to a reduction in ELF by 0.161% over the long run and 1.164% in the short run. These findings highlight that entrepreneurial activities—particularly those centered on sustainability—play a crucial role in lowering environmental degradation through green innovation, resource efficiency, and eco-conscious business models. In the context of G20 economies, the negative relationship between ENT and ELF is likely driven by green entrepreneurship, which fosters clean energy solutions, sustainable business models, and low-carbon innovations. As startups and businesses integrate environmental considerations into their strategies, they reduce reliance on fossil fuels, minimize waste, and adopt circular economy principles, ultimately leading to a smaller ecological footprint [
142]. Moreover, ref. [
143] emphasizes that eco-entrepreneurs drive sustainability by introducing environmentally responsible technologies, green investments, and carbon-efficient production methods. Additionally, ref. [
144] argues that entrepreneurial ecosystems that prioritize sustainability accelerate the transition toward a low-carbon economy. However, while ENT generally benefits environmental quality, its impact depends on the type of entrepreneurship. High-impact green startups tend to lower ELF, but businesses focused solely on profit maximization without sustainability considerations may contribute to pollution and resource depletion. This aligns with the Porter Hypothesis, which suggests that environmentally responsible entrepreneurship leads to both economic and environmental gains when supported by strong policy frameworks. Moreover, this study outcome supports the hypothesis (H5) that ENT significantly enhances ES.
Furthermore, the CS-ARDL results align with the theoretical foundations of the study by demonstrating the complex interplay between technological advancements, financial mechanisms, education, globalization, and entrepreneurship in shaping environmental quality within G20 economies. The negative long-run coefficients of GRF, EDU, ENT, and TCN support the Sustainability Transition Theory (STT) by indicating that green finance, technological innovation, and human capital development contribute to reducing ELF, thus promoting sustainability. This aligns with STT’s premise that systemic changes in finance, governance, and technology drive long-term environmental improvements. Similarly, Innovation Diffusion Theory (IDT) finds support in the positive impact of GLI, which suggests that globalization facilitates the exchange of sustainable technologies and practices, reinforcing IDT’s emphasis on technology dissemination. However, the pollution haven hypothesis (PHH) is also partially reflected in the positive coefficient of GLI, indicating that globalization may contribute to environmental stress in certain contexts by attracting pollution-intensive industries. The negative impact of ENT and TCN in both the short and long run further validates STT, as cleaner production methods and renewable energy technologies emerge as key drivers of sustainability. These findings highlight the multifaceted nature of environmental transition, where innovation and financial instruments play crucial roles in mitigating ecological degradation while globalization presents both opportunities and risks.
6. Conclusion and Policy Implications
The world is currently facing unparalleled environmental challenges. These challenges are resulting in the degradation of ecosystems, the depletion of natural resources, and the intensifying effects of climate change. Hence, these issues cause significant threats to global sustainability and require urgent attention, particularly from the world’s largest economies. Among these economies, the G20 bloc, which represents a major portion of global economic activity, are considered key players in shaping the future of ES. Therefore, keeping in view the current scenario, this study aimed to address these concerns by investigating the role of TCN, EDU, and GRF in promoting EQ in G20 economies, with a focus on their interactions with GLI and ENT. The current study uses comprehensive analysis by utilizing the CS-ARDL, GMM, and Pairwise Causality tests. The work identifies both long-run and short-run relationships between the study variables across the G20. The study finds that technological innovation (TCN), education (EDU), and green finance (GRF) all have a significant negative impact on the ecological footprint (ELF). This means that progress in these areas helps improve environmental quality by reducing ELF. However, globalization (GLI) shows a positive relationship with ELF, suggesting that as global trade and economic activities expand, environmental degradation may also increase in G20 nations. On the other hand, entrepreneurship (ENT) has a negative impact on ELF, highlighting the role of innovation and sustainable business practices in protecting the environment. Moreover, the study emphasizes that G20 countries can enhance environmental quality by promoting technological advancements, investing in education, and increasing green finance initiatives. At the same time, since globalization contributes to higher ELF, it is crucial to manage global trade and resource consumption carefully to reduce its environmental impact. Ultimately, the findings highlight the need to balance economic growth with environmental responsibility. By integrating these key factors, G20 economies can work towards reducing environmental degradation and building a more sustainable and resilient future. The following are practical recommendations that can help enhance environmental quality in G20 nations.
Since GRF negatively influences ELF in both the short and long run, G20 economies should increase investments in green finance by expanding green bond markets, providing tax incentives for climate-focused financial tools, and establishing dedicated green investment funds. Additionally, they should mandate sustainability criteria for financial institutions to ensure funds are directed toward low-carbon industries and eco-friendly innovations.
Given the negative relationship between TCN and ELF, G20 countries must prioritize clean technology investments by increasing R&D funding for renewable energy, energy-efficient systems, and circular economy solutions. Additionally, regulatory frameworks should be strengthened to incentivize businesses to transition towards low-emission technologies through subsidies, tax breaks, and innovation grants.
Since EDU reduces ELF, G20 economies should embed sustainability in education systems by integrating environmental curricula at all levels and fostering climate literacy programs. Governments should also expand vocational training in green industries, ensuring a skilled workforce capable of driving sustainable transformation in key sectors such as energy, construction, and agriculture.
The negative link between ENT and ELF highlights the need for stronger support for green startups through dedicated funding, incubators, and regulatory incentives. G20 countries should also develop entrepreneurship-friendly policies, such as fast-track approvals for eco-innovative businesses and preferential procurement programs that prioritize sustainable enterprises.
Since GLI is positively linked to ELF, G20 countries must implement policies that regulate resource-intensive trade, including carbon tariffs, stricter environmental standards for imports, and incentives for businesses to adopt sustainable supply chain practices. Additionally, green trade agreements should be established to ensure globalization supports rather than harms environmental sustainability.
This study provides very valuable insights but is still subject to certain limitations. Firstly, the data range for the current study is from 2000 to 2020, which may not capture more recent developments in the dynamics of EQ in G20 economies. Secondly, the current work is confined to a limited set of variables, such as GRF, TCN, and EDU, which might not fully capture all the factors influencing EQ. Thirdly, the work mainly focusses on G20 countries, which limits the generalizability of the findings of other economies, especially those with different levels of industrialization and development. Future research can address these limitations by considering different time periods that better reflect the changing global sustainability landscape. Researchers may also explore additional dependent variables beyond environmental quality to capture broader economic impacts. Including more factors, such as governance, policy effectiveness, and sectoral shifts, could further enrich the analysis. Moreover, future studies could also apply alternative methods like MMQR or Quantile-on-Quantile models to examine relationships across different quantiles in greater depth. Thus, expanding the scope to other country groups, such as G10 or E7, could provide useful comparisons in sustainability outcomes. Finally, using dual models and the EKC framework could also help explore nonlinear relationships between variables which can offer a more comprehensive view of sustainability dynamics.


