Article

A Robust Sustainability Assessment Methodology for Aircraft Parts: Application to a Fuselage Panel

by
Aikaterini Anagnostopoulou
1,
Dimitris Sotiropoulos
2 and
Konstantinos Tserpes
1,*
1
Laboratory of Technology & Strength of Materials, Department of Mechanical Engineering & Aeronautics, University of Patras, 26500 Patras, Greece
2
Department of Electrical and Computers Engineering, University of Peloponnese, 26334 Patras, Greece
*
Author to whom correspondence should be addressed.
Sustainability 2025, 17(8), 3299; https://doi.org/10.3390/su17083299
Submission received: 5 February 2025 / Revised: 3 April 2025 / Accepted: 4 April 2025 / Published: 8 April 2025
(This article belongs to the Section Sustainable Materials)

Abstract

This paper presents a cradle-to-gate sustainability assessment methodology specifically designed to evaluate aircraft components in a robust and systematic manner. This methodology integrates multi-criteria decision-making (MCDM) analysis across ten criteria, categorized under environmental impact, cost, and performance. Environmental impact is analyzed through lifecycle assessment and cost through lifecycle costing, with both analyses facilitated by SimaPro 9.6.0.1 software. Performance is measured in terms of component mass and specific stiffness. The robustness of this methodology is tested through various MCDM techniques, normalization approaches, and objective weighting methods. To demonstrate the methodology, this paper assesses the sustainability of a fuselage panel, comparing nine variants that differ in materials, joining techniques, and part thicknesses. All approaches consistently identify thermoplastic CFRP panels as the most sustainable option, with the geometric mean aggregation of weights providing balanced criteria consideration across environmental, cost, and performance aspects. The adaptability of this proposed methodology is illustrated, showing its applicability to any aircraft component with the requisite data. This structured approach offers critical insights to support sustainable decision-making in aircraft component design and procurement.

1. Introduction

Greenhouse gas emissions from aviation have risen significantly over the past three decades. Although aviation, along with shipping, accounts for about 4% of the European Union’s total emissions, it remains the fastest-growing source of emissions. The primary driver behind this increase is the growth in air traffic. Efforts to reduce emissions in the aviation sector have only recently gained traction on a global scale. The EU aims to reduce emissions by 55% by 2030 and achieve net-zero emissions by 2050. To meet these targets, the EU is currently implementing several strategies, including the inclusion of aviation in the emissions trading scheme, a revision of this scheme for aviation, and proposals for more sustainable fuels and aircraft technologies [1]. In the field of aviation, relevant research is coordinated by the Clean Aviation Joint Undertaking, established with the primary mission of developing disruptive aircraft technologies to support the European Green Deal and achieve climate neutrality by 2050. One of the main technologies emphasized by Clean Aviation is “Green manufacturing and assembly, end-to-end and eco-design”. According to the Strategic Research and Innovation Agenda of Clean Aviation, “A key enabler of green manufacturing and eco-design is sustainability assessment”.
In contrast to other engineering sectors, such as the automotive sector [2,3], where sustainability practices are already integrated into structural design, relatively few studies have focused on sustainability assessments in aviation. Specifically, a search in Scopus for “Sustainability” AND “Aircrafts” reveals only 21 relevant journal articles. For instance, ref. [4] outlines an approach for modeling future aircraft technologies and provides an overview of existing methods and challenges in assessing sustainability for current technologies. Reference [5] explores the integration of sustainability practices within aircraft maintenance, repair, and overhaul (MRO) companies. Meanwhile, ref. [6] proposes a sustainability-based design process that evaluates sustainability using an index encompassing technology, environmental, economic, and circular economy aspects, first introduced in [7]. Research has extensively examined how propulsion systems and fuel types impact aircraft sustainability. In [8,9], turbojet engines fueled by kerosene and bio-based alternatives underwent comprehensive energy, exergy, thermo-ecological, environmental, enviro-economic, and sustainability assessments. Similarly, ref. [10] investigates the potential benefits of hydrogen fuel in enhancing sustainability and environmental performance in a medium-scale turboprop engine. The sustainability and economic efficiencies of electric vehicles and aircraft are compared in [11]. In [12], a hybrid simulation approach assesses the sustainability of make-to-order supply chains. Further research, such as that by Karpuk et al. [13], illustrates the effect of new airframe and propulsion technologies on the sustainability of future medium-range jets. In [14], a thermodynamic, environmental, and sustainability analysis was conducted on the PW4000 engine across eight long-haul flight phases. Additionally, ref. [15] proposes an aircraft design process that incorporates sustainability throughout its service life, introducing a green index that combines maintenance costs with an environmental parameter. Reference [16] presents a model to support the design and evaluation of sustainable business models, while [17] examines 3D printing’s role in enhancing sustainability within an MRO setting. In [18], an exergetic metaheuristic design for a business jet aircraft predicts an exergetic sustainability index and an environmental effect factor using artificial neural networks for various flight phases. A sustainability index for an aircraft manufacturing company using a Fuzzy Best-Worst decision-making approach is introduced in [19]. Exergy modeling to evaluate the sustainability level of high by-pass turbofan engines in commercial aircraft is presented in [20]. Innovative concepts and methodologies continue to emerge. In [21], box wing aircraft technology is introduced alongside an overview of ongoing research efforts, while [22] describes an efficient fuzzy method for assessing sustainability in dismantling strategies, considering ten risk scenarios. The sustainability performance of turboprop aircraft is detailed in [23]. In [24], alternative green battery technologies are evaluated for their contributions to the Sustainable Development Goals. Lastly, ref. [25] presents a topology optimization-based design for load-bearing components, assuming that reducing maximum stress improves the load-carrying capacity, fatigue life, and overall sustainability.
From the reviewed literature, it is evident that existing research on aircraft sustainability has primarily concentrated on fuel types and propulsion systems, with most assessments focusing on operational factors rather than structural components. Studies addressing the sustainability of structural parts and mechanical design often operate under the assumption that enhancing strength and reducing weight inherently lead to improved sustainability. Notably, only the work in [5] offers a holistic sustainability assessment of a structural component by considering a broad range of criteria.
In this study, we propose a comprehensive sustainability assessment methodology specifically for aircraft parts, demonstrated through an application to a fuselage panel. With minor adjustments, this methodology can be applied to any structural component. Key innovations in the present work include the following:
  • The methodology is holistic as it efficiently combines environment, cost, and performance.
  • The methodology is robust as all combinations of MCDM, and weighting methods consistently identify the most sustainable options.
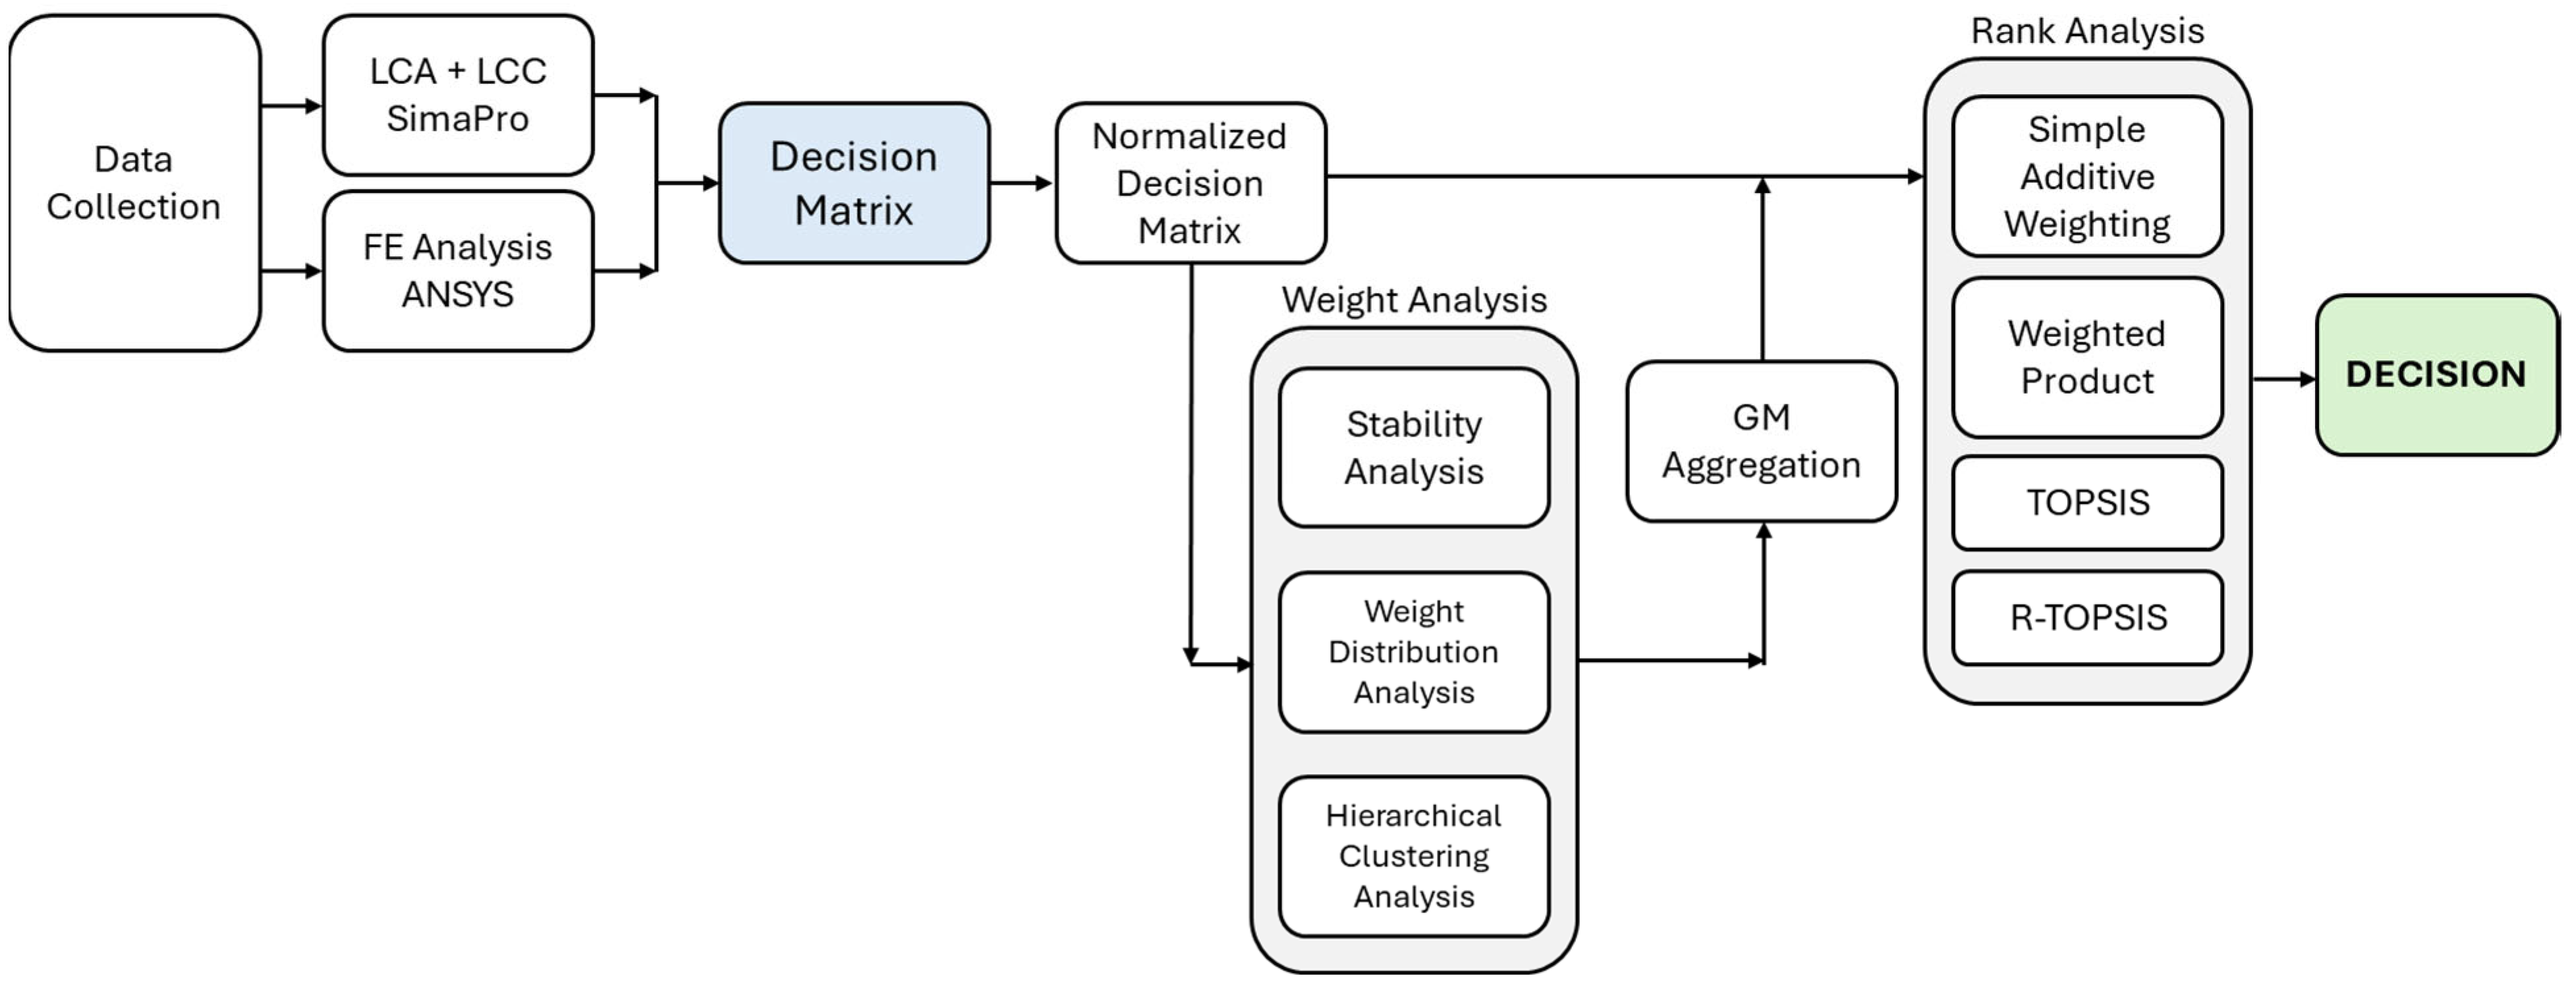
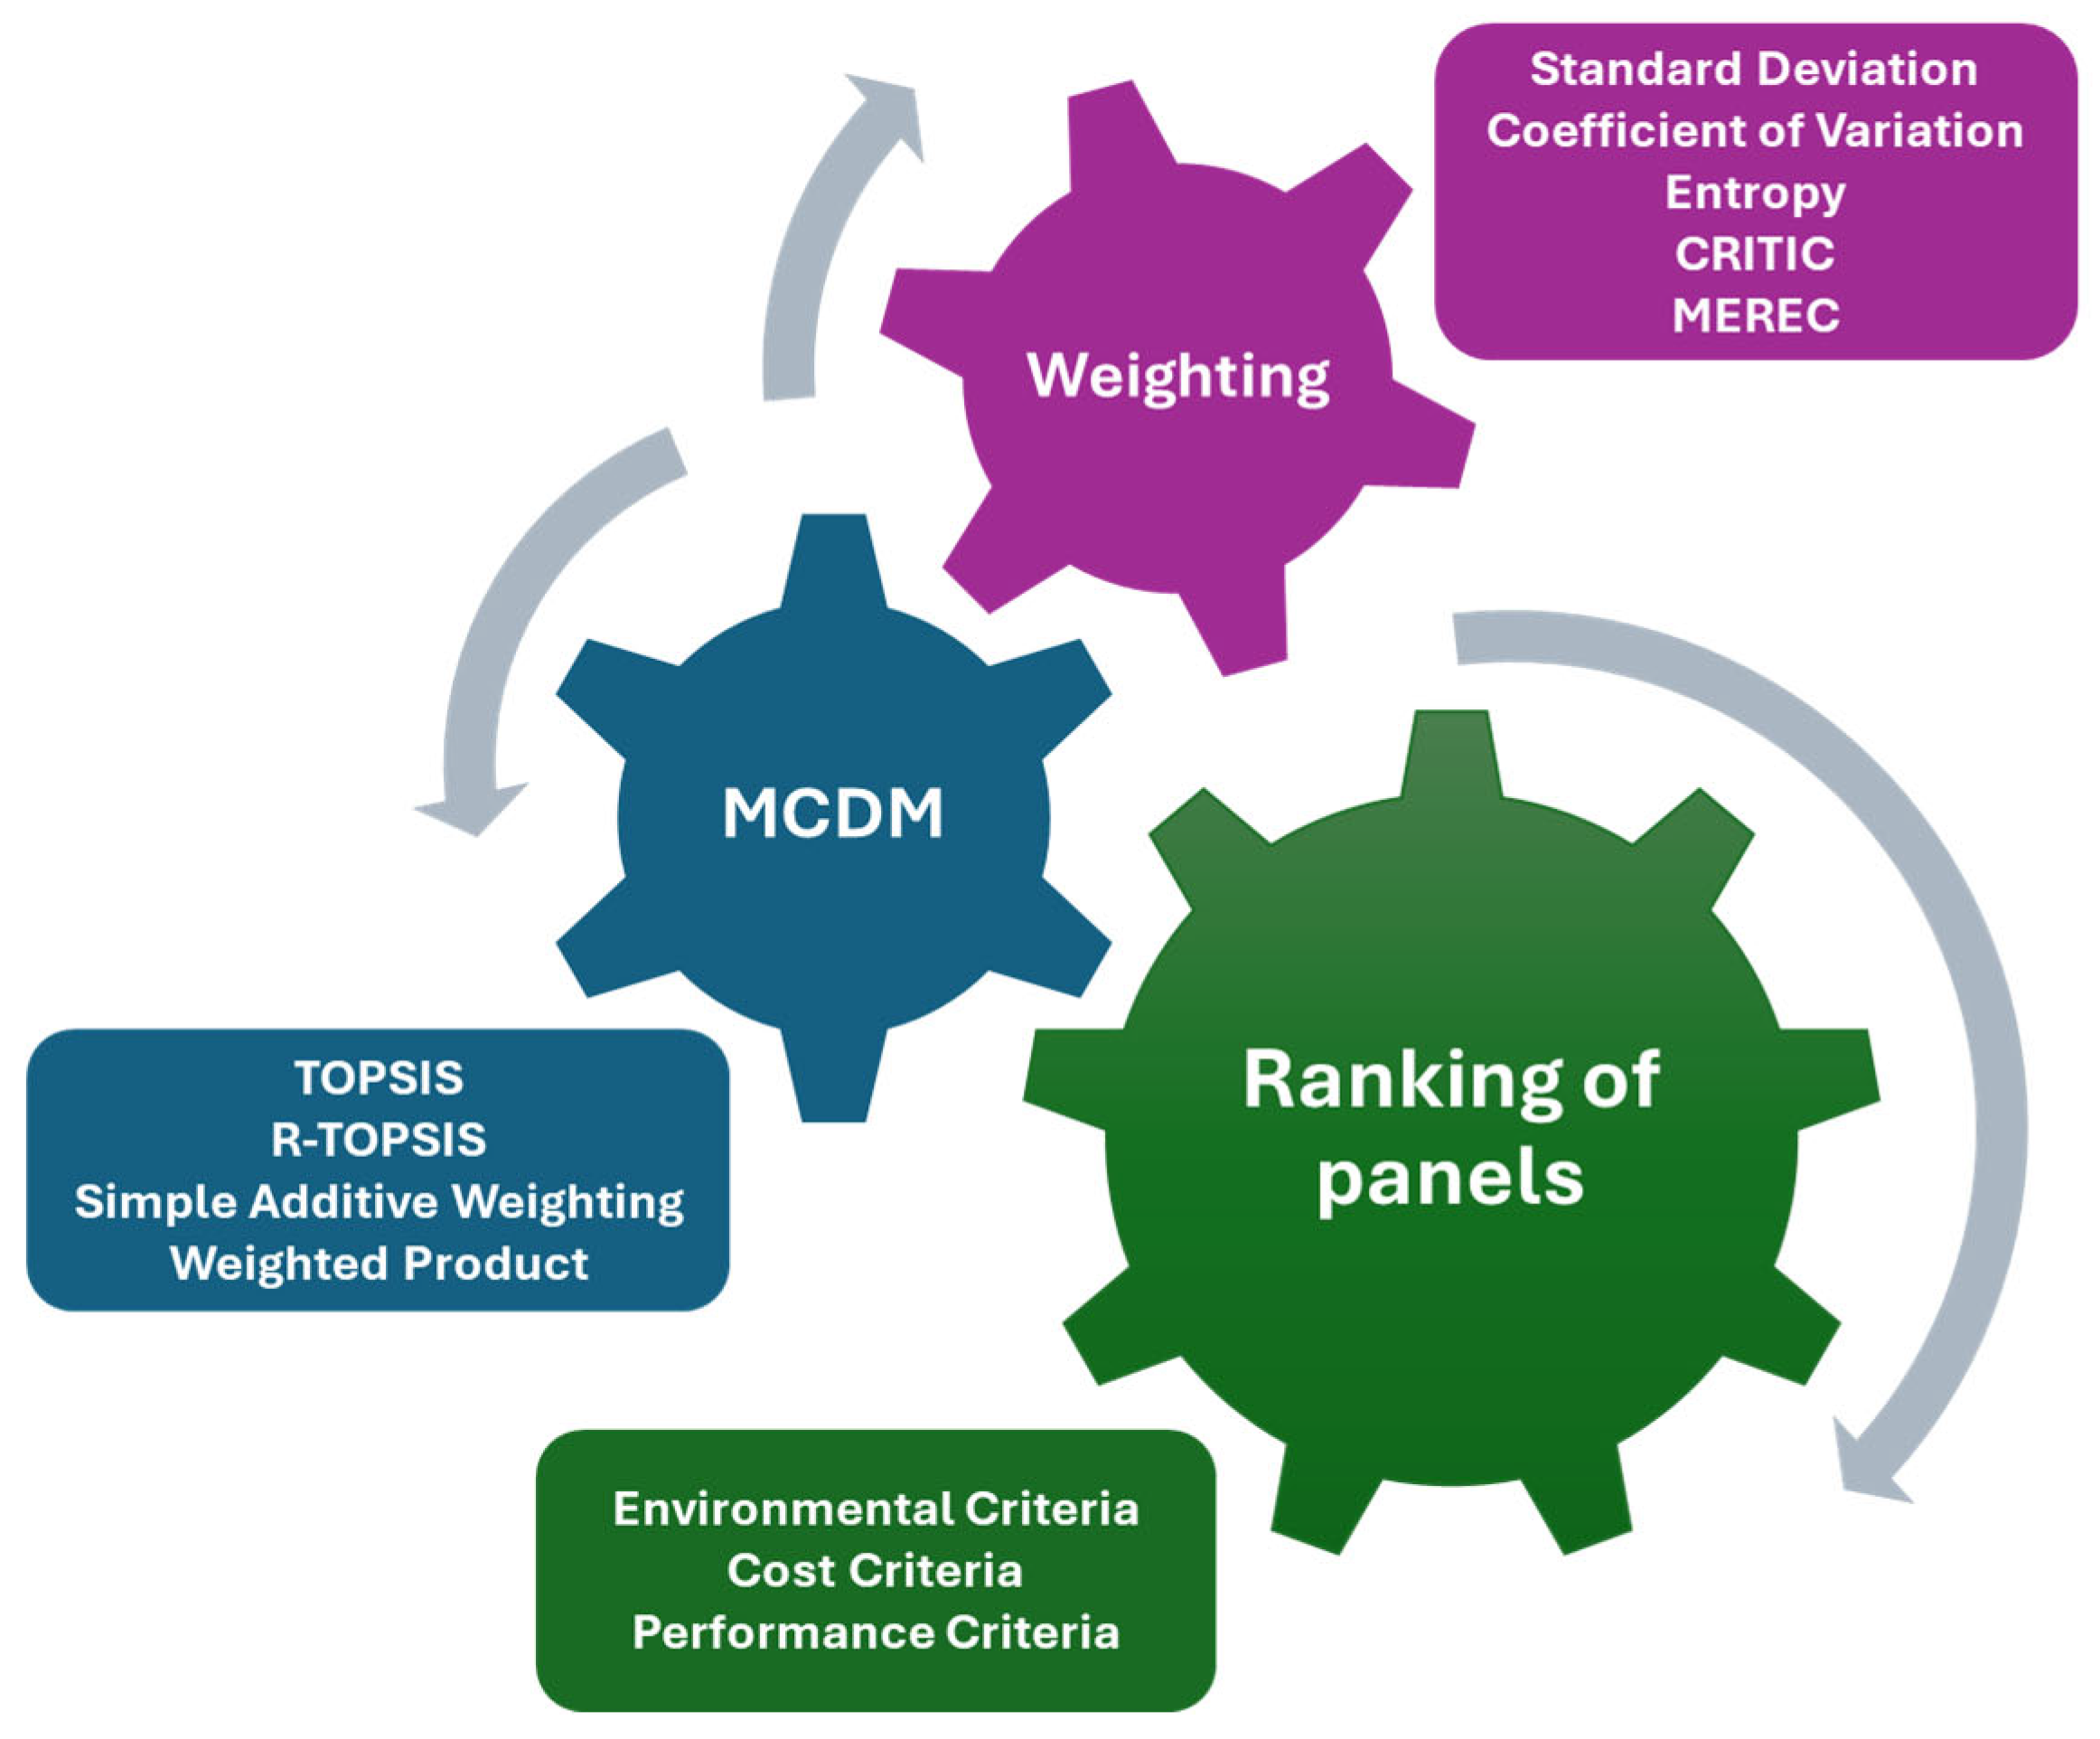
  • The methodology evaluates diverse assessment criteria using various MCDM methods, particularly the novel R-TOPSIS method and employs five different objective weighting methods to examine their influence on ranking outcomes.
  • It integrates SimaPro software with the Ecoinvent 3 database, a reliable combination, to conduct both lifecycle analysis (LCA) and lifecycle costing (LCC).
  • These innovations contribute to a more nuanced and adaptable approach to sustainability assessment in the field of aircraft structural design.

2. The Technological Problem

The objective of this work was to develop a robust methodology for assessing the sustainability of aircraft parts. While this methodology functions independently, it can also serve as a foundational step toward creating an eco-design methodology for aircraft components.
This work is motivated by the Clean Aviation project FASTER-H2, which aims to validate, down-select, mature, and demonstrate key technologies, as well as provide architectural integration for an ultra-efficient, hydrogen-enabled fuselage and empennage designed for targeted ultra-efficient short-to-medium-range (SMR) aircraft. The current study addresses a specific objective within this project: the development of a sustainability-driven eco-design approach for a fuselage that integrates a liquid hydrogen storage tank. The basic module of the eco-design approach is sustainability assessment. In this paper, the sustainability assessment methodology is described on the basis of its application to a fuselage panel.

Different Configurations of the Fuselage Panel

A schematic illustration of the fuselage panel is given in Figure 1. The panel comprises a curved skin, 7 stiffeners of Z-profile, 4 frames, and 24 clips.
The following alternative materials and joining methods manufacturing processes are considered:
  • Aluminum 2024 (Al2024), manufactured using stretch forming;
  • Aluminum 7075 (Al7075), manufactured using hydroforming;
  • Thermosetting (TS) composite material, manufactured using autoclave;
  • Thermoplastic (TP) composite material, manufactured using autoclave;
  • Welding for aluminum and TP;
  • Bonding for TS.
Also, for the skin, the stiffeners, and the frames, three different thickness values were considered.
By alternating between the three materials, the three joining techniques, and the three thickness values, nine distinct alternatives, S0 to S8, were created, as summarized in Table 1. The different materials, manufacturing processes, and thicknesses influence the environmental impacts, costs, and strength of each panel configuration. In this study, the joining method is considered to affect only the environmental impacts and costs. These alternatives represent possible fuselage panel designs, with varying environmental, cost, and performance metrics, highlighting the importance of the sustainability assessment methodology in the design process.

3. The Sustainability Assessment Methodology

3.1. Related Work

The use of multi-criteria decision-making (MCDM) methods for sustainability assessment in engineering structures is a well-established research area. Neto et al. [27] have reported a systematic review on the use of MCDMs for assessing social sustainability in the built environment. Ziemba [28] provided a thorough review that scientifically analyzes the suitability of various multi-criteria decision analysis (MCDA) methods for sustainability-related decision-making challenges, focusing on sustainability assessment and sustainable development. In engineering, most studies have targeted buildings [29,30,31] and environmental pollution management frameworks [32], with relatively few examining mechanical structures [6,33]. For instance, Negrin et al. [29] utilized unspecified MCDM techniques combined with three distinct weighting methods: equal weights for each objective, a 50–25–25 distribution giving more weight to environmental criteria, and a distribution derived from the CRITIC method [34], to evaluate the sustainability of different structural designs. In [30], Sanchez-Garrido employed five MCDM methods, introducing a sustainability index created by the weighted aggregation of the scores across MCDM methods. The criteria weights were based on their frequency of use in civil engineering MCDM design, as this usage frequency is considered reflective of each method’s strengths and limitations, with data gathered from the literature. Bhat et al. [31] applied the TOPSIS MCDM method in conjunction with the entropy weighting method to evaluate the sustainability of various machining methods. Jasinski et al. [33] developed a comprehensive sustainability assessment framework for the automotive industry by selecting criteria from the literature and refining them through expert interviews with professionals from academia, automotive manufacturers, consultancies, and NGOs. Their framework aims to serve as a decision-support tool during the early stages of vehicle development. Markatos et al. [35] combined the analytical hierarchy method (AHM) MCDM method with a weighted sum model (WSM) for sustainability assessment. These studies illustrate the versatility and adaptability of MCDM methods across various engineering applications, highlighting their potential for supporting sustainability-oriented decision making. Sharma et al. [36] made an attempt to find the optimal parametric combination for improving the productivity and sustainability of a production firm that uses the laser welding (LW) and electro chemical machining (ECM) processes. Peiro [37] studied the implementation of hybrid renewable energy systems in hospitals, as an applicable solution to improve the sustainability of power systems. To consider all aspects of sustainability for choosing the optimal system, a MCDM approach, considering the technical, environmental, economic, and energy security criteria, was applied using the TOPSIS method. Lastly, Moro et al. [38] addressed the existing gap in the research by comparing LCA methods with durability parameters integrated and MCDM methods in concrete mixtures.
Herein, we propose a parametric sustainability assessment method for aircraft parts. Increased effort has been placed on the robustness of the methodology by employing various MCDM methods, considering different objective weighting methods, and studying the influence of the weights on the sustainability outcome. In the next section, the methodology will be described in detail on the basis of its application to the fuselage panel described in Section 2.

3.2. The Methodology

The flowchart in Figure 2 depicts the basic components and sub-components of the sustainability assessment methodology. In the following sections, all components will be described in detail.

3.2.1. Criteria

While the definition of sustainability is inherently dynamic, it traditionally includes environmental, economic, technical, and social criteria. In the methodology presented here, the focus is on the first three criteria—environmental, economic, and technical—which are detailed in the following sections.
Environment
The environmental criteria are grounded in a comprehensive cradle-to-grave lifecycle assessment (LCA) performed using SimaPro software with the Ecoinvent 3 library, which is in alignment with ISO14040 and ISO14044 standards [39,40] The framework for the LCA consists of the following steps:
  • Definition of goal and scope: The first step of an LCA involves outlining the purpose and scope of the assessment, including the functional unit under study, the system boundaries, and the assumptions and limitations.
  • Inventory analysis: The second step requires the collection of data.
  • Impact assessment: In this step are chosen the environmental categories that we want to interpret. This is performed by selecting the appropriate method in SimaPro.
  • Interpretation: The last step of an LCA is where the results are discussed.
Each of these steps is detailed in the sections that follow.
A. Definition of goal and scope: The primary objective of this assessment is to evaluate the environmental impact associated with the production of the panel, focusing on variations in materials, geometries, and manufacturing processes for nine panel alternatives. The functional unit in this study is defined as a single panel. The initial design (S0 scenario) of the panel (geometry and materials) was provided in the context of the Faster-H2 project, and the other scenarios were based on the initial one with changes in the geometry and the materials for the scope of the sustainability assessment methodology. This analysis is considered from cradle to grave and covers all production and manufacturing stages, from raw material extraction until the end of the life of the panel, including its use phase. As the use phase is considered, the panel’s transportation as a part of the fuselage of an A319 aircraft which has a lifetime of 30 years. The panel is assumed to remain in service for the entire aircraft lifespan, with fatigue not being taken into account. Details for the use phase and the different waste scenarios for the different materials can be seen in Appendix A.4 and Appendix A.5 in Table A11, Table A12 and Table A13. Transportation impacts are neglected due to data unavailability.
B. Inventory analysis: Data collection, the most labor-intensive phase of the LCA, involves gathering comprehensive information on materials and processes within the defined system boundaries. Key data sources include the Ecoinvent 3 database, and relevant literature. The panel consists of the skin, the stiffeners, the frames and the clips. All elements can be made from three different materials: aluminum, thermoset CFRP, and thermoplastic CFRP. Materials and manufacturing processes for each part of the alternatives described in Table 1 are listed in Table 2, Table 3 and Table 4. More data for the materials used in the LCA are provided in Appendix A.1.
LCA also encompasses pre-production processes essential for preparing materials in the required forms for manufacturing. These processes are schematically explained in Figure 3. A summary is given below.
For the aluminum panel, we used the following processes for the following parts:
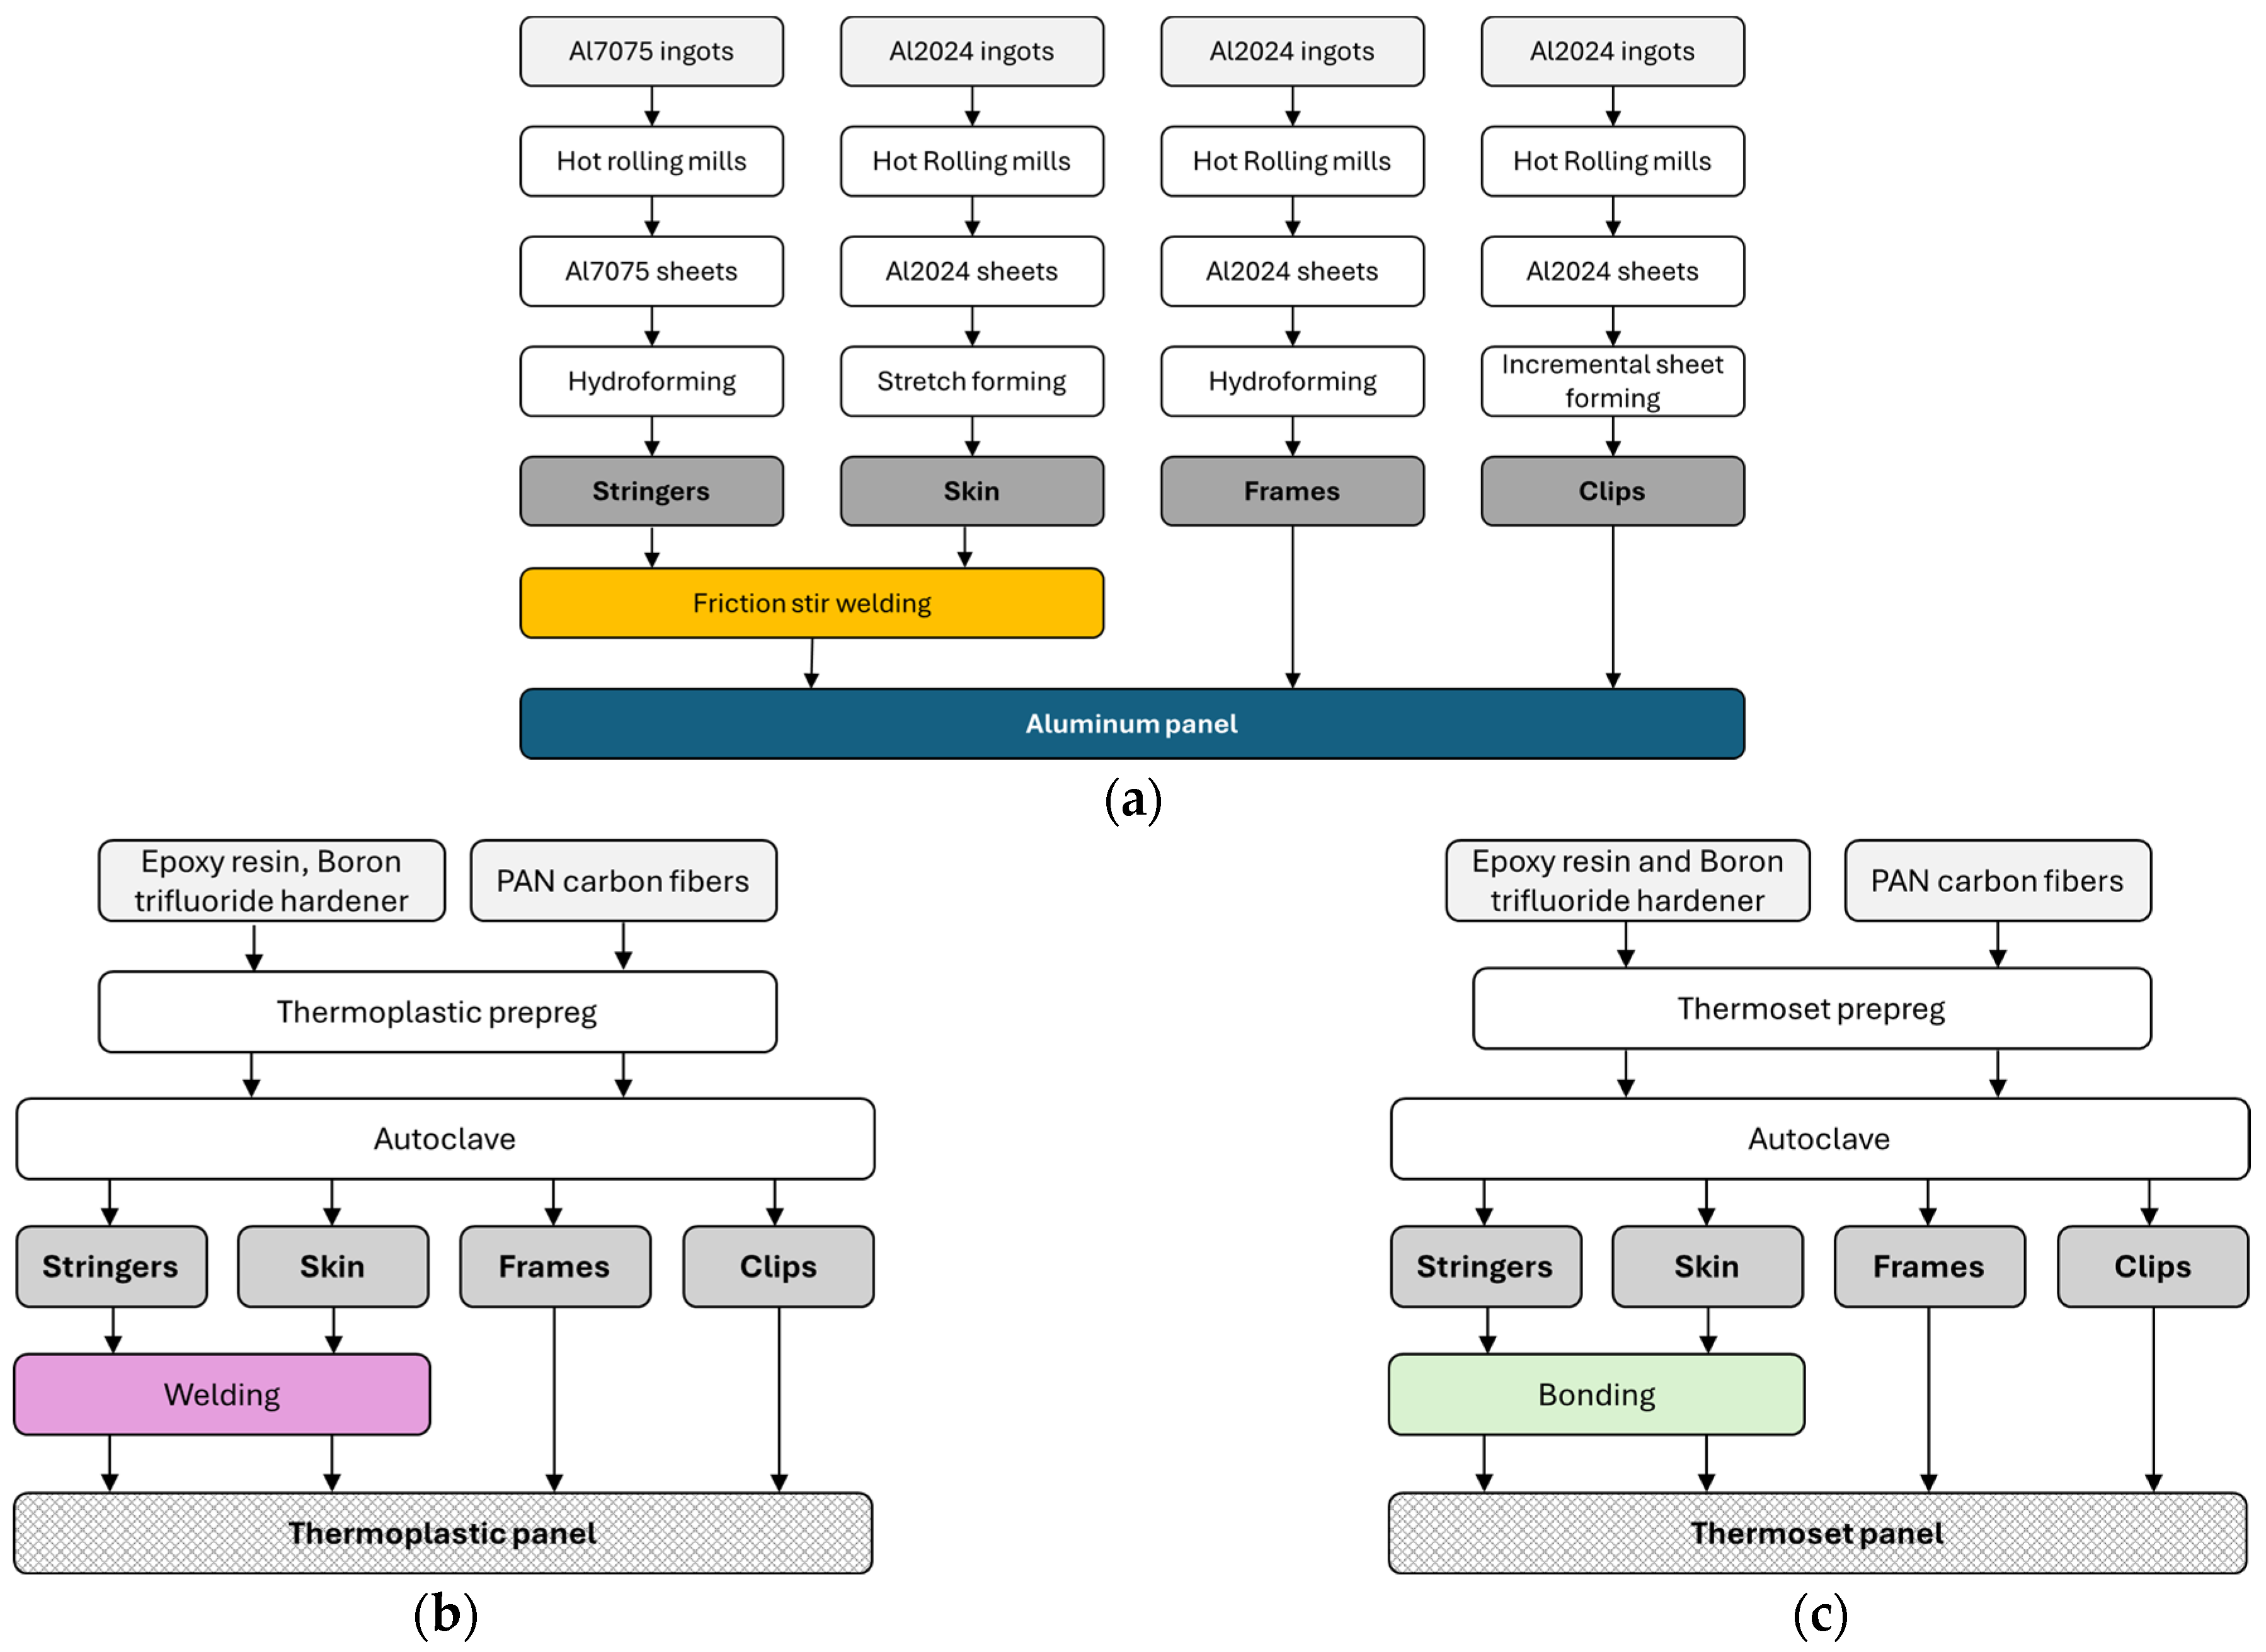
  • Stiffeners: Al7075 ingots are passed through rolling mills to form sheets, which are then used to produce the stiffeners and clips through the hydroforming process.
  • Skin: Al2024 ingots are passed through rolling mills to form sheets, which then are used to produce the skin through the stretch forming process.
  • Frames: Al2024 ingots are passed through rolling mills to form sheets, which are then used to produce the stiffeners and clips through the hydroforming process.
  • Clips: Al2024 ingots are passed through rolling mills to form sheets, which then are used to produce the stiffeners and clips through the incremental sheet forming process.
Stiffeners are welded to the skin through friction stir welding.
For the thermoplastic panel, we used the following processes for the following parts:
  • Polyphenylene powder, a thermoplastic resin, is added to the PAN carbon fiber fabric and the prepreg is constructed. Then, using an autoclave, the skin, stiffeners, frames, and clips are manufactured. Finally, the stiffeners are welded to the skin.
For the thermoset panel, we used the following process:
  • The process is similar to the process of thermoplastic composite with different joining method. Epoxy resin with Boron trifluoride hardener is added to the PAN carbon fiber fabric and the prepreg is constructed. Then, using an autoclave, the skin, stiffeners, frames, and clips are manufactured. Finally, the stiffeners are bonded to the skin. Data for the bonding can be found in Table A5.
Comprehensive material and process data are provided in Appendix A.
C. Impact assessment: The environmental criteria considered in this study are given as follows:
  • Human health (C1): Measured as disability adjusted life years (DALYs), representing the combined years of life lost and years lived with disability.
  • Ecosystems (C2): Assessed based on species loss over a specific area and time period.
  • Resource scarcity (C3): Evaluated as the additional future production costs of resources over an infinite timeframe, with constant annual production and a 3% discount rate applied.
  • Global warming potential (GWP) (C4): Climate change factors of IPCC method with a timeframe of 100 years, where carbon dioxide uptake is implicitly included.
These criteria were calculated using two methods:
ReCiPe 2016 Endpoint (H) V1.08: This method, available in SimaPro, is categorized globally, with characterization factors representing impacts on a global scale. Based on the Hierarchist perspective (H), it aligns with generally accepted policy principles concerning timeframes and related considerations. The ReCiPe method provides results on human health, ecosystems, and resource scarcity.
IPCC 2021 GWP100 V1.02: Falling under SimaPro’s Single-Issue category, this method specifically assesses global warming potential (GWP) in terms of kg CO2 equivalent.
Figure 4 illustrates the tree diagram of the SimaPro process used to calculate the GWP criterion for the aluminum panel and thermoplastic panel. The tree diagram for the thermoset panel is omitted here for brevity.
D. Interpretation of the results: In this study, the interpretation of the results is not straightforward and is derived from ranking the alternative designs of the panel in terms of sustainability, combining environmental, cost, and performance criteria.
Cost
LCC is an economic analysis method focused on calculating all costs associated with constructing, operating, and maintaining a project over a specified period [10]. Within this study, an LCC framework is implemented in SimaPro to capture the full range of expenses related to panel production. The cost criteria (C5 to C8) are detailed below:
  • Material cost (C5): This includes expenditures on the raw materials used in production; see Table A9 and Table A10.
  • Energy cost (C6): Accounts for energy consumption throughout the production and manufacturing processes.
  • Use cost (C7): Includes kerosene consumption for transporting the panel throughout the entire operational lifetime of the A319.
  • End of life (EoL) cost (C8): Accounts for the cost of EoL services (recycling, landfill, incineration, etc.).
This LCC methodology provides a comprehensive view of economic impacts across the panel’s lifecycle, enabling a thorough sustainability assessment. Due to data limitations, labor costs and service costs for manufacturing processes were not included in the study.
Performance
The performance of the fuselage panel is evaluated based on its mass and specific stiffness. Mass is designated as performance criterion C9, as it is a critical factor in sustainability assessments. A lighter panel requires fewer materials, less energy, and lower costs, resulting in reduced emissions. Additionally, reducing panel weight enhances aircraft efficiency by decreasing fuel consumption during operation, resulting in less environmental impacts during the use phase. Specific stiffness, an essential structural design parameter, is also evaluated. To compute specific stiffness, a finite element model (FEM) of the panel was developed in ANSYS Workbench 2023R1as shown in Figure 5a, with all components represented by solid elements (excluding clips). Specific stiffness was determined by applying a unit axial compressive displacement at one end of the panel while fully constraining the opposite end. Figure 5b illustrates the axial deformation contour of the panel under this load. Specific stiffness is designated as performance criterion C10.
Table 5 summarizes the 10 criteria in terms of category, impact type, and sign.

3.3. MCDM Analysis

Assessing the sustainability of aircraft components involves multiple criteria, including environmental, economic, and performance metrics. To assess these criteria and make appropriate decisions, we use a set of multi-criteria decision-making (MCDM) tools. Our approach, schematically explained in Figure 6, utilizes (i) different normalization techniques, (ii) objective weighting methods, and (iii) ranking methodologies to ensure a robust and reliable sustainability assessment.
We begin by formulating the decision matrix X = x i j m × n that collects the performance values of each alternative across all criteria, i.e., x i j refers to the value of the j -th criterion for the i -th alternative. The i = 1,2 , , m denotes the set of alternatives, where m = 9 corresponds to the nine different aircraft panel designs that are being studied, and j = 1,2 , , n are the criteria in our case study, n = 10 includes the sustainability assessment’s environmental impacts, costs, and performance metrics.
Because the criteria have different units and scales, normalizing the data is necessary to make meaningful comparisons by transforming the raw data x i j into a dimensionless form n i j , ensuring that all criteria contribute appropriately to the decision-making process without being unduly influenced by their original units or magnitudes. The normalized decision matrix N = n i j m × n is obtained by applying well-established procedures, including vector normalization, min–max normalization, and linear scale normalization. These procedures transform the data into a common scale, fixing the nonuniformity in the performance of different alternatives.
After data normalization, the next step is to determine the weights w j of the criteria C j using objective weighting methods in order to capture the relative importance of each criterion. We avoid subjectivity in the weighting using several methods, which are standard deviation (SD), coefficient of variation (COV), entropy, CRITIC, and MEREC, that aim to account for the distribution of variables both across and within the criteria.
Consequently, once the normalized decision matrix N , as well as the weight vector w = w 1 , w 2 , , w n , are defined, we apply MCDM ranking methods to evaluate and compare the alternatives, such as simple additive weighting (SAW), weighted product (WP), technique for order preference by similarity to ideal solution (TOPSIS), and the novel R-TOPSIS method, which are used to aggregate the criteria values and produce a ranked list of alternatives based on their overall sustainability performance.
In the subsequent sections, we explain the normalization methods applied (Section 3.3.1), the objective weighting methods used to set the criteria weights (Section 3.3.2), and the MCDM ranking methods employed for the evaluation of the alternatives (Section 3.3.3).

3.3.1. Normalization Methods

Normalization in MCDM is a crucial step that ensures a fair and accurate comparison between different criteria that may have varying units and scales. By transforming the raw data into a common scale, normalization eliminates biases caused by differences in measurement units, making it easier to assess and rank alternatives objectively. It enhances the reliability of decision-making methods such as TOPSIS, VIKOR, and AHP by ensuring that no criterion disproportionately influences the final decision. Additionally, normalization helps improve computational efficiency and interpretability, allowing decision-makers to derive meaningful insights from the data and select the best alternative based on well-balanced criteria.
In our sustainability analysis of the design of the aircraft panel, we consider both cost criteria (which should be minimized) and benefit criteria (which should be maximized). Therefore, the normalization methods we employ must effectively address both types of criteria to ensure that the meaning of the normalized values is straightforward, with a higher normalized value indicating better performance across all criteria. Among the many normalization methods available, we have selected three widely recognized approaches: (a) vector normalization, (b) min–max normalization, and (c) linear scale normalization as presented in Table 6, where x i j denotes the original value, and n i j is the normalized value for the i -th alternative with respect to the j -th criterion.
In our case study, the criteria are classified as follows:
  • Benefit criterion (to be maximized): C10 (Specific stiffness)
  • Cost criteria (to be minimized): C1–C9 environmental impacts (human health, ecosystems, resources, global warming potential), costs (material, energy, use-phase, end-of-life), and mass efficiency.
The normalized decision matrix N = n i j , which is produced from all three methods, as detailed above, contains dimensionless values comparable across all criteria, with higher values consistently indicating a better performance. However, in MCDM analyses, it is important to select the appropriate normalization method which can greatly affect both the final ranking of alternatives and the calculation of criteria weights using objective weighting methods. Previous studies have demonstrated the fact that, in MCDM applications, different normalization methods produce relatively different results, which then affect the robustness and reliability when making a decision [41,42].
To identify the best-applied normalization technique in our study, we performed an extensive stability analysis, presented in Section 4.2.1, to evaluate how sensitive the weighting methods and overall rankings are to perturbations in the normalized data. Our simulations indicated that the choice of normalization method significantly impacts the performance of objective methods used for calculating weights, especially for those methods based on the data’s spread. Applying incorrect normalization may result in biased or unstable weights, which can affect the reliability of the MCDM process [43].
For our dataset, vector normalization proved to be the best method since it showed more stability in generating criteria weights across various perturbation levels compared to min–max and linear scale normalization. Moreover, we verified that all MCDM methods that are applied for ranking the alternatives must utilize the same normalization method used through the weighting stage. Based on these findings, we adopted vector normalization as the method for normalization in this study.

3.3.2. Objective Weighting Methods

Determining the weights is one of the most crucial steps because it affects the ranking of the alternatives and can be subjectively or objectively determined. Subjective weights are based on the opinion of experts, whereas objective weights are based on the data properties like variability or contrast. In this study, we used five well-known objective methods to minimize bias and, therefore, transparency in the whole process of the sustainability assessment. Specifically, the applied methods are standard deviation (SD), coefficient of variation (COV), entropy, CRITIC, and MEREC. These methods were implemented using custom MATLAB R2024a functions developed for this project. In the following, we present a brief description of each implemented method.
Standard deviation (SD) [34,44,45]. Let n i j be the normalized values, then the weight w j for criterion j is calculated as
w j = s j k = 1 n     s k ,
where s j = 1 m 1 i = 1 m     n i j n j 2 is the sample standard deviation of the j -th criterion and n j = 1 m i = 1 m   n i j is the mean of the normalized values. The rationale of the SD method is to assign higher weights to criteria with greater variability across alternatives, providing, in this way, a discriminating power that is particularly effective when the differentiation between alternatives is a key consideration.
Coefficient of variation (COV) [44]. The COV method extends the SD by considering the relative variability of each criterion since it normalizes the standard deviation with the mean. The weight w j for j -the criterion is given by
w j = C V j k = 1 n     C V k
where C V j = s j n j is the coefficient of variation for the criterion j with s j and n j defined as in the SD method. Consequently, any criterion where COV exhibits greater values than others is more significant, as its relative weight within the COV is higher, resulting in the enhanced discriminating power of the criterion in differentiating the alternatives.
Entropy method [44,46]. The entropy method measures the information content in each criterion using Shannon’s entropy concept, where the key idea is to assign weights based on the amount of information present in the criteria. To this end, first, we calculate the proportion p i j of alternative i for criterion j
p i j = n i j i = 1 m     n i j ,   i , j
and then compute the entropy e j of each criterion:
e j = k i = 1 m   p i j l n p i j , j
where the constant k = 1 l n ( m ) guarantees that 0 e j 1 . The degree of diversification d j of the information contained in each criterion is d j = 1 e j , and finally, the normalized weight w j is calculated by
w j = d j k = 1 n     d k
Generally, the lower the information entropy of a criterion, the more information it provides, and thus the greater its weight is, while criteria with a more uniform distribution of values (higher entropy) are considered less informative and assigned lower weights.
CRITIC method [34]. The CRITIC (criteria importance through intercriteria correlation) method calculates objective weights for criteria by considering both standard deviation and intercriteria correlations, by aiming to reflect the significance of individual criteria as well as the conflicts that may arise between them. To this end, the weight for each criterion is computed using these two factors. For each criterion j , the weight w j is calculated as:
w j = C j k = 1 n     C k
where C j is the amount of information contained in the j -th criterion is determined by:
C j = s j k = 1 n   1 r j k
Here, s j is the sample standard deviation of the j -th criterion as defined in the SD method, and r j k represents the Pearson correlation coefficient between criteria j and k computed as:
r j k = i = 1 m     n i j n j n i k n k i = 1 m     n i j n j 2 i = 1 m     n i k n k 2
CRITIC assigns higher weights to criteria with high standard deviation (which measures contrast intensity) and low correlation with other criteria (which measure conflict). The factor 1 r j k emphasizes criteria that are less correlated (lower r j k ) with others, hence increasing their weights to reflect their distinct contribution to the decision. These two facts make CRITIC particularly effective for problems where both the discriminating power of criteria and their independence from other criteria are crucial to avoid information redundancy. However, it is necessary to note that CRITIC mainly identifies a linear relationship in the pairs of variables through correlations, making it less effective in situations that involve multiple criteria with complex interdependencies in a nonlinear way.
MEREC method [47,48]. The MEREC (method based on the removal effects of criteria) is a novel objective weighting technique that determines criteria weights by considering the effect of excluding each criterion on the overall performance of alternatives. MEREC employs a causality-based approach, emphasizing the actual contribution of each criterion to the decision process, in contrast to traditional objective weighting approaches that depend exclusively on direct variability measurements like standard deviation or entropy.
For each alternative i , the overall performance score S i is defined and computed via a nonlinear function f x = l n 1 + l n x as follows:
S i = ln 1 + 1 m j = 1 m     ln n i j
where n i j denotes the normalized values. The performance score of the alternative i when j th criterion is removed is calculated as:
S i j = ln 1 + 1 m k = 1 k j m     ln n i k
Then, the effect of removing the j t h criterion is measured as the summation of absolute deviations E j = i = 1 n   S i j S i and the weight w j is determined by normalizing the removal effects:
w j = E j k = 1 m     E k
Obviously, higher removal effects E j indicate the greater importance of a criterion in differentiating alternatives, leading to higher weights. The method utilizes a logarithmic metric to aggregate performances and assesses the significance of each criterion by evaluating its impact on decision outcomes when removed. The results of the simulation that the authors carried out in [47] show that MEREC produces reliable weights that exhibit a strong correlation with other (SD, entropy, CRITIC) for small problems; however, this correlation weakens as the problem size increases. The effectiveness of any weighting method depends on the proper normalization of the decision matrix and the careful execution of the computational procedure.

3.3.3. MCDM Methods

After obtaining the normalized decision matrix N = n i j m × n and criteria weights w = w 1 , w 2 , , w n , four MCDM methods were employed in this study to rank the alternatives: simple additive weighting (SAW), weighted product (WP), TOPSIS (technique for order of preference by similarity to ideal solution), and R-TOPSIS (robust TOPSIS). Each evaluation method handles cost and benefit weighting through different aggregation and ranking mechanisms. In the SAW method, linear aggregation is applied by adding the products obtained from each criterion weighting to a set of normalized measures. On the other hand, the WP method employs a multiplicative aggregation by taking the product of the weighted normalized criteria rather than simply summing them. In contrast, TOPSIS and its strong variant R-TOPSIS concentrate on how far the given alternatives are from the ideal and the anti-ideal alternatives, respectively, and thus evaluate how close they are to these two solutions.
As noted by several researchers [43,49], different MCDMs may provide an inconsistent order of preferences even for the same problem. It is natural since each method has its own aggregator structure which is responsible for combining the information with the criteria. Therefore, applying more than one approach strengthens the reliability of the ranking results by thoroughly studying the problem for the decision using various approaches. To do so, all methods have been applied in a consistent manner by normalizing the decision matrix with respect to the benefit and cost criteria described in Section 3.3.1. In the following, we present a mathematical description of each method.
Simple additive weighting (SAW) [46,50]. The SAW method is one of the oldest techniques in the MCDM field, and its popularity is owing to its relative simplicity and ease of computation. For each alternative i , an overall preference score V i is calculated by multiplying each normalized value n i j   with its associated weight criterion w j and summing across all criteria:
V i = j = 1 n w j   n i j ,     i = 1,2 , ,   m
The alternatives are ranked based on their resulting values V i in descending order, where a higher value indicates better performance. The SAW method validity is based on the additive utility assumption [51]; although in many engineering problems, these assumptions do not hold—such as when criteria are interdependent or exhibit nonlinear relationships—the SAW method remains a widely used approach in MCDM due to its simplicity and ease of interpretation.
Weighted product (WP) [50,51]. The WP method is similar to SAW but aids in extending it by means of employing a multiplicative aggregation approach, which effectively captures nonlinear relationships between criteria. For each alternative i , the preference score P i is computed as a product of every normalized criterion value raised to the weight corresponding to that criterion:
P i = j = 1 n   n i j w j ,     i = 1,2 , , m
where n i j is the normalized value of the i th alternative with respect to the j th criteria, and w j is the corresponding criterion weight, ensuring that j = 1 n   w j = 1 . In order to make all the alternatives comparable, preference scores P i are normalized by dividing each P i by the maximum score within the set:
V i = P i m a x k = 1 m   P k ,     i = 1,2 , , m
This normalization guarantees that all the V i scores fall between 0 and 1, where a higher score represents a better performance; therefore, alternatives are then ranked based on their V i values in descending order. The WP has two main advantages; first, it penalizes alternatives that perform poorly with higher penalties than the additive technique; second, its geometric aggregation approach makes it ideal for problems where criteria depend on each other [51].
TOPSIS [46,51]. The TOPSIS method is a widely utilized MCDM method that ranks alternatives based on relative closeness to a positive ideal solution (PIS) and a negative ideal solution (NIS). TOPSIS is carried out through the following for a normalized decision matrix N = n i j m × n :
First, calculate the weighted normalized matrix Y = y i j m × n by applying the criteria weights w j to each normalized value:
y i j = w j n i j ,   for   i = 1,2 , , m ; j = 1,2 , , n
The positive ideal solution ( A + ) and negative ideal solution ( A ) are then determined by:
A j + = m a x m i = 1   y i j   if   j   is   a   benefit   criterion   m i n m i = 1   y i j   if   j   is   a   cos t   criterion   ; A j = m i n m i = 1   y i j   if   j   is   a   benefit   criterion   m a x m i = 1   y i j   if   j   is   a   cos t   criterion  
The separation between each alternative is measured by the Euclidean distances and calculated as
S i + = j = 1 n     A j + y i j 2 ,   S i = j = 1 n     y i j A j 2 ,   i = 1,2 , , m
to quantify how close each alternative is to PIS and NIS. Finally, the relative closeness coefficient C i of each alternative to the ideal solution is given by
C i = S i S i + + S i , i = 1,2 , , m
A higher C i indicates that the alternative A i is closer to the PIS and further from the NIS, thus being more desirable; therefore, the alternatives are ranked in descending order of C i values.
R-TOPSIS [52]. R-TOPSIS addresses the rank reversal problem through a domain-based normalization while maintaining the core principles of classical TOPSIS. The method requires a pre-defined domain D = [ d 1 j ,   d 2 j ] for each criterion j and performs max or max–min normalization across all criteria, with criterion type differentiation (cost or benefit) occurring only in determining ideal solutions (PIS and NIS). The key difference that characterizes both benefit and cost criteria is only about the ideal solutions PIS and NIS since these ideal points remain fixed (see Step 4).
Here are the main steps of the R-TOPSIS algorithm [52]:
Step 1: Define the decision matrix X = x i j m × n ; the criteria weights as W = w j 1 × n , where w j > 0 and j = 1 n   w j = 1 ; and a sub-domain of real numbers D = d j 2 × n , where d j R , to evaluate the rating of the alternatives, where d 1 j is the minimum of D j and d 2 j is the maximum of D j .
Step 2: Calculate the normalized decision matrix n i j ) by using max or max–min as:
n i j = x i j d 2 j , o r   n i j = x i j d 1 j d 2 j d 1 j ,       i = 1,2 , , m ; j = 1,2 , , n
Step 3: Calculate the weighted normalized decision matrix as
y i j = w j n i j ,   for   i = 1,2 , , m ; j = 1,2 , , n
Step 4: Set the negative (NIS) and positive (PIS) ideal solutions such as:
A j + = w j   if   j   is   a   benefit   criterion   d 1 j d 2 j w j   if   j   is   a   cos t   criterion   ; A j = d 1 j d 2 j w j i f   j   i s   a   b e n e f i t   c r i t e r i o n w j i f   j   i s   a   c o s t   c r i t e r i o n
Step 5: Calculate the distances of each alternative i in relation to the ideal solutions such as:
S i + = j = 1 n     A j + y i j 2 ,         S i = j = 1 n   y i j A j 2 ,     i = 1,2 , , m
Step 6: Derive the closest coefficient of the alternatives C i as
C i = S i S i + + S i ,     i = 1,2 , , m
Sort the alternatives in descending order. The highest C i gives the best performance with regard to the evaluation criteria.

4. Results

4.1. Construction and Normalization of the Decision Matrix

According to the methodology outlined in Section 3.2, the initial decision matrix was constructed using the criteria defined in Table 5, which consisted of ten criteria (C1–C10) divided into three categories: environmental impact, cost, and performance. Nine alternatives were evaluated, a reference aluminum panel (S0), two aluminum variants (S1–S2), three thermoset CFRP panels (S3–S5), and three thermoplastic CFRP panels (S6–S8). Criteria C1 to C4 focus on environmental factors, emphasizing their importance in ecological evaluations, whereas C5 to C8 address economic issues, reflecting financial considerations. Criterion C9 is the panel’s mass, which must also be minimized, while criterion C10 represents specific stiffness, which should be maximized. These latter criteria are classified as performance indicators.
The decision matrix incorporates environmental impact indicators derived from lifecycle assessment (C1–C4), comprehensive cost factors covering the entire lifecycle (C5–C8), and key performance parameters (C9–C10). As shown in Table 7, the data span different orders of magnitude and units of measurement, necessitating a normalization procedure for meaningful comparison. For instance, the environmental indicators range from very small values (C2, in the order of 10−3) to very large values (C3 and C4, in the order of 105).
Considering the diversity of the criteria and their distinct units of the measurement system, the vector normalization approach was utilized to transform the initial decision matrix into comparative dimensionless units, a choice that will be validated through detailed stability analysis in Section 4.2.1. In a decision matrix X = x i j m x n , with m alternatives and n criteria, each normalized value n i j is calculated using the formula:
n i j = x i j i = 1 m x i j 2   if   j   is   a   benefit   criterion   1 x i j i = 1 m x i j 2   if   j   is   a   cos t   criterion  
where x i j is the original value for the i -th alternative to the j -th criterion.
Table 8 provides the normalized decision matrix, which is computed by applying the equations of Table 6 (second column for criteria C1 to C4 and C10 and third column for criteria C5 to C9), with values rounded to four decimal places for consistency. The normalizing procedure allows direct comparison among all criteria while maintaining the relative proportions of alternatives for each criterion, transforming the varied scales of the original criteria into uniform units.
Examining the normalized values in Table 8 resulted in the following observations concerning the established ideal points within each criteria category.
Environmental criteria (C1–C4) reveal a distinct separation between aluminum (S0–S2) and composite (S3–S8) alternatives. The aluminum panels exhibit lower normalized values (0.53–0.57 range) across all environmental indicators, whereas CFRP alternatives show superior ecological performance with higher normalized values (0.73–0.76 range). Panel S7 (CFRP Thermoplastic) demonstrates superior environmental performance, with normalized values consistently exceeding 0.76.
Cost criteria (C5–C8) indicate different trends among various cost components. In terms of material and energy costs (C5–C6), aluminum alternatives (S0–S2) exhibit superior performance, with normalized values exceeding 0.94, whereas CFRP thermoset panels (S3–S5) present lower values, ranging from 0.43 to 0.47. CFRP thermoplastic alternatives (S6–S8) exhibit intermediate material cost performance, ranging from 0.84 to 0.86. In terms of end-of-life costs (C8), a contrary trend is noted, with CFRP alternatives achieving significantly greater normalized values (>0.97) compared to the aluminum panels, which range from 0.40 to 0.45.
The mass efficiency indicator (C9) aligns with environmental criteria, demonstrating that CFRP alternatives outperform with normalized values between 0.73 and 0.76, while aluminum panels present lower values in the range of 0.52 to 0.57. The specific stiffness ratio (C10) indicates slight differences among material types, with CFRP panels exhibiting higher normalized values (0.35–0.38 range) in comparison to aluminum alternatives (0.25–0.26 range). Panel S5 (CFRP Thermoset) demonstrates the highest normalized value (0.3825) for specific stiffness among all options.
This analysis emphasizes the trade-offs in material selection, where CFRP materials’ superior environmental and performance characteristics must be weighed against their elevated material and energy costs. In contrast, although aluminum alternatives offer improved cost efficiency during production, they exhibit inferior environmental impact and end-of-life management performance.
A preliminary ranking inspection of the normalized values indicated that alternative S7 (CFRP Thermoplastic TC1100-PPS) achieved the most favorable overall position, ranking first in seven of ten criteria. S4 (CFRP Thermoset 8552/IM7) (HEXCEL Stamford, Connecticut, Stamford, CT, USA) and S8 (CFRP Thermoplastic TC1100-PPS) (TORAY, Tokyo, Japan) occupied the second and third positions, respectively. However, this initial rating is insufficient until the criteria are appropriately weighted, enhancing the assessment and yielding a thorough sustainability assessment.

4.2. Weighting Methods Analysis and Selection

To assess the alternatives regarding sustainability, appropriate weights must be assigned to the criteria to reflect their relative importance in the decision-making process. Five objective weighting methods were considered: SD, COV, Entropy, CRITIC, and MEREC. However, before applying any of these methods, testing them for reliability and stability within realistic data perturbations, e.g., 1–25%, is important. This additional verification allows us to select the most robust methods for the final sustainability analysis in the subsequent sections of this paper.
The selection process comprises three distinct steps to assess the weighting methods. First, a stability analysis is conducted through perturbation experiments to determine how each weighting method responds to small variations in the normalized decision matrix on each weighting method selected. Second, the weight distributions from all methods are analyzed to understand how they allocate relative significance to the different criteria. Finally, the methods are clustered according to their stability by employing hierarchical clustering based on the derived stability scores. This step provides additional statistical support for methods selection.

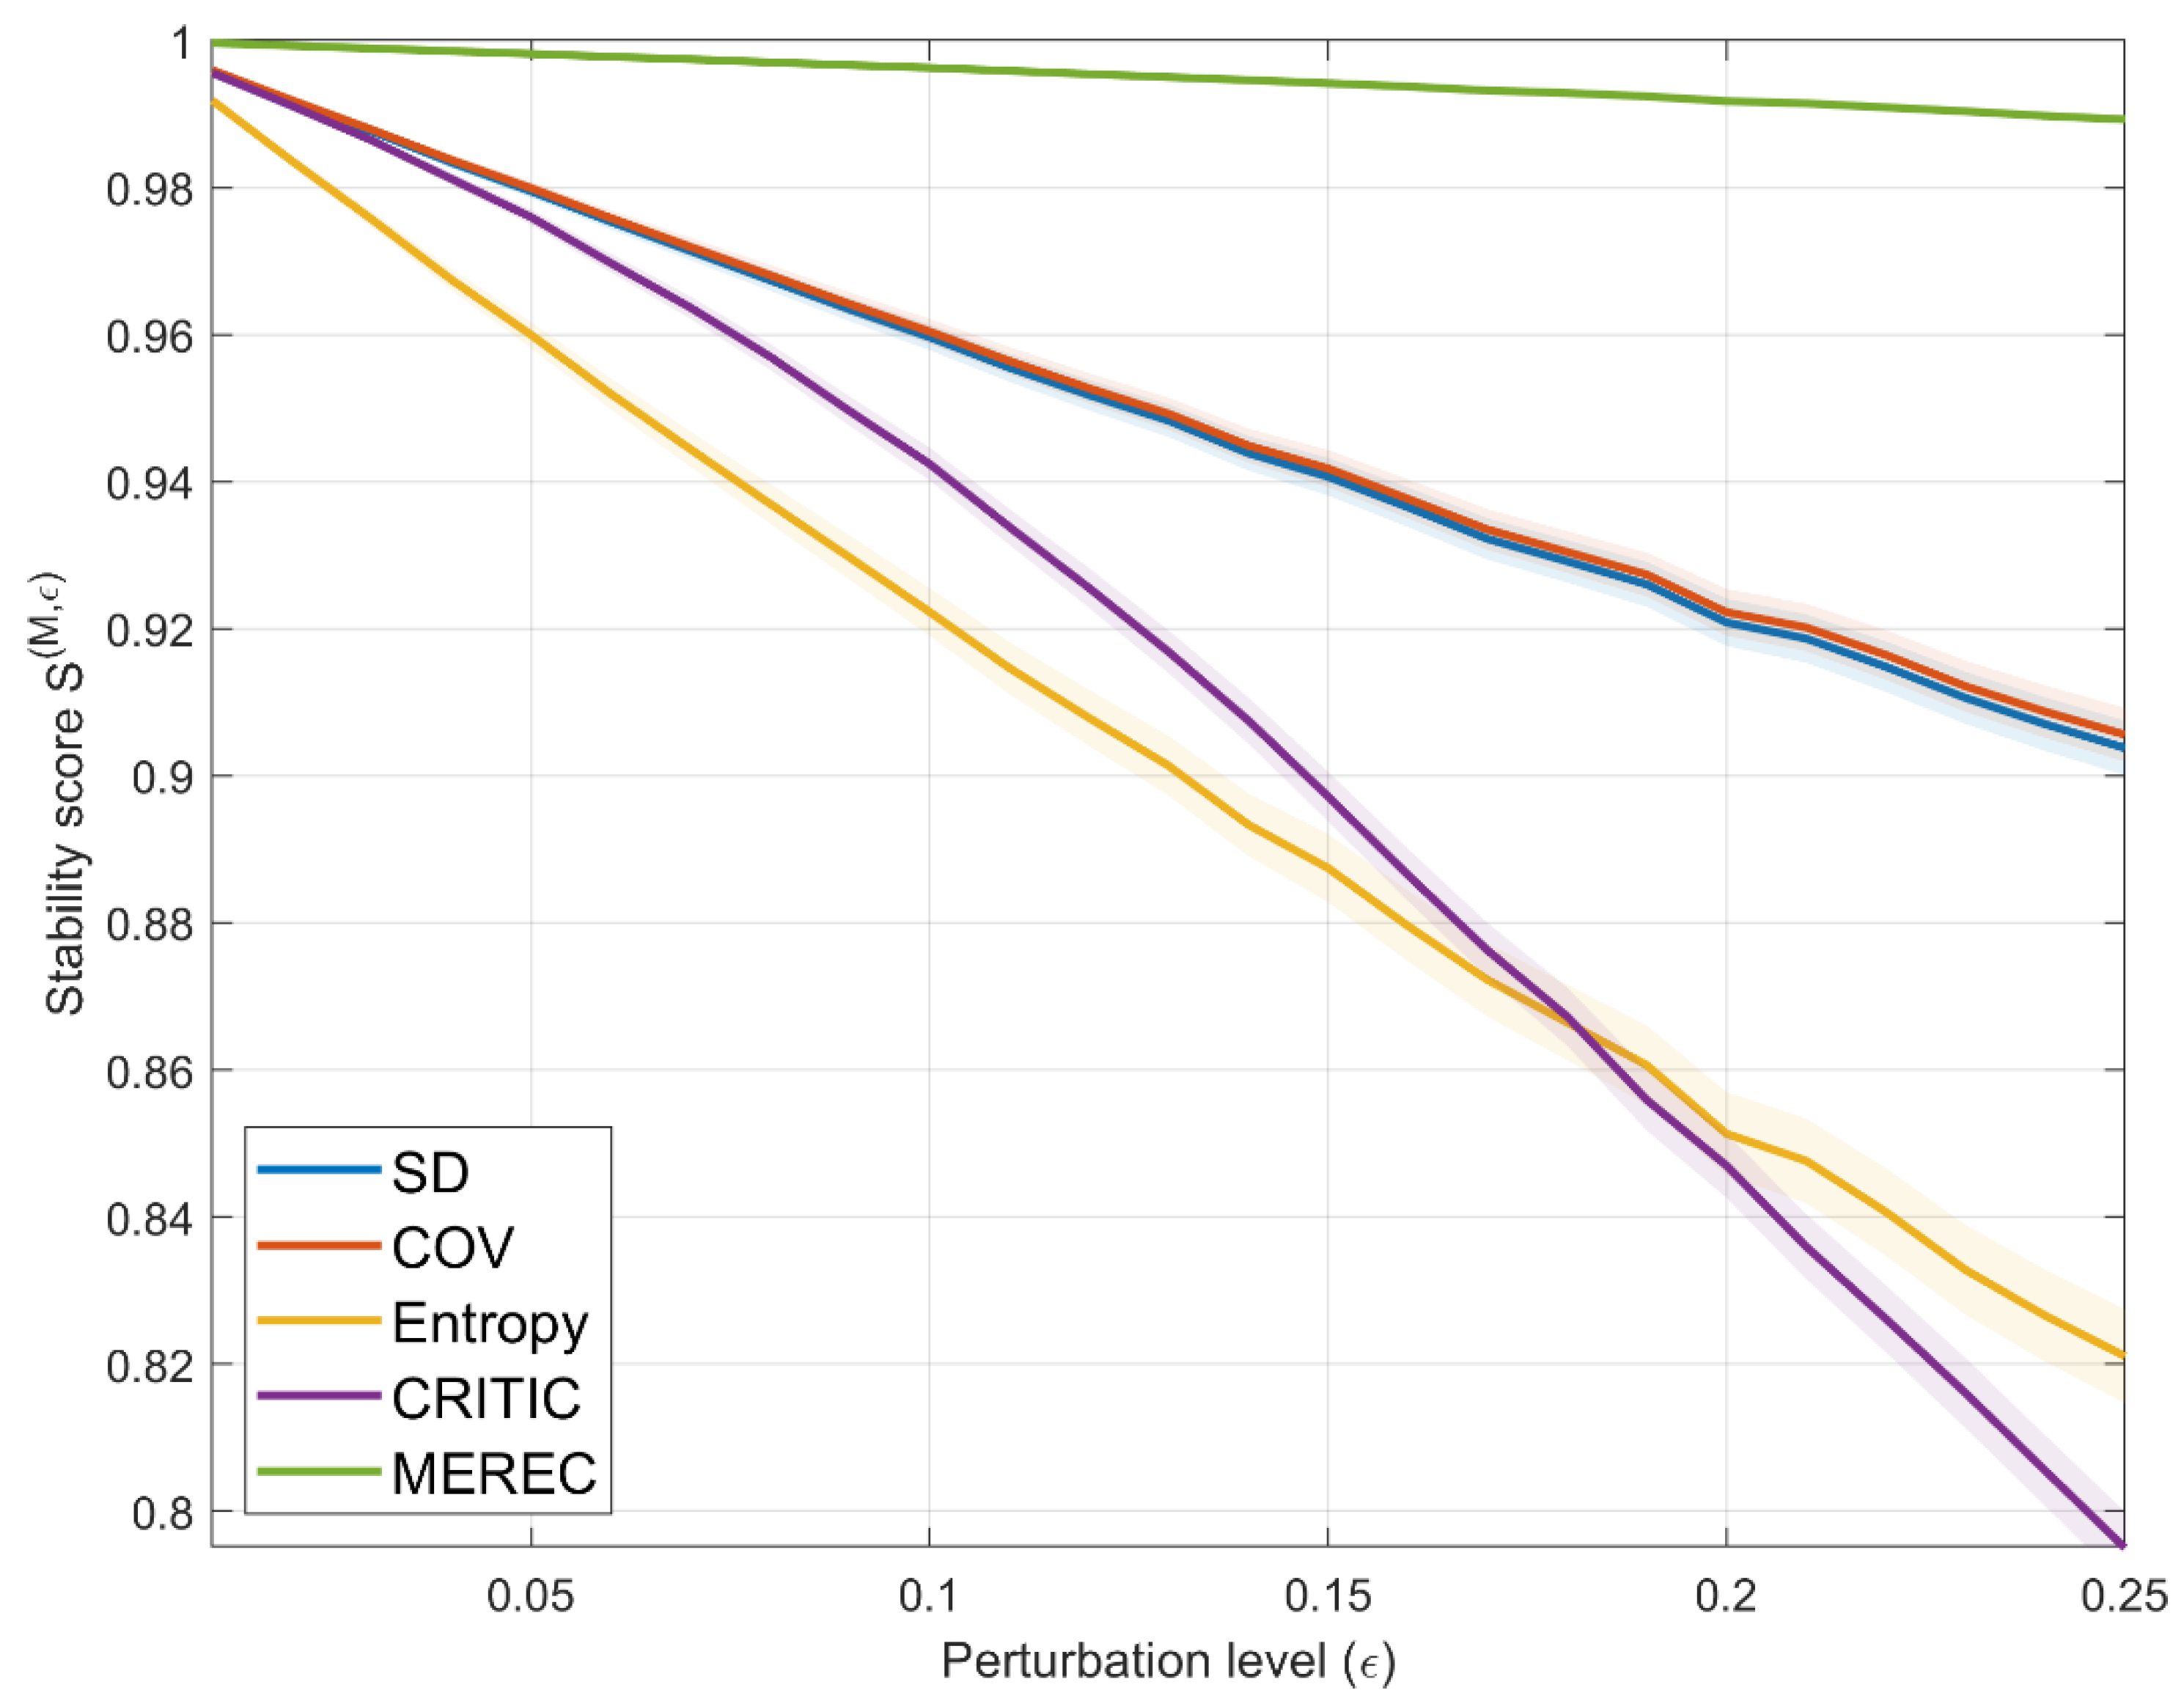
4.2.1. Stability Analysis

In this step, an extensive stability analysis was carried out to check the stability of the objective weighting methods and choose the most appropriate normalization strategy by examining three well-established normalization approaches in the literature, as presented in Table 6 (Section 3.3.1), where x i j denotes the original value, and n i j is the normalized value for the i -th alternative with respect to the j -th criterion.
Our analysis utilized perturbations within the range ε     [ 0.01 ,   0.25 ] with a step size of 0.01, resulting in 25 unique perturbation levels, and at each level, 1000 Monte Carlo iterations were conducted, yielding a total of 25,000 experiments to achieve statistical significance. For each objective method M at perturbation level ε , the stability score S M ,   ε was calculated as S M , ε = 1 / 1 + μ δ , where μ δ denotes the mean relative weight change across all criteria for the method M at perturbation level ε .
Table 9 provides the stability score statistics under vector normalization, which was identified as the most effective method among the three normalization strategies examined in our study. Figure 7 illustrates the stability scores of the five objective weighting methods utilizing vector normalization at different perturbation levels.
The comparative analysis from the results indicated that vector normalization attained the highest overall stability score (mean = 0.94076 , var = 7.1000 × 10 4 ), outperforming both linear scale transformation (mean = 0.91478 , var = 3.6200 × 10 3 ) and min-max normalization (mean = 0.93376, by excluding the undefined results for MEREC).
As we can observe from Figure 7, the superiority of vector normalization is especially clear in its consistent performance across different perturbation levels, with SD, COV, and MEREC ensuring stability scores above 0.90 at ε ≤ 0.20, and especially the MEREC exhibits remarkable resilience with scores consistently above 0.98 even at ε = 0.25 (0.98922). In contrast, under linear scale transformation, we noticed that only SD and COV maintain scores above 0.90 at ε = 0.20 (0.91882 and 0.93062, respectively), while MEREC decreases to 0.8188 and shows the worst performance among the examined methods. Under min–max normalization, although SD and COV show similar robustness, MEREC yields mathematically undefined results due to the incompatibility of its logarithmic transformation with the [0,1] bounded domain produced by min–max normalization.
Moreover, we conducted a comparative analysis between the original MEREC normalization and vector normalization to validate our methodology reasonably. While implementing MEREC following its linear scale normalized formulation, the linear approach produced extreme instability. Our findings indicated that the performance of the MEREC is considerably enhanced due to vector normalization, as shown through a mean stability score of 0.9948 against 0.9226, and the variance was reduced up to 145 times from 1.4447 × 10 3 to 9.9518 × 10 6 . The improvement in stability is further observed at a high level of perturbation (ε = 0.25), where the vector-normalized MEREC performs with a stability score of 0.98922 compared to the score of 0.86586 for the original formulation, demonstrating a 7.82% enhancement in mean stability in our case study. This improvement is clearly illustrated in Figure 7, where stability scores obtained during the application of the perturbation remain well above 0.98 across all perturbation levels for the vector-normalized formulation, while the original formulation exhibits a steady decrease in stability score. Therefore, applying MEREC with vector normalization significantly enhances its performance, representing the most effective method in our case study.
The mathematical properties of vector normalization facilitate keeping relative relationships and handling changes in scales, thereby supporting its use as the preferred normalization strategy for subsequent analyses. Within this framework, three methods were identified as particularly robust: MEREC, COV, and SD, all demonstrating stability scores exceeding 0.90 even at 25%. In particular, MEREC was the most stable (0.98922), followed by COV (0.90586) and SD (0.90404), in that order. Both entropy and CRITIC experienced significant reductions in stability, with values of 0.82134 and 0.79564, respectively. Our analysis indicates that these three methods, combined with vector normalization, are the most suitable and least sensitive to perturbations, up to 25% of the original values.

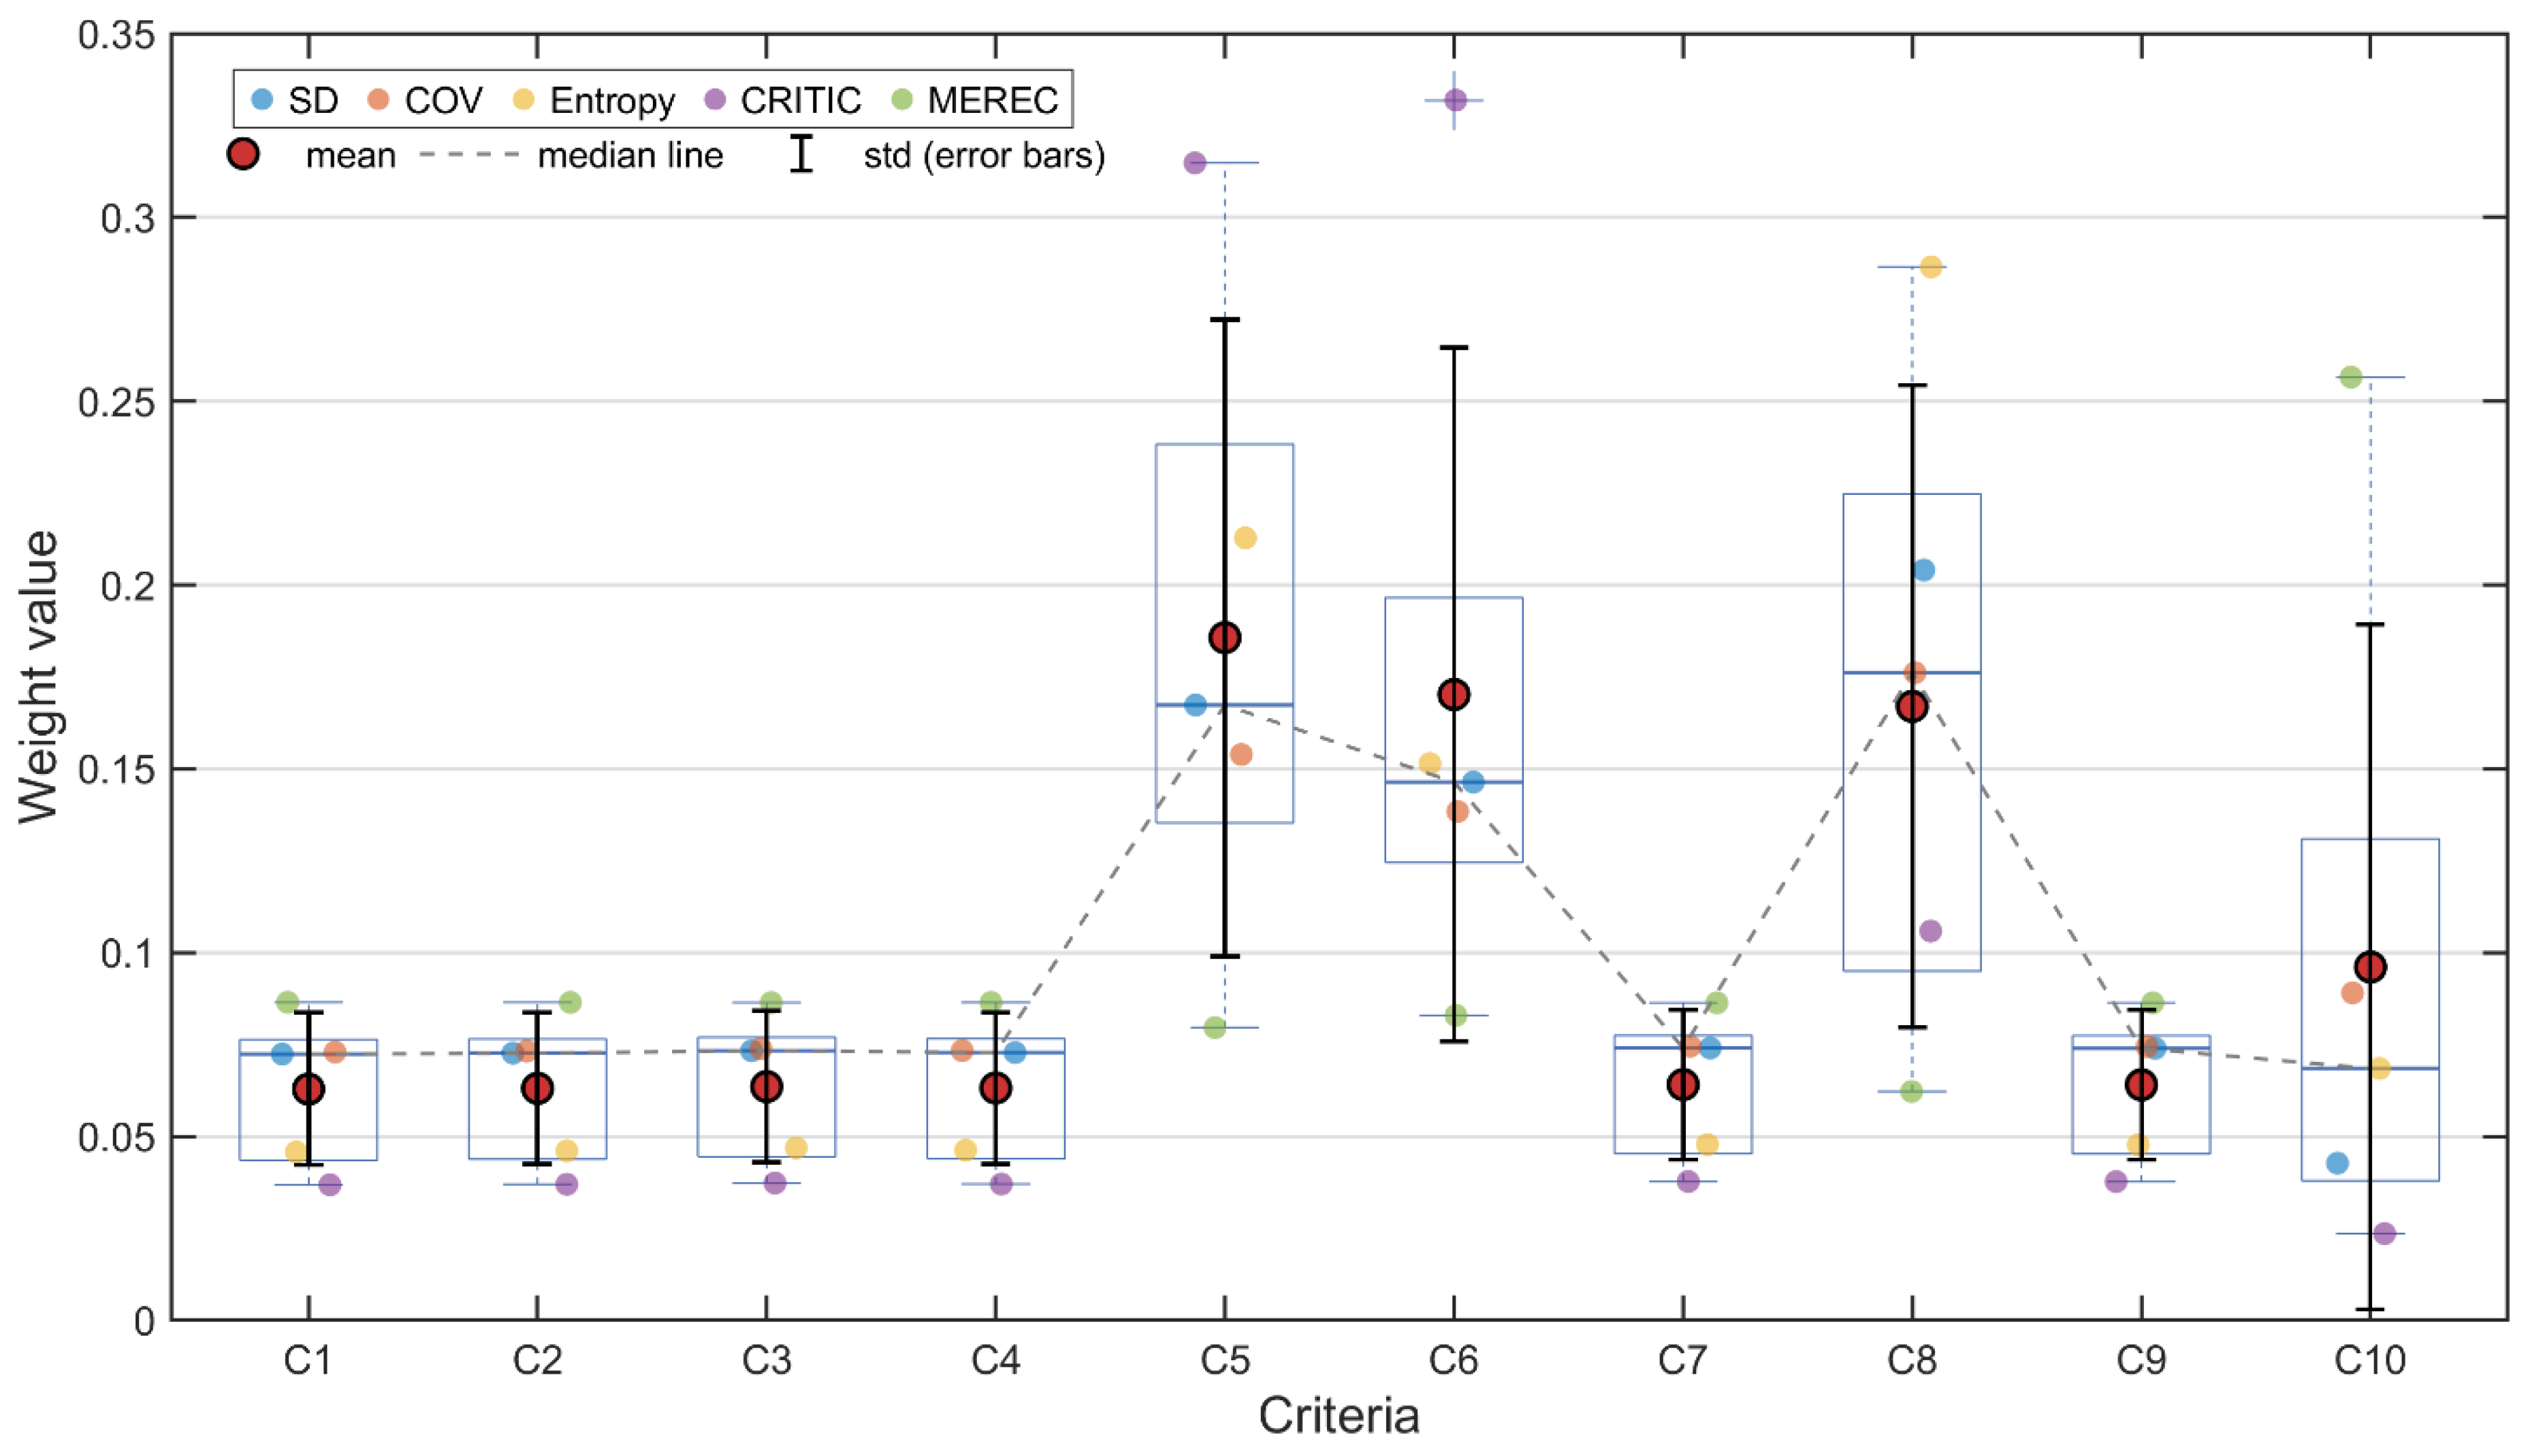
4.2.2. Weight Distribution Analysis

All five objective weighting methods were employed to determine the criteria weights, as presented in Table 10, after verifying vector-based normalization as the most robust approach. At the same time, Figure 8 illustrates the weight distributions through boxplots, highlighting various statistics, including mean values indicated by red dots, median lines represented as dashed lines, and standard deviation bars, in addition to colored markers representing individual method weights for each criterion.
The results were compared, identifying three types of dependencies in grouping the criteria sets. All methods indicated agreement on the role of the environmental criteria (C1–C4), with average weights of approximately 0.07 and minimal standard deviations. This consistency is more noticeable, as shown by the compact boxplots and closely spaced scatter plot markers for these criteria in Figure 8, indicating agreement among the methods concerning the significance of environmental criteria in the sustainability evaluation process.
Cost-related criteria (C5–C8), however, were the ones that showed the greatest dispersion, as demonstrated by the notably larger boxplots and the wider standard deviation bars in Figure 8. The CRITIC method demonstrated significant differentiation, assigning notably high weights to material cost (C5 = 0.3148) and energy cost (C6 = 0.3319), which was identified as an outlier in Figure 8, resulting in a max/min ratio of 14.057. The entropy method also placed cost criteria second to end-of-life cost (C8 = 0.2865), resulting in a max/min ratio of 6.2586. The COV method maintained a slight advantage in the cost distributions, resulting in the lowest max/min ratio (2.4138) among all methods, indicative of an overall better balance while still allowing discrimination.
The performance criteria C9 and C10 showed the most interesting contrast. Like environmental criteria, the mass (C9) exhibited remarkable uniformity, whereas the specific stiffness (C10) demonstrated considerable variability. This divergence is mainly due to MEREC’s significant emphasis on C10 (0.2566) compared to CRITIC’s minimal emphasis (0.0236). The SD method exhibited a marginal overall differentiation (max/min ratio = 4.7736); within these weights, the overall median values across the entire criteria categories maintained relative consistency.
Therefore, we observe a significant variation in criteria weights across the five objective methods presented in Table 10, as max/min ratios (ranging from 2.4138 to 14.057), emphasizing the need to use various weighting methods to ensure robust decision making. The MEREC method achieves a relative balance of the environmental criteria while maintaining meaningful differentiation in performance criteria, especially for specific stiffness (C10). The SD and COV methods behaved similarly in weight distribution; however, the CRITIC and Entropy methods exhibited more extreme weight assignment, particularly in cost-related criteria, potentially introducing bias in the final sustainability assessment.
The weight distribution studies provide additional insights that are significant with respect to the stability analysis. More balanced weighting methods (SD, COV, MEREC) demonstrated better stability characteristics, while methods demonstrating extreme weightings (CRITIC and entropy) were less stable. This relationship between the balance of weights and the stability of the methods strongly suggests that these issues are related, and this needs to be further examined using hierarchical clustering analysis to confirm the choice of method. The following subsection describes the findings of a hierarchical clustering study used to evaluate these observations and identify the weight methods that work best together.

4.2.3. Hierarchical Clustering Analysis

We applied hierarchical cluster analysis based on Ward’s minimum variance method to confirm and classify the weighting methods according to their statistical characteristics [53]. The hierarchical clustering dendrogram of the weighting methods based on mean stability scores and their variances across all perturbation levels is illustrated in Figure 9. Our implementation included the main features based on the stability analysis results presented in Section 4.2.1, the mean value of the stability score, and their variances for all perturbation levels. The number of clusters was established through a cluster dendrogram structure and confirmed by silhouette scores, which depict the extent to which an object belongs to its cluster concerning the other clusters [54].
The dendrogram in Figure 9 reveals distinct method groupings relative to stability performance. Interestingly, the SD and COV methods were closely grouped at a small Euclidean distance of less than 0.5, suggesting nearly identical stability measures since both methods approach a mean stability of 0.9491 with a very low range of 1 × 10 6 . The MEREC method, although located in a distinct cluster, has achieved a better stability measure (mean = 0.9948, variance = 1 × 10 5 ) and joined the group of SD-COV at a considerable distance (approximately 1.5). On the contrary, entropy and CRITIC methods exhibited considerable dispersion and were closer to each other but at a greater distance (>3.0), with much lower stability scores of 0.9026 and 0.9083, respectively, and higher variances, indicating increased sensitivity to perturbations in the decision matrix.
The hierarchical clustering results strongly support the further selection of MEREC, SD, and COV for weight aggregation. This cluster analysis reveals that these three methods have distinctive but complementary features; MEREC has the highest average stability (mean = 0.9948) among its nearest clusters, whereas SD and COV have minimal variance (1 × 10 6 ), making them extremely stable. Their distinct separation from the relatively less stable methods of Entropy and CRITIC in the dendrogram and their moderate weight proportions 4.7736, 2.4138, and 4.1207 for SD, MEREC, and COV, respectively, show that these methods will be reliable for sustainability assessment. Their high stability and the fact that they have complementary weight patterns make them appropriate for their selection for the rank analysis that follows.

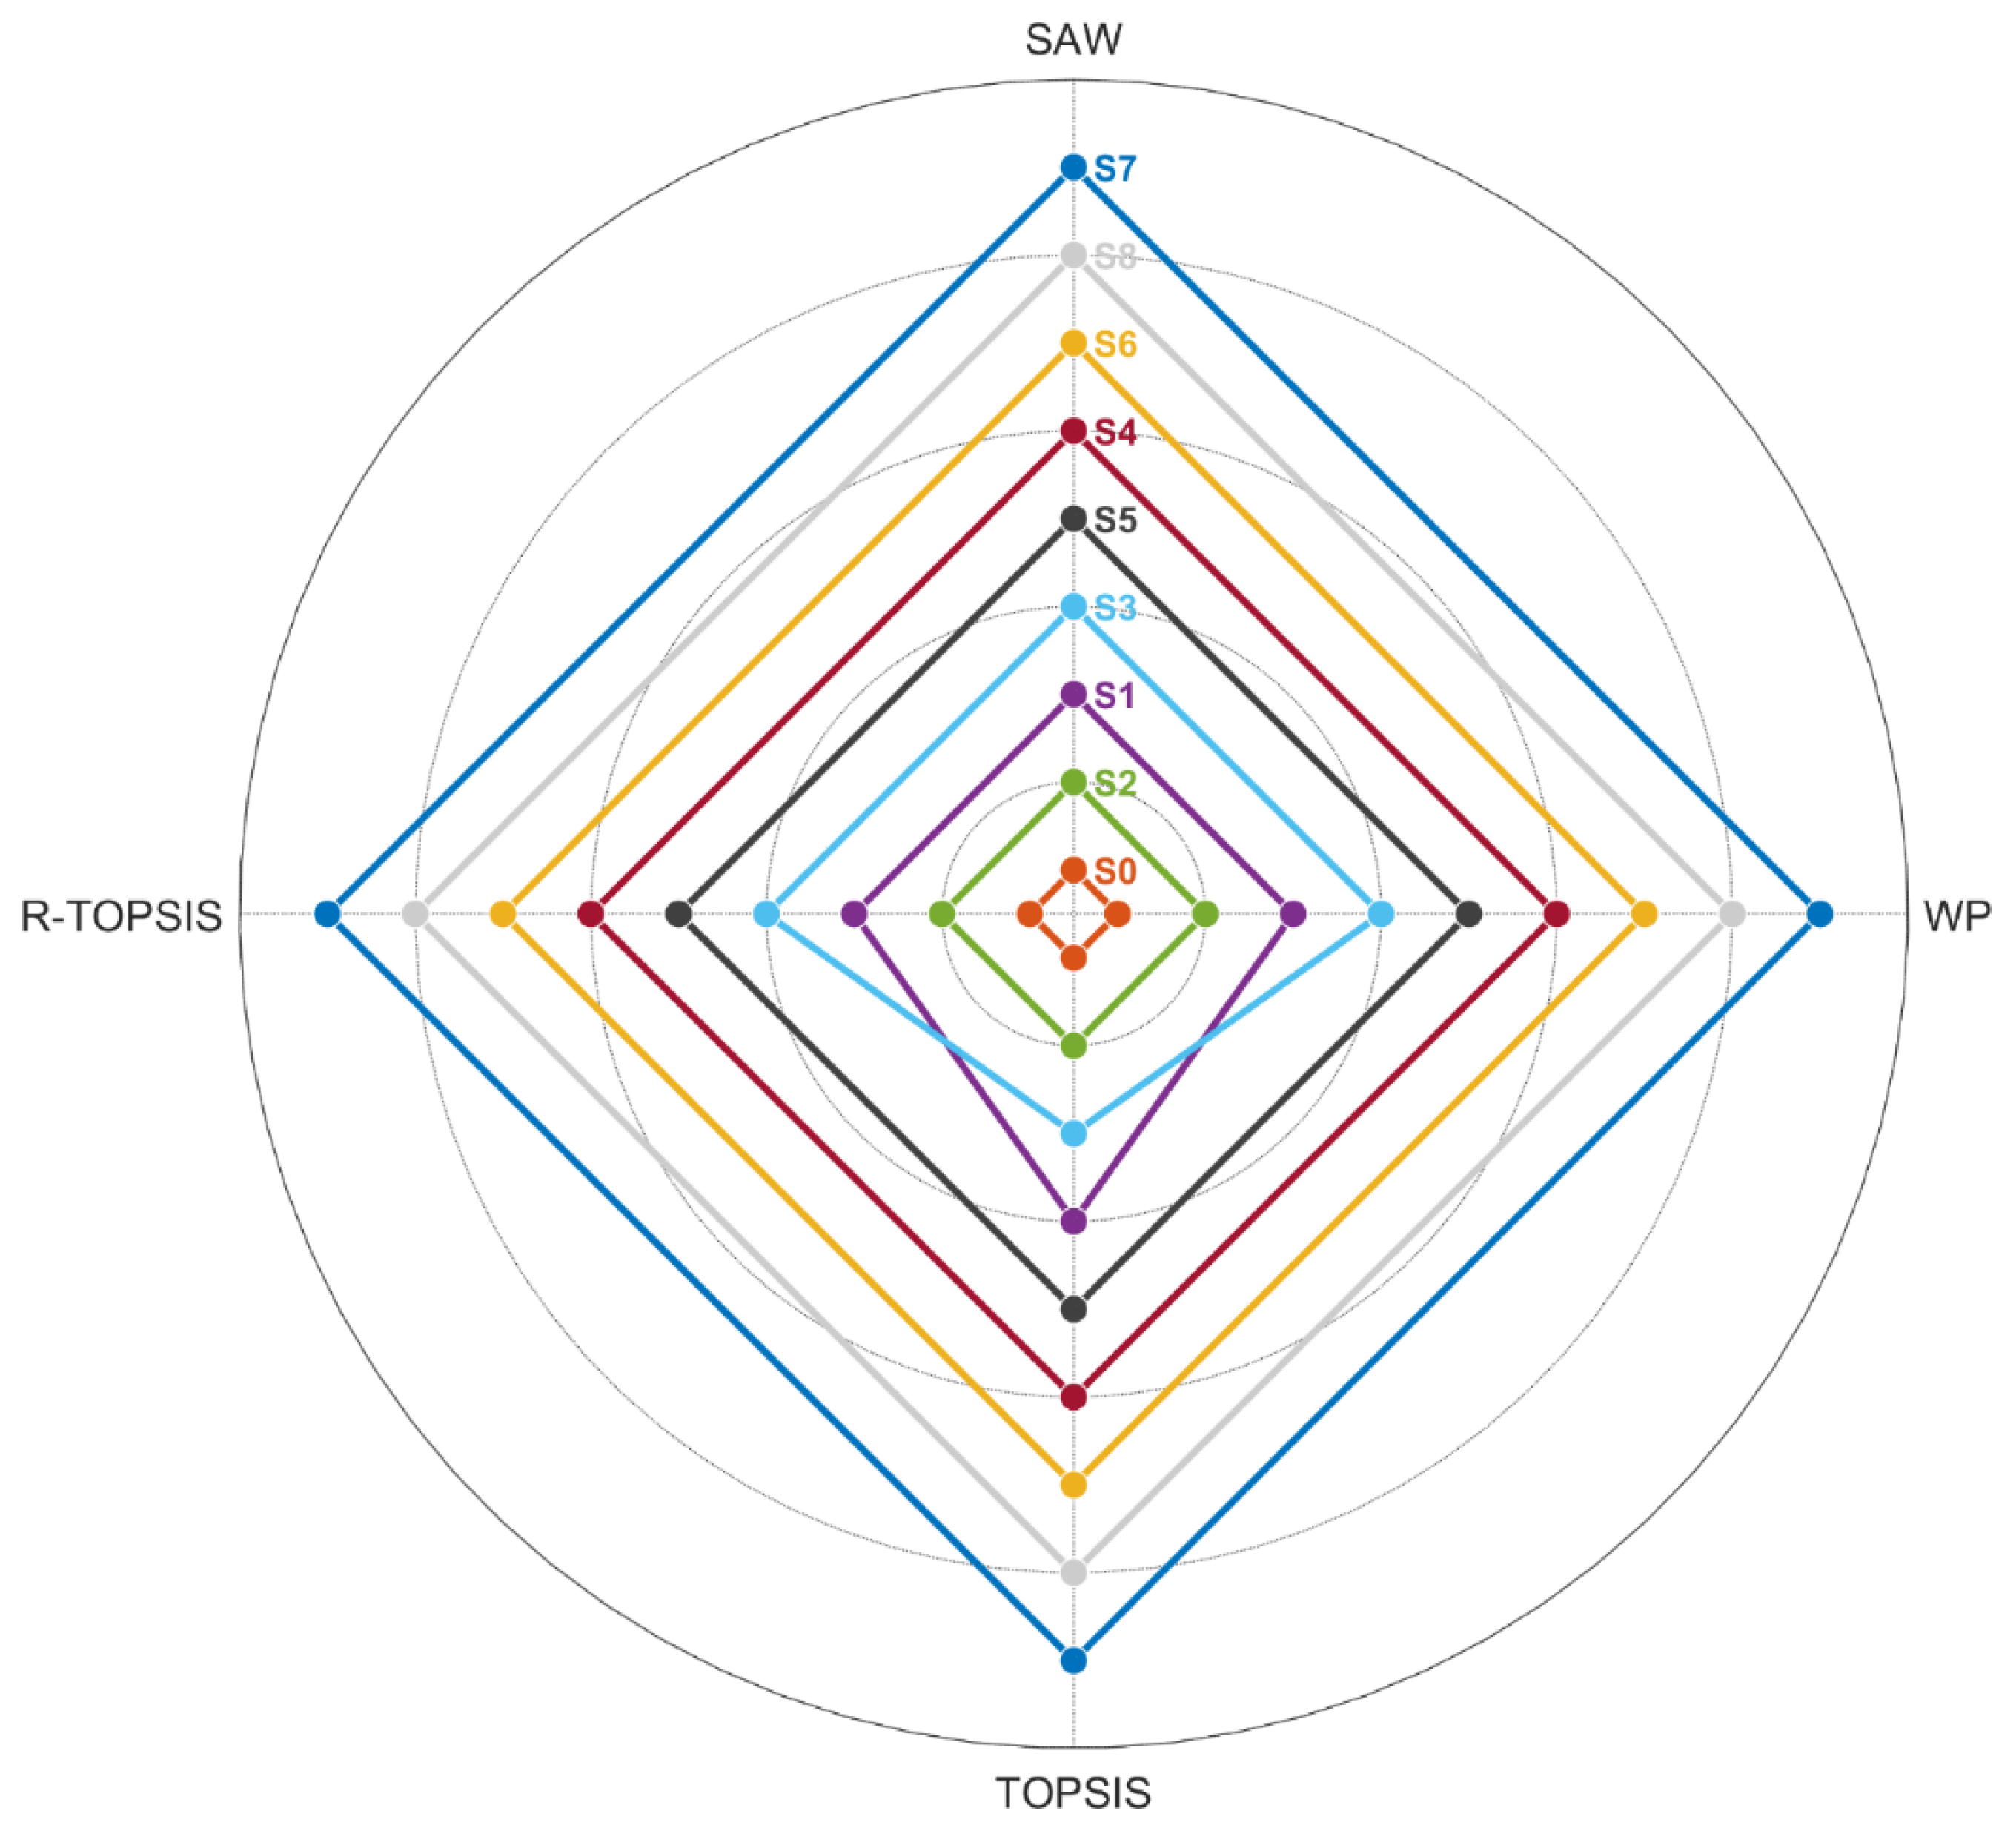
4.3. Rank Analysis Using Aggregated Weights

After conducting validation based on hierarchical clustering, the three most stable weighting methods (SD, COV, and MEREC) were selected for the aggregation of weights using the geometric mean (GM) [55] as it preserves ratio scale properties and at the same time minimizing the influence of outlier values. The weight distributions across the three selected methods and their geometric mean values are presented in Table 11.
The aggregated weights show an improved balance across criteria with the max/min 1.6979, significantly lower than that noted in individual methods (SD: 4.7736, COV: 2.4138, MEREC: 4.1207). This reduced dispersion shows that extreme weightings were moderate while allowing effective differentiation among criteria, specifically environmental criteria (C1–C4: 0.082), cost (C5–C8: 0.126–0.139), and performance (C9–C10: 0.083–0.105) were distinctly assessed.
In order to further elaborate on the weight distribution, categorical analysis was performed (Table 12 and Figure 10). The results reveal that SD and COV are more focused on cost criteria, assigning 59.19% and 54.30%, respectively, but in the case of MEREC, categorization is not as extreme with environmental, cost, and performance, having percentages of 34.59%, 31.12%, and 34.29%, respectively. The geometric mean effectively moderates these extremes, yielding a distribution of 32.85% for environmental, 48.32% for cost, and 18.83% for performance criteria. This moderation is reflected in the max/min ratio 2.57, which falls between the highly skewed SD ratio of 5.07 and the extremely balanced MEREC ratio of 1.11.
To verify the ranking results thoroughly, these aggregated weights were implemented through four MCDM methods: SAW, WP, TOPSIS, and R-TOPSIS. The ranking results based on the obtained scores are displayed in Table 13, and there is a high degree of agreement among all the employed methodologies. Panel S7 (CFRP Thermoplastic) was the top alternative across all the methods and achieved the maximum scores (SAW: 0.74463, WP: 1, TOPSIS: 0.69506, R-TOPSIS: 0.73806). S8 and S6 (also thermoplastic CFRP) were second and third in the ranking without deviation, while the reference aluminum panel (S0) was always last. The polar plot in Figure 11 assists in presenting the ranking patterns that were reported in Table 13 across all methods.
The remarkable consistency across different MCDM methodologies, supported by clear visual patterns in Figure 11, validates the ranking results. The analysis conclusively identifies thermoplastic CFRP panels, particularly alternative S7, as the optimal choice when considering the complete spectrum of environmental, economic, and performance criteria.
The comprehensive validation using multiple MCDM methods, together with the consistency of results, strongly demonstrates that the methodology and the resulting rankings are reliable. The balanced weight distribution achieved through geometric mean aggregation has contributed to stable and meaningful rankings across all methodologies.

5. Conclusions

In this paper, we introduced a robust sustainability assessment methodology tailored for evaluating aircraft components. The methodology was applied to a fuselage panel made from either aluminum or CFRP (carbon fiber-reinforced polymer). The comprehensive analysis of the results revealed several key findings:
  • The application of specific software packages, e.g., SimaPro along with the Ecoinvent 3 database, supported LCA and LCC analyses as well as ANSYS to evaluate the structural behavior of the component, which allows assessing all the sustainability criteria of the component throughout its lifecycle on environmental, economic, and technical perspectives. Such systematic methods, with the use of established industry standards, enhance the validity of the data and the results obtained, which is very important in enhancing the validity of sustainability assessment in aviation.
  • Utilizing numerous MCDM methods and objective weighting methods, we were able to show the following:
    • The GM of the weights of the three most stable methods, that is, SD, COV, and MEREC, results in a more balanced set of weights with a max/min ratio of 1.6979, which prevents the assessment from being driven by any one aspect of sustainability. Moreover, the categorical analysis of weight distributions shows that traditional methods (SD and COV) tend to prioritize the cost category of the criteria set (54–59%), but on the other hand, the MEREC suggests a more balanced distribution across environmental (34.59%), cost (31.12%), and performance (34.29%) categories. The GM somehow reduces these extremes and provides a more reasonable approach to making design decisions from the sustainability perspective.
    • The methodology shows notable robustness through consistent ranking results obtained by applying four different MCDM methods (SAW, WP, TOPSIS, and R-TOPSIS). This consistency validates not only the aggregation of weights but also confirms the reliability of the overall assessment framework. Remarkably, thermoplastic CFRP panel configuration S7 was the best option in all the methods applied, followed by the S8 panel configuration and S6, while the reference aluminum panel S0 always ranked last.
The methodology developed in this study is fully parametric, making it applicable to any structural component. The case of the A319, with a 30-year lifetime and kerosene as the fuel—of which the component under study is a part—is also adjustable. Any such changes would be reflected in the input data for the LCA and LCC steps, while the overall methodology remains unchanged. The approach can also seamlessly integrate with optimization modules to support sustainability-driven, eco-design strategies for aircraft components.

Author Contributions

Conceptualization, K.T., D.S. and A.A.; methodology, K.T., D.S. and A.A.; software, D.S. and A.A.; formal analysis, K.T., D.S. and A.A.; investigation, K.T., D.S. and A.A.; resources, K.T., D.S. and A.A.; data curation, K.T., D.S. and A.A.; writing—original draft preparation, K.T., D.S. and A.A.; writing—review and editing, K.T. and D.S.; visualization, K.T., D.S. and A.A.; supervision, K.T.; project administration, K.T.; funding acquisition, K.T. All authors have read and agreed to the published version of the manuscript.

Funding

The work described in this paper has been financially supported by the Clean Aviation project FASTER-H2 (Project: 101101978). The views and opinions expressed in the paper are those of the author(s) only and do not necessarily reflect those of the European Union or Clean Aviation Joint Undertaking.

Institutional Review Board Statement

Not applicable.

Informed Consent Statement

Not applicable.

Data Availability Statement

The authors declare that the data supporting the findings of this study are available within the paper.

Conflicts of Interest

The authors declare no conflicts of interest.

Abbreviations

The following abbreviations are used in this manuscript:
MCDMMulti-Criteria Decision-Making
CFRPCarbon Fiber-Reinforced Polymer
LCALifecycle Analysis
LCCLifecycle Costing
R-TOPSISRobust Technique for Order of Preference by Similarity to Ideal Solution
EUEuropean Union
3DThree Dimensional
MROMaintenance Repair and Operations
SMRShort-to-Medium Range
Al2024Aluminum 2024
Al7075Aluminum 7075
TSThermosetting
TPThermoplastic
NGONon-Governmental Organizations
AHMAnalytical Hierarchy Method
WSMWeighted Sum Model
LWLaser Welding
ECMElectro Chemical Machining
ISOInternational Organization for Standardization
CFCarbon Fiber
PANPolyacrylonitrile
DALYsDisability Adjusted Life Years
IPCCIntergovernmental Panel on Climate Change
GWPGlobal Warming Potential
HHierarchist
CO2Carbon Dioxide
EoLEnd of Life
FEMFinite Element Model
USDUnited States Dollar
SDStandard Deviation
COVCoefficient of Variance
CRITICCriteria Importance Through Inter-Criteria Correlation
MERECMethod Based on the Removal Effects of Criteria
SAWSimple Additive Weighting
WPWeighted Product
TOPSIS Technique for Order Preference by Similarity to Ideal
PISPositive Ideal Solution
NISNegative Ideal Solution
MaxMaximum
MinMinimum
GMGeometric Mean

Appendix A

Appendix A.1. Materials

Table A1. Composition of Al2024 (density: 2780 kg/m3).
MaterialContent
Aluminum92.81%
Chromium0.05%
Iron0.25%
Magnesium0.5%
Manganese0.6%
Silicon0.25%
Titanium0.07%
Zinc0.125%
Copper4.36%
Table A2. Composition of Al7075 (density: 2810 kg/m3).
MaterialContent
Aluminum88%
Chromium0.2%
Iron0.3%
Magnesium2.5%
Manganese0.1%
Silicon0.35%
Titanium0.15%
Zinc6%
Copper1.5%
Table A3. Composition of CFRP thermoset material (density: 1570 kg/m3, fiber content: 57.7% wt.).
MaterialContent
Epoxy resin and Boron trifluoride hardener for 1 kg CFRP0.423 kg
Epoxy resin for 1 kg resin0.66 kg
Boron trifluoride for 1 kg resin0.33 kg
PAN carbon fibers for 1 kg thermoset CFRP0.577 kg
Acrylonitrile (production of 1 kg PAN carbon fibers)2.25 kg
Dimethylacetamide (production of 1 kg PAN carbon fibers)0.031 kg
Polyurethane (production of 1 kg PAN carbon fibers)0.02 kg
Embodied energy (prepreg)40 MJ
Electricity (production of 1 kg PAN carbon fibers)58 kWh
Heat (production of 1 kg PAN carbon fibers)257.3 MJ
Table A4. Composition of TP (fiber content: 57% wt.).
MaterialContent
Thermoplastic resin (Polyphenylene sulfidepowder)0.43 kg
Plastic micronizer machine (milling the resin pellets)/consumption for 1 kg of pellets0.2 kWh
PAN carbon fibers for 1 kg thermoplastic CFRP0.57 kg
Composite density1550 kg/m3
Table A5. Bonding materials.
Bisphenol A epoxy-based vinyl ester resin0.66 kg
Ethylenediamine0.33 kg

Appendix A.2. Processes

Table A6. Energy of metal forming process.
SubprocessEnergy (kWh/kg)
Stretch forming3.95
Incremental sheet forming12.91
Hydroforming4
Hot rolling mills0.07
Table A7. Friction stir welding energy.
ProcessEnergy (kwh/800 mm)
Friction stir welding0.07056
Table A8. Autoclave process energy.
ProcessEnergy
Vacuum generation10.2 MJ
Autoclave curing294.3 kWh

Appendix A.3. Cost

Table A9. Material costs.
MaterialCost (EUR/kg)
Al20245
Al70757
Boron Trifluoride341.66
Epoxy resin9.15
PAN carbon fibers30
Permabond adhesive693.5
Polyphenylene sulfide20
Polyurethane sizing3.58
Table A10. Electricity cost.
EnergyCost (EUR/kWh)
Electricity Europe0.2847

Appendix A.4. Use-Phase of the Panel

Table A11. Fuel consumption (Airbus A319).
Total distance in A319 lifetime20,188,120.8 km
Kerosene consumption per kg of transportation6729.374 kg kerosene/kg transportation
Kerosene cost0.658 EUR/kg

Appendix A.5. End-of-Life of the Panel

Table A12. Waste scenarios.
Aluminum panel85% recycling and 15% landfill
CFRP panel100% landfill
Table A13. End-of-life cost.
Landfill cost0.06 EUR/kg
Recycling cost1.04 EUR/kg

References

  1. Vogiantzi, C.; Tserpes, K. On the Definition, Assessment, and Enhancement of Circular Economy across Various Industrial Sectors: A Literature Review and Recent Findings. Sustainability 2023, 15, 16532. [Google Scholar] [CrossRef]
  2. Drohomeretski, E.; Da Costa, S.E.G.; De Lima, E.P.; De Oliveira Neves, T.R. The Application of Sustainable Practices and Performance Measures in the Automotive Industry: A Systematic Literature Review. Eng. Manag. J. 2015, 27, 32–44. [Google Scholar] [CrossRef]
  3. Ramadugu, S.; Ledella, S.R.K.; Gaduturi, J.N.J.; Pinninti, R.R.; Sriram, V.; Saxena, K.K. Environmental Life Cycle Assessment of an Automobile Component Fabricated by Additive and Conventional Manufacturing. Int. J. Interact. Des. Manuf. IJIDeM 2024, 18, 847–858. [Google Scholar] [CrossRef]
  4. Pinheiro Melo, S.; Barke, A.; Cerdas, F.; Thies, C.; Mennenga, M.; Spengler, T.S.; Herrmann, C. Sustainability Assessment and Engineering of Emerging Aircraft Technologies—Challenges, Methods and Tools. Sustainability 2020, 12, 5663. [Google Scholar] [CrossRef]
  5. Swastanto, G.A.; Johnson, M.E. Exploratory Study of Sustainability Practices in Worldwide Major Aircraft Maintenance, Repair, and Overhaul Companies. Transp. Res. Rec. J. Transp. Res. Board 2024, 2678, 1060–1078. [Google Scholar] [CrossRef]
  6. Filippatos, A.; Markatos, D.; Tzortzinis, G.; Abhyankar, K.; Malefaki, S.; Gude, M.; Pantelakis, S. Sustainability-Driven Design of Aircraft Composite Components. Aerospace 2024, 11, 86. [Google Scholar] [CrossRef]
  7. Katsiropoulos, C.V.; Pantelakis, S.G. A Novel Holistic Index for the Optimization of Composite Components and Manufacturing Processes with Regard to Quality, Life Cycle Costs and Environmental Performance. Aerospace 2020, 7, 157. [Google Scholar] [CrossRef]
  8. Balli, O.; Caliskan, N.; Caliskan, H. Aviation, Energy, Exergy, Sustainability, Exergoenvironmental and Thermoeconomic Analyses of a Turbojet Engine Fueled with Jet Fuel and Biofuel Used on a Pilot Trainer Aircraft. Energy 2023, 263, 126022. [Google Scholar] [CrossRef]
  9. Akdeniz, H.Y.; Balli, O.; Caliskan, H. Energy, Exergy, Thermoecologic, Environmental, Enviroeconomic and Sustainability Analyses and Assessments of the Aircraft Engine Fueled with Biofuel and Jet Fuel. J. Therm. Anal. Calorim. 2023, 148, 3585–3603. [Google Scholar] [CrossRef]
  10. Akdeniz, H.Y. Systematic Benchmarking of Performance, Environmental and Sustainability Impacts of Utilization of Alternative Cleaner Fuel in an Aircraft Gas Turbine Engine. Environ. Sci. Pollut. Res. 2022, 29, 51012–51029. [Google Scholar] [CrossRef]
  11. Markowska, K.; Sękala, A.; Stecuła, K.; Kawka, T.; Sirovitskiy, K.; Pankova, O.; Vnukova, N.; Shulyak, M.; Kharchenko, S.; Shchur, T.; et al. Comparison of the Sustainability and Economic Efficiency of an Electric Car and an Aircraft—A Case Study. Sustainability 2023, 15, 1238. [Google Scholar] [CrossRef]
  12. Barbosa, C.; Malarranha, C.; Azevedo, A.; Carvalho, A.; Barbosa-Póvoa, A. A Hybrid Simulation Approach Applied in Sustainability Performance Assessment in Make-to-Order Supply Chains: The Case of a Commercial Aircraft Manufacturer. J. Simul. 2023, 17, 32–57. [Google Scholar] [CrossRef]
  13. Karpuk, S.; Radespiel, R.; Elham, A. Assessment of Future Airframe and Propulsion Technologies on Sustainability of Next-Generation Mid-Range Aircraft. Aerospace 2022, 9, 279. [Google Scholar] [CrossRef]
  14. Aygun, H. Exergo-Sustainability Behavior of High by-Pass Turbofan Engine of a Passenger Aircraft during Main Flight Phases. Energy Sources Part Recovery Util. Environ. Eff. 2021, 46, 1127–1144. [Google Scholar] [CrossRef]
  15. Fera, M.; Abbate, R.; Caterino, M.; Manco, P.; Macchiaroli, R.; Rinaldi, M. Economic and Environmental Sustainability for Aircrafts Service Life. Sustainability 2020, 12, 10120. [Google Scholar] [CrossRef]
  16. Cardeal, G.; Höse, K.; Ribeiro, I.; Götze, U. Sustainable Business Models–Canvas for Sustainability, Evaluation Method, and Their Application to Additive Manufacturing in Aircraft Maintenance. Sustainability 2020, 12, 9130. [Google Scholar] [CrossRef]
  17. Lin, C.-W.; Chen, T. 3D Printing Technologies for Enhancing the Sustainability of an Aircraft Manufacturing or MRO Company—A Multi-Expert Partial Consensus-FAHP Analysis. Int. J. Adv. Manuf. Technol. 2019, 105, 4171–4180. [Google Scholar] [CrossRef]
  18. Baklacioglu, T.; Turan, O.; Aydin, H. Metaheuristic Approach for an Artificial Neural Network: Exergetic Sustainability and Environmental Effect of a Business Aircraft. Transp. Res. Part Transp. Environ. 2018, 63, 445–465. [Google Scholar] [CrossRef]
  19. Raj, A.; Srivastava, S.K. Sustainability Performance Assessment of an Aircraft Manufacturing Firm. Benchmarking Int. J. 2018, 25, 1500–1527. [Google Scholar] [CrossRef]
  20. Balli, O. Exergy Modeling for Evaluating Sustainability Level of a High By-Pass Turbofan Engine Used on Commercial Aircrafts. Appl. Therm. Eng. 2017, 123, 138–155. [Google Scholar] [CrossRef]
  21. Somerville, A.; Marino, M.; Baxter, G.; Wild, G. Understanding Box Wing Aircraft: Essential Technology to Improve Sustainability in the Aviation Industry. Aviation 2016, 20, 129–136. [Google Scholar] [CrossRef]
  22. Sabaghi, M.; Cai, Y.; Mascle, C.; Baptiste, P. Sustainability Assessment of Dismantling Strategies for End-of-Life Aircraft Recycling. Resour. Conserv. Recycl. 2015, 102, 163–169. [Google Scholar] [CrossRef]
  23. Aydın, H.; Turan, Ö.; Karakoç, T.H.; Midilli, A. Exergo-Sustainability Indicators of a Turboprop Aircraft for the Phases of a Flight. Energy 2013, 58, 550–560. [Google Scholar] [CrossRef]
  24. Barke, A.; Thies, C.; Melo, S.P.; Cerdas, F.; Herrmann, C.; Spengler, T.S. Socio-Economic Life Cycle Assessment of Future Aircraft Systems. Procedia CIRP 2020, 90, 262–267. [Google Scholar] [CrossRef]
  25. Munk, D.J.; Miller, J.D. Topology Optimization of Aircraft Components for Increased Sustainability. AIAA J. 2022, 60, 445–460. [Google Scholar] [CrossRef]
  26. Anagnostopoulou, A.; Sotiropoulos, D.; Floros, G.; Tserpes, K. Towards the Development of an Eco-Design Approach for Aircraft Components. Eng. Proc. 2025, 90, 81. [Google Scholar] [CrossRef]
  27. Passos Neto, G.D.M.; Alencar, L.H.; Valdes-Vasquez, R. Multiple-Criteria Methods for Assessing Social Sustainability in the Built Environment: A Systematic Review. Sustainability 2023, 15, 16231. [Google Scholar] [CrossRef]
  28. Ziemba, P. Application Framework of Multi-Criteria Methods in Sustainability Assessment. Energies 2022, 15, 9201. [Google Scholar] [CrossRef]
  29. Negrin, I.; Kripka, M.; Yepes, V. Multi-Criteria Optimization for Sustainability-Based Design of Reinforced Concrete Frame Buildings. J. Clean. Prod. 2023, 425, 139115. [Google Scholar] [CrossRef]
  30. Sánchez-Garrido, A.J.; Navarro, I.J.; Yepes, V. Multi-Criteria Decision-Making Applied to the Sustainability of Building Structures Based on Modern Methods of Construction. J. Clean. Prod. 2022, 330, 129724. [Google Scholar] [CrossRef]
  31. Bhat, P.; Agrawal, C.; Khanna, N. Development of a Sustainability Assessment Algorithm and Its Validation Using Case Studies on Cryogenic Machining. J. Manuf. Mater. Process. 2020, 4, 42. [Google Scholar] [CrossRef]
  32. Khalili, N.R.; Duecker, S. Application of Multi-Criteria Decision Analysis in Design of Sustainable Environmental Management System Framework. J. Clean. Prod. 2013, 47, 188–198. [Google Scholar] [CrossRef]
  33. Jasiński, D.; Meredith, J.; Kirwan, K. A Comprehensive Framework for Automotive Sustainability Assessment. J. Clean. Prod. 2016, 135, 1034–1044. [Google Scholar] [CrossRef]
  34. Diakoulaki, D.; Mavrotas, G.; Papayannakis, L. Determining Objective Weights in Multiple Criteria Problems: The Critic Method. Comput. Oper. Res. 1995, 22, 763–770. [Google Scholar] [CrossRef]
  35. Markatos, D.N.; Malefaki, S.; Pantelakis, S.G. Sensitivity Analysis of a Hybrid MCDM Model for Sustainability Assessment—An Example from the Aviation Industry. Aerospace 2023, 10, 385. [Google Scholar] [CrossRef]
  36. Sharma, A.K.; Aravindan, N.; Ignatia, K.M.J.; Areche, F.O.; Loganathan, G.B.; Taha, A.H.; Dwivedi, P.; Yellapragada, R.K. Hybrid Multi Criteria Decision Making Methodology for Improving Sustainability of the Manufacturing Sector. Int. J. Interact. Des. Manuf. IJIDeM 2024, 19, 695–704. [Google Scholar] [CrossRef]
  37. Peirow, S.; Razi Astaraei, F.; Saifoddin Asl, A. Techno-Economic and Environmental Assessment of a Hybrid Renewable Energy System for a Hospital Using Multi-Criteria Decision-Making Method. Energies 2023, 16, 1916. [Google Scholar] [CrossRef]
  38. Moro, C. Comparative Analysis of Multi-Criteria Decision Making and Life Cycle Assessment Methods for Sustainable Evaluation of Concrete Mixtures. Sustainability 2023, 15, 12746. [Google Scholar] [CrossRef]
  39. ISO 14044; Environmental Management—Life Cycle Assessment—Requirements and Guidelines. ISO: Geneva, Switzerland, 2006.
  40. ISO 14040:2006; Environmental Management—Life Cycle Assessment—Principles and Framework. ISO: Geneva, Switzerland, 2006.
  41. Jahan, A.; Edwards, K.L. A State-of-the-Art Survey on the Influence of Normalization Techniques in Ranking: Improving the Materials Selection Process in Engineering Design. Mater. Des. 1980–2015 2015, 65, 335–342. [Google Scholar] [CrossRef]
  42. Milani, A.S.; Shanian, A.; Madoliat, R.; Nemes, J.A. The Effect of Normalization Norms in Multiple Attribute Decision Making Models: A Case Study in Gear Material Selection. Struct. Multidiscip. Optim. 2005, 29, 312–318. [Google Scholar] [CrossRef]
  43. Zanakis, S.H.; Solomon, A.; Wishart, N.; Dublish, S. Multi-Attribute Decision Making: A Simulation Comparison of Select Methods. Eur. J. Oper. Res. 1998, 107, 507–529. [Google Scholar] [CrossRef]
  44. Zelený, M. Multiple Criteria Decision Making; McGraw-Hill Series in Quantitative Methods for Management; McGraw-Hill Book: New York, NY, USA, 1982; ISBN 978-0-07-072795-3. [Google Scholar]
  45. Wang, Y.-M.; Luo, Y. Integration of Correlations with Standard Deviations for Determining Attribute Weights in Multiple Attribute Decision Making. Math. Comput. Model. 2010, 51, 1–12. [Google Scholar] [CrossRef]
  46. Hwang, C.-L.; Yoon, K. Multiple Attribute Decision Making; Lecture Notes in Economics and Mathematical Systems; Springer: Berlin/Heidelberg, Germany, 1981; Volume 186, ISBN 978-3-540-10558-9. [Google Scholar]
  47. Keshavarz-Ghorabaee, M.; Amiri, M.; Zavadskas, E.K.; Turskis, Z.; Antucheviciene, J. Determination of Objective Weights Using a New Method Based on the Removal Effects of Criteria (MEREC). Symmetry 2021, 13, 525. [Google Scholar] [CrossRef]
  48. Keshavarz-Ghorabaee, M. Assessment of Distribution Center Locations Using a Multi-Expert Subjective–Objective Decision-Making Approach. Sci. Rep. 2021, 11, 19461. [Google Scholar] [CrossRef]
  49. Triantaphyllou, E.; Lin, C.-T. Development and Evaluation of Five Fuzzy Multiattribute Decision-Making Methods. Int. J. Approx. Reason. 1996, 14, 281–310. [Google Scholar] [CrossRef]
  50. Yeh, C. A Problem-based Selection of Multi-attribute Decision-making Methods. Int. Trans. Oper. Res. 2002, 9, 169–181. [Google Scholar] [CrossRef]
  51. Triantaphyllou, E. Multi-Criteria Decision Making Methods: A Comparative Study; Applied Optimization; Springer: Boston, MA, USA, 2000; Volume 44, ISBN 978-1-4419-4838-0. [Google Scholar]
  52. Aires, R.F.D.F.; Ferreira, L. A New Approach to Avoid Rank Reversal Cases in the TOPSIS Method. Comput. Ind. Eng. 2019, 132, 84–97. [Google Scholar] [CrossRef]
  53. Murtagh, F.; Legendre, P. Ward’s Hierarchical Agglomerative Clustering Method: Which Algorithms Implement Ward’s Criterion? J. Classif. 2014, 31, 274–295. [Google Scholar] [CrossRef]
  54. Kimes, P.K.; Liu, Y.; Hayes, D.N.; Marron, J.S. Statistical Significance for Hierarchical Clustering. Biometrics 2017, 73, 811–821. [Google Scholar] [CrossRef]
  55. Aczél, J.; Saaty, T.L. Procedures for Synthesizing Ratio Judgements. J. Math. Psychol. 1983, 27, 93–102. [Google Scholar] [CrossRef]
Figure 1. Sketch of the panel [26].
Sustainability 17 03299 g001
Figure 2. Components and sub-components of the sustainability assessment methodology.
Sustainability 17 03299 g002
Figure 3. Manufacturing process tree of (a) the aluminum panel, (b) the thermoplastic CFRP panel, and (c) the thermoset CFRP panel.
Sustainability 17 03299 g003
Figure 4. SimaPro tree-diagram of the analysis for the computation of the GWP criterion: (a) Aluminum panel and (b) thermoplastic panel. The thickness of the arrows and the bar on the right of the text boxes are analogous to the contribution of each process/material.
Sustainability 17 03299 g004
Figure 5. (a) Part of the FE mesh of the panel created using the ANSYS software. (b) Axial deformation of the panel due to the application of the displacement of −1 mm [26].
Sustainability 17 03299 g005
Figure 6. The basic components of MCDM analysis.
Sustainability 17 03299 g006
Figure 7. Stability scores S M , ε of weighting methods under vector normalization for perturbation levels ε. Shaded areas represent 95% confidence intervals from Monte Carlo simulations.
Sustainability 17 03299 g007
Figure 8. Distribution of criteria weights across the five weighting methods.
Sustainability 17 03299 g008
Figure 9. Hierarchical clustering dendrogram of the weighting methods based on mean stability scores and their variances across all perturbation levels.
Sustainability 17 03299 g009
Figure 10. Comparative weight distribution across categories.
Sustainability 17 03299 g010
Figure 11. Rankings comparison across the four MCDM methods (SAW, WP, TOPSIS, R-TOPSIS).
Sustainability 17 03299 g011
Table 1. Characteristics of the nine panel alternatives.
AlternativeSkin MaterialStiffener MaterialFrame MaterialClip MaterialJoining MethodSkin Thickness (mm)Stiffener Thickness (mm)Frame Thickness (mm)
S0Al2024Al7075Al2024Al2024Welding2.82.41.6
S1Al2024Al7075Al2024Al2024Welding2.52.21.5
S2Al2024Al7075Al2024Al2024Welding2.82.41.6
S3TSTSTSTSBonding2.82.41.6
S4TSTSTSTSBonding2.52.21.5
S5TSTSTSTSBonding2.82.41.5
S6TPTPTPTPWelding2.82.41.6
S7TPTPTPTPWelding2.52.21.5
S8TPTPTPTPWelding2.82.41.6
Table 2. Materials and manufacturing methods used for alternatives S0, S1, and S2.
PartMaterialManufacturing Process
Skin PanelAl2024Stretch forming
StringerAl7075Hydroforming
ClipAl2024Incremental sheet forming
FrameAl2024Hydroforming
Table 3. Materials and manufacturing methods used for alternatives S3, S4, and S5.
PartMaterialManufacturing Process
Skin PanelTS prepreg 57.7% wt. cf.Autoclave
StringerTS prepreg 57.7% wt. cf.Autoclave
ClipTS prepreg 57.7% wt. cf.Autoclave
FrameTS prepreg 57.7% wt. cf.Autoclave
Table 4. Materials and manufacturing methods used for alternatives S6, S7, and S8.
PartMaterialManufacturing Process
Skin PanelTP prepreg 57% wt. cf.Autoclave
StringerTP prepreg 57% wt. cf.Autoclave
ClipTP prepreg 57% wt. cf.Autoclave
FrameTP prepreg 57% wt. cf.Autoclave
Table 5. Criteria description and categorization for the MCDM analysis.
CriteriaDescriptionCategoryImpact Type
C1Human health (DALYs)EnvironmentMinimize
C2Ecosystems (species. year)EnvironmentMinimize
C3Resources (USD 2013)EnvironmentMinimize
C4Global warming potential (kg CO2)EnvironmentMinimize
C5Material costCostMinimize
C6Energy costCostMinimize
C7Use costCostMinimize
C8EoL costCostMinimize
C9MassPerformanceMinimize
C10Specific stiffnessPerformanceMaximize
Table 6. Mathematical formulation of normalization methods for benefit and cost criteria.
MethodBenefit Criteria (Max)Cost Criteria (Min)Description
Vector normalization n i j = x i j i = 1 m x i j 2 n i j = 1 x i j i = 1 m x i j 2 Transforms using Euclidean norm, with cost criteria inverted
Linear scale n i j = x i j max i x i j n i j = min i x i j x i j Scales relative to maximum for benefits and minimum for costs
Min-max n i j = x i j min i x i j max i x i j min i x i j n i j = max i x i j x i j max i x i j min i x i j Scales to [0,1] range with appropriate direction
Table 7. Initial decision matrix for panel alternatives.
AlternativeC1C2C3C4C5C6C7C8C9C10
S01.33003.430 × 10−31.160 × 1058.130 × 10516438.301.340 × 10527.030.23084931.845
S11.20003.100 × 10−31.050 × 1057.350 × 10515335.901.210 × 10525.227.33574897.502
S21.30003.360 × 10−31.140 × 1057.950 × 10516136.801.310 × 10526.429.56505037.188
S30.75601.950 × 10−36.560 × 1044.610 × 105154014907.540 × 1041.0217.03307355.105
S40.68401.760 × 10−35.930 × 1044.170 × 105143013506.820 × 1040.92415.40107306.868
S50.75601.950 × 10−36.560 × 1044.610 × 105152014607.380 × 1040.99916.65707515.834
S60.74601.920 × 10−36.480 × 1044.550 × 10543014407.450 × 1041.01016.81606999.713
S70.67501.740 × 10−35.860 × 1044.110 × 10538913106.730 × 1040.91215.20506952.876
S80.73001.880 × 10−36.340 × 1044.450 × 10542114107.280 × 1040.98716.44507152.875
Table 8. Normalized decision matrix using the vector normalization technique.
AlternativeC1C2C3C4C5C6C7C8C9C10
S00.53140.53160.53130.53110.93940.98890.52890.40610.52930.2510
S10.57720.57660.57580.57610.94340.98960.57460.44570.57440.2492
S20.54200.54110.53940.54150.94050.98940.53950.41930.53960.2563
S30.73360.73370.73490.73410.43070.56910.73490.97760.73480.3743
S40.75900.75960.76040.75950.47130.60960.76030.97970.76020.3718
S50.73360.73370.73490.73410.43810.57780.74060.97800.74060.3825
S60.73720.73780.73820.73760.84100.58360.73810.97780.73820.3562
S70.76220.76240.76320.76300.85620.62110.76340.97990.76320.3538
S80.74280.74330.74380.74330.84440.59220.74410.97830.74390.3640
Table 9. Summary statistics of stability scores under vector normalization.
MethodMeanMedianstdVarianceMinMax
SD0.94860.94790.0282 7.9343 × 10 4 0.90400.9958
COV0.94950.94880.0276 7.6423 × 10 4 0.90590.9959
Entropy0.90260.90060.0522 2.7242 × 10 3 0.82130.9917
CRITIC0.90830.91570.0633 4.0121 × 10 3 0.79560.9956
MEREC0.99480.99500.0032 9.9518 × 10 6 0.98920.9996
Table 10. Criteria weights obtained by different objective weighting methods.
CriteriaSDCOVEntropyCRITICMEREC
C10.07240.07300.04580.03690.0865
C20.07270.07320.04610.03700.0865
C30.07330.07390.04690.03740.0864
C40.07280.07340.04630.03710.0865
C50.16740.15390.21280.31480.0796
C60.14640.13840.15150.33190.0829
C70.07410.07460.04780.03780.0864
C80.20410.17620.28650.10590.0623
C90.07400.07450.04780.03770.0864
C100.04280.08910.06850.02360.2566
max/min4.77362.41386.258614.05704.1207
Table 11. Weight distribution across three selected methods and their geometric mean (GM).
CriterionSDCOVMERECGM
C10.07240.07300.08650.0818
C20.07270.07320.08650.0820
C30.07330.07390.08640.0825
C40.07280.07340.08650.0821
C50.16740.15390.07960.1350
C60.14640.13840.08290.1263
C70.07410.07460.08640.0830
C80.20410.17620.06230.1390
C90.07400.07450.08640.0830
C100.04280.08910.25660.1054
max/min4.77362.41384.12071.6979
Table 12. Categorical weight distribution for different weighting methods.
CategorySDCOVMERECGM
Environmental (C1–C4)29.13%29.34%34.59%32.85%
Cost (C5–C8)59.19%54.30%31.12%48.32%
Performance (C9–C10)11.68%16.36%34.29%18.83%
max/min5.073.321.112.57
Table 13. Rank analysis results across different MCDM methods using GM weights.
PanelSAWWPTOPSISR-TOPSISMeanRank
S099999.009
S177676.757
S288888.008
S366766.256
S444444.004
S555555.005
S633333.003
S711111.001
S822222.002
Disclaimer/Publisher’s Note: The statements, opinions and data contained in all publications are solely those of the individual author(s) and contributor(s) and not of MDPI and/or the editor(s). MDPI and/or the editor(s) disclaim responsibility for any injury to people or property resulting from any ideas, methods, instructions or products referred to in the content.

