Article

Impact of Regional and Seasonal Characteristics on Battery Electric Vehicle Operational Costs in the U.S.

1
Automotive Mechatronics Laboratory, Department of Mechanical Engineering, Sungkyunkwan University, 2066 Seobu-ro, Jangan-gu, Suwon-si 16419, Republic of Korea
2
Argonne National Laboratory, 9700 S. Cass Ave, Lemont, IL 60439, USA
*
Authors to whom correspondence should be addressed.
Sustainability 2025, 17(8), 3282; https://doi.org/10.3390/su17083282
Submission received: 30 December 2024 / Revised: 14 March 2025 / Accepted: 14 March 2025 / Published: 8 April 2025
(This article belongs to the Special Issue Innovative and Sustainable Development of Transportation)

Abstract

:
This study investigates the operational cost competitiveness of battery electric vehicles (BEVs) in the United States, considering regional climates, energy prices, and driving patterns. By comparing BEVs with plug-in hybrid electric vehicles (PHEVs), hybrid electric vehicles (HEVs), and the alternative use of BEVs and conventional vehicles (Convs), the analysis incorporates thermal dynamometer tests, real-world vehicle miles traveled (VMT), and state-specific energy prices. Using detailed simulations, the study evaluates energy consumption across varying temperatures and driving distances. The findings reveal that, while BEVs remain cost-effective for short trips in moderate climates, PHEVs are more economical for long-range trips and cold environments, due to the excessive cost of using external direct current fast chargers (DCFCs) and reduced BEV efficiency at low temperatures. HEVs are identified as the most cost-efficient option in regions like New England, characterized by high residential electricity prices. These insights are critical for shaping vehicle electrification strategies, particularly under diverse regional and seasonal conditions, and for advancing policies on alternative energy and fuels.

1. Introduction

Sales of battery electric vehicles (BEVs) have been consistently increasing in the United States and worldwide [1]. Cost-effectiveness is considered one of the primary reasons drivers choose BEVs [2,3]. Typically, BEVs are considered more economical in operation than vehicles with internal combustion engines, primarily due to their higher energy efficiency and the lower cost of electricity relative to fuel. However, the efficiency of BEVs can be impacted by the characteristics of lithium-ion batteries, which perform less effectively in colder climates [4,5,6]. Furthermore, unlike conventional vehicles, BEVs do not utilize engine waste heat, therefore requiring additional energy for cabin heating, which can lead to increased energy usage and diminished range in cold conditions. This correlation between increased energy consumption and reduced range in low temperatures has been well-established through various studies [7,8,9,10,11,12].
Beyond environmental conditions, operational costs for BEVs can also escalate when charging occurs at commercial direct current fast chargers (DCFCs) rather than at residential charging facilities or in regions where electricity costs are high [13]. Furthermore, if the residential electricity price is not competitive, BEVs are not likely an economical option. Sensitivity analyses were conducted in multiple cities worldwide to evaluate the profitability of electric taxis considering electricity prices [14,15,16,17]. The impacts of energy prices on personal/shared electric vehicle operation have also been analyzed in several studies [18,19,20,21,22]. The influence of these factors on operating costs is not visible through standard fuel economy ratings. Instead, it requires an analysis of actual vehicle mileage and regional specifics such as climate and energy costs.
Several studies have examined the influence of climatic conditions and driving behaviors on the energy needs of BEVs [23,24,25,26,27,28,29,30]. The impact of seasonal changes and usage patterns on the electricity consumption of BEVs in Beijing, China, was explored in [31], where driving patterns were classified using the k-means method, and energy consumptions were compared by application and season. The cost analysis of BEVs in Macau and a comparison with conventional vehicles were carried out in [32]. A Belgian case study for the emissions performance of BEVs was conducted in [33], considering the electricity grid and charging and driving patterns. More recently, the operational costs of BEVs, considering the regional factors of various cities, have been investigated as a part of a TCO (total cost of ownership) analysis across the globe [34,35,36,37]. Focusing on North America, Yuksel and Michalek [38] analyzed the energy consumption of BEVs across various regions in the United States, taking regional temperatures and driving patterns into account to study greenhouse gas emissions. The authors of [39,40] utilized the household travel GPS data in Seattle to evaluate the annual operational costs of PHEVs and then compared them with those of conventional vehicles. The authors of [41] compared the TCOs of different powertrains of the same vehicle platform, Kia Niro, in North America. While individual studies have introduced detailed analyses of specific characteristics such as climate, driving patterns, and energy prices, a comprehensive approach that integrates these characteristics is required.
This study aims to evaluate the competitiveness of BEVs in terms of operational costs, considering factors such as climate, differences in electricity and gasoline prices, and the distribution of miles traveled. Regional characteristics within the United States are gathered from various sources and reflected in the analysis. For comparison, operating costs from scenarios with multiple vehicle configurations were yielded. The thermal dynamo test results of representative vehicles were utilized to make a realistic assumption of vehicle efficiency in various climates. With this foundation, the novelty of this study lies in the following aspects:
  • This study presents a methodology that can yield practical results by comprehensively considering actual driving patterns, regional temperatures, and energy prices.
  • This study enables comparative analysis across different regions by targeting the entire United States rather than a single region.
  • The study utilized results from dynamometer tests conducted under various temperatures, enabling the precise analysis of energy and fuel consumption across different conditions.
This paper is structured as follows: The Second Section first explains the assumptions made concerning vehicle configuration scenarios and trips, along with the methodology for evaluating the operational costs. Data from multiple sources regarding annual and monthly vehicle miles traveled (VMT), as well as daily trip lengths are combined to construct a realistic driving scenario. The relationship between temperature and energy consumption of different vehicle types, namely BEVs, PHEVs, HEVs, and Conv, is applied to evaluate the electricity or fuel needs for each scenario. Consideration of electricity and fuel prices depending on regions is followed to obtain the operational costs. The Third Section addresses the result of the operational cost calculation for each scenario. The Fourth Section compares the operational costs of different vehicle configurations to analyze the impact of the regional and seasonal factors involved. Employing both U.S. map-based visualization and parameter-based X-Y plots enabled the identification of the factors contributing to each vehicle option’s superiority under different conditions. Finally, the Fifth Section summarizes the study and discusses potential future research directions and contributions.

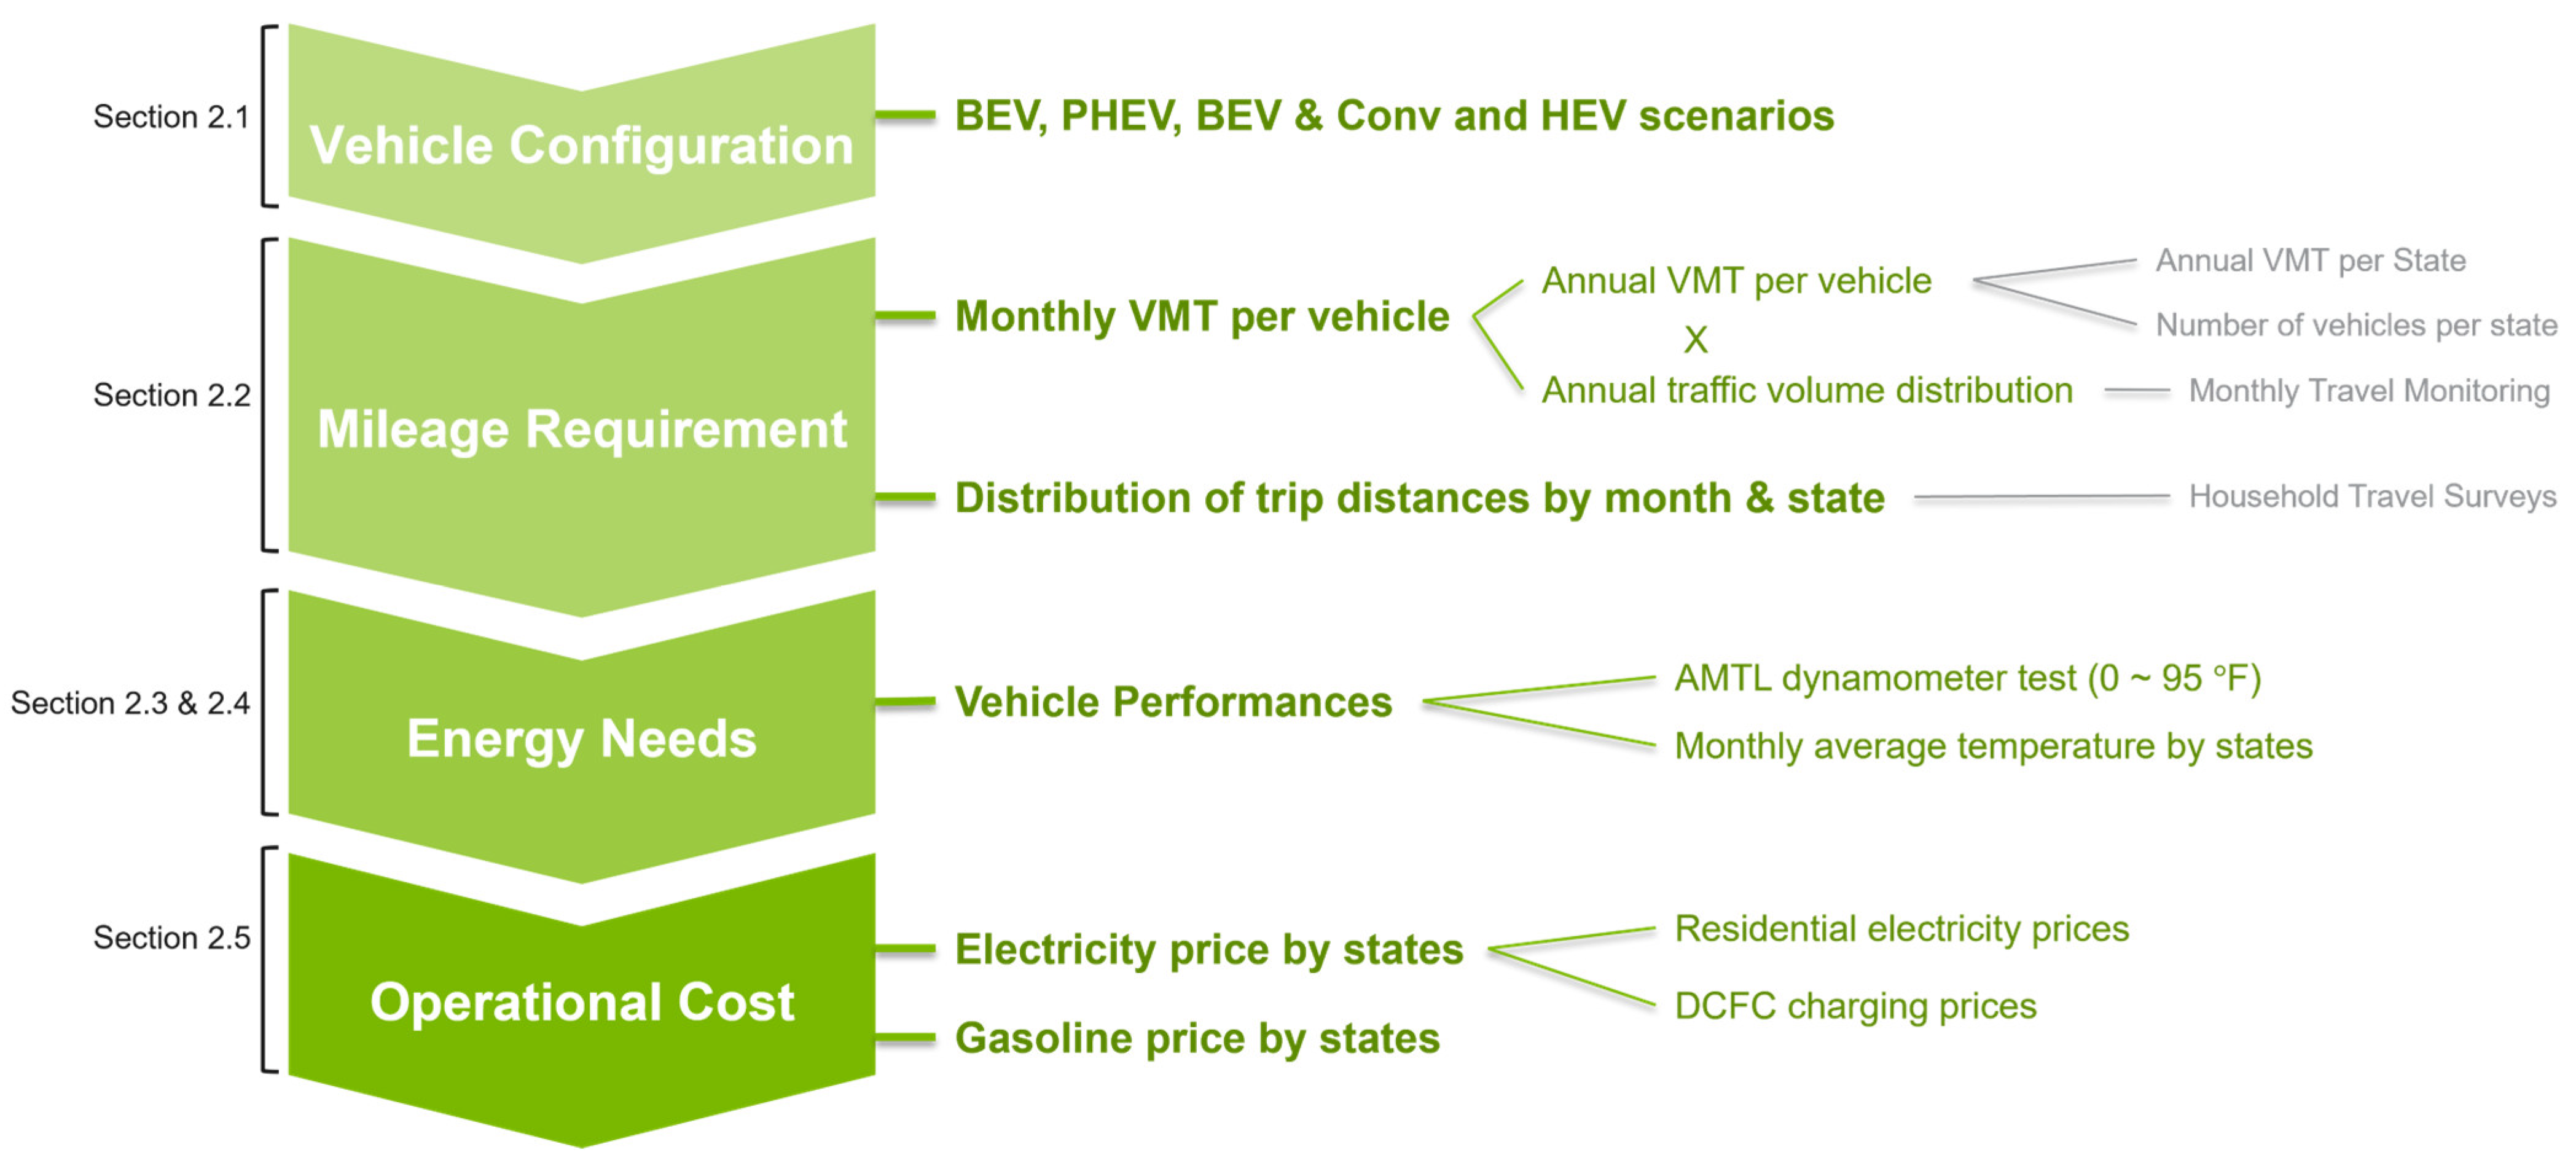
2. Materials and Methods

This section is composed of step-by-step processes for the estimation of operational costs for each vehicle configuration scenario. Figure 1 shows the overall process of evaluating the operational costs. Section 2.1 explains the selected vehicle configurations. Section 2.2 proposes the assumptions adopted regarding the mileage requirements. Driving patterns in each region and season and the overall traffic volume are combined to determine the mileage requirements. Section 2.3 and Section 2.4 address the impact of temperature on each vehicle. The influence of different seasons is reflected in the operational costs through the different monthly average temperatures of each region and season. Ultimately, regional electricity and gasoline prices are multiplied by the energy needs to yield the operational costs.

2.1. Scenarios with Configuration of Vehicles

This study considers four scenarios with different vehicle configurations: BEV, PHEV, BEV and Conv, and HEV. The vehicle is assumed to start fully charged daily using residential charging equipment for both BEV and PHEV scenarios. In the BEV scenario, if the total distance of all trips scheduled for a day exceeds the BEV’s range, it is assumed that the vehicle needs to be recharged at a DCFC station to complete the trips. For PHEVs, the vehicle initially operates in the charge-depleting (CD) mode to use all the electricity charged overnight, and then switches to the charge-sustaining (CS) mode to complete the remaining trips. The BEV and Conv scenario presumes the availability of both a BEV and a conventional vehicle. The choice of vehicle depends on whether the total distance of all scheduled trips for the day exceeds the BEV’s range; if it does, the conventional vehicle is used; otherwise, the BEV is selected. In the HEV scenario, all daily trips are completed using HEV alone. Figure 2 illustrates the trip management for each scenario. Note that the Conv-only scenario is not addressed in this paper, as it is evident that HEVs will always be superior in terms of operational costs under any conditions.

2.2. Vehicle Miles Traveled (VMT) Assumptions

To accurately compute the operational costs of vehicles, it is essential to consider both the total distance traveled monthly and the distance covered each day. Operational modes can vary based on daily distances, significantly impacting costs. Data for annual VMT, monthly VMT distribution, and daily travel distances were compiled by postprocessing information from multiple sources. Operational costs are initially estimated using daily travel data, which reflects the total distance traveled each day, assuming a single residential charging before traveling for BEVs and PHEVs. These daily estimates are then scaled up to align with the monthly VMT, derived from combined annual VMT and monthly distribution data, to ensure consistency and precision in the overall cost analysis across broader temporal scales.

2.2.1. Household Travel Survey

In 2022, the Federal Highway Administration (FHA) conducted the National Household Travel Survey involving 27,290 households nationwide [42]. Each household was assigned a specific date to report on their travel activities for all household members. Data associated with non-personal vehicles, public transit modes like airplanes and trains, and pedestrian travel were excluded to maintain the focus on vehicle miles traveled. Additionally, reports from non-drivers were removed to prevent duplicate entries. Figure 3 presents a data histogram showing trip distances under 200 miles, categorized by regional divisions. Figure 4a,b illustrate the monthly distribution of trip miles of the East South Central Division and Mountain Division, respectively. Figure 3 shows that the occurrence of trips decreases exponentially as the trip miles increase, regardless of divisions. However, the distribution of miles varies depending on the region, as shown in Figure 4. While analyzing the correlation between region and seasonal factors and driving patterns, which is beyond the scope of this study, the trip data were implemented separately for each region and season to reflect actual driving patterns.

2.2.2. Monthly VMT

Monthly VMT was derived by applying a monthly distribution factor to the annual VMT. The net annual VMT by state was divided by the number of registered vehicles in each state [43] to calculate the average annual VMT per vehicle by region. Figure 5 shows the average annual VMT per vehicle by state.
Traffic volume distribution data were utilized to break down the annual VMT into monthly VMT. Traffic data from approximately 5000 traffic counting locations nationwide were monitored and used to estimate the total traffic volume every month by the Federal Highway Administration [43]. For each state, the proportion of traffic in a single month to the total annual traffic was calculated. This ratio served as the monthly distribution factor for the VMT. Figure 6 displays the estimated monthly traffic volume by state, whereas Figure 7 shows the proportion of monthly traffic relative to annual totals in each state.

2.3. Temperature Impacts on Vehicle Performances

This study used data from thermal dynamo tests conducted at the Advanced Mobility Testing Laboratory (AMTL) at Argonne National Laboratory [44,45,46,47,48,49]. The tests involved six vehicles—two BEVs, two parallel PHEVs, one HEV, and one Conv—and were carried out using a dynamometer equipped with a temperature controller. The tests were conducted at various temperatures: 20 °F, 72 °F, and 95 °F. Additionally, data at 0 °F were available for some vehicles. Table 1 shows the brief specs of the vehicles tested and 0 °F test availability. Note that vehicles with similar levels of cabin volumes were chosen for a reasonable comparison. The miles per gallon equivalent (MPGe) of BEVs, which assumes 1 gallon of gasoline is equivalent to 33.7 kWh of electricity, and the miles per gallon (MPG) of other vehicles based on the EPA (United States Environmental Protection Agency) standard are presented for reference as well [50,51]. To represent the consumption and efficiency characteristics of BEV and PHEV, the data from each pair of BEVs and PHEVs were averaged. Vehicle fuel economy and energy consumption values were interpolated or extrapolated for temperatures between these test points.

2.3.1. Variation in Energy Consumption, Range, and Fuel Economy

Thermal dynamo tests with UDDS and HWFET duty cycles were conducted across different cell temperatures: 0 °F, 20 °F, 72 °F, and 95 °F. For tests at 0 °F and 20 °F, vehicles were soaked in the cell temperature for enough time before initiating the driving tests, and the target temperature of the HVAC system was set to 72 °F. In 95 °F tests, the target temperature of the HVAC system was also set to 72 °F, and a light intensity of 850 W/m2 was applied to simulate the effects of sunlight. As the ambient temperature increases or decreases from 72 °F, the electricity consumption of the BEV and PHEV increases due to the HVAC load. In contrast, the usable battery energy decreases, as shown in Figure 8a,b. The change in vehicle range from these effects is described in Figure 8c. Below 25 °F, both PHEVs operate the internal combustion engine even in the CD mode to prevent excessive energy loss. Due to the uncertainty in the internal combustion engine operation strategies of PHEVs, it is assumed that electricity and gasoline are consumed at constant rates during CD mode operation below 10 °F, as seen in Figure 8a and Figure 9a. Figure 9b shows the change in PHEV, HEV, and Conv fuel economy depending on the ambient temperature. Note that the electricity consumption and fuel economies were evaluated by an average weight of 55% on UDDs and 45% on HWFET, respectively.

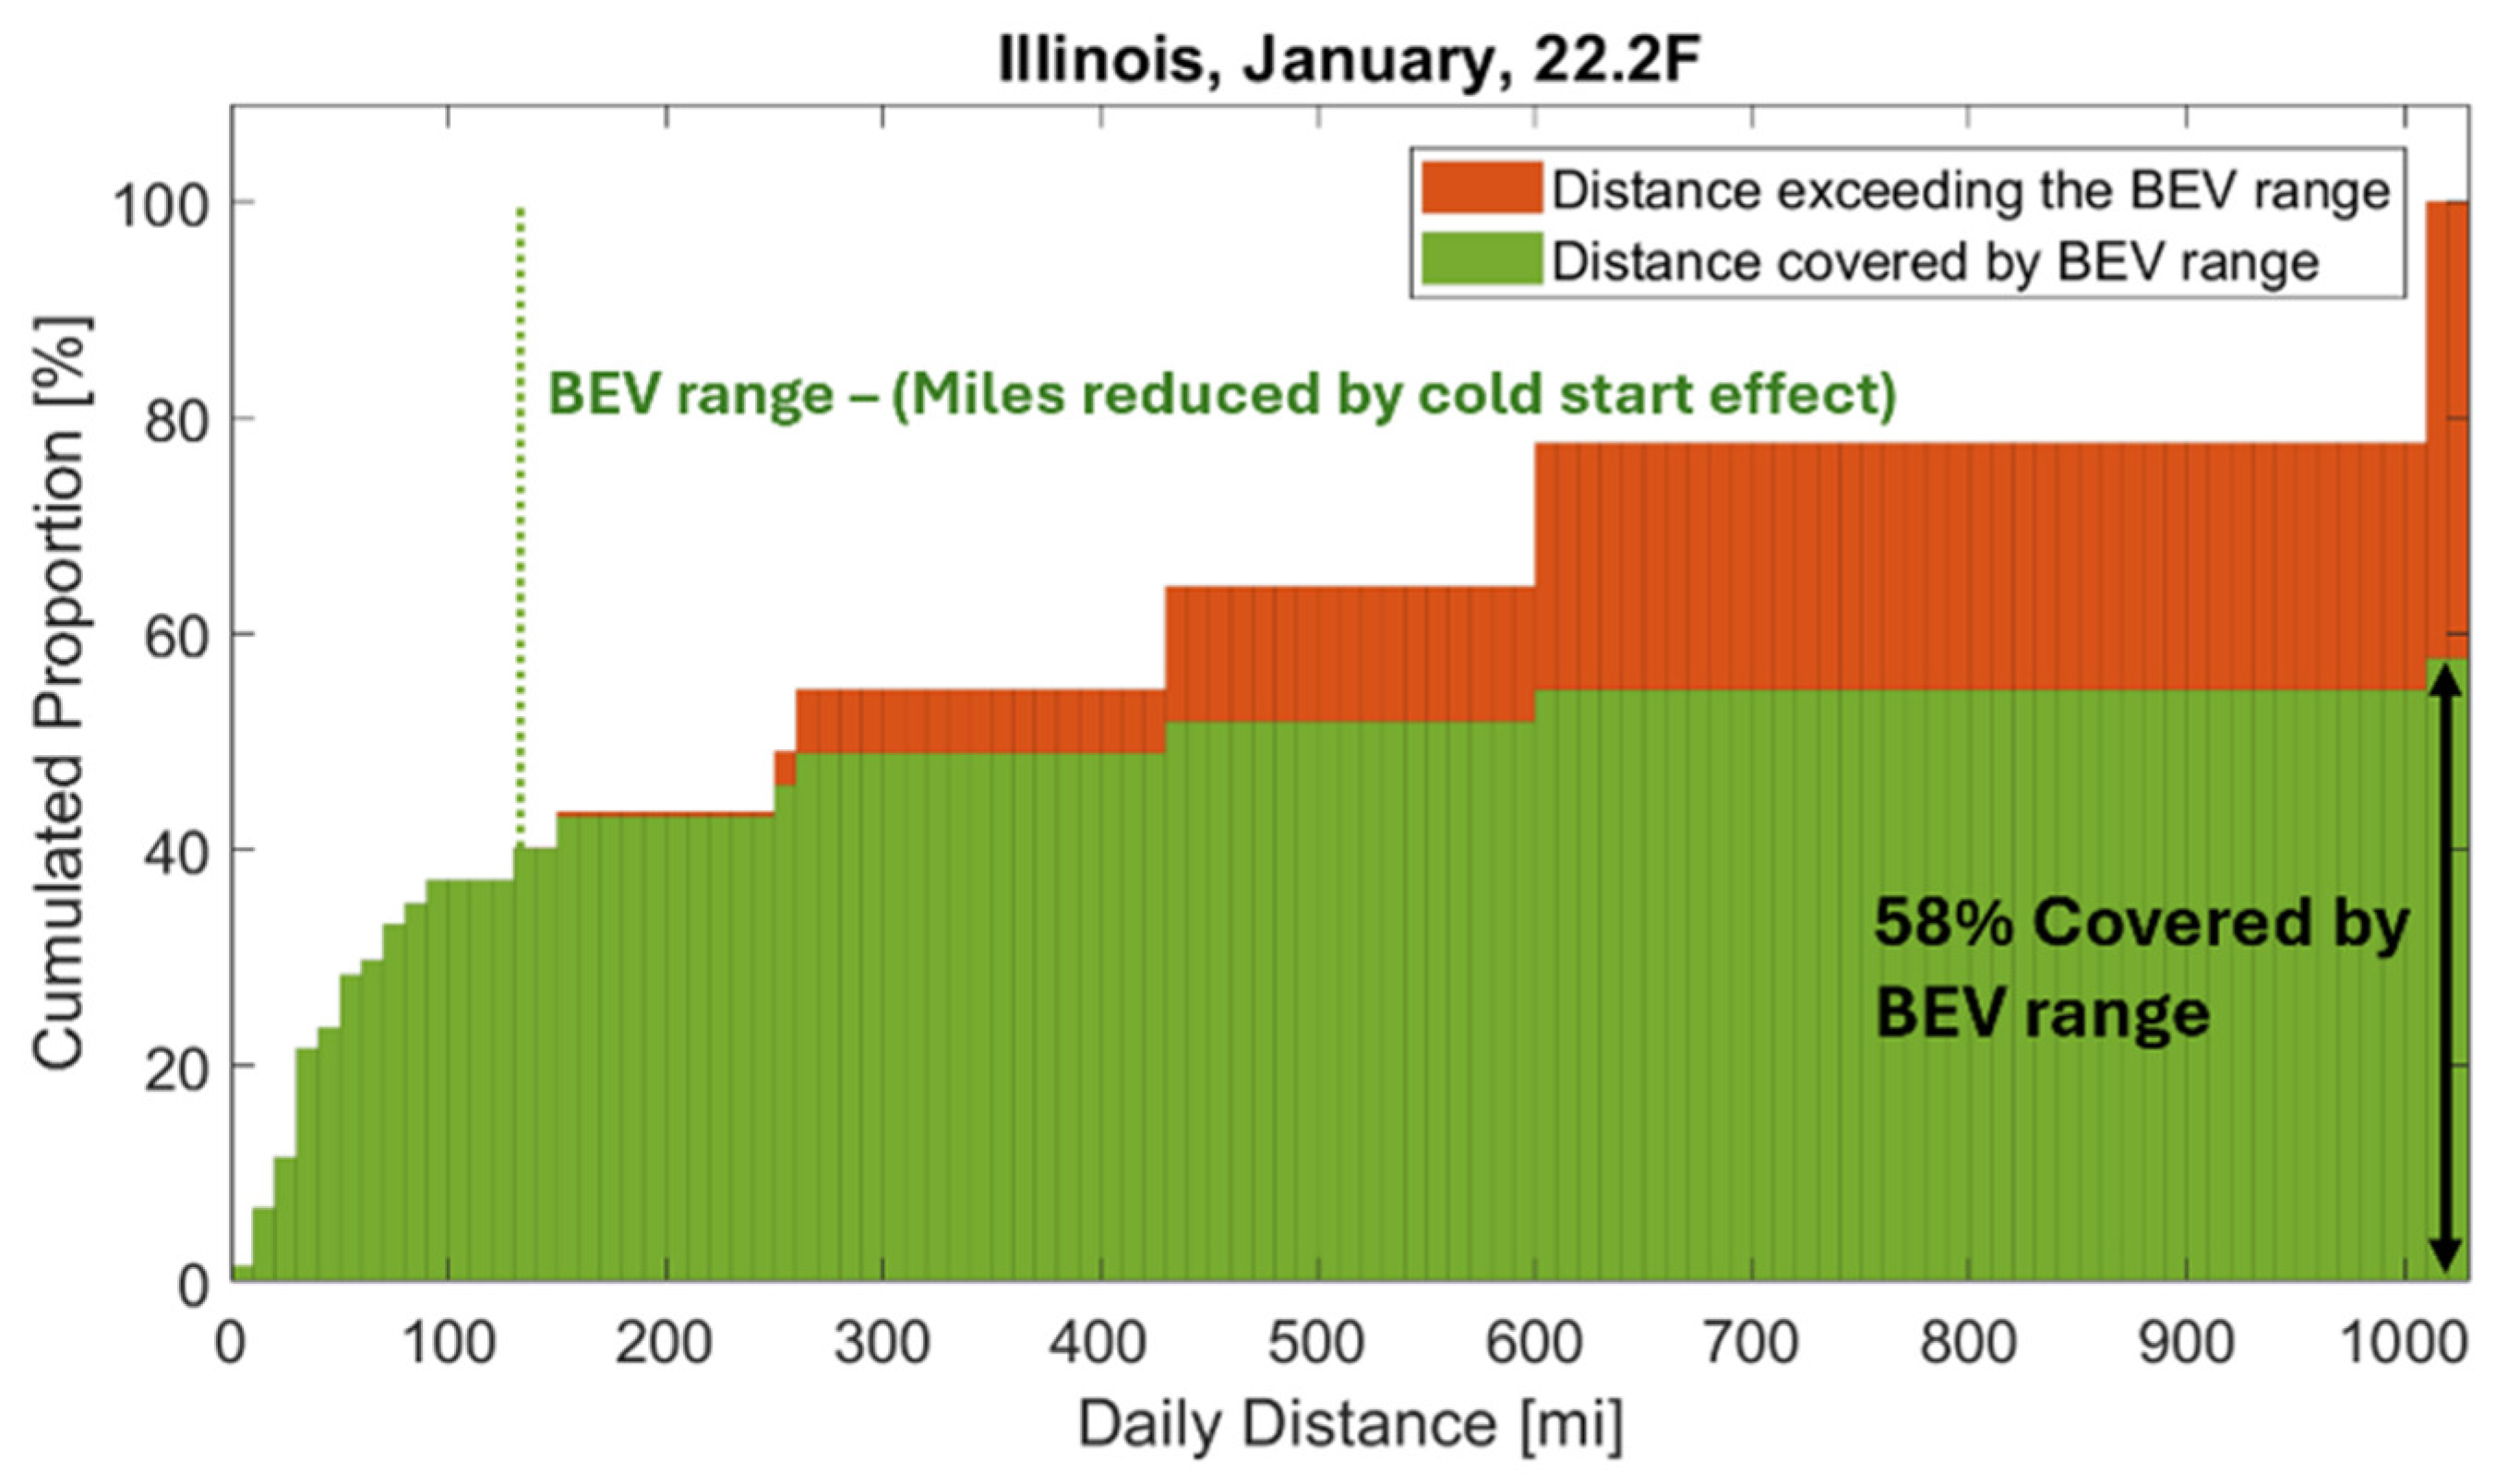
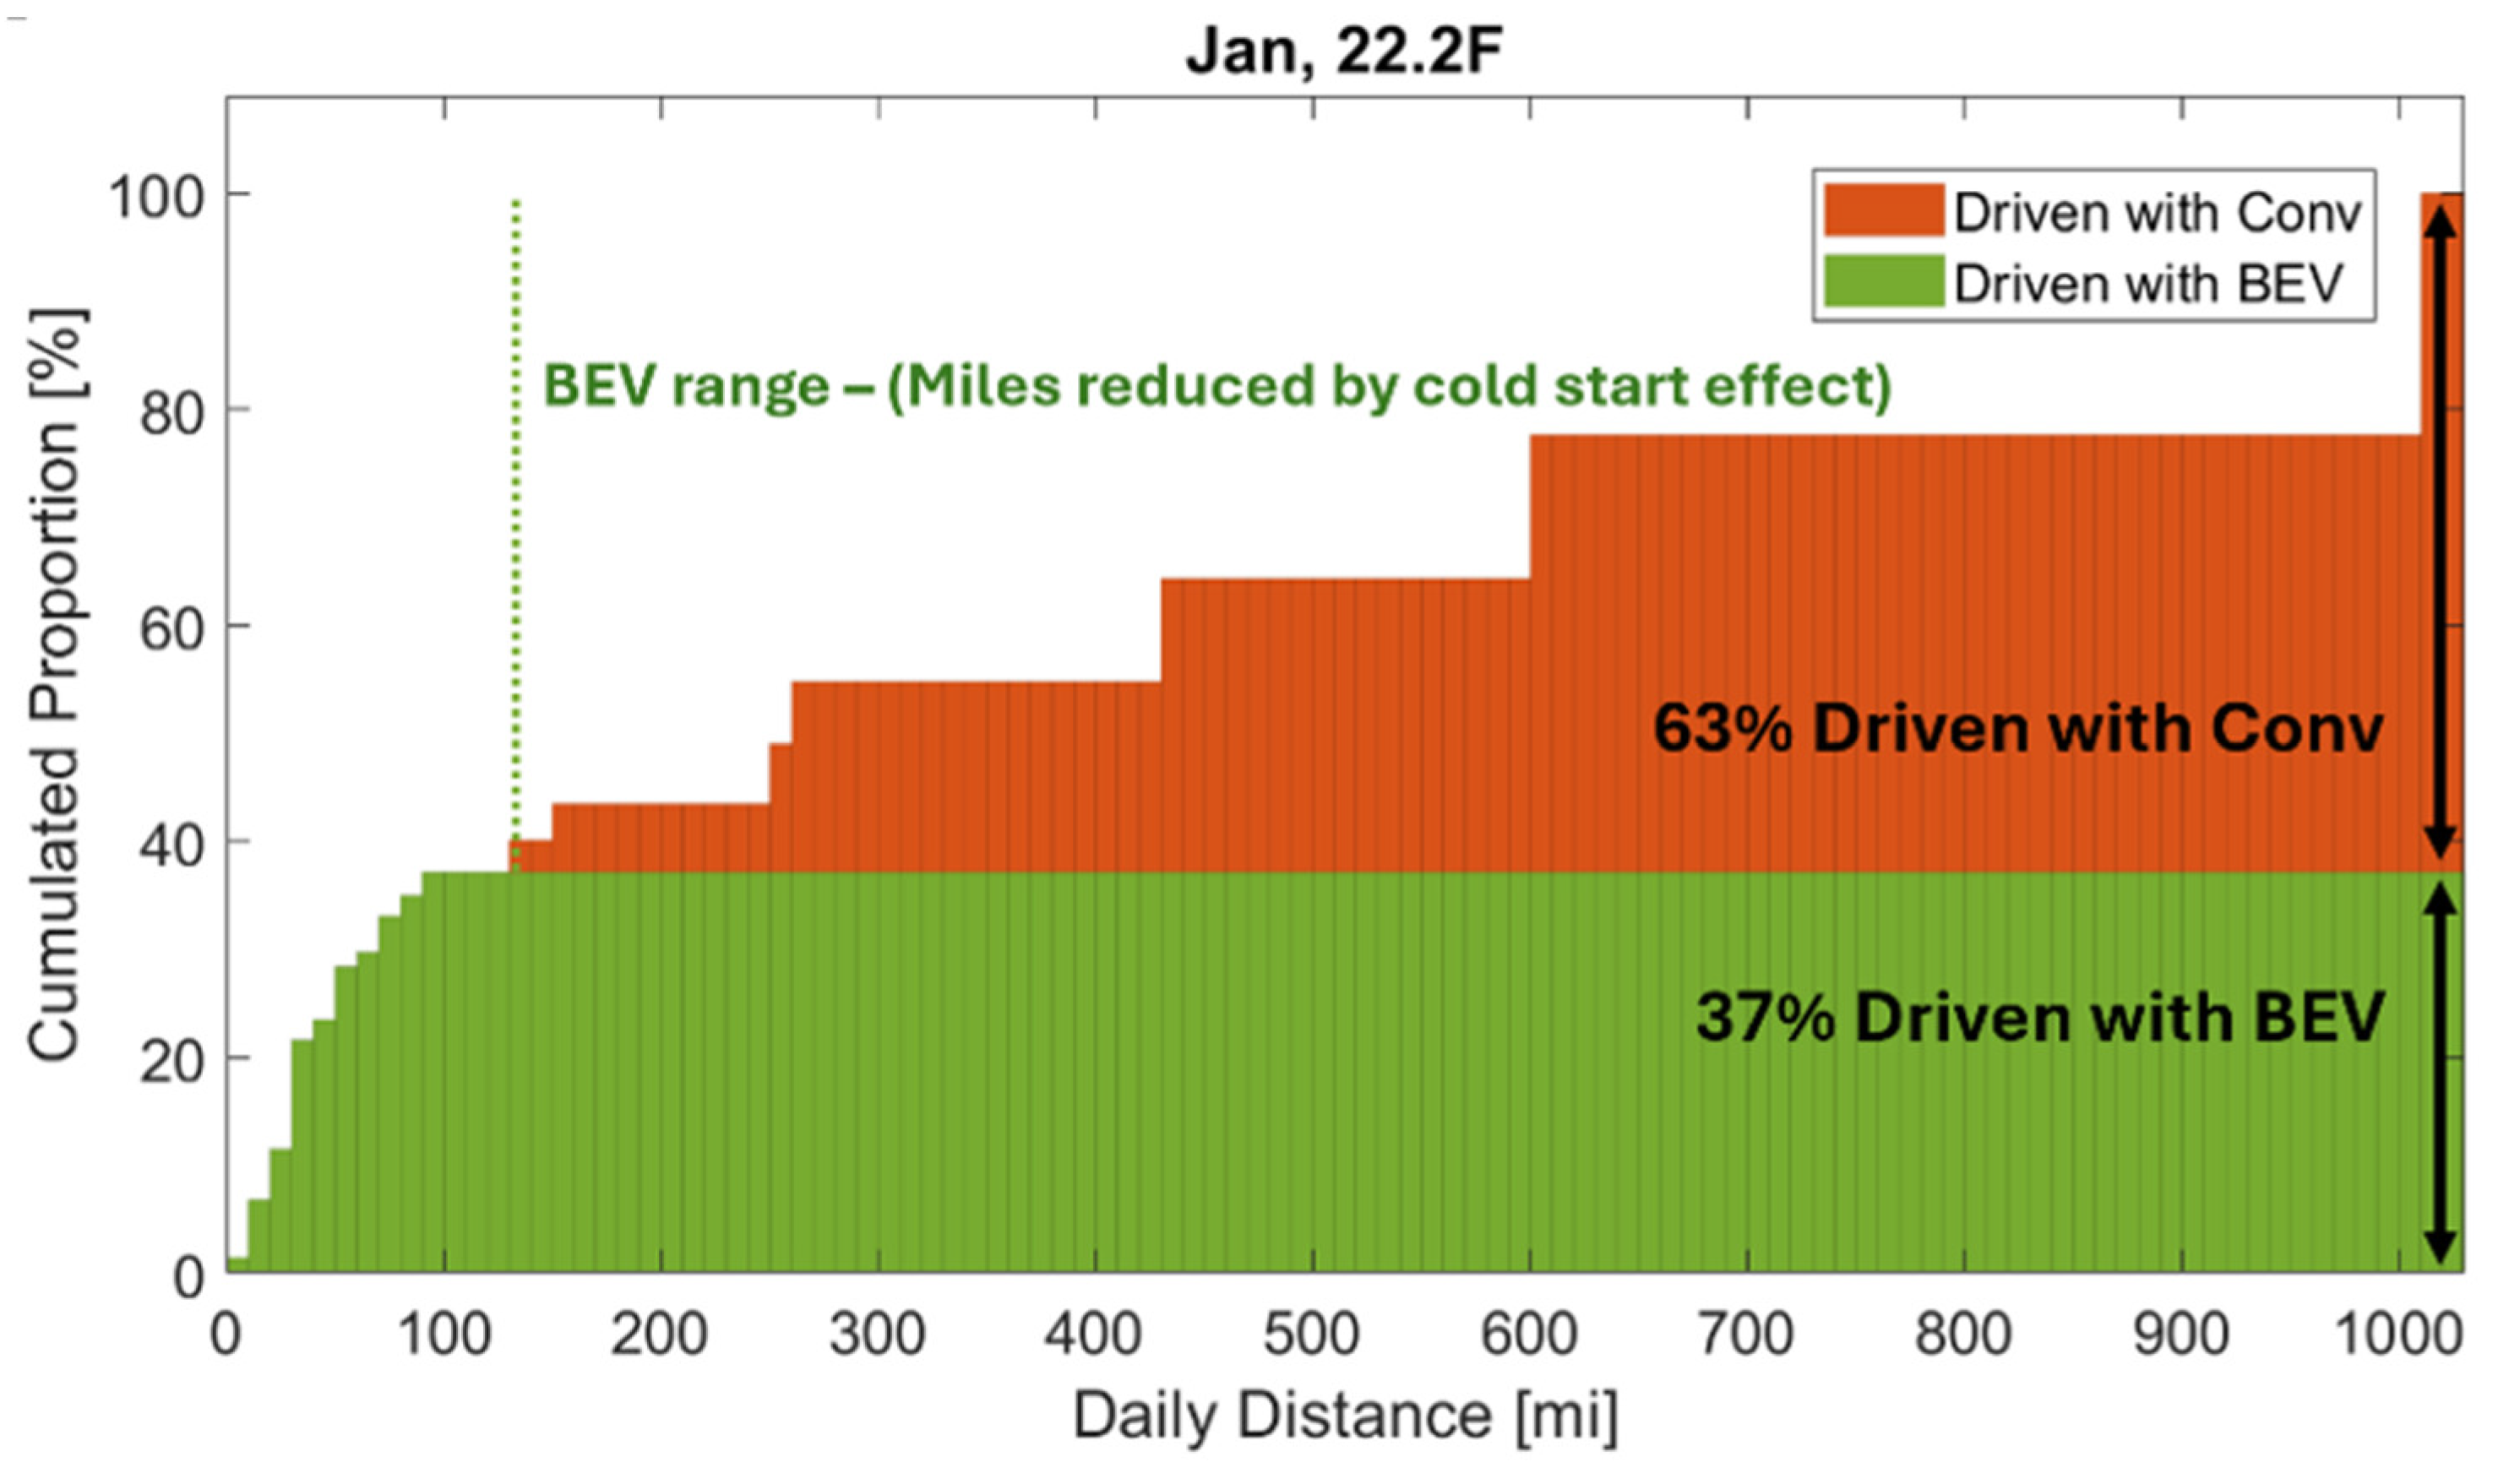
2.3.2. Energy Loss from Cold Start

During the initial stages of operation, vehicles exhibit reduced energy efficiency due to the suboptimal temperature of their powertrain components and cabin. Powertrain components function less efficiently at lower temperatures, and additional energy is required to adjust the cabin temperature to the target level, whether warming or cooling. The impact of these conditions, known as a cold start, was analyzed by comparing the energy consumption in the initial duty-cycle test, which includes the cold start effect, with that in the warm start tests. Figure 10 shows the additional energy or fuel consumed by BEV, PHEV, and Conv because of the cold start effect.

2.4. Electricity and Fuel Consumption

2.4.1. BEV Scenario

To determine the amount of external charging, the monthly mileage is divided into miles driven using residential charging and external charging based on range. It is assumed that a cold start occurs once daily, reducing the miles driven using residential charging to account for this effect. Figure 11 shows the total cumulated distance of January in Illinois from the household travel survey and the portion of distance covered by the BEV range as an example. Days when the total traveled distance was below the range are fully covered with green, while the days on which the distance was higher are partially green, indicating the partial contribution of the residential charged electricity. The proportion of miles driven with residential electricity and electricity charged from external chargers, referred to as λ r e s i d e n t i a l M , S and λ e x t e r n a l M , S , are utilized to evaluate the amount of electricity charged from residential chargers and external chargers, E B E V , r e s i d e n t i a l and E B E V , e x t e r n a l , as follows:
E B E V , r e s i d e n t i a l M , S = e c B E V T M , S m m o n t h l y   V M T M , S λ r e s i d e n t i a l M , S
E B E V , e x t e r n a l M , S = e c B E V T M , S m m o n t h l y   V M T M , S λ e x t e r n a l M , S
where e c B E V T M , S and m m o n t h l y   V M T M , S refer to the electricity consumption of the BEV in a specific temperature T and the monthly VMT of a specific month, M, and state, S, respectively.

2.4.2. PHEV Scenario

For PHEVs, we calculated the consumption of electricity and gasoline separately by dividing the daily distances driven into two portions, as in Figure 12: those within the PHEV range, which is the maximum distance that can be traveled using electric power stored in the PHEV battery, and those beyond the PHEV range. The vehicle was assumed to be driven in the charge-depleting mode (CD mode) within the PHEV range.
However, gasoline is consumed in addition to electricity at low ambient temperatures, as shown in Figure 9a, so that the two types of energy consumption are combined. Once the daily distance exceeds the PHEV range, only gasoline is consumed as the charge-sustaining mode (CS mode) is engaged. With the proportion of miles driven in the CD mode and CS mode, λ C D M , S and λ C S M , S , the electricity consumption E P H E V , and gasoline consumption G P H E V are obtained as follows:
E P H E V M , S = e c P H E V T M , S m m o n t h l y   V M T M , S λ C D M , S
G P H E V M , S = g p m P H E V , C D T M , S m m o n t h l y   V M T M , S λ C D M , S + λ C S M , S m p g P H E V , C S T M , S  
where e c P H E V , g p m P H E V , and m p g P H E V , C S refer to electricity consumption in the CD mode, fuel consumption in the CD mode, and fuel economy in the CS mode of the PHEV, respectively.

2.4.3. BEV and Conv Scenario

In the Bev and Conv Scenario, it is assumed that BEVs are used on days when the total miles driven are within their range, while conventional vehicles are employed on days exceeding this range. An example of the portion of distances driven with the BEV and Conv is shown in Figure 13. It can be seen that the miles driven by the BEV in the current scenario are less than the miles driven by residential electricity in the BEV scenario. This is because, in the BEV scenario, vehicles began operating with residential electricity even when total miles exceeded the BEV range, whereas BEVs were not utilized at all in such cases in the BEV and Conv scenario. The electricity consumed byBEV, E B E V & C o n v , and the gasoline consumed by the conventional vehicle, G B E V & C o n v , in this scenario are calculated as follows:
E B E V & C o n v M , S = e c B E V T M , S m m o n t h l y   V M T M , S λ B E V ,   B E V & C o n v M , S
G B E V & C o n v M , S = m m o n t h l y   V M T M , S λ C o n v , B E V & C o n v M , S m p g C o n v T M , S
where λ B E V ,   B E V & C o n v , λ C o n v ,   B E V & C o n v , and m p g C o n v refer to the proportion of distances driven with BEV and Conv, and the fuel economy of the conventional vehicle, respectively.

2.4.4. HEV Scenario

In the HEV scenario, all the daily distances were driven by a single type of vehicle. Fuel consumption G H E V was obtained as follows:
G H E V M , S = m m o n t h l y   V M T M , S m p g H E V T M , S
where m p g H E V refers to the fuel economy of HEV.

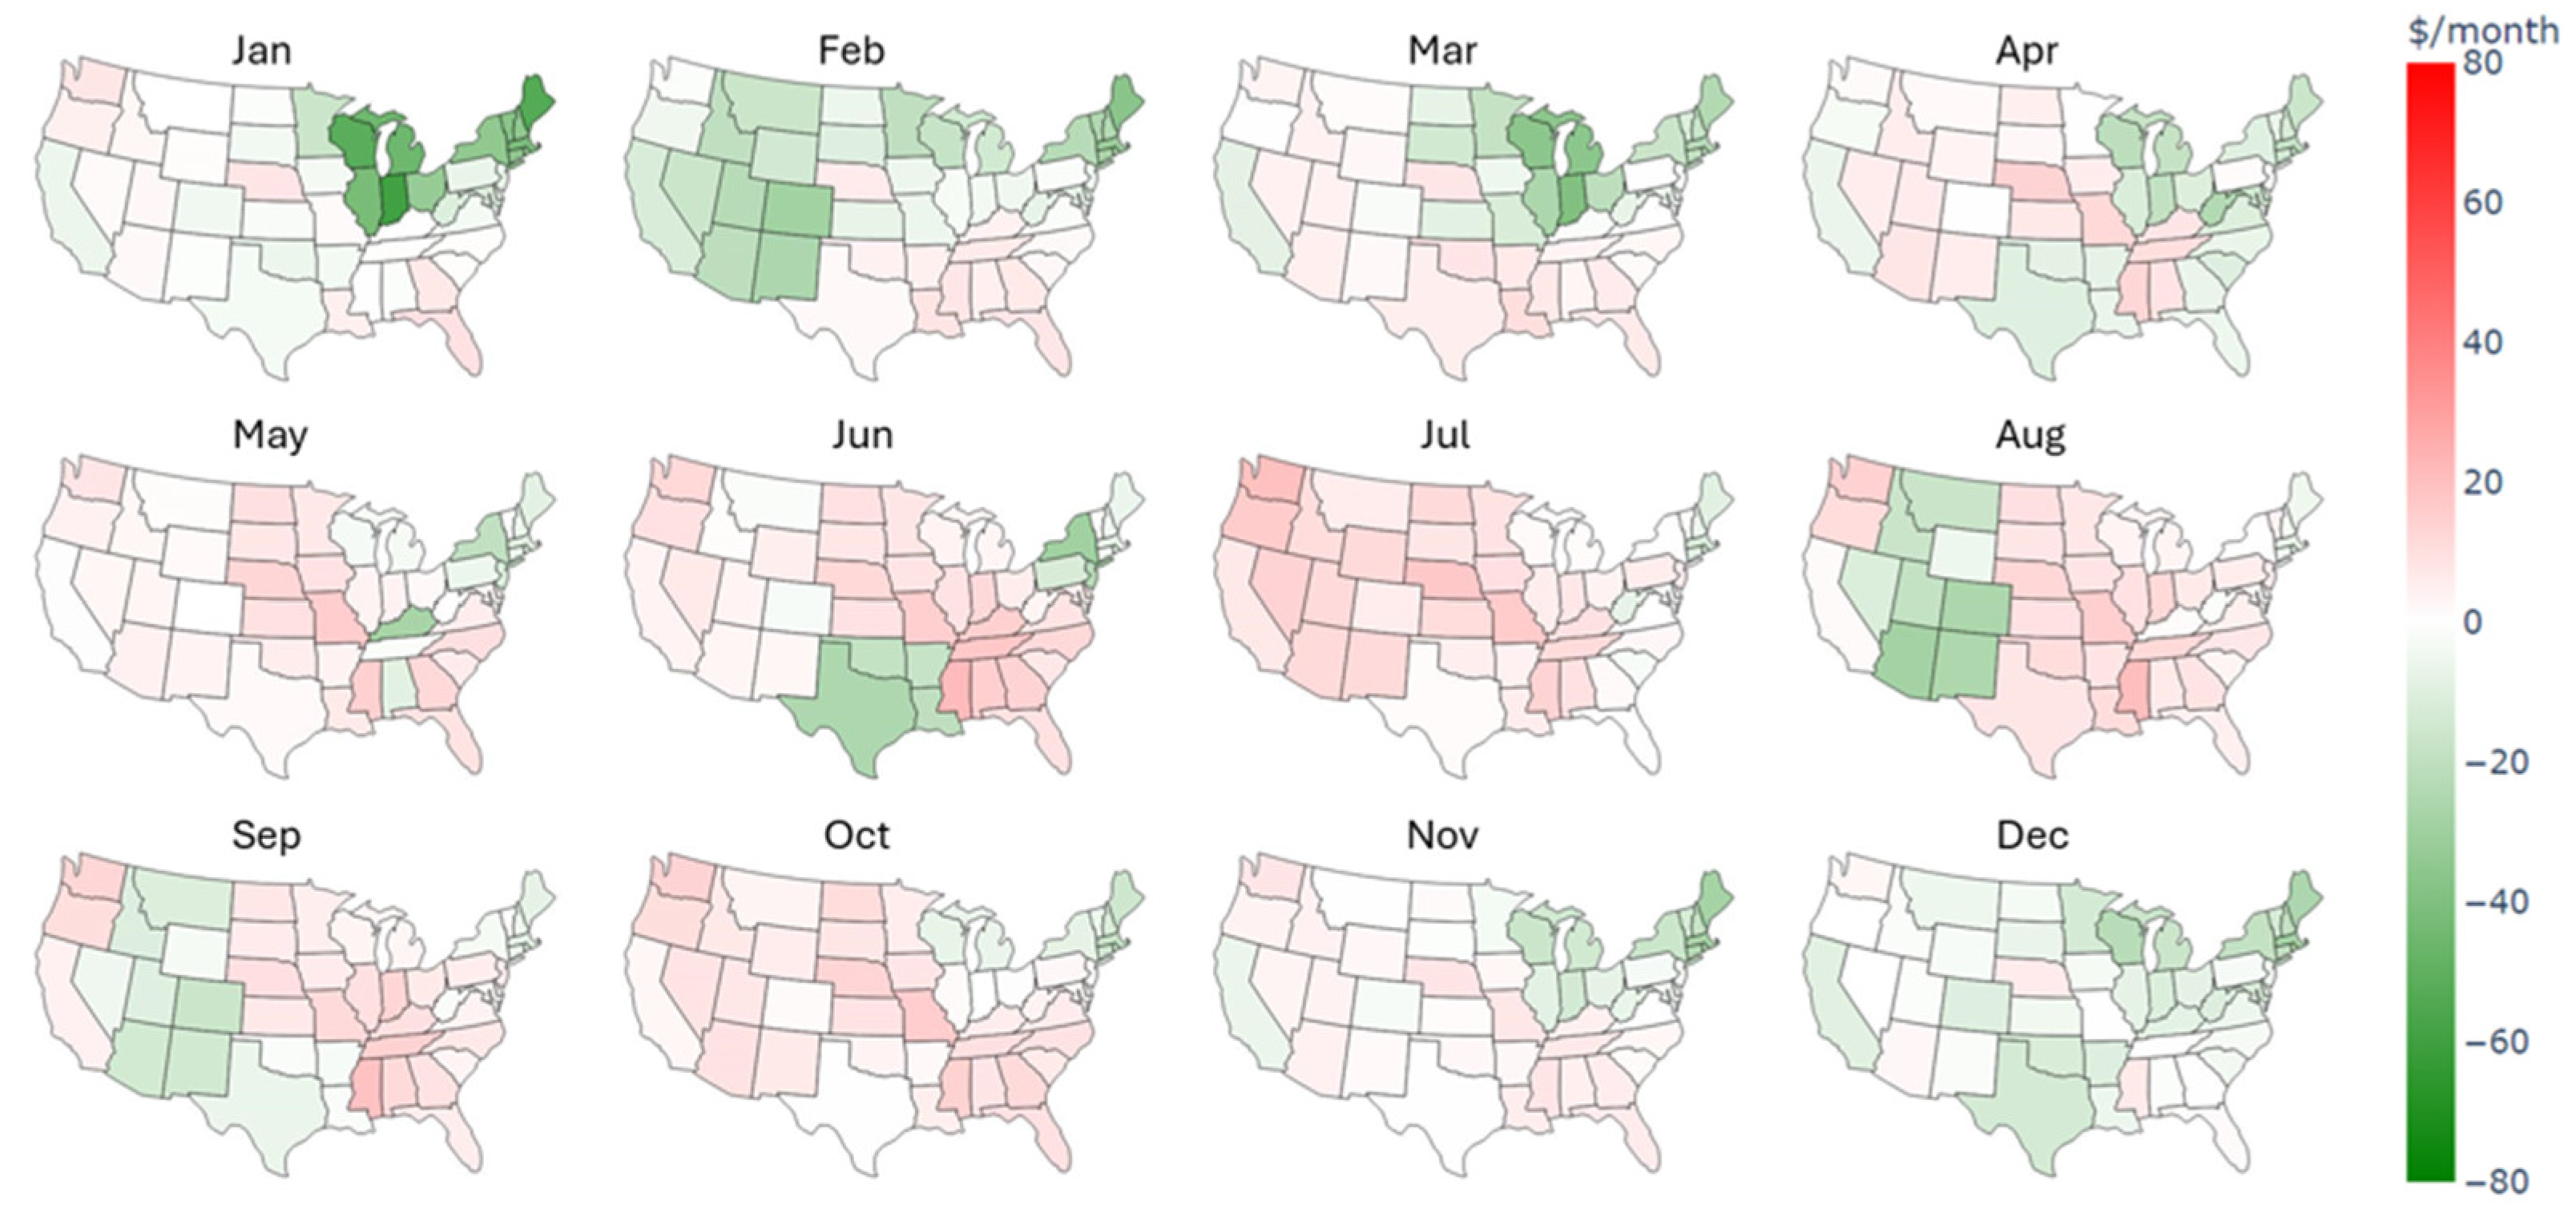
2.5. Operational Costs

State-specific residential and external DCFC electricity prices [53,54], denoted as e p r e s i d e n t i a l S and e p e x t e r n a l S , along with gasoline prices [55], g p S , were employed to finally obtain the monthly operational costs for each scenario. Figure 14 shows the distribution of electricity and gasoline prices in January 2024 across the U.S. The monthly operational costs were then calculated by converting the electricity and gasoline consumed into their respective costs for each scenario.
C B E V M , S = e p r e s i d e n t i a l S E B E V ,   r e s i d e n t i a l M , S + e p e x t e r n a l S E B E V ,   e x t e r n a l M , S
C P H E V M , S = e p r e s i d e n t i a l S E P H E V M , S + g p S G P H E V M , S
C B E V & C o n v M , S = e p r e s i d e n t i a l S E B E V & C o n v M , S + g p S G B E V & C o n v M , S
C H E V M , S = g p S G H E V M , S

3. Results

3.1. Operational Costs in BEV Scenario

Figure 15 shows the monthly costs for the BEV scenario, broken down by month and state. The average monthly operational cost across the nation is USD 56.43, while elements with the highest and the lowest operational cost are January, Indiana, at USD 134.38, and May, Montana, at USD 21.83, respectively. Factors such as long-range trips, cold weather, and high electricity prices contribute to increased costs in specific regions and seasons. For instance, California consistently shows higher monthly costs than neighboring areas, yielding USD 81.45 of average monthly cost, which is 44.33% higher than the national average, primarily due to relatively high residential electricity and gasoline prices. Figure 16 shows the distance driven beyond the BEV range each month and state. Some elements in Figure 15 corresponding to the bright areas in Figure 16 are brighter than neighboring regions, showing the increased charging cost due to the higher rates at DCFC chargers. The impact of long-range trips on operational costs is demonstrated in the Discussion Section.

3.2. Operational Costs in PHEV, BEV and Conv, and HEV Scenarios

Figure 17, Figure 18 and Figure 19 show the differences in the monthly costs of PHEV, BEV and Conv, and HEV scenarios compared to those of the BEV scenarios. Regions and months where corresponding scenarios exhibit less operational costs are indicated as green, and where they require more operational costs are shown as red. The operational costs of the PHEV and BEV and Conv scenarios appear to be comparable to those of the BEV, with PHEVs typically incurring lower expenses than the BEV and Conv scenario. The operational cost difference between the BEV and PHEV ranged from USD −60.83 to USD 21.50, with negative values indicating that PHEV was more economical. For the BEV and Conv scenario, the difference relative to BEV varied from USD −37.22 to USD 38.58. The HEV scenario generally incurred higher operational costs than the BEV scenario, with cost gaps between USD −48.80 and USD 40.74. However, in the New England division, encompassing Connecticut, Maine, Massachusetts, New Hampshire, Rhode Island, and Vermont, the HEV scenario exhibited lower costs despite the absence of long-range trips requiring external charging. This can be attributed to the distribution of residential electricity prices. While California experiences a similar level of high residential electricity costs with New England, as shown in Figure 14, since gasoline prices are also high in California, the HEV option was not competitive in California.

4. Discussion

Detailed regional and seasonal plots in the previous section provided an overview of the impact of long-range trips on operational costs. On the other hand, the effects of climate and energy prices are not clearly distinguished because they are mixed with the influence of long-range trips. This section first compares the results obtained with findings from a previous study. Then, the most economical choices were determined and displayed with their temperature and energy price parameters to analyze those effects.

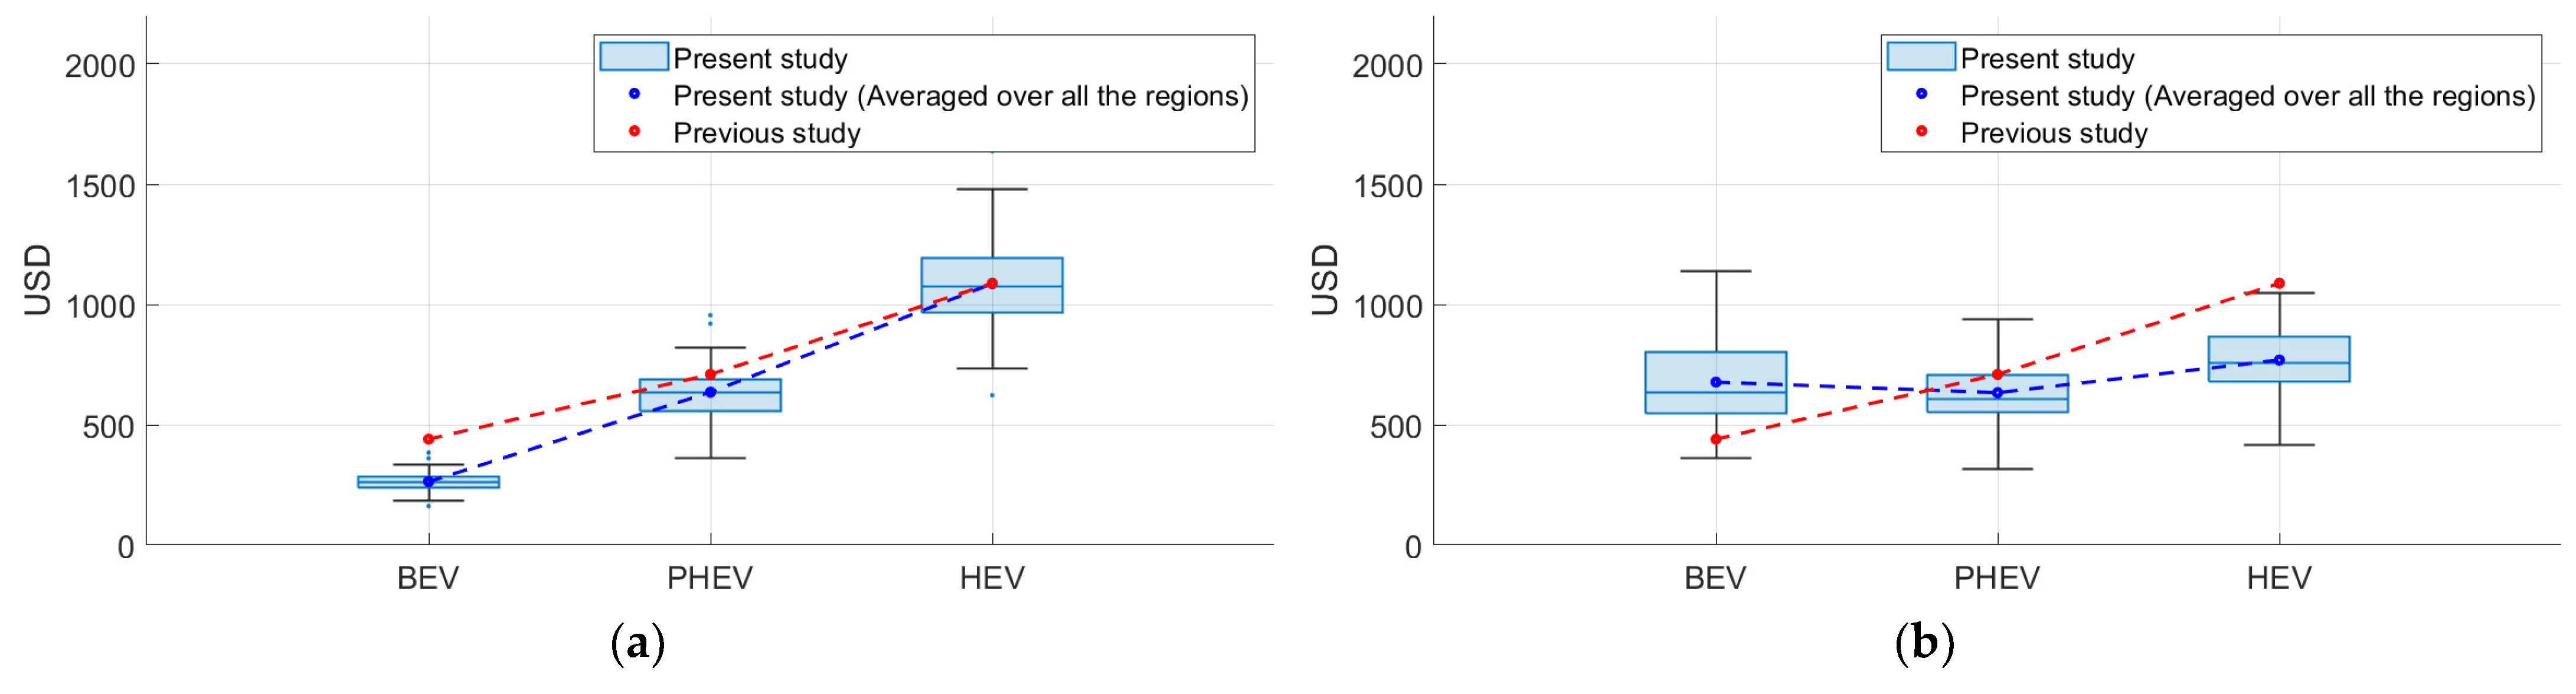
4.1. Comparison of Operational Costs Result with a Previous Study

The TCOs of Kia Niro 2024 were analyzed in [41] regarding Windsor, Ontario, Canada, with three different powertrain options. While [41] focuses on evaluating TCOs with fixed fuel economy and energy prices, it ensures a fair comparison of BEVs, PHEVs, and HEVs by referring to the vehicles on the same platform. Since both [41] and the present study conducted a comparative analysis of these three powertrains, we compared the operational cost results from our study with those of [41]. Considering that the medium electricity price (8.9 cents/kWh) is chosen among low (6.4 cents/kWh), medium (8.9 cents/kWh), and high (13 cents/kWh) in [41], to ensure a fair comparison, residential and DCFC charging prices were adjusted to the low and high prices, respectively. Gasoline prices were also aligned with the values used in [41]. The differences in assumptions are summarized in Table 2.
Figure 20a compares operational cost results under the same assumption of electricity and gasoline prices as the previous study. Although discrepancies in operational costs exist due to differences in vehicle performance, overall values remain consistent. In the present study, regional climate and driving patterns are considered, resulting in a distribution of values rather than a single estimate. In Figure 20b, as the variations in regional electricity and gasoline prices are reflected, the operational cost of BEVs increases significantly, and the regional disparities lead to an expansion in the size of the interquartile box.

4.2. Impact of Seasonal and Regional Factors and Driving Patterns on Cost Competitiveness

In Figure 21, elements where BEV, PHEV, HEV, and BEV and Conv were the most economical choice were indicated as green, blue, yellow, and red, respectively. The elements with long-range trips were again distinguished by PHEVs being the most economical choice. However, even if we set aside the impact of long-distance driving, we can see that most economic choices change depending on the season. For example, in the western U.S. in July and December, the BEV was determined to be the most economical choice in July and the PHEV in December, even though the amount of long-distance driving was similar. Another characteristic point would be the New England division, where HEV has been the most economical choice almost every month.
Each pair of state and month in Figure 21 is represented as a point in Figure 22 with the same color legend. In Figure 22, the x-axes are the temperature of the corresponding region and month, and the y-axes are the ratio of gasoline price to the residential electricity price. Three subplots show the data filtered as having monthly miles below the BEV range, below the BEV range plus 50 miles, and the BEV range plus 100 miles. The last subplot includes all the elements. As seen in Figure 21, the HEV is the most cost-efficient option in the New England region. Specifically, the HEV was the most cost-efficient option in most regions where gasoline’s dollar-per-gallon price is smaller than 13 times the dollar-per-kilowatt-hour price of residential electricity. In other regions, the BEV or PHEV was generally the most cost-efficient option. By comparing the four subplots in Figure 22, it was found that the farther the vehicle is driven beyond the BEV range, the more cost-efficient option PHEV was likely to be. The percentage of elements where the PHEV was the most economical was 8.9% for driving within the BEV range and 15.3% for miles beyond BEV less than 50 miles. This percentage increased to 22.6% for miles beyond the BEV range of less than 100 miles and 35.2% among all elements, respectively.
Furthermore, while the elements where PHEVs were the most economical were clustered in small gasoline–residential electricity price ratios and low-temperature areas for miles beyond the BEV range of less than 100 miles, they were distributed broader beyond that range. Meanwhile, the elements where BEVs were the most economical appeared in high-temperature or high gasoline–residential electricity price areas. This visualization allows for the quantitative confirmation of the qualitatively known vulnerabilities of BEVs in low temperatures and long-distance driving. For example, over 95% of the elements included in segment B, indicated in Figure 23, are where the PHEV is the most economical choice regardless of the daily miles. Likewise, for over 96% of the elements in segment A, HEV exhibited the lowest operational cost. Segment C is initially dominated by BEVs when miles beyond range are small, but as shown in Figure 24, the ratio of PHEV-dominant elements increases up to 17% as the miles beyond the BEV range increase.

5. Conclusions

This study comprehensively analyzes operational costs for different vehicle configurations, considering regional climates, driving patterns, energy prices, and vehicle efficiency in various temperatures. The analysis used an operational cost map of the U.S. for each vehicle to show the variations in operational costs. The specific impact of each factor was discovered by comparing the most economical options by temperature and energy price. By categorizing the 576 elements (48 states and 12 months) into four groups, where BEV, BEV and Conv, PHEV, and HEV were the most economical, and visualizing their distribution, the influence of regional and seasonal factors is demonstrated. Due to the characteristics of each powertrain, the distributed elements could be segmented into three sections, as shown in Figure 23. The HEV and PHEV consistently exhibited the lowest operational cost in segments A and B. In contrast, the most economical option in segment C varied depending on the distance driven beyond the BEV range.
Two possible directions can be considered as a further development of this research. On the one hand, the assumptions on electric chargers can be made more concrete and applied to the analysis. For example, external chargers can be categorized into workplace chargers, private company chargers, etc. In addition, it is possible to consider the different characteristics of charging infrastructure in different regions and convert the time spent on detours to a monetized cost for operation. On the other hand, there could be future studies where the proposed methodology can be applied. By designing a household-level scenario with multiple vehicles, this methodology can be used to analyze the cost of vehicle operation at the household level. Another application of the proposed methodology could be to analyze the operating costs of certain vehicle models on a regional basis, which could provide consumers and stakeholders with more detailed insights. These directions for future research could further support the development of vehicle electrification policies and alternative energy policies, contributing to a more comprehensive understanding of cost-effective and sustainable transportation solutions.
The analysis methodology employed in this study provides a realistic approach to assessing operational costs for different vehicle types. This methodology and findings are expected to contribute to formulating vehicle electrification policies and alternative energy and alternative fuel policies for future vehicles.

Author Contributions

Conceptualization, R.V. and S.-H.H.; methodology, R.V. and K.-H.K.; software, K.-H.K.; validation, R.V., N.K. and K.-H.K.; formal analysis, R.V., K.S. and K.-H.K.; investigation, R.V., K.S. and K.-H.K.; resources, N.K., K.S. and S.-H.H.; data curation, R.V., K.S. and K.-H.K.; writing—original draft preparation, K.-H.K.; writing—review and editing, R.V., N.K. and S.-H.H.; visualization, K.-H.K.; supervision, R.V. and S.-H.H.; project administration, R.V. and N.K.; funding acquisition, R.V. and N.K. All authors have read and agreed to the published version of the manuscript.

Funding

The authors would like to acknowledge the financial support of the Office of Nuclear Energy (NE) within the U.S. Department of Energy (DOE) to conduct this work. The submitted manuscript has been created by UChicago Argonne, LLC, Operator of Argonne National Laboratory (Argonne). Argonne, a U.S. Department of Energy Office of Science laboratory, is operated under Contract No. DE-AC02-06CH11357. The U.S. Government retains for itself, and others acting on its behalf, a paid-up nonexclusive, irrevocable worldwide license in said article to reproduce, prepare derivative works, distribute copies to the public, and perform publicly and display publicly, by or on behalf of the Government.

Data Availability Statement

The raw data supporting the conclusions of this article will be made available by the authors upon request.

Acknowledgments

The authors would like to acknowledge Argonne National Laboratory for supporting this work. Related ongoing efforts at Argonne include the development of thermal management models in Autonomie to improve energy consumption and range estimation under varying ambient temperatures, as well as a broader study using TechScape to evaluate the national-level impact of regional, climatic, and operational patterns on vehicle energy use across different classes, including not only light-duty vehicles, which are the focus of the present study, but also mediumduty and heavy-duty vehicles.

Conflicts of Interest

The authors declare no conflicts of interest.

References

  1. Global EV Outlook 2024. Available online: https://www.iea.org/reports/global-ev-outlook-2024 (accessed on 17 December 2024).
  2. More Americans Would Buy an Electric Vehicle, and Some Consumers Would Use Low-Carbon Fuels, Survey Shows—Consumer Reports. Available online: https://www.consumerreports.org/cars/hybrids-evs/interest-in-electric-vehicles-and-low-carbon-fuels-survey-a8457332578/ (accessed on 17 December 2024).
  3. How Americans View Electric Vehicles. Available online: https://www.pewresearch.org/short-reads/2023/07/13/how-americans-view-electric-vehicles/ (accessed on 17 December 2024).
  4. Piao, N.; Gao, X.; Yang, H.; Guo, Z.; Hu, G.; Cheng, H.-M.; Li, F. Challenges and Development of Lithium-Ion Batteries for Low Temperature Environments. eTransportation 2022, 11, 100145. [Google Scholar] [CrossRef]
  5. Aris, A.M.; Shabani, B. An Experimental Study of a Lithium Ion Cell Operation at Low Temperature Conditions. Energy Procedia 2017, 110, 128–135. [Google Scholar] [CrossRef]
  6. Luo, H.; Wang, Y.; Feng, Y.-H.; Fan, X.-Y.; Han, X.; Wang, P.-F. Lithium-Ion Batteries under Low-Temperature Environment: Challenges and Prospects. Materials 2022, 15, 8166. [Google Scholar] [CrossRef] [PubMed]
  7. Delos Reyes, J.R.M.; Parsons, R.V.; Hoemsen, R. Winter Happens: The Effect of Ambient Temperature on the Travel Range of Electric Vehicles. IEEE Trans. Veh. Technol. 2016, 65, 4016–4022. [Google Scholar] [CrossRef]
  8. Dost, P.; Spichartz, P.; Sourkounis, C. Temperature Influence on State-of-the-Art Electric Vehicles’ Consumption Based on Fleet Measurements. In Proceedings of the 2015 International Conference on Electrical Systems for Aircraft, Railway, Ship Propulsion and Road Vehicles (ESARS), IEEE, Aachen, Germany, 3–5 March 2015; pp. 1–6. [Google Scholar]
  9. Al-Wreikat, Y.; Serrano, C.; Sodré, J.R. Effects of Ambient Temperature and Trip Characteristics on the Energy Consumption of an Electric Vehicle. Energy 2022, 238, 122028. [Google Scholar] [CrossRef]
  10. Steinstraeter, M.; Heinrich, T.; Lienkamp, M. Effect of Low Temperature on Electric Vehicle Range. World Electr. Veh. J. 2021, 12, 115. [Google Scholar] [CrossRef]
  11. Szumska, E.M.; Jurecki, R.S. Parameters Influencing on Electric Vehicle Range. Energies 2021, 14, 4821. [Google Scholar] [CrossRef]
  12. Seo, J.; Vijayagopal, R.; Kim, N.; Rousseau, A.; Stutenberg, K. Effects of Ambient Temperature on Electric Vehicle Range Considering Battery Performance, Powertrain Efficiency, and HVAC Load. Energy Convers. Manag. 2025, 326, 119493. [Google Scholar] [CrossRef]
  13. How Much Does It Cost to Charge an Electric Car?—Kelley Blue Book. Available online: https://www.kbb.com/car-advice/how-much-does-it-cost-to-charge-an-ev/ (accessed on 5 June 2024).
  14. Wang, N.; Liu, Y.; Fu, G.; Li, Y. Cost–Benefit Assessment and Implications for Service Pricing of Electric Taxies in China. Energy Sustain. Dev. 2015, 27, 137–146. [Google Scholar] [CrossRef]
  15. Bauer, G.S.; Greenblatt, J.B.; Gerke, B.F. Cost, Energy, and Environmental Impact of Automated Electric Taxi Fleets in Manhattan. Environ. Sci. Technol. 2018, 52, 4920–4928. [Google Scholar] [CrossRef]
  16. Li, B.; Szeto, W.Y.; Zou, L. Optimal Fare and Fleet Size Regulation in a Taxi/Ride-Sourcing Market with Congestion Effects, Emission Externalities, and Gasoline/Electric Vehicles. Transp. Res. Part. A Policy Pract. 2022, 157, 215–243. [Google Scholar] [CrossRef]
  17. Wang, N.; Fu, G.; Li, Y.; Gong, Z. Economy Benefit and Business Operating Service Pricing Model of Electric Taxi. Tongji Daxue Xuebao/J. Tongji Univ. 2014, 42, 976–982. [Google Scholar]
  18. Bushnell, J.; Muehlegger, E.; Rapson, D. Energy Prices and Electric Vehicle Adoption; National Bureau of Economic Research: Cambridge, MA, USA, 2022. [Google Scholar]
  19. Chen, X.; Lei, Z.; Ukkusuri, S.V. Modeling the Influence of Charging Cost on Electric Ride-Hailing Vehicles. Transp. Res. Part. C Emerg. Technol. 2024, 160, 104514. [Google Scholar] [CrossRef]
  20. Miao, R.; Guo, P.; Huang, W.; Li, Q.; Zhang, B. Profit Model for Electric Vehicle Rental Service: Sensitive Analysis and Differential Pricing Strategy. Energy 2022, 249, 123736. [Google Scholar] [CrossRef]
  21. Borlaug, B.; Salisbury, S.; Gerdes, M.; Muratori, M. Levelized Cost of Charging Electric Vehicles in the United States. Joule 2020, 4, 1470–1485. [Google Scholar] [CrossRef]
  22. Nehiba, C. Electric Vehicle Usage, Pollution Damages, and the Electricity Price Elasticity of Driving. J. Environ. Econ. Manag. 2024, 124, 102915. [Google Scholar] [CrossRef] [PubMed]
  23. Fetene, G.M.; Kaplan, S.; Mabit, S.L.; Jensen, A.F.; Prato, C.G. Harnessing Big Data for Estimating the Energy Consumption and Driving Range of Electric Vehicles. Transp. Res. D Transp. Environ. 2017, 54, 1–11. [Google Scholar] [CrossRef]
  24. Van Haaren, R. Assessment of Electric Cars’ Range Requirements and Usage Patterns Based on Driving Behavior Recorded in the National Household Travel Survey of 2009. Earth Environ. Eng. Dep. Columbia Univ. Fu Found. Sch. Eng. Appl. Sci. New York 2011, 51, 53. [Google Scholar]
  25. Yang, D.; Liu, H.; Li, M.; Xu, H. Data-Driven Analysis of Battery Electric Vehicle Energy Consumption under Real-World Temperature Conditions. J. Energy Storage 2023, 72, 108590. [Google Scholar] [CrossRef]
  26. Belloni, E.; Bertolini, V.; Faba, A.; Scorretti, R.; Raschi, E.; Cardelli, E. Seasonal Effects on EV Charging Performance and Power Consumption Under Real Traffic Conditions: A Case Study in Umbria Region, Italy. In Proceedings of the 2023 IEEE Vehicle Power and Propulsion Conference (VPPC), Milan, Italy, 24–27 October 2023; IEEE: Piscataway, NJ, USA; pp. 1–6. [Google Scholar]
  27. Rachna; Singh, A. K. Analyzing Electric Vehicle Performance Considering Smooth Roads with Seasonal Variation. Electr. Eng. 2024. [Google Scholar] [CrossRef]
  28. Perugu, H.; Collier, S.; Tan, Y.; Yoon, S.; Herner, J. Characterization of Battery Electric Transit Bus Energy Consumption by Temporal and Speed Variation. Energy 2023, 263, 125914. [Google Scholar] [CrossRef]
  29. Lee, G.; Song, J.; Lim, Y.; Park, S. Energy Consumption Evaluation of Passenger Electric Vehicle Based on Ambient Temperature under Real-World Driving Conditions. Energy Convers. Manag. 2024, 306, 118289. [Google Scholar] [CrossRef]
  30. Dominguez-Jimenez, J.A.; Campillo, J.E.; Montoya, O.D.; Delahoz, E.; Hernández, J.C. Seasonality Effect Analysis and Recognition of Charging Behaviors of Electric Vehicles: A Data Science Approach. Sustainability 2020, 12, 7769. [Google Scholar] [CrossRef]
  31. Hao, X.; Wang, H.; Lin, Z.; Ouyang, M. Seasonal Effects on Electric Vehicle Energy Consumption and Driving Range: A Case Study on Personal, Taxi, and Ridesharing Vehicles. J. Clean. Prod. 2020, 249, 119403. [Google Scholar] [CrossRef]
  32. Ching, T.W.; Cheong, T.H. Cost Analysis of Electric Vehicles in Macau. In Proceedings of the IEEE 2013 Tencon—Spring, Sydney, NSW, Australia, 17–19 April 2013; IEEE: Piscataway, NJ, USA; pp. 342–346. [Google Scholar]
  33. Rangaraju, S.; De Vroey, L.; Messagie, M.; Mertens, J.; Van Mierlo, J. Impacts of Electricity Mix, Charging Profile, and Driving Behavior on the Emissions Performance of Battery Electric Vehicles: A Belgian Case Study. Appl. Energy 2015, 148, 496–505. [Google Scholar] [CrossRef]
  34. Gil Ribeiro, C.; Silveira, S. The Impact of Financial Incentives on the Total Cost of Ownership of Electric Light Commercial Vehicles in EU Countries. Transp. Res. Part. A Policy Pract. 2024, 179, 103936. [Google Scholar] [CrossRef]
  35. Ayetor, G.K.; Nyarko, F.K.; Andoh, P.Y. Achieving Cost Parity for Battery Electric Vehicles in Africa: A Case Study of Ghana. Transp. Lett. 2024, 16, 144–156. [Google Scholar] [CrossRef]
  36. Suttakul, P.; Wongsapai, W.; Fongsamootr, T.; Mona, Y.; Poolsawat, K. Total Cost of Ownership of Internal Combustion Engine and Electric Vehicles: A Real-World Comparison for the Case of Thailand. Energy Rep. 2022, 8, 545–553. [Google Scholar] [CrossRef]
  37. Franzò, S.; Nasca, A.; Chiesa, V. Factors Affecting Cost Competitiveness of Electric Vehicles against Alternative Powertrains: A Total Cost of Ownership-Based Assessment in the Italian Market. J. Clean. Prod. 2022, 363, 132559. [Google Scholar] [CrossRef]
  38. Yuksel, T.; Michalek, J.J. Effects of Regional Temperature on Electric Vehicle Efficiency, Range, and Emissions in the United States. Environ. Sci. Technol. 2015, 49, 3974–3980. [Google Scholar] [CrossRef]
  39. Khan, M.; Kockelman, K.M. Predicting the Market Potential of Plug-in Electric Vehicles Using Multiday GPS Data. Energy Policy 2012, 46, 225–233. [Google Scholar] [CrossRef]
  40. Wu, X.; Dong, J.; Lin, Z. Cost Analysis of Plug-in Hybrid Electric Vehicles Using GPS-Based Longitudinal Travel Data. Energy Policy 2014, 68, 206–217. [Google Scholar] [CrossRef]
  41. Soszynska, P.; Saleh, H.; Kar, H.; Iyer, L.V.; Viana, C.; Kar, N.C. Driving the Future: An Analysis of Total Cost of Ownership for Electrified Vehicles in North America. World Electr. Veh. J. 2024, 15, 492. [Google Scholar] [CrossRef]
  42. National Household Travel Survey. Available online: https://nhts.ornl.gov/assets/2022/download/csv.zip (accessed on 6 June 2024).
  43. Office of Highway Policy Information. Available online: https://www.fhwa.dot.gov/policyinformation/travel_monitoring/tvt.cfm (accessed on 6 June 2024).
  44. Jeong, J.; Choi, S.; Kim, N.; Lee, H.; Stutenberg, K.; Rousseau, A. Model Validation of the Chevrolet Volt 2016. SAE Tech. Pap. 2018. [Google Scholar] [CrossRef]
  45. Jeong, J.; Kim, N.; Stutenberg, K.; Rousseau, A. Analysis and Model Validation of the Toyota Prius Prime. SAE Tech. Pap. 2019. [Google Scholar] [CrossRef]
  46. Stutenberg, K.; Kim, N.; Russo, D.M.; Islam, E.; Kim, K.; Lohse-Busch, H.; Rousseau, A.; Vijayagopal, R. Vehicle Technology Assessment, Model Development and Validation of a 2018 Toyota Camry XLE With a 2.5L I4 and 8-Speed Automatic Transmission; National Highway Traffic Safety Administration: Washington, DC, USA, 2021. [Google Scholar]
  47. Stutenberg, K.; Kim, N.; Cho, J.E.; Hughley, J.; Iliev, S.; Vijayagopal, R. Vehicle Technology Assessment, Model Development, and Validation of a 2021 Hyundai Sonata Hybrid; National Highway Traffic Safety Administration: Washington, DC, USA, 2023. [Google Scholar]
  48. Stutenberg, K.; Dupont, B.; Di Russo, M.; Kim, N.; Vijayagopal, R. Vehicle Technology Assessment, Model Development, and Validation of a 2020 Tesla Model 3 AWD; National Highway Traffic Safety Administration: Washington, DC, USA, 2023. [Google Scholar]
  49. Jehlik, F.; Nieto Prada, D.; Kim, N.; Stutenberg, K.; Vijayagopal, R. Vehicle Technology Assessment, Model Development, and Validation of a 2020 Chevrolet Bolt; National Highway Traffic Safety Administration: Washington, DC, USA, 2023. [Google Scholar]
  50. Text Version of the Electric Vehicle Label | US EPA. Available online: https://www.epa.gov/fueleconomy/text-version-electric-vehicle-label (accessed on 15 February 2025).
  51. Certification and Fuel Economy for Light-Duty Passenger Cars and Trucks | US EPA. Available online: https://www.epa.gov/ve-certification/certification-and-fuel-economy-light-duty-passenger-cars-and-trucks (accessed on 15 February 2025).
  52. Find and Compare Cars. Available online: https://fueleconomy.gov/feg/findacar.shtml (accessed on 15 February 2025).
  53. U.S. Energy Information Administration—EIA—Independent Statistics and Analysis. Available online: https://www.eia.gov/electricity/data/browser/ (accessed on 22 October 2024).
  54. EV Charging Pricing Trends. Available online: https://stable.auto/insights/electric-vehicle-charger-price-by-state (accessed on 30 April 2024).
  55. State Gas Price Averages. Available online: https://gasprices.aaa.com/state-gas-price-averages/ (accessed on 31 January 2024).
Figure 1. A step-by-step process for the estimation of operational costs.
Sustainability 17 03282 g001
Figure 2. Vehicle configurations in four scenarios.
Sustainability 17 03282 g002
Figure 3. Distribution of trip distances across the U.S.
Sustainability 17 03282 g003
Figure 4. Monthly distribution of miles driven by regions under 200 miles. (a) East South Central Division. (b) Mountain Division.
Sustainability 17 03282 g004
Figure 5. Average annual VMT per vehicle by state.
Sustainability 17 03282 g005
Figure 6. Net traffic volumes by state over a year.
Sustainability 17 03282 g006
Figure 7. Distribution of annual traffic volume normalized per state.
Sustainability 17 03282 g007
Figure 8. Vehicle performance variation by temperature (BEV and PHEV in the CD mode): (a) electricity consumption of BEV and PHEV in the CD mode; (b) usable battery energy of BEV and PHEV; (c) range of BEV and PHEV in the CD mode.
Sustainability 17 03282 g008
Figure 9. Vehicle performance variation by temperature (PHEV, HEV, and Conv): (a) gasoline consumption of PHEV in the CD mode; (b) fuel economy of PHEV in the CS mode, HEV, and Conv.
Sustainability 17 03282 g009
Figure 10. Cold start effect of BEV, PHEV, and Conv.
Sustainability 17 03282 g010
Figure 11. Miles covered by BEV range.
Sustainability 17 03282 g011
Figure 12. Miles covered by the PHEV range.
Sustainability 17 03282 g012
Figure 13. Miles driven by BEV and Conv in the BEV and Conv scenario.
Sustainability 17 03282 g013
Figure 14. Electricity and gasoline prices in Jan 2024 across the U.S.
Sustainability 17 03282 g014
Figure 15. Monthly costs in the BEV scenario.
Sustainability 17 03282 g015
Figure 16. Miles beyond BEV range.
Sustainability 17 03282 g016
Figure 17. Monthly costs in the PHEV scenario.
Sustainability 17 03282 g017
Figure 18. Monthly costs in the BEV and Conv scenario.
Sustainability 17 03282 g018
Figure 19. Monthly costs in the HEV scenario.
Sustainability 17 03282 g019
Figure 20. Comparison of operational costs between the present study and the previous study [41]: (a) result obtained with electricity and gasoline prices adjusted to the assumption from the previous study; (b) result obtained with varying electricity and gasoline prices by regions.
Sustainability 17 03282 g020
Figure 21. Choice of vehicles for the least operational costs (U.S. map).
Sustainability 17 03282 g021
Figure 22. Choice of vehicles for the least operational costs (scatter plot).
Sustainability 17 03282 g022
Figure 23. Segmentation of the regional and seasonal elements.
Sustainability 17 03282 g023
Figure 24. Change in the ratio of dominant powertrains in segment C.
Sustainability 17 03282 g024
Table 1. Vehicle specs [52] and 0 °F test availabilities.
NameVehicleCabin Volume (ft3)EPA Fuel Economy (MPG(e))0 °F Test Data
BEV12020 Tesla Model 3112121Available
BEV22020 Chevrolet Bolt111118Available
PHEV12017 Toyota Prius Prime111133Available
PHEV22016 Chevrolet Volt109106Not available
HEV2021 Hyundai Sonata Hybrid12147Not available
Conv2018 Toyota Camry11426Not available
Table 2. Assumptions adopted in the present study and [41].
AssumptionsPresent Study[41]
Annual VMT6007–17,378 miles12,400 miles
Fuel economyDepends on the temperatureOEM information
Electricity pricesUSD 0.10/kWh–USD 0.31/kWh (residential) *
USD 0.17/kWh–USD 0.54/kWh (DCFC) *
USD 0.09/kWh
Gasoline priceUSD 2.69/gal–USD 4.54/gal **USD 4.28/gal
VehicleBEV2020 Tesla Model 3 and 2020 Chevrolet Bolt2024 Kia Niro EV Wind
PHEV2017 Toyota Prius Prime and 2016 Chevrolet Volt2024 Kia Niro PHEV EX
HEV2021 Hyundai Sonata2024 Kia Niro HEV LX
* For comparison, residential and DCFC electricity prices were adjusted to USD 0.064/kWh and USD 0.13/kWh, respectively. ** Gasoline price was adjusted to USD 4.28/gal for comparison.
Disclaimer/Publisher’s Note: The statements, opinions and data contained in all publications are solely those of the individual author(s) and contributor(s) and not of MDPI and/or the editor(s). MDPI and/or the editor(s) disclaim responsibility for any injury to people or property resulting from any ideas, methods, instructions or products referred to in the content.

