Article

A Scenario-Based Approach to Using Electric Vehicle Batteries in Virtual Power Plants: Insights from Environmental, Social, and Governance and Monte Carlo Simulations

by
Seungryong Choi
1 and
Keuntae Cho
2,*
1
Graduate School of Management of Technology, Sungkyunkwan University, Suwon 16419, Republic of Korea
2
Department of Systems Management Engineering & Graduate School of Management of Technology, Sungkyunkwan University, Suwon 16419, Republic of Korea
*
Author to whom correspondence should be addressed.
Sustainability 2025, 17(7), 3224; https://doi.org/10.3390/su17073224
Submission received: 4 March 2025 / Revised: 27 March 2025 / Accepted: 3 April 2025 / Published: 4 April 2025

Abstract

:
The intensified global focus on the energy transition and sustainability has increased the drive to leverage electric vehicle (EV) batteries as virtual power plant (VPP) resources. However, uncertainties and governance factors associated with this integration have not been systematically researched. This study aimed to identify and evaluate the key uncertainties surrounding the deployment of EV batteries in VPPs and propose strategic responses from an ESG perspective. We adopted a mixed-methods approach using scenario planning to identify critical uncertainties. The approach included quantitative assessments using Monte Carlo simulations and a scenario matrix to incorporate ESG elements into future projections. The findings highlighted economic value volatility (E: 13.37%), employment creation potential and sustainability (S: 10.68%), and increased transparency requirements (G: 8.60%) as the most influential uncertainty factors based on the simulation results. These variables formed the basis for selecting three core drivers for scenario construction. Four distinct scenarios were identified. By proposing tailored response strategies for each scenario, this study suggests that the long-term sustainability of EV batteries and VPP industries can be bolstered in various potential future environments. Integrating ESG factors into a scenario analysis helps decision-making in industries characterized by high uncertainty. The study offers strategies that embed ESG considerations to support the sustainability of EV batteries and VPP sectors and provides valuable insights for shaping policies, industrial strategies, and corporate ESG initiatives.

1. Introduction

Major countries, including Korea, aim to enhance their energy supply efficiency and achieve significant greenhouse gas reductions by 2050 [1]. Many nations are expanding renewable energy to meet carbon neutrality targets, yet intermittency remains a challenge for power supply stability [2]. In response, virtual power plants (VPPs)—which integrate and manage distributed energy resources (DERs)— have emerged as a critical technology for addressing the intermittency of renewable energy [3,4]. Although demand response (DR)-based VPPs are currently deployed in some industrial sectors [5], resource availability has declined amid industrial restructuring and economic uncertainty. Consequently, electric vehicle (EV) batteries, enabled by vehicle-to-grid (V2G) technology, are gaining attention as alternative VPP assets to complement fluctuating renewables and improve grid stability [6].
Many countries are advancing EV battery integration into VPPs [7]. The United States (via FERC Order No. 2222) and the European Union (“Clean Energy for All Europeans”) have established frameworks that encourage small-scale DER participation, thus laying the groundwork for EV-based VPP operations. In contrast, other nations (e.g., Korea) remain in earlier stages, requiring policy and institutional development. Given the increasing complexity of energy transitions and sustainability challenges, traditional market-driven decision-making focused primarily on short-term cost-effectiveness is no longer sufficient. Instead, environmental, social, and governance (ESG) considerations must be prioritized because they directly influence public acceptance, regulatory compliance, and the equitable distribution of benefits, all of which are essential for the long-term viability and resilience of EV battery-based VPP operations [8]. In particular, governance factors such as transparency and social factors including public acceptance are critical in ensuring community support and mitigating potential conflicts or societal backlash associated with new technologies [9].
Nevertheless, existing studies still focus on the technical feasibility and short-term efficiency (e.g., real-time scheduling, DR programs), overlooking broader and longer-term factors such as policy uncertainties, social acceptance, and the role of transparency in shaping public trust. This highlights the necessity for an integrated analytical framework that explicitly incorporates ESG factors, ensuring that EV–VPP integration strategies are robust under various long-term uncertainty scenarios.
Accordingly, this study assumes that EV batteries can serve as VPP resources for both grid stability and carbon neutrality [10], and seeks to systematically identify the uncertainties in EV–VPP integration from an ESG perspective. We propose future scenarios and response strategies by applying a mixed-methods approach combining scenario planning, Monte Carlo simulations, and scenario matrices [11,12]. This design captures key ESG elements (economic feasibility, social acceptance, transparency requirements) and derives practical insights for EV battery and VPP policies and industrial strategies, ultimately contributing to an ESG-focused sustainable energy transition. The remainder of this paper is organized as follows: Section 2 reviews the relevant literature and identifies research gaps. Section 3 presents the research design and methodology in detail. Section 4 reports the simulation results, while Section 5 discusses the interpretation of the derived scenarios and their strategic implications from an ESG perspective. Finally, Section 6 concludes the study and offers suggestions for future research.

2. Literature Review

2.1. EV Batteries in VPPs: Major Benefits and Current Research

Integrating electric vehicle (EV) batteries into virtual power plants (VPPs) provides several advantages. First, EV batteries enhance grid stability by storing excess renewable energy and releasing it during peak demand periods [6]. Second, EV owners can achieve economic benefits through participation in electricity markets or demand response (DR) programs, such as peak shaving and frequency regulation [13]. Third, by aggregating numerous EV batteries, VPPs can leverage a large-scale flexible resource without the need to construct additional central power plants [14], thereby reducing carbon emissions and infrastructure costs. Fourth, recent studies highlight the potential of incorporating EV mobility patterns into ancillary service design, enabling real-time coordination between EV charging behavior and grid needs to unlock additional flexibility and support system-level stability [15]. These benefits align with global carbon neutrality objectives and promote eco-friendly mobility by linking transportation electrification with power sector decarbonization [10]. Despite these advantages, prior research has primarily focused on technical optimization and short-term efficiency [16,17,18]. For example, Qureshi et al. [16] combined neural networks with convex optimization to reduce grid volatility, while Li et al. [17] developed a real-time DR program supporting China’s carbon neutrality goals. Although these studies offer practical solutions, they inadequately address long-term policy uncertainties, EV battery price volatility, and social acceptance issues. Wang et al. [18] integrated wind power with EV batteries to enhance grid stability but did not consider battery lifespan and cost variability. Similarly, Zhou et al. [19] examined EV charging/discharging and frequency resource allocation but neglected policy incentives and social acceptance. Consequently, the comprehensive ESG sustainability incorporating economic feasibility, social acceptance, and governance elements such as the transparency of EV battery-based VPP operations remains insufficiently explored.
Short-term optimization methods, while effective for immediate industrial applications, fail to fully capture the essential governance and social factors critical for long-term energy transitions. Harsh et al. [20] highlighted the necessity of policy strategies when integrating solar generation, battery storage, and controllable loads. Adhikari et al. [21] emphasized the importance of policy support and social acceptance in widespread EV adoption. Governance factors such as transparency significantly influence public trust and regulatory compliance [9] but remain insufficiently explored in current models. Therefore, a more integrated approach explicitly addressing these ESG elements through scenario-based methods is necessary to enhance the feasibility and long-term sustainability of EV-VPP adoption [22].

2.2. Scenario-Based Approach vs. Traditional Methods

Traditional EV battery evaluation methods primarily rely on deterministic models such as cost–benefit analyses focusing on short-term feasibility metrics [23] (e.g., payback period, levelized cost of electricity [LCOE]). While useful, these approaches overlook critical uncertainties related to policy changes, market price volatility, and technological innovations. Scenario-based methodologies, in contrast, enable researchers to
  • Identify and analyze various plausible futures based on critical uncertainties (e.g., government incentives, battery costs, and ESG regulations);
  • Evaluate qualitative dimensions, including social acceptance and employment creation potential;
  • Incorporate probabilistic analyses (such as Monte Carlo simulation) for more robust decision-making.
Thus, scenario planning expands the analytical horizons beyond static parameters, allowing stakeholders to proactively prepare for diverse future possibilities. Compared to traditional methods, scenario planning emphasizes
  • Interactions between social/governance factors (e.g., transparency) and techno-economic variables;
  • The identification of “tail events” that could substantially alter EV battery economics;
  • The provision of a structured framework for policymakers and industry stakeholders to formulate long-term strategies rather than concentrating solely on short-term returns on investment (ROIs).

2.3. Combining Scenario Planning with Monte Carlo Simulation

Scenario planning is a qualitative analytical technique commonly used for forecasting, strategic planning, and identifying variables in uncertain environments [24]. It has been applied to EV-VPP integration to account for uncertainties in technological advancement, policy dynamics, and market prices [25,26,27]. Chen et al. [25] combined Delphi techniques with scenario planning to derive policy response strategies, while Fathi [26] and Mietzner and Reger [27] highlighted the value of scenario planning in strategic decision-making, despite the reliance on expert opinions [28].
Monte Carlo simulation is a quantitative method that estimates future outcomes by defining probability distributions for uncertain variables and repeatedly generating diverse scenarios [11]. This method complements scenario planning’s qualitative approach, especially in sustainability-driven contexts requiring rigorous risk assessment [29]. Zhu et al. [30] applied Monte Carlo simulation to forecast carbon emissions under various policy scenarios, and Prakash et al. [31] integrated scenario planning with Monte Carlo analysis to evaluate service quality gaps. In the EV-VPP context, Monte Carlo simulation effectively incorporates policy variations, market dynamics, and technological advances, thereby improving forecast precision [29]. Yet, to ensure reliability, careful calibration of input data, particularly for long-term variables such as EV battery prices, lifespan, and adoption rates, is essential. Integrating real-world data on policy trends and technological innovations further enables comprehensive long-term strategy formulation.

2.4. Research Gap and Research Questions

As highlighted previously, existing studies have emphasized technical efficiency and short-term operational strategies, often overlooking critical long-term uncertainties such as policy dynamics, battery cost volatility, social acceptance, and ESG requirements [9,22]. Few studies have systematically integrated an ESG-oriented scenario analysis with probabilistic modeling methods. Given the growing complexity of energy transitions and the significance of sustainability governance, advanced strategic decision-making frameworks beyond purely techno-economic analyses are urgently required. To address this gap, this study proposes a hybrid scenario-based approach that explicitly integrates governance elements (e.g., transparency) and social considerations (e.g., employment creation and public acceptance) with Monte Carlo simulation.
The research aims to answer the following questions:
  • What are the critical uncertainties—technological, policy-related, and social—surrounding EV battery utilization in VPPs from an ESG perspective?
  • How can scenario planning combined with Monte Carlo simulation support strategic decision-making under long-term uncertainties?
  • What policy and business strategies are most effective at achieving ESG-oriented outcomes across various future scenarios?
These research questions will be addressed through a structured mixed-methods approach combining scenario planning, Monte Carlo simulations, and scenario matrices, as elaborated in detail in Section 3.

3. Methods

The integration of EV batteries into virtual power plants (VPPs) presents significant potential but is accompanied by substantial uncertainty across the policy, economic, and social domains. Addressing these uncertainties is essential for supporting sustainable deployment and effective decision-making. To that end, this study adopts a structured, multi-phase methodology that combines scenario planning with probabilistic simulation. Expert input is incorporated through semi-structured interviews, Delphi rounds, and a targeted survey to identify and refine key uncertainty factors [32]. This approach reduces subjective bias and enhances the robustness of the input variables. Additionally, Monte Carlo simulations are applied to quantitatively assess the impacts of selected uncertainties, enabling the development of future scenarios that reflect both technical dynamics and ESG considerations.

3.1. Research Procedure

This study followed a multi-stage research procedure to identify and assess the key uncertainties associated with the integration of electric vehicle (EV) batteries into virtual power plants (VPPs), as illustrated in Figure 1. In Stage 1, a PEST framework was extended to include ESG criteria, resulting in a PEST-ESG analytical approach for identifying political, economic, social, technological, and governance-related uncertainty factors [33,34]. Stages 2 and 3 applied a qualitative expert-based method, employing semi-structured interviews and the Delphi technique with 17 experts from government, public institutions, and industry to derive and refine the initial set of uncertainty factors [35,36,37,38,39,40]. In Stage 4, a structured survey using a three-point scale was conducted with an expanded panel of 50 experts to prioritize the uncertainty factors based on their relevance and ESG significance [40,41,42]. This iterative three-step process was designed to improve reliability and consistency through repeated feedback, consensus-building, and diverse expert perspectives [35]. In Stage 5, the selected secondary uncertainties were analyzed using Monte Carlo simulation. Each uncertainty factor was assigned a probability distribution (e.g., triangular or normal) based on expert input and historical data, and 1,000,000 simulations were performed in Python 3.12.2. to assess the probabilistic impact on “market growth rate”, defined as the dependent variable representing EV battery resource utilization in VPPs [43]. The two uncertainty factors with the highest standard deviations were selected as the axes of the 2 × 2 scenario matrix, while a third factor was included as a scenario-specific subfactor [44,45,46]. In Stage 6, these findings were used to construct four future scenarios incorporating ESG dimensions such as transparency and job creation [11]. This framework provides a robust basis for strategic planning under uncertainty and contributes to ESG-oriented decision-making in the energy transition.

3.1.1. Stage 1: Framework Design

This stage applied a PEST-ESG framework to comprehensively identify external uncertainties related to EV battery utilization in VPPs. While the PEST model captures broad macro-environmental trends across the political, economic, social, and technological domains, the integration of ESG dimensions, particularly governance (e.g., transparency) and social factors (e.g., public acceptance), ensures a more sustainability-oriented perspective [33,34].

3.1.2. Stage 2: Initial Identification of Uncertainty Factors

To develop an initial pool of uncertainty variables, semi-structured interviews were conducted with 17 experts from diverse sectors, including government ministries, public agencies, large corporations, SMEs, and startups [38,39,40,47]. Conducted between August and September 2024 through in-person, video, and phone formats, the interviews were designed using the PEST-ESG framework to explore issues related to policy, technology, economics, and sustainability. (See Appendix A Table A2 for the complete list of interview questions.)

3.1.3. Stage 3: Selection of Primary Uncertainty Factors

Following the interviews, the same group of experts was asked to prioritize the most influential factors. A “significant external influence” was defined as a factor likely to trigger systemic or cascading impacts across the energy system. This expert-based filtering step ensured analytical relevance and reliability in the subsequent scenario development process [48].

3.1.4. Stage 4: Selection of Secondary Uncertainty Factors

Building on previous stages, a structured survey was administered between 4 October and 15 November 2024, targeting 50 professionals from the policy, technology, and market sectors. Respondents rated the ESG relevance of each uncertainty factor using a three-point Likert scale (“low”, “medium”, and “high”), and a weighted scoring approach was used to prioritize variables for simulation modeling [40,41,42,49]. This method ensured that the selected factors reflected critical ESG considerations such as environmental sustainability, social acceptance, and governance transparency, thereby enhancing the long-term applicability and policy relevance of the resulting scenarios.

3.1.5. Stage 5: Selection of the Final Uncertainty Factors

The final selection of uncertainty factors was based on the procedure outlined in Figure 2, with a primary focus on identifying the key uncertainty factors necessary for deriving final scenarios [44,45].
To comprehensively reflect uncertainties across various ESG domains, this study adopted an extended scenario matrix structure. In addition to the two primary axes (X and Y), a third supplementary factor was incorporated to enrich the scenario framework [50,51,52]. The selection of variables and assignment of probability distributions required for the Monte Carlo simulation was carried out through iterative expert consultations using the Delphi method, ensuring consistency and methodological rigor [35]. Final variables were derived through a consensus-building process. Subsequently, Monte Carlo simulations were conducted using Python 3.12.2. to evaluate the probabilistic impact of each uncertainty factor on the market growth rate, defined as a proxy for the utilization of EV batteries within VPPs [29,43]. Variables with the highest standard deviations in the simulation outcomes were identified as key uncertainties across the environmental, social, and governance domains [45,53]. By integrating expert-driven and data-driven approaches, this methodology addresses the limitations of traditional qualitative scenario planning and enables more robust and empirically grounded strategic insights [51].
Step 1: Initial extraction of variables for uncertainty factors. To define the input variables for the Monte Carlo simulation, this stage employed semi-structured interviews with the same 17 experts involved in the initial identification phase [47,48,54]. Given the early-stage nature of EV–VPP commercialization and the difficulty in recruiting experts with both policy and technical expertise, semi-structured interviews allowed for efficient communication, focused discussion, and consensus-building. The interviews were conducted from 18 to 30 November 2024 using in-person, video, and phone formats to collect in-depth responses to predefined questions assessing the future impact of each uncertainty factor [37,38]. (See Appendix A Table A3 for the full list of questions.)
Step 2: To improve the analytical depth and validity of the Monte Carlo simulation, this study prioritized and refined initially derived variables through an expert-based consensus process [48,54]. Recognizing that not all candidate variables hold equal influence, we conducted an additional evaluation step in which the same expert group was asked to reselect variables deemed to have significant external impacts, defined as the potential to trigger systemic changes across the political, economic, social, technological, and ESG dimensions [54]. The selection of probability distributions followed a two-step process: first, the literature was reviewed to set target ranges; then, expert interviews were conducted to calibrate key parameters [55,56]. A consensus was formed using qualitative techniques. To evaluate the robustness of these inputs, a sensitivity analysis was performed by varying key parameters (e.g., ±10% around the most likely value, such as 60–80%) [57]. This step was essential for reducing modeling uncertainty and improving the reliability of scenario projections [58,59].
Step 3: Monte Carlo simulation implementation. To assess the probabilistic impacts of selected uncertainty factors, a Monte Carlo simulation was conducted using Python, an open-source programming language well-suited for complex numerical computations. The implementation utilized scientific libraries [60], which enabled efficient vectorized operations and high-volume random number generation [29]. This method allows for robust estimations of outcome variability by repeatedly sampling from predefined probability distributions. The following key components of the Python code were designed for this study:
  • A total of 1,000,000 simulation iterations were executed to ensure statistical robustness.
  • A fixed random seed was applied to ensure the reproducibility of the results.
  • Finalized variables and their probability distributions, based on expert consensus, were incorporated as input parameters.
  • Descriptive statistics for each simulation output mean, standard deviation, minimum, and maximum were computed using the DataFrame.describe() function and presented via console output.
Step 4: Derivation of simulation results and final selection of uncertainties. In this stage, the results obtained from the Monte Carlo simulation were analyzed, and the final uncertainty factors were selected based on this analysis. The simulation results were evaluated by assessing the impact of each uncertainty factor on the market growth rate and analyzing their statistical characteristics, including standard deviation. The final uncertainty factors were primarily selected based on the factors with the highest standard deviations among the simulation results [45]. Through this process, the most critical uncertainty elements in each ESG domain were identified.

3.1.6. Stage 6: Derivation of 2 × 2 Scenarios

In this study, the scenario matrix method–widely used in “futures” studies and strategic management–was applied to reduce complex and highly uncertain environmental factors into two primary axes [51,52]. Using this approach, multiple alternative future states were derived. In this process, the two uncertainty factors with the highest standard deviation values were designated as the core axes and a third factor was incorporated as a sub-element to enable a more refined scenario analysis.
The scenario axes were structured in a two-level opposing format, such as “low vs. high” or “negative vs. positive” [46]. Additionally, a sub-factor was incorporated to construct a 2 × 2 scenario matrix, ensuring that the characteristics of each scenario were clearly distinguished for ease of comparison [61]. Each scenario comprehensively described the assumed future environment (e.g., policy and regulatory frameworks, technological advancement speed, market demand, and social perception) and was used as the foundation for developing a scenario storyline. In this process, economic value volatility, job creation potential, and ESG transparency requirements were established as key uncertainties, while additional factors such as government support policies, advancements in EV battery recycling technologies, and fluctuations in international energy prices were considered to enhance the realism and consistency of the scenarios. Through this analysis, each scenario provides in-depth insights into how it may unfold in real-world conditions and enables the derivation of policy implications and strategic responses [62].

3.2. Analysis Method

3.2.1. Scenario Planning

Scenario planning is a key methodology for exploring multiple alternative scenarios in highly uncertain future environments and developing the corresponding strategic responses [24]. Schwartz [51] defined this approach as “a process of exploring multiple alternative scenarios to prepare for an uncertain future and formulating strategies tailored to each scenario”. Schoemaker [61] emphasized that scenario planning involves identifying key uncertainties and developing interrelated scenarios, enabling organizations to respond effectively to change and implement sustainable strategies. In this study, a scenario planning methodology was applied to comprehensively consider policy, social, economic, and technological uncertainties, as well as ESG factors related to EV battery utilization as a VPP resource. First, potential future environmental changes and risks associated with EV battery deployment were identified. Among the derived uncertainty factors, the most influential and volatile were selected to define the primary scenario axes. Future environmental projections were then developed using a scenario matrix, incorporating environmental, social, and economic sustainability considerations to formulate strategic responses. However, because scenario planning is particularly effective for exploring various future possibilities based on expert subjective judgment, it is essential to integrate quantitative analysis and expert validation to enhance the accuracy and reliability of the results.

3.2.2. Monte Carlo Simulation

Monte Carlo simulation is a probabilistic method that estimates the range of future outcomes (e.g., mean and standard deviation) by defining variables and probability distributions for uncertainty factors and repeatedly simulating various scenarios based on these inputs [29]. This technique was first introduced in the Manhattan Project in 1949 and has since been widely applied to risk analysis and forecasting across multiple fields, including finance, investment, manufacturing, and logistics [63].

Comparative Advantage over Other Methods

Unlike purely deterministic models, which rely on fixed input values and may fail to capture outlier cases, Monte Carlo simulation can accommodate a wide spectrum of randomness and tail risks. This is particularly valuable for VPP and EV battery integration, where market conditions, technological breakthroughs, and policy changes can produce highly skewed or extreme outcomes. Other approaches, such as agent-based modeling or system dynamics, focus on detailed interactions or feedback loops, but may require extensive calibration and still struggle to represent broad probability distributions as effectively as Monte Carlo [62]. Additionally, Monte Carlo simulation is particularly well-suited for quantifying ESG-related uncertainties in VPP and EV battery operations. Governance factors such as transparency requirements and regulatory changes often exhibit nonlinear effects on market stability. By modeling these variables probabilistically, Monte Carlo provides a more robust framework for analyzing policy-driven energy transitions.

Probability Distributions, Equation, and Boundary Conditions

Monte Carlo simulation operates by repeatedly sampling input variables from predefined probability distributions and calculating the corresponding scenario outcomes [64]. The governing relationship in this study is conceptually expressed as follows:
Y = f(X1, X2,…, Xn)
where
  • Y denotes the scenario outcome (e.g., the projected market growth rate of EV battery utilization in VPPs);
  • Xi represents individual uncertainty variables, such as policy incentives, battery costs, and employment rates.
Each Xi is associated with a specific probability distribution Pi, selected based on empirical data, expert judgment, and theoretical rationale. Legal amendment-related uncertainties were modeled using appropriate probability distributions: a normal distribution for intensity (assuming symmetric variability), a binomial distribution for implementation likelihood, and a triangular distribution for amendment timing to reflect asymmetrical scheduling uncertainty. Boundary conditions (e.g., minimum, most likely, and maximum values) were established based on historical data, the domain-specific literature, and expert input to ensure realistic input ranges. A random number generator sampled values for each X1, and combinations were input into the function f(⋅) to compute Y. This process was repeated one million times to generate an empirical distribution of outcomes, enabling the calculation of key statistical indicators such as means, standard deviations, and confidence intervals. The choice of one million simulation runs was informed by prior research recommending 100,000–1,000,000 iterations for convergence in complex energy modeling [65,66]. To validate this, preliminary tests showed that standard deviations stabilized after approximately 750,000 runs, indicating sufficient convergence. This approach is theoretically supported by the Law of Large Numbers (LLN), which states that as the number of trials increases, the sample mean converges to the population mean [67]. In Monte Carlo simulations, this ensures that statistical estimates become more accurate and less sensitive to randomness and outliers. As demonstrated in Figure 3, the stabilization of the standard deviation confirms convergence under the LLN and supports the robustness of using one million iterations.
Through these refinements, Monte Carlo simulation enhances strategic decision-making by providing a probabilistic framework to assess uncertainty in EV battery VPP deployment. It enables policymakers and industry leaders to evaluate risk exposure, quantify ESG impacts, and develop resilient, data-driven strategies for sustainable energy transitions.

3.2.3. Combination of Scenario Planning and Monte Carlo Simulation

The research methodology combining scenario planning and Monte Carlo simulation serves as a critical tool for systematically and reliably supporting strategic decision-making in highly uncertain environments. Scenario planning qualitatively explores various uncertainty factors to present potential future pathways, offering a comprehensive understanding of how policy, technological, economic, and social factors interact. In contrast, Monte Carlo simulation applies variables and probability distributions to each uncertainty factor and repeatedly simulates numerous scenarios to enable a quantitative assessment of the outcomes [29]. This approach complements the qualitative analysis derived from scenario planning by providing clearer predictions of the likelihood and potential impact of each scenario.

Integrated Approach

A four-step integrated approach was employed: (1) uncertainty factors (E, S, and G) were identified through scenario planning; (2) appropriate probability distributions were assigned to each variable using expert input and historical data; (3) 1,000,000 Monte Carlo iterations were conducted to capture probabilistic impacts and tail risks; and (4) a 2 × 2 scenario matrix was constructed based on simulation results, enabling a strategic analysis across ESG dimensions. Through these stages, the integration of scenario planning and Monte Carlo simulation provides both breadth (qualitative scenario exploration) and depth (quantitative likelihood estimates) in forecasting. This combined framework thus improves the reliability of future environmental projections and offers valuable insights into risk management and opportunity analysis for sustainable EV battery VPP resource utilization.

4. Results

To maintain readability, only the main results are highlighted here; detailed statistical outputs and sensitivity values are included in the Appendix A.

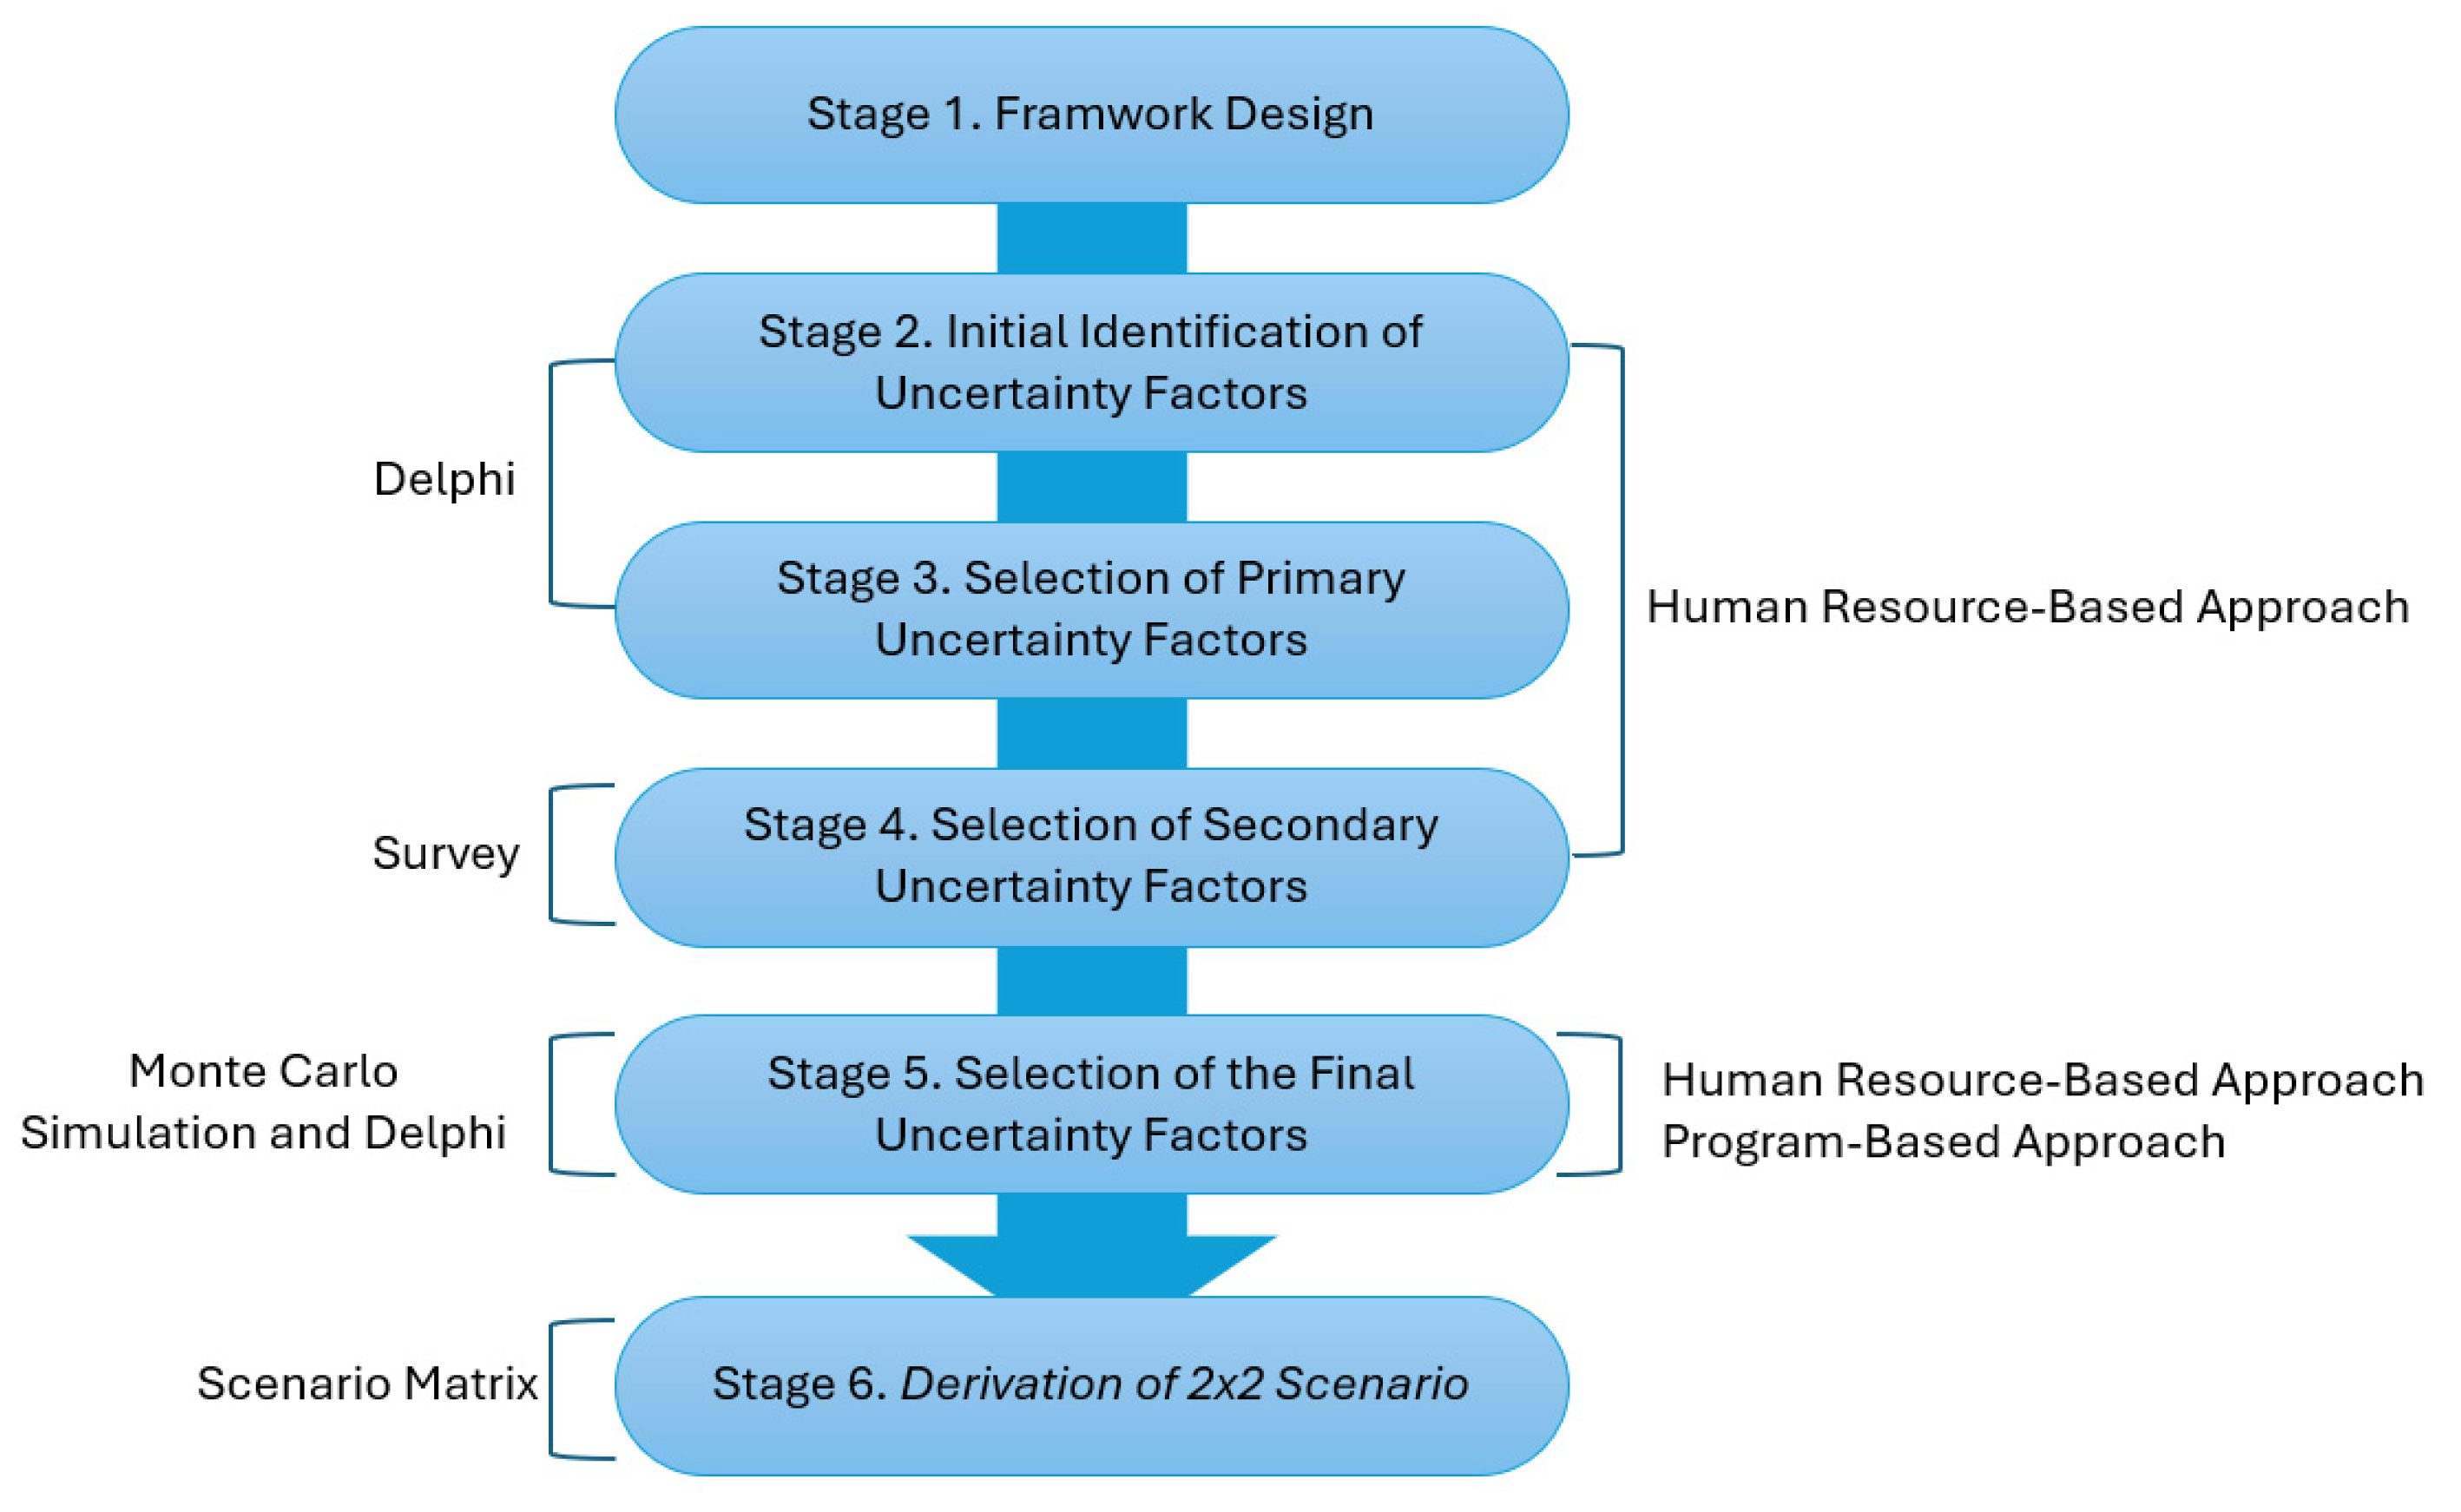
4.1. Stage 1: Result of the Framework Design

A 3 × 3 matrix was constructed by mapping ESG dimensions (horizontal axis) against PEST factors (vertical axis), resulting in nine combined categories: PE, SE, EE, PS, SS, ES, PG, SG, and EG. Notably, political and technological factors were merged due to their strong interdependence in the energy sector, where policy drives innovation and vice versa [68]. This classification scheme provided a structured basis for categorizing the initial uncertainty factors and ensuring alignment with both sustainability and macro-environmental perspectives.

4.2. Stage 2: Results of the Initial Identification of Uncertainty Factors

Table 1 shows the results of initial identification of uncertainty factors. (See Appendix A Table A4 for a detailed list).
As listed in Table 1, 46 uncertainty factors were identified through semi-structured interviews with the optimal expert group. Key uncertainty factors include the possibility of legal and regulatory changes (PE), government subsidies and taxation policies (EE), community acceptance (PS), fluctuations in raw material prices (EE), integration with renewable energy (PE), transparency and standardization requirements (PG), and changes in ESG investment indicators (EG). These factors are interdependent, suggesting that changes in one area may have cascading effects on other areas. Additionally, the linkage between decentralized power and renewable energy policies, growth potential in the battery recycling and reprocessing market (EE), and community participation and conflict resolution (PS) create positive synergies between VPP and EV battery utilization while simultaneously introducing uncertainties owing to policy changes or social conflicts, thereby having dual impacts. The need for enhanced transparency and reliability (SG) and education and talent development (PS) highlights that stakeholder collaboration and social consensus across the entire VPP industry ecosystem must be considered in future development.

4.3. Stage 3: Results of the Selection of the Primary Uncertainty Factors

Among the initially derived 46 uncertainty factors, 27 factors were selected based on their perceived “significant external influence”, as shown in Table 2. (See Appendix A Table A5 for the detailed contents).
Through expert re-evaluation, this stage prioritized uncertainty factors with the greatest potential for systemic impact across PEST-ESG domains. Experts identified four key drivers: policy volatility, economic uncertainty, social acceptance, and governance transparency. In the policy domain, legal revisions, subsidy policies, and alignment emerged as critical, while social acceptance hinged on perception changes and job creation. Economic value volatility was ranked highest across categories, with attention to emerging business models and the sharing economy. Governance-related factors, particularly procedural clarity and trust in subsidy and recycling systems, were also emphasized. These findings highlight the cross-cutting nature of uncertainty, underscoring both risks and opportunities for future EV–VPP deployment.

4.4. Stage 4: Results of the Selection of Secondary Uncertainty Factors

Table 3 presents the results. (For a detailed list, please see Appendix A Table A6).
As shown in Table 3, nine secondary uncertainty factors were selected from 27 candidates based on their ESG relevance. “Legal amendment potential” (PE) received the highest score, and selections were made within each domain to ensure balanced ESG representation. This stage emphasized sustainability by reaffirming the importance of legal and economic volatility, while also elevating social and governance priorities such as “Employment creation potential and sustainability” (SS), “Technical education and workforce development policies” (PS), and “Increased transparency requirements” (PG). High scores for “Sustained marketing investment” (SG) and “Activation of the sharing economy and potential for business model innovation” (ES) reflect growing interest in long-term value creation. Overall, the results highlight that social and governance factors are not secondary, but central to building resilient EV–VPP strategies.

4.5. Stage 5: Results of the Final Selection of Uncertainty Factors

To address the first research question “What are the critical uncertainties surrounding EV battery utilization in VPPs from an ESG perspective?” this section presents the final selection of uncertainty drivers derived from the Monte Carlo simulation. The analysis confirms the dominant influence of economic value volatility, employment creation potential, and transparency requirements, each representing one of the ESG pillars. To enhance the robustness of the nine previously identified uncertainty factors, a probabilistic analysis was conducted using Monte Carlo simulation. This process involved defining input variables, assigning appropriate probability distributions, and executing high-volume simulations. The outcomes enabled the identification of three high-impact uncertainty drivers, which formed the foundation of the 2 × 2 scenario matrix developed in the following section. Detailed procedures and simulation results are provided in the subsequent subsections.

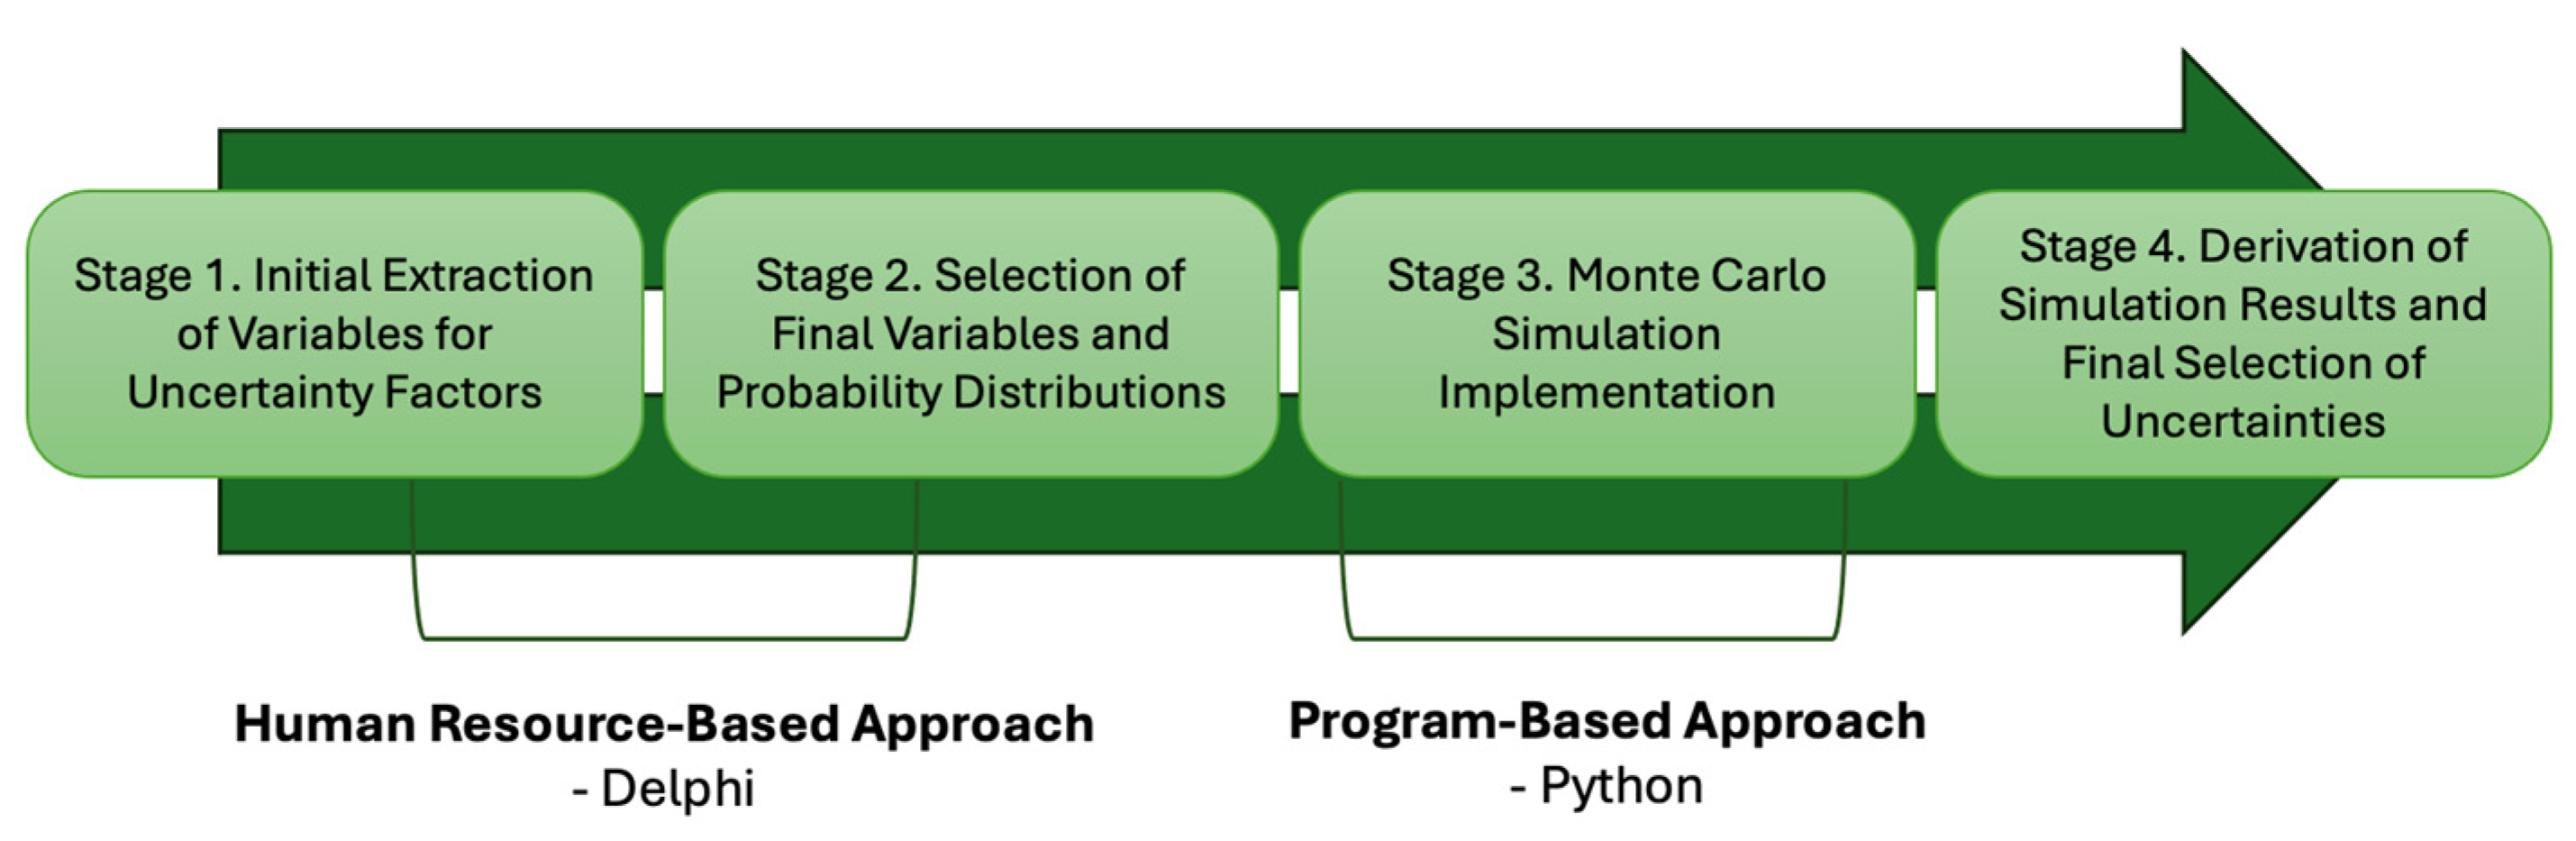
4.5.1. Steps 1 and 2: Results of Variable Selection and the Extraction of Probability Distribution Parameters

Table 4 and Table 5 show the results for variable selection and the extraction of probability parameters. (For a detailed list, please see Appendix A Table A7 and Table A8).
As illustrated in Table 4, a total of fifty-one variables were initially identified across nine uncertainty factors, with each factor comprising four to seven variables. To enhance model clarity and avoid excessive complexity, an additional expert consensus process was conducted. Through this, each uncertainty factor was distilled to three core variables, resulting in a final set of twenty-seven variables. These variables maintained the conceptual breadth of the initial pool, encompassing key thematic domains such as policy alignment, technological volatility, market uncertainty, social acceptance, investment sustainability, and regulatory transparency. Of particular note, employment-related variables were refined to emphasize sustainable job creation and broader social benefits rather than short-term labor fluctuations, reinforcing alignment with ESG principles.
As shown in Table 5, parameter values for each variable, such as the minimum, most likely, and maximum estimates were derived through a structured Consensus Conference [69]. This process incorporated expert-informed perspectives on policy foresight, societal trends, market competitiveness, and governance robustness, reflecting both the present conditions and anticipated future uncertainties [70]. Monte Carlo simulations were then conducted to model various scenario pathways, including early or delayed regulatory amendments and divergent trajectories of technological innovation. A range of probability distributions, binomial, normal, triangular, Poisson, discrete, and lognormal, was applied to match the unique characteristics of each uncertainty factor. For instance, binomial distributions were used for binary events (e.g., regulatory enactment), while normal and triangular distributions were employed for continuous variables such as the legal amendment intensity, timing, and investment efficiency. These refinements supported intuitive, probabilistically grounded scenario development and enabled a more robust evaluation of ESG-related risks and opportunities in EV–VPP integration.

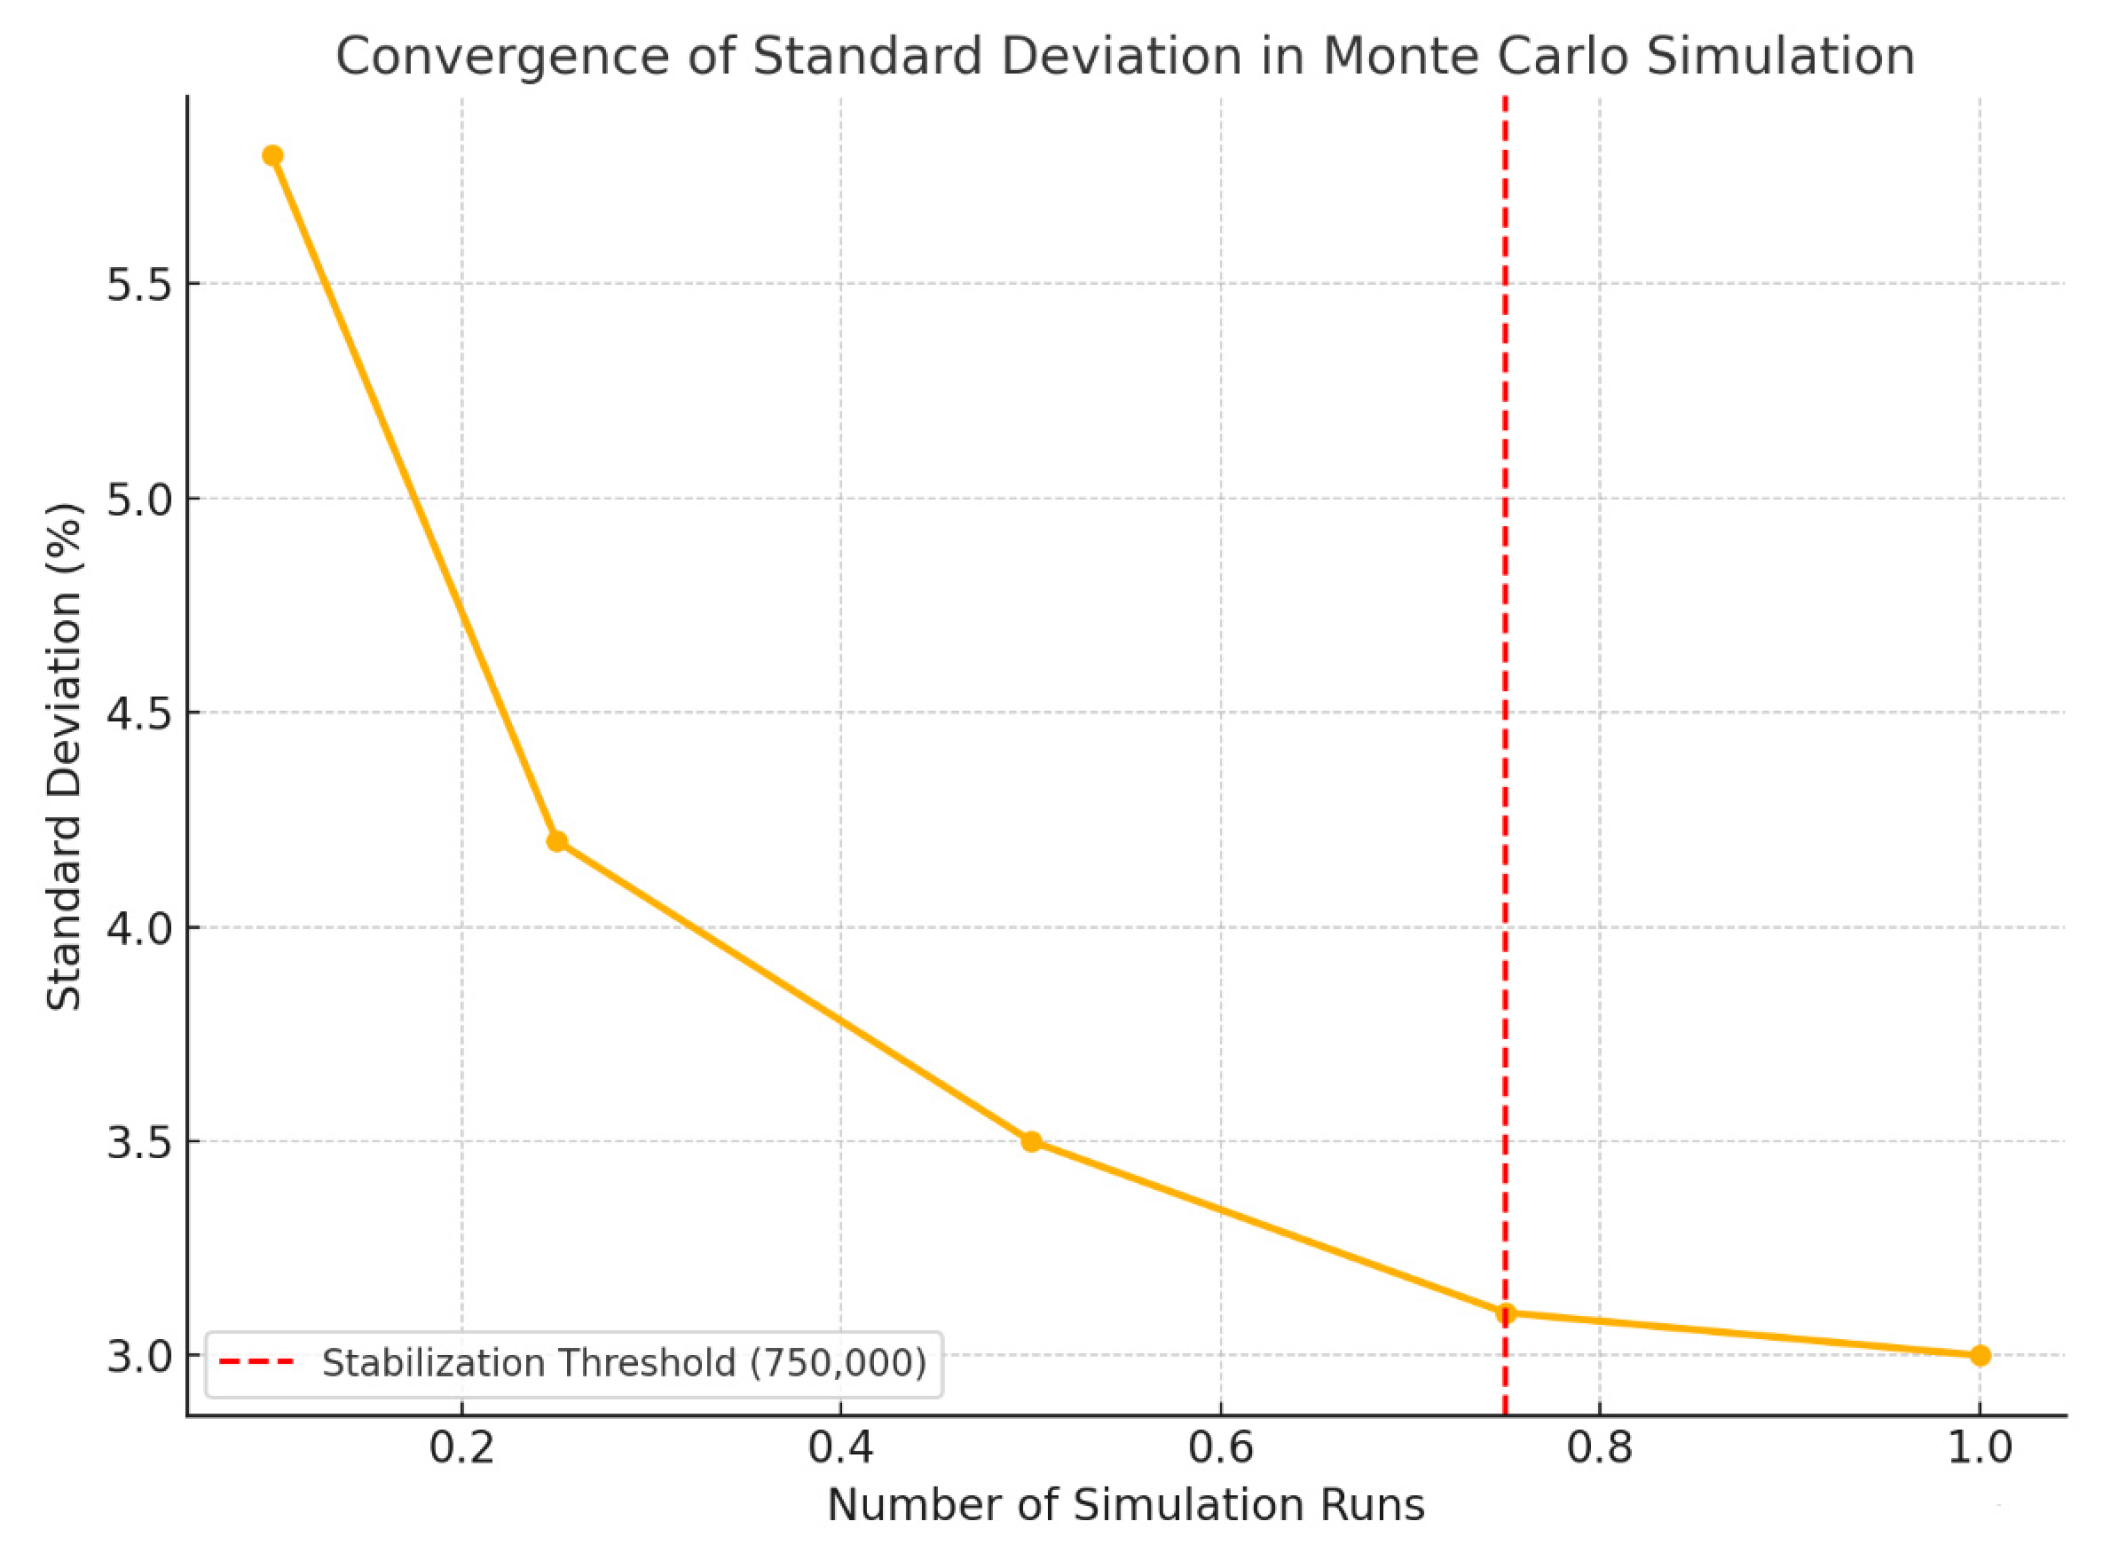
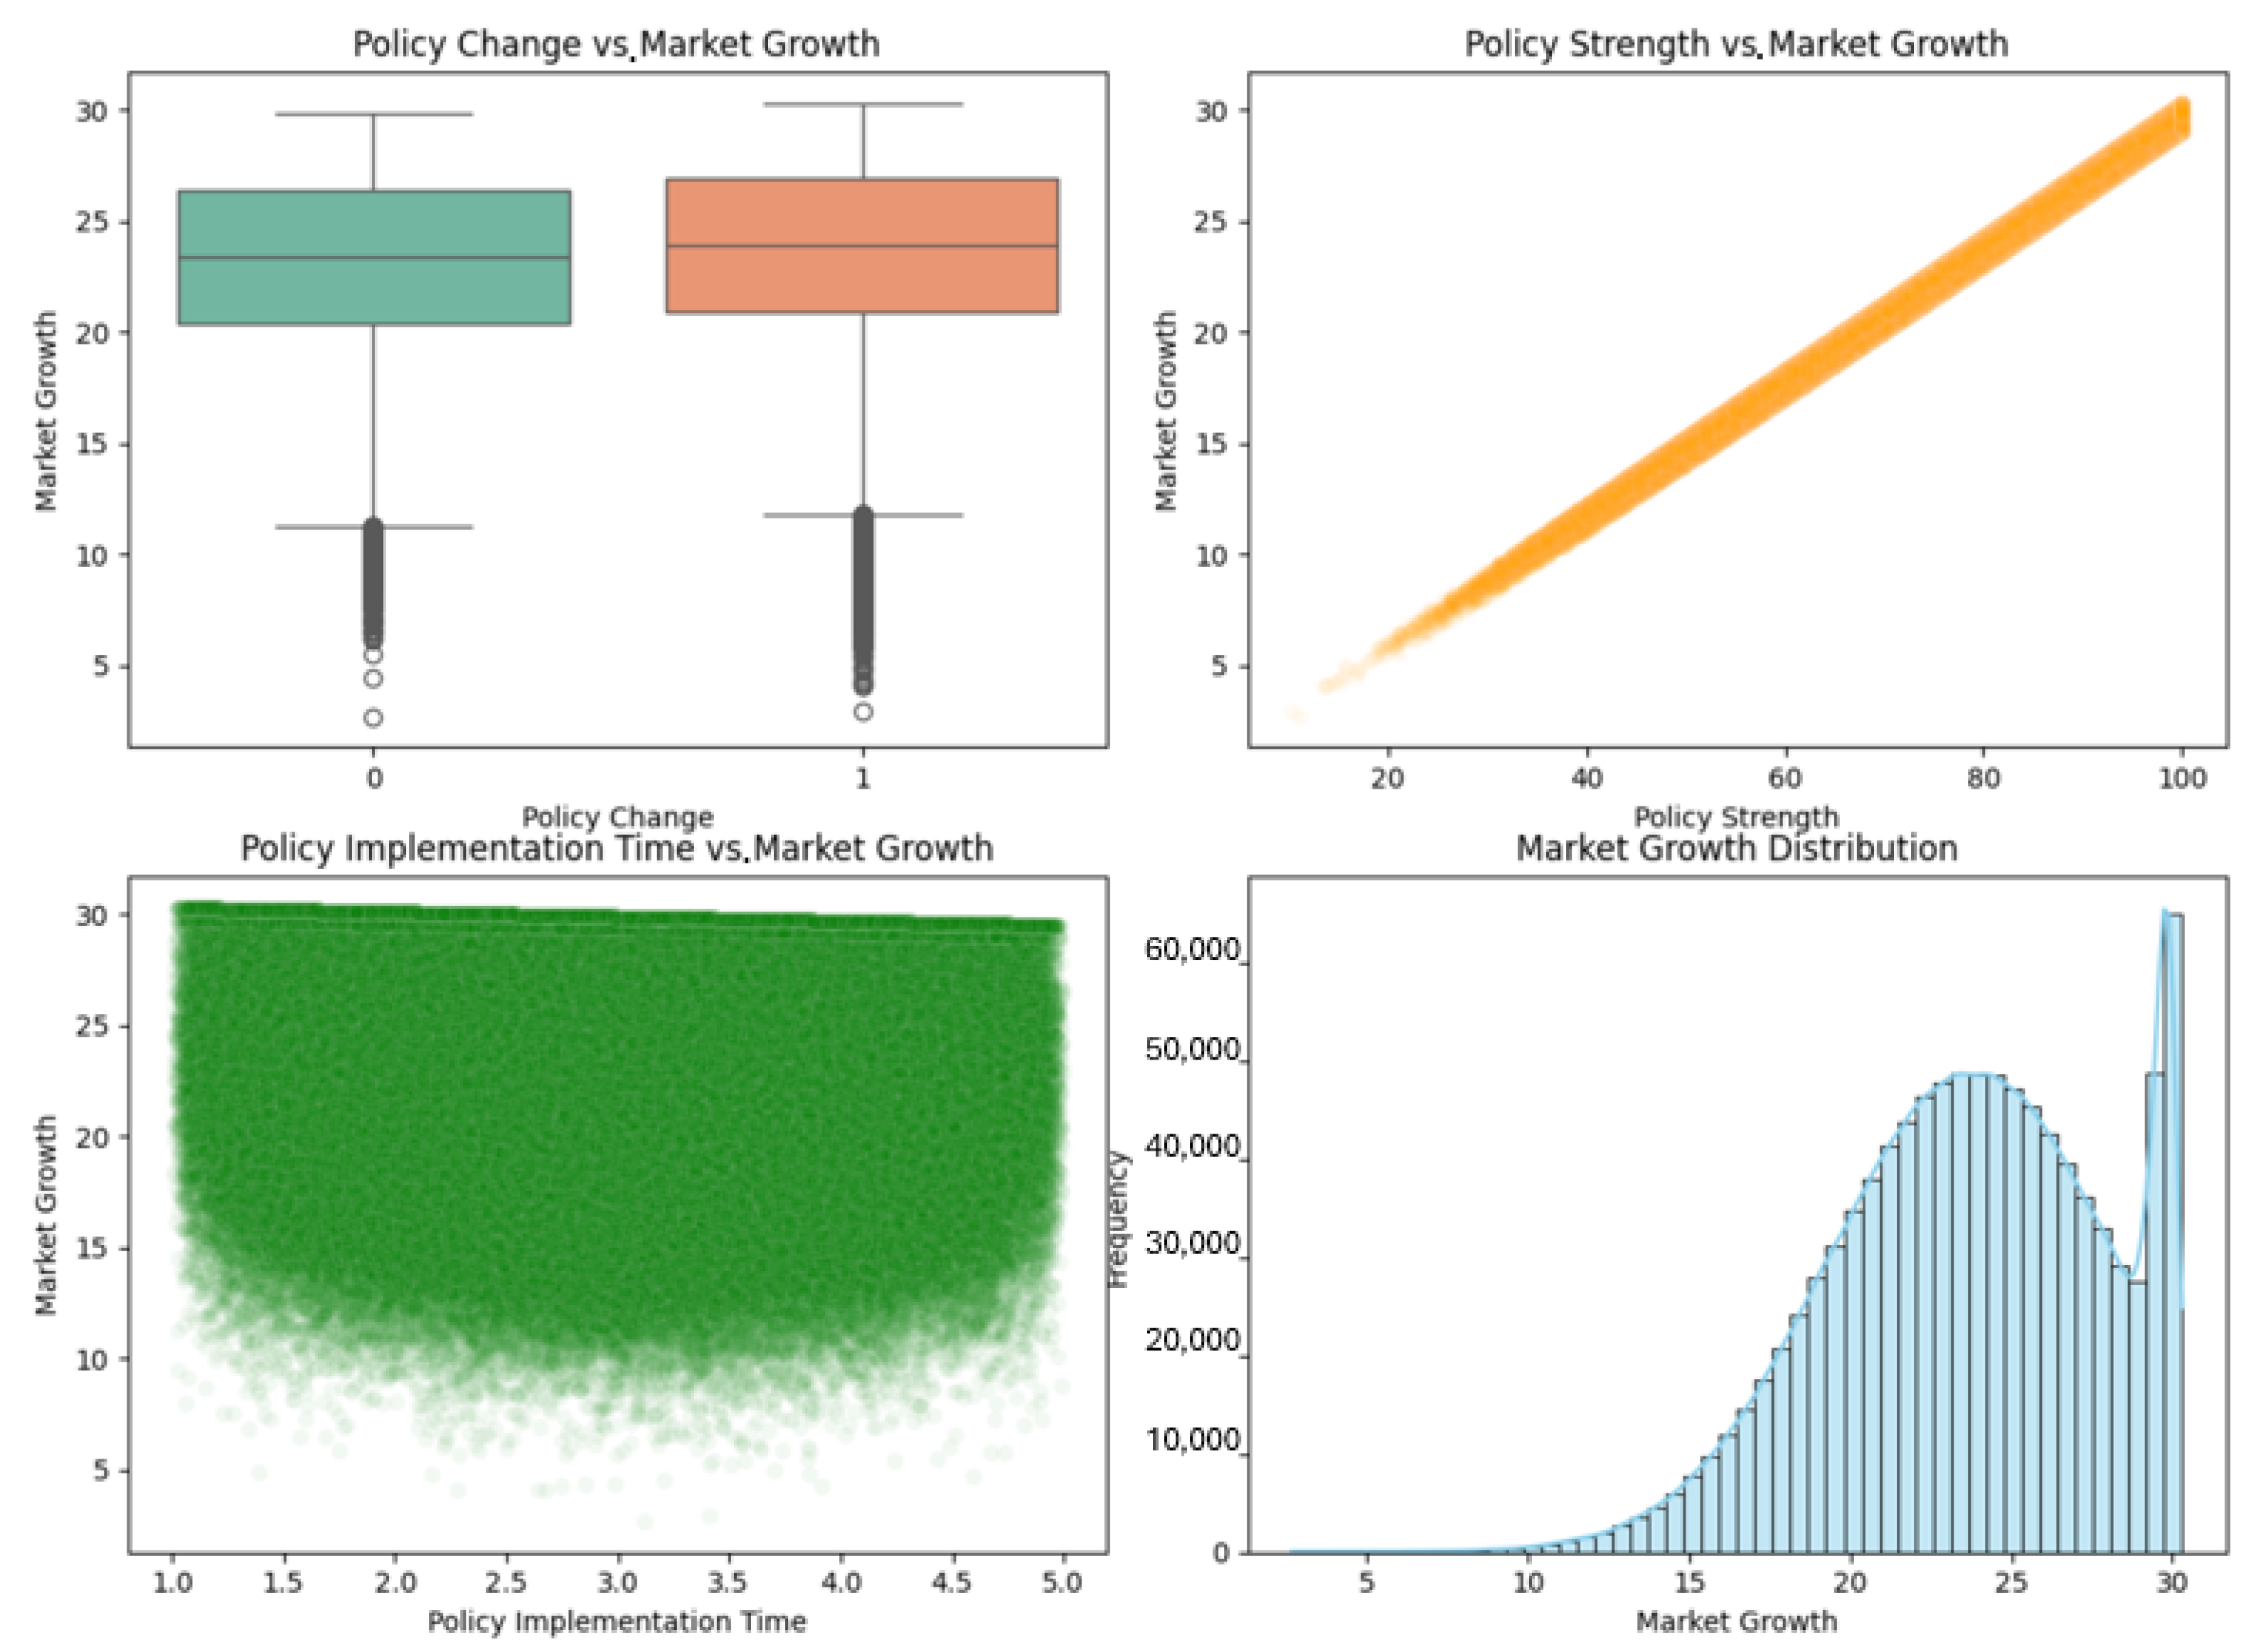
4.5.2. Steps 3 and 4: Results of Simulation Execution and the Final Selection of Uncertainties

The Python code used to execute the Monte Carlo simulations underpinning the visualizations in Figure 4 and quantitative outcomes in Figure 5 is available in a public repository (see Appendix B for the access link). For the detailed quantitative outputs shown in Figure 5, please refer to Appendix A Table A9.
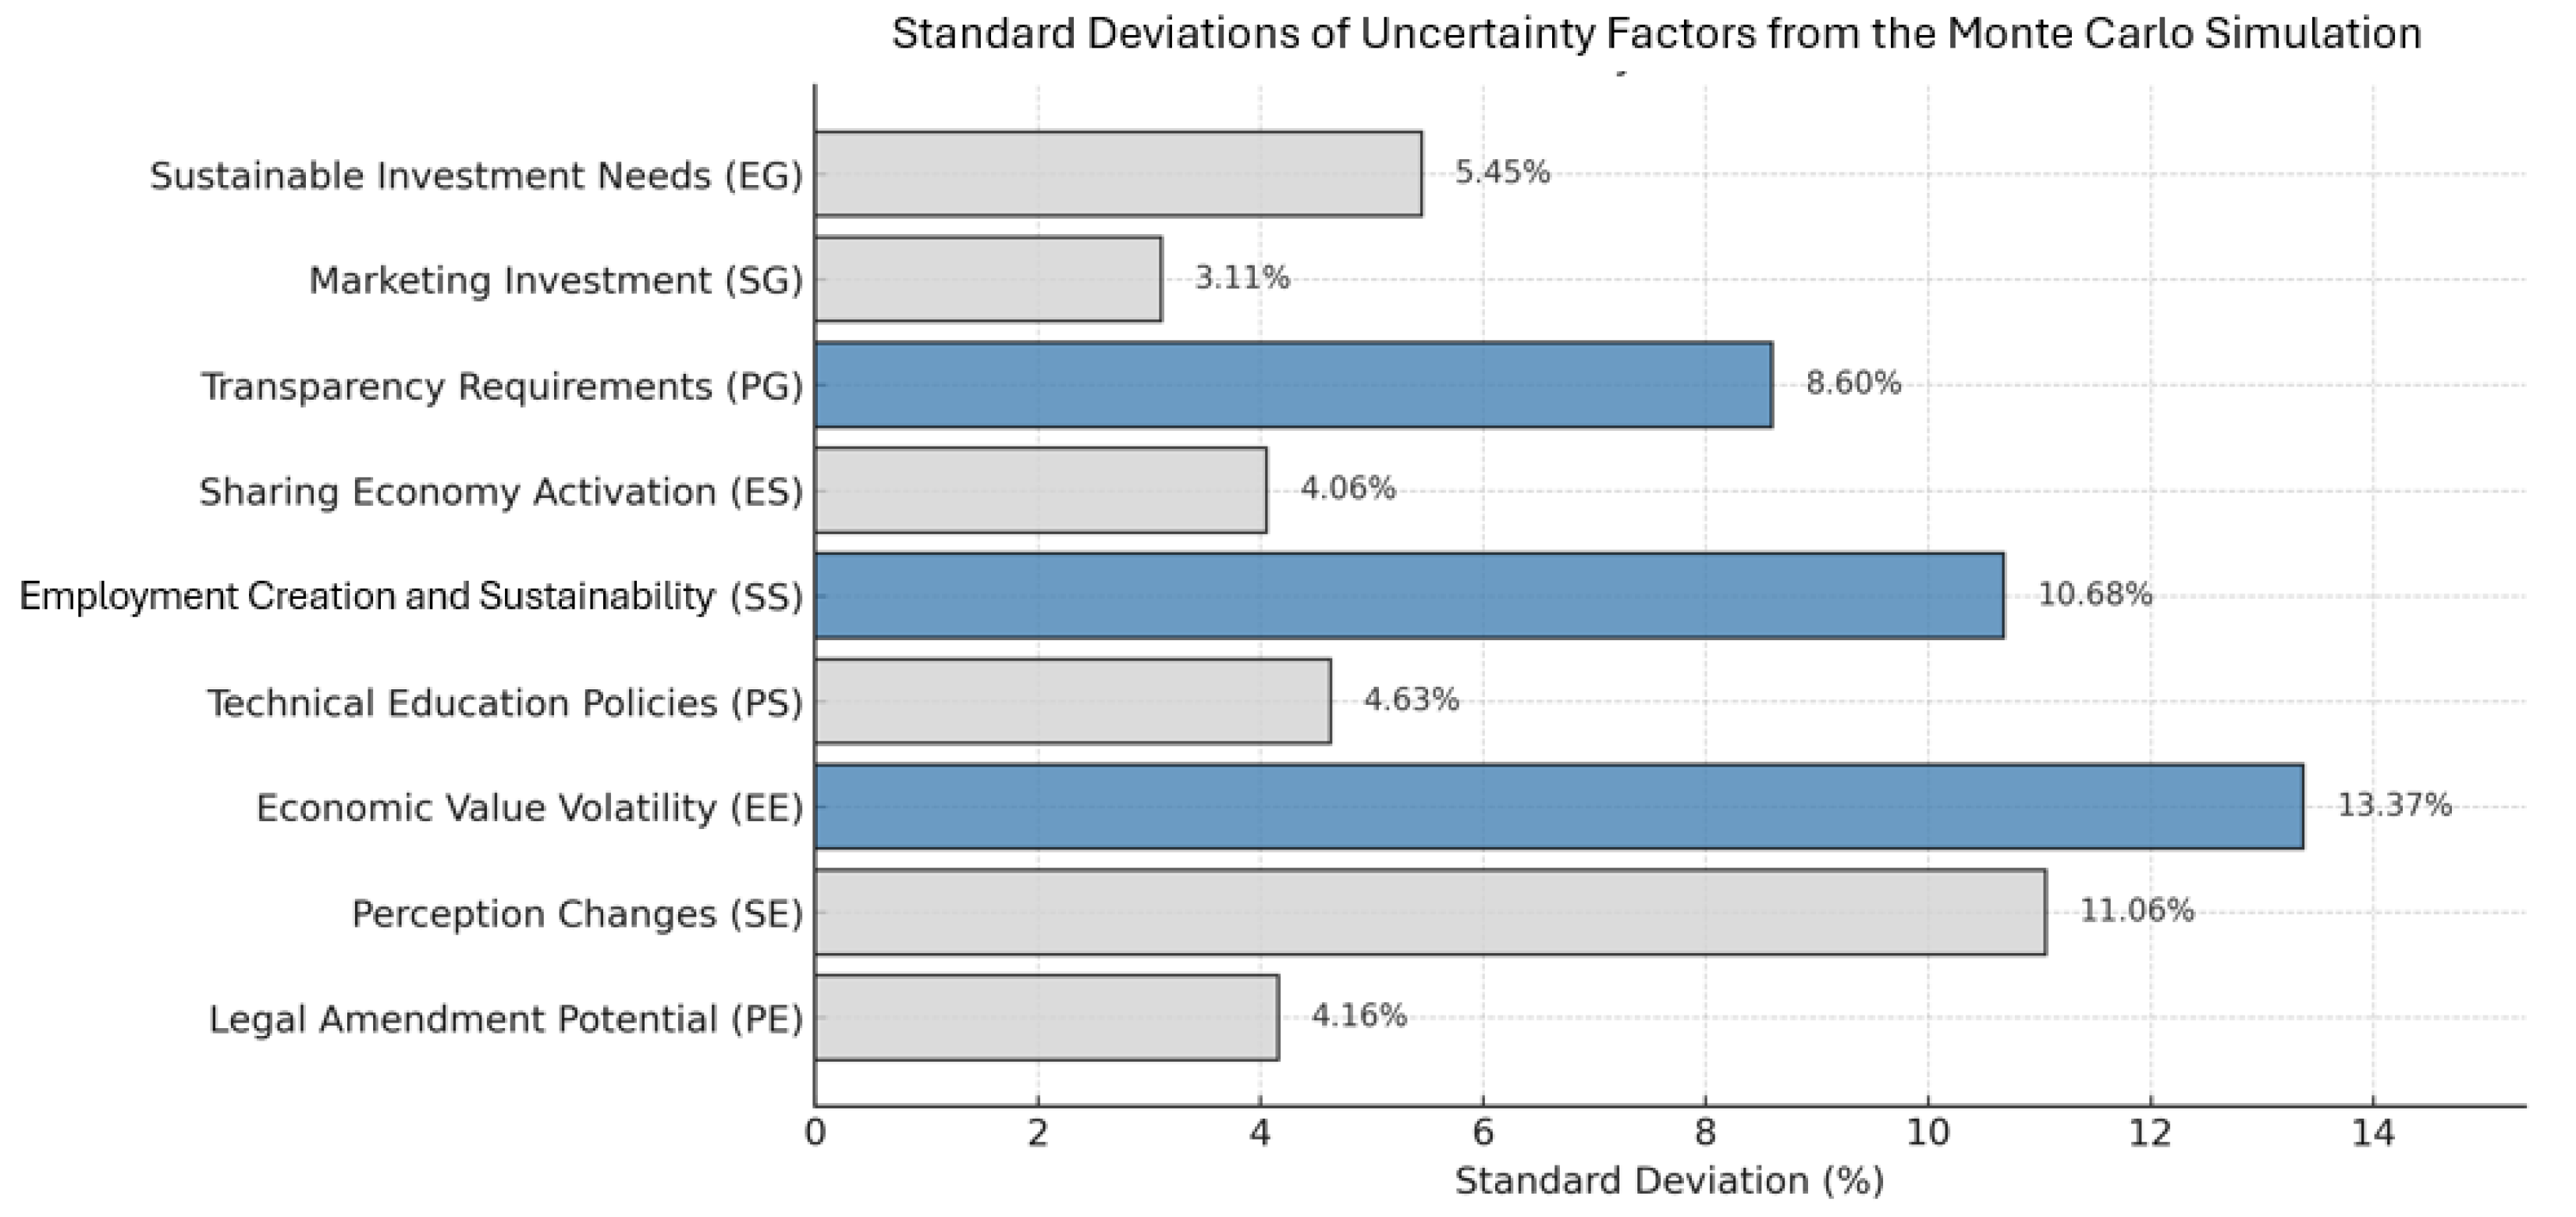
To identify the most critical uncertainty drivers, we analyzed the standard deviations of projected market growth from the Monte Carlo simulation. As shown in Figure 5, three factors with the highest variability were selected as final scenario drivers:
  • Economic value volatility (EE)—13.37%;
  • Employment creation potential and sustainability (SS)—10.68%;
  • Increased transparency requirements (PG)—8.60%.
Although perception change (SE) showed a higher deviation (11.06%) than some selected factors, it was excluded based on the study’s principle of selecting one variable per ESG domain. Its relevance, however, was considered during scenario interpretation. These findings confirm that the selected variables are not only statistically significant but also highly sensitive to external conditions [71], with clear interdependencies—e.g., rising economic volatility may reduce employment or governance trust. This highlights the importance of an integrated ESG perspective in addressing systemic uncertainty in EV–VPP systems. In summary, high-variance ESG drivers offer both analytical clarity and strategic value in guiding resilient policies and investments for sustainable VPP development. Table 6 presents the results of the sensitivity analysis executed using a Python-based model. (See Appendix A Table A10 for the detailed contents.)
This section presents the results of the sensitivity analysis conducted to evaluate the robustness of the Monte Carlo simulation model. As shown in Table 6, each of the 27 input variables was individually adjusted within a ±10% range from its baseline value to examine the extent to which minor deviations affect the projected market growth rate. The resulting changes in standard deviations were found to remain within a 1% margin across all variables, indicating that the model is highly stable under moderate parameter fluctuations. Such consistency demonstrates that the simulation outcomes are not significantly affected by slight variations in input assumptions, thereby validating the model’s reliability for long-term scenario-based forecasting. This result enhances confidence in the model’s suitability for analyzing ESG-related uncertainties in the context of EV battery integration into virtual power plants (VPPs). To generate these results, a Python-based simulation framework was developed by extending the core code presented in the Appendix B. The automated structure of this framework enables repeated sensitivity testing with minimal user intervention, facilitating efficient model calibration and validation. Researchers and practitioners can utilize this approach to iteratively test a wide range of scenarios and improve the interpretability of simulation-based energy policy planning [72,73].

4.6. Stage 6: Results of the 2 × 2 Scenario Matrix

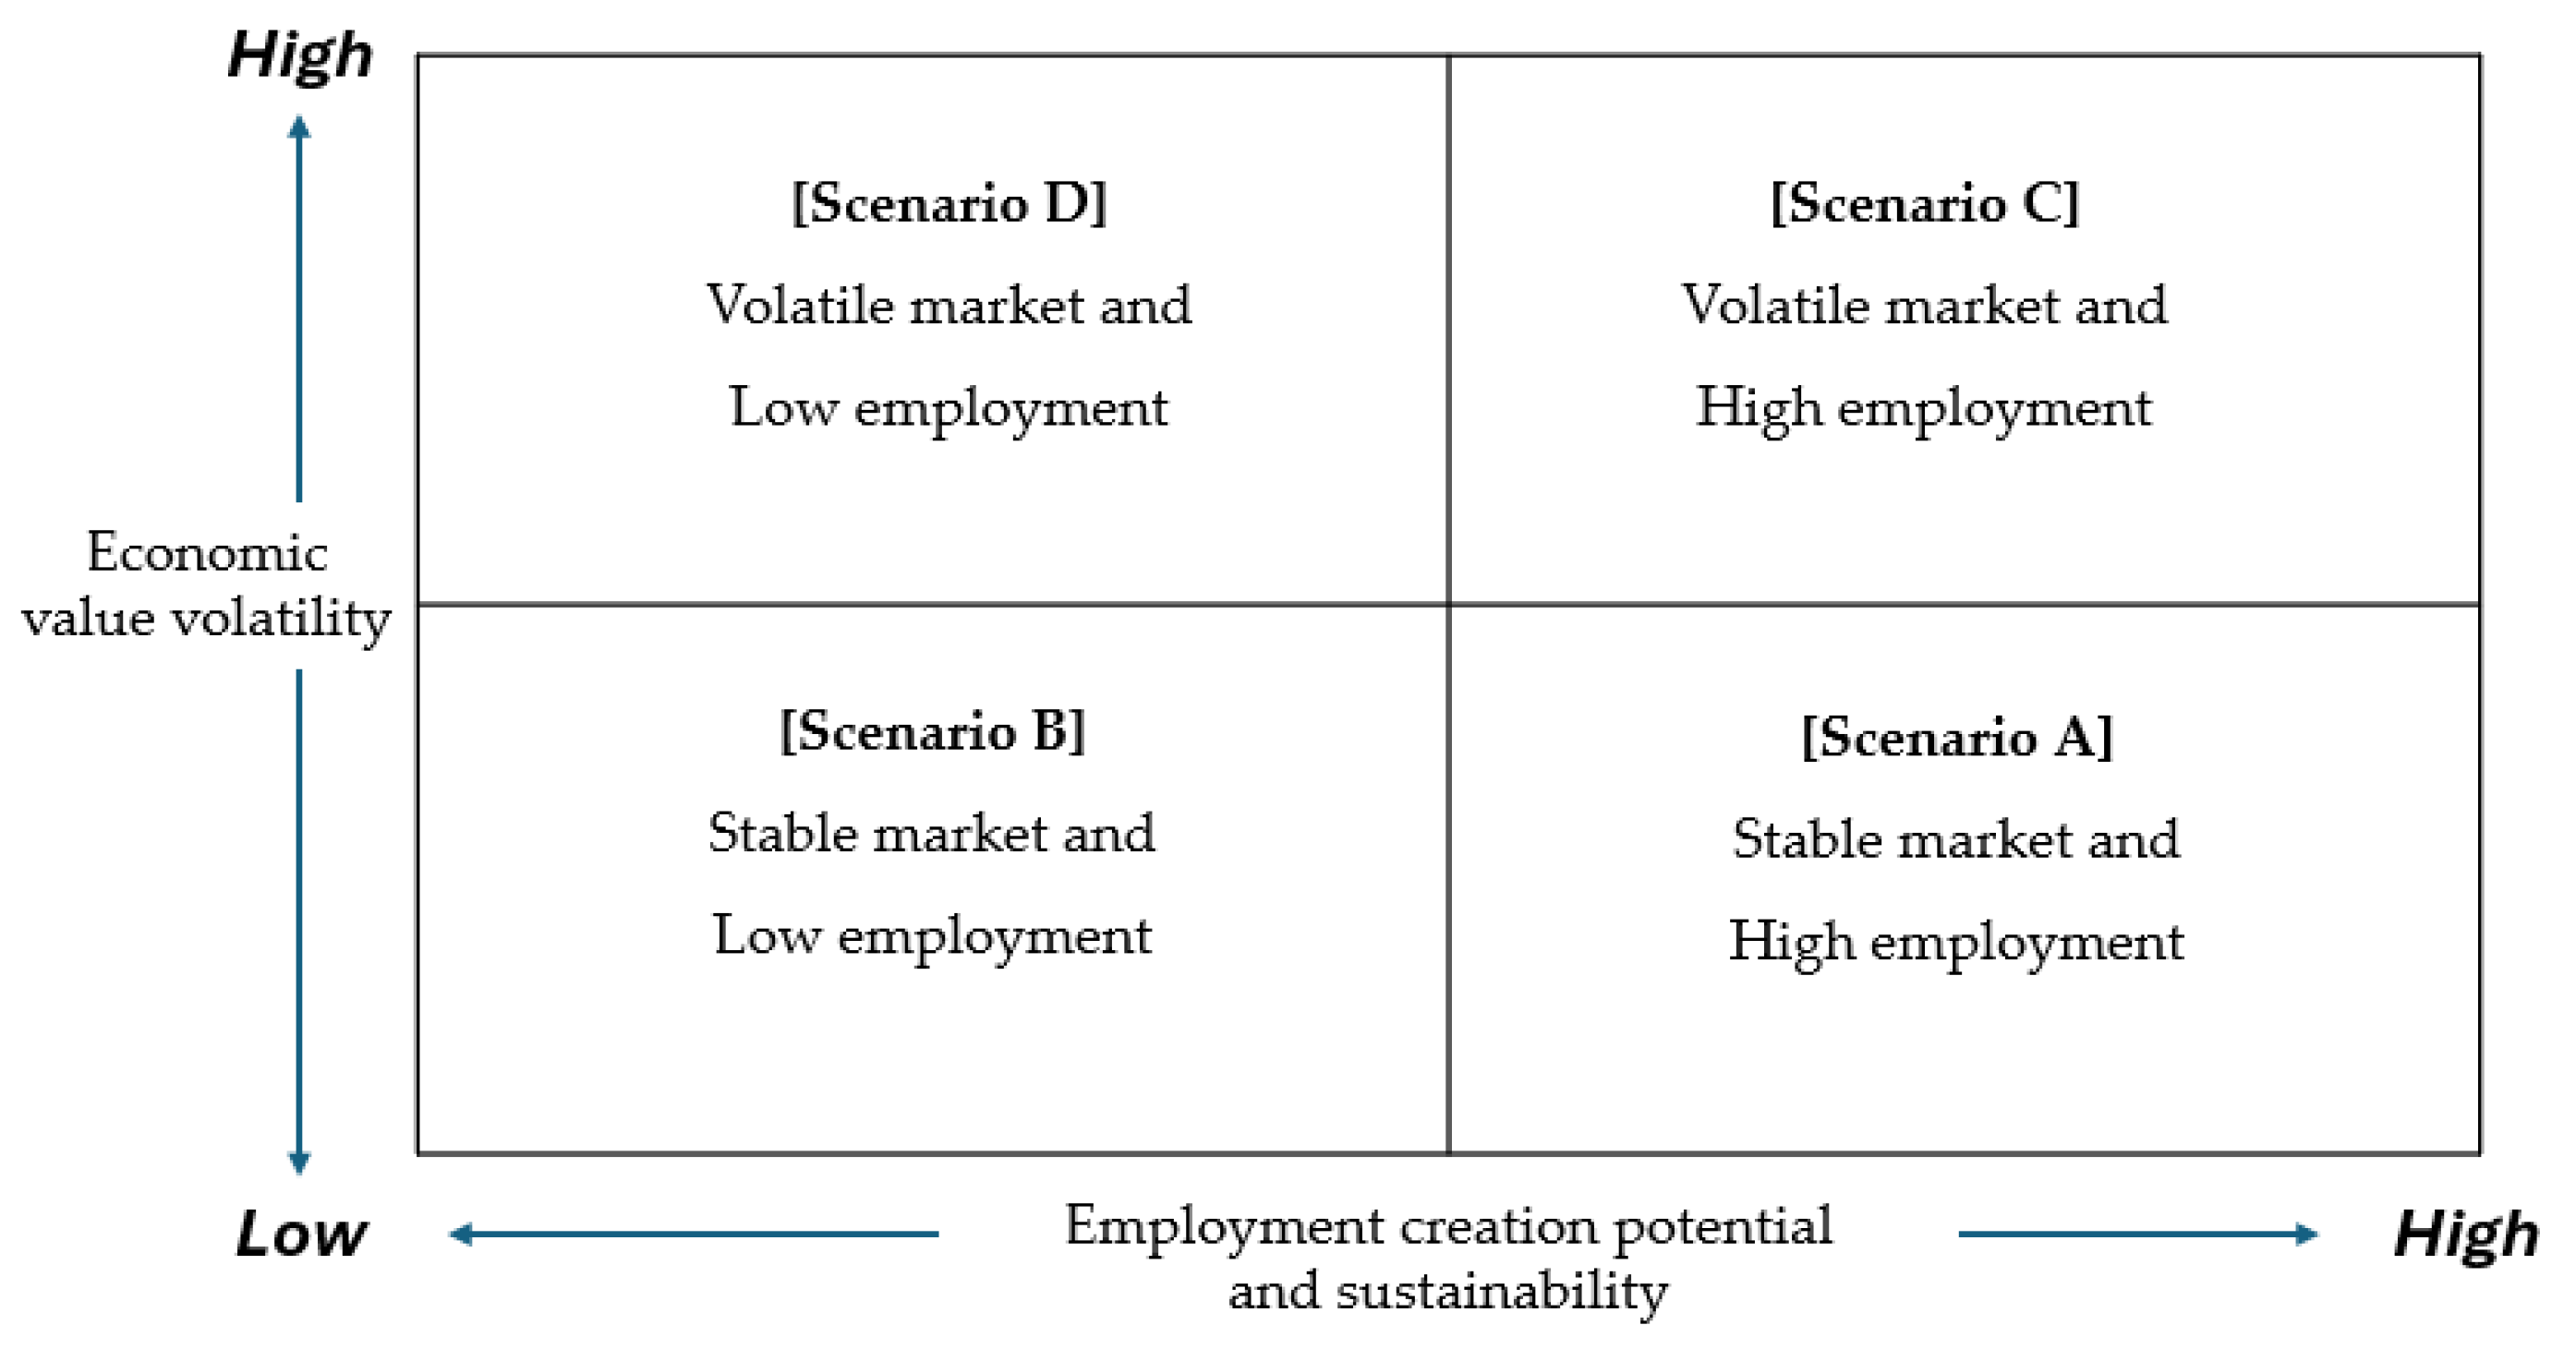
To construct a 2 × 2 scenario matrix, we selected economic value volatility (EE, 13.37%), employment creation potential and sustainability (SS, 10.68%), and increased transparency requirements (PG, 8.60%) as the final uncertainty factors based on their standard deviations obtained from the Monte Carlo simulation. The two factors with the highest standard deviations—employment creation potential and sustainability (X-axis) and economic value volatility (Y-axis)—were designated as the principal axes, whereas increased transparency requirements were set as a subsidiary factor.
Figure 6 presents a 2 × 2 scenario matrix constructed with employment creation potential and sustainability on the X-axis and economic value volatility on the Y-axis, with increased transparency requirements as a subsidiary factor. The following four scenarios were derived from this matrix and detailed interpretations and strategic responses to each scenario are discussed in Section 5:
  • Scenario A—This ideal scenario envisions continuous industrial growth facilitated by stable policy support and corporate investment. This occurs when proactive government policies align with long-term corporate investment commitments.
  • Scenario B—In this scenario, while the industrial environment remains stable, advancements in technology and automation limit employment opportunities. This highlights the impact of automation and innovation on employment within the existing industrial framework.
  • Scenario C—Characterized by high market volatility, this scenario perceives active job creation driven by technological innovation and the emergence of new business models, indicating that uncertain market conditions can foster new opportunities.
  • Scenario D—This scenario depicts a situation in which rapid industrial changes, coupled with a focus on automation and efficiency, adversely affect the labor market, emphasizing the negative impact of automation on employment amid high volatility.

5. Discussion

The scenarios presented in this study are not speculative narratives but are grounded in statistically significant uncertainty drivers. Final scenario axes were selected based on the highest standard deviations derived from 1,000,000 Monte Carlo simulation runs, ensuring interpretability and traceability across empirical outcomes. Building upon the 2 × 2 scenario matrix presented in Figure 6, this section offers a detailed interpretation of each of the four scenarios and derives practical implications for policymakers and industry stakeholders. The analysis focuses on how the interplay of economic value volatility, employment creation potential, and ESG transparency requirements shapes the future trajectories of the EV battery and VPP industries.
In Scenario A, the EV battery and VPP industries sustained stable growth, driven by the increasing demand for electric vehicles and the global transition to sustainable energy. This scenario assumes that strong policy support and long-term corporate investment create a solid foundation for industrial expansion [74]. Consequently, there is a growing demand for highly skilled workers in battery recycling, operation, and data analytics, reflecting a qualitative improvement in employment opportunities rather than simply quantitative growth [75]. This shift contributes to positive social spillover effects as industries benefit from a well-trained workforce. Furthermore, high ESG transparency requirements encourage companies to systematically disclose ESG data, thus fostering long-term corporate value growth and trust building [76]. Given this stable environment, policymakers could further incentivize infrastructure development and R&D through targeted financing or green bond issuance, ensuring continuous industry growth [77,78]. Meanwhile, private enterprises can capitalize on the favorable market by investing in workforce training and retention programs that align with emerging technologies and ESG principles. By doing so, they strengthen their position against future disruptions and maintain public trust. Finally, strengthening ESG disclosure frameworks and establishing regular stakeholder communication channels are crucial to secure long-term trust [79].
In Scenario B, the EV battery and VPP industries maintain stable economic value; however, automation- and efficiency-driven strategies limit new job creation [80]. Although firms operate in a stable market environment, they prioritize cost reduction and productivity enhancement through advanced technology and automation, leading to restrained hiring beyond essential personnel. Even under high transparency requirements, employment growth remains limited, as companies may focus on enhancing environmental sustainability and governance structures to maintain public trust [81]. Given this scenario, companies must maximize cost efficiency through automation, AI, and big data analytics, while selectively hiring a small number of highly skilled specialists [82]. At the same time, governments might focus on upskilling and reskilling the existing workforce by providing targeted educational programs that support high-tech automation skills, and firms should weigh the benefits of automation against the potential reputational risks associated with minimal job creation. By actively communicating their ESG efforts—particularly around environmental stewardship and social contributions—companies can mitigate negative perceptions and maintain stakeholder confidence. Governments and educational institutions should work together to enhance workforce training programs, and firms should actively promote ESG initiatives to demonstrate their commitment to sustainability and ethical management.
Scenario C is characterized by high economic value volatility, leading to rapid market expansion and a surge in employment creation. Although this volatility can generate significant short-term profits, the sustainability of these employment opportunities remains uncertain. Companies may adopt flexible workforce strategies, including project-based contracts and partnerships, to manage this uncertainty [83]. Given the high transparency requirements, firms must be prepared to address the environmental risks and community concerns that may arise during periods of rapid market growth.
Under these conditions, policymakers could implement adaptive regulations and contingency funds to stabilize the market when volatility spikes, minimizing potential negative spillovers. Companies should invest in diversified portfolios spanning energy storage systems, renewables, and VPP solutions to hedge against sudden market downturns. Moreover, engaging in transparent ESG reporting and proactive stakeholder dialogue can help firms maintain credibility even when expansion proceeds at a breakneck pace. To navigate this high-risk, high-reward environment, firms should diversify their energy sector investments, including energy storage systems, renewable energy, and VPP technologies, to hedge against volatility. They should also implement flexible hiring structures, allowing them to quickly scale up or down as needed. Additionally, regular ESG disclosures and transparent risk management processes are essential for maintaining trust among stakeholders.
Scenario D represents a highly volatile economic environment with intense technological competition that severely limits new employment creation. Under these conditions, companies focus on cost reduction and efficiency by prioritizing process automation and AI-driven optimization over new hiring [84]. Instead of expanding their workforce, firms reallocate existing employees and invest in technological advancements. Simultaneously, strict ESG transparency requirements force companies to disclose financial and ESG performance data regularly, compelling them to adopt alternative corporate social responsibility initiatives, such as environmental protection and community engagement, to maintain a positive reputation.
Policymakers in this scenario might need to offer incentives for collaborative R&D among firms, aiming to mitigate the risks of excessive technological competition and ensure that smaller players are not entirely excluded. For businesses, rigorous risk management systems and AI-driven optimization become critical to remaining competitive, but they should also communicate how these efficiency gains contribute to broader environmental or social goals. To withstand extreme market fluctuations, firms must establish rigorous risk management and internal control systems to maintain investor confidence [85]. Moreover, maximizing the use of AI and automation is essential to ensure cost efficiency and competitiveness. Because new employment creation is minimal, firms should focus on enhancing environmental performance and social contribution initiatives to strengthen their corporate image and secure long-term competitiveness.
Unlike previous studies that primarily focused on short-term technological optimization, this study adopted a comprehensive scenario analysis approach that integrates long-term sustainability, social acceptance, policy support, and ESG transparency requirements. By defining economic value volatility and employment creation potential as core uncertainties and incorporating ESG transparency requirements as a secondary factor, this study presents a more holistic perspective on the long-term development pathways of the EV battery and VPP industries beyond purely technological considerations. In particular, the scenario narratives are not abstract descriptions but are directly derived from simulation results based on empirical distributions. The key uncertainties were selected using statistical metrics, namely, standard deviation values extracted from 1,000,000 Monte Carlo simulation runs. These quantified outcomes enabled the construction of a scenario matrix grounded in interpretable numerical patterns, addressing concerns that scenario planning alone may yield overly speculative or vague conclusions. The strategic insights and policy recommendations outlined in each scenario thus provide tangible guidance for government agencies and industry leaders seeking to navigate diverse future conditions, whether stable or volatile, and to align technology investments with ESG priorities.
Furthermore, the scenario-based methodology proposed in this study holds significant potential for supporting national-scale grid stability initiatives. As countries advance their energy transition policies, the integration of electric vehicle (EV) batteries as distributed energy resources within virtual power plants (VPPs) can enhance frequency regulation, demand response, and overall system reliability. Recent studies have demonstrated the technical feasibility of large-scale, bi-directional EV fleet control for ancillary service provision, showing that real-time coordination of EV charging and discharging can effectively contribute to frequency containment and grid balancing using empirical fleet data [86]. Extending the proposed methodology to national-scale simulations would allow policymakers to more accurately anticipate system-level uncertainties and to design resilient energy infrastructures aligned with environmental, social, and governance (ESG) objectives.

6. Conclusions

The findings of this study demonstrate that each scenario provides a multifaceted outlook on market growth potential and employment creation, emphasizing not only technological optimization but also the comprehensive impacts of policy and societal factors on industry development. By highlighting social responsibility and sustainability, which have often been overlooked in previous research, this study clarifies how employment creation and ESG requirements interact under various conditions. Consequently, this study offers strategic directions for businesses and policymakers to navigate evolving market environments effectively.
The academic contribution of this study lies in its broader perspective on the future trajectory of the EV battery and VPP industries. By incorporating social and policy dimensions into a scenario-based framework, it advances long-term industry forecasting beyond the scope of traditional techno-economic analyses. Specifically, the focus on economic value and employment creation potential—paired with ESG transparency—enables a more comprehensive understanding of systemic transitions. From a policy and industry standpoint, this study provides actionable insights into transparency-enhancing governance and workforce development programs. Building on these insights, this study further proposes a decentralized VPP structure that enables the aggregation and coordination of distributed EV-based energy storage systems. This structure leverages digital platforms and intermediary aggregators to manage bidirectional energy flows, facilitate participation in demand response programs, and uphold ESG principles such as fairness, data transparency, and community benefit. These findings serve as practical guidance for stakeholders seeking to align technology investments with sustainability and social value creation.
Furthermore, this study employed a mixed-methods approach that combines scenario planning with Monte Carlo simulations, thereby supplementing traditional qualitative analyses with quantitative uncertainty assessments. By using scenario planning to explore various future pathways and Monte Carlo simulations to provide probabilistic analyses of each pathway, this study produced more reliable and realistic policy recommendations. This hybrid methodology is particularly effective for systematically analyzing uncertainties in complex systems, making it a valuable contribution to future applications across diverse industries. Despite its contributions, this study had several limitations. First, it does not fully incorporate the impacts of external variables, such as regulatory changes, geopolitical dynamics, and the pace of technological innovation. Future research should expand the scenario analysis by integrating quantitative models and empirical data to account for these external factors. In addition, more empirical case studies should be conducted to enhance the practical applicability of these findings for industry professionals. This study provides a comprehensive perspective on the development of the EV battery and VPP industries, reaffirming the significance of sustainable energy transitions and social value creation from an ESG perspective. The findings offer valuable implications for policy formulation and corporate strategy, and serve as a foundational reference for future refined research in this field.

Author Contributions

Conceptualization, S.C. and K.C.; methodology, S.C.; software, S.C.; validation, S.C.; formal analysis, S.C.; writing—original draft preparation, S.C.; writing—review and editing, S.C. and K.C.; supervision, K.C. All authors have read and agreed to the published version of the manuscript.

Funding

This research received no external funding.

Institutional Review Board Statement

Ethical review and approval were waived for this study.

Informed Consent Statement

Informed consent was obtained from all subjects involved in the study.

Data Availability Statement

The data used to support the findings of this study are included in the article.

Conflicts of Interest

The authors declare no conflicts of interest.

Appendix A

Table A1. Abbreviations and key terms.
AbbreviationFull TermDefinition
EVElectric VehicleA vehicle powered fully or partially by electricity stored in a battery
VPPVirtual Power PlantA network of decentralized energy resources coordinated through digital technologies to function as a single power plant
ESGEnvironmental, Social, and GovernanceA set of non-financial criteria used to evaluate sustainability and ethical impact
PESTPolitical, Economic, Social, and TechnologicalA macro-environmental framework used to identify external factors affecting an organization or system
Monte Carlo
Simulation
A computational method that uses repeated random sampling to model the probability of different outcomes
PEPolitical/EnvironmentalFactors at the intersection of policy direction and environmental regulation (e.g., carbon neutrality policies)
PGPolitical/GovernanceVariables related to policy coordination and institutional transparency
PSPolitical/SocialFactors describing how policy changes influence public participation and consensus
EEEconomic/EnvironmentalAspects covering economic feasibility and environmental risks (e.g., battery cost vs. carbon impact)
ESEconomic/SocialFactors exploring how economic changes affect social outcomes (e.g., job creation through new business models)
EGEconomic/GovernanceGovernance aspects of sustainable investment and financial risk management
SESocial/EnvironmentalIntersections between public awareness and environmental sustainability
SSSocial/SocialCommunity-level impacts such as employment sustainability and public trust
SGSocial/GovernanceSocial acceptance and stakeholder confidence in governance structures
Table A2. Interview questions for the initial uncertainty identification.
CategoryQuestion
Political/Environment (PE)What are the potential uncertainties related to future policies and environmental regulations that may arise in the context of utilizing electric vehicle (EV) batteries as a resource in virtual power plants (VPPs)?
Social (PEST)/Environment (SE)What uncertainties are associated with changes in public perception regarding environmental improvements and contributions?
Economic/Environment (EE)What uncertainties are related to the economic support measures required for rapid environmental improvement?
Political/Social (ESG) (PS)What uncertainties exist in terms of policy support and relevant regulations for achieving social contributions?
Social (PEST)/Social (ESG) (SS)What uncertainties can be considered from the perspective of social responsibility and shifts in public perception?
Economic/Social (ESG) (ES)What uncertainties may affect economic viability in the context of social contributions?
Political/Governance (PG)What are the uncertainties related to the regulatory and technical requirements, as well as future uncertainties, from a policy and technological standpoint?
Social (PEST)/Governance (SG)What future uncertainties should be considered to strengthen the sustainability of the project?
Economic/Governance (EG)What uncertainties could impact the continuous economic viability and the achievement of ESG (environmental, social, and governance) performance?
Table A3. Interview questions for initial variable extraction.
CategoryUncertaintyQuestion
PELegal amendment potentialWhat legal and regulatory considerations are necessary to expand the scope of EV battery utilization within the next five years?
SEPerception changesWhat changes and underlying factors can be used to assess the shift in the public perception of EV batteries as an environmentally friendly energy source?
EEEconomic value volatilityWhat factors are anticipated to influence the volatility of economic value concerning electric vehicle (EV) batteries and virtual power plants (VPPs)?
PSTechnical education and workforce development policiesWhat are the essential considerations for educational policies aimed at technical training and workforce development in the EV battery and VPP sectors?
SSEmployment creation potential and sustainabilityWhat factors need to be continuously monitored from an employment creation perspective to sustain the promotion of EV battery recycling and the VPP industry?
ESActivation of the sharing economy and potential for business model innovationWhat indicators can be used to assess the potential for activating the sharing economy and creating new business models through the utilization of VPPs?
PGIncreased transparency requirementsWhat factors can increase the transparency of the VPP and EV battery resource processes?
SGSustained marketing investmentWhat factors should be considered when evaluating the potential for continued marketing investments to boost participation rates in VPPs and EV battery-related services?
EGNeed for sustainable investment and capital influx volatilityWhat considerations must be examined to ensure sustainable investments aimed at achieving ESG goals and managing capital influx volatility?
Table A4. Results of the initial identification of uncertainty factors.
Category#Uncertainty Factors/Concise Expression
PE6
-
Potential changes in policies for expanding the utilization of EV batteries/Legal amendment potential
-
Linkage with distributed energy resource support policies/Policy linkage
-
Changes in government subsidy policies/Government subsidy policy changes
-
Potential changes in EV battery production and waste management regulations/Regulatory change potential
-
Linkage with international environmental agreements/International agreement linkage
-
Possibility of introducing mandatory renewable energy usage policies linked with VPP/Renewable energy mandate
SE5
-
Changes in public perception of eco-friendly energy sources, such as EV batteries/Perception changes
-
The gap between the expected and actual environmental benefits of VPPs/Expectation vs. actual effect
-
Changes in methods for assessing the environmental contribution of EV batteries and VPP systems/Assessment method changes
-
Perceptions of environmental impacts from the expansion of EV battery recycling facilities/Recycling facility expansion impact
-
Potential community opposition to VPP and EV battery utilization/Community opposition
EE6
-
Economic value volatility of EV batteries and VPPs/Economic value volatility
-
Changes in subsidies and tax incentives related to distributed energy resources/Subsidy and tax incentive changes
-
Changes in investment costs per unit of environmental improvement/Investment cost changes
-
Changes in the cost structure due to fluctuations in raw material prices (e.g., lithium and cobalt) for batteries/Raw material price fluctuations
-
Economic value of technologies improving battery energy storage efficiency/Economic value of energy storage efficiency technologies
-
Economic growth potential of the battery recycling market/Recycling market growth potential
PS5
-
Changes in legal regulations for VPP and energy resource management/Legal regulation changes
-
Policies for community engagement and conflict resolution in the development of EV battery and VPP infrastructure/Community engagement and conflict resolution policies
-
Educational policies for technical training and workforce development related to EV batteries and VPPs/Technical education and workforce development policies
-
Whether to mandate educational programs related to VPPs and EV batteries/Mandating educational programs
-
Provision of financial incentives to promote community participation/Financial incentive provision
SS6
-
Employment creation potential and sustainability due to EV battery recycling and VPPs, and the sustainability of such employment/Employment creation potential and sustainability
-
Changes in trust regarding EV batteries and VPP systems/Reliability changes
-
Shifts in the perception of technologies related to VPPs and EV batteries/Technology perception changes
-
Concerns regarding the expansion of the EV battery-based infrastructure/Concerns about infrastructure expansion
-
Social inequality in access to technology related to VPPs and EV batteries/Social inequality in technology access
-
Intergenerational differences in the perceptions of renewable energy resource technologies/Intergenerational perception differences
ES4
-
Potential for activating the sharing economy and creating new business models through VPPs/Activation of the sharing economy and potential for business model innovation
-
Economic value of new job categories related to VPPs and EV batteries/Economic value of new job categories
-
Creation and diversification of local economic business models linked to VPPs and EV batteries/Local economic business model creation and diversification
-
Volatility in service pricing for VPPs and EV batteries/Service pricing volatility
PG4
-
Increased demand for transparency in pricing and transactions between consumers and energy providers in VPP and EV battery utilization/Increased transparency requirements
-
Changes in collaboration and regulatory direction between policymakers and government agencies/Policy collaboration and regulatory direction changes
-
Development of technical standards and policy guidelines for VPP and EV battery utilization/Technical standard and policy guideline development
-
Introduction of regulatory sandboxes for the VPP and EV battery industries/Regulatory sandbox introduction
SG5
-
Ensuring transparency and strengthening relevant regulations/Transparency and regulatory strengthening
-
The need for specific measures to enhance stakeholder trust and the potential for conflicts/Stakeholder trust enhancement and conflict potential
-
The need for continuous marketing investment to encourage participation/Sustained marketing investment
-
Increasing demand from consumers and investors for the disclosure of ESG performance/Demand for ESG performance disclosure
-
Enforcing environmental responsibility in the use of VPPs and batteries/Strengthening environmental responsibility in VPP and battery use
EG5
-
The need for sustainable investment to achieve ESG goals and the volatility of capital inflows/Need for sustainable investment and capital influx volatility
-
Potential changes in financial regulations and support programs related to ESG investments/ESG investment-related financial regulations and support program changes
-
Whether to establish a collaborative framework between public and private investment institutions/Public–private investment institution collaboration framework
-
Changes in performance evaluation metrics related to ESG investments/ESG investment performance evaluation metrics changes
-
Diversification of financing models related to VPPs and batteries/VPP and battery financing model diversification
Table A5. Results of the selection of the primary uncertainty factors.
CategoryUncertainty (Number of Expert Selections)
PE
-
Legal amendment potential (15)/Policy linkage (12)/Government subsidy policy changes (11)
SE
-
Perception changes (15)/Expectation vs. actual effect (11)/Assessment method changes (9)
EE
-
Economic value volatility (17)/Subsidy and tax incentive changes (16)/Investment cost changes (7)
PS
-
Legal regulation changes (13)/Community engagement and conflict resolution policies (13)/Technical education and workforce development policies (12)
SS
-
Employment creation potential and sustainability (15)/Reliability changes (15)/Technology perception changes (9)
ES
-
Activation of the sharing economy and potential for business model innovation (16)/Economic value of new job categories (15)/Local economic business model creation and diversification (13)
PG
-
Increased transparency requirements (15)/Policy collaboration and regulatory direction changes (15)/Technical standard and policy guideline development (13)
SG
-
Transparency and regulatory strengthening (13)/Stakeholder trust enhancement and conflict potential (12)/Sustained marketing investment (12)
EG
-
Need for sustainable investment and capital influx volatility (16)/ESG investment-related financial regulations and support program changes (12)/Public–private investment institution collaboration framework (12)
Table A6. Results of the selection of secondary uncertainty factors.
CategoryUncertaintyESG Correction
HighMediumLowTotal
(Weighted)
Political/Environment (PE)Legal amendment potential26186120
Policy linkage27149118
Government subsidy policy changes201812108
Political/Society (PS)Technical education and workforce development policies211811110
Community engagement and conflict resolution policies9202188
Legal regulation changes211514107
Political/Governance (PG)Policy collaboration and regulatory direction changes181814104
Technical standard and policy guideline development9271495
Increased transparency requirements18248110
Social/Environment (SE)Perception changes221711111
Assessment method changes6321294
Expectation vs. actual effect6291591
Social/Society (SS)Technology perception changes142214100
Reliability changes191714105
Employment creation potential and sustainability17285112
Social/Governance (SG)Sustained marketing investment18239109
Transparency and regulatory strengthening5301590
Stakeholder trust enhancement and conflict potential152312103
Economic/Environment (EE)Economic value volatility211712109
Subsidy and tax incentive changes122612100
Investment cost changes122612100
Economic/Society (ES)Economic value of new job categories15181798
Activation of the sharing economy and potential for business model innovation14306108
Local economic business model creation and diversification9301198
Economic/Governance (EG)Need for sustainable investment and capital influx volatility201812108
ESG investment-related financial regulations and support program changes9329100
Public–private investment institution collaboration framework182111107
Table A7. Results of the initial variable extraction and final variable selection.
CategoryUncertainty#Results of the Initial Variable Extraction and Final Variable Selection
PELegal amendment potential5Legal amendment potential (16)/Intensity of legal amendments (15)/Timing of legal amendments (13)/Scope of legal amendments/International alignment of legal amendments
SEPerception changes4Changes in public perception (15)/Increase in the technology adoption rate due to changes in perception (15)/Changes in the public trust index (11)/Media coverage and tone
EEEconomic value volatility6Intensity of competition (14)/Policy support (10)/Level of technological innovation (8)/Fluctuations in raw material prices/Balance of market supply and demand/Fluctuations in energy prices
PSTechnical education and workforce development policies7Expansion of technical education programs (12)/Quality of educational programs (10)/Investment ratio in educational budgets (9)/Level of educational infrastructure and facilities/Alignment with industry demand/Faculty expertise and capabilities/Level of international cooperation and exchange
SSEmployment creation potential and sustainability7Government employment subsidy support (11)/Sustainability of employment (11)/Employment growth (9)/Mismatch between labor demand and supply/Inter-industry synergies/Scale of corporate investments/Pace of technological innovation
ESActivation of the sharing economy and potential for business model innovation6Number of business models (16)/Growth rate of the sharing economy’s revenue (13)/Participation rate of startups and emerging companies (11)/Speed of technology adoption/Amount and frequency of investments/Number of partnerships and collaborations
PGIncreased transparency requirements5Level of transparency requirements (15)/Rate of transparency requirement fulfillment (14)/Cost of regulatory compliance (11)/Data accessibility/Frequency of report and document disclosures
SGSustained marketing investment5Marketing investments (13)/Customer conversion rate (13)/Marketing effectiveness (12)/Customer satisfaction index/Market share fluctuations
EGNeed for sustainable investment and capital influx volatility6Achievement rate of ESG goals (14)/Private capital inflow ratio (13)/Investment payback period (13)/Proportion of assets in sustainable investments/Investor perceptions and expectations/Standardization of ESG investment performance evaluation methods
Table A8. Results of the extraction of probability distribution parameters.
UncertaintyVariableProbability DistributionParameters
(PE) Legal amendment potentialLegal amendment potentialBinomial Distribution
  • Value: 0 (No legal amendment), 1 (Legal amendment present)
  • Probability:
    -
    Legal amendment present—80%
    -
    No legal amendment—20%
Intensity of legal amendmentsNormal Distribution
  • Value: The intensity of the legal amendment’s impact on the scope of EV battery utilization is set between 0 and 100%.
    -
    Mean—80% (indicating the expectation of active policy implementation)
    -
    Standard deviation—15% (reflecting the potential for higher or lower policy intensity)
Timing of legal amendmentsTriangular Distribution
  • Value: The timing of the legal amendment (1 to 5 years)
    -
    Minimum value—1 year | mode—3 years | maximum value—5 years
(SE) Perception changesChanges in public perceptionNormal Distribution
  • Value: 0 to 100% (0 indicates no change in perception, 100 indicates a very high rate of change)
    -
    Mean—50% (indicating an expected moderate level of perception change)
    -
    Standard deviation—20% (reflecting the variability in the rate of perception change)
Changes in the public trust indexNormal Distribution
  • Mean: 50% (indicating a moderate level of confidence)
  • Standard deviation: 20%
  • Range: 0 to 100%
Increase in the technology adoption rate due to changes in perceptionTriangular Distribution
  • Low perception change (0–30%): minimum value—3%, mode—7%, maximum value —10%
  • Moderate perception change (30–70%): minimum value—7%, mode—15%, maximum value—20%
  • High perception change (70–100%): minimum value—15%, mode—25%, maximum value—35%
(EE) Economic value volatilityIntensity of competitionNormal Distribution
  • Mean: 50% (indicating a moderate level of competitive intensity)
  • Standard deviation: 20% (reflecting the variability in competitive intensity)
  • Range: 0 to 100%
Policy supportDiscrete Probability Distribution
  • 0 (No support): 30%
  • 50 (Moderate support): 50%
  • 100 (Strong support): 20%
Level of technological innovationTriangular Distribution
  • Minimum value: 10% (low level of innovation)
  • Mode: 30% (average level of innovation)
  • Maximum value: 50% (high level of innovation)
(PS) Technical education and workforce development policiesExpansion of technical education programsBinomial Distribution
  • Value: 0 (No expansion), 1 (Expansion present)
    -
    Probability distribution
    -
    Expansion present—70% (reflecting the trends of energy transition policies and strengthened ESG focus)
    -
    No expansion—30%
Quality of educational programsNormal Distribution
  • Value: The qualitative level of the educational program is set between 0% and 100%.
    -
    Probability distribution
    -
    Mean—65% (indicating an expected above-average qualitative level)
    -
    Standard deviation—15% (reflecting the variability in the operational capabilities of different educational institutions)
Investment ratio in educational budgetsTriangular Distribution
  • Value: The proportion (%) of the energy-related education budget allocated to VPP and EV battery technology training
    -
    Probability distribution
    -
    Minimum value—5% (early stage)
    -
    Mode—15% (mid-level, policy implementation)
    -
    Maximum value—25% (budget expansion under strong policy support)
(SS) Employment creation potential and sustainabilityGovernment employment subsidy supportTriangular Distribution
  • Minimum value: 0% (no subsidy policy applied)
  • Mode: 50% (moderate level of policy intervention—stable industry support)
  • Maximum value: 100% (comprehensive support—promotion of large-scale industry growth)
Sustainability of employmentNormal Distribution
  • Value: Employment sustainability is set between 0% and 100% (0 is very low and 100is very high)
  • Mean: 65% (reflecting the continuous demand in the VPP and EV battery industries)
  • Standard deviation: 20% (reflecting uncertainty due to industry growth and policy changes)
Employment growthTriangular Distribution
  • Low sustainability (≤ 50%): minimum, −2%; mode, 0%; maximum, 2%
  • Moderate sustainability (50–80%): minimum, 2%; mode, 5%; maximum, 7%
  • High sustainability (≥ 80%): minimum, 5%; mode, 12%; maximum, 18%
(ES) Activation of the sharing economy and potential for business model innovationNumber of business modelsPoisson Distribution
  • Mean (λ): 5 (assuming 5 new business models are introduced on average per year)
  • Range:
    -
    Minimum value—0 (indicating that no models are likely to be created)
    -
    Maximum value—15 (in the case of active creation activities)
Growth rate of the sharing economy’s revenueNormal Distribution
  • Mean: 10% (annual average revenue growth rate)
  • Standard deviation: 5% (reflecting market volatility)
  • Range: 0 to 30%
Participation rates of startups and emerging companiesTriangular Distribution
  • Minimum value: 10% (low participation rate in the early stage)
  • Mode: 40% (average participation rate)
  • Maximum value: 70% (high participation rate)
  • Range: 10% to 70%
(PG) Increased transparency requirementsLevel of transparency requirementsNormal Distribution
  • Value: 0 to 100% (0 indicates no demand, 100% indicates very high demand)
    -
    Mean—70% (reflecting the current high level of transparency requirements)
    -
    Standard deviation—20% (reflecting the variability in the demand level)
Rate of transparency requirement fulfillmentTriangular Distribution
  • Value: The percentage (0–100%) of transparency requirements met by the company
    -
    Distribution
    -
    Minimum value—30% (difficult to meet due to technical and financial limitations)
    -
    Mode—60% (average level of response by typical companies)
    -
    Maximum value—80% (proactive compliance by leading companies)
Cost of regulatory complianceTriangular Distribution
  • Minimum value: 1% (low regulation and minimal costs)
  • Mode: 5% (typical level of regulatory compliance costs)
  • Maximum value: 10% (high costs resulting from strengthened regulatory enforcement)
(SG) Sustained marketing investmentMarketing investmentsBinomial Distribution
  • Value: 0 (No investment), 1 (Investment executed)
  • Probability
  • Investment executed—70% (reflecting high initial market interest in EV batteries and VPP)
  • No investment—30%
Customer conversion rateTriangular Distribution
  • When the marketing investment is 0 (No investment):
    -
    Minimum value (left) = 1%/Mode (mode) = 3%/Maximum value (right) = 5%
  • When the marketing investment is 1 (Investment made):
    -
    Minimum value (left) = 5%/Mode (mode) = 10%/Maximum value (right) = 15%
Marketing effectivenessTriangular Distribution
  • When the marketing investment is 0 (No investment):
    -
    Minimum value (left) = 5%/Mode (mode) = 7%/Maximum value (right) = 10%
  • When the marketing investment is 1 (Investment made):
    -
    Minimum value (left) = 10%/Mode (mode) = 20%/Maximum value (right) = 30%
(EG) Need for sustainable investment and capital influx volatilityAchievement rate of ESG goalsTriangular Distribution
  • Minimum value: 20% (low ESG achievement rate)
  • Mode: 50% (moderate level of goal achievement)
  • Maximum value: 80% (high ESG goal achievement rate)
  • Range: 20% to 80%
Private capital inflow ratioNormal Distribution
  • Mean: 40% (proportion of total investment accounted for by private capital)
  • Standard deviation: 10% (reflecting economic and market volatility)
  • Range: 10% to 70% (to prevent extreme scenarios)
Investment payback periodLog-Normal Distribution
  • Mean (Median): 5 years (typical investment payback period)
  • Standard deviation: 1.825 years (reflecting volatility)
  • Range: 2 years to 15 years (including extreme scenarios)
Table A9. Final results of the simulation.
CategoryUncertaintySimulation Results
AverageMaximumMinimumStandard Deviation
PELegal amendment potential23.60%30.30%2.69%4.16%
SEPerception changes39.36%79.84%1.24%11.06%
EEEconomic value volatility42.36%84.78%3.30%13.37%
PSTechnical education and workforce development policies24.27%37.86%2.68%4.63%
SSEmployment creation potential and sustainability40.97%74.32%0.63%10.68%
ESActivation of the sharing economy and potential for business model innovation17.01%31.37%3.66%4.06%
PGIncreased transparency requirements49.61%71.51%12.00%8.60%
SGSustained marketing investment8.59%13.83%1.85%3.11%
EGNeed for sustainable investment and capital influx volatility28.72%50.88%5.89%5.45%
Table A10. Results of the sensitivity analysis.
CategoryUncertaintyVariableSensitivity Analysis Results for the Market Growth Rate Standard DeviationWhether the Difference in Results Is Within 1%
−10%Standard10%
PELegal amendment potentialLegal amendment potential4.16%4.16%4.16%O
Intensity of legal amendments3.75%4.16%4.00%O
Timing of legal amendments4.16%4.16%4.16%O
SEPerception changesChanges in public perception10.22%11.06%11.79%O
Changes in public trust index10.75%11.06%11.34%O
Increase in technology adoption rate due to changes in perception10.94%11.06%11.18%O
EEEconomic value volatilityIntensity of competition12.92%13.37%13.85%O
Policy support12.56%13.37%13.48%O
Level of technological innovation13.33%13.37%13.42%O
PSTechnical education and workforce development policiesExpansion of technical education programs4.63%4.63%4.63%O
Quality of educational programs4.21%4.63%4.93%O
Investment ratio in educational budgets4.60%4.63%4.67%O
SSEmployment creation potential and sustainabilityGovernment employment subsidy support10.07%10.68%11.28%O
Sustainability of employment10.32%10.68%10.84%O
Employment growth10.58%10.68%10.73%O
ESActivation of the sharing economy and potential for business model innovationNumber of business models4.04%4.06%4.08%O
Growth rate of the sharing economy’s revenue4.01%4.06%4.11%O
Participation rates of startups and emerging companies3.73%4.06%4.39%O
PGIncreased transparency requirementsLevel of transparency requirements7.94%8.60%8.74%O
Rate of transparency requirement fulfillment8.41%8.60%8.80%O
Cost of regulatory compliance8.60%8.60%8.60%O
SGSustained marketing investmentMarketing investments3.27%3.11%3.11%O
Customer conversion rate3.01%3.11%3.21%O
Marketing effectiveness2.92%3.11%3.31%O
EGNeed for sustainable investment and capital influx volatilityAchievement rate of ESG goals5.46%5.45%5.93%O
Private capital inflow ratio5.42%5.45%5.96%O
Investment payback period5.64%5.45%5.69%O

Appendix B

Access to the Simulation Code
-
The Python code used for the Monte Carlo simulations presented in this study is publicly available at the following GitHub repository: https://github.com/HenryChoi-1039/EV_VPP_MonteCarlo_Simulation (accessed on 26 March 2025)
Users are encouraged to cite this repository if using or adapting the code for academic or practical applications.

References

  1. Lau, H.C.; Tsai, S.C. Global Decarbonization Current Status and What It Will Take to Achieve Net Zero by 2050. Energies 2023, 16, 7800. [Google Scholar] [CrossRef]
  2. Schmietendorf, K.; Peinke, J.; Kamps, O. The Impact of Turbulent Renewable Energy Production on Power Grid Stability and Quality. Eur. Phys. J. B 2017, 90, 222. [Google Scholar] [CrossRef]
  3. Liu, R.; Liu, Y.; Jing, Z. Impact of Industrial Virtual Power Plant on Renewable Energy Integration. Glob. Energy Interconnect. 2020, 3, 545–552. [Google Scholar] [CrossRef]
  4. Dielmann, K.; van der Velden, A. Virtual Power Plants (VPP)—A New Perspective for Energy Generation? In Proceedings of the 9th International Scientific and Practical Conference of Students, Post-Graduates Modern Techniques and Technologies, MTT, Tomsk, Russia, 7–11 April 2003; IEEE: Piscataway, NJ, USA, 2003. [Google Scholar]
  5. Pasetti, M.; Rinaldi, S.; Manerba, D. A Virtual Power Plant Architecture for the Demand-Side Management of Smart Prosumers. Appl. Sci. 2018, 8, 432. [Google Scholar] [CrossRef]
  6. Lund, H.; Kempton, W. Integration of Renewable Energy into the Transport and Electricity Sectors Through V2G. Energy Policy 2008, 36, 3578–3587. [Google Scholar] [CrossRef]
  7. Rubino, L.; Capasso, C.; Veneri, O. Review on Plug-in Electric Vehicle Charging Architectures Integrated with Distributed Energy Sources for Sustainable Mobility. Appl. Energy 2017, 207, 438–464. [Google Scholar] [CrossRef]
  8. Nitlarp, T.; Kiattisin, S. The Impact Factors of Industry 4.0 on ESG in the Energy Sector. Sustainability 2022, 14, 9198. [Google Scholar] [CrossRef]
  9. Popescu, C.; Hysa, E.; Kruja, A.; Mansi, E. Social Innovation, Circularity, and Energy Transition for Environmental, Social, and Governance (ESG) Practices—A Comprehensive Review. Energies 2022, 15, 9028. [Google Scholar] [CrossRef]
  10. Veza, I.; Asy’Ari, M.Z.; Idris, M.; Epin, V.; Fattah, I.R.; Spraggon, M. Electric Vehicle (EV) and Driving Towards Sustainability: Comparison Between EV, HEV, PHEV, and ICE Vehicles to Achieve Net Zero Emissions by 2050 from EV. Alex. Eng. J. 2023, 82, 459–467. [Google Scholar] [CrossRef]
  11. Foa, R.; Howard, M. Use of Monte Carlo Simulation for the Public Sector: An Evidence-Based Approach to Scenario Planning. Int. J. Mark. Res. 2006, 48, 27–48. [Google Scholar] [CrossRef]
  12. Gordon, A.V. Matrix Purpose in Scenario Planning: Implications of Congruence with Scenario Project Purpose. Futures 2020, 115, 102479. [Google Scholar]
  13. Argiolas, L.; Stecca, M.; Ramirez-Elizondo, L.M.; Soeiro, T.B.; Bauer, P. Optimal battery energy storage dispatch in energy and frequency regulation markets while peak shaving an EV fast charging station. IEEE Open Access J. Power Energy 2022, 9, 374–385. [Google Scholar] [CrossRef]
  14. Salvatore, M.; Giuseppe, N. Electric Vehicles for a flexible energy system: Challenges and opportunities. Energies 2024, 17, 5614. [Google Scholar] [CrossRef]
  15. Caminiti, C.M.; Brigatti, L.G.; Spiller, M.; Rancilio, G.; Merlo, M. Unlocking Grid Flexibility: Leveraging Mobility Patterns for Electric Vehicle Integration in Ancillary Services. World Electr. Veh. J. 2024, 15, 413. [Google Scholar] [CrossRef]
  16. Qureshi, U.; Andrabi, I.; Manzoor, M.; Khan, S.J.; Gul, O.; Farooq, F. Optimizing Electric Vehicle Integration in Virtual Power Plants: A Stochastic Optimization Framework with MDNN Integration. IEEE Trans. Ind. Inform. 2024, 60, 9227–9236. [Google Scholar]
  17. Li, J.; Peng, D.; Zhao, H.; Wang, D.; Qi, E. A ‘Spatial-Temporal’ Bi-Layer Optimal Control Strategy of Large-Scale Electric Vehicles (EVs) in a Multi-Area Virtual Power Plant (VPP) Oriented to Dual Carbon Target. IET Renew. Power Gener. 2022, 16, 1445–1461. [Google Scholar] [CrossRef]
  18. Wang, W.; Chen, P.; Zeng, D.; Liu, J. Electric Vehicle Fleet Integration in a Virtual Power Plant With Large-Scale Wind Power. IEEE Trans. Ind. Inform. 2020, 16, 5612–5620. [Google Scholar]
  19. Zhou, B.; Zhang, K.; Chan, K.W.; Li, C.; Lu, X.; Bu, S. Optimal Coordination of Electric Vehicles for Virtual Power Plants With Dynamic Communication Spectrum Allocation. IEEE Trans. Ind. Inform. 2020, 16, 5612–5623. [Google Scholar] [CrossRef]
  20. Harsh, P.; Sun, H.; Das, D.; Awagan, G.; Jiang, J. A Stochastic Incentive-Based Demand Response Program for Virtual Power Plant with Solar, Battery, Electric Vehicles, and Controllable Loads. arXiv 2024, arXiv:2406.00163 2024. [Google Scholar]
  21. Madhusudhan, A.; Prasad, G.L.; Yeonbae, K.; Prakash, A.; Bahadur, K.S. Identification and analysis of barriers against electric vehicle use. Sustainability 2020, 12, 4850. [Google Scholar] [CrossRef]
  22. Wüstenhagen, R.; Wolsink, M.; Bürer, M.J. Social Acceptance of Renewable Energy Innovation: An Introduction to the Concept. Energy Policy 2007, 35, 2683–2691. [Google Scholar] [CrossRef]
  23. David, A.O.; Al-Anbagi, I. EVs for frequency regulation cost benefit analysis in a smart grid environment. IET Electr. Syst. Transp. 2017, 7, 310–317. [Google Scholar] [CrossRef]
  24. Matz Ringdgren, H.; Vandhold, H. Scenario Planning; Filmak: Sinalunga, Italy, 2012. [Google Scholar]
  25. Chen, K.; Ren, Z.; Mu, S.; Sun, T.Q.; Mu, R. Integrating the Delphi Survey into Scenario Planning for China’s Renewable Energy Development Strategy Towards 2030. Technol. Forecast. Soc. Change 2020, 158, 120157. [Google Scholar] [CrossRef]
  26. Fathi, M.R.; Maleki, M.H.; Sobhani, S.M.; Koksal, C.D. Future Study of Operations Research Based on Scenario Planning and Soft Systems Methodology. Foresight 2020, 22, 223–249. [Google Scholar] [CrossRef]
  27. Mietzner, D.; Reger, G. Advantages and Disadvantages of Scenario Approaches for Strategic Foresight. Int. J. Technol. Intell. Plan. 2005, 1, 220–239. [Google Scholar] [CrossRef]
  28. Sikander, A. Scenario-Planning as a Stand-Alone Tool for Strategic Foresight: Limitations and Options. Change Manag. Int. J. 2016, 16, 13–18. [Google Scholar] [CrossRef]
  29. Mun, J. Modeling Risk: Applying Monte Carlo Simulation, Real Options Analysis, Forecasting, and Optimization Techniques; John Wiley & Sons: Hoboken, NJ, USA, 2006; Volume 347. [Google Scholar]
  30. Zhu, L.; He, L.; Shang, P.; Zhang, Y.; Ma, X. Influencing Factors and Scenario Forecasts of Carbon Emissions of the Chinese Power Industry: Based on a Generalized Divisia Index Model and Monte Carlo Simulation. Energies 2018, 11, 2398. [Google Scholar] [CrossRef]
  31. Prakash, A.; Jha, S.K.; Mohanty, R.P. Scenario Planning for Service Quality: A Monte Carlo Simulation Study. J. Strategy Manag. 2012, 5, 331–352. [Google Scholar] [CrossRef]
  32. Markmann, C.; Darkow, I.-L.; Von Der Gracht, H. A Delphi-Based Risk Analysis—Identifying and Assessing Future Challenges for Supply Chain Security in a Multi-Stakeholder Environment. Technol. Forecast. Soc. Change 2013, 80, 1815–1833. [Google Scholar] [CrossRef]
  33. Ho, J.K.-K. Formulation of a Systemic PEST Analysis for Strategic Analysis. Eur. Acad. Res. 2014, 2, 6478–6492. [Google Scholar]
  34. Oyasor, E.I.; Gbadebo, A.D. Strategic Decisions for Business Sustainability: Evidence Based on the Five C Analysis and PEST Analysis. Int. J. Prof. Bus. Rev. 2024, 9, 15. [Google Scholar]
  35. Nasir, M.H.N.M.; Sahibuddin, S. Addressing a Critical Success Factor for Software Projects: A Multi-Round Delphi Study of TSP. Int. J. Phys. Sci. 2011, 6, 1213–1232. [Google Scholar]
  36. Holt, G.; Hughes, D. A Study Using Semi-Structured Interview and Delphi Survey to Explore the Barriers and Enabling Factors that Influence Access and Utilization of Weight Management Services for People Living with Morbid Obesity: A Patient and Professional Perspective. J. Hum. Nutr. Diet. 2021, 34, 215–223. [Google Scholar] [PubMed]
  37. Maier, H.R.; Guillaume, J.H.A.; van Delden, H.; Riddell, G.A.; Haasnoot, M.; Kwakkel, J.H. An uncertain future, deep uncertainty, scenarios, robustness and adaptation: How do they fit together? Environ. Model. Softw. 2016, 81, 154–164. [Google Scholar]
  38. Dalkey, N.; Helmer, O. An Experimental Application of the DELPHI Method to the Use of Experts. Manag. Sci. 1963, 9, 458–467. [Google Scholar] [CrossRef]
  39. Rowe, G.; Wright, G. The Delphi Technique as a Forecasting Tool: Issues and Analysis. Int. J. Forecast. 1999, 15, 353–375. [Google Scholar]
  40. Landeta, J.; Barrutia, J.; Lertxundi, A. Hybrid Delphi: A Methodology to Facilitate Contribution from Experts in Professional Contexts. Technol. Forecast. Soc. Change 2011, 78, 1629–1641. [Google Scholar] [CrossRef]
  41. McKim, C.A. The Value of Mixed Methods Research: A Mixed Methods Study. J. Mix. Methods Res. 2017, 11, 202–222. [Google Scholar]
  42. Harpe, S.E. How to Analyze Likert and Other Rating Scale Data. Curr. Pharm. Teach. Learn. 2015, 7, 836–850. [Google Scholar]
  43. Al Atoum, B.; Biagi, S.F.; González-Díaz, D.; Jones, B.J.P.; McDonald, A.D. Electron Transport in Gaseous Detectors with a Python-Based Monte Carlo Simulation Code. Comput. Phys. Commun. 2020, 254, 107357. [Google Scholar]
  44. Vithayasrichareon, P.; MacGill, I.F. A Monte Carlo based decision-support tool for assessing generation portfolios in future carbon constrained electricity industries. Energy Policy 2012, 41, 374–392. [Google Scholar]
  45. Hawawini, G.A. A Mean-Standard Deviation Exposition of the Theory of the Firm under Uncertainty: A Pedagogical Note. Am. Econ. Rev. 1978, 68, 194–202. [Google Scholar]
  46. Rhydderch, A. Scenario Building: The 2x2 Matrix; Futuribles International: Paris, France, 2017. [Google Scholar]
  47. Brown, J. Interviews, Focus Groups, and Delphi Techniques. In Advanced Research Methods for Applied Psychology; Routledge: London, UK, 2018; pp. 95–106. [Google Scholar]
  48. Dilshad, R.M.; Latif, M.I. Focus Group Interview as a Tool for Qualitative Research an Analysis. Pak. J. Soc. Sci. 2013, 33, 191–198. [Google Scholar]
  49. Nardi, P.M. Doing Survey Research: A Guide to Quantitative Methods; Routledge: London, UK, 2018. [Google Scholar]
  50. Hejazi, A. Unveiling Cognitive Biases in Scenario Development A Study of the 2x2 Matrix Method. Nuts About Leadersh. 2024, 1, 1–7. [Google Scholar]
  51. Schwartz, P. The Art of the Long View: Planning for the Future in an Uncertain World; Currency Doubleday: New York, NY, USA, 1991. [Google Scholar]
  52. Van der Heijden, K. Scenarios: The Art of Strategic Conversation; Wiley: Hoboken, NJ, USA, 1996. [Google Scholar]
  53. McHugh, K.A.; Yammarino, F.J.; Dionne, S.D.; Serban, A.; Sayama, H.; Chatterjee, S. Collective Decision Making, Leadership, and Collective Intelligence: Tests with Agent-Based Simulations and a Field Study. Leadersh. Q. 2016, 27, 218–241. [Google Scholar]
  54. Lavenberg, S.S.; Welch, P.D. A Perspective on the Use of Control Variables to Increase the Efficiency of Monte Carlo Simulations. Manag. Sci. 1981, 27, 322–335. [Google Scholar]
  55. Kermanshachi, S.; Rouhanizadeh, B.; Dao, B. Application of Delphi Method in Identifying, Ranking, and Weighting Project Complexity Indicators for Construction Projects. J. Leg. Aff. Disput. Resolut. Eng. Constr. 2020, 12, 04519033. [Google Scholar]
  56. Vidal, L.-A.; Marle, F.; Bocquet, J.-C. Using a Delphi Process and the Analytic Hierarchy Process (AHP) to Evaluate the Complexity of Projects. Expert Syst. Appl. 2011, 38, 5388–5405. [Google Scholar]
  57. Xu, C.; Gertner, G. Uncertainty and Sensitivity Analysis for Models with Correlated Parameters. Reliab. Eng. Syst. Saf. 2008, 93, 1563–1573. [Google Scholar]
  58. Saltelli, A.; Ratto, M.; Andres, T.; Campolongo, F.; Cariboni, J.; Gatelli, D.; Saisana, M.; Tarantola, S. Global Sensitivity Analysis: The Primer; Wiley: Hoboken, NJ, USA, 2008. [Google Scholar]
  59. De Lataillade, A.; Blanco, S.; Clergent, Y.; Dufresne, J.; El Hafi, M.; Fournier, R. Monte Carlo Method and Sensitivity Estimations. J. Quant. Spectrosc. Radiat. Transf. 2002, 75, 529–538. [Google Scholar] [CrossRef]
  60. Lewis, A. GetDist: A Python Package for Analyzing Monte Carlo Samples. arXiv 2019, arXiv:1910.13970. [Google Scholar]
  61. Schoemaker, P.J.H. Scenario Planning: A Tool for Strategic Thinking. Sloan Manag. Rev. 1993, 36, 25–40. [Google Scholar]
  62. Bradfield, R.; Wright, G.; Burt, G.; Cairns, G.; van der Heijden, K. The Origins and Evolution of Scenario Techniques in Long Range Business Planning. Futures 2005, 37, 795–812. [Google Scholar] [CrossRef]
  63. Metropolis, N.; Ulam, S. The Monte Carlo Method. J. Am. Stat. Assoc. 1949, 44, 335–341. [Google Scholar] [CrossRef]
  64. Raychaudhuri, S. Introduction to monte carlo simulation. In Proceedings of the 2008 Winter Simulation Conference, Miami, FL, USA, 7–10 December 2008; IEEE: Piscataway, NJ, USA, 2008. [Google Scholar]
  65. Mahmutoglu, A.G.; Erdogan, A.T.; Demir, A. Random Input Sampling for Complex Models Using Markov Chain Monte Carlo. arXiv 2012, arXiv:1211.4706. [Google Scholar]
  66. Kroese, D.P.; Taimre, T.; Botev, Z.I. Handbook of Monte Carlo Methods; Wiley: Hoboken, NJ, USA, 2011. [Google Scholar]
  67. Hoffmann-Jørgensen, J.; Pisier, G. The law of large numbers and the central limit theorem in Banach spaces. Ann. Probab. 1976, 4, 587–599. [Google Scholar] [CrossRef]
  68. Qamruzzaman, M.D.; Karim, S. Green Energy, Green Innovation, and Political Stability Led to Green Growth in OECD Nations. Energy Strategy Rev. 2024, 55, 101519. [Google Scholar] [CrossRef]
  69. Fink, A.; Kosecoff, J.; Chassin, M.; Brook, R.H. Consensus Methods: Characteristics and Guidelines for Use. Am. J. Public Health 1984, 74, 979–983. [Google Scholar] [CrossRef]
  70. Woolley, A.W.; Chabris, C.F.; Pentland, A.; Hashmi, N.; Malone, T.W. Evidence for a Collective Intelligence Factor in the Performance of Human Groups. Science 2010, 330, 686–688. [Google Scholar] [CrossRef]
  71. Saltelli, A.; Annoni, P.; Azzini, I.; Campolongo, F.; Ratto, M.; Tarantola, S. Variance-Based Sensitivity Analysis of Model Output. Design and Estimator for the Total Sensitivity Index. Comput. Phys. Commun. 2010, 181, 259–270. [Google Scholar] [CrossRef]
  72. Pedregosa, F.; Varoquaux, G.; Gramfort, A.; Michel, V.; Thirion, B.; Grisel, O.; Duchesnay, É. Scikit-learn: Machine learning in Python. J. Mach. Learn. Res. 2011, 12, 2825–2830. [Google Scholar]
  73. McKinney, W. Python for Data Analysis: Data Wrangling with Pandas, NumPy, and IPython; O’Reilly Media, Inc.: Sebastopol, CA, USA, 2012. [Google Scholar]
  74. Rezvani, Z.; Jansson, J.; Bodin, J. Advances in Consumer Electric Vehicle Adoption Research: A Review and Research Agenda. Transp. Res. Part D Transp. Environ. 2015, 34, 122–136. [Google Scholar] [CrossRef]
  75. Dubois, C.-A.; Singh, D. From Staff-Mix to Skill-Mix and Beyond: Towards a Systemic Approach to Health Workforce Management. Hum. Resour. Health 2009, 7, 87. [Google Scholar] [PubMed]
  76. Ioannou, I.; Serafeim, G. The Impact of Corporate Social Responsibility on Investment Recommendations: Analysts’ Perceptions and Shifting Institutional Logics. Strateg. Manag. J. 2015, 36, 1053–1081. [Google Scholar] [CrossRef]
  77. Flammer, C. Corporate Green Bonds. J. Financ. Econ. 2021, 142, 499–516. [Google Scholar]
  78. Wüstenhagen, R.; Menichetti, E. Strategic Choices for Renewable Energy Investment: Conceptual Framework and Opportunities for Further Research. Energy Policy 2012, 40, 1–10. [Google Scholar] [CrossRef]
  79. Eccles, R.G.; Ioannou, I.; Serafeim, G. The Impact of a Corporate Culture of Sustainability on Corporate Behavior and Performance; National Bureau of Economic Research: Cambridge, MA, USA, 2012. [Google Scholar]
  80. Brynjolfsson, E.; McAfee, A. The Second Machine Age: Work, Progress, and Prosperity in a Time of Brilliant Technologies; WW Norton & Company: New York, NY, USA, 2014. [Google Scholar]
  81. Surroca, J.; Tribó, J.A.; Waddock, S. Corporate Responsibility and Financial Performance: The Role of Intangible Resources. Strateg. Manag. J. 2010, 31, 463–490. [Google Scholar] [CrossRef]
  82. Acemoglu, D.; Restrepo, P. Artificial Intelligence, Automation, and Work. In The Economics of Artificial Intelligence: An Agenda; University of Chicago Press: Chicago, IL, USA, 2018; pp. 197–236. [Google Scholar]
  83. Hobday, M. The Project-Based Organisation: An Ideal Form for Managing Complex Products and Systems? Res. Policy 2000, 29, 871–893. [Google Scholar] [CrossRef]
  84. Autor, D.H.; Levy, F.; Murnane, R.J. The Skill Content of Recent Technological Change: An Empirical Exploration. Q. J. Econ. 2003, 118, 1279–1333. [Google Scholar]
  85. Cortesi, A.; Tettamanzi, P.; Corno, F. Empirical Evidence on Internal Control Systems and Corporate Governance in Italy. J. Manag. Gov. 2009, 13, 75–100. [Google Scholar]
  86. Nespoli, L.; Wiedemann, N.; Suel, E.; Xin, Y.; Raubal, M.; Medici, V. National-scale bi-directional EV fleet control for ancillary service provision. Energy Inform. 2023, 6 (Suppl. S1), 40. [Google Scholar] [CrossRef]
Figure 1. Research procedure.
Sustainability 17 03224 g001
Figure 2. Procedure for scenario development.
Sustainability 17 03224 g002
Figure 3. Convergence of standard deviations across different Monte Carlo simulation sample sizes. The results stabilize beyond 750,000 iterations, justifying the selection of 1,000,000 runs for a robust scenario estimation.
Sustainability 17 03224 g003
Figure 4. Visualization of simulation results for “legal amendment potential (PE)”.
Sustainability 17 03224 g004
Figure 5. Visualization of the final simulation results.
Sustainability 17 03224 g005
Figure 6. Results of the 2 × 2 scenario matrix.
Sustainability 17 03224 g006
Table 1. Results of the initial identification of uncertainty factors.
Category#Uncertainty Factors/Concise Expression
PE6
-
Potential changes in policies for expanding the utilization of EV batteries/Legal amendment potential
-
Linkage with distributed energy resource support policies/Policy linkage
-
Changes in government subsidy policies/Government subsidy policy changes
-
Potential changes in EV battery production and waste management regulations/Regulatory change potential
-
Linkage with international environmental agreements/International agreement linkage
-
Possibility of introducing mandatory renewable energy usage policies linked with VPPs/Renewable energy mandate
Table 2. Results of the selection of the primary uncertainty factors.
CategoryUncertainty (Number of Expert Selections)
PE
-
Legal amendment potential (15)/Policy linkage (12)/Government subsidy policy changes (11)
Table 3. Results of the selection of secondary uncertainty factors.
CategoryUncertaintyESG Correlation
HighMediumLowTotal (Weighted)
PELegal amendment potential26186120
Policy linkage27149118
Government subsidy policy changes201812108
Table 4. Results of the initial variable extraction and final variable selection.
CategoryUncertainty#Results of the Initial Variable Extraction
and Final Variable Selection
PELegal amendment potential5Legal amendment potential (16)/Intensity of legal amendments (15)/Timing of legal amendments (13)/Scope of legal amendments/International alignment of legal amendments
Table 5. Results of the extraction of probability distribution parameters.
UncertaintyVariableProbability DistributionParameters
(PE) Legal amendment potentialLegal amendment potentialBinomial DistributionValue: 0 (No legal amendment), 1 (Legal amendment present)
Probability:
-
Legal amendment present—80%
-
No legal amendment—20%
Intensity of legal amendmentsNormal Distribution
-
Value: The intensity of the legal amendment’s impact on the scope of EV battery utilization is set between 0 and 100.
-
Mean: 80 (indicating the expectation of active policy implementation)
-
Standard deviation: 15 (reflecting the potential for a higher or lower policy intensity)
Timing of legal amendmentsTriangular DistributionValue: The timing of the legal amendment (1 to 5 years)
-
Minimum value, 1 year | Mode, 3 years | Maximum value, 5 years
Table 6. Results of the sensitivity analysis.
CategoryUncertaintyVariableSensitivity Analysis Results for the Market Growth Rate Standard DeviationWhether the Difference in Results Is Within 1%
−10%Standard10%
EEEconomic value volatilityIntensity of competition12.92%13.37%13.85%O
Policy support12.56%13.37%13.48%O
Level of technological innovation13.33%13.37%13.42%O
Disclaimer/Publisher’s Note: The statements, opinions and data contained in all publications are solely those of the individual author(s) and contributor(s) and not of MDPI and/or the editor(s). MDPI and/or the editor(s) disclaim responsibility for any injury to people or property resulting from any ideas, methods, instructions or products referred to in the content.

