Article

A Bi-Level Optimization Model for Hydrogen Station Location Considering Hydrogen Cost and Range Anxiety

School of Maritime Economics and Management, Dalian Maritime University, Dalian 116026, China
*
Author to whom correspondence should be addressed.
Sustainability 2025, 17(7), 3210; https://doi.org/10.3390/su17073210
Submission received: 10 March 2025 / Revised: 29 March 2025 / Accepted: 2 April 2025 / Published: 4 April 2025
(This article belongs to the Special Issue Sustainable Energy System: Efficiency and Cost of Renewable Energy)

Abstract

:
In pursuit of sustainable development, worldwide adoption of hydrogen fuel cell vehicles (HFCVs) is growing to cut carbon emissions in the transportation sector. The construction of hydrogen refueling stations (HRSs) is the key to popularizing HFCVs. The popularity of HRSs is hindered by cost, site selection, and user expectations. Selecting mature gas stations with large passenger flow to expand HRSs can improve the accuracy of the hydrogen refueling network. Reducing the range anxiety of HFCV users to improve the path coverage of HFCVs is a favorable way to expand the hydrogen vehicle industry chain. Therefore, this study proposes a bi-level programming model, which considers hydrogen source (HS), hydrogen delivery mode (HDM), initial remaining range, range anxiety, and other factors. The upper-level model is designed to optimize economic costs, including the total chain cost of the HRS. The lower level aims to optimize the range anxiety of HFCV users and more accurately reflect their autonomy by controlling the maximum remaining range of the vehicle. Finally, the expressway in the Liaoning Province of China is taken as an example to verify that the optimization model had the advantages of low hydrogen cost and minimal range anxiety. The cost analysis of several HSs and HDMs was discussed from the perspective of the best site selected, and it was found that the Anshan HS using coal to produce hydrogen and the long tube trailer can provide lower hydrogen cost for the HRS. This method is generalizable to other regions or all types of HFCVs.

1. Introduction

In order to accelerate the realization of carbon emission reduction, countries must shift their focus to developing renewable energy and increasing the share of renewable sources in the energy mix [1,2,3]. Hydrogen energy is a promising area of sustainable development that has garnered considerable attention as a clean energy source [4,5]. Researchers consider hydrogen energy the ideal energy in the 21st century because of its advantages as a pollution-free, high efficiency, and renewable energy source [6]. Moving towards achieving carbon neutrality, electricity is the main energy source for passenger transport, while hydrogen is the main energy source for freight transport, especially on the road [7]. Much of the existing energy infrastructure is based on fossil fuels. HRSs are both the terminals of hydrogen-delivery networks and the HSs for HFCVs [8]. The network of HRSs is too small to improve the path coverage of HFCVs and to promote the development of the hydrogen energy industry chain.
The gradual decrease in HFCV/HRS ratio after 2018 is ascribed to the faster increase in HRSs [9]. By the end of 2024, about 1369 HRSs had been built worldwide, less than a fraction of filling stations [10]. The expansion of hydrogen automobiles underscores the necessity for dedicated hydrogen refueling stations [11]. The small scale of hydrogen refueling facilities network is one of the significant obstacles to promoting hydrogen energy [12]. If HFCVs are to be successfully promoted, there must be a certain degree of coverage of hydrogen refueling facilities network [13].
The problem of location selection is complex and changeable, and scholars have studied it from different angles and formed a location selection model with its characteristics [14]. Based on the set cover model, P-median model, and P-center model, the optimization location problem of the nodal network is formed. The flow type problem is represented by the interception model, which is mainly based on the operation behavior of the vehicle. The traffic model considers the driving path and distance and determines the best location along the road from the perspective of traffic distribution. The traffic flow model emphasizes the distribution of traffic flow, which is mainly applicable to the location of intercity highway networks such as expressways and national highways. Complex land acquisition approval, high construction and operating costs, and other factors make it challenging to scale up the HRS network (see Figure 1). The construction of HRSs can consider the reasonable planning of a single station [15,16,17,18,19,20] and adopt the method of combined stations [21,22,23,24,25,26]. HRSs, coupled with existing refueling, gas filling, and charging stations, can effectively integrate and utilize existing stations’ resources, promoting the cooperative income of the two [27]. Off-site and on-site are the other two basic types of HRSs [28]. After combining storage transportation and other factors, the on-site mode is less cost-effective than the off-site mode [29]. Off-site hydrogen supply is the most cost-effective investment option for small and medium-sized HRSs [30].
Most of the existing literature focused on the modeling research of the location selection of HRSs in the hydrogen industry chain. More overall consideration is needed for HRSs, HSs, and hydrogen energy consumers. Few studies have considered the effect of facility layout on HFCV users’ range anxiety in site selection. Reducing the range anxiety of users and improving their satisfaction with HFCVs are effective ways to expand the hydrogen energy industry. Research on range anxiety [31,32,33,34,35,36,37] has been considered, but the HRS network optimization layout has not been considered.
There are complex interrelations among the factors in the location problem, which makes it a multi-objective and multi-constraint optimization problem. In order to solve complex problems such as location selection, this study proposes a bi-level programming model. This study deals with many complex factors of HRS location, such as construction and operating costs, HS location [38], HDM, and user experience. The model studied the optimization of HRS location from the perspective of hydrogen cost and user’s range anxiety. The upper-level model of this study considers the investors of HRSs. The goal of the upper-level model is to minimize the hydrogen cost under a series of constraints, that is, to minimize the total chain cost per unit of hydrogen used. The lower-level model of this study considers the HFCV users. The goal of the lower-level model is to minimize the user’s range anxiety. By integrating these two levels, the model in this study can consider the needs of both investors and users to achieve global optimization. The new bi-level programming model is constructed to simulate the synergistic interaction between upper and lower subjects and obtain a better location selection scheme.
The main objective of this study is to design and apply a bi-level programming model to solve the location problem of HRSs scientifically. The model will help this study understand how to most effectively lay out the network of HRSs to support the widespread application of HFCVs and the development of the hydrogen energy industry. Section 2 reviews the literature related to the research. Section 3 establishes the model and analyzes the example. Section 4 discusses the results. The last section summarizes this study’s relevant achievements and analyses the research’s shortcomings.

2. Literature Review

2.1. Research Progress of HRS Site Selection

The research of HRS site selection involves various aspects such as cost, HS, demand, etc. The site selection of HRS can be a single station mode, and the location of stations along the highway is determined with the minimum number of stations as the goal [15]. The site selection of HRS can also be a combined station model. The existing gas station locations are taken as potential sites for HRSs, and factors such as carbon emission [21], population, and economy [26] are jointly considered and applied to the site-selection model. Safety can be considered in the construction of combined stations to judge the layout adaptability of HRSs [38]. The location of HRSs may be affected by the unknown distribution of HS [20] and consumer demand points [16,17]. The selection of HRSs also needs to consider the number, location, and station scale to meet people’s expected demand for hydrogen refueling [19].
The bi-level programming model is widely used in site selection. A bi-level programming problem is a system optimization problem with two hierarchical structures. The upper and lower problems have decision variables, constraints, and objective functions. The upper and lower models of site selection can consider factors such as site investment and construction or economic cost, profit, distance deviations, user cost, and satisfaction [35,39,40] to obtain the optimal site selection scheme. Some studies have found that the construction of combined stations has better effects in terms of investment cost and user satisfaction [38].

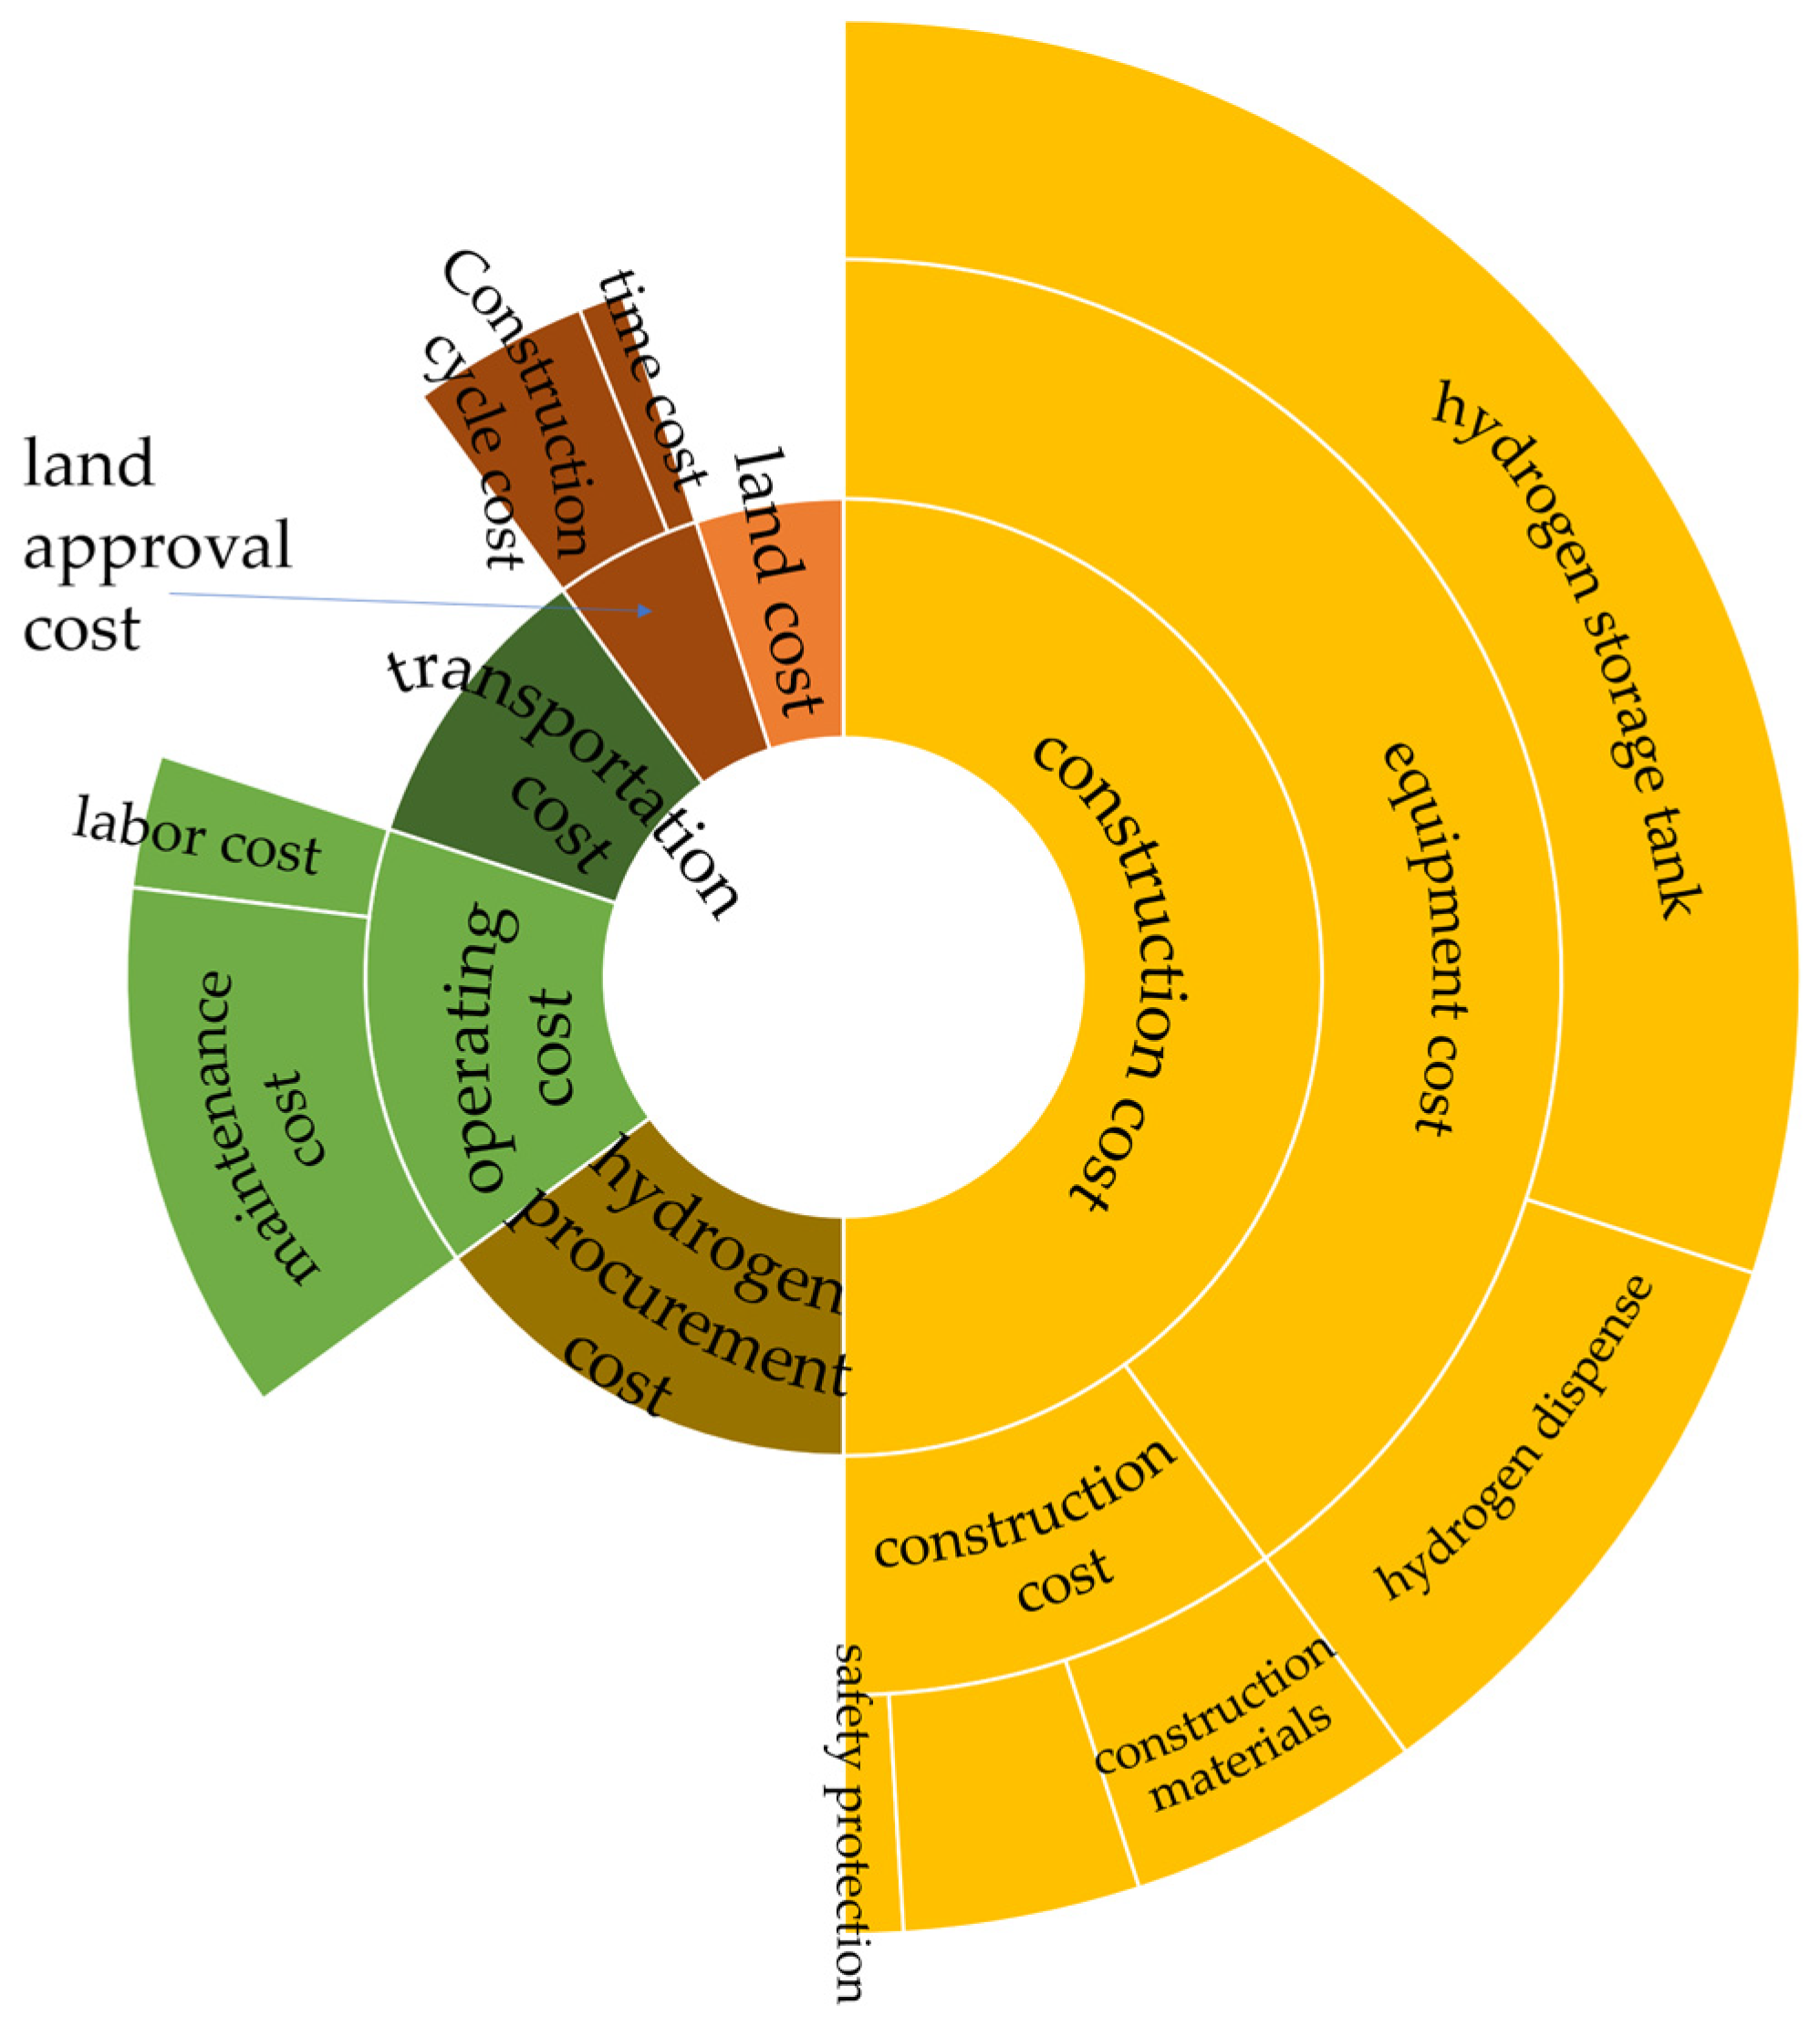
2.2. Impact of HRS Construction Cost on Site Selection

In site selection, it the mention of various construction costs is unavoidable. The study on the location of shared bicycles in urban environments found that the travel demand of users was affected by land use, which resulted in different operating costs [41]. The goal of the site selection of green logistics parks is to minimize transportation and environmental costs to reduce the total cost of site selection [42]. For the emergency location problem, transport, deployment, inventory, and safety inventory costs can be considered in the model to analyze the site location when the total emergency logistics cost is lowest [43]. In the siting study of oil–hydrogen combined stations, different siting situations were discussed to minimize construction costs, transportation costs, and carbon emissions [15]. The entire life cycle cost of hydrogen energy, including hydrogen production, transportation, storage, use, and carbon tax, can be considered in the location of HRS construction costs [44]. In many studies, only some took the total chain cost of station construction in the site-selection model.

2.3. The Impact of Range Anxiety on the Location of HRSs

The word “anxiety” comes from psychology. “Range anxiety” is defined as the psychological anxiety consumers experience about their vehicles’ limited range. “Range anxiety” is essentially a psychological problem rather than a technical one and is considered one of the most urgent obstacles to developing new energy vehicles [31]. Promoting HFCVs also faces various obstacles, such as hydrogen price, remaining range, HRS network, and hydrogen explosion risk [32]. Studies have shown that range anxiety is negatively correlated with buying HFCVs [33].
The problem of range anxiety has been relatively well studied in rechargeable vehicles. This study will draw on the relevant charging vehicle studies to explore the corresponding difficulties of HFCVs. When the vehicle can reach any station during range anxiety, the pain of range anxiety can be alleviated [34]. The degree of range anxiety will affect users’ satisfaction with a particular route [35]. When a charging vehicle stops at a charging station, the anxiety of a fully charged vehicle is less than that of a half-charged one [36]. Based on the actual driving big data, it is found that the true remaining range of a full battery can reflect the user’s trust in the vehicle’s driving ability [37]. Charging demands are predicted based on the remaining ranges of hydrogen vehicles [10].
The refueling time of HFCVs is similar to that of traditional fossil energy vehicles [45], less than five minutes. HFCVs perform well in refueling, effectively alleviating users’ anxiety about refueling time.
By analyzing the literature, studying the location of HRS is a future undertaking. Most research on the location of HRSs is based on location modeling. The cost problem in site selection research is often relatively simple, and HRSs’ total chain cost must be considered. Most of the range anxiety problems are considered with regard to charging-vehicle users, and few plan the path for HFCV users. In this study, the total chain cost of HRS and the range anxiety of HFCV users are considered in the location model to improve the accuracy of the location of HRSs.

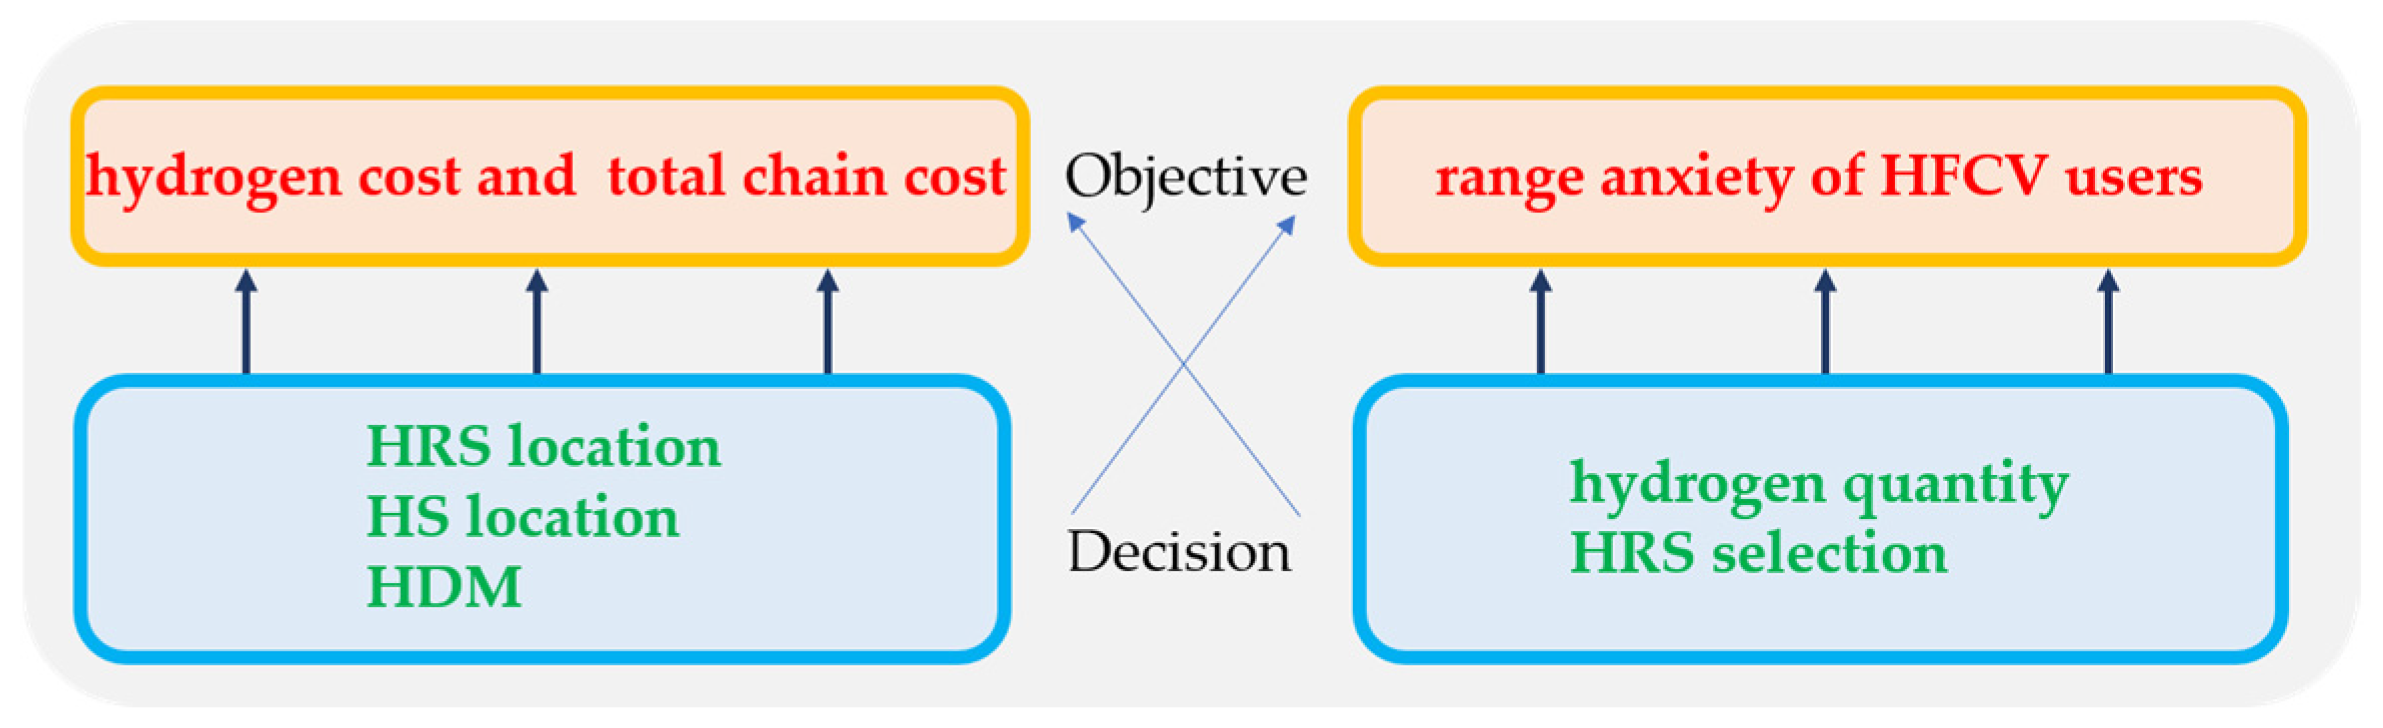
3. Materials and Methods

This study assumed that the investment and operation of HRS is a public service project. Therefore, the site selection and construction of HRS’s need to consider not only the investment and operating costs but also the HS, HDM, and the range anxiety of users. There will be some conflicts of interest between HRS investors and HFCV users in the planning process. Therefore, the HRS network optimization involves two subjects: HRS investors and HFCV users. The decisions of the two types of subjects will affect and function on each other so that it can be considered as a bi-level programming problem (see Figure 2).
The HRS investor is the leader, aiming to minimize hydrogen costs through joint decision-making on site selection and hydrogen delivery strategies. Meanwhile, HFCV users are followers, minimizing their range anxiety by choosing optimal stations within the established HRS network. The investor’s siting decisions influence users’ station choices and hydrogen quantities. Then, the hydrogen refueling quantities and station choices made by users are fed back to the upper level, influencing the selection of HSs. This study uniquely incorporates HRS investor perspectives and HFCV user experiences to analyze the strategic interactions between infrastructure deployment and usage patterns.
This study proposed the following hypotheses:
Hypothesis 1: 
Each potential HRS location is known, which means that the HRS location can be selected centrally from a fixed number of candidate locations.
Hypothesis 2: 
HRS investors and HFCV users are rational and will make rational decisions based on their goals and limitations.
Hypothesis 3: 
The demand and path of HFCVs are known, and the models are consistent. HFCVs drive at a certain speed between HRSs, consume a fixed quantity of hydrogen per 100 km, and always fill up with hydrogen when parked at the HRS [46].
Hypothesis 4: 
The HS has sufficient capacity and can meet the demand for HRSs. HFCVs are of the same model.

3.1. Upper-Level Model

The upper-level model is the primary model of the HRS investment construction site selection. From the investor’s point of view, the lowest hydrogen cost of the HRS is taken as the objective function, and the location and quantity of the station construction are determined.
min C i l + C i c o + C i p + C i t r + C i e l i I ψ w i
Formula (1) is to minimize the hydrogen cost of HRS. HRSs’ costs include land, construction, annual operating, and other costs. The hydrogen cost refers to the ratio of the total chain cost of a HRS to the hydrogen quantity, that is, the total chain cost per unit of hydrogen quantity.
C i l = i I c i l s i x i
Formula (2) represents the total land cost when the unit land cost is c i l and the area is s i for the construction of the node i. There is a positive correlation between the land cost and the land area of HRS.
C i c o = i I E i x i
Formula (3) represents the total construction cost of node i when the fixed construction cost is E i . The construction cost of node i includes equipment, civil construction, installation, and other expenses.
C i p = i I ψ w i γ i p
Formula (4) represents hydrogen procurement cost.   is the ceiling brackets. If the range anxiety of the HFCV users on the path is not 0, γ i = 1 , the vehicles may stop and refuel at node i. If the range anxiety of the HFCV users on the path is 0, γ i = 0 , the users have no range anxiety, so no hydrogen quantity will be generated. If the range anxiety of the HFCV users on the path is ∞, γ i is meaningless, and the vehicles cannot continue moving forward.
C i t r = i I t T ψ w i α A t α L i f
Formula (5) is the annual transportation cost of hydrogen for t-type transport vehicles. ψ w i α represents the number of t-type vehicles that need to transport hydrogen in the whole year.
C i H t r = i I ψ w i A H
Formula (6) is the annual transportation cost of hydrogen pipeline transportation. A H is the levelized cost of pipeline hydrogen (the total pipeline construction cost per hydrogen unit).
C i e l = i I x i G i
Formula (7) is the HRS’s annual operating cost. Operating costs include fuel consumption and other costs, such as personnel.
s . t . i I C i c o γ i T
Formula (8) limits the total construction cost of HRSs, equivalent to limiting the number of HRSs.
min d i j d i j max d i j
Formula (9) is the distance constraint between HRS i and j.
f F w i f i I w i
Formula (10) restricts the supply of hydrogen from HS f to node i.

3.2. Lower-Level Model

The goal of the lower-level model is to minimize range anxiety for HFCV users on the path.
min i I γ i = min i I ζ ε L i
s . t . i I y i x i
Formula (12) limits the number of vehicles that must be refueled at node i.
L 0 = L L 0 = L 2 L 0 = L 3 L 0 = L 4 L 0 = L 5 L 0 = L 6
Formula (13) indicates that if there is a HRS at the starting point, the remaining range of HFCV is L. If there is no HRS at the starting point, the remaining range of HFCV is L 2 , L 3 , L 4 , L 5 , L 6 . The different remaining range of HFCVs determines the possibility of range anxiety on the path.
L j = L y i + L i 1 y i L i j
Formula (14) is the HFCV’s remaining range when it arrives at the HRS j from the node i.
w i = y i L L i j σ i I
Formula (15) is the hydrogen quantity of refueling generated when the HFCV arrives at the node i.
γ i = 0 , ε < L i L ζ ε L i 0 < L i ε L i = 0
When the remaining range of the HFCV is below ε and has not yet reached the HRS, the users will have “range anxiety”. Users will rationally choose HRSs on the path to stop for refueling to alleviate range anxiety. The range anxiety is reflected by a function [35]. Assuming that L i is the maximum remaining range before reaching the HRS at node i, then the range anxiety at node i on the path is γ i . In Equation (16), when ε < L i L , HFCVs have sufficient remaining range and users will not have range anxiety. When 0 < L i ε and the remaining range is below ε , the users will have range anxiety. The users will make a reasonable decision whether to stop and refuel according to the degree of anxiety at this time. When L i = 0 , the users cannot drive the HFCV to the next node I and the range anxiety is infinite. When range anxiety is infinite, the HFCV cannot continue to drive, so it does not need to be considered in the calculation. The user will stop the HFCV for refueling at any remaining range. In order to simplify the calculation, this study does not consider the situation of users stopping to refuel without range anxiety.
y i 0 , 1    i I
Formula (17) indicates that the HFCV stops at node i, y i = 1. Otherwise, y i = 0.
w i 0    i I
Formula (18) restricts the HFCV to refueling when it arrives at node i.
L L i 0    i I
Formula (19) restricts the remaining range of the HFCV to less than the maximum range and cannot be negative.

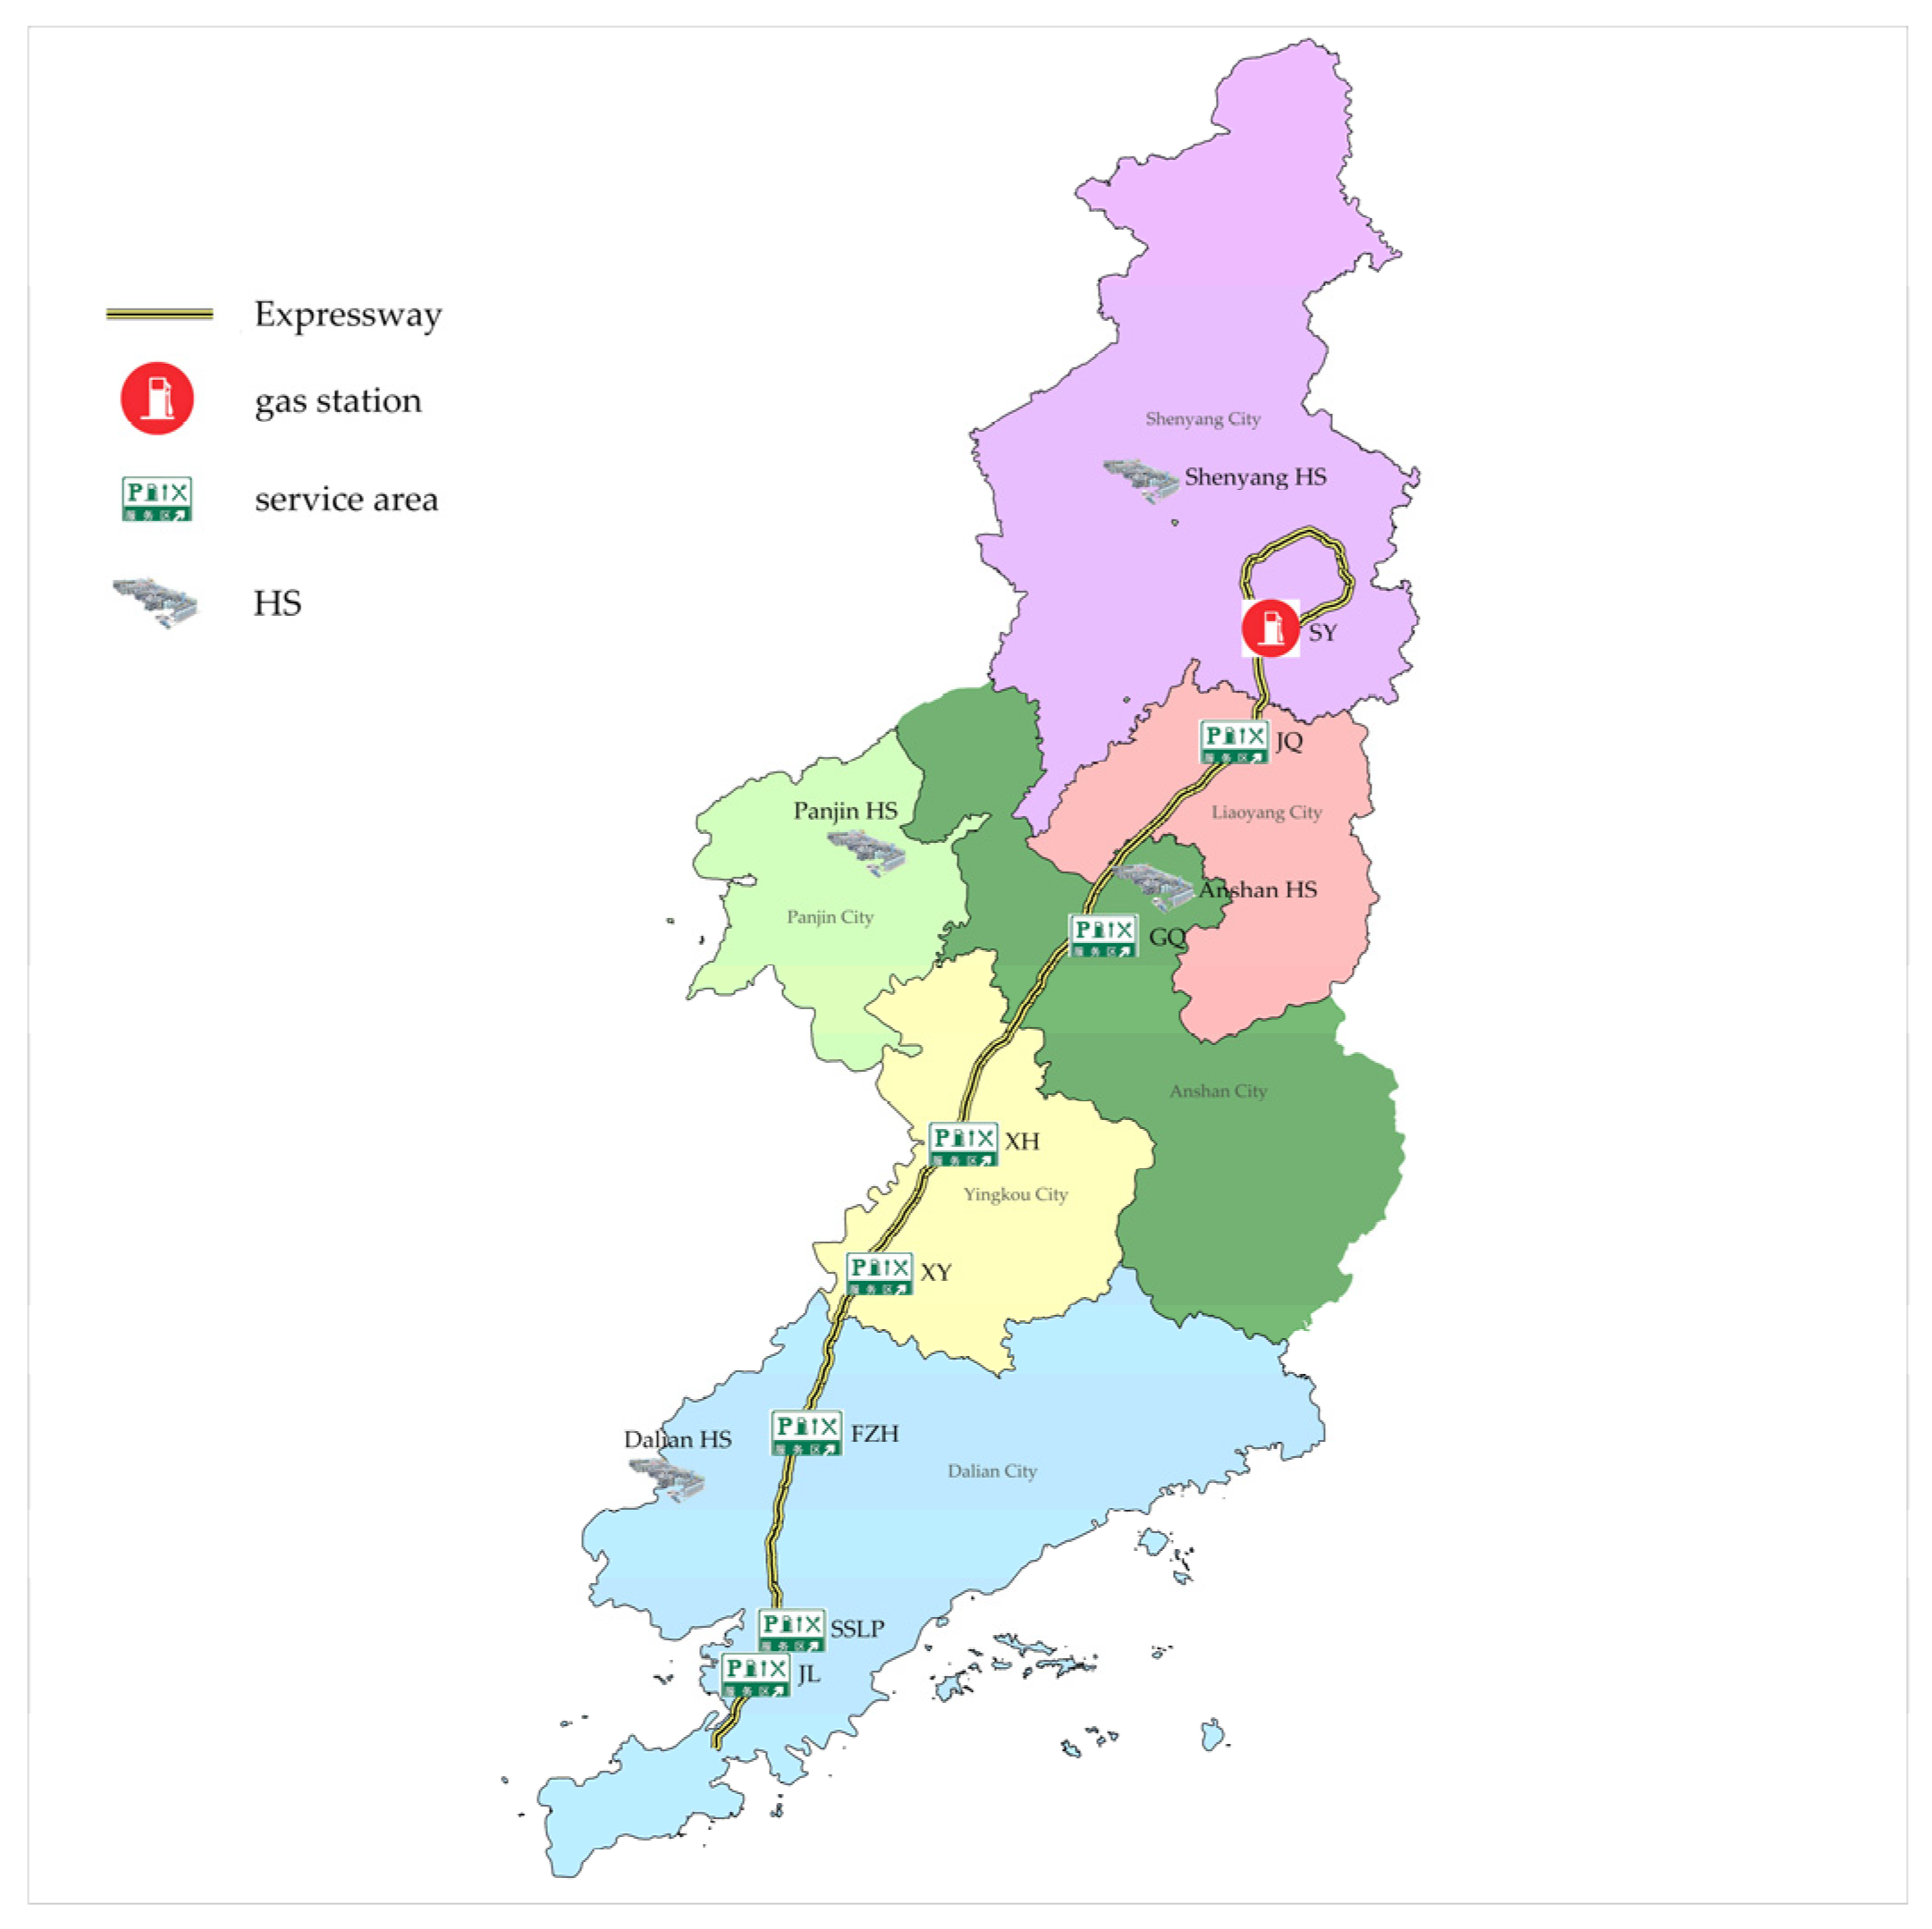
3.3. Example Analysis—Hydrogen Corridor Data

By the end of June 2023, China had built 351 HRSs. China is the world’s largest HRS-holding country, accounting for 32.2% of the world. Relevant studies show that China’s hydrogen energy industry chain will continuously trend upward in 2023 [47]. By 2050, more than 50% of the world’s heavy-duty trucks are expected to use hydrogen fuel cells as engines. Heavy trucks are mainly used for logistics distribution, and their routes are relatively fixed, mainly on highways. This study took hydrogen fuel cell heavy-duty trucks (HHDTs) as the application object to demonstrate and apply the hydrogen energy industry in Northeast Asia as soon as possible.
The site selection of HRS was studied by taking the Shenyang–Dalian Expressway in Liaoning Province as an example. The reason for choosing this path is that Liaoning Province is actively building a “hydrogen corridor”. The province has introduced various hydrogen subsidy policies that promote hydrogen equipment and the construction of HRSs. High costs, such as the construction cost of HRSs, can be addressed with adequate policy support [48,49]. Along the Shenyang–Dalian Expressway, residential areas and factories are evenly distributed and densely clustered, making it unsuitable to develop new sites for HRSs. Constructing a standalone HRS involves complex processes such as land approval and safety reviews. Combined stations not only streamline these cumbersome procedures but also enhance operational efficiency. Therefore, this study selected all of the service area and gas station along the Shenyang–Dalian Expressway as a candidate site for HRSs [50].
In this study, the global area of Liaoning Province was imported into ArcGIS, and the corresponding vector map was drawn. The Shenyang–Dalian Expressway is 371.4 km long, passing through 5 major provincial cities, 42 toll stations, and 7 large-scale comprehensive service areas (see Figure 3).
The path was planned according to the “Dalian—Jiuli Service Area (JL)—Sanshilipu Service Area (SSLP)—Fuzhou River Service Area (FZH)—Xiongyue Service Area (XY)—Xihai Service Area (XH)—Ganquan Service Area (GQ)—Jingquan Service Area (JQ)—Shenyang Gas Station (SY)—JQ—GQ—XH—XY—FZH—SSLP—JL—Dalian”. This path is 742.8 km long.
The general scale of the HRS is 500 kg/d, the area is s i = 3000 m2, the fixed construction cost is E i = 1.2 × 10⁷ (CNY), and the annual operating cost is G i = 2.0 × 10⁶ (CNY). Table 1 lists the distance between the service area (node i) and the starting point, the unit land purchase cost c i l , and each HRS’s construction area s i .
More than 20 enterprises can provide hydrogen in Liaoning Province; the distances between four large hydrogen production plants (HSs) and each node i are listed in Table 2.
Table 3 lists the unit price of hydrogen at each HS.
The most-used HDMs in China are long-tube trailers and pipelines with little tank cars [51]. This study will compare the transportation costs of three different HDMs and choose the better one. Table 4 shows the cost unit prices of the three HDMs. Pipeline transportation had ignored the difference between hydrogen production and distribution in this study [52].
According to the sales situation of vehicles in China in 2022, the relevant parameters of the FSQ4250SFFCEV model of Foshan HFCVs were adopted in this study, and the load is about 32 tons. According to the data of China’s Ministry of Transport in 2022, the total freight volume of Liaoning Province is 1.39 × 10⁸ tons, so we were assumed that the annual traffic volume of heavy vehicles is Ψ = 4.36 × 10⁷. In this study, we assumed that the maximum remaining range of each HHDT when full fuel is L = 500 (km), and the driving range per hydrogen unit is σ = 10 (km/kg). Let the remaining range value [31] for the driver to generate range anxiety be ε = 500 3 (km). min d i j d i j max d i j , min d i j = 20 (km), max d i j = 100 (km); according to the path back and forth and the total distance constraints, this study calculated the case need to select 1–3 HRSs, T ≤ 3.6 × 10⁷ (CNY). ζ is the scale factor used to adjust the proportional relationship between ε L i and γ i . To control the range of values, we set ζ = 0.1 here.

4. Results

The optimization model was calculated in Python 3.11.5. This section includes a discussion of the results of three different scenarios. By comparing the different scenarios in sensitivity analysis, this study finds a way of establishing HRSs. Reasonable HRS planning minimizes users’ range anxiety and improves satisfaction, increasing the usage of HHDTs on this path.

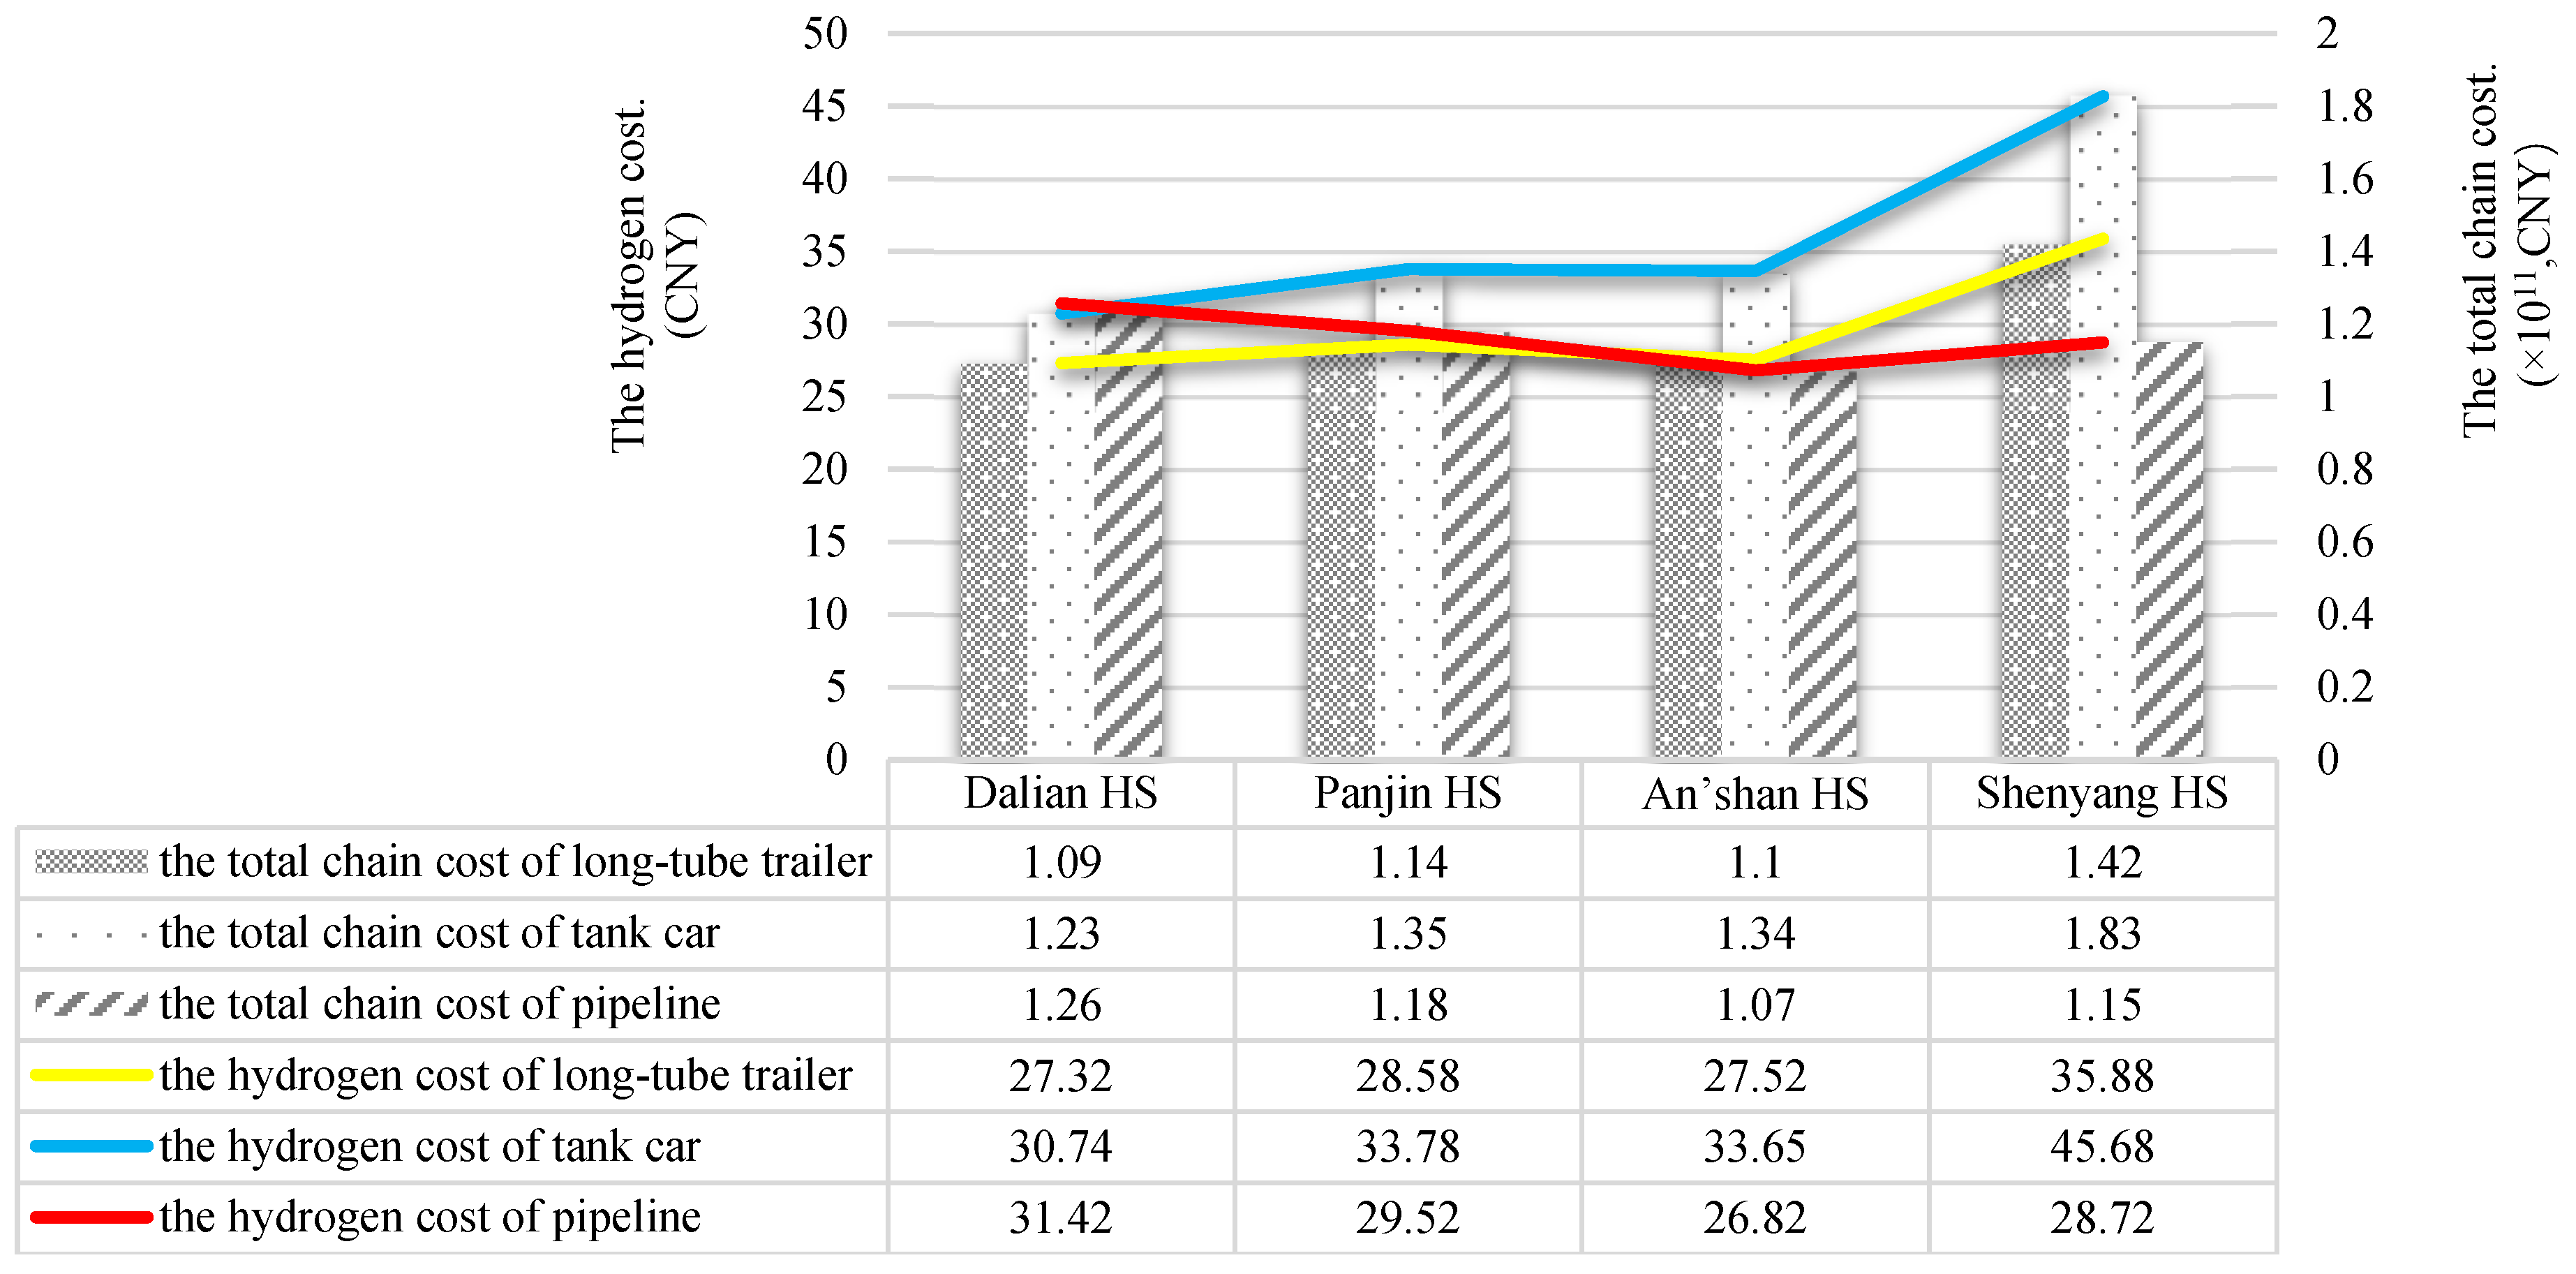
4.1. Results Analysis

Three scenarios are set according to the different values of the HRS site selection expense—T = 1.2 × 10⁷ (CNY), T = 1.2 × 10⁷ (CNY), T = 2.4 × 10⁷ (CNY)—and the initial remaining range— L 0 = L (km), L 0 = L 3 (km), L 0 = L 3 (km). HFCVs returning to the city must meet the maximum remaining range to cover the distance from JL to Dalian. The selection results of HRSs, HSs, and HDMs are shown in Figure 4.

4.1.1. Scenario 1

The site selection expense of HRS T = 1.2 × 10⁷ (CNY) and the initial remaining range L 0 = L (km) are calculated as follows.
Facility layout: SY extends the HRS.
HS and hydrogen quantity: SY chooses Anshan HS to supply hydrogen and uses the long-tube trailer to transport hydrogen. The refueling quantity of a single vehicle is 37.14 (kg).
Cost: The total chain cost of the expansion of SY is 3.57 × 10¹⁰ (CNY) and the hydrogen cost is 22.08 (CNY).
This section lists the four maximum remaining range situations of the HHDT at each node i and explains the relationship with range anxiety in detail.
Table 5 lists the maximum remaining range L i for vehicles passing through each node i. Table 6 lists the range anxiety of HFCV users at each node i.
First, the HHDT does not stop for refueling throughout the process, and when the vehicle returns to the XH, the range is negative (as shown in Table 5, no refueling), and the range anxiety is infinite (as shown in Table 6, no refueling). When the range anxiety is infinite, the vehicle cannot continue to travel to the next node, indicating that one or more HRSs must be built on the path.
Second, the HHDT stops at GQ for refueling on the return trip (as shown in Table 5, refueling at GQ), the range anxiety on the path is 1.05 (as shown in Table 6, refueling at GQ).
Third, the HHDT stops at JQ for refueling on the return trip (as shown in Table 5, refueling at JQ), the range anxiety on the path is 0.33 (as shown in Table 6, refueling at JQ).
Fourth, when the HHDT stops at SY for refueling (as shown in Table 5, refueling at SY), the range anxiety on the path is 0.23 (as shown in Table 6, refueling at SY).
When the HHDT starts from Dalian with the maximum remaining range L, it stops at SY for refueling so that the users will have the least range anxiety and the highest satisfaction on this path (as shown in Table 6).
The total range anxiety of HHDT users on this path is the smallest when the HRS is expanded in SY. Users with the most minor range anxiety will be in the most relaxed state during driving. A single vehicle’s refueling quantity at SY is 37.14 (kg).
When different HSs and different HMDs are used to supply hydrogen to SY, different hydrogen procurement costs and total chain costs will be obtained. Figure 5 shows the total chain and hydrogen costs of different HSs and HDMs when expanding HRS at SY. Hydrogen cost is used to represent the total chain cost per unit of the hydrogen quantity. The lower the hydrogen cost, the lower the cost of the HS and HMD selected by the HRS. The lowest hydrogen cost method is Anshan HS and long-tube trailer transportation, followed by Shenyang HS and long-tube trailer transportation and Anshan HS and tank car transportation, as shown in Figure 4a. The difference between the three types of hydrogen cost is not significant, and the main reason that affects the total chain cost is that the hydrogen price of Anshan HS is lower than the hydrogen unit price of other HSs. Compared with the other two HDMs, the long-tube trailer has more advantages in terms of total price and is also the most widely-used HDM in China.

4.1.2. Scenario 2

The site-selection cost of HRS T = 1.2 × 10⁷ (CNY) and the initial remaining range L 0 = L 3 (km) are calculated as follows.
Facility layout: XY extends the HRS.
HS and hydrogen quantity: XY chooses Anshan HS to supply hydrogen and use the pipeline to transport hydrogen. The refueling quantity of a single vehicle is 91.72 (kg).
Cost: The total chain cost of the expansion of XY is 1.07 × 10¹¹ (CNY), and the hydrogen cost is 26.82 (CNY).
The HHDT stops at XY for refueling, and the range anxiety on the path is 3.07.
When a HHDT starts from Dalian with a maximum remaining range of L 3 , it stops at XY for refueling, which minimizes the range anxiety of users on this path and gives them the highest satisfaction.
When the HRS is expanded at XY, the total range anxiety of HHDT users on this path is the smallest. When the users’ range anxiety is sight, they will be in the most relaxed state while driving.
When different HSs and different HDMs are used to supply hydrogen to XY, different hydrogen procurement costs and total chain costs will be obtained. Figure 6 shows the total chain and hydrogen costs of different HSs and HDMs when expanding HRS at XY. The lowest hydrogen cost method is Anshan HS and pipeline transportation, followed by Dalian HS and long-tube trailer transportation and Anshan HS and long-tube trailer transportation, as shown in Figure 4b. The cost difference between the three types of hydrogen is not large. The total price of the pipeline is more advantageous than that of the other two HDMs. Pipeline transportation is also a way to transport hydrogen without considering factors such as weather, environment, and labor costs. In this study, the cost of pipeline construction was considered in terms of hydrogen cost. At present, China is actively developing pipeline transportation. If the pipeline is built, then for long-term use, the cost will be cheaper.

4.1.3. Scenario 3

Bulleted lists look like this:
The text continues here.
Site selection expense of HRSs T = 2.4 × 10⁷ (CNY) and initial remaining range L 0 = L 3 (km).
Facility layout: JL and SY expansion HRSs.
HS and hydrogen quantity: JL chooses Anshan HS to supply hydrogen and use the pipeline to transport hydrogen. The refueling quantity of a single vehicle is 70.47 (kg) at JL. SY chooses Anshan HS to supply hydrogen and use a long-tube trailer to transport hydrogen. The refueling quantity of a single vehicle is 33.95 (kg) at SY.
Cost: The total chain cost of the expansion of JL is 8.23 × 10¹⁰ (CNY) and the hydrogen cost is 26.82 (CNY).
The total chain cost of the expansion of SY is 3.27 × 10¹⁰ (CNY) and the hydrogen cost is 22.08 (CNY).
The HHDT stops at JL for refueling and then continues to drive. The vehicle arrives at SY for the second refueling. The vehicle returns to JL for the third refueling, and the range anxiety on the path is 0.32.
When the HHDT starts from Dalian and the maximum remaining range is L 3 , the HHDT users will have the least range anxiety and the highest satisfaction when they stop at JL and SY for refueling.
When JL and SY expand the HRSs, the total range anxiety of HHDT users on this path is the smallest. When the users’ range anxiety is small, they will be in the most relaxed state during driving.
In the scenario setting of building two HRSs, Figure 7 shows the total chain and hydrogen costs of different HSs and HDMs when expanding HRS at JL, and Figure 8 shows the total chain and hydrogen costs of different HSs and HDMs when expanding HRS at SY, respectively. The lowest hydrogen cost method in the construction of JL is Anshan HS and pipeline transportation, followed by Dalian HS and long-tube trailer transportation, and Shenyang HS and pipeline transportation. During the construction of SY, the lowest hydrogen cost method is Anshan HS and long-tube trailer transportation, followed by Shenyang HS and long-tube trailer transportation and Anshan HS and tank car transportation, as shown in Figure 4c.

4.2. Sensitivity Analysis

In the above example, the site-selection cost T, the vehicle’s initial remaining range L 0 , and the hydrogen unit price are all determined parameters. This section extends the situation analysis in the example to better fit the realistic situation. Based on the influence of the change in relevant parameters on the location, cost, and mode of hydrogen transport of HRSs, the study obtains corresponding conclusions and gives reasonable suggestions for station construction.
HRS investors can make decisions on the size of the HRS network (the number of HRSs). Based on the length limit of the Shenyang–Dalian Expressway, three different investment situations can be set in this section, namely, T = 1.2 × 10⁷ (CNY), T = 2.4 × 10⁷ (CNY), T = 3.6 × 10⁷ (CNY). The number of HRS is one when T = 1.2 × 10⁷ (CNY). The number of HRS is two when T = 2.4 × 10⁷ (CNY). The number of HRS is three when T = 3.6 × 10⁷ (CNY). Other parameters are consistent with the calculation examples. Data on HRS location, HS location, HDM, the total chain cost of HRS, and hydrogen cost are listed in Table 7. When HHDTs start in Dalian, the users’ statuses are different. In order to fit the realistic situation, this study designs six kinds of initial remaining ranges L0.
T = 1.2 × 10⁷ (CNY): The investor only expands one HRS in the path (as shown in Table 7). When the initial remaining range of the vehicle is L 0 = L , L 0 = L 2 , L 0 = L 3 from Dalian, the location of the investor’s HRS expansion is SY, XY, and XY, respectively. When the initial remaining range of the vehicle is L 0 = L 4 , the position of the investor to expand the HRS is FZH. The vehicle continued to drive after refueling on FZH and could not return to Dalian. When the initial remaining range of the vehicle is L 0 L 5 , the formal situation is similar to L 0 = L 4 .
T = 2.4 × 10⁷ (CNY): The HRS investor expands two HRSs on the path. When the initial remaining range of the vehicle is L 0 = L 2 from Dalian, the location of the investor’s expansion HRSs is FZH and GQ. When the initial remaining range of the vehicle is L 0 L 3 when starting from Dalian, the location of the investor’s expansion HRSs is JL and SY. The initial remaining range of the HHDT is too low, and JL must refuel to maintain the operation. The vehicle continues to run to Shenyang for refueling, and the range anxiety of the users on this path will be minimized.
T = 3.6 × 10⁷ (CNY): The investor expands three HRSs on the path. When the vehicle’s initial remaining range is L 0 L 3 from Dalian, the investor must include JL and SY when expanding. The site selection of the third HRS is based on the principle of the lowest construction cost. When the initial remaining range of HHDT is L 0 L 2 , the location of HRS expansion is similar to T = 2.4 × 10⁷ (CNY).

5. Discussion

In this study, different initial remaining range L 0 was designed to reflect the wishes of HHDT users in real situations. HHDTs with different initial remaining ranges in Dalian will form a variety of sites (see Figure 9).
When the HRS investor only expands one station on the path, it cannot meet the normal road of L 0 L 4 vehicles. On the path of HHDT, users’ range anxiety is the least, the second HRS in Shenyang gas station expansion is the most ideal. If investors build a third hydrogen station, the location will be based on factors such as land purchase costs. Heavy truck users are legally required to stop for a 20 min break every four hours. The decision factor for users to park is refueling or resting. Before the user stops to rest, he has reached range anxiety and stopped for refueling, so the parking and refueling situation is the first. When investors build three HRSs, most HHDT users will not stop for refueling or rest.
In theory, the more HRSs there are, the less range anxiety users will have on the path. This study stipulated that the vehicle will stop for refueling at L i < L 3 to alleviate range anxiety. When the number of HRS is one, the user’s range anxiety is significantly higher than that of the number of HRS is two (as shown in Figure 10). When the number of refueling stations is three, the user’s range anxiety is the same as when the number of refueling stations is two. The reason is that the maximum remaining range of the vehicle L i L 3 did not meet the parking requirements in this study. Even if HRSs are built along the roads, users will still not stop to refuel unless their range anxiety reaches a critical threshold. Therefore, the locations of HRSs with the lowest cost and minimum user range anxiety are JL and SY. The increase in the number of HRSs has decreased in the number of users stopping at the stations for hydrogen refueling. This phenomenon is because as more HRSs become available for users to choose from, their range anxiety decreases, leading to smaller hydrogen quantities at each station (as shown in Figure 11). HHDT users are more willing to choose this path because the range anxiety is low. Investors are more motivated to build HRSs because of the low hydrogen cost. Therefore, the site selection results of this study will promote the coverage rate of hydrogen vehicles in China’s Liaoning Hydrogen energy corridor and positively affect the development of the hydrogen energy industry.
The selection of HSs will change as the unit prices of hydrogen from various HSs in Python are adjusted. For example, when the hydrogen price per unit of Dalian HS is experimentally adjusted to 16.73 (CNY)/kg, the HS selection of JL HRS will shift from Anshan HS to Dalian HS (in the example analysis, the unit price of hydrogen from Anshan HS is 16.73 (CNY)/kg, and Dalian is 21.3 (CNY)/kg). Changes in HSs will lead to variations in hydrogen transportation costs. According to calculation results, changes in hydrogen purchase costs are significantly more pronounced than transportation costs. Equipment acquisition costs account for the largest proportion of the total chain cost but have a minimal impact on siting selection. However, the unit price of hydrogen energy has the most significant influence on total chain cost, directly affecting the HRS siting results.
The fundamental reason for these cost changes lies in the different hydrogen production methods. Anshan HS still uses traditional coal-based hydrogen production. Therefore, low-cost hydrogen will likely remain dominant in the current market. Green hydrogen needs to perform better in various social attributes [53]. In the future, green hydrogen will replace traditional hydrogen, and the price of hydrogen is expected to decrease [8].
This study considers three different HDMs, with the lowest cost of using long-tube trailers, followed by pipeline transportation, and the relatively high cost of tank cars. Pipeline transportation depends on the construction cost, and long-term use will reduce the average cost. Implementing trailers for hydrogen delivery applications has a low capital cost and provides good investment flexibility. However, by enlarging the delivery scale, this technique loses its economic advantages because capital and operation costs grow linearly. The calculation results show that pipeline transportation is chosen for long-distance hydrogen transportation, while long-tube trailers are used for short-distance transportation. To date, pipelines are widely recognized as the most economical mode for large-scale hydrogen delivery [8]. The results are consistent with hydrogen transportation-related research.
The main contributions of this study are as follows.
First, this study proposed a bi-level programming model that integrates the interests of HRS investors and HFCV users. The upper-level model optimizes the hydrogen cost of each HRS, and the lower-level model optimizes the range anxiety of HFCV users. By optimizing the overall hydrogen cost, the users’ range anxiety is reduced.
Second, the total chain cost and the hydrogen quantity were used to characterize the hydrogen cost of HRS. In this study, the total chain cost calculation framework for HRSs encompasses land costs, construction costs, hydrogen procurement costs, hydrogen transportation costs, and daily operational costs. Each cost parameter inherently reflects current market conditions to a certain extent. This study comprehensively considers more factors and employs more precise data. The model integrates local hydrogen source distribution, high-speed traffic freight flow, long-term trends in land use planning, etc., ensuring that site selection aligns better with real-world scenarios. By utilizing high-precision geographic information data and land purchase cost data, the study enhances the accuracy of model calculation results. By analyzing elements like land and construction costs, the research avoids large-scale land modifications. The model fully accounts for operational costs—such as hydrogen unit purchase prices, transportation distances, equipment maintenance, and employee salaries—helping reduce costs throughout the hydrogen refueling station’s lifecycle. Additionally, the model aligns with local environmental protection policies and sustainable development goals, promoting the green development of hydrogen refueling stations.
Third, this study uses the expressway in Liaoning Province of China as an example to analyze the hydrogen cost of different HSs and HSs. According to the hydrogen cost, the influence of various factors on the station’s site selection is analyzed in detail, and the site selection results of HRSs are given reasonably.
This study focuses on expanding HRSs within existing service areas without considering costs such as land approval and safety audits. If distributed hydrogen production equipment becomes widely adopted, hydrogen stations can operate without relying on large-scale centralized hydrogen plants, thus reducing transportation costs and risks. If long-tube trailer and pipeline transportation capacities are significantly improved, enabling more flexible HRS siting that can better align with demand locations while accessing lower-cost HSs. The location model proposed in this study can be used in some areas’ early phases of HRS network construction. With the increasing scale of the hydrogen energy industry chain, the model needs to be constantly adjusted and improved in combination with application scenarios.

6. Conclusions

The construction of HRSs is the basic guarantee for comprehensively improving the coverage rate of HFCV. Previous studies did not take the whole chain factors such as HS location and HDM and HRS investment into the site-selection model. In this study, the hydrogen cost of HRSs was adjusted based on the principle of minimum range anxiety of HFCV users. Not only does this improve users’ satisfaction on the path but it also reduces the cost of hydrogen station investors.
In this study, combined with expressway simulation in Liaoning Province, China, the results show that expanding the construction scale of HRSs can reduce the range anxiety of HFCV users, increase the coverage number of HFCV driving paths, and promote the popularization of HFCVs. During the early planning phase, HRS investors should rationally determine the number of stations and avoid blindly pursuing excessive numbers. Green hydrogen should rapidly increase its market share to achieve sustainable development goals. Low-cost hydrogen can improve the income of hydrogen station investment builders and improve the enthusiasm of HFCV users to replace traditional fuel vehicles. The cost of pipeline transportation is higher than long-tube trailers. A mature hydrogen pipeline network, in the future, will be used for pipeline transportation compared to long-tube trailers and tank cars and will have more advantages.
Due to the inconsistency between provincial and provincial transportation system policies, the number of HRSs built will be contrary to the actual situation. The location of the cross-province calculation is not accurate enough. This study chose a province as an example to discuss in order to avoid similar problems. The maturity of the HRS network is inseparable from government support. The location model in the study is based on universal logic, such as flow, costs, and transportation distances, and can be replicated globally. Although specific data from particular expressways are used, no policy-specific assumptions are involved.

Author Contributions

Conceptualization, L.J. and L.W.; methodology, L.J.; software, L.J. and L.W.; validation, L.J. and L.W.; formal analysis, L.J.; investigation, L.J.; resources, L.W.; data curation, L.J.; writing—original draft preparation, L.J.; writing—review and editing, L.J. and L.W.; visualization, L.W.; funding acquisition, L.W. All authors have read and agreed to the published version of the manuscript.

Funding

This research was funded by the National Key R&D Program of China, grant number 2023YFE0113200 and the International Science and Technology Cooperation Program Project of Liaoning Province, grant number 2023JH2/10700027.

Data Availability Statement

Data will be made available on request.

Conflicts of Interest

The authors declare no conflicts of interest.

Nomenclature

The following variables are used in this study:
x i binary decision variable, taking the value one if a HRS is built at node i, and zero otherwise
y i binary decision variable, taking the value one if a HFCV stops at node i, and zero otherwise
w i refueling quantity of a single vehicle at each node i (kg)
L the maximum remaining range with full fuel (km)
L i the maximum remaining range of the FCEV before reaching at node i (km)
L 0 the initial remaining range (km)
L i j the shortest path distance between any node i and j (km)
L i f the shortest path distance between node i and HS f (km)
ε range anxiety threshold, that is, users become anxious when the remaining range of the HFCV will only last for ε (km)
ζ the scale factor
γ i the range anxiety for a user arrives at node i
T budget for the construction of the HRSs (CNY)
C i l land cost of node i (CNY)
c i l unit land cost of node i (CNY)
C i c o HRS construction cost (CNY)
C i t r hydrogen delivery cost of t-type vehicles between node i and HS f (CNY)
C i H t r hydrogen delivery cost of pipeline between node i and HS f (CNY)
C i p hydrogen procurement cost (CNY)
E i fixed cost of building one HRS at node i (CNY)
G i annual operating cost of node i (CNY)
s i land area of node i (m2)
p unit price of hydrogen (CNY/kg)
A t unit transportation cost of t-type vehicle (CNY)
A H levelized cost of pipeline hydrogen transportation (CNY/kg)
α hydrogen fuel cell heavy-duty truck load (kg/vehicle)
σ hydrogen consumption per 100 km of a HFCV (100 km/kg)
ψ annual vehicle flow (vehicle)
w i f hydrogen quantity from the HS f to the node i (kg)
I set of potential hydrogen refueling station locations, iI, jJ, and the starting point is represented by 0
F set of hydrogen sources, fF
HRShydrogen refueling station
HFCVhydrogen fuel cell vehicle
HHDThydrogen fuel cell heavy-duty truck
HShydrogen source
HDMhydrogen delivery mode
JLservice area at Jiuli
SSLPservice area at Sanshilipu
FZHservice area at Fuzhouhe
XYservice area at Xiongyue
XHservice area at Xihai
GQservice area at Ganquan
JQservice area at Jingquan
SYgas station at Shenyang

References

  1. Liu, J.C.; Ma, X.Y.; Lu, C.R. A three-stage framework for optimal site selection of hybrid offshore wind-photovoltaic-wave-hydrogen energy system: A case study of China. Energy 2024, 313, 133723. [Google Scholar]
  2. Isaac, N.; Saha, A.K. A review of the optimization strategies and methods used to locate hydrogen fuel refueling stations. Energies 2023, 16, 2171. [Google Scholar] [CrossRef]
  3. Martins, F.P.; Almaraz, S.D.; Junior, A.B.B.; Azzaro-Pantel, C.; Parikh, P. Hydrogen and the sustainable development goals: Synergies and trade-offs. Ren. Sust. Energy Rev. 2024, 204, 114796. [Google Scholar]
  4. Zhou, Y.; Qin, X.P.; Mei, W.J.; Yang, W.L.; Ni, M. Multi-period urban hydrogen refueling stations site selection and capacity planning with many-objective optimization for hydrogen supply chain. Int. J. Hydrogen Energy 2024, 79, 1427–1441. [Google Scholar]
  5. Velmozhina, K.A.; Politaeva, N.A.; Ilin, I.V.; Shinkevich, P.S. Review of modern strategies for the development of hydrogen bioenergy as key areas for achieving sustainable development goals. Int. J. Hydrogen Energy 2024, 70, 729–736. [Google Scholar]
  6. Calandra, D.; Wang, T.W.; Cane, M.; Alfiero, S. Management of hydrogen mobility challenges: A systematic literature review. J. Clean. Prod. 2023, 410, 137305. [Google Scholar]
  7. Yan, H.S.; Tan, X.C.; Kong, L.S.; Cheng, Y.L. How China’s transport sector responds to carbon neutrality target: A study from a multi-model comparison analysis. Energy Sustain. Dev. 2025, 85, 101627. [Google Scholar]
  8. Guan, D.Q.; Wang, B.W.; Zhang, J.G.; Shi, R.; Jiao, K.; Li, L.C.; Wang, Y.; Xie, B.; Zhang, Q.W.; Yu, J.; et al. Hydrogen society: From present to future. Energy Environ. Sci. 2023, 16, 4926–4943. [Google Scholar]
  9. Yang, C.; Hu, Q. Quantifying fuel cell vehicles and hydrogen refueling station networks in China based on roadmap. Energy Sustain. Dev. 2023, 76, 101265. [Google Scholar]
  10. Zhu, S. 80% of Global Hydrogen Refueling Stations Are Located in Just Five Countries; Interact Analysis: Wellingborough, UK, 2025. [Google Scholar]
  11. Sayarshad, H.R. Coordinated routing, charging, and power grid for electric and hydrogen vehicles with renewable energy integration. Renew. Energy 2025, 243, 122572. [Google Scholar]
  12. Ball, M.; Weeda, M. The hydrogen economy—Vision or reality? Int. J. Hydrogen Energy 2015, 40, 7903–7919. [Google Scholar]
  13. Winter, C.-J. Hydrogen energy—Abundant, efficient, clean: A debate over the energy-system-of-change. Int. J. Hydrogen Energy 2009, 34, S1–S52. [Google Scholar]
  14. Lin, R.H.; Ye, Z.Z.; Wu, B.D. A review of hydrogen station location models. Int. J. Hydrogen Energy 2020, 45, 20176–20183. [Google Scholar]
  15. Hernández, B.; Alkayas, A.; Azar, E.; Mayyas, A.T. Mathematical Model for the Placement of Hydrogen Refueling Stations to Support Future Fuel Cell Trucks. IEEE Access 2021, 9, 148118–148131. [Google Scholar]
  16. Kim, H.; Kim, B.-I.; Thiel, D. Exact algorithms for incremental deployment of hydrogen refuelling stations. Int. J. Hydrogen Energy 2021, 46, 28760–28774. [Google Scholar]
  17. Sun, H.R.; He, C.M.; Yu, X.Z.; Wu, M.X.; Ling, Y.H. Optimal siting and sizing of hydrogen refueling stations considering distributed hydrogen production and cost reduction for regional consumers. Int. J. Energy Res. 2019, 43, 4184–4200. [Google Scholar]
  18. Zhou, Y.; Qin, X.P.; Li, C.L.; Zhou, J. An Intelligent Site Selection Model for Hydrogen Refueling Stations Based on Fuzzy Comprehensive Evaluation and Artificial Neural Network—A Case Study of Shanghai. Energies 2022, 15, 1098. [Google Scholar] [CrossRef]
  19. Greene, D.L.; Ogden, J.M.; Lin, Z.H. Challenges in the designing, planning and deployment of hydrogen refueling infrastructure for fuel cell electric vehicles. eTransportation 2020, 6, 100086. [Google Scholar]
  20. Shamsi, H.; Tran, M.-K.; Akbarpour, S.; Maroufmashat, A.; Fowler, M. Macro-Level optimization of hydrogen infrastructure and supply chain for zero-emission vehicles on a Canadian corridor. J. Clean. Prod. 2021, 289, 125163. [Google Scholar]
  21. Xu, M.J.; Wu, Y.N.; Liao, Y.J.; Tao, Y.; Liu, F.T. Optimal sites selection of oil-hydrogen combined stations considering the diversity of hydrogen sources. Int. J. Hydrogen Energy 2023, 48, 1043–1059. [Google Scholar]
  22. Stephens-Romero, S.D.; Brown, T.M.; Kang, J.E.; Recker, W.W.; Samuelsen, G.S. Systematic planning to optimize investments in hydrogen infrastructure deployment. Int. J. Hydrogen Energy 2010, 35, 4652–4667. [Google Scholar]
  23. Markert, F.; Nielsen, S.K.; Paulsen, J.L.; Andersen, V. Safety aspects of future infrastructure scenarios with hydrogen refueling stations. Int. J. Hydrogen Energy 2007, 32, 2227–2234. [Google Scholar] [CrossRef]
  24. Nicholas, M.A.; Ogden, J. Detailed analysis of urban station siting for California hydrogen highway network. J. Transp. Res. Board 2006, 1983, 121–128. [Google Scholar] [CrossRef]
  25. Li, S.X.; Long, J.H.; Sui, P.-C.; Hou, Z.X.; Chahine, R.; Xiao, J.S. Addition of hydrogen refueling for fuel cell bus fleet to existing natural gas stations: A case study in Wuhan, China. Int. J. Energ. Res. 2019, 43, 7557–7572. [Google Scholar] [CrossRef]
  26. Lin, R.H.; Ye, Z.Z.; Guo, Z.Y.; Wu, B.D. Hydrogen station location optimization based on multiple data sources. Int. J. Hydrogen Energy 2020, 45, 10270–10279. [Google Scholar]
  27. Shi, M.F.; Li, X.M.; Xu, C.B. Two-stage site selection of hydrogen refueling stations coupled with gas stations considering cooperative effects based on the CRITIC-ITFAHPMABAC method: A case study in Beijing. Int. J. Hydrogen Energy 2024, 49, 1274–1292. [Google Scholar]
  28. Katikaneni, S.P.; Al-Muhaish, F.; Harale, A.; Pham, T.V. On-site hydrogen production from transportation fuels: An overview and techno-economic assessment. Int. J. Hydrogen Energy 2014, 39, 4331–4350. [Google Scholar] [CrossRef]
  29. Chaudhary, K.; Bhardvaj, K.; Chaudhary, A. A qualitative assessment of hydrogen generation techniques for fuel cell applications. Fuel 2024, 358, 130090. [Google Scholar] [CrossRef]
  30. Melaina, M.; Penev, M. Hydrogen Station Cost Estimates. Comparing Hydrogen Station Cost Calculator Results with Other Recent Estimates; National Renewable Laboratory (NREL): Denver, CO, USA, 2013. [Google Scholar]
  31. Noel, L.; Rubens, G.Z.; Sovacool, B.K.; Kester, J. Fear and loathing of electric vehicles: The reactionary rhetoric of range anxiety. Energy Res. Soc. Sci. 2019, 48, 96–107. [Google Scholar] [CrossRef]
  32. Ala, G.; Miceli, R.; Romano, P.; Schettino, G.; Viola, F. Electric Vehicles and Psychology, Part 2. In Proceedings of the 2021 Sixteenth International Conference on Ecological Vehicles and Renewable Energies, Monte-Carlo, Monaco, 5–7 May 2021; pp. 1–7. [Google Scholar]
  33. Wang, Z.K.; Zeng, S.K.; Guo, J.B. Understanding the influence of state of health on the range anxiety of battery electric vehicle drivers. IET Intell. Transp. Sy. 2021, 15, 286–296. [Google Scholar] [CrossRef]
  34. Salah, K.; Kama, N. Reducing Range Anxiety by Unifying Networks of Charging Stations. In Proceedings of the 2016 3rd International Conference on Manufacturing and Industrial Technologies, Istanbul, Turkey, 25–27 May 2016; Volume 70, p. 04003. [Google Scholar]
  35. Guo, F.; Yang, J.; Lu, J.Y. The battery charging station location problem: Impact of users’ range anxiety and distance convenience. Transport. Res. Part E 2018, 114, 1–18. [Google Scholar]
  36. Chen, R.; Liu, X.L.; Miao, L.X.; Yang, P. Electric Vehicle Tour Planning Considering Range Anxiety. Sustainability 2020, 12, 3685. [Google Scholar] [CrossRef]
  37. Xia, L.N.; Chen, C.; Ren, H.H.; Kang, Z.J. Analysis of range anxiety using NEV monitoring big data. In Proceedings of the 2022 ASIA Conference on Algorithms, Computing and Machine Learning, Hangzhou, China, 25–27 March 2022; pp. 145–149. [Google Scholar]
  38. Fuse, M.; Noguchi, H.; Seya, H. Near-term location planning of hydrogen refueling stations in Yokohama City. Int. J. Energy Res. 2021, 46, 12272–12279. [Google Scholar] [CrossRef]
  39. Li, J.Y.; Liu, C.Y.; Wang, Y.S.; Chen, R.; Xu, X.S. Bi-level programming model approach for electric vehicle charging stations considering user charging costs. Electr. Pow. Syst. Res. 2023, 214, 108889. [Google Scholar]
  40. Wu, Q.L.; Li, C.X. Dynamic pricing and energy management of hydrogen-based integrated energy service provider considering integrated demand response with a bi-level approach. J. Energ. Storage 2023, 59, 106558. [Google Scholar]
  41. Lei, Y.; Zhang, J.; Ren, Z.H. A Study on Bicycle-Sharing Dispatching Station Site Selection and Planning Based on Multivariate Data. Sustainability 2023, 15, 13112. [Google Scholar] [CrossRef]
  42. Xu, Y.J.; Jia, H.F.; Zhang, Y.K.; Tian, G.D. Analysis on the location of green logistics park based on heuristic algorithm. Advan. Mech. Engin. 2018, 10, 168781401877463. [Google Scholar]
  43. Zhang, R.C.; Li, J.X.; Shang, Y.Y. Multi-Level Site Selection of Mobile Emergency Logistics Considering Safety Stocks. Appl. Sci. 2023, 13, 11245. [Google Scholar] [CrossRef]
  44. Zhou, Y.; Qin, X.P.; Yao, C.L.; Ni, M.; Zhou, J.; Liu, L.; Lie, W.Y.; Yang, W.L. Site planning and selection of hydrogen refueling stations considering the life cycle and demand uncertainty. Sustain. Energy Fuels 2023, 23, 5513–5527. [Google Scholar]
  45. Ga, B.V.; Tu, B.T.M.; Mai, P.X.; Hung, B.V.; Pham, L.H.P. Zero-Emission Vehicles Penetration into the ASEAN Market: Challenges and Perspective. In CIGOS 2021, Emerging Technologies and Applications for Green Infrastructure; Springer: Singapore, 2021; Volume 203, pp. 1733–1742. [Google Scholar]
  46. Kuby, M.; Lim, S. The flow-refueling location problem for alternative-fuel vehicles. Socio-Econ. Plan. Sci. 2005, 39, 125–145. [Google Scholar]
  47. Gao, X.W.; An, R.C. Research on the coordinated development capacity of China’s hydrogen energy industry chain. J. Clean. Prod. 2022, 377, 134177. [Google Scholar] [CrossRef]
  48. Yang, Y.; Tong, L.G.; Yin, S.W.; Liu, Y.X.; Wang, L.; Qiu, Y.N.; Ding, Y.L. Status and challenges of applications and industry chain technologies of hydrogen in the context of carbon neutrality. J. Clean. Prod. 2022, 376, 134347. [Google Scholar] [CrossRef]
  49. Apostolou, D.; Xydis, G. A literature review on hydrogen refuelling stations and infrastructure. Current status and future prospects. Renew. Sustain. Energy Rev. 2019, 113, 109292. [Google Scholar] [CrossRef]
  50. Wang, X.T.; Liu, N.N. Research on the construction plan layout of the combined Hydrogen and CNG refueling station. In Proceedings of the 2021 5th International Conference on Advances in Energy, Environment and Chemical Science, Shanghai, China, 26–28 February 2021; Volume 245, p. 01006. [Google Scholar]
  51. Yao, Y.Z.; Tan, L.Y.; Chen, F.; Pan, A.; Ma, Q.J.; Zhao, J.L. Hydrogen energy industry in China: The current status, safety problems, and pathways for future safe and healthy development. Saf. Sci. 2025, 186, 106808. [Google Scholar] [CrossRef]
  52. Xue, S.; Zhu, Z. How government policies promote transportation utilization in the national-level hydrogen supply chain: A case of China. Energy Sustain. Dev. 2024, 80, 101457. [Google Scholar] [CrossRef]
  53. Akhtar, M.S.; Khan, H.; Liu, J.J.; Na, J. Green hydrogen and sustainable development—A social LCA perspective highlighting social hotspots and geopolitical implications of the future hydrogen economy. J. Clean. Prod. 2023, 395, 136438. [Google Scholar] [CrossRef]
Figure 1. The cost breakdown structure of HSR.
Sustainability 17 03210 g001
Figure 2. Bi-level programming model.
Sustainability 17 03210 g002
Figure 3. The Shenyang–Dalian Expressway.
Sustainability 17 03210 g003
Figure 4. The results of location selection in three scenarios: (a) scenario 1; (b) scenario 2; (c) scenario 3.
Sustainability 17 03210 g004
Figure 5. The total chain and hydrogen costs of different HSs and HDMs when expanding HRS at SY in scenario 1.
Sustainability 17 03210 g005
Figure 6. The total chain and hydrogen costs of different HSs and HDMs when expanding HRS at XY in scenario 2.
Sustainability 17 03210 g006
Figure 7. The total chain and hydrogen costs of different HSs and HDMs when expanding HRS at JL in scenario 3.
Sustainability 17 03210 g007
Figure 8. The total chain and hydrogen costs of different HSs and HDMs when expanding HRS at SY in scenario 3.
Sustainability 17 03210 g008
Figure 9. The location scheme of the HHDT with different initial remaining range.
Sustainability 17 03210 g009
Figure 10. The range anxiety of users at node i.
Sustainability 17 03210 g010
Figure 11. The refueling quantity (kg) of a single vehicle at each node i.
Sustainability 17 03210 g011
Table 1. Data related to each service area.
Service AreaDistance (km) c i l ( CNY / m 2 ) s i ( m 2 )
JL31.92073000
SSLP43.82253000
FZH106.51353000
XY158.92043000
XH191.12253000
GQ265.81353000
JQ326.71353000
SY359.12503000
Table 2. The distance L i f (km) between node i and HS.
Dalian HSPanjin HSAnshan HSShenyang HS
JL71.4224.4243.0318.8
SSLP62.3214.8231.4306.9
FZH31.6156.2175.0249.7
XY69.5105.9124.9199.5
XH100.581.292.7170.3
GQ174.159.520.095.9
JQ235.698.838.537.5
SY260.7115.662.058.4
Table 3. The unit price p (CNY/kg) of hydrogen at each HS.
Dalian HSPanjin HSAnshan HSShenyang HS
the unit price p21.319.416.718.6
Table 4. The unit price of different HDMs.
HDMTransport Capacity
α: Kg/Vehicle
Unit Price of T-Type HDM
A t : CNY/(Kg·Km)
Pipeline Levelized
Cost Below 150 Km
A H : CNY/Kg
long-tube trailer350.00866.00
tank car4000.001357.00
Pipeline10.12
Table 5. The maximum remaining range L i (km) when passing through each node i.
Node iJLSSLPFZHXYXHGQJQSYJQGQXHXYFZHSSLPJL
no refueling468.1456.2393.5341.1308.9234.2173.3128.683.923.0−51.7
refueling at GQ468.1456.2393.5341.1308.9234.2173.3128.683.923.0425.3393.1340.7278.0266.1
refueling at JQ468.1456.2393.5341.1308.9234.2173.3128.683.9439.1364.4332.2279.8217.1205.2
refueling at SY468.1456.2393.5341.1308.9234.2173.3128.6455.3394.4319.7287.5235.1172.4160.5
Table 6. The range anxiety γ i when passing through each node i.
Node iJLSSLPFZHXYXHGQJQSYJQGQXHXYFZHSSLPJLTotal
range
anxiety
00000000.130.200.72
00000000.130.200.72000001.05
00000000.130.200000000.33
00000000.130000000.100.23
Table 7. The data of the vehicle passing through each at each node i.
One HRSTwo HRSsThree HRSs
LHSSY: Anshan HSFZH:—SY: Anshan HSSSLP:—FZH:—SY: Anshan HS
HDMSY: Long-tube trailerFZH:—SY: Long-tube trailerSSLP:—FZH:—SY: Long-tube trailer
The total chain cost (CNY).SY: 3.57 × 10¹⁰FZH: 1.44 × 10⁷ SY: 3.57 × 10¹⁰SSLP: 1.46 × 10⁷ FZH: 1.44 × 10⁷ SY: 3.57 × 10¹⁰
The hydrogen cost (CNY).SY: 22.08FZH:—SY: 22.08SSLP:—FZH:—SY: 22.08
L 2 HSXY: Anshan HSFZH: Anshan HS GQ: Anshan HSFZH: Anshan HS XY:—GQ: Anshan HS
HDMXY: PipelineFZH: pipeline GQ: long-tube trailerFZH: pipeline XY:—GQ: long-tube trailer
The total chain cost (CNY).XY: 9.75 × 10¹⁰FZH: 3.73 × 10¹⁰ GQ: 3.57 × 10¹⁰FZH:3.73 × 10¹⁰ XY: 1.46 × 10⁷ GQ: 2.98 × 10¹⁰
The hydrogen cost (CNY).XY: 26.82FZH: 26.82 GQ: 22.08FZH: 26.82 XY:—GQ: 22.08
L 3 HSXY: Anshan HSSSLP: Anshan HS SY: Anshan HSJL: Anshan HS XH:—SY: Anshan HS
HDMXY: PipelineJL: pipeline GQ: long-tube trailerJL: pipeline XH:—SY: long-tube trailer
The total chain cost (CNY).XY: 1.07 × 10¹¹SSLP: 8.23 × 10¹⁰ SY: 3.27 × 10¹⁰JL:8.24 × 10¹⁰ XH: 1.47 × 10⁷ SY: 3.27 × 10¹⁰
The hydrogen cost (CNY).XY: 26.82SSLP: 26.82 SY: 22.08JL: 26.82 XH:—SY: 22.08
L 4 HS JL: Anshan HS SY: Anshan HSJL: Anshan HS SSLP:—SY: Anshan HS
HDM JL: pipeline SY: long-tube trailerJL: pipeline SSLP:—SY: long-tube trailer
The total chain cost (CNY). JL: 6.61 × 10¹⁰ SY: 2.30 × 10¹⁰JL: 8.72 × 10¹⁰ SSLP: 1.47 × 10¹⁰ SY: 3.27 × 10¹⁰
The hydrogen cost (CNY). JL: 26.82 SY: 22.08JL: 26.82 SSLP:—SY: 22.08
L 5 HS JL: Anshan HS SY: Anshan HSJL: Anshan HS JQ:—SY: Anshan HS
HDM JL: pipeline SY: long-tube trailerJL: pipeline JQ:—SY: long-tube trailer
The total chain cost (CNY). JL: 9.02 × 10¹⁰ SY: 3.27 × 10¹⁰JL: 9.02 × 10¹⁰ JQ: 1.44 × 10⁷ SY: 3.27 × 10¹⁰
The hydrogen cost (CNY). JL: 26.82 SY: 22.08JL: 26.82 JQ:—SY: 22.08
L 6 HS JL: Anshan HS SY: Anshan HSJL: Anshan HS JQ:—SY: Anshan HS
HDM JL: pipeline SY: long-tube trailerJL: pipeline JQ:—SY: long-tube trailer
The total chain cost (CNY). JL: 9.21 × 10¹⁰ SY: 3.27 × 10¹⁰JL: 9.21 × 10¹⁰ JQ: 1.44 × 10⁷ SY: 3.27 × 10¹⁰
The hydrogen cost (CNY). JL: 26.82 SY: 22.08JL: 26.82 JQ:—SY: 22.08
Disclaimer/Publisher’s Note: The statements, opinions and data contained in all publications are solely those of the individual author(s) and contributor(s) and not of MDPI and/or the editor(s). MDPI and/or the editor(s) disclaim responsibility for any injury to people or property resulting from any ideas, methods, instructions or products referred to in the content.

