The Application of Response Surface Methodology and Machine Learning for Predicting the Compressive Strength of Recycled Aggregate Concrete Containing Polypropylene Fibers and Supplementary Cementitious Materials


Abstract
1. Introduction
2. Materials and Methods
2.1. Response Surface Methodology (RSM)
2.2. Machine Learning (ML) Approach
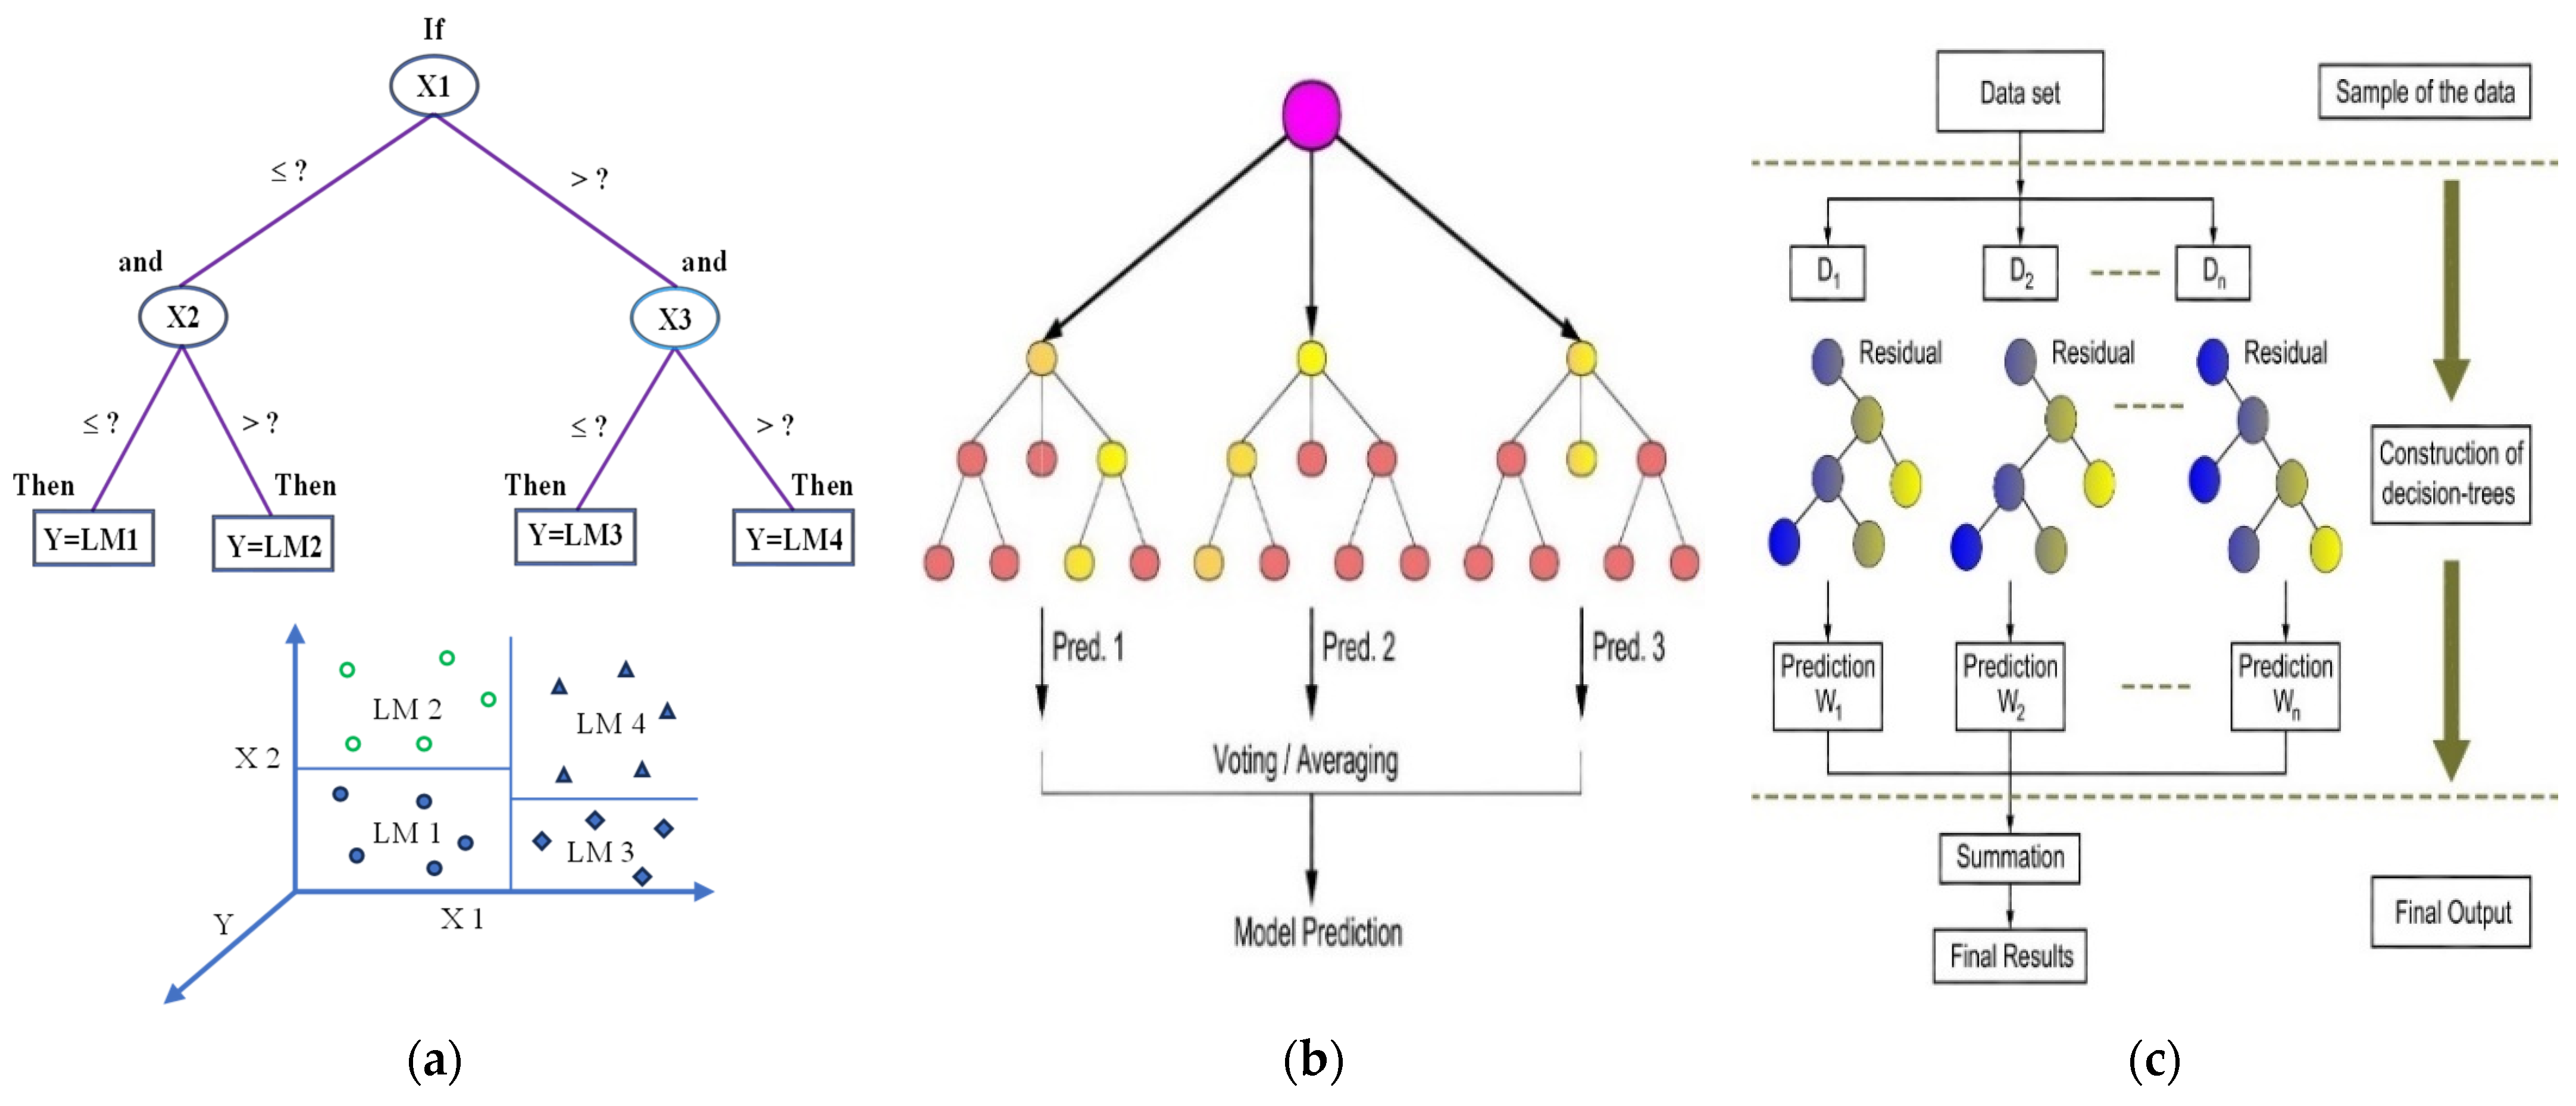
2.2.1. M5P-Tree (M5P)
2.2.2. Random Forest (RF)
2.2.3. Extreme Gradient Boosting (XGB)
2.3. Model Efficiencies
3. Results and Discussion
3.1. RSM
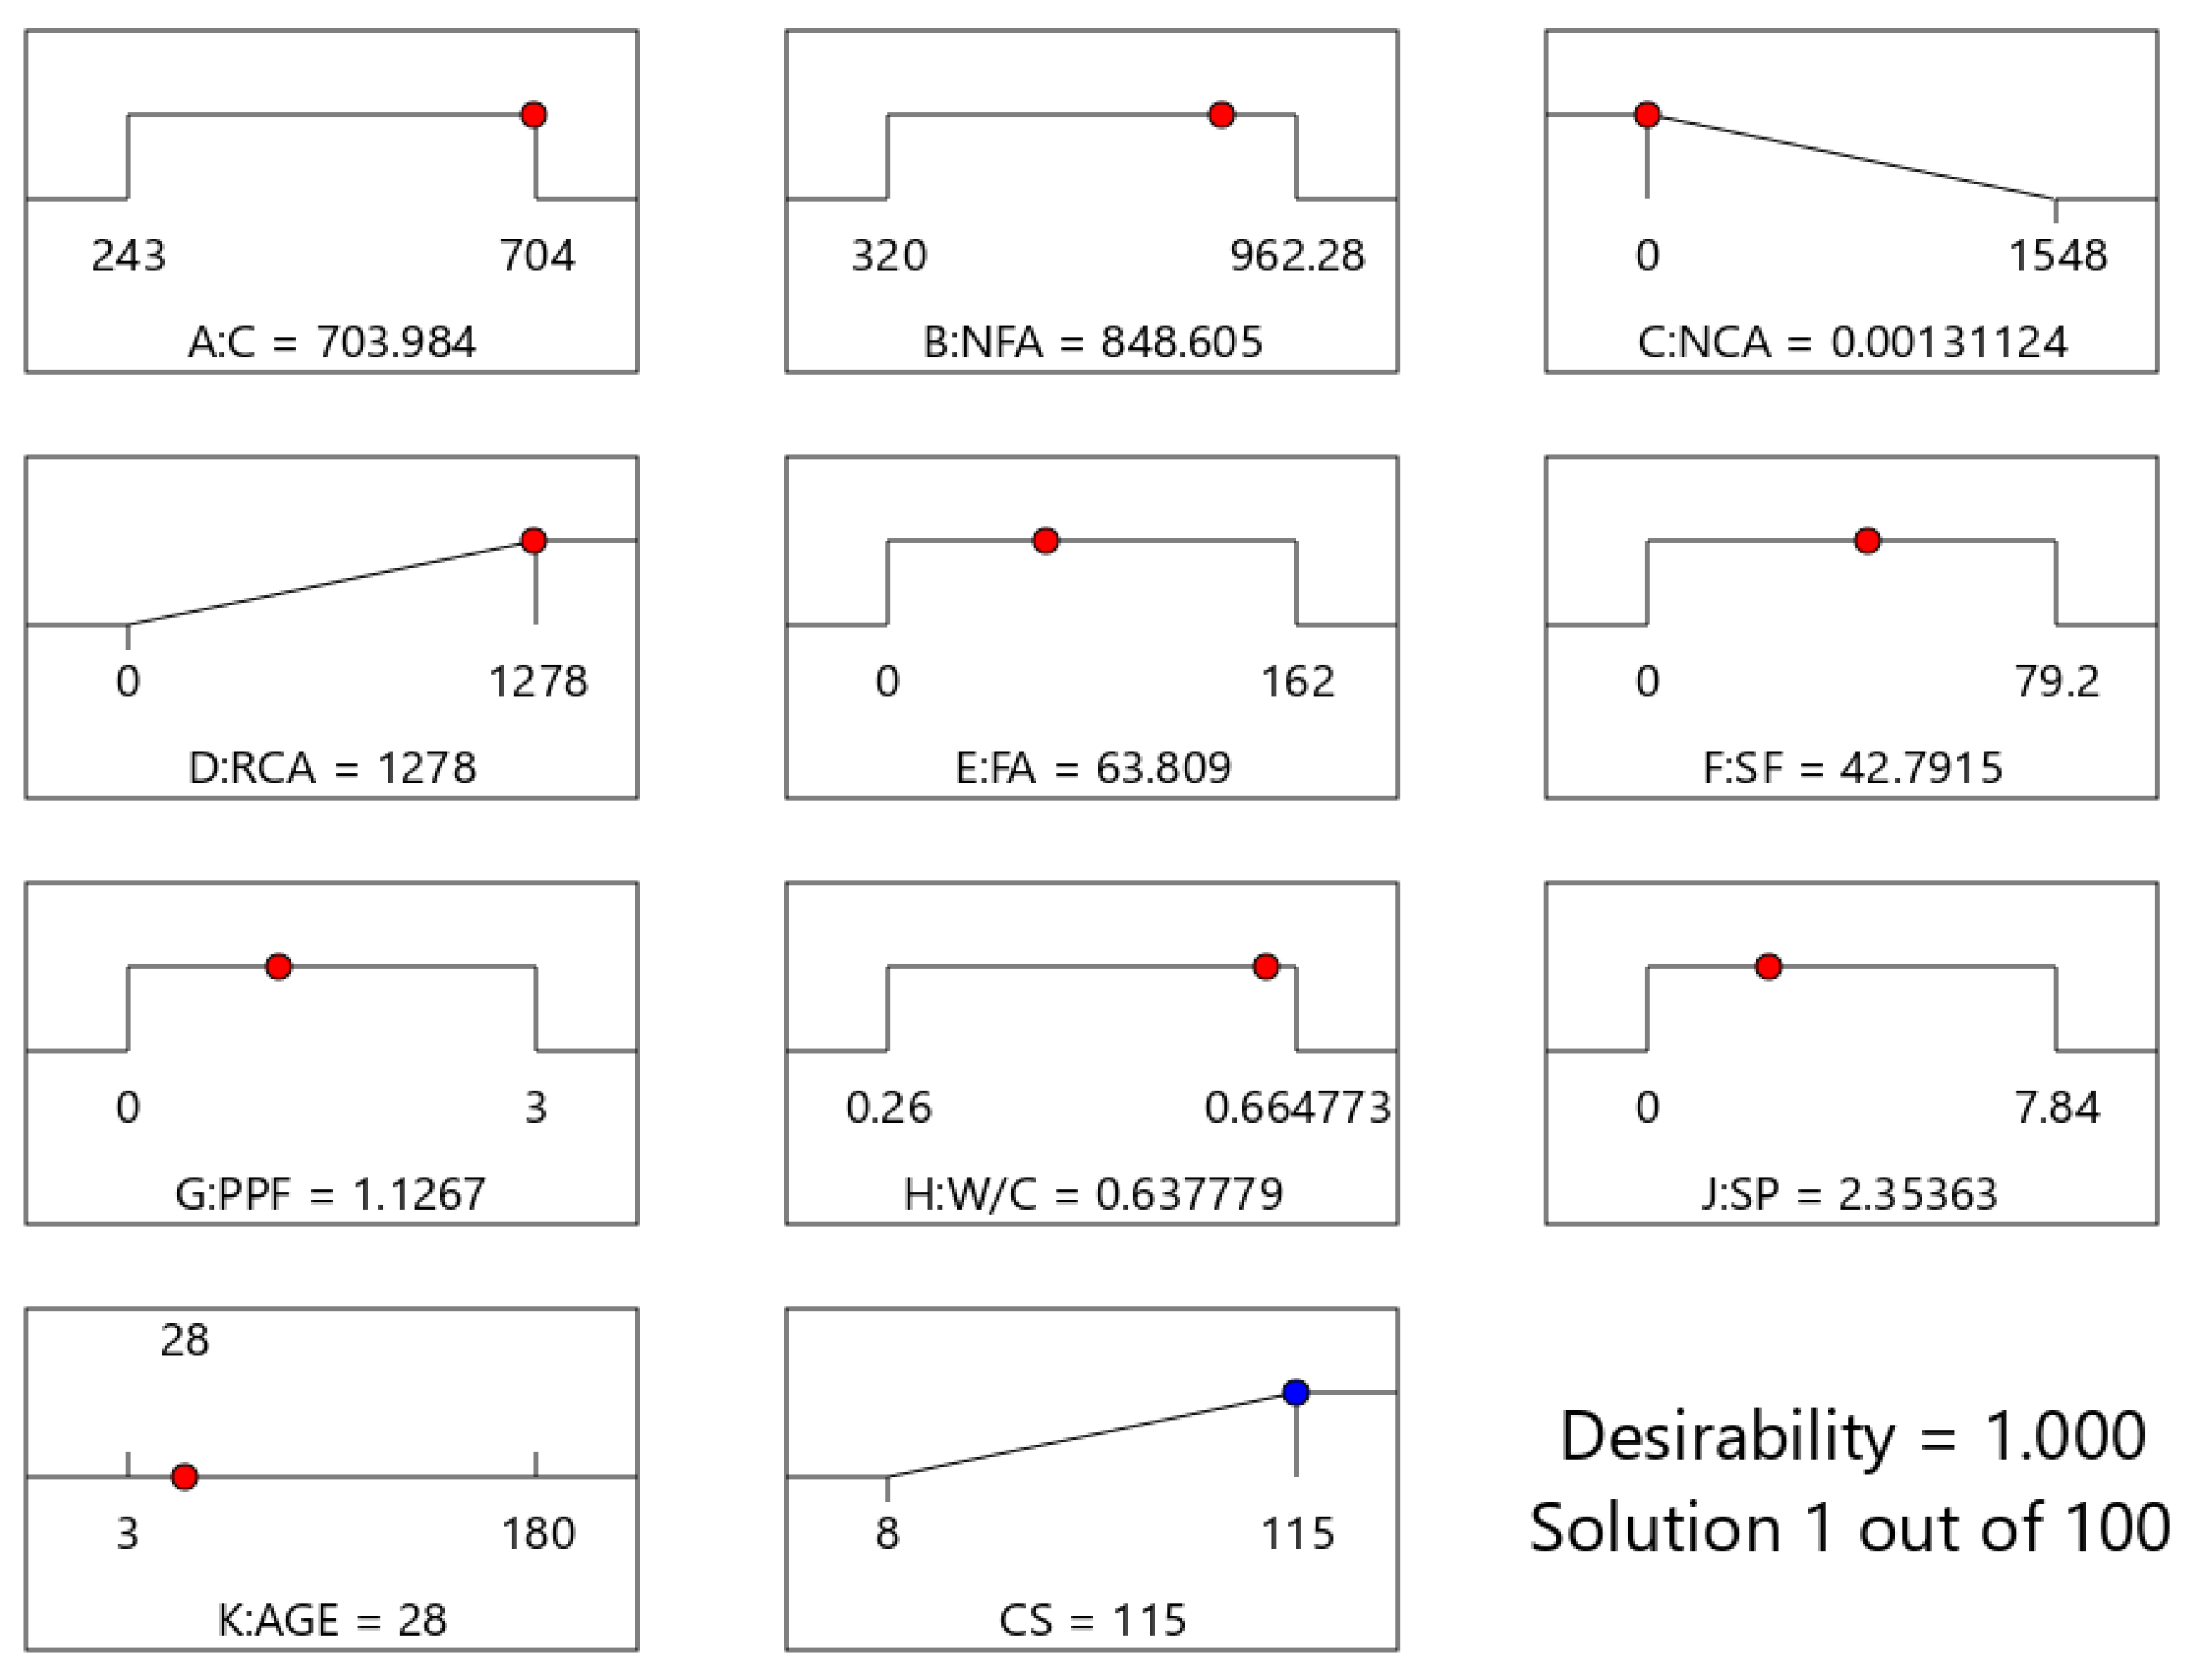
Optimization by RSM
3.2. Performance of ML Models
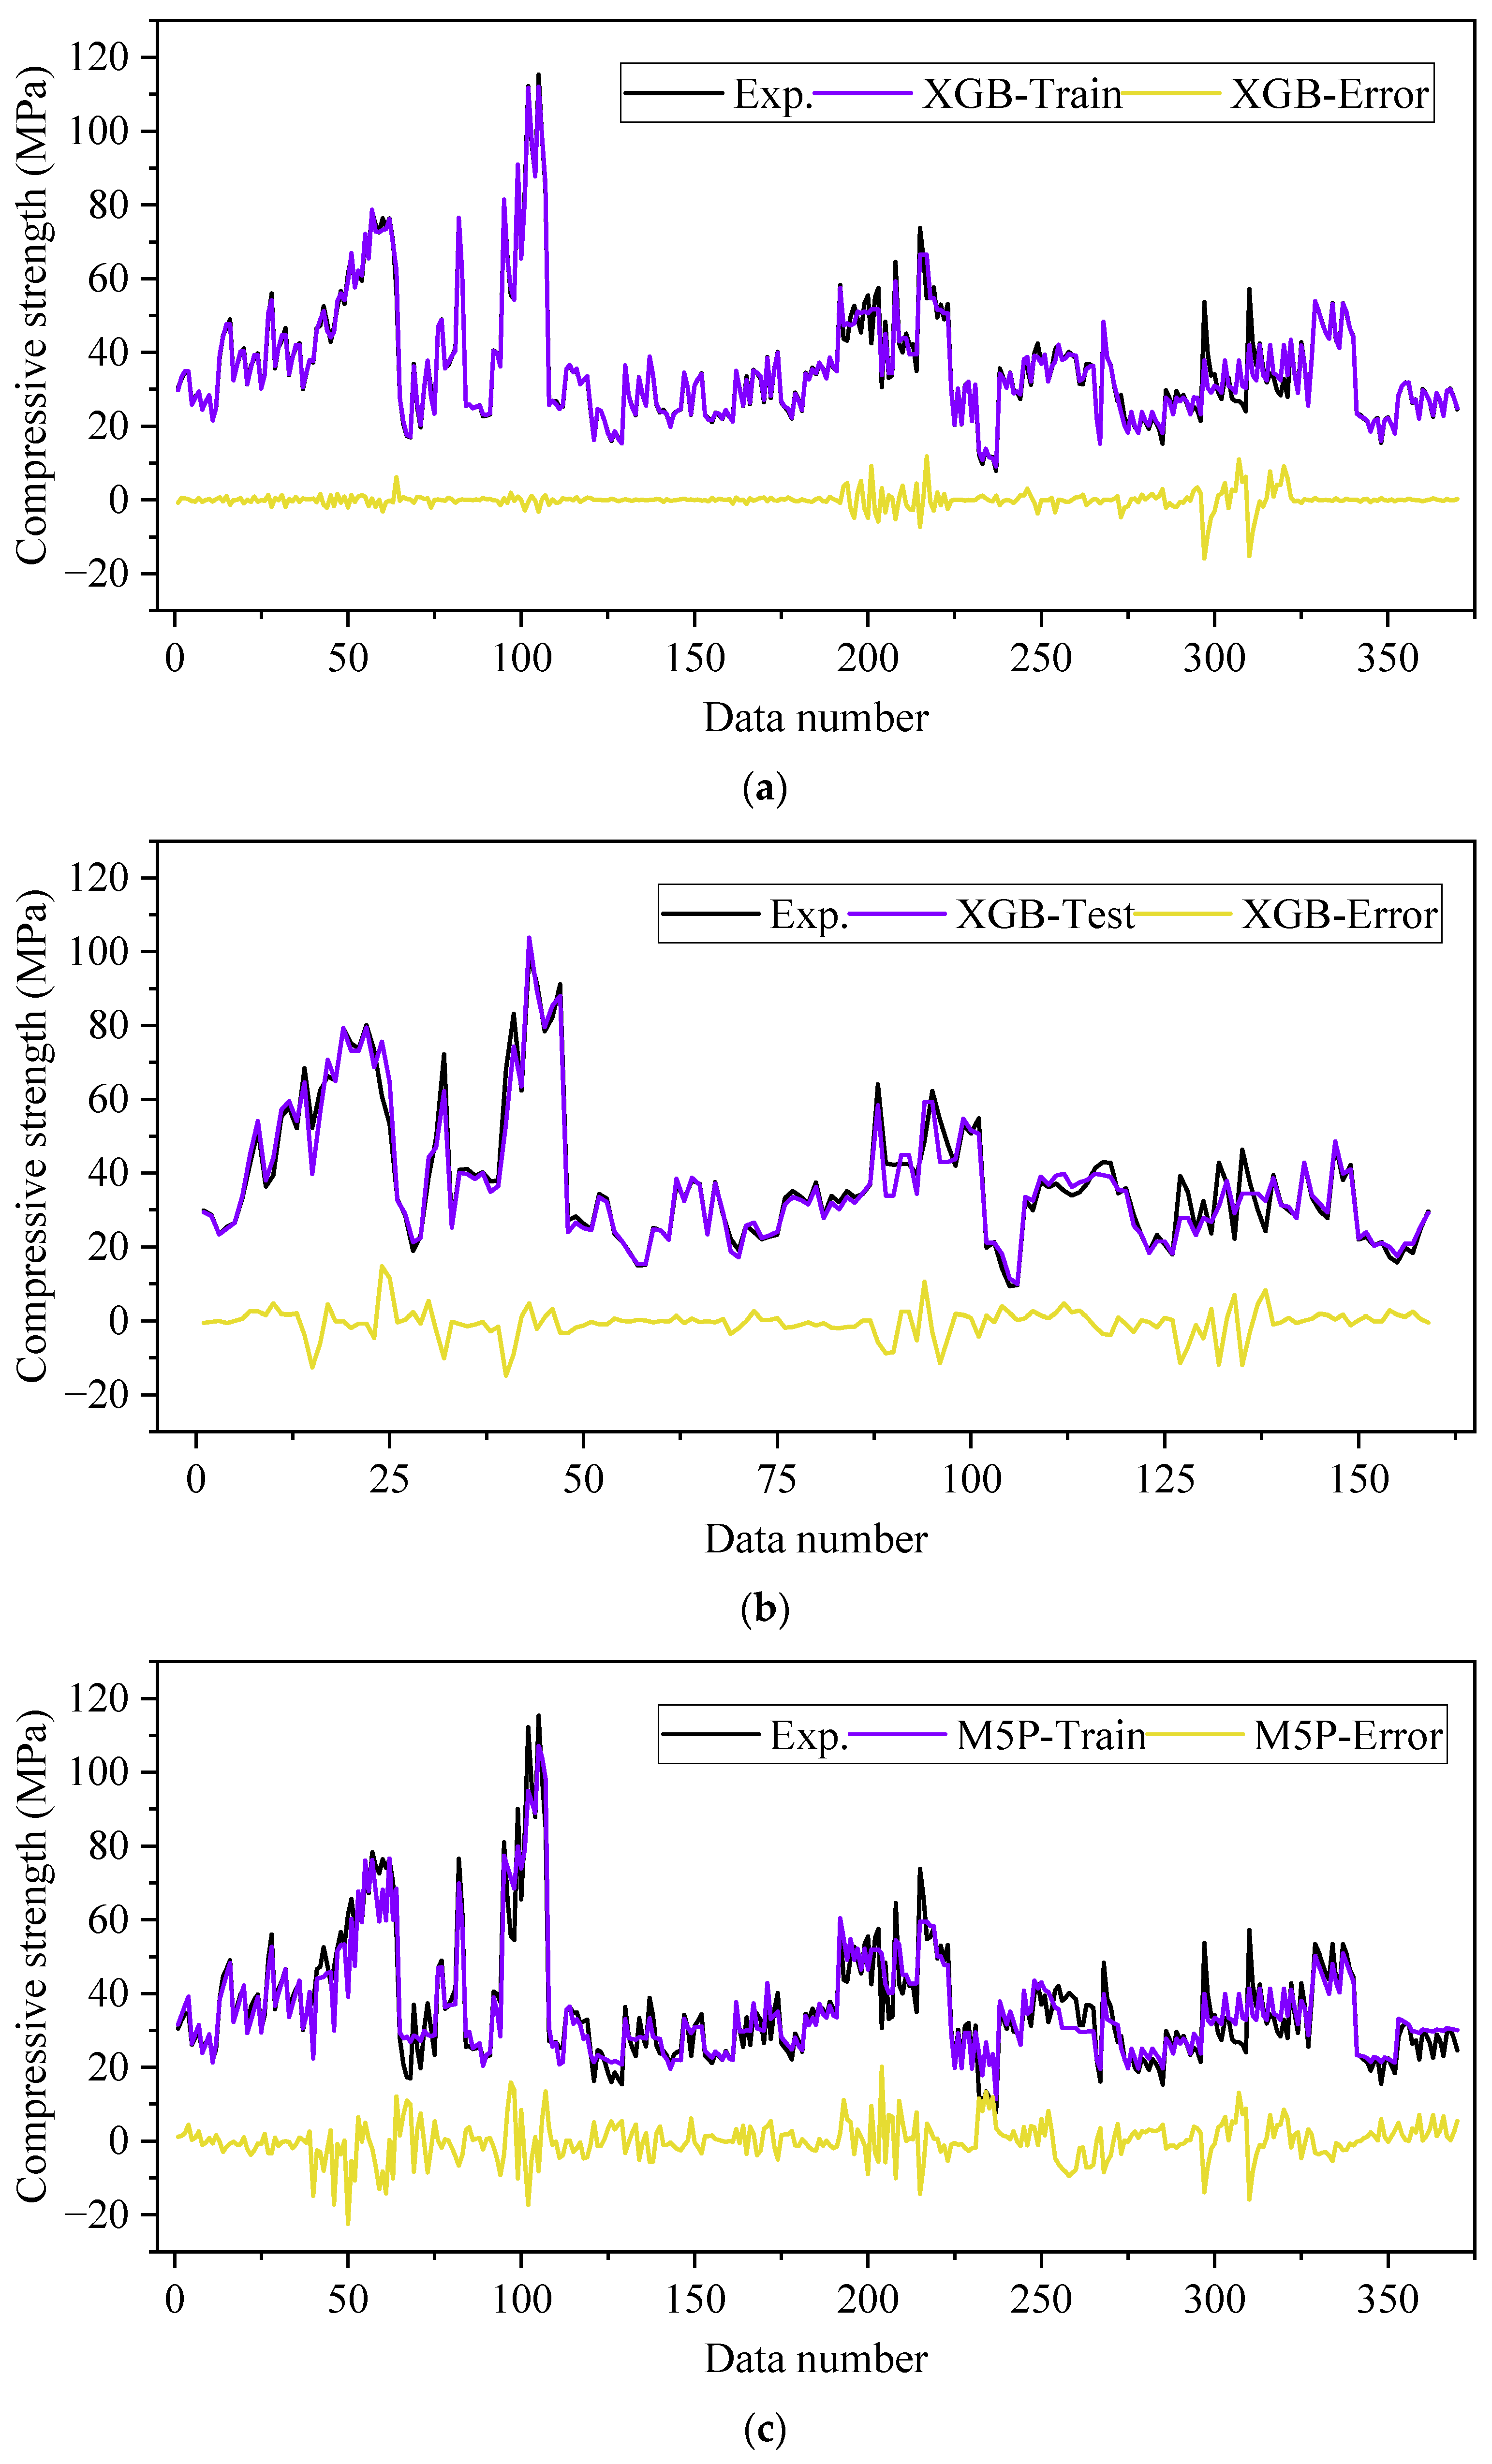
3.2.1. XGB Model
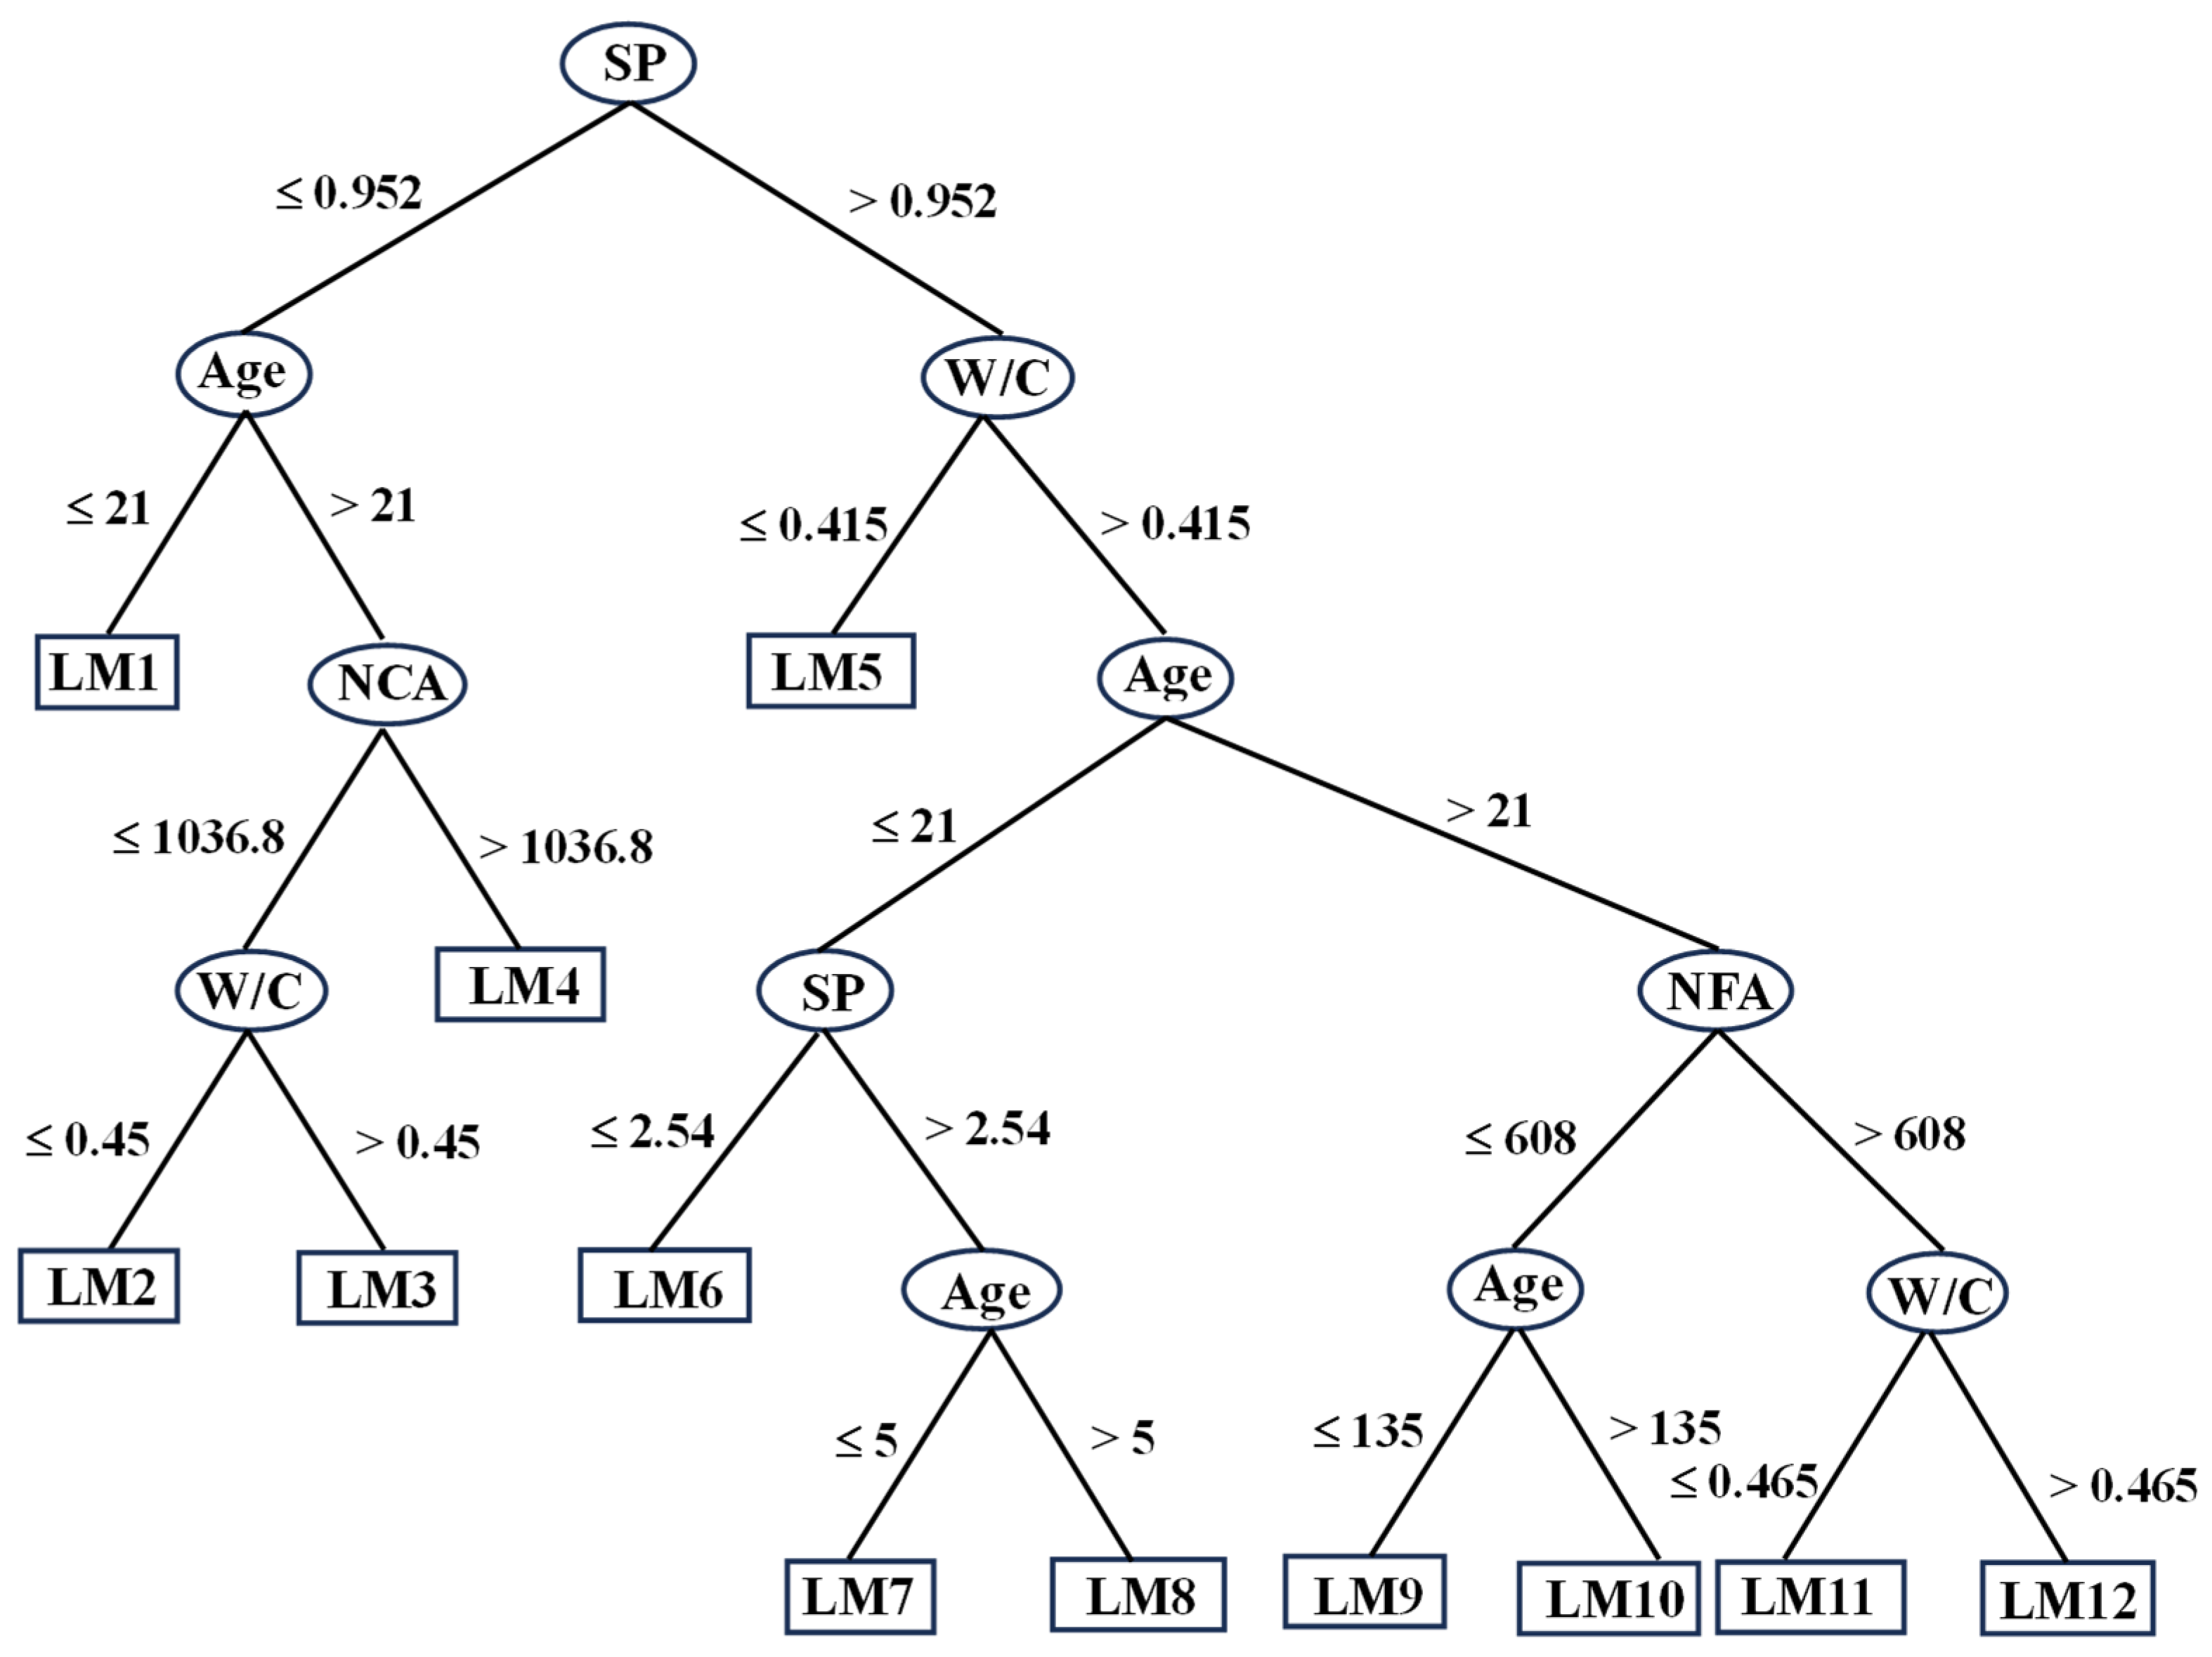
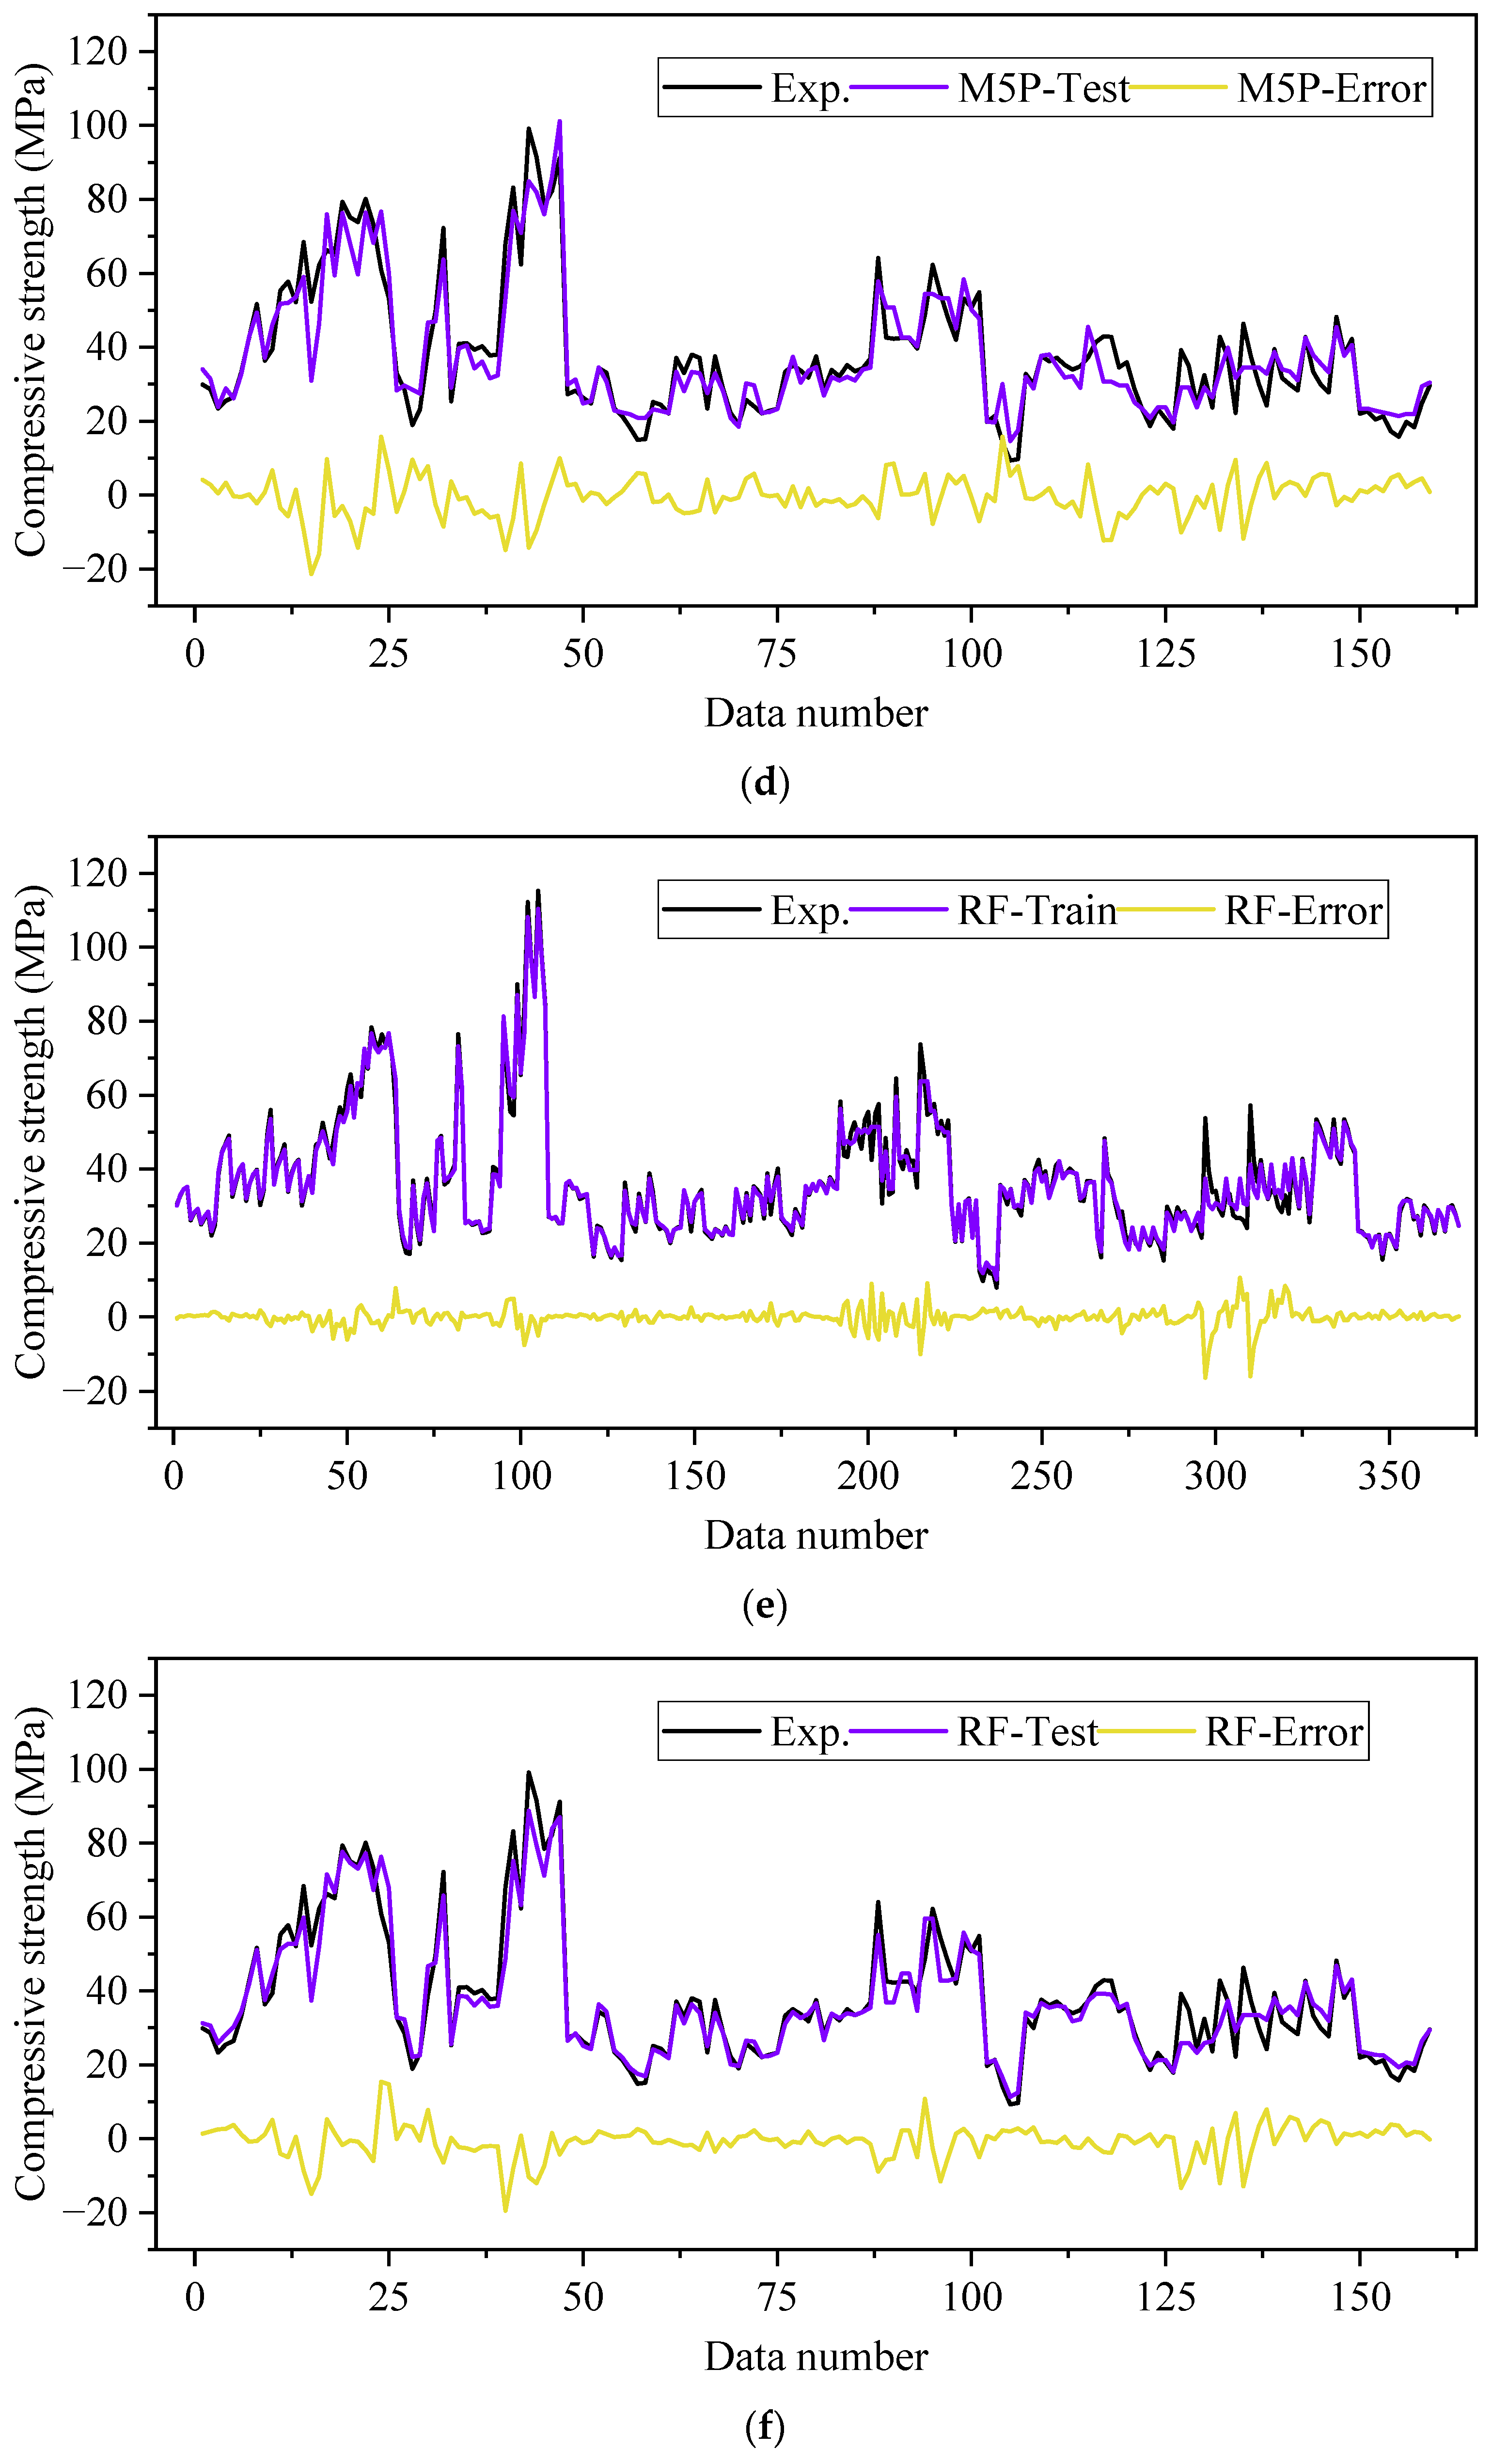
3.2.2. M5P Model
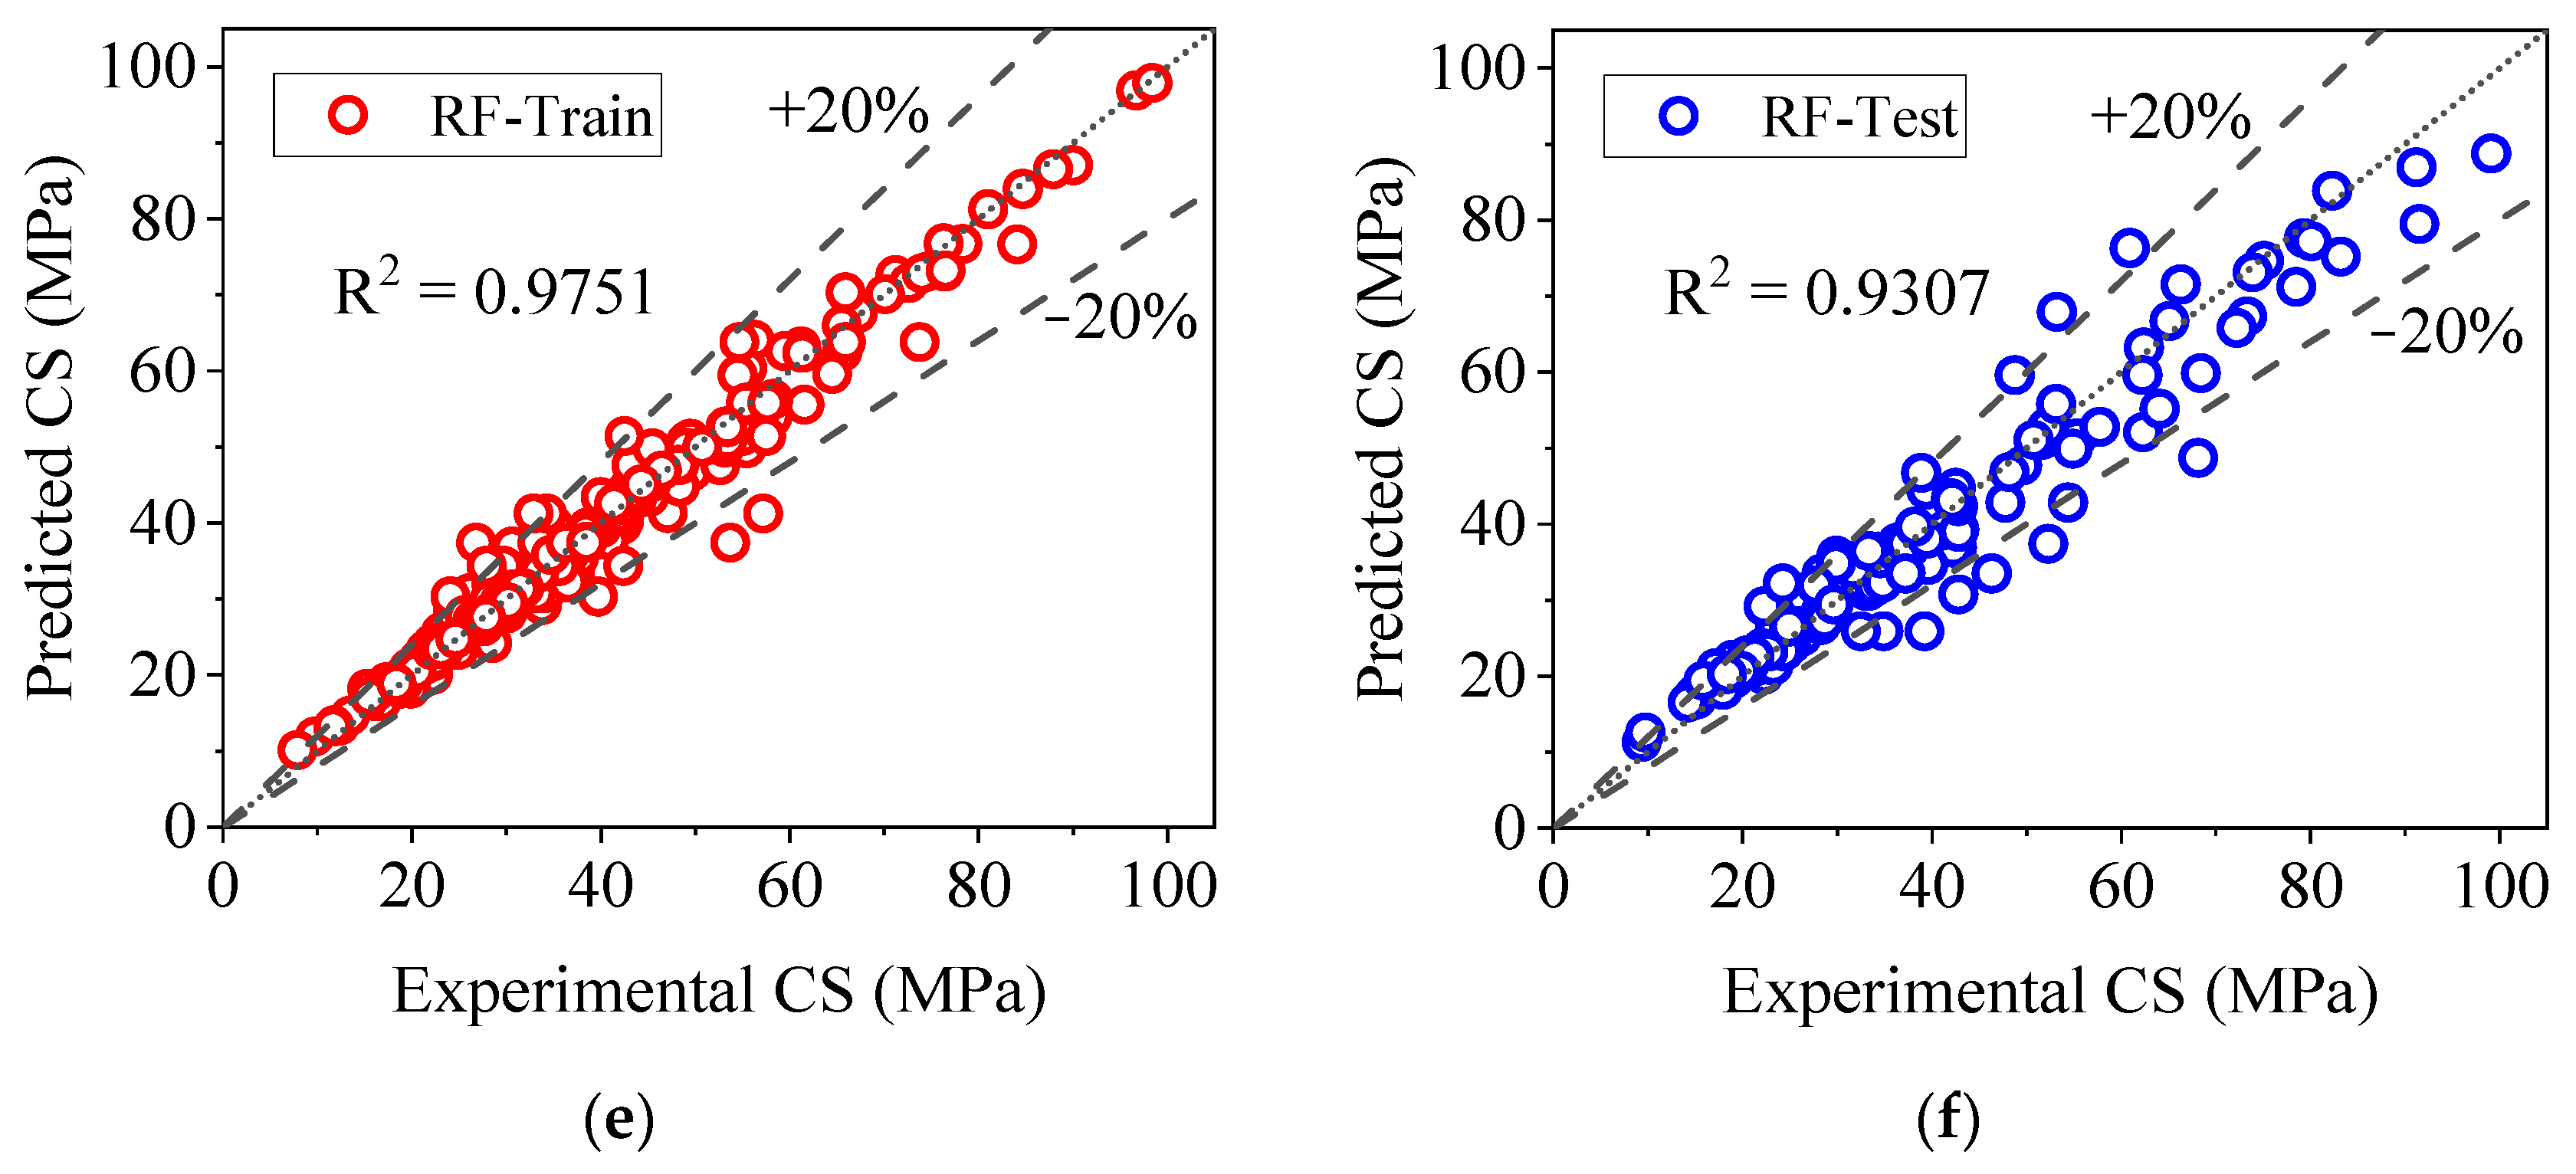
3.2.3. Random Forest Model (RF)
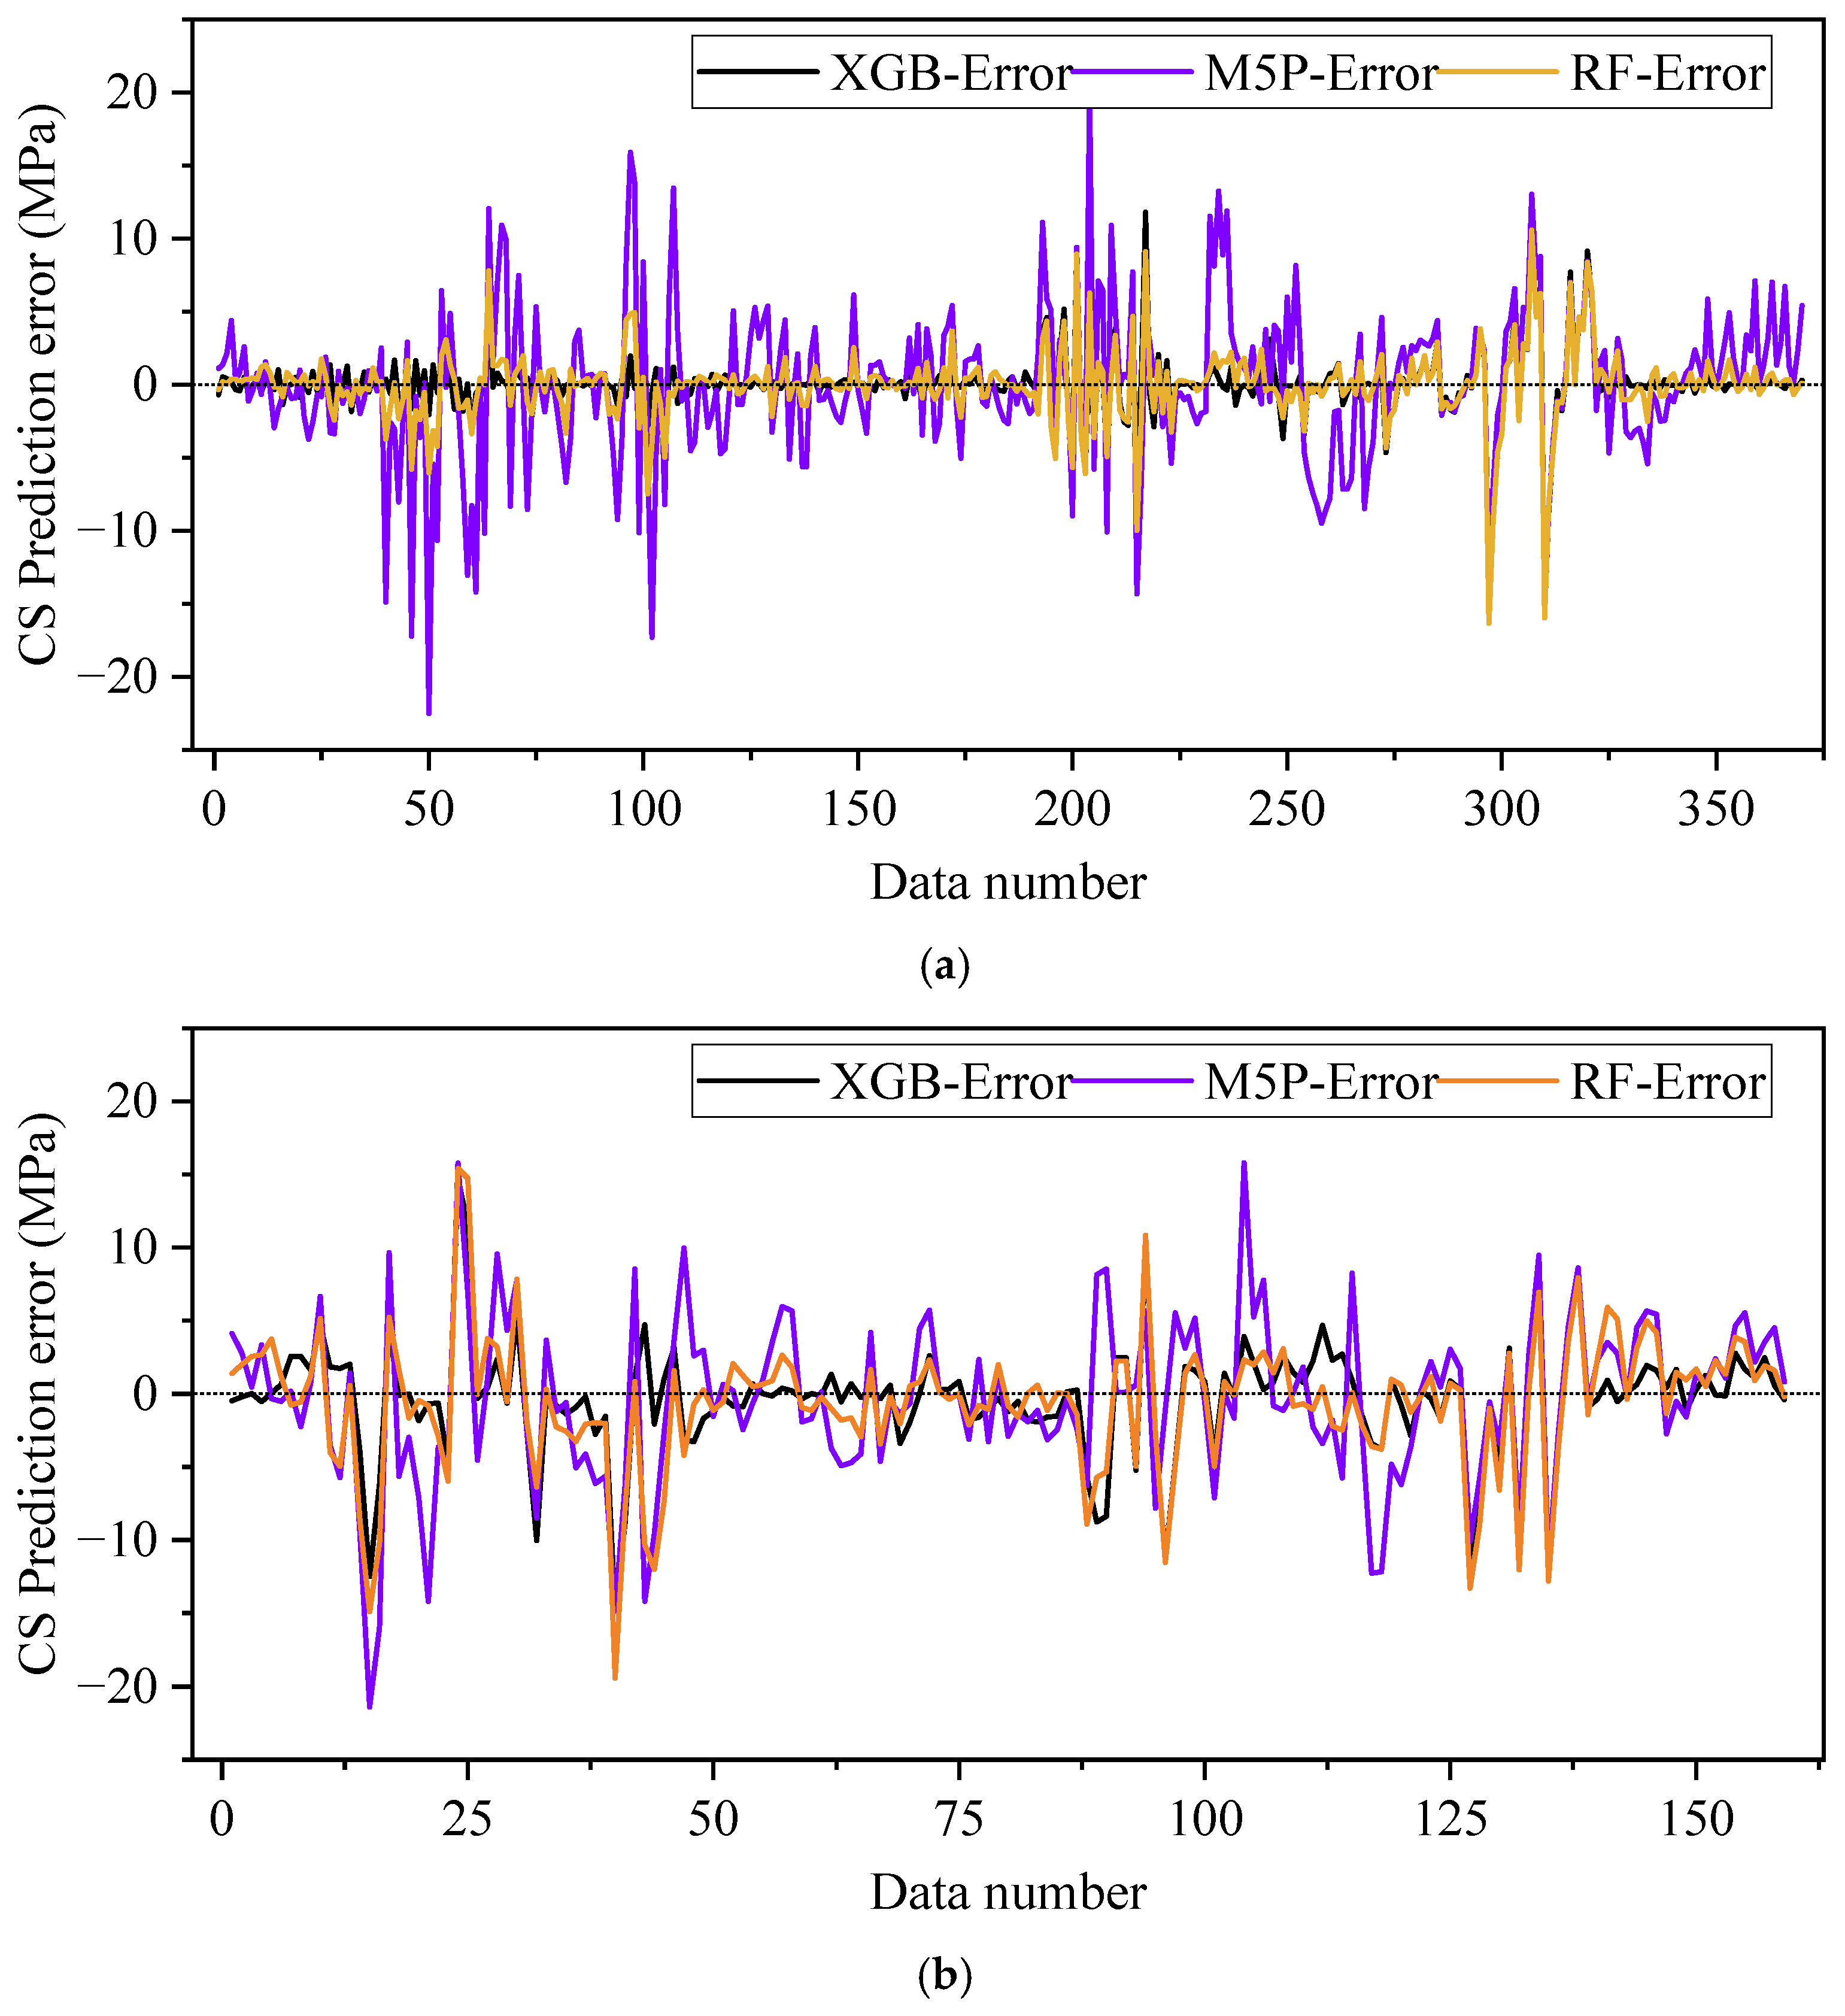
3.3. Comparison Between the Developed Models
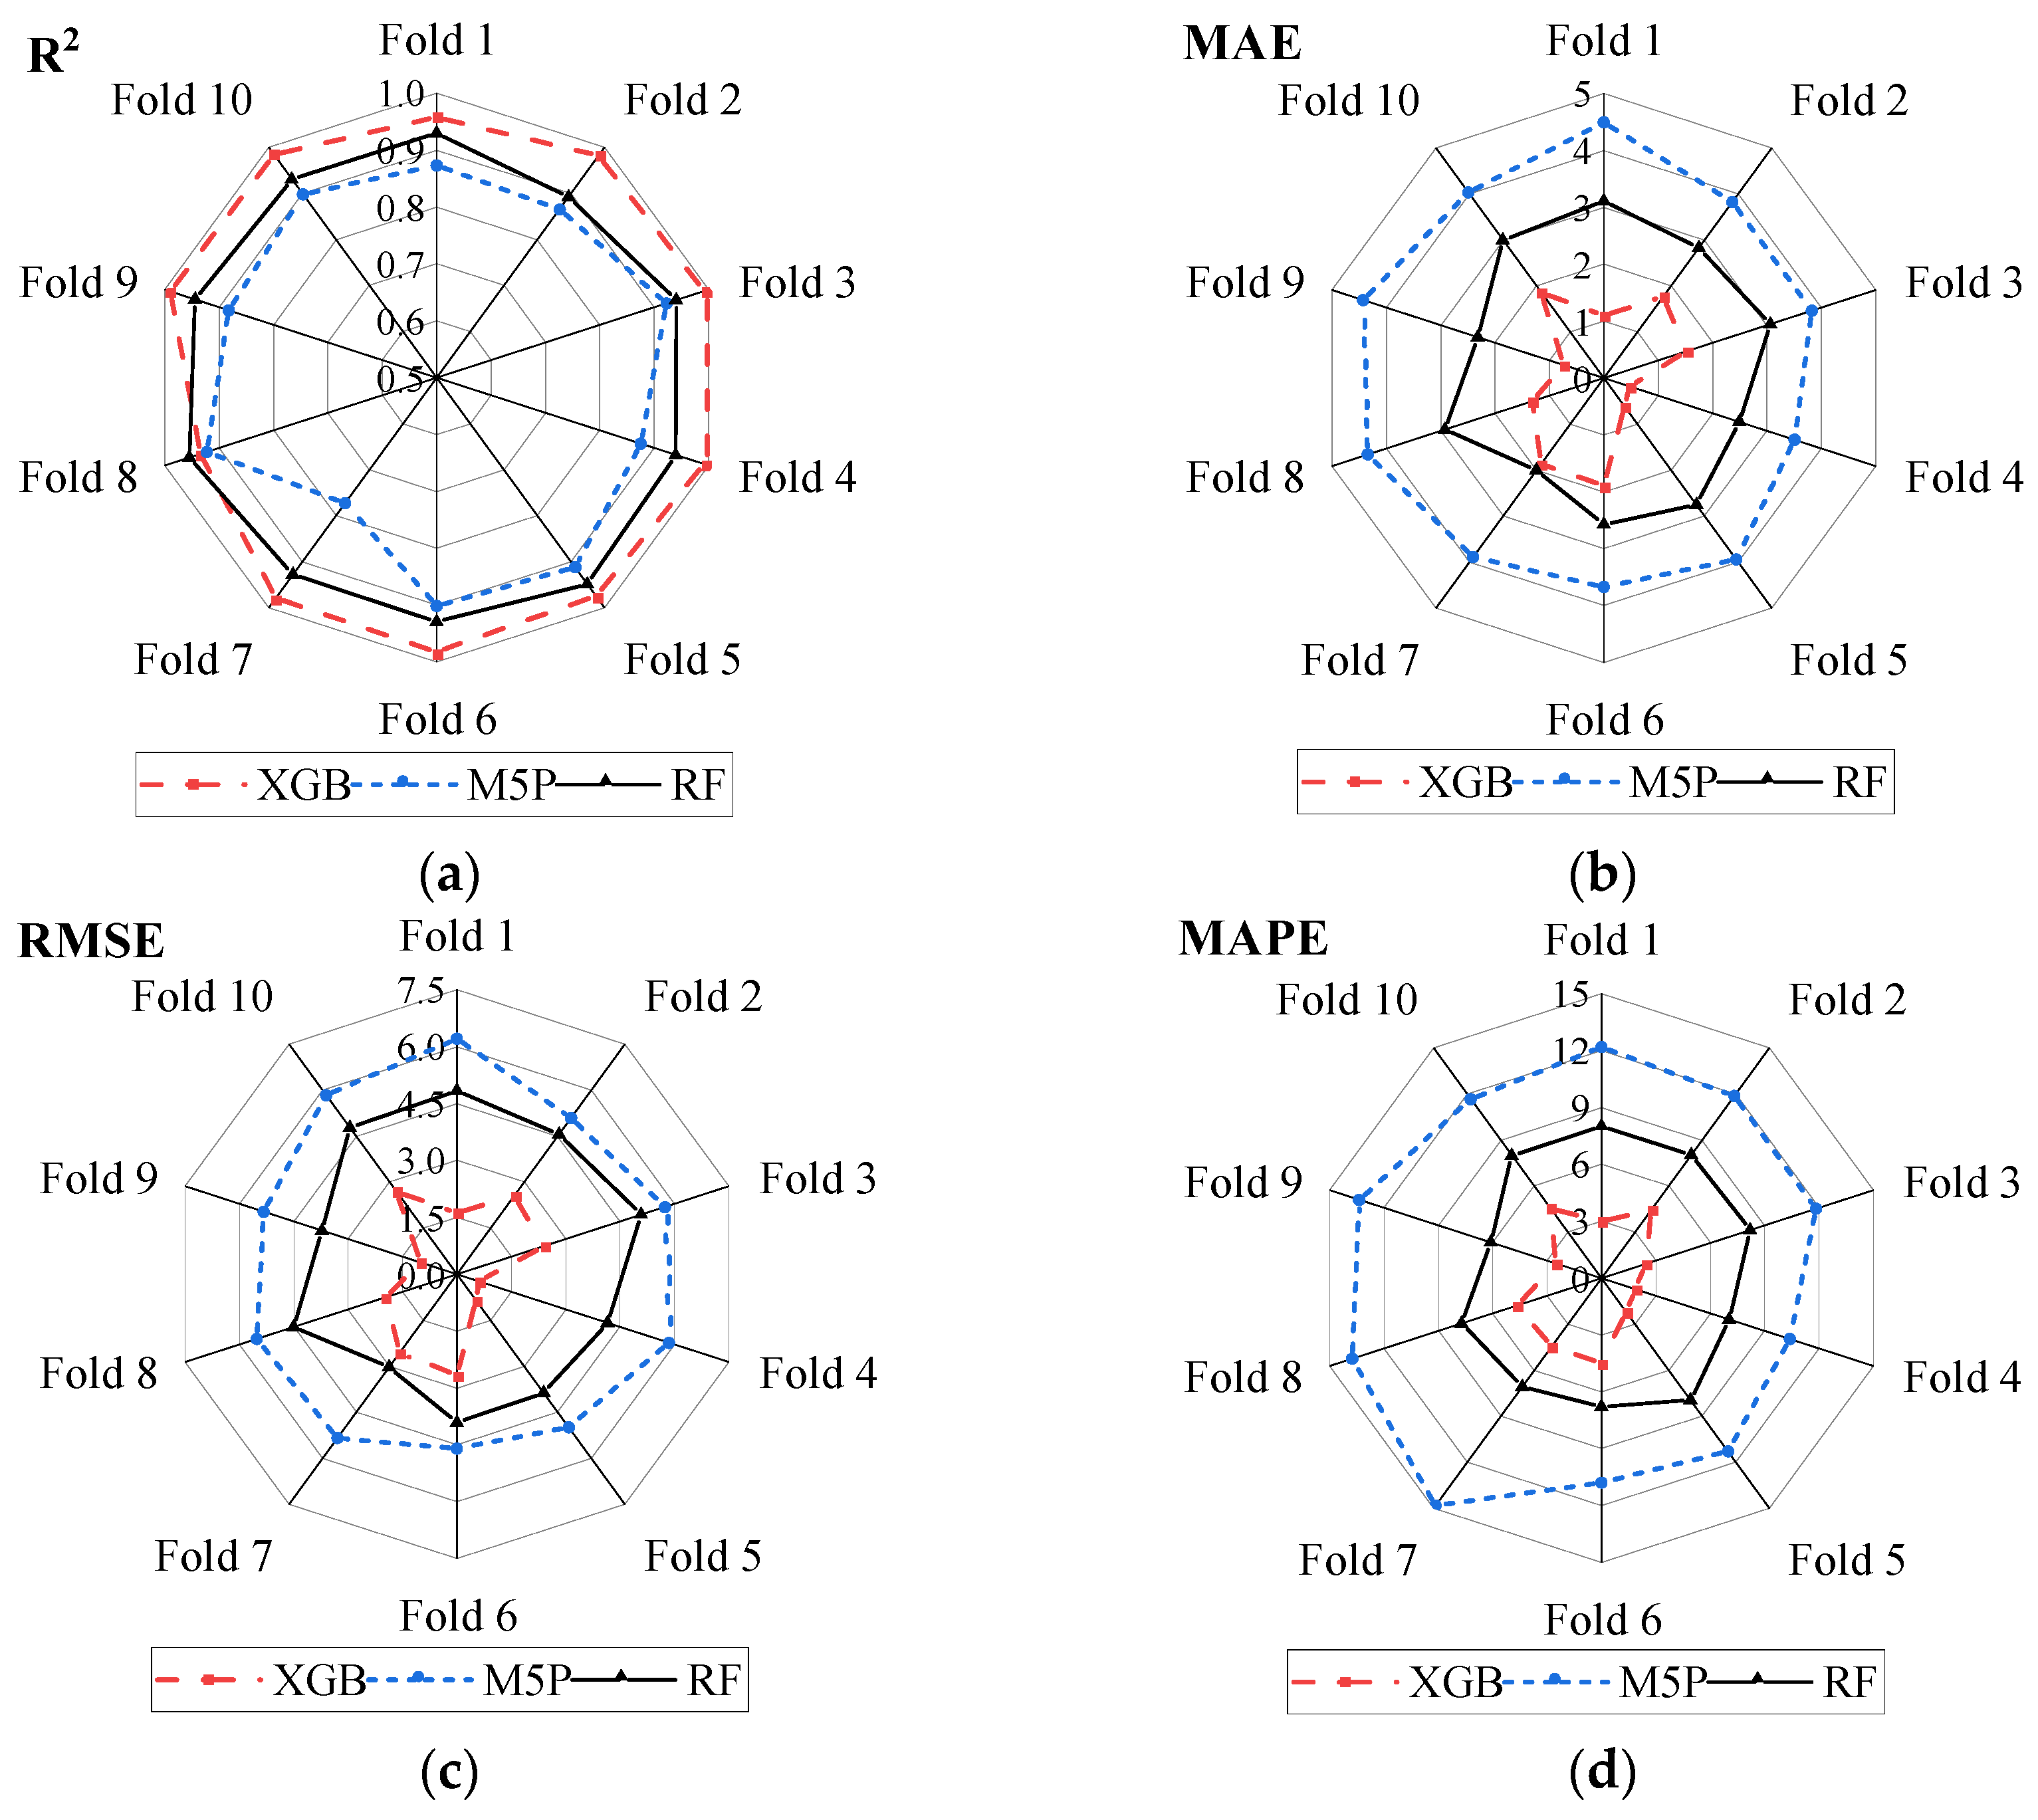
3.4. Cross Validation
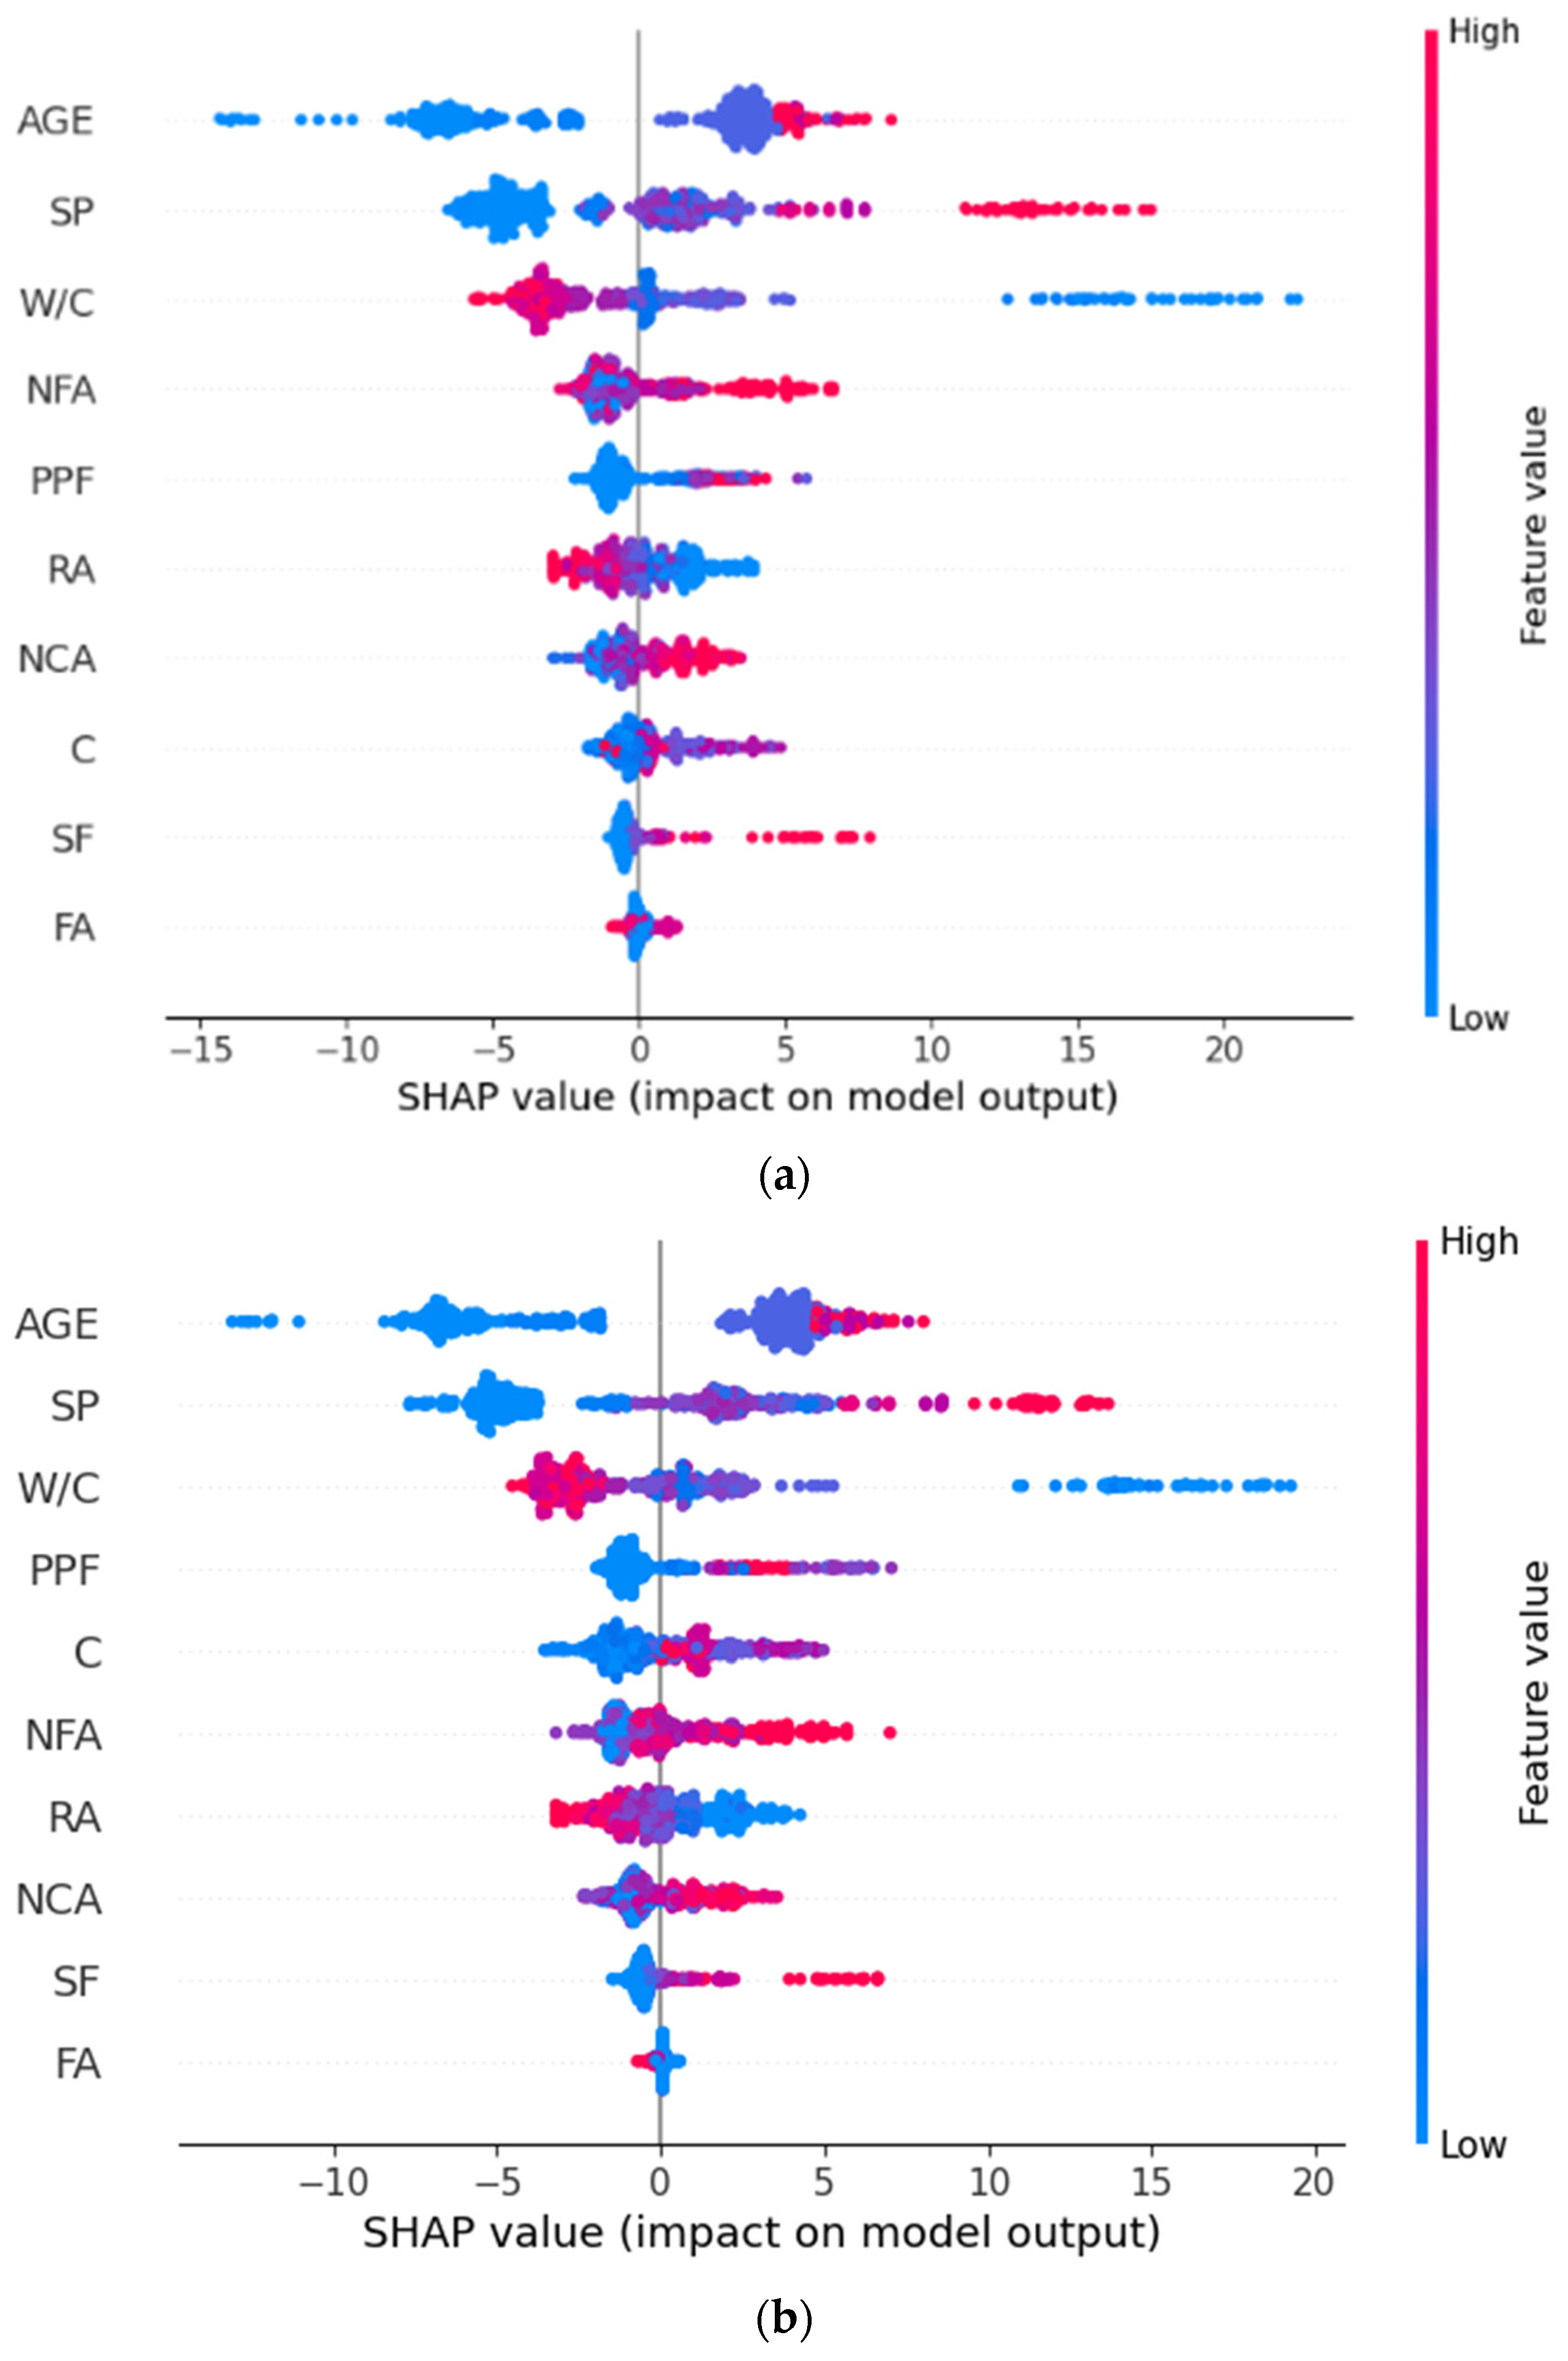
3.5. SHAP Analysis for Feature Importance of the RF and XGB Models
4. Conclusions
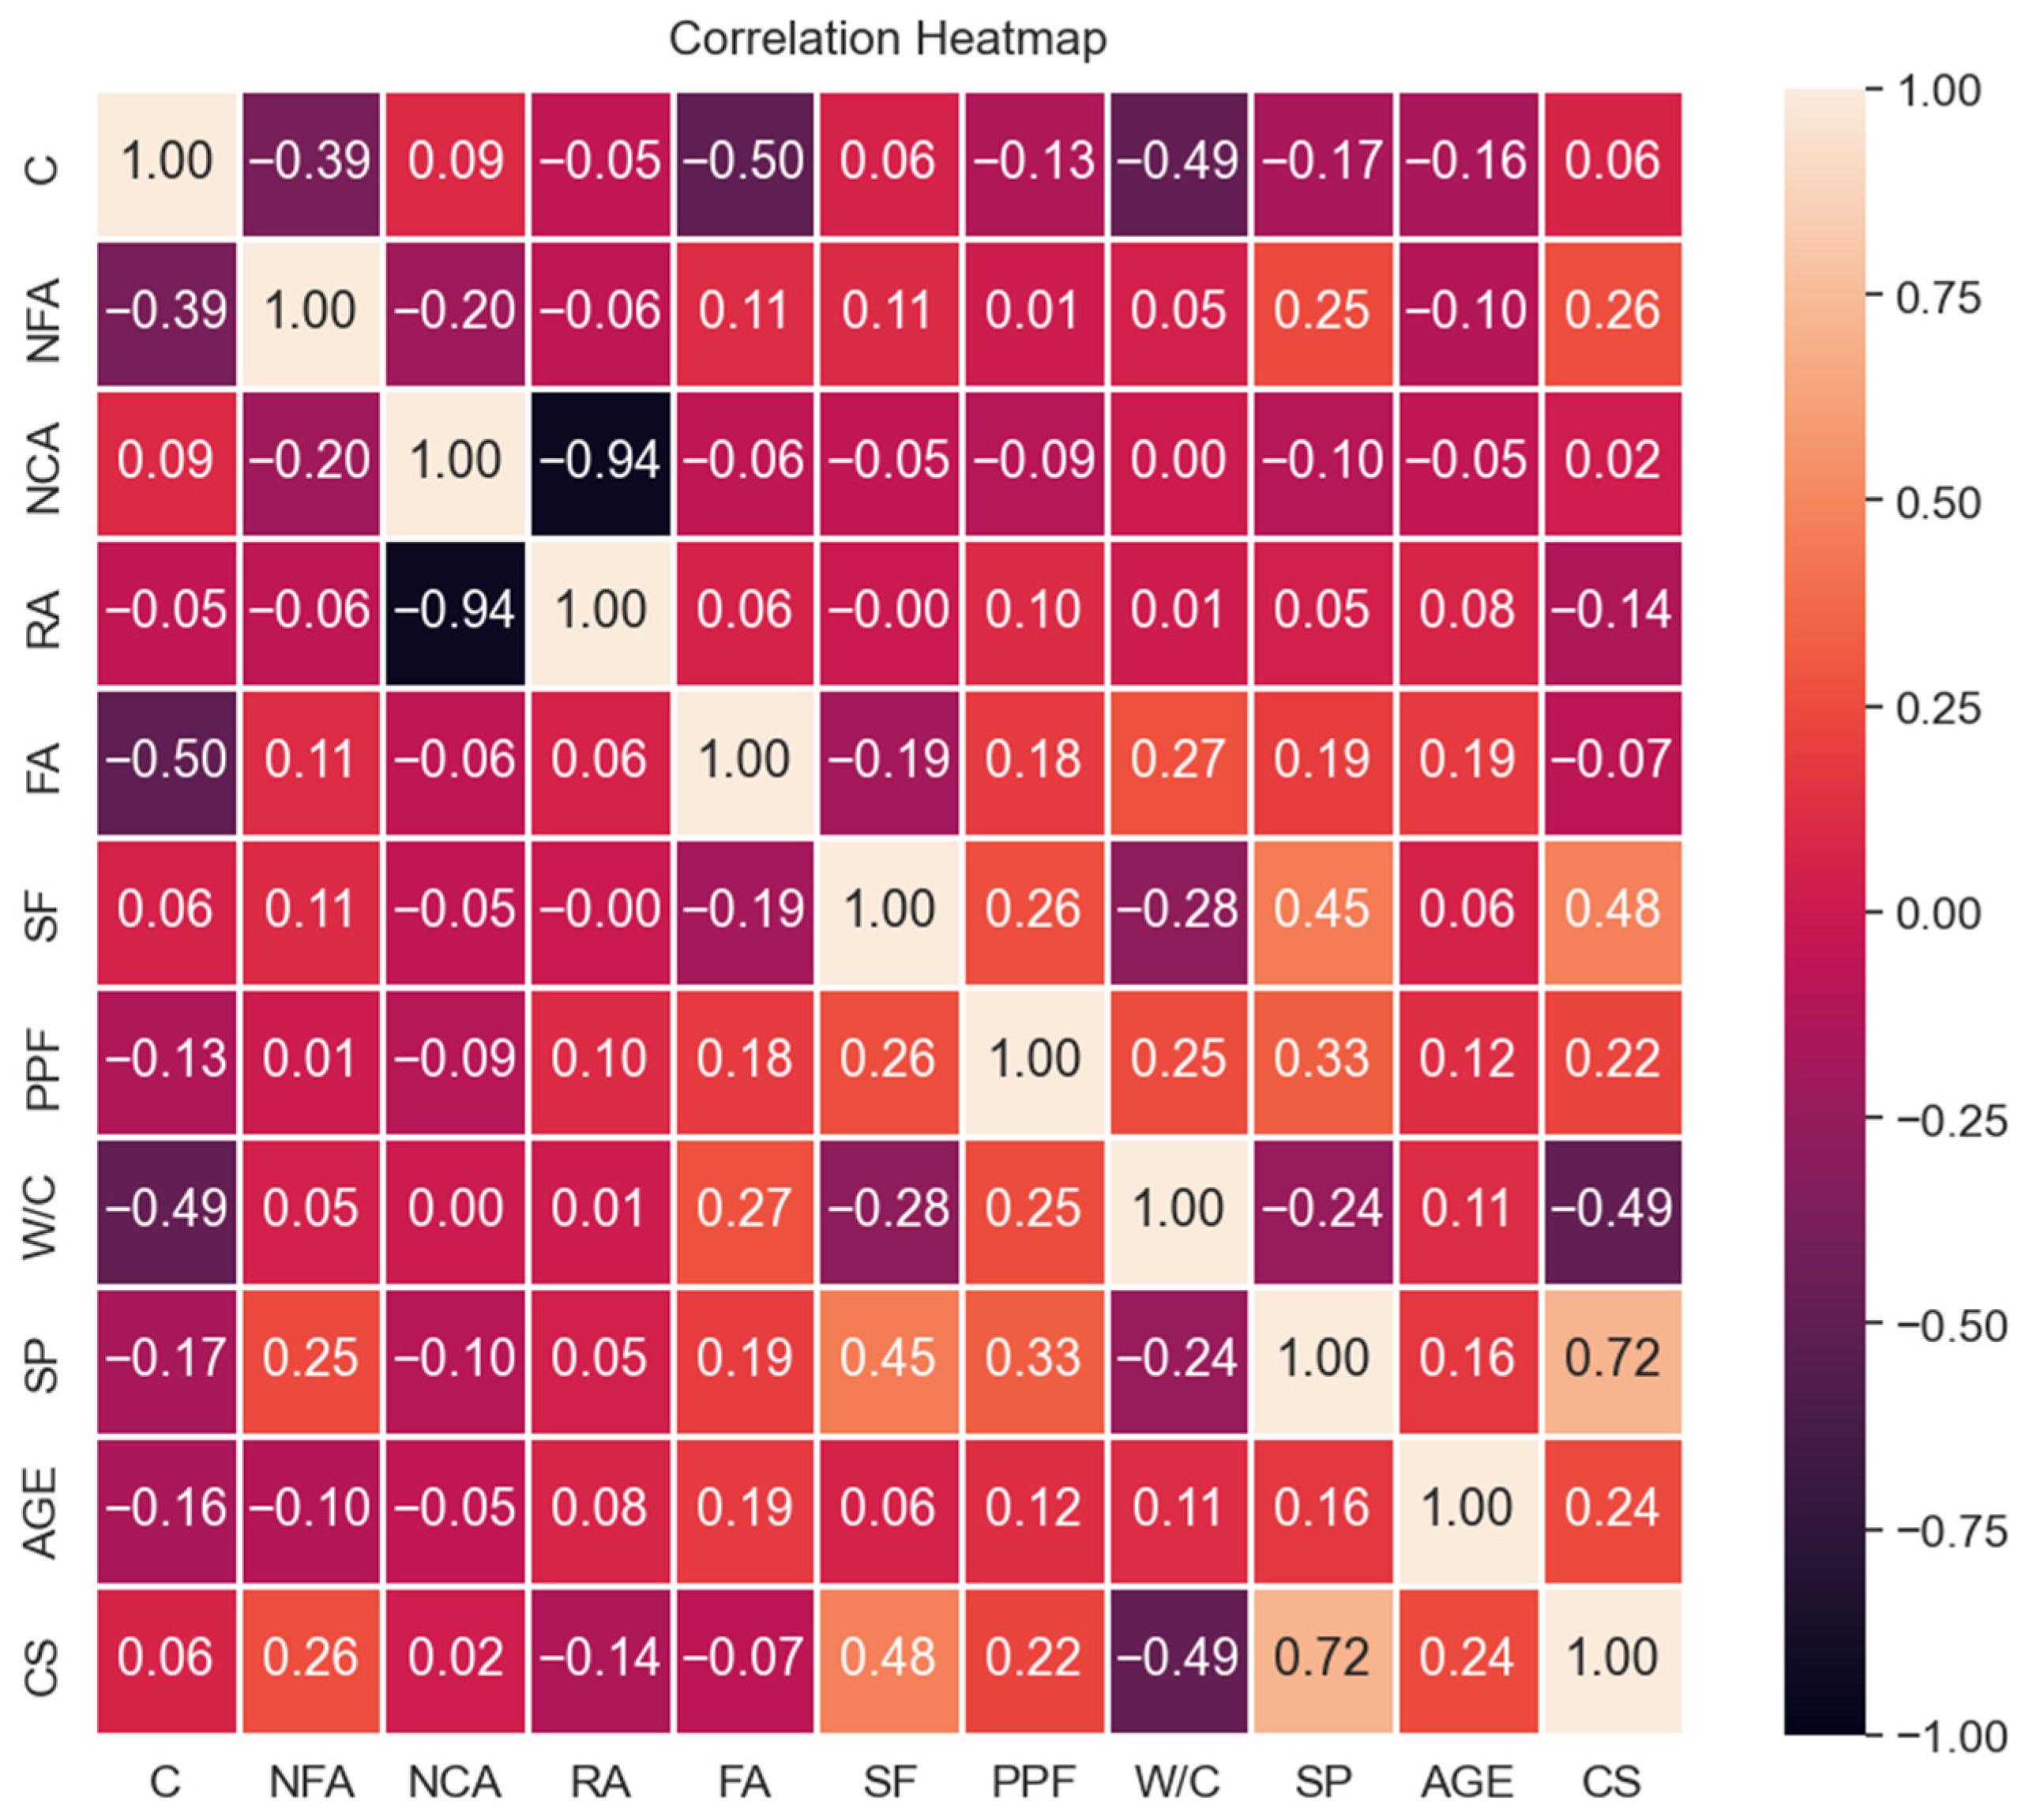
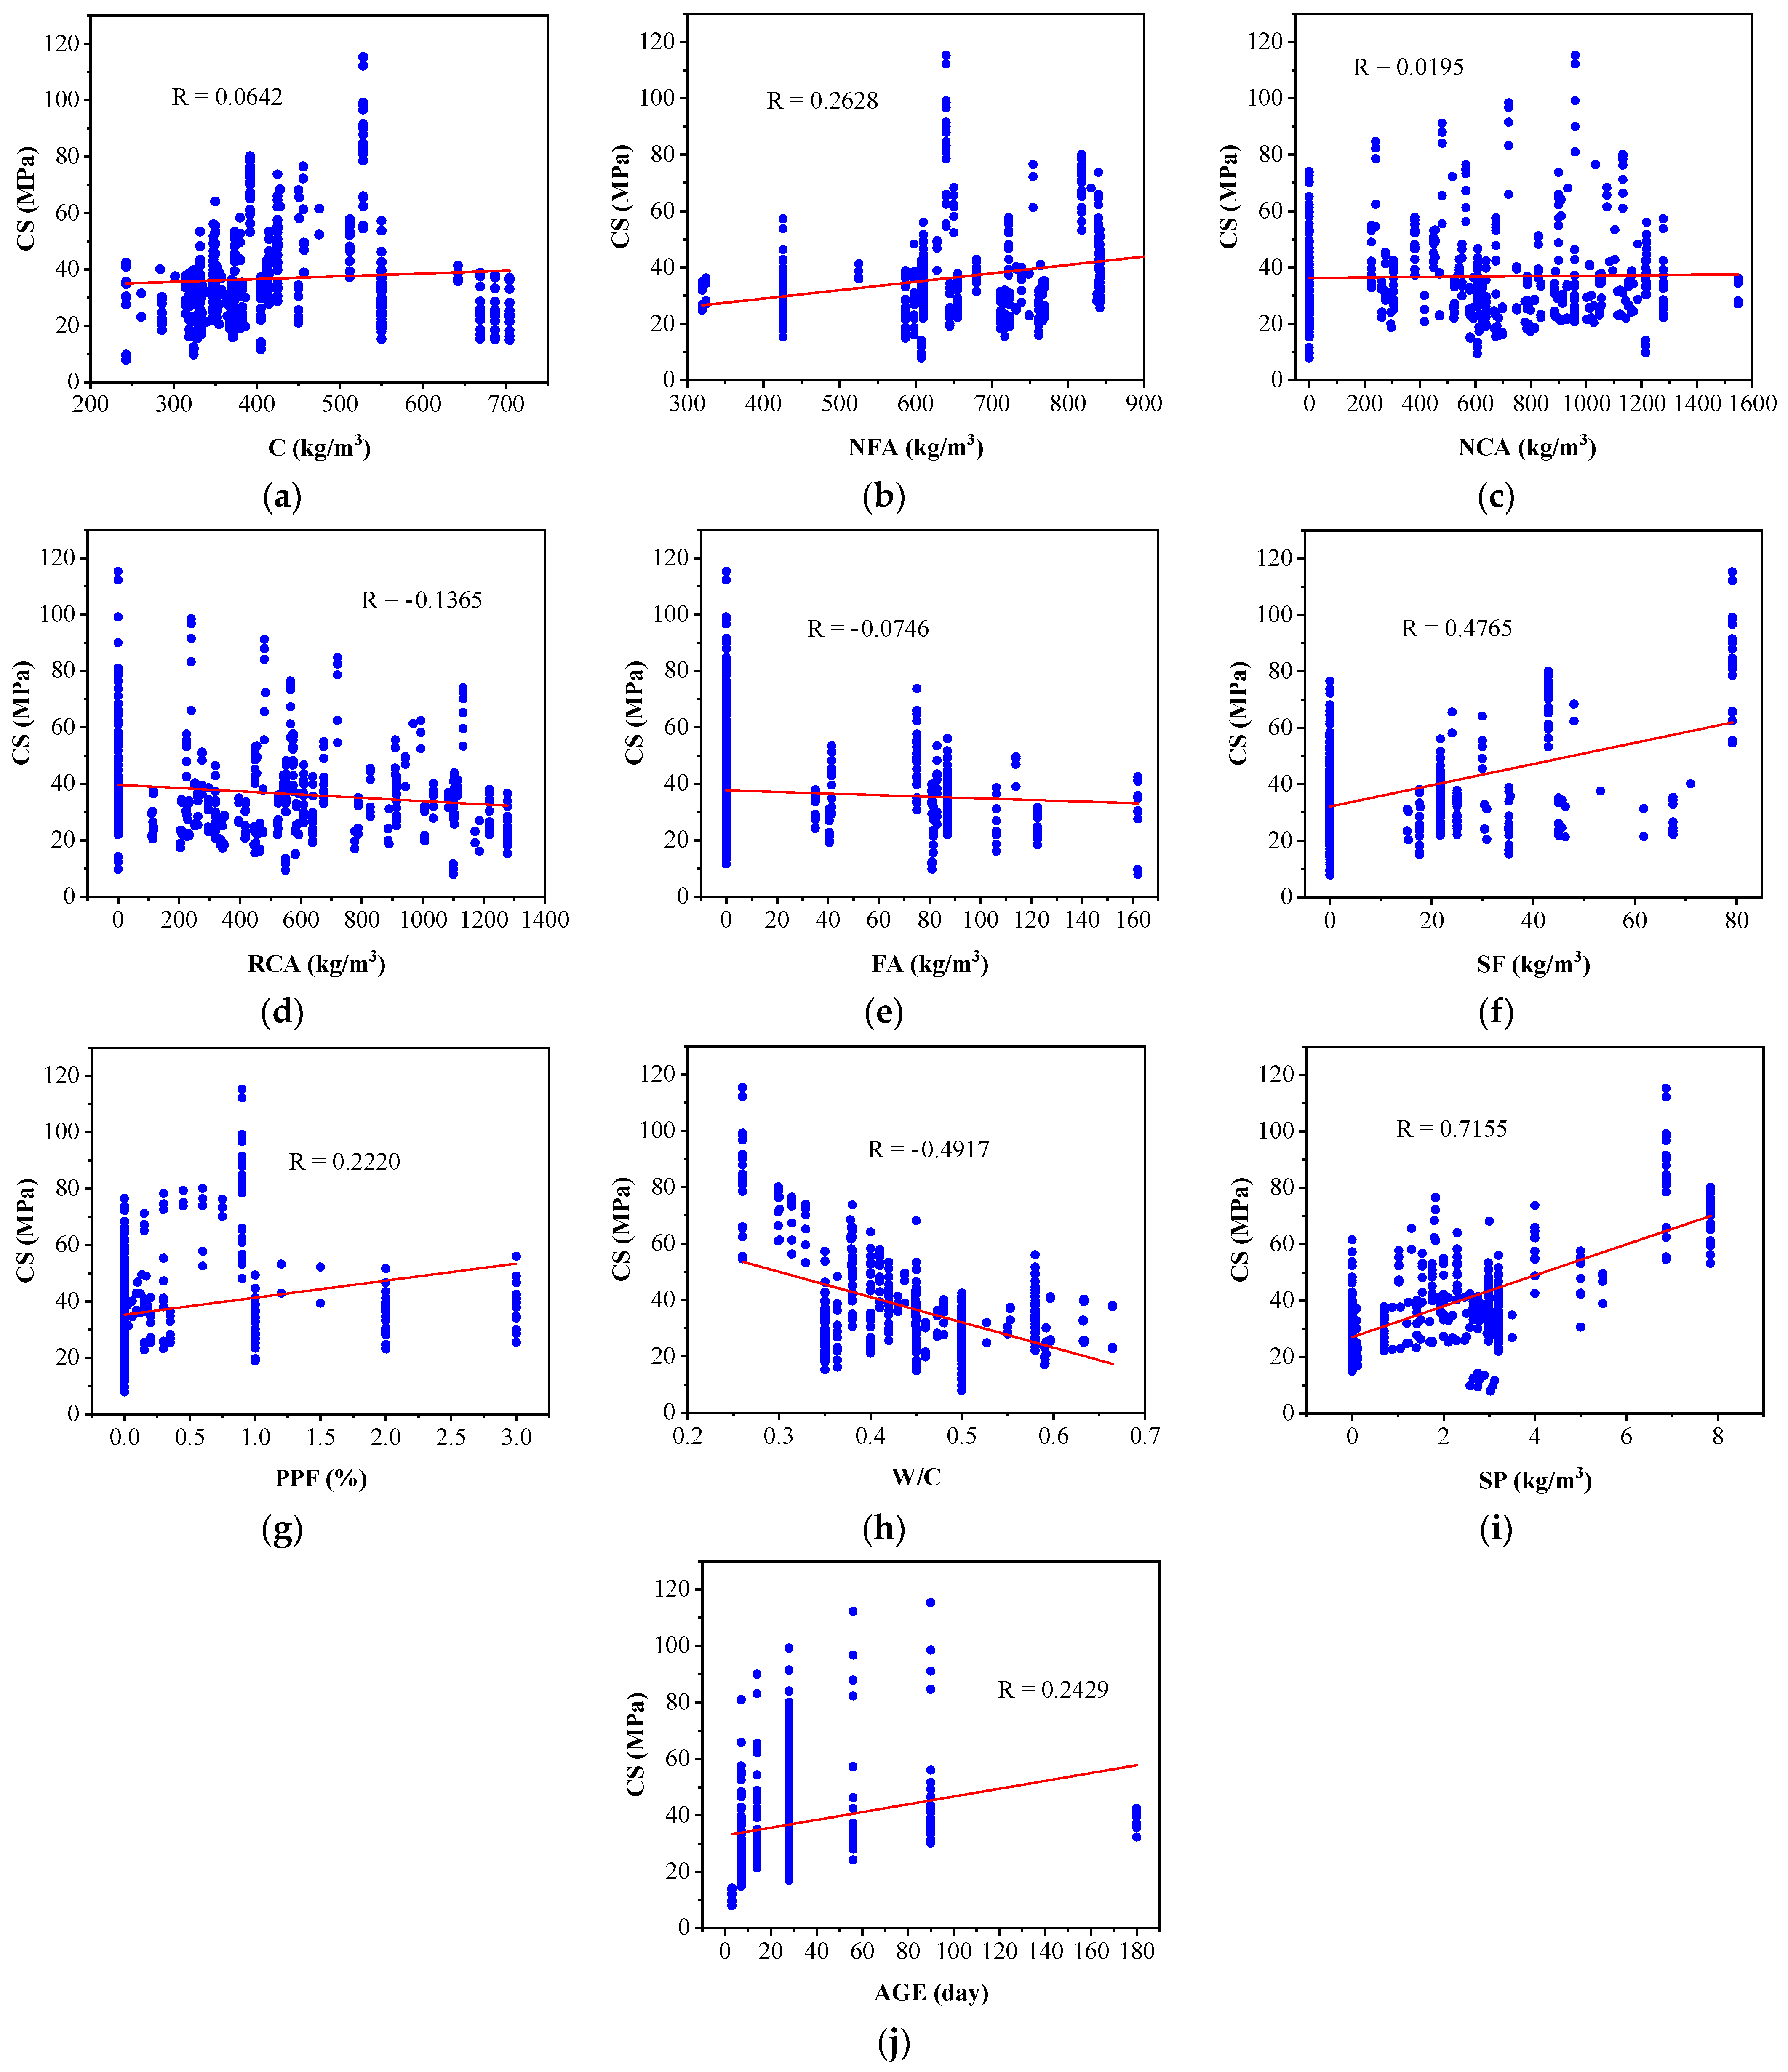
- The correlation coefficient values were illustrated as a heat map, demonstrating the relationships between the input and output parameters. The input parameter SP significantly influenced CS, with a value of 0.7155, followed by SF, which had a value of 0.48. The W/C input parameter had a large negative impact on CS, with a value of −0.4917, followed by RA, which had a value of −0.1365. PPF exhibited a positive correlation with CS, indicated by an R value of 0.2220.
- Based on the optimization of the CS of RAC containing FA, SF, and PPF, the optimal CS was found to be 115 MPa at a 100% volume of RA consisting of coarse aggregate, 1.13% PPF by volume of concrete, 7.90% FA, and 5.30% SF as partial replacements of binders by weight.
- The XGB model outperformed the RF and M5P models regarding robustness and accuracy in the 10-fold cross-validation.
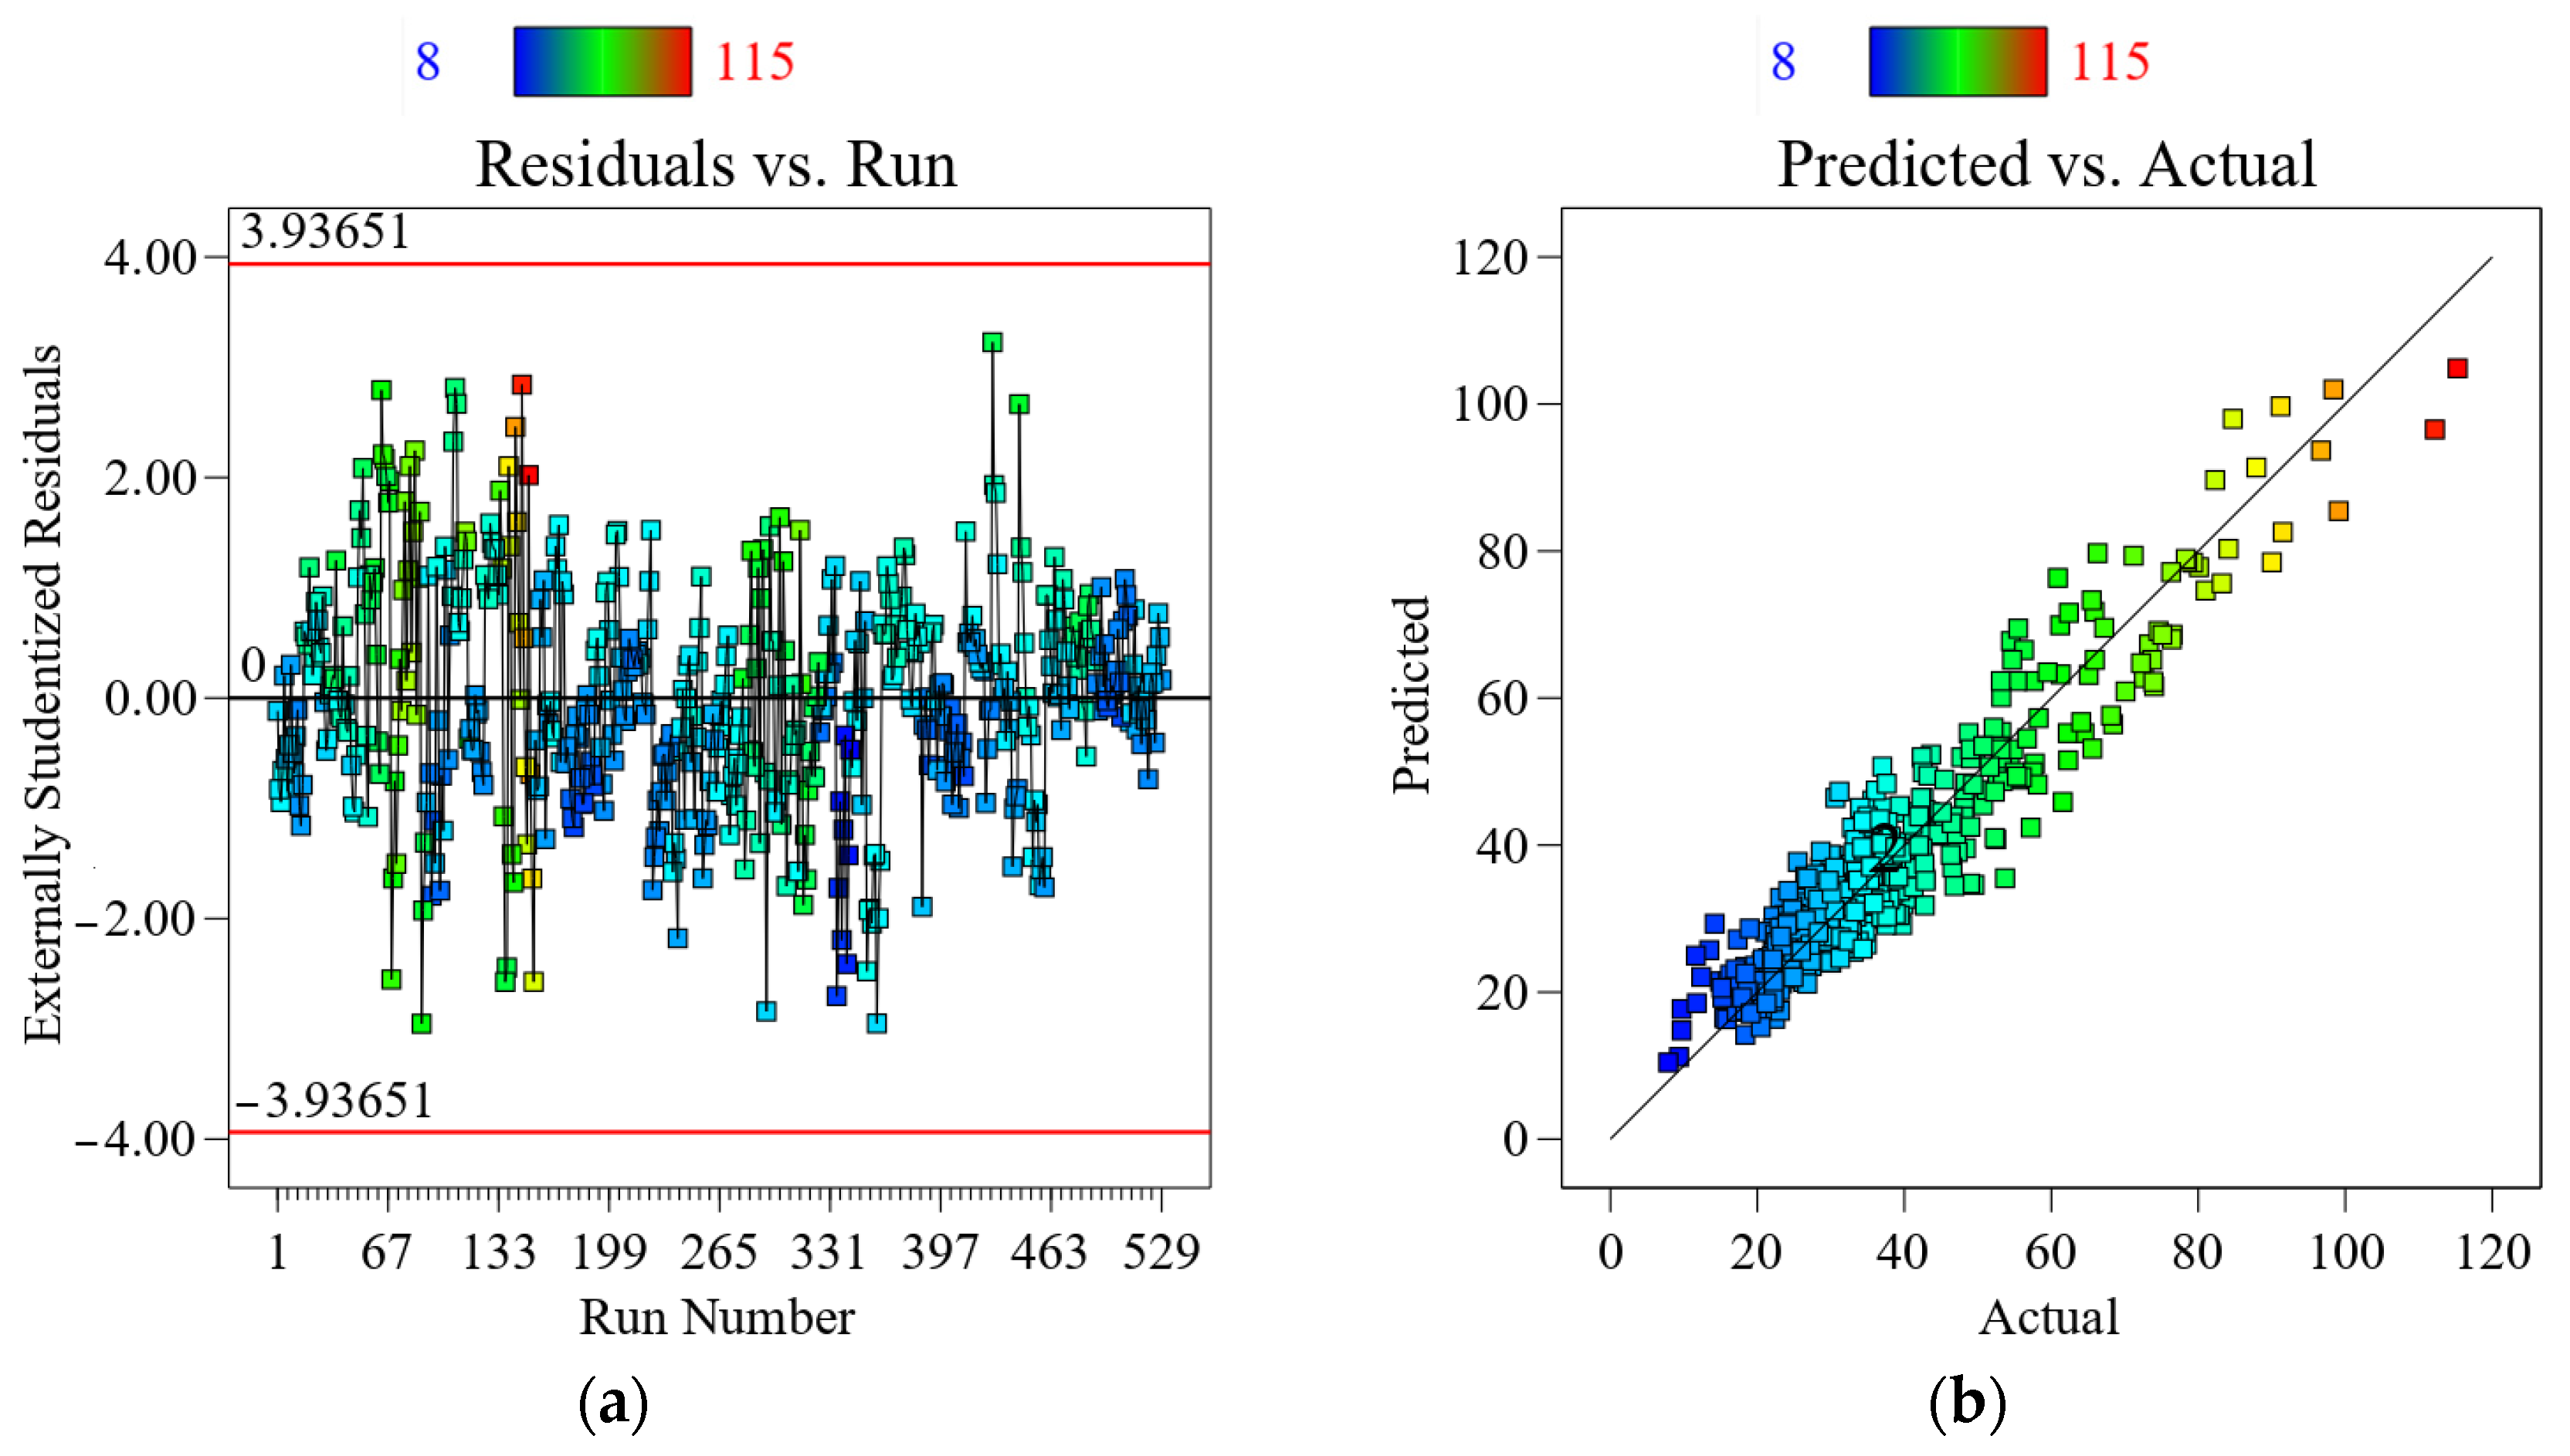
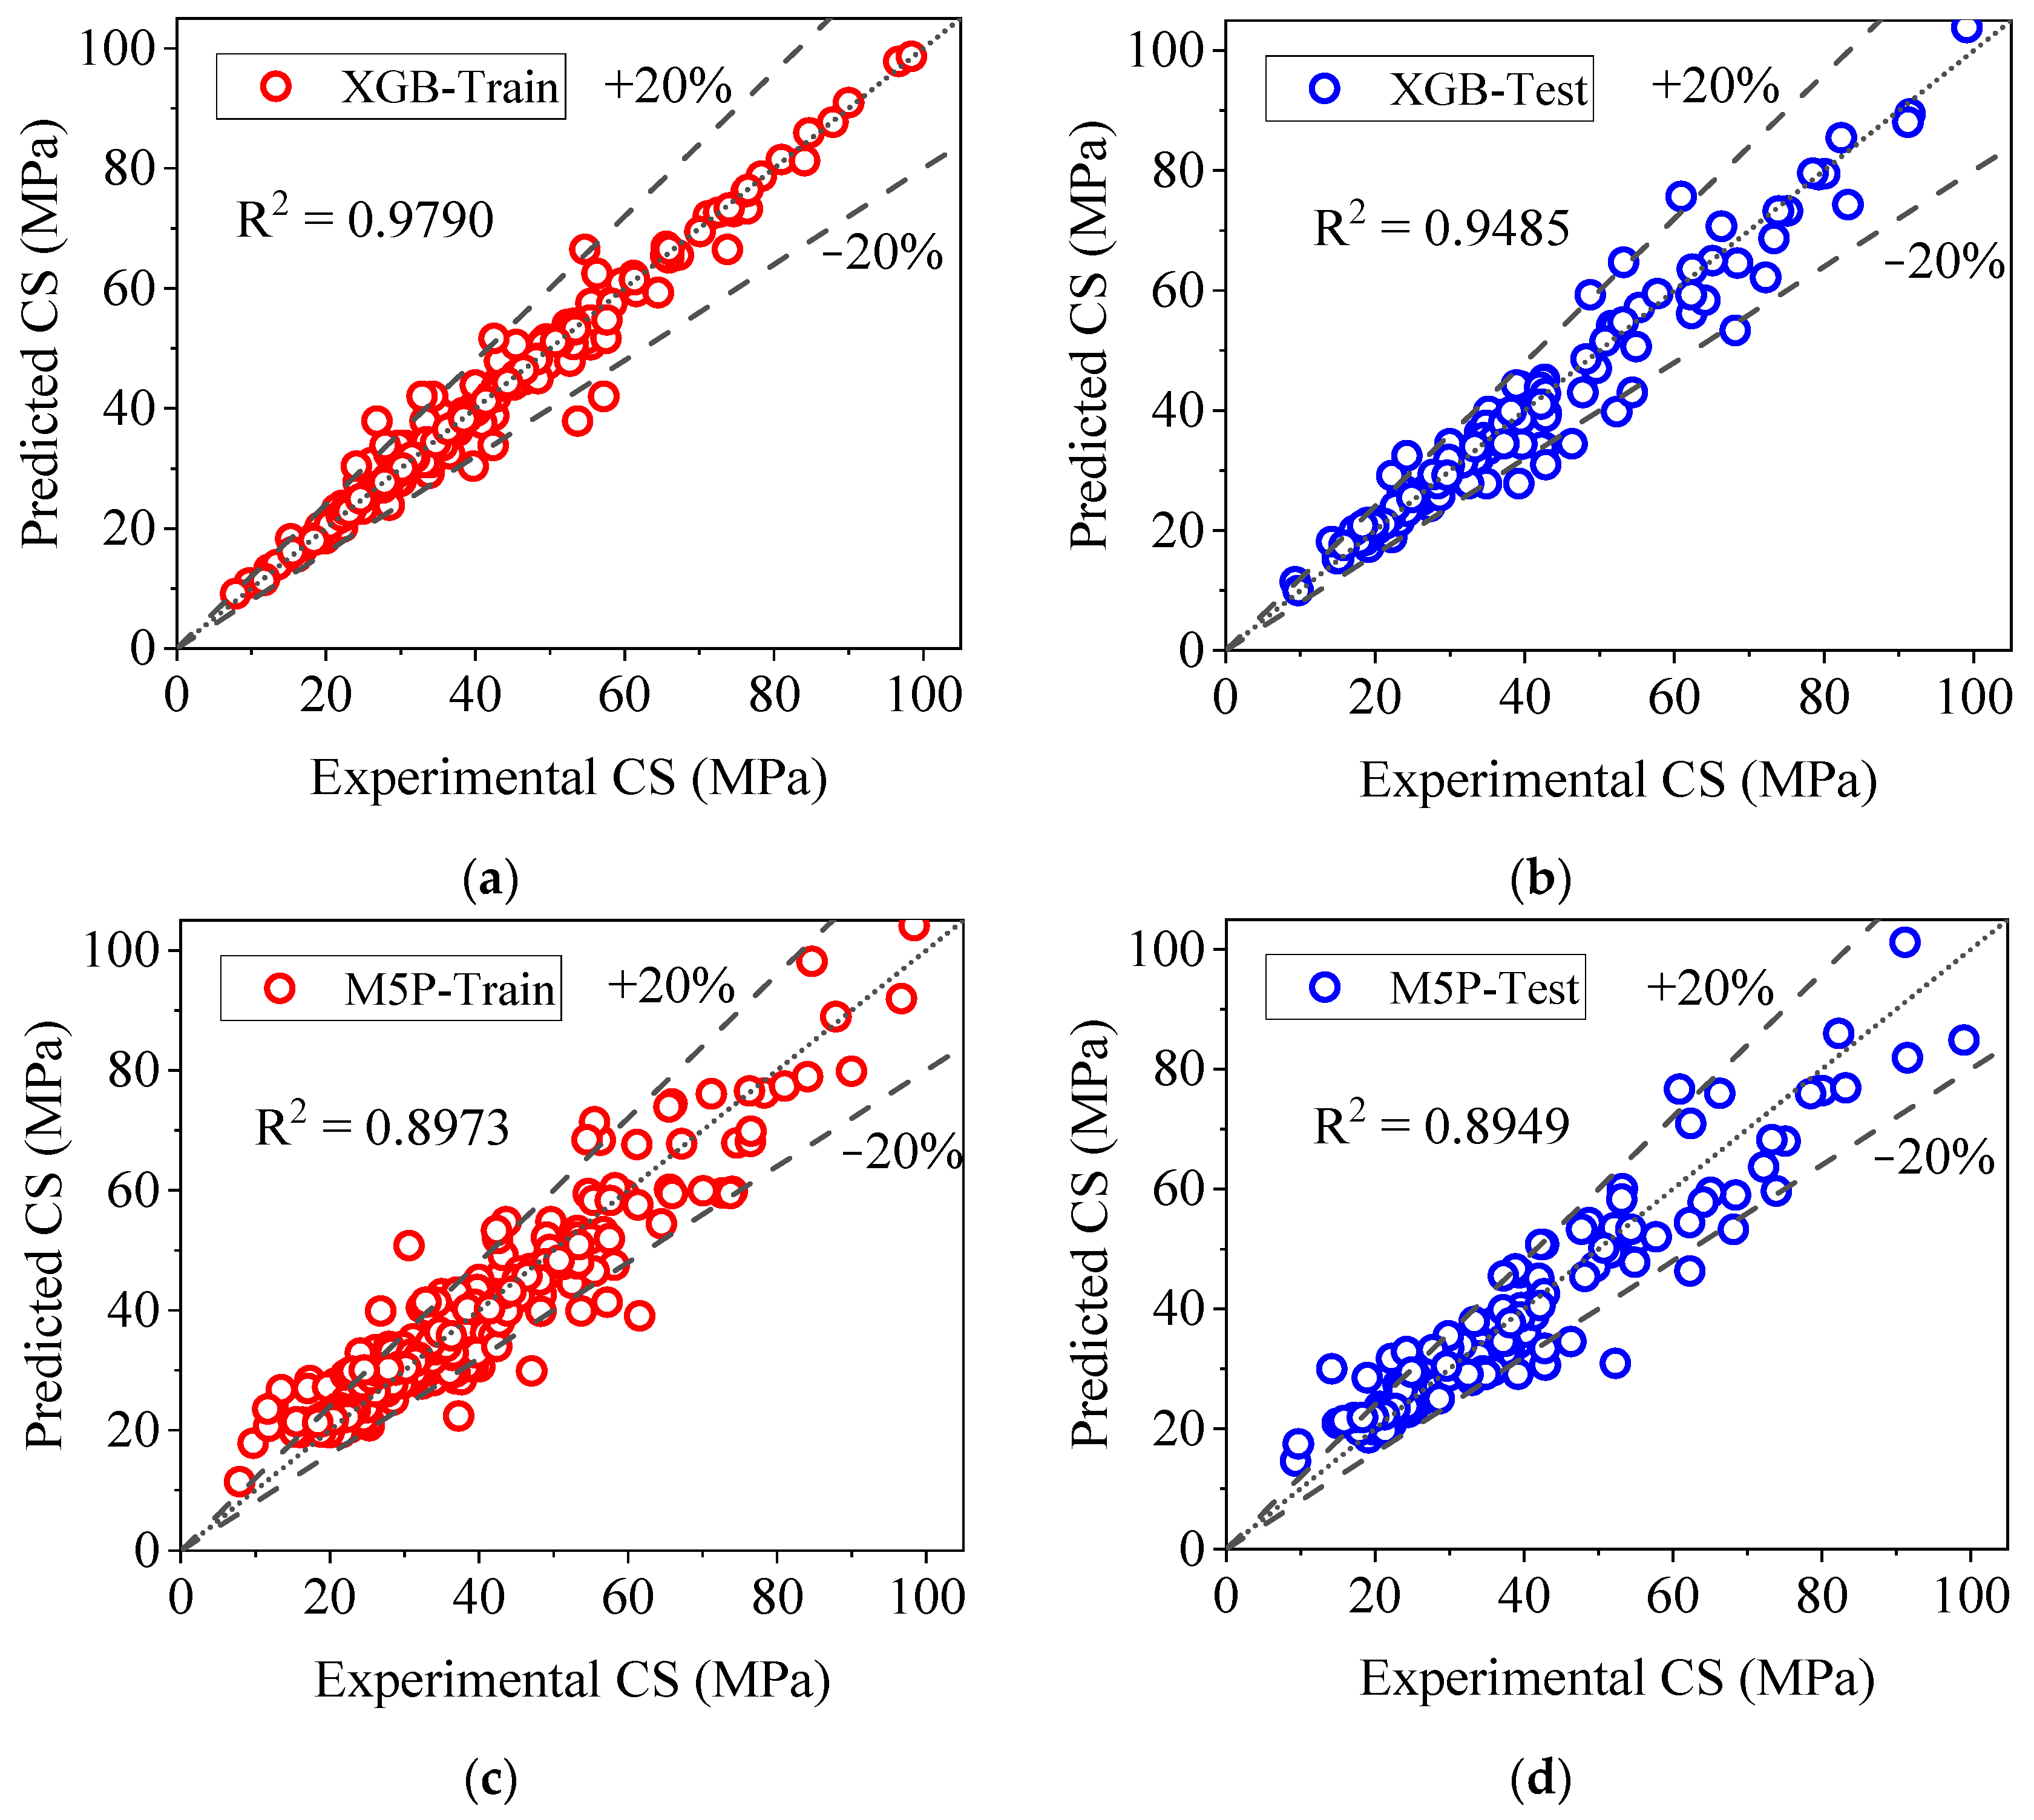
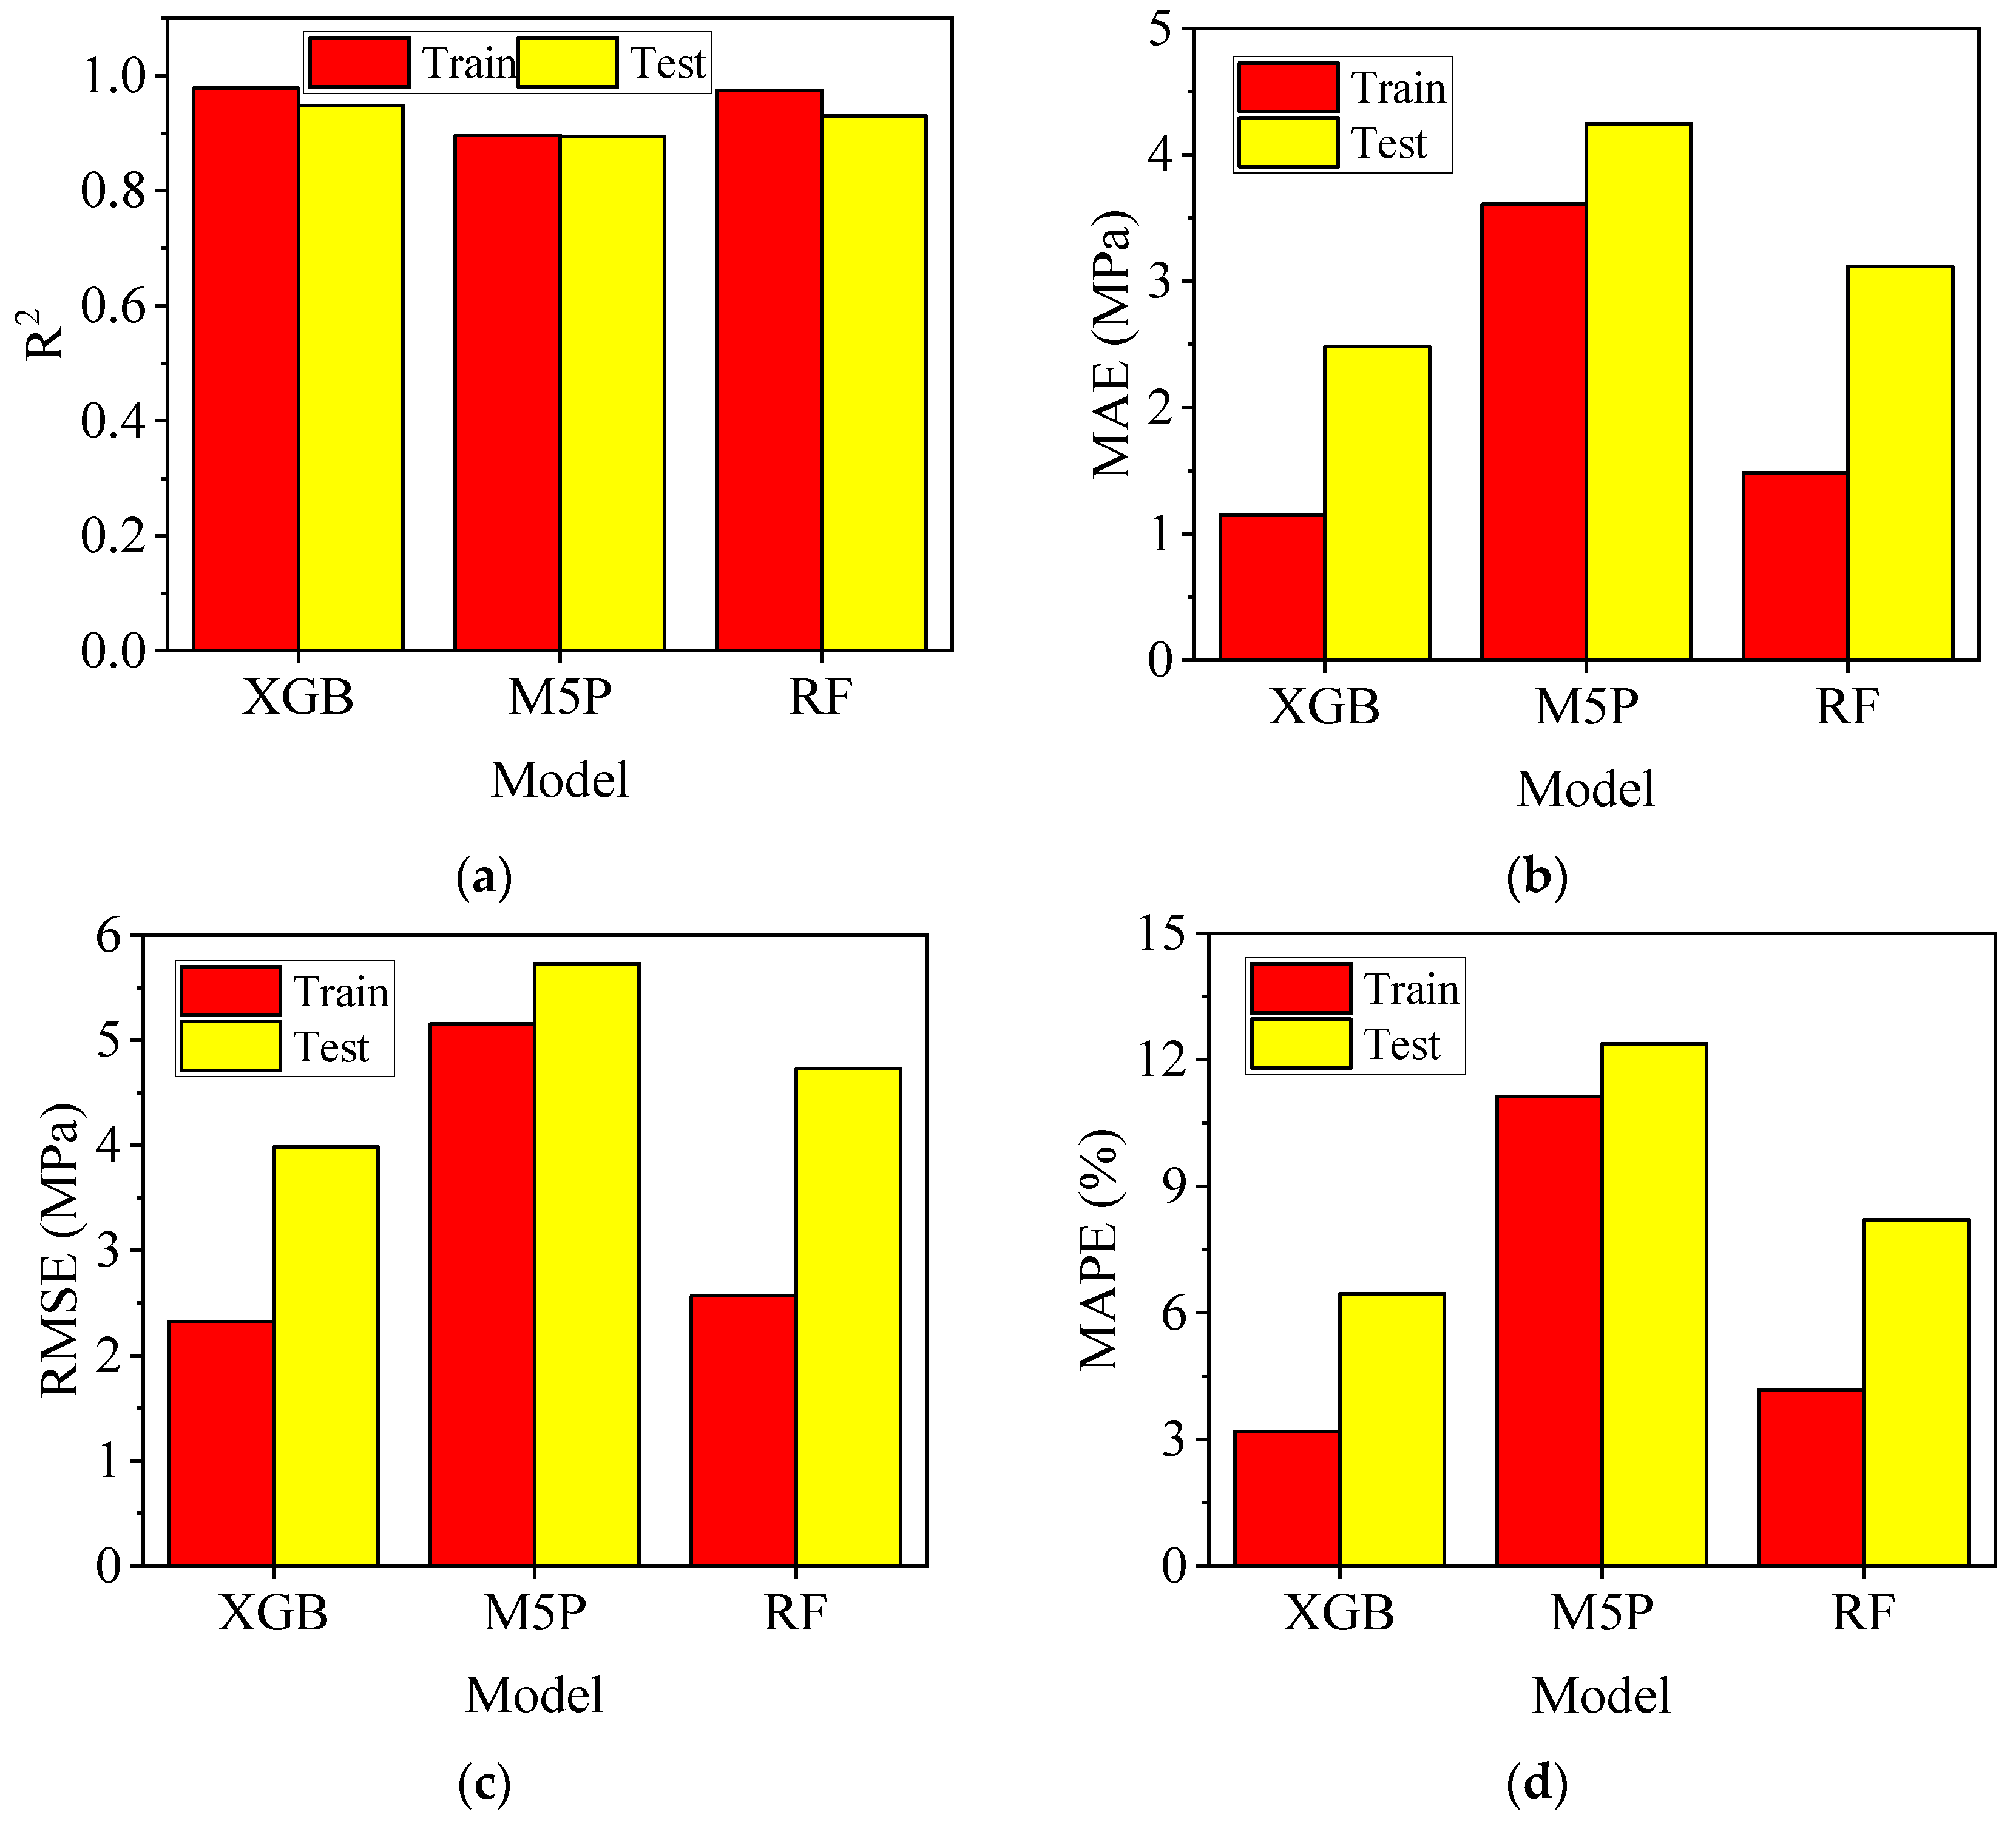
- The XGB prediction model demonstrated a robust correlation between the predicted and experimental data, achieving R2 values of 0.9790 and 0.9485 for the training and test datasets, respectively, indicating the model’s high predictive power and its accurate representation of the dataset’s trend.
- According to the results of the XGB models, the MAPE, RMSE, and MAE values for CS were 3.19%, 2.324 MPa, and 1.149 MPa, respectively, demonstrating that the XGB prediction model exhibited error rates below 5%. The XGB model had superior overall performance in terms of higher R2 and lower MAE, RMSE, and MAPE values.
- The SHAP analysis conducted using the XGB and RF models indicated that factors such as curing age, SP, cement, NFA, NCA, SF, and FA positively influence compressive strength. In contrast, W/C and RA negatively affect CS. Curing age and SP exert the most significant influence relative to the other factors. Moreover, the RA input parameter plays a more significant role than the NCA. PPF positively affects compressive strength. While SF and FA contribute to compressive strength, their impact is less pronounced than that of cement.
5. Limitations and Future Work
Author Contributions
Funding
Institutional Review Board Statement
Informed Consent Statement
Data Availability Statement
Acknowledgments
Conflicts of Interest
Abbreviations
| RA | Recycled aggregate |
| RAC | Recycled-aggregate concrete |
| PPF | Polypropylene fiber |
| FA | Fly ash |
| SF | Silica fume |
| CS | Compressive strength |
| LR | Linear regression |
| ML | Machine learning |
| RF | Random forest |
| SCMs | Supplementary cementitious materials |
| CV | Cross-validation |
| C | Cement |
| NFA | Natural fine aggregate |
| CCD | Central composite design |
| NCA | Natural coarse aggregate |
| W/C | Water/binder ratio |
| SP | Super plasticizer |
| AGE | Curing period |
| SDR | Standard deviation reduction |
| R | Correlation coefficient |
| R2 | Coefficient of determination |
| MAE | Mean absolute error |
| RMSE | Root mean squared error |
| MAPE | Mean absolute percentage error |
| SD | Standard deviation |
| RSM | Response surface methodology |
| ANOVA | Analysis of variance |
References
- Alharthai, M.; Ali, T.; Qureshi, M.Z.; Ahmed, H. The Enhancement of Engineering Characteristics in Recycled Aggregates Concrete Combined Effect of Fly Ash, Silica Fume and PP Fiber. Alex. Eng. J. 2024, 95, 363–375. [Google Scholar] [CrossRef]
- Younis, K.H.; Mustafa, S.M. Feasibility of Using Nanoparticles of SiO2 to Improve the Performance of Recycled Aggregate Concrete. Adv. Mater. Sci. Eng. 2018, 2018, 1512830. [Google Scholar] [CrossRef]
- Younis, K.H.; Pilakoutas, K. Strength Prediction Model and Methods for Improving Recycled Aggregate Concrete. Constr. Build. Mater. 2013, 49, 688–701. [Google Scholar] [CrossRef]
- Kurda, R.; de Brito, J.; Silvestre, J.D. Water Absorption and Electrical Resistivity of Concrete with Recycled Concrete Aggregates and Fly Ash. Cem. Concr. Compos. 2019, 95, 169–182. [Google Scholar] [CrossRef]
- Kurad, R.; Silvestre, J.D.; de Brito, J.; Ahmed, H. Effect of Incorporation of High Volume of Recycled Concrete Aggregates and Fly Ash on the Strength and Global Warming Potential of Concrete. J. Clean. Prod. 2017, 166, 485–502. [Google Scholar] [CrossRef]
- Adessina, A.; Ben Fraj, A.; Barthélémy, J.F.; Chateau, C.; Garnier, D. Experimental and Micromechanical Investigation on the Mechanical and Durability Properties of Recycled Aggregates Concrete. Cem. Concr. Res. 2019, 126, 105900. [Google Scholar] [CrossRef]
- Tam, V.W.Y.; Tam, C.M.; Wang, Y. Optimization on Proportion for Recycled Aggregate in Concrete Using Two-Stage Mixing Approach. Constr. Build. Mater. 2007, 21, 1928–1939. [Google Scholar] [CrossRef]
- Thomas, J.; Thaickavil, N.N.; Wilson, P.M. Strength and Durability of Concrete Containing Recycled Concrete Aggregates. J. Build. Eng. 2018, 19, 349–365. [Google Scholar] [CrossRef]
- Kazmi, S.M.S.; Munir, M.J.; Wu, Y.F.; Patnaikuni, I.; Zhou, Y.; Xing, F. Influence of Different Treatment Methods on the Mechanical Behavior of Recycled Aggregate Concrete: A Comparative Study. Cem. Concr. Compos. 2019, 104, 103398. [Google Scholar] [CrossRef]
- Xuan, D.; Zhan, B.; Poon, C.S. Durability of Recycled Aggregate Concrete Prepared with Carbonated Recycled Concrete Aggregates. Cem. Concr. Compos. 2017, 84, 214–221. [Google Scholar] [CrossRef]
- Choi, H.; Choi, H.; Lim, M.; Inoue, M.; Kitagaki, R.; Noguchi, T. Evaluation on the Mechanical Performance of Low-Quality Recycled Aggregate Through Interface Enhancement Between Cement Matrix and Coarse Aggregate by Surface Modification Technology. Int. J. Concr. Struct. Mater. 2016, 10, 87–97. [Google Scholar] [CrossRef]
- Wang, R.; Yu, N.; Li, Y. Methods for Improving the Microstructure of Recycled Concrete Aggregate: A Review. Constr. Build. Mater. 2020, 242, 118164. [Google Scholar] [CrossRef]
- Saeed, M.K.; Al Sayed, A.A.-K.A.; Almutairi, A.D.; Dahish, H.A.; Al-Fasih, M.Y.M. Utilizing Alkali-Activated Recycled Concrete Aggregates from Demolished Structures to Investigate Concrete Properties in the Jeddah Region of Saudi Arabia. Sustainability 2025, 17, 1903. [Google Scholar] [CrossRef]
- Pstrowska, K.; Gunka, V.; Prysiazhnyi, Y.; Demchuk, Y.; Hrynchuk, Y.; Sidun, I.; Kułażyński, M.; Bratychak, M. Obtaining of Formaldehyde Modified Tars and Road Materials on Their Basis. Materials 2022, 15, 5693. [Google Scholar] [CrossRef]
- Xuan, D.; Zhan, B.; Poon, C.S. Assessment of Mechanical Properties of Concrete Incorporating Carbonated Recycled Concrete Aggregates. Cem. Concr. Compos. 2016, 65, 67–74. [Google Scholar] [CrossRef]
- Katar, I.; Ibrahim, Y.; Abdul Malik, M.; Khahro, S.H. Mechanical Properties of Concrete with Recycled Concrete Aggregate and Fly Ash. Recycling 2021, 6, 23. [Google Scholar] [CrossRef]
- Karthik, C.H.; Nagaraju, A. An Experimental Study on Recycled Aggregate Concrete with Partial Replacement of Cement with Flyash and Alccofine. In Proceedings of the Innovative Technology for Smart Construction Materials and Sustainable Infrastructure, online, 14–15 October 2022; Institute of Physics: London, UK, 2023; Volume 1130. [Google Scholar]
- Shicong, K.; Poon, C.S. Compressive Strength, Pore Size Distribution and Chloride-Ion Penetration of Recycled Aggregate Concrete Incorporating Class-F Fly Ash. J. Wuhan Univ. Technol. Mater. Sci. Ed. 2006, 21, 130–136. [Google Scholar] [CrossRef]
- Ali, B.; Qureshi, L.A.; Nawaz, M.A.; Aslam, H.M.U. Combined Influence of Fly Ash and Recycled Coarse Aggregates on Strength and Economic Performance of Concrete. Civ. Eng. J. 2019, 5, 832–844. [Google Scholar] [CrossRef]
- Sunayana, S.; Barai, S.V. Partially Fly Ash Incorporated Recycled Coarse Aggregate Based Concrete: Microstructure Perspectives and Critical Analysis. Constr. Build. Mater. 2021, 278, 122322. [Google Scholar] [CrossRef]
- Ali, B.; Ahmed, H.; Ali Qureshi, L.; Kurda, R.; Hafez, H.; Mohammed, H.; Raza, A. Enhancing the Hardened Properties of Recycled Concrete (RC) through Synergistic Incorporation of Fiber Reinforcement and Silica Fume. Materials 2020, 13, 4112. [Google Scholar] [CrossRef]
- Ahmed, T.W.; Ali, A.A.M.; Zidan, R.S. Properties of High Strength Polypropylene Fiber Concrete Containing Recycled Aggregate. Constr. Build. Mater. 2020, 241, 118010. [Google Scholar] [CrossRef]
- Nazir, S.; Mahajan, A.; Jaggi, S. An Experimental Study on Enhancing Recycled Aggregate Concrete Properties Through Silica Fume Incorporation. Res. Sq. 2023. [Google Scholar] [CrossRef]
- Shahab, M.; Bashar, N. Effect of Silica Fume on Strength of Recycled Aggregate Concrete. Int. J. Res. Eng. Innov. 2024, 8, 101–107. [Google Scholar] [CrossRef]
- Ismail, A.J.; Younis, K.H.; Maruf, S.M. Recycled Aggregate Concrete Made with Silica Fume: Experimental Investigation. Civ. Eng. Archit. 2020, 8, 1136–1143. [Google Scholar] [CrossRef]
- Jahandari, S.; Mohammadi, M.; Rahmani, A.; Abolhasani, M.; Miraki, H.; Mohammadifar, L.; Kazemi, M.; Saberian, M.; Rashidi, M. Mechanical Properties of Recycled Aggregate Concretes Containing Silica Fume and Steel Fibres. Materials 2021, 14, 7065. [Google Scholar] [CrossRef] [PubMed]
- Nadim, F.; Hasan, R.; Rahman Sobuz, H.; Ashraf, J.; Sadiqul Hasan, N.; Dip Datta, S.; Islam, H.; Islam, A.; Awall, R.; Rahman, S.A.; et al. Effect of Silica Fume on the Microstructural and Mechanical Properties of Concrete Made with 100% Recycled Aggregates. Rev. Constr. 2024, 23, 413–435. [Google Scholar] [CrossRef]
- Alamri, M.; Ali, T.; Ahmed, H.; Qureshi, M.Z.; Elmagarhe, A.; Adil Khan, M.; Ajwad, A.; Sarmad Mahmood, M. Enhancing the Engineering Characteristics of Sustainable Recycled Aggregate Concrete Using Fly Ash, Metakaolin and Silica Fume. Heliyon 2024, 10, e29014. [Google Scholar] [CrossRef]
- Ye, P.; Chen, Z.; Su, W. Mechanical Properties of Fully Recycled Coarse Aggregate Concrete with Polypropylene Fiber. Case Stud. Constr. Mater. 2022, 17, e01352. [Google Scholar] [CrossRef]
- Sun, S.; Du, Y.; Sun, S.; Yu, Q.; Li, Y. Mechanical Properties of Recycled Concrete with Polypropylene Fiber and Its Bonding Performance with Rebars. Mater. Sci. 2024, 30, 396–403. [Google Scholar] [CrossRef]
- Zhang, H.; Liu, Y.; Sun, H.; Wu, S. Transient Dynamic Behavior of Polypropylene Fiber Reinforced Mortar under Compressive Impact Loading. Constr. Build. Mater. 2016, 111, 30–42. [Google Scholar] [CrossRef]
- Fallah, S.; Nematzadeh, M. Mechanical Properties and Durability of High-Strength Concrete Containing Macro-Polymeric and Polypropylene Fibers with Nano-Silica and Silica Fume. Constr. Build. Mater. 2017, 132, 170–187. [Google Scholar] [CrossRef]
- Yan, P.; Chen, B.; Afgan, S.; Aminul Haque, M.; Wu, M.; Han, J. Experimental Research on Ductility Enhancement of Ultra-High Performance Concrete Incorporation with Basalt Fibre, Polypropylene Fibre and Glass Fibre. Constr. Build. Mater. 2021, 279, 122489. [Google Scholar] [CrossRef]
- Zhang, L.; Li, X.; Li, C.; Zhao, J.; Cheng, S. Mechanical Properties of Fully Recycled Aggregate Concrete Reinforced with Steel Fiber and Polypropylene Fiber. Materials 2024, 17, 1156. [Google Scholar] [CrossRef] [PubMed]
- Imran, H.; Al-Abdaly, N.M.; Shamsa, M.H.; Shatnawi, A.; Ibrahim, M.; Ostrowski, K.A. Development of Prediction Model to Predict the Compressive Strength of Eco-Friendly Concrete Using Multivariate Polynomial Regression Combined with Stepwise Method. Materials 2022, 15, 317. [Google Scholar] [CrossRef]
- Dahish, H.A.; Elsayed, M.; Mohamed, M.; Elymany, M. Experimental Investigation on the Effect of Using Crumb Rubber and Recycled Aggregate on the Mechanical Properties of Concrete. ARPN J. Eng. Appl. Sci. 2021, 16, 2157–2168. [Google Scholar]
- Dahish, H.A.; Bakri, M.; Alfawzan, M.S. Predicting the Strength of Cement Mortars Containing Natural Pozzolan and Silica Fume Using Multivariate Regression Analysis. Int. J. GEOMATE 2021, 20, 68–76. [Google Scholar] [CrossRef]
- Dahish, H.A. Predicting the Compressive Strength of Concrete Containing Crumb Rubber and Recycled Aggregate Using Response Surface Methodology. Int. J. GEOMATE 2023, 24, 117–124. [Google Scholar] [CrossRef]
- Dahish, H.A.; Alkharisi, M.K. Hybrid Fiber Reinforcement in HDPE-Concrete: Predictive Analysis of Fresh and Hardened Properties Using Response Surface Methodology. Buildings 2024, 14, 3479. [Google Scholar] [CrossRef]
- Raveendran, N.; K, V. Synergistic Effect of Nano Silica and Metakaolin on Mechanical and Microstructural Properties of Concrete: An Approach of Response Surface Methodology. Case Stud. Constr. Mater. 2024, 20, e03196. [Google Scholar] [CrossRef]
- Yin, Y.; Qiao, L.; Li, Q.; Chen, L.; Miao, M.; Dong, J.; Song, L.; Luo, A.; Zheng, H. Thermodynamic Performance of SiC-Enhanced MicroPCM Backfill Based on Response Surface Methodology. Case Stud. Constr. Mater. 2024, 20, e03345. [Google Scholar] [CrossRef]
- Hassani, A.; Kazemian, F. Investigating Geopolymer Mortar Incorporating Industrial Waste Using Response Surface Methodology: A Sustainable Approach for Construction Materials. Case Stud. Constr. Mater. 2024, 21, e03609. [Google Scholar] [CrossRef]
- Haque, M.; Ray, S.; Mita, A.F.; Mozumder, A.; Karmaker, T.; Akter, S. Prediction and Optimization of Hardened Properties of Concrete Prepared with Granite Dust and Scrapped Copper Wire Using Response Surface Methodology. Heliyon 2024, 10, e24705. [Google Scholar] [CrossRef] [PubMed]
- Patil, S.; Ramesh, B.; Sathish, T.; Saravanan, A. RSM-Based Modelling for Predicting and Optimizing the Rheological and Mechanical Properties of Fibre-Reinforced Laterized Self-Compacting Concrete. Heliyon 2024, 10, e25973. [Google Scholar] [CrossRef] [PubMed]
- Dahish, H.A.; Almutairi, A.D. Effect of Elevated Temperatures on the Compressive Strength of Nano-Silica and Nano-Clay Modified Concretes Using Response Surface Methodology. Case Stud. Constr. Mater. 2023, 18, e02032. [Google Scholar] [CrossRef]
- Mitchell, T.M. Machine Learning; McGraw-Hill: New York, NY, USA, 1997; ISBN 0070428077. [Google Scholar]
- Pereira, F.; Mitchell, T.; Botvinick, M. Machine Learning Classifiers and FMRI: A Tutorial Overview. Neuroimage 2009, 45, S199–S209. [Google Scholar] [CrossRef]
- Sarker, I.H. Machine Learning: Algorithms, Real-World Applications and Research Directions. SN Comput. Sci. 2021, 2, 160. [Google Scholar] [CrossRef]
- Bergstra, J.; Bengio, Y. Random Search for Hyper-Parameter Optimization. J. Mach. Learn. Res. 2012, 13, 281–305. [Google Scholar]
- Kohavi, R. A Study of Cross-Validation and Bootstrap for Accuracy Estimation and Model Selection. In Proceedings of the 14th International Joint Conference on Artificial Intelligence-Volume 2, Montreal, QC, Canada, 20–25 August 1995; Morgan Kaufmann Publishers Inc.: San Francisco, CA, USA, 1995; pp. 1137–1143. [Google Scholar]
- Wan Mohammad, W.N.S.; Ismail, S.; Wan Alwi, W.A. Properties of Recycled Aggregate Concrete Reinforced with Polypropylene Fibre. MATEC Web Conf. 2016, 66, 00077. [Google Scholar] [CrossRef]
- Hanumesh, B.; Harish, B.; Venkata Ramana, N. Influence of Polypropylene Fibres on Recycled Aggregate Concrete. Mater. Today Proc. 2018, 5, 1147–1155. [Google Scholar] [CrossRef]
- Ali, B.; Fahad, M.; Mohammed, A.S.; Ahmed, H.; Elhag, A.B.; Azab, M. Improving the Performance of Recycled Aggregate Concrete Using Nylon Waste Fibers. Case Stud. Constr. Mater. 2022, 17, e01468. [Google Scholar] [CrossRef]
- Matar, P.; Zéhil, G.-P. Effects of Polypropylene Fibers on the Physical and Mechanical Properties of Recycled Aggregate Concrete. J. Wuhan Univ. Technol. Mater. Sci. Ed. 2019, 34, 1327–1344. [Google Scholar] [CrossRef]
- Ahmed, L.A.; Hassan, S.S.; Al-Ameer, O.A. Ultra-High Performance Reinforced by Polypropylene Fiber Concrete Made with Recycled Coarse Aggregat. Kufa J. Eng. 2017, 8, 128–141. [Google Scholar] [CrossRef]
- Turk, O. Evaluation of Compressive Strength for Recycled Aggregate Concrete Reinforced with Polypropylene Fibers. Master’s Thesis, The British University in Dubai, Dubai, United Arab Emirates, 2021. [Google Scholar]
- Sonkhla, P. Effect of Silica Fume and Recycled Coarse Aggregate in Concrete; Jaypee University of Information Technology: Waknaghat, India, 2016. [Google Scholar]
- Saravanakumar, P.; Dhinakaran, G. Strength Characteristics of High-Volume Fly Ash–Based Recycled Aggregate Concrete. J. Mater. Civ. Eng. 2013, 25, 1127–1133. [Google Scholar] [CrossRef]
- Sowmith, N.; Anjaneya Babu, P.S.S. Influence of Fly Ash on the Performance of Recycled Aggregate Concrete. Int. J. Sci. Res. (IJSR) 2016, 5, 1740–1744. [Google Scholar] [CrossRef]
- Bajad, M.N.; Mutha, N.; Husain, H.; Kshirsagar, N. Effect of Recycled Aggregate and Fly Ash in Concrete. IOSR J. Mech. Civ. Eng. (IOSR-JMCE) 2015, 12, 28–35. [Google Scholar] [CrossRef]
- ASTM C39/C39M-18; ASTM International Standard Test Method for Compressive Strength of Cylindrical Concrete Specimens. ASTM International: West Conshohocken, PA, USA, 2018.
- BS 1881; P. 116 Testing Concrete. Method for Determination of Compressive Strength of Concrete Cubes. BSI: London, UK, 1983.
- GB/T 50081-2019; Standard for Test Methods of Concrete Physical and Mechanical Properties. China Architecture & Building Press: Beijing, China, 2019.
- BS EN 12390-3; BSI Hardened Concrete-Part 3: Testing Hardened Concrete. Compressive Strength of Test Specimens. BSI: London, UK, 2019.
- IS 516; Indian Standards Methods of Tests for Strength of Concrete. Bur Indian Stand: New Delhi, India, 1959.
- Khan, M.A.; Farooq, F.; Javed, M.F.; Zafar, A.; Ostrowski, K.A.; Aslam, F.; Malazdrewicz, S.; Maślak, M. Simulation of Depth of Wear of Eco-Friendly Concrete Using Machine Learning Based Computational Approaches. Materials 2021, 15, 58. [Google Scholar] [CrossRef] [PubMed]
- Weka 3 Data Mining Software in Java; University of Waikato: Hamilton, New Zealand, 2011; Volume 19, p. 52.
- Anaconda Inc. Anaconda Individual Edition, Anaconda Website. 2024. Available online: https://www.anaconda.com/download (accessed on 20 January 2025).
- Montgomery, D.C. Design and Analysis of Experiments, 10th ed.; John Wiley & Sons, Inc.: Hoboken, NJ, USA, 2019; ISBN 9781118146927. [Google Scholar]
- Junaid, M.; Jiang, C.; Eltwati, A.; Khan, D.; Alamri, M.; Eisa, M.S. Statistical Analysis of Low-Density and High-Density Polyethylene Modified Asphalt Mixes Using the Response Surface Method. Case Stud. Constr. Mater. 2024, 21, e03697. [Google Scholar] [CrossRef]
- Elsayed, M.; Almutairi, A.D.; Hussein, M.; Dahish, H.A. Axial Capacity of Rubberized RC Short Columns Comprising Glass Powder as a Partial Replacement of Cement. Structures 2024, 64, 106612. [Google Scholar] [CrossRef]
- Adamu, M.; Trabanpruek, P.; Limwibul, V.; Jongvivatsakul, P.; Iwanami, M.; Likitlersuang, S. Compressive Behavior and Durability Performance of High-Volume Fly-Ash Concrete with Plastic Waste and Graphene Nanoplatelets by Using Response-Surface Methodology. J. Mater. Civ. Eng. 2022, 34, 04022222. [Google Scholar] [CrossRef]
- Bishop, C.M. Pattern Recognition and Machine Learning; Springer: New York, NY, USA, 2006. [Google Scholar]
- Breiman, L. Random Forests. Mach. Learn. 2001, 45, 5–32. [Google Scholar] [CrossRef]
- Wang, Y.; Witten, I.H. Induction of Model Trees for Predicting Continuous Classes; Computer Science Working Papers; University of Waikato: Hamilton, New Zealand, 1996. [Google Scholar]
- Quinlan, J.R. Learning with Continuous Classes. In Proceedings of the Australian Joint Conference on Artificial Intelligence, Hobart, Australia, 16–18 November 1992; pp. 343–348. [Google Scholar]
- Alkharisi, M.K.; Dahish, H.A.; Youssf, O. Prediction Models for the Hybrid Effect of Nano Materials on Radiation Shielding Properties of Concrete Exposed to Elevated Temperatures. Case Stud. Constr. Mater. 2024, 21, e03750. [Google Scholar] [CrossRef]
- Chen, T.; Guestrin, C. XGBoost. In Proceedings of the 22nd ACM SIGKDD International Conference on Knowledge Discovery and Data Mining, San Francisco, CA, USA, 13–17 August 2016; ACM: New York, NY, USA; pp. 785–794. [Google Scholar]
- Wu, J.; Ma, D.; Wang, W. Leakage Identification in Water Distribution Networks Based on XGBoost Algorithm. J. Water Resour. Plan. Manag. 2022, 148, 04021107. [Google Scholar] [CrossRef]
- Wang, T.; Bian, Y.; Zhang, Y.; Hou, X. Classification of Earthquakes, Explosions and Mining-Induced Earthquakes Based on XGBoost Algorithm. Comput. Geosci. 2023, 170, 105242. [Google Scholar] [CrossRef]
- Chakraborty, D.; Awolusi, I.; Gutierrez, L. An Explainable Machine Learning Model to Predict and Elucidate the Compressive Behavior of High-Performance Concrete. Results Eng. 2021, 11, 100245. [Google Scholar] [CrossRef]
- Elsayed, M.; Almutairi, A.D.; Dahish, H.A. Effect of Elevated Temperatures on the Residual Capacity of Rubberized RC Columns Containing Waste Glass Powder. Case Stud. Constr. Mater. 2024, 20, e02944. [Google Scholar] [CrossRef]
- Obaid, H.A.; Enieb, M.; Eltwati, A.; Al-Jumaili, M.A. Prediction and Optimization of Asphalt Mixtures Performance Containing Reclaimed Asphalt Pavement Materials and Warm Mix Agents Using Response Surface Methodology. Int. J. Pavement Res. Technol. 2024. [Google Scholar] [CrossRef]
- Lundberg, S.M.; Lee, S.-I. A Unified Approach to Interpreting Model Predictions. In Proceedings of the 31st International Conference on Neural Information Processing Systems, Long Beach, CA, USA, 4–9 December 2017. [Google Scholar]
- Demie, S.; Nuruddin, M.F.; Shafiq, N. Effects of Micro-Structure Characteristics of Interfacial Transition Zone on the Compressive Strength of Self-Compacting Geopolymer Concrete. Constr. Build. Mater. 2013, 41, 91–98. [Google Scholar] [CrossRef]

| Parameters | Unit | Min. | Max. | Mean | Std. Deviation | Skewness | Kurtosis |
|---|---|---|---|---|---|---|---|
| Cement (C) | kg/m3 | 243 | 704 | 423.08 | 107.37 | 1.004 | 0.332 |
| Natural fine aggregate (NFA) | kg/m3 | 320 | 962.3 | 662.34 | 145.46 | −0.429 | −0.332 |
| Natural coarse aggregate (NCA) | kg/m3 | 0 | 1548 | 629.52 | 411.55 | −0.103 | −0.987 |
| Recycled aggregate (RA) | kg/m3 | 0 | 1278 | 481.93 | 389.59 | 0.425 | −0.864 |
| Fly ash (FA) | kg/m3 | 0 | 162 | 28.75 | 43.48 | 1.213 | 0.340 |
| Silica fume (SF) | kg/m3 | 0 | 79.2 | 12.53 | 20.98 | 1.764 | 2.437 |
| Polypropylene fiber (PPF) | % | 0 | 3.0 | 0.249 | 0.607 | 2.924 | 8.709 |
| Water/cement ratio (W/C) | 0.26 | 0.66 | 0.447 | 0.091 | 0.099 | −0.496 | |
| Super plasticizer (SP) | kg/m3 | 0 | 7.84 | 1.779 | 2.156 | 1.295 | 1.092 |
| Curing period (AGE) | day | 3 | 180 | 28.52 | 29.0 | 2.808 | 9.380 |
| Compressive strength (CS) | MPa | 7.88 | 115.30 | 36.803 | 16.53 | 1.526 | 2.983 |
| Source | Sum of Squares | df | Mean Square | F-Value | p-Value | Metrics | Value | |
|---|---|---|---|---|---|---|---|---|
| Model | 1.28 × 10⁵ | 32 | 3993.47 | 120.51 | <0.0001 | significant | R2 | 0.8860 |
| A-C | 7.91 | 1 | 7.91 | 0.2387 | 0.6254 | Adjusted R2 | 0.8787 | |
| B-NFA | 274.44 | 1 | 274.44 | 8.28 | 0.0042 | Predicted R2 | 0.867 | |
| C-NCA | 1432.61 | 1 | 1432.6 | 43.23 | <0.0001 | Adeq. Precision | 65.67 | |
| D-RCA | 1814.14 | 1 | 1814.1 | 54.74 | <0.0001 | Std. Dev. | 5.76 | |
| E-FA | 21.82 | 1 | 21.82 | 0.6585 | 0.4175 | Mean | 36.8 | |
| F-SF | 24.8 | 1 | 24.8 | 0.7483 | 0.3874 | C.V. % | 15.64 | |
| G-PPF | 29.84 | 1 | 29.84 | 0.9005 | 0.3431 | |||
| H-W/C | 90.42 | 1 | 90.42 | 2.73 | 0.0992 | |||
| J-SP | 16.3 | 1 | 16.3 | 0.492 | 0.4834 | |||
| K-AGE | 138.81 | 1 | 138.8 | 4.19 | 0.0412 | |||
| AB | 1126.23 | 1 | 1126.2 | 33.99 | <0.0001 | |||
| AF | 35.16 | 1 | 35.16 | 1.06 | 0.3035 | |||
| AH | 676.2 | 1 | 676.2 | 20.41 | <0.0001 | |||
| BE | 700.09 | 1 | 700.09 | 21.13 | <0.0001 | |||
| BG | 340.3 | 1 | 340.3 | 10.27 | 0.0014 | |||
| BH | 314.96 | 1 | 314.96 | 9.5 | 0.0022 | |||
| BJ | 364.36 | 1 | 364.36 | 11 | 0.001 | |||
| BK | 391.56 | 1 | 391.56 | 11.82 | 0.0006 | |||
| EH | 588.4 | 1 | 588.4 | 17.76 | <0.0001 | |||
| EK | 555.73 | 1 | 555.73 | 16.77 | <0.0001 | |||
| FH | 200.58 | 1 | 200.58 | 6.05 | 0.0142 | |||
| FJ | 646.99 | 1 | 646.99 | 19.52 | <0.0001 | |||
| FK | 621.97 | 1 | 621.97 | 18.77 | <0.0001 | |||
| GJ | 111.36 | 1 | 111.36 | 3.36 | 0.0674 | |||
| HJ | 280.43 | 1 | 280.43 | 8.46 | 0.0038 | |||
| HK | 1490.4 | 1 | 1490.4 | 44.98 | <0.0001 | |||
| JK | 339.67 | 1 | 339.67 | 10.25 | 0.0015 | |||
| D2 | 256.09 | 1 | 256.09 | 7.73 | 0.0056 | |||
| G2 | 269.4 | 1 | 269.4 | 8.13 | 0.0045 | |||
| H2 | 1006.79 | 1 | 1006.8 | 30.38 | <0.0001 | |||
| J2 | 1692.32 | 1 | 1692.3 | 51.07 | <0.0001 | |||
| K2 | 4833.3 | 1 | 4833.3 | 145.85 | <0.0001 | |||
| Residual | 16,436.49 | 496 | 33.14 | |||||
| Lack of Fit | 13,902.16 | 420 | 33.1 | 0.9926 | 0.533 | not significant | ||
| Pure Error | 2534.34 | 76 | 33.35 | |||||
| Cor Total | 1.44 × 10⁵ | 528 |
Disclaimer/Publisher’s Note: The statements, opinions and data contained in all publications are solely those of the individual author(s) and contributor(s) and not of MDPI and/or the editor(s). MDPI and/or the editor(s) disclaim responsibility for any injury to people or property resulting from any ideas, methods, instructions or products referred to in the content. |
© 2025 by the authors. Licensee MDPI, Basel, Switzerland. This article is an open access article distributed under the terms and conditions of the Creative Commons Attribution (CC BY) license (https://creativecommons.org/licenses/by/4.0/).
Share and Cite
Alkharisi, M.K.; Dahish, H.A. The Application of Response Surface Methodology and Machine Learning for Predicting the Compressive Strength of Recycled Aggregate Concrete Containing Polypropylene Fibers and Supplementary Cementitious Materials. Sustainability 2025, 17, 2913. https://doi.org/10.3390/su17072913
Alkharisi MK, Dahish HA. The Application of Response Surface Methodology and Machine Learning for Predicting the Compressive Strength of Recycled Aggregate Concrete Containing Polypropylene Fibers and Supplementary Cementitious Materials. Sustainability. 2025; 17(7):2913. https://doi.org/10.3390/su17072913
Chicago/Turabian StyleAlkharisi, Mohammed K., and Hany A. Dahish. 2025. "The Application of Response Surface Methodology and Machine Learning for Predicting the Compressive Strength of Recycled Aggregate Concrete Containing Polypropylene Fibers and Supplementary Cementitious Materials" Sustainability 17, no. 7: 2913. https://doi.org/10.3390/su17072913
APA StyleAlkharisi, M. K., & Dahish, H. A. (2025). The Application of Response Surface Methodology and Machine Learning for Predicting the Compressive Strength of Recycled Aggregate Concrete Containing Polypropylene Fibers and Supplementary Cementitious Materials. Sustainability, 17(7), 2913. https://doi.org/10.3390/su17072913