Article

The Effect of Long-Term Soil System Use and Diversified Fertilization on the Sustainability of the Soil Fertility—Organic Matter and Selected Trace Elements

by
Agnieszka Andrzejewska
* and
Maria Biber
Department of Agricultural Chemistry and Environmental Biogeochemistry, Poznan University of Life Science, Wojska Polskiego 28, 60-637 Poznan, Poland
*
Author to whom correspondence should be addressed.
Sustainability 2025, 17(7), 2907; https://doi.org/10.3390/su17072907
Submission received: 14 January 2025 / Revised: 18 March 2025 / Accepted: 21 March 2025 / Published: 25 March 2025

Abstract

:
It has been assumed that the long-term impact of a diversified soil use system (SUS) and the continuous application of manure and/or mineral fertilizers (NPK) affects the sustainability of soil fertility components. This influence is manifested through the content and distribution of nutrients, as well as some bioavailable heavy metals in the soil. This hypothesis was verified in 2022 in a long-term field experiment that started in 1957. It consisted of a seven-course crop rotation: potato–spring barley–winter triticale–alfalfa–alfalfa–winter wheat–winter rye and monocultures of these crops plus black fallow. The studies were carried out on three separate fields: black fallow (BF), winter wheat grown in monoculture (WW-MO), and crop rotation (WW-CR). Each of these experimental objects consists of five fertilizer variants (FVs) fertilized in the same way every year: absolute control (AC)—variant without fertilizers for 75 years; farmyard manure—FM; mineral fertilizers—NPK; mixed variant—NPK + FM; mineral fertilizers plus annually applied lime—NPK + L. The second factor was the soil layer: 0.0–0.3 m, 0.3–0.6 m, or 0.6–0.9 m. The obtained results clearly indicate that long-term fertilization with NPK + FM, especially in rotation with legumes, strengthens the eluviation/illuviation processes, decreasing the sustainability of soil fertility. Liming is a factor stabilizing the content and distribution of silt and clay particles in the soil. The key factor determining the content and distribution of micronutrients and heavy metals in the soil was the content of organic carbon (Corg). Its content decreased in the following order: WW-CR (13.2 ± 5.8) ≥ WW-MO (12.3 ± 6.9) > BF (6.6 ± 2.8 g·kg−1). The large variability resulted from a distribution trend with soil depth, which increased as follows: MO ≥ CR > BF. FVs with FM had the highest Corg content. NPK, regardless of the long-term soil use system (SUS), had the lowest content. Among the elements studied, the key one impacting the content of both micronutrients and heavy metals was iron (Fe). The Fe content decreased in the order BL (100%) > WW-MO (90.5%) > WW-CR (85%). The opposite tendency was found for the remaining elements, the content of which was consistent with the content of Corg, which was the highest in CR. The strongest impact of Fe, modified by the SUS, was found for Zn, Pb, and Cd. Despite the differences observed between SUSs, fertilization variants, and soil layers, the content of Fe and Mn was in the medium class, while Zn and Cu were in the high class of availability. The content of Ni was the highest for NPK + FM in WW-CR. The content of Pb was weakly affected by the long-term SUS but showed a strong tendency for accumulation in the topsoil layer. The content of Cd was the highest in BF, where it exceeded the threshold of 0.27 mg·kg−1. The long-term diversified SUS, as the main factor determining the sustainability of soil fertility, makes it possible to indicate the directions of humus accumulation and its distribution in the soil. It turned out to be a key factor, but in cooperation with Fe, it determined the content of micronutrients and bioavailable heavy metals in the soil.

1. Introduction

The natural factors determining the type of crop production in a given area are the climate, or rather the microclimate, and the native soil fertility, which determines the spectrum of cultivated crop plants [1,2]. The need to meet the global food demand, on the one hand, and ensure the economic profitability of farmers’ production, on the other, requires conducting field experiments to build systems oriented on effective exploitation, i.e., the yield potential of cultivated crops. It is necessary to determine the impact of plant production systems (plants, crop succession, fertilization) on trends in soil fertility changes and their impact on natural ecosystems. All these conditions are met by static, long-term field experiments [3,4].
Monoculture and crop rotation are basic, though extreme, methods of crop production [5]. It is well documented that these extreme crop production systems have different effects on the sustainability of soil fertility and consequently on arable soil productivity. The former involves repeated cultivation of the same species in subsequent growing seasons. This method of crop production has certain advantages, mainly the limited number of tools needed from sowing/planting to harvesting. However, the disadvantages outweigh the benefits. Primarily, plants are more susceptible to pathogens and diseases. Moreover, monoculture leads to a disruption of the biogeochemical cycles of nutrients and, thus, to the deterioration of the physical soil properties. All these factors cause a decline in yields [6,7,8]. There are known crop plants that are characterized by high internal resistance to those factors. The classic example is maize, which in many regions of the world is grown in monoculture [9]. Among the classic cereals, the most resistant to monoculture is rye and the most susceptible are barley and wheat. In the first case, yield declines are observed after many years, while in the second group, they may occur as soon as the second year of repeated sowing [10].
Crop rotation is mainly based on biological factors that determine the advantages of directed crop plant succession in subsequent growing seasons [11]. Over thousands of years, farmers have observed the interactions between cultivated plants in successive growing seasons. The main negative effect of the continuous cultivation of one species in a given field is a decrease in yields resulting from a decrease in soil fertility [12,13,14]. The basic remedy has been the application of farmyard manure and/or the implementation of an annual break in arable soil cultivation, known as a black or green fallow. A three-field cropping system that ensures the stabilization of yields can be considered the first system of sustainable agricultural production [15]. This system dominated for many centuries; however, by the end of the Middle Ages in Europe, it proved to be insufficient for meeting the food needs of the growing human population. A sudden increase in production was ensured only by the crop succession introduced in Western Europe in the 18th century, known as the Norfolk Crop Rotation [16].
Rotational, i.e., sustainable crop production systems are based on three pillars. The first is the alternating/seasonal cultivation of cereals with non-cereal (leafy) crops [17,18]. The second is the introduction of legumes into the crop succession cycle in the field. This group includes annual legumes as well as perennial legumes. The first group is currently represented mainly by large-seeded legumes such as peas, broad beans, and lupines, and the second by fodder crops, most often clover or alfalfa. Farmers treat legumes mainly as a source of N, also with a view to improving the soil structure [19,20]. The third pillar of the classic crop rotation is the use of manure, classically used for a leafy crop, which usually begins the crop rotation cycle [21].
The need to increase food production, combined with the optimization of the use of production measures, has prompted field experiments. In 1843, the first experimental field was founded in Rothamsted (England), and it still exists. The key crop in this experimental field is winter wheat, grown in monoculture and crop rotation [3]. This type of field experiment called a long-term experiment due to its duration, is carried out in many regions of the world. These long-term experiments aim to achieve two key goals. The first, practical one involves minimizing the effects of monoculture by using farmyard manure (FYM) alone or in combination with mineral fertilizers. Hence, experimental variants with only manure or only with NPK, as well as mixed variants such as NPK + FYM, have appeared in experimental fields [22]. In addition, so-called incomplete fertilizer variants have been tested; for example, NP, NK, or only N [23]. The second, scientifically oriented main goal focused on observing the cycles of carbon, nitrogen, and some macronutrients, mainly P and K. Research on long-term trends in weeds, diseases, and pathogens cannot be omitted. With the progress of the biological sciences, research has focused on interactions between microorganisms and plants [24,25,26].
There are knowledge gaps about the impact of long-term field experiments on the sustainability of soil fertility. The first concerns micronutrients. In principle, micronutrients are not introduced as an experimental factor in this type of study. However, it should be assumed that the main factor, i.e., the system of arable soil use (monoculture or crop rotation) and the fertilization system (organic, mineral, or mixed) affects both the resources and the structure (chemical forms) and, in consequence, the availability of micronutrients to plants. Secondly, soil chemical tests most often concern only the surface layer of the soil profile (0.0 m to max 0.3 m). Crop plants root much deeper, also in the so-called subsoil [27,28,29]. In the diagnostics of mineral nitrogen (Nmin), measurements in winter cereals are carried out to a depth of 0.9 m at intervals of 0.3 m. These soil layers also require assessment for micronutrient resources, which also can be done by the collection of samples for Nmin analysis [30].
The objective of the study carried out in 2022, i.e., after 75 years of diversified systems of arable soil use, including long-term black fallow and winter wheat grown in monoculture and in a 7-year crop rotation, was to assess the contents and the vertical distribution of available micronutrients (iron, Fe; manganese, Mn; zinc, Zn; and copper, Cu) and selected bioavailable heavy metals (nickel, Ni; lead, Pb; and cadmium, Cd) under continuous use of farmyard manure and mineral fertilizers (NPK) arranged in five variants. It was assumed that the basic soil properties are an important factor in the sustainability of soil fertility.

2. Materials and Methods

2.1. Experimental Site

The study on the content of available resources of micronutrients and selected bioavailable heavy metals in the soil was carried out in 2022, i.e., in the 75th year after funding a long-term experiment at the Brody Experimental Station of the Poznan University of Life Sciences, Poland (52°26′ N, 16°18′ E, 92 m a.s.l.). It was established on soil formed from loamy sand, classified as Albic Luvisols (Neocambic). This station, managed by the Agronomy Department of the Poznan University of Life Sciences, is located 50 km west of Poznań in the Wielkopolska Region of western Poland.
The local climate of the study area, classified as intermediate (between Atlantic and Continental), is seasonal. Continental conditions dominate in the summer months. The climate of the studied area in the period 1960–2020 was characterized by an average annual temperature of 8.1 °C (ranging from 6.6 to 10 °C) and a total rainfall of approximately 580 mm annually (ranging from 310 to 840 mm) [31] (Meteorological Synoptic Station Brody, 52°43′ N, 16°30′ E).

2.2. Experimental Design

The static field experiment was established as a randomized block design of four replicates, including a seven-course crop rotation: potato–spring barley–winter triticale–alfalfa–alfalfa–winter wheat–winter rye and monocultures of these crops plus black fallow. A detailed study was carried out on three separate fields: black fallow (BF), winter wheat grown in monoculture (WW-MO), and winter wheat grown in crop rotation (WW-CR). Each of these objects was treated as a separate single-factor experiment consisting of five FVs fertilized in the same way every year: absolute control (AC)—variant without fertilizers for 75 years; farmyard manure—FM; mineral fertilizers—NPK; mixed variant, including FM and NPK—NPK + FM; and mineral fertilizers plus annually applied lime (1 t·ha−1 of CaO − NPK + L. The second factor in the conducted study was the soil layer, including 0.0–0.3 m (A), 0.3–0.6 m (B), and 0.6–0.9 m (C). The division of the soil profile into soil layers was adopted in accordance with the methodology for mineral nitrogen (Nmin) testing [30].
The fertilizer application has remained constant, using 90 kg N·ha−1, 26 kg P·ha−1, and 100 kg K·ha−1. With this dose of P, the amounts of the studied elements were Fe—210 ± 28, Mn—11 ± 0.4, Zn—48 ± 12, Cu—1.3 ± 0.4, Pb—1.4 ± 2, Ni—1.0 ± 0.05, and Cd—0.6 ± 2 g·ha−1·year−1. The cow manure dose was 30 t·ha−1. With this dose of manure, 4.2 t·ha−1 of organic matter is annually introduced into the soil. The amounts of micronutrients and heavy metals introduced in manure, on average, were Fe—8900 ± 660, Mn—900 ± 74, Zn—990 ± 180, Cu—25 ± 9, Pb—19 ± 4.5, and Cd—1.8 ± 0.3 g·ha−1·year−1. The total size of a single plot is 55 m2. Herbicides were used for the first time in 1976. Harvesting methods have also changed over the years; until 1976, a sheaf-binder was used, and later, three types of combine harvester were used: a Hege 125 B (1977–1998), a Wintersteiger Nurserymaster Elite (1999–2007), and a Wintersteiger Classic (2008–2022).

2.3. Soil Sampling and Analysis and Data Evaluation

Composite soil samples (0.0–0.3; 0.3–0.6; 0.6–0.9 m) for the determination of basic soil properties such as soil texture, organic C (Corg), pH, and electrical conductivity (EC), as well as the content of available forms of micronutrients (iron, Fe; manganese, Mn; zinc, Zn; and copper, Cu) and bioavailable forms of the heavy metals cadmium (Cd) and lead (Pb), were collected in October 2022. The soil samples were then air-dried and crushed to pass through a 2-mm mesh. Soil granulometric fractions were determined using the aerometric method [32]. EC was measured based on PN-EN 27888:199 and pH on PN-EN ISO 10523:2012 [33,34]. The content of Corg was determined using an ELEMENTRACK-CS analyzer. The contents of available micronutrients and bioavailable heavy metals were determined based on the Mehlich 3 method [35]. The concentration of micronutrients (Fe, Mn, Zn, Cu) and heavy metals (Ni, Pb, Cd) was determined using flame-type atomic absorption spectrometry. The results were expressed in mg·kg−1 on a soil dry matter basis.
The state of soil fertility with respect to the content of micronutrients was evaluated based on ranges proposed by Zbiral et al. [36] for the Mehlich extraction solution. The bioavailability of Cd was evaluated based on Maly et al. [37], who assumed that a content (determined by the Mehlich 3) below 0.27 mg kg−1 does not pose a risk to the environment. The second source of heavy metal evaluation could be the data on the natural background. It has been assumed that these ranges are represented by the soil layer below the top layer (A, 0.0–0.3 m) in the AC and variants without applied FM. These ranges were as follows: Pb: 3.3–4.2; Ni: 0.0–0.09; Cd: 0.23–0.27 mg·kg−1.
The Humus Stability Index (HSI) has been calculated on the basis of averaged data for the tested factors using the following formula presented by Spychalski et al. [38]:
H S I = H / ( S i + C ) · 100 ,
where: HSI is the soil Humus Stability Index, H is the humus content (%), and Si and C denote the silt and clay content (%), respectively. The content of humus was calculated as Corg (%) × 1.724. The four classes of soil sensitivity to degradation with respect to the humus content are as follows:
(1)
S < 5 = structurally degraded soil;
(2)
5 < S < 7 = a great risk of soil structure degradation;
(3)
7 < S < 9 = a small risk of soil structure degradation;
(4)
S > 9 = no risk of soil structure degradation.
An H index > 9 indicates that the humus content in a particular soil layer is at the optimal level.

2.4. Statistical Analysis

The effects of the individual experimental factor (fertilization variants, FVs; soil layer, SL) and their interactions were assessed individually for black fallow (BF), winter wheat grown in monoculture (WW-MO), and winter wheat grown in crop rotation (WW-CR) by means of a two-way ANOVA. Means were separated by honest significant difference (HSD) using Tukey’s method when the F-test indicated significant factorial effects at the level of p < 0.05. The relationships between the soil characteristics were analyzed using Pearson correlation and linear regression. STATISTICA 12 software was used for all statistical analyses (StatSoft Inc., Tulsa, OK, USA, 2013). In the second step, a principal component analysis (PCA) was used to illustrate the associations between the studied soil characteristics. In the third step of the diagnostic procedure, stepwise regression was applied to discriminate the set of soil general characteristics and/or micronutrients determining the content of micronutrients and bioavailable heavy metals. In the computational procedure, a consecutive variable was removed from the multiple linear regressions in a step-by-step manner. The best regression model was chosen based on the highest F-value.

3. Results

3.1. Key Indicators of Soil Fertility Sustainability

Electrical conductivity (EC) did not show significant variability at any soil depth in response to fertilization variants (FVs). Moreover, no differences were observed between the examined soil use variants (Table 1). A correlation between EC and the content of the tested elements was noted for Cu in BF (r = −0.74**), Cd in MO (0.52*), and for Mn (r = 0.60 in CR (Table A1, Table A2 and Table A3, respectively).
The percentage of clay (Cl), silt (Si), and sand (Sa) showed a significant response to the interaction of fertilization variants (FVs) and soil depth (SL) for Black Fallow (BF) and winter grown in crop rotation (WW-CR) (Table 1). The increasing sand (Sa) content, regardless of the soil use system (SUS), had a negative impact on the Cl and Si content. The strength of decrease was, as a rule, significantly greater for silt (Si) than for clay (Cl) (Table A1, Table A2 and Table A3). The exception was CR, for which the same level of decline was observed (r = −0.95*** for Si and 0.85*** for Cl, Table A3). In BF, the highest Si content averaged for soil layers, was found in the soil continuously fertilized with farmyard manure (FM). It was twice as high as in the absolute control (AC). Only in the latter FV did the Si content decrease with soil depth. In all others, the opposite trend was recorded, with that of NPK + FM being the strongest (Figure S1). The Cl content, similar to Si, showed extreme values for FM and AC, but the differences were smaller (Figure S2). With the exception of NPK and NPK + FM (layer A), the highest Cl content was recorded in layer B. A significant and positive relationship was noted only between Cl and Mn (r = 0.58*).
The Si content in CR was only slightly higher than in BF (16.1% ≥ 15.5%). The highest was recorded in NPK + FM, and it was significantly lower (by 1/3) for NPK (Figure S3). The vertical Si distribution was strongly affected by the application of manure, which led to its increase in soil depth, showing the greatest accumulation in layer C. The opposite trend was observed for NPK and NPK + L. The average Cl content was one-third higher in CR compared to BF (Figure 1). The highest was found for NPK + FM and the lowest was for NPK. At the same time, a decreasing trend in Cl content was observed for all FVs except NPK + L. In this particular case, the Cl content was both high and constant in the entire soil profile. The strongest downward Cl trend took place in soil continuously treated with manure. A correlation was noted only between Cl and Fe, which was negative (r = −0.57*).
In the WW-MO system, an effect of both factors on the granulometric soil fractions was found, but there was no interaction between them (Table 1). The average Si content was higher than in other SUSs, and the Cl content was intermediate. The highest Si content was recorded for NPK and the lowest for NPK + FM (a decrease of 30%). Overall, the Si content increased significantly below layer A. The Cl content was the highest for NPK + L, and the lowest in AC by 54%. In the soil profile, it increased progressively with depth. Si showed a positive relationship with Mn (r = 0.52*). A greater number of proven but negative correlations was recorded for Cl (Fe, Mn, and Cd) (Table A2).
The soil reaction increased in the order BF < MO < CR. A significant effect of FVs was found for BF and MO. In both cases, the lowest pH was recorded in FM, while the highest was found in BF for NPK + L and in MO for NPK. The content of organic carbon (Corg) showed significant variability in all soil layers under the continuous long-term application of fertilizers (Table 2). The differences between the examined systems of soil use were large. The Corg content in black fallow (BF), averaged for soil layers, was approximately half that in both wheat variants (6.6 vs. 12.5 g·kg−1). The most stable characteristic of Corg distribution in the soil, regardless of its use, was its gradual (but specific to a given fertilizer variant) decrease with soil depth. The greatest differences between fertilizer variants in the entire soil profile were noted for BF (Figure A1). The highest Corg content was found for manure-treated soil. Extreme differences occurred between FM and both mineral NPK variants. They were significant in all soil layers, but the greatest differences were revealed in the subsoil. In layer B in NPK and NPK + L, Corg was only 40% of that recorded for FM. In layer C, these differences increased to 50%. The buffering effect of manure on this soil characteristic was clearly visible, especially in the FM variant. In this plot, the decrease in Corg in layer B was less than 10% compared to the topsoil layer. For comparison, in NPK + L, where it was the greatest, it reached 55%. Intermediate values were recorded for AC and NPK + FM, amounting to 33%.
In the winter wheat monoculture (WW-MO), a quite different pattern of Corg distribution in the soil resulted, mainly from the dominance of its accumulation in the topsoil layer (Figure A2). The highest Corg content was recorded in FM, and it decreased strongly with soil depth. In layers B and C, compared with the A layer, it decreased by two-thirds and three-quarters, respectively. A similarly strong downward tendency, but with much lower values in the topsoil layer, occurred in NPK + FM. In AC and mineral FVs, the Corg content in the topsoil layer was much lower than in both variants with manure. Compared with FM, it was only two-thirds of its value. Moreover, the downward trend was also smaller.
In winter wheat grown in crop rotation (WW-CR), the general pattern of Corg distribution in the soil turned out to be highly specific (Figure A3). Differences in its vertical distribution, with the exception of AC, were quite constant with soil depth. The Corg percentage distribution pattern 100/60/30 was revealed in both NPK + FM and NPK + L. A similar pattern was observed for NPK, which was the poorest (17 vs. 23 g Corg·kg−1 for NPK + FM). The average Corg content in AC was slightly lower than in NPK, but the differences between soil layers were relatively small.
The effect of SUS on the Humus Stability Index (HSI) was significant and increased in the order BF (6.3) < MO (9.7) < CR (11.6) (Table 2). In BF, the highest HSI was recorded for AC, which was almost twice as high as NPK (Figure S4). Moreover, the HSI in the topsoil was twice as high as recorded in the subsoil layers. Extreme values were found for NPK + FM and NPK (12.7 vs. 5.4). As a rule, the HSI decreased with soil depth, showing the strongest downward trend for NPK + FM and FM (coefficient of variation, CV = 52%). The degradation state (HSI < 5.0) was revealed in NPK already in layer B, and in the remaining FVs, except AC, only in the C layer. At the same time, HSI was negatively correlated with the Si content (r = −0.58*) and positively with the humus content (r = 0.79**) (Table A1).
The HSI values in WW-MO were high due to exceptionally high values in the topsoil, ranging from 14.9 for NPK to 24.2 for NPK + FM. At the same time, these two FVs showed the strongest decrease in this index with soil depth, as indicated by CVs of 82% and 86%. For comparison, the greatest HSI stability with soil depth (CV = 46%) was observed for AC. An HSI value below 5.0 was recorded first for NPK in layer B. However, in the remaining FVs, except AC, it was recorded only in layer C. A positive HSI correlation was observed for Sa (0.72**) and a negative correlation with Si and Cl (r = −0.62** and −0.52*, respectively). The key factor determining the HSI was the humus content (r = 0.95***) (Table A2).
The HSI in WW-CR was the highest due to higher values in both upper layers (A and B, Figure 2). In the topsoil, this index ranged from 15.3 for NPK + L to 24.4 for FM. In layer B, it was significantly lower and ranged from 9.3 for NPK + L to 13.8 for NPK. The only drop below 5.0 was recorded in layer C for NPK + FM. This FV showed the greatest decreasing tendency with soil depth (CV = 78%). However, AC was the most stable in this respect (CV = 37%). Similarly to WW-MO, the Sa content was positively correlated (r = 0.59*), and Cl negatively correlated (r = −0.75**) with HSI. However, the dominant factor determining HSI was the content of the humus (r = 0.88***).

3.2. Trends in the Content and Distribution of Micronutrients and Bioavailable Heavy Metals with Soil Depth

3.2.1. Black Fallow

Only two of the seven elements examined showed significant variability in distribution with soil depth in response to long-term exposure to diversified fertilization. These were manganese (Mn) and nickel (Ni) (Table 3). In general, a significantly higher content of available Mn was recorded in FM, which was 15% higher compared with NPK + FM. The remaining FVs examined were much poorer in Mn and did not differ from each other. Three response patterns to long-term fertilization can be distinguished in the vertical distribution of Mn (Figure 3). The first one, concerning AC, NPK, and NPK + L, clearly indicates a dominance of the topsoil layer and a significant decrease in the Mn content in the subsoil layers. The decrease was in the range of 33–42%. The opposite trend was observed for FM, in which the Mn content in subsoil layers was higher than in the topsoil. The third pattern was revealed for NPK + FM, in which the average level of Mn content in the soil resulted from its significant decrease in layer B. All FVs, despite significant vertical variability, were in the medium availability class (30.1–200 mg·kg−1).
The second element whose available content responded significantly to FVs, regardless of the soil layer, was nickel (Ni, Figure 4). The specificity of the FVs’ impact actually relates to the effect of manure. The highest progressive Ni content increase with soil depth occurred in FM. In layer C, its content increased 28 times compared to the topsoil layer. Moreover, the average Ni content in the soil was 12 times higher compared to AC and six times higher compared to NPK + L. In NPK + FM, unlike FM, a significant increase was recorded only in the C layer compared to the upper soil layers.
The content of available iron (Fe), despite a certain but insignificant response to FVs, decreased considerably and gradually with soil depth (Table 3). Compared with the topsoil, it was half as high in layer B and reached only 37.5% in layer C. Taking into account the ranges of Fe availability, the values found in the entire soil profile were in the medium class (60.0–420 mg·kg−1). Very similar patterns, as for Fe, were recorded for zinc (Zn), as well as for bioavailable lead (Pb) and cadmium (Cd). For all these elements, there was a sudden decline in their content in the subsoil compared with the topsoil. In layer B, it reached 54%, 71%, and 84%, respectively. The same trend, although not significant, was observed for copper (Cu). The content of Zn in the topsoil was in the high class (>5.0 mg kg−1), and in the deeper soil layers, it was in the medium class (2.21–5.0 mg·kg−1). The content of available Cu in the entire soil profile was in the high class in the NPK, and in the low class in the FM. In the remaining FVs, the high class was noted only in layer A. In the case of Cd, its bioavailability exceeded the threshold value of 0.27 mg·kg−1 soil in the topsoil.
A principal component analysis (PCA) clearly revealed the distinct impact of the components on the strength of relationships between the elements in the soil and the main fertility characteristics of the black fallow (Table 4). PCs with eigenvalues greater than 1.0 were used as a primary criterion to determine the number of PCs. PC1 and PC2 contributed 47% and 28% of the total variance, respectively (Figure A4). However, only the variables with scores on PCs over 0.70 (R2 > 0.50) were taken into consideration. In general, six of the thirteen variables had loadings on PC1, meeting the selected criterion. The highest score (≥0.9), and at the same time, negative loadings on PC1 were recorded in descending order (r) for Fe = Zn = Cd > Pb. On PC2, the required criterion was met for five of the thirteen variables. On PC3, the required criterion was met only for EC. The studied variable weight was evaluated by the eigenvector, which varies between −1 to +1. The eigenvectors for the examined variables were broadly scattered on the first two PCA axes (Figure A4). The closest to absolute −1 on the PC1 axis were Zn and Cd, followed by Pb and Fe.
It has been clearly documented that the content of five of the seven elements examined was governed by the content of Corg (Table A1). The exceptions were Cu and Ni. The strongest dependence was found for Fe, 66% of whose content depended on Corg (acronym C):
F e = 32.3 C + 25.4   for   n = 15 ,   R 2 = 0.66 ,   p   0.001
This is very important information because the variability of Fe content was the main factor determining the content of bioavailable forms of heavy metals. The obtained dependencies are as follows:
N i = 0.25 0.002 F e + 0.016 M n   f o r   n = 15 , R 2 = 0.80 ,   p       0.001
  P b = 2.38 + 0.008 F e   f o r   n = 15 , R 2 = 0.89 ,   p   0.001
C d = 0.21 + 0.00025 F e   f o r   n = 15 , R 2 = 0.86 ,   p   0.001
The Ni content depended positively on the Mn content (Table A1). The content of Zn, Pb, and Cd was linearly and strongly associated with the content of Fe. The content of Cu, as the only element examined, showed a negative response to EC.

3.2.2. Winter Wheat in Monoculture

A significant response to FVs was recorded for two of the seven elements examined, namely Fe and Ni. At the same time, significant variability depending on the soil layer was observed only for Fe, Ni, and Pb. Nevertheless, neither of these two sets of elements showed any effect of FVs on their distribution with soil depth (Table 5). The only content of available Cu responded significantly to the FV × SL interaction (Figure 5). The key reason was its distribution with soil depth in NPK. Only, in this case, the Cu content decreased gradually from 8.5 mg·kg−1 in the topsoil to 3.1 mg·kg−1 in layer B. This means a decline from the high to the medium class of availability. For the remaining FVs, the content of available Cu was in the very high class and was stable throughout the soil profile (≈5.5 mg kg−1).
The highest Fe content was recorded in FM and the lowest in NPK + L. The difference between both variants reached one-third. The decrease in Fe content with soil depth took place only in layer C. In general, the Fe content was in the medium class. The content of Ni, like Fe, responded to the factors studied. The crucial factor was its extremely high content in NPK + L. For comparison, it was 2.5 times lower in NPK + FM. Subsoil layers were much poorer in available Ni. The content of Fe in the subsoil decreased significantly only in the C layer, while for Ni, it did so below the topsoil.
The content of bioavailable Pb decreased significantly with soil depth. The difference between the topsoil and the B layer was almost one-third. The same pattern, but not significant, was observed for Mn, Zn, and Cd. The average Mn content was slightly above 50 mg·kg−1, representing the medium availability class, which is sufficient for winter wheat (<50 mg·kg−1). Only in FM the content of available Zn was high throughout the soil profile. For AC and NPK, a drop to the medium class was recorded only in layer C. In the remaining FVs, the Zn content was on the border between the high and medium classes. For winter wheat, even the lowest Zn content was sufficient for optimal supply. The content of available Cu was generally in the high class, with differences with soil depth only for NPK. In the case of Cd, its highest content of 0.25 mg·kg−1 was below the threshold value of 0.27 mg·kg−1.
The criterion of variable loading on PCs over 0.70 was met for PC1, PC2, and PC3. The first two principal components (PCs) with an eigenvalue ≥1.0 accounted for 65.5% of the total variance in the data (Table 4, Figure A5). This value was much lower than that obtained in BF (Figure A4). PC1 was significantly correlated with six of the thirteen variables examined. On PC1, the highest negative loadings were recorded for Fe = Cd = Zn > Pb. The required criterion for PC2 was met for Sa, which was negative and for Si, Cl, Mn, and Ni, which were positive. On PC3, the required criterion was met only for EC. The eigenvectors for the examined variables were grouped on the first two PCA axes (Figure A5). The closest values to the absolute −1 on the PC1 axis were Zn and Pb, followed by Cu and Fe. The largest distances were found between Sa and Si and between Cl and humus.
Significant relationships between soil fertility characteristics and the elements examined were found only for Cd, which depended on EC, and Pb, which in turn depended on the Corg content (Table A2). There was no linear relationship between Corg and Mn. However, this dependence was consistent with the quadratic regression model (C = Corg):
M n = 0.03 C 2 + 1.65 C + 34.7   f o r   n = 15 , R 2 = 0.68 ,   p   0.05 .
This equation clearly explains why the Mn content increased to 56.5 mg·kg−1 under the condition that Corg reached 25.4 g·kg−1. This condition was met only in the topsoil layer for FM. Mn was significantly correlated with Zn and Pb (Table A2). The widest spectrum of significant relationships was observed for Fe, which correlated with Cu and especially strongly with Pb and Zn. Stepwise regressions fully supported the predicted worth of Fe, as shown in the following set of equations:
P b = 1.81 + 0.013 F e   f o r   n = 15 , R 2 = 0.72 ,   p   0.001
C d = 0.15 + 0.0004 F e   f o r   n = 15 , R 2 = 0.64 ,   p   0.001 .
It is worth emphasizing the strong relationship between Pb and Cd (r = 0.86***). At the same time, Pb was significantly correlated with Mn, Zn, and Cu, and Cd also with Cu (Table A2).

3.2.3. Winter Wheat Grown in Crop Rotation

Significant variability in the content of available nutrients and bioavailable heavy metals with soil depth in response to the long-term use of organic and mineral fertilizers was recorded for Zn, Ni, and Pb (Table 6). The content of available Zn, averaged over FVs, was in the high class in the soil layer of 0.0–0.6 m. It decreased to the medium class only in layer C. A much more complicated pattern of Zn distribution in the soil resulted from the analysis of the FV × SL interaction (Figure 6). In the entire studied soil profile, the highest Zn content (high class) was recorded in the AC variant. In the subsoil layers, it was only slightly lower compared to the topsoil. At the same time, the lowest Zn content was recorded in NPK, which decreased gradually and significantly with soil depth. In subsequent layers, it was 100%, 46%, and 25%, respectively. However, a decline from the high availability class to the medium class occurred just below the topsoil layer. Analogous trends were also observed in the NPK + FM and NPK + L variants. However, the decrease to the medium class only occurred in the C layer. A very specific distribution of Zn was observed in FM. Its content was found to be the lowest in the topsoil, but it was still in the high class. The differences between layers were small and basically negligible.
The content of bioavailable Ni averaged over FVs, differed only in the specific response in NPK + FM, as well as in the vertical distribution in the soil (Table 6; Figure 7). The Ni content in this particular FV was the highest and, at the same time, hardly differentiated between soil layers. However, the highest Ni content was found in layer C. Its content in the topsoil was more than twice as high as AC and almost three times higher than in FM. In these two FVs and in NPK, the significantly highest Ni content was found in layer B. This specific difference was particularly strong in AC and FM, in which it exceeded the content in the topsoil layer by 144% and 175%. The lowest content of Ni, and at the same time, poor differentiation between soil layers was noted in NPK + L.
The content of bioavailable Pb was significantly affected by the FV × SL interaction (Table 6). Its highest content in AC resulted from its uniform distribution in the entire soil profile (Figure 8). At the same time, its lowest content was recorded in FM, where a significant decrease occurred only in layer C. In mineral FVs, a regular decrease in Pb content with soil depth was observed. The strongest was found in NPK, where its content in subsequent soil layers was 100%, 60%, and 33%.
The content of available Fe decreased gradually with soil depth. Its content in layer C was only 52% of that recorded in the topsoil. Despite this variability and the effect of FVs, the Fe content was in the medium class (Table 6). The same tendency was observed for Cu, but the difference between layers was smaller, amounting to only 33%. The evaluation of FVs according to Cu availability classes was specific. For AC and FM, in the entire soil profile, it was in the high class. However, the decrease to the medium class for NPK + FM and NPL + L occurred only in layer C, and for NPK it was already visible in layer B. The content of available Mn was, averaged over studied factors, in the medium class. A decrease in depth was only observed in FVs with NPK.
The content of Cd was poorly differentiated by FVs. The key factor affecting its distribution was soil depth. It decreased gradually with soil depth, amounting in the C layer to only two-thirds of its content in the topsoil. In the case of Mn, no response to the tested factors was found. Despite the observed variability in the Fe content, it was in the medium availability class. The same applies to Mn but not to Cu. Its content in the soil layer up to a depth of 0.6 m was in the high class. The content of Cd did not exceed the critical threshold of 0.27 mg·kg−1.
The first two principal components (PCs) with an eigenvalue ≥1.0 accounted for 78% of the total variance in the data (Table 4). This value was much higher than that obtained for winter wheat grown in monoculture. PC1 was significantly correlated with eight of the thirteen variables. The highest, and negative, loadings were recorded for Zn = Cd ≥ Pb > Fe > H. The required criterion for PC2 was reached for EC and Si, which were positive, and for Sa, which was negative. On PC3, only Ni met the required criterion and had a negative loading. The eigenvectors for the examined variables were grouped on the first two PCA axes (Figure A6). The closest values to absolute −1 on the PC1 axis were H, Pb, and Fe, followed by Cd and Pb. The largest distances were found between Si and HSI and Sa and Cl.
The content of Corg significantly determined the content of all elements examined, with the exception of Ni (Table A3). Its relationship with Fe was consistent with a quadratic regression model (C = Corg):
F e = 0.94 C 2 + 34.5 C + 59.2   f o r   n = 15 , R 2 = 0.7 ,   p   0.05
The obtained regression model indicates that the content of available Fe increased to 257.3 mg kg−1 when Corg reached 18.2 g kg−1. These conditions were met in all soil layers, with the exception of the topsoil for FM, NPK + FM, and NPK + L. In this layer, an increase in the Corg content led to a decrease in the available Fe content. The strongest dependency (linear) between Corg and the elements studied was recorded for Zn (r = 0.76**).
The content of bioavailable heavy metals was determined by a different set of the studied soil characteristics. The content of Ni, determined on the basis of a stepwise regression model, showed a dependence on EC, but the strength of this relationship was low:
N i = 3.35 + 0.0055 E C   f o r   n = 15 , R 2 = 0.29 ,   p   0.05 .
Regression models for Pb and Cd were determined using the same statistical procedure. They are as follows:
P b = 0.66 + 0.02 F e   f o r   n = 15 , R 2 = 0.78 ,   p   0.001
C d = 0.12 + 0.01 Z n   f o r   n = 15 ,   R 2 = 0.74 ,   p   0.001 .
Referring to these two equations, attention should be paid to the strong relationship of Fe and Zn and the significant relationships of Pb and Cd with the other micronutrients examined (Table A3).

4. Discussion

4.1. Soil Fertility Status—Indicators of Soil Fertility Sustainability

The general state of soil fertility in a long-term field experiment, after 75 years of extremely different SUSs, was determined on the basis of four indicators, namely the soil texture, electrical conductivity (EC), soil reaction (pH), and organic carbon content (Corg, humus). It has been assumed that EC, as related to the concentration of nutrients in the soil solution, should reflect the long-term difference in the application of organic and mineral fertilizers [39]. However, the conducted study did not show any significant differences in this soil characteristic in response to the tested FVs. It turned out to be a significant predicator of Ni content, but only in WW-CR. However, the level of prediction was low.
The long-term experiment on which the present study was conducted in the 75th year was established on a soil classified as Luvisol. This type of soil covers 45% of Poland’s area [40]. In humid climates, fine soil particles (silt, clay), along with humus and Fe and Mn oxides, are transported down the soil profile. In consequence, the topsoil layers (eluvial horizons A and E) are subject to the depletion of these components, and at the same time, the deep soil layers are enriched with them (illuvial horizon, Bt) [41]. Eluviation/illuviation processes are considered to degrade soil fertility [
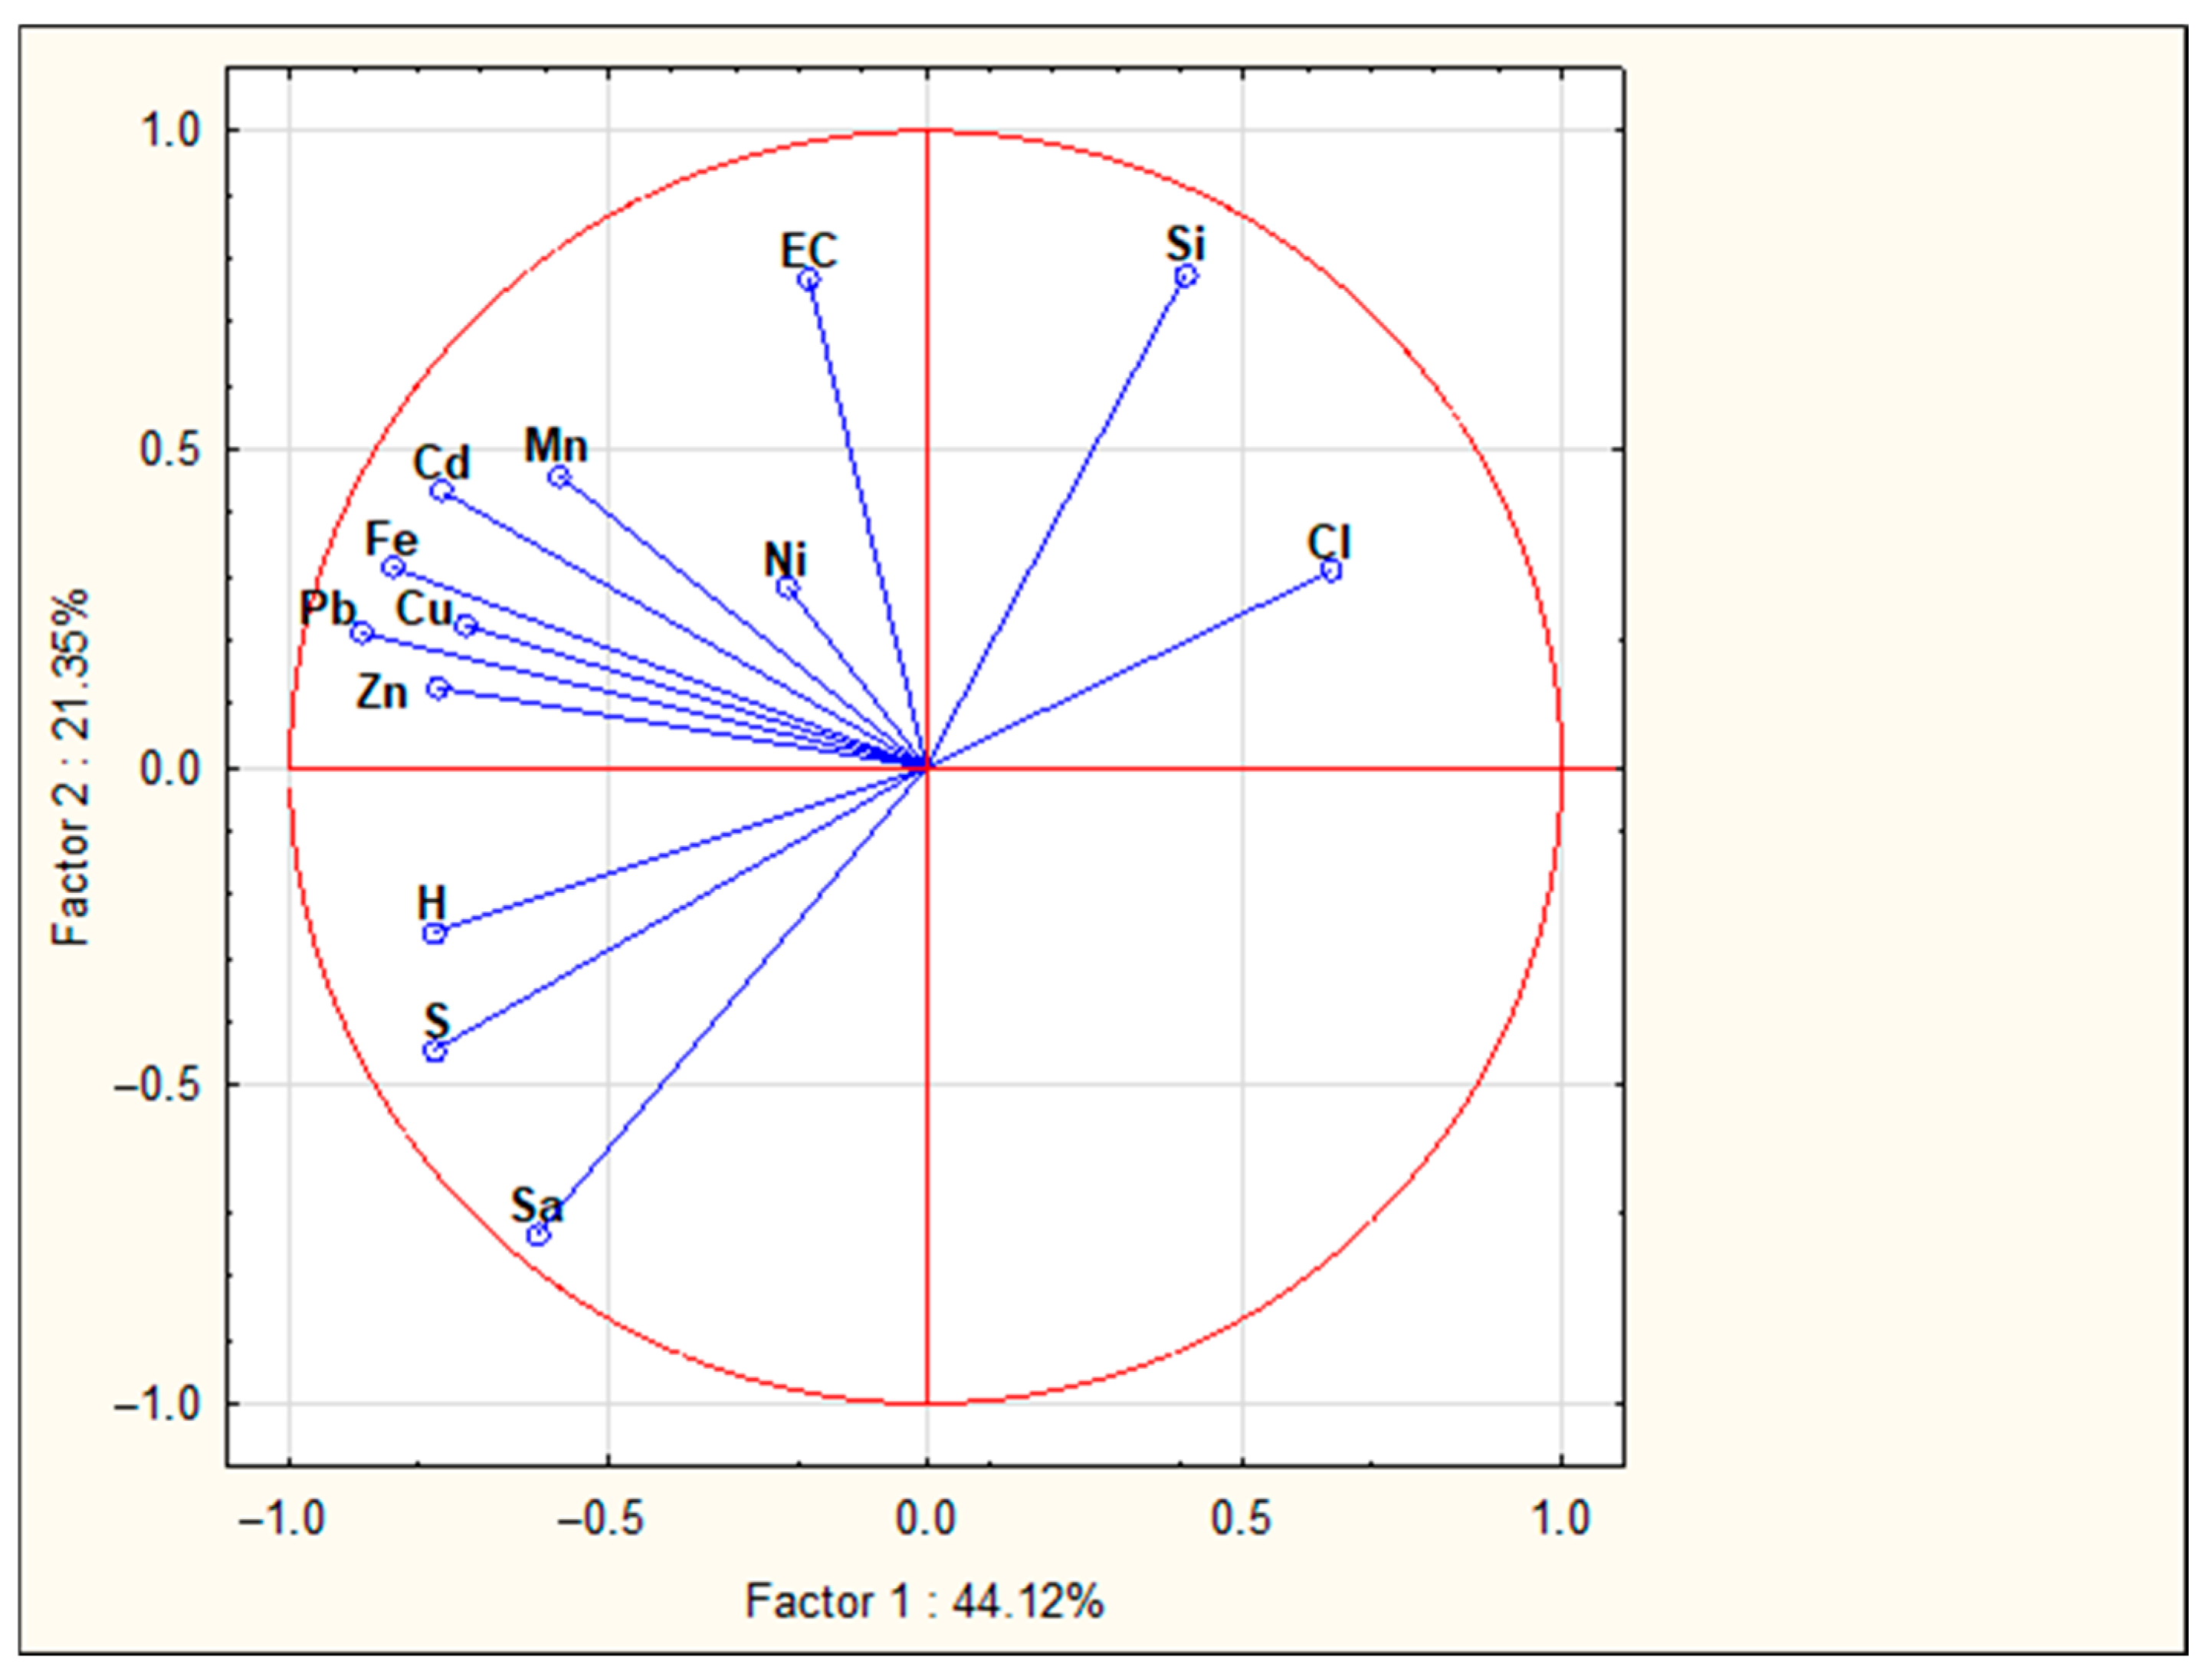
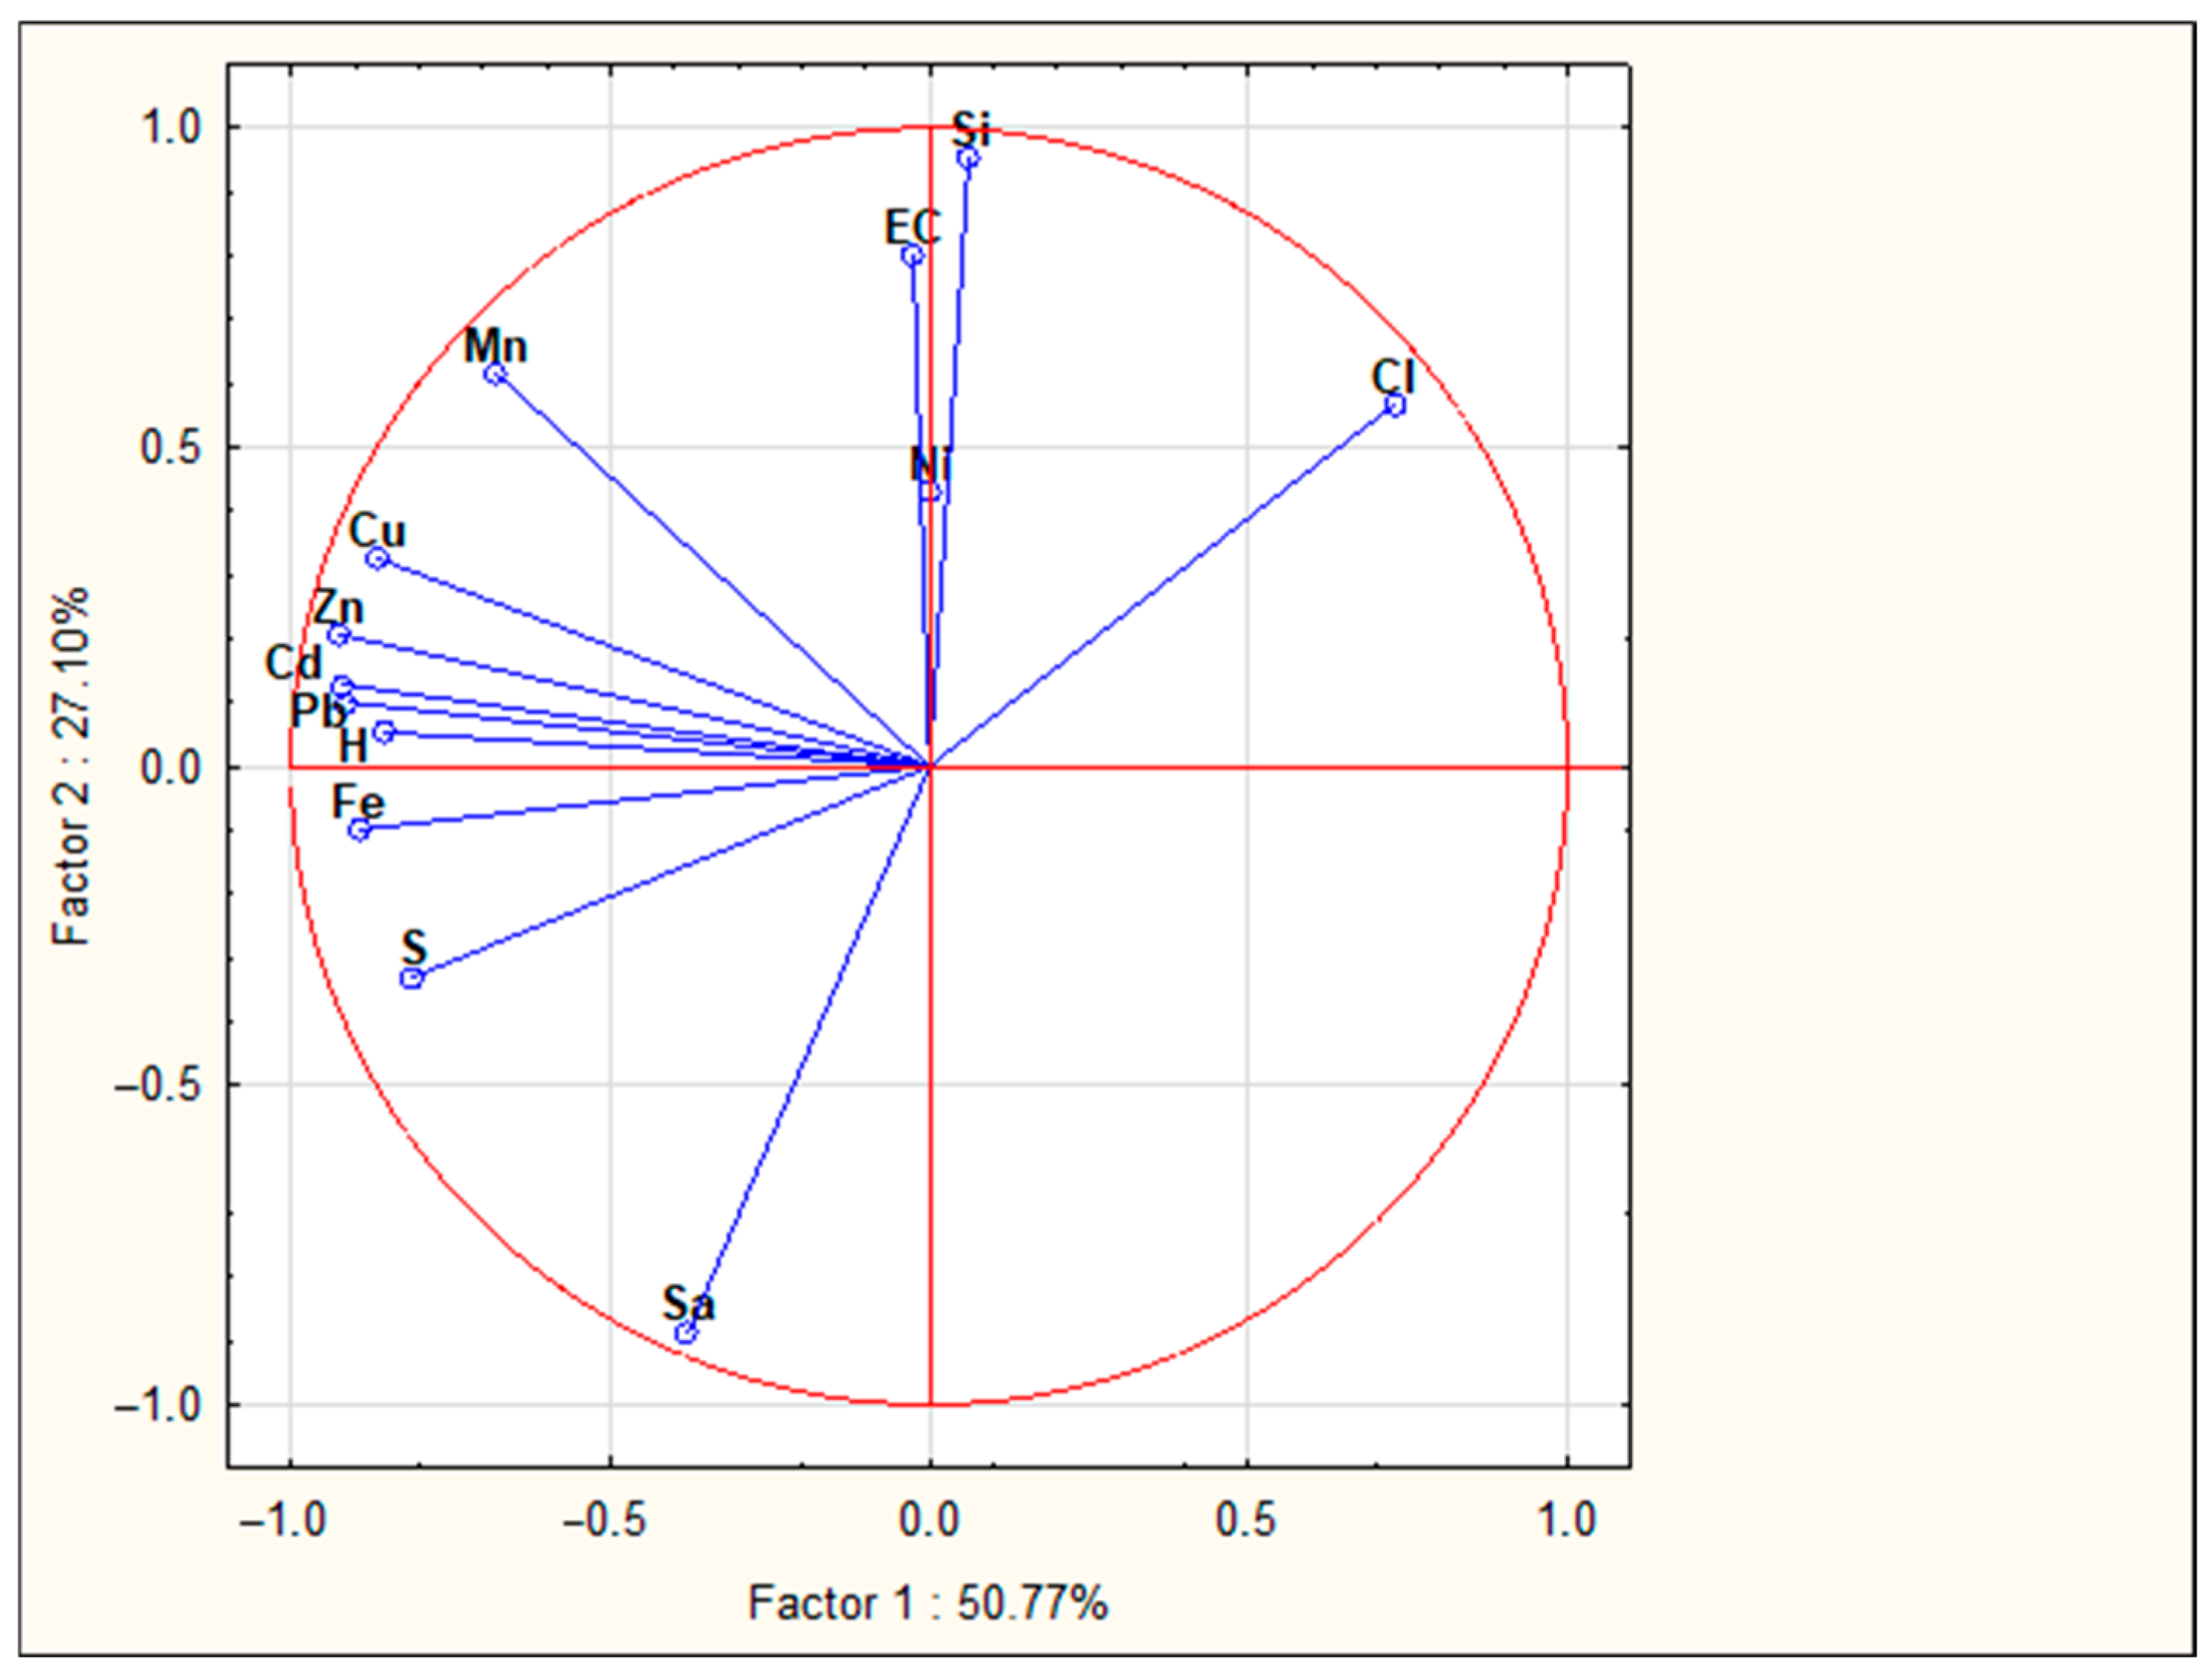
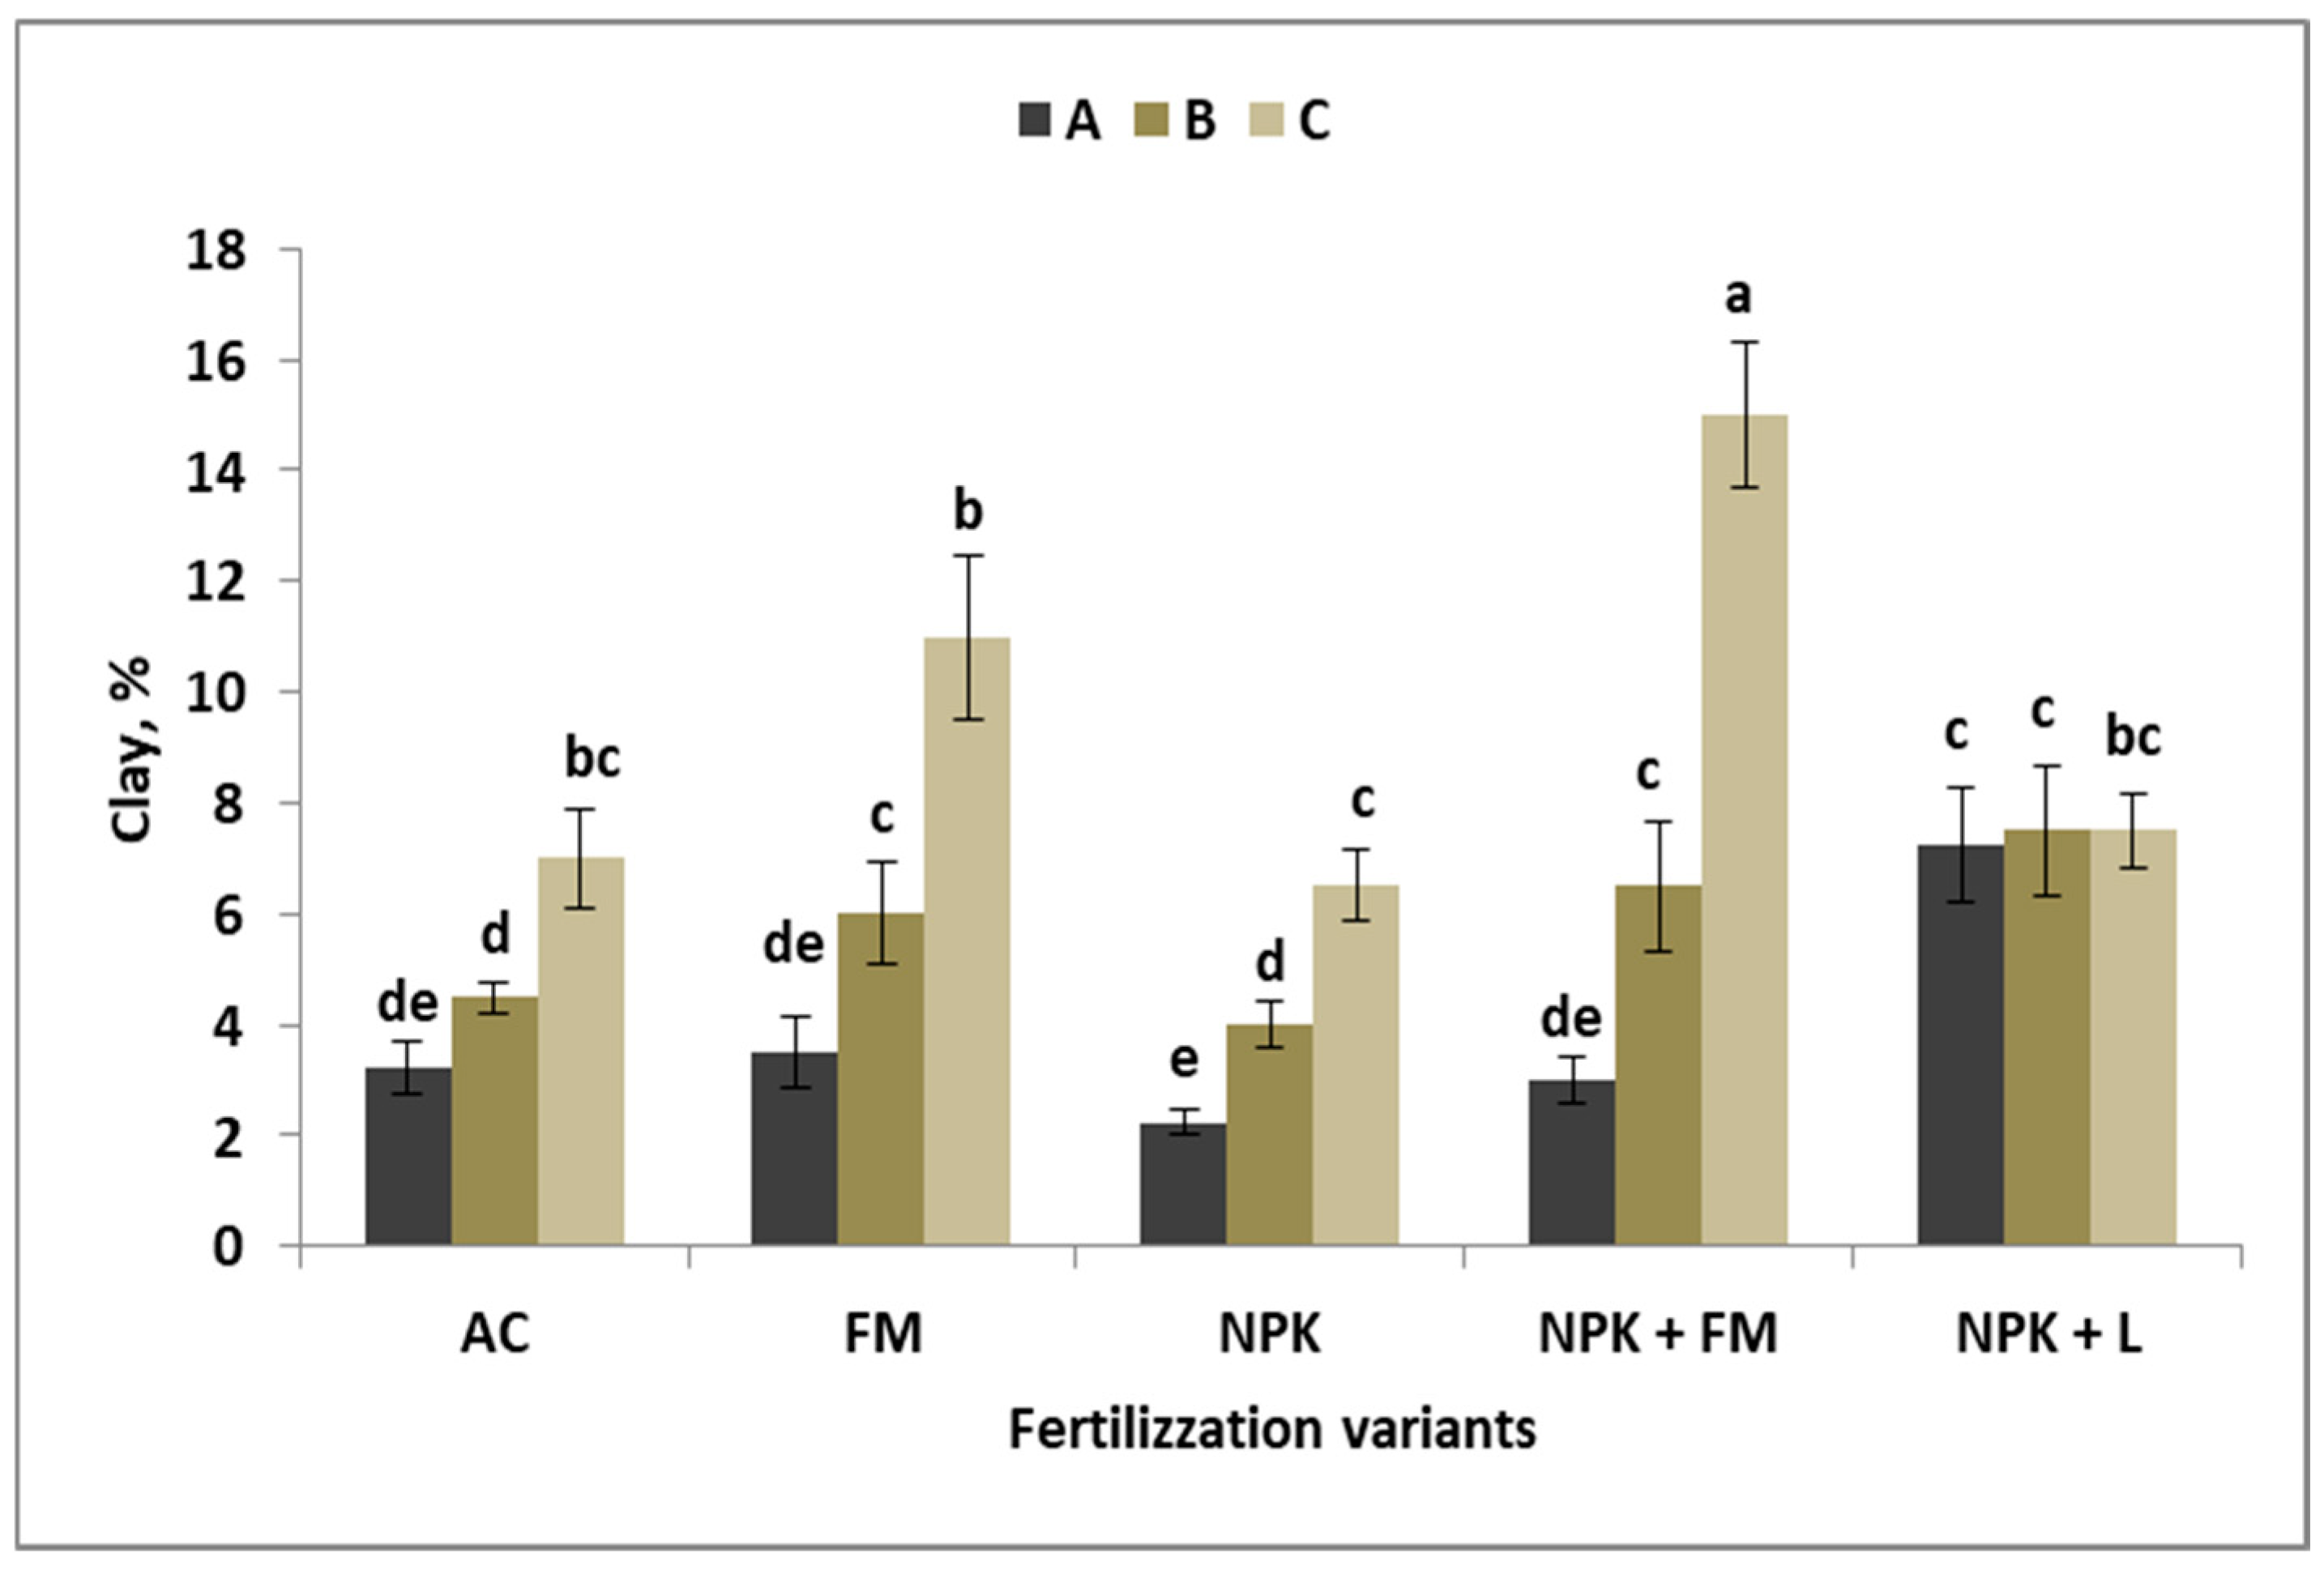
42]. The consequences of these processes were clearly noted in the experiment, regardless of the SUS. The observed changes in the soil profile included basic granulometric fractions. The increase in sand content, which dominated, had a greater impact on silt than on the clay content. The value of R2 (coefficient of determination) in BF was 0.95 and 0.43 for Si and Cl, respectively. In WW-MO, it was 0.79 and 0.47, respectively. A significantly different tendency was observed in WW-CR, where the respective R2 values were 0.86 and 0.72. The downward trend in Cl distribution with soil depth was strongest for NPK + FM (CV = 76%). Only a weak trend was found for FM (CV = 56%). In contrast to the effect of manure, a stable and high clay content in the entire soil profile was recorded in NPK + L with 1.0 t CaO·ha−1 applied annually. A similar stabilization action of lime was observed in WW-MO. The extreme impact of both FVs on the clay vertical distribution can be explained by the role of cations incorporated into the soil in applied fertilizers and their products (mineralization of manure and crop residues) on the charge of silicate clay colloids. Continuous application of Ca2+ increases the aggregation of clay colloids, which in turn increases their stability and consequently prevents downward movement. The effect of manure (mineralization), in interaction with alfalfa, whose roots acidify the rhizosphere, is the opposite, ultimately leading to the disintegration of colloid aggregates and facilitating their transport in the soil profile [43]. Lime therefore plays a stabilizing role in the clay content of the topsoil in Luvisol, preventing its degradation. It can therefore be considered an agronomic measure responsible for the sustainability of soil fertility. However, there was no significant effect of soil mineral fractions, regardless of the soil use system or fertilization variants, on the content of the studied elements.
Soil reaction is a key indicator of soil fertility, as it is considered to be sensitive to the SUS and fertilizers applied [44]. The expected differences were observed, but they were not large. The long-term SUS had a moderate impact on soil pH, which increased in the order BF (6.1) < WW-MO (6.4) < WW-CR (6.6). The obtained series confirm the role of crop rotation in maintaining the sustainability of soil fertility. The obtained order emphasizes the role of the grown plants, or more specifically, organic residues, on the cation balance [20,45]. Generally, there was a slight increase in pH with soil depth, regardless of the other factors studied. A significant effect of applied fertilizers on soil pH was found for BF and WW-MO. In both cases, the lowest pH of approximately 6.0 was recorded in the FM variant. The difference between FM and NPK variants indirectly indicates the buffering role of nutrients introduced with mineral fertilizers. This conclusion is confirmed by the higher pH values in NPK than in NPK + L, where 1.0 t CaO·ha−1 was applied annually. The relationship between pH and the contents of the micronutrients tested was, as a rule, negative, and they were significant only in BF. This is a natural, geochemical phenomenon that has also been documented in long-term experiments [46,47]. The most important fact, however, is that these negative relationships included heavy metals. However, it is more difficult to explain the negative effect of pH on the Corg content (C), proven in BF. The obtained relationship is presented below:
C = 11.9 p H + 79.5   f o r   n = 15 , R 2 = 0.52 , p 0.01
The obtained trend results from two natural geochemical phenomena: In mineral soils, the Corg content decreases, while the pH increases with soil depth [48].
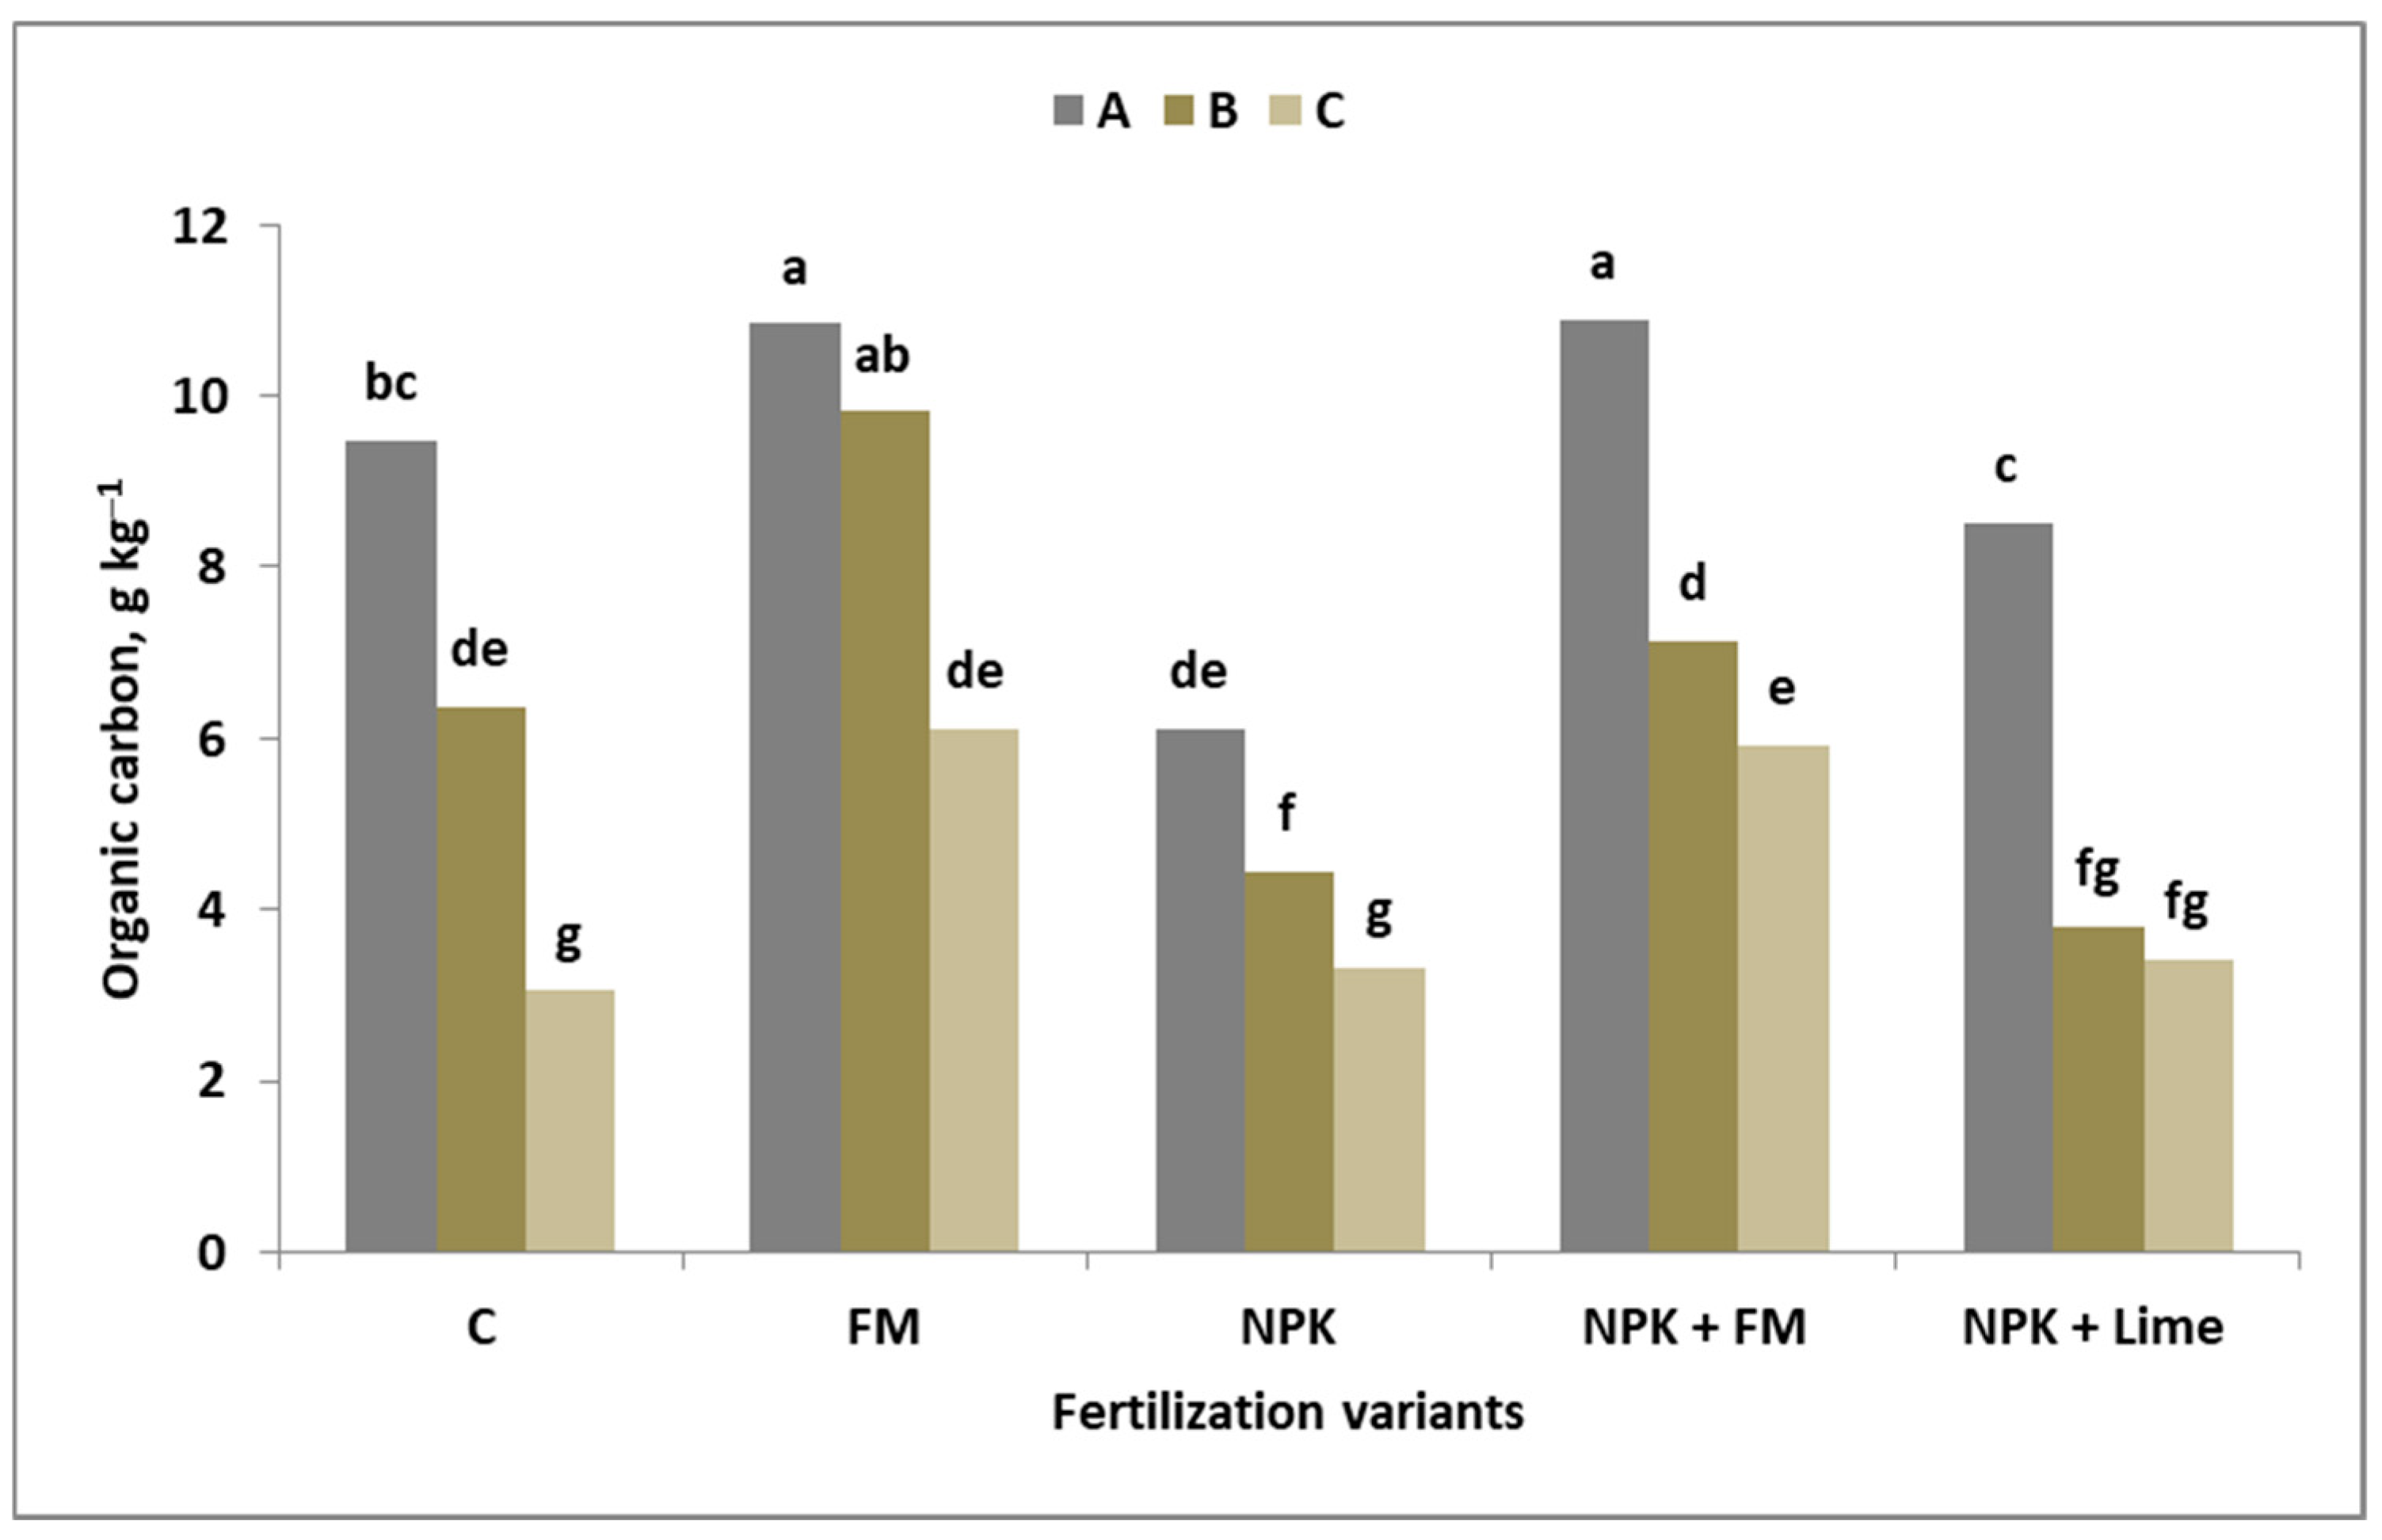
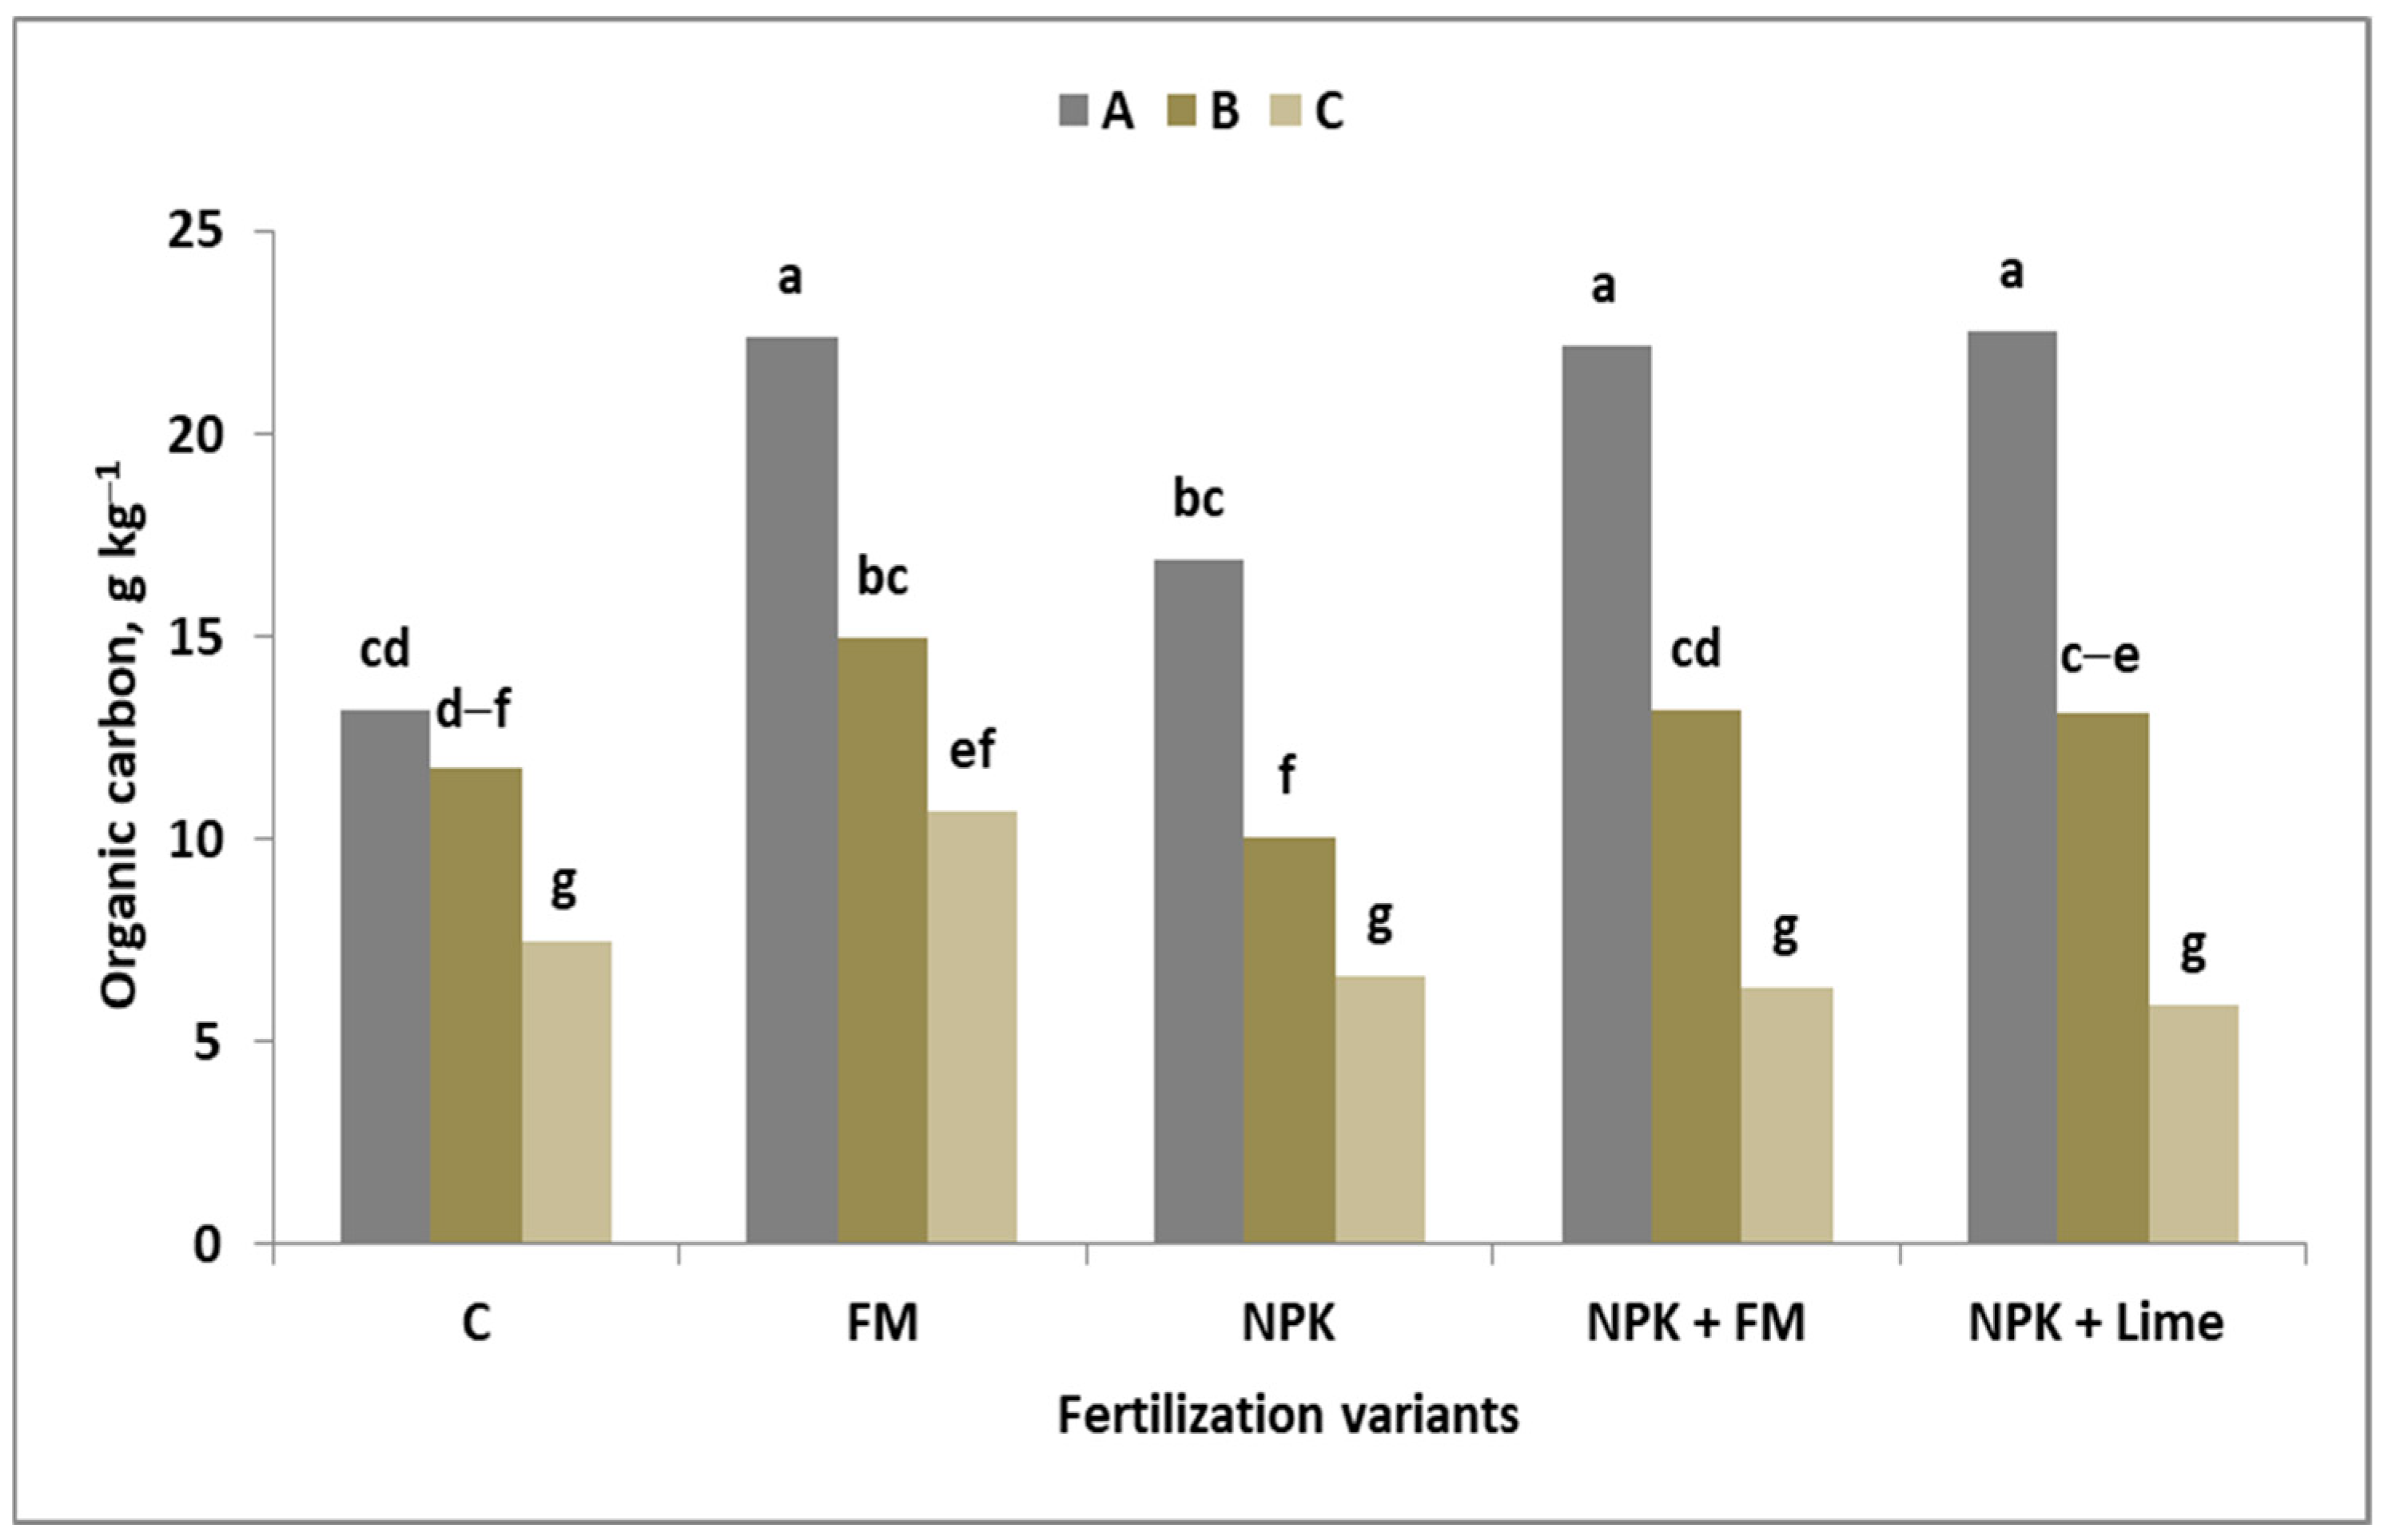
The content of the tested elements in the studied soil was determined by the humus content. Soil organic matter is a crucial indicator of soil fertility in mineral soils [49]. There are different indices for soil organic matter status evaluation. The most frequently used is the content of Corg (humus) in the topsoil layer. The status of this characteristic can be assessed using standardized ranges. The most objective evaluation, reflecting the variability in Corg content, was obtained by applying local (national) ranges [50]. The main limitation of an objective, realistic evaluation of soil fertility is the threshold range, which relates only to the topsoil layer. Without taking the subsoil into account, the assessment of the current state of soil fertility is incomplete [51,52]. Moreover, the analysis of the level of soil saturation with humus, without taking into account the soil texture, leads to erroneous conclusions [53]. In this study, a reliable assessment of the humus content, taking into account the soil texture in subsequent soil layers, was carried out based on the Humus Stability Index (HSI) [
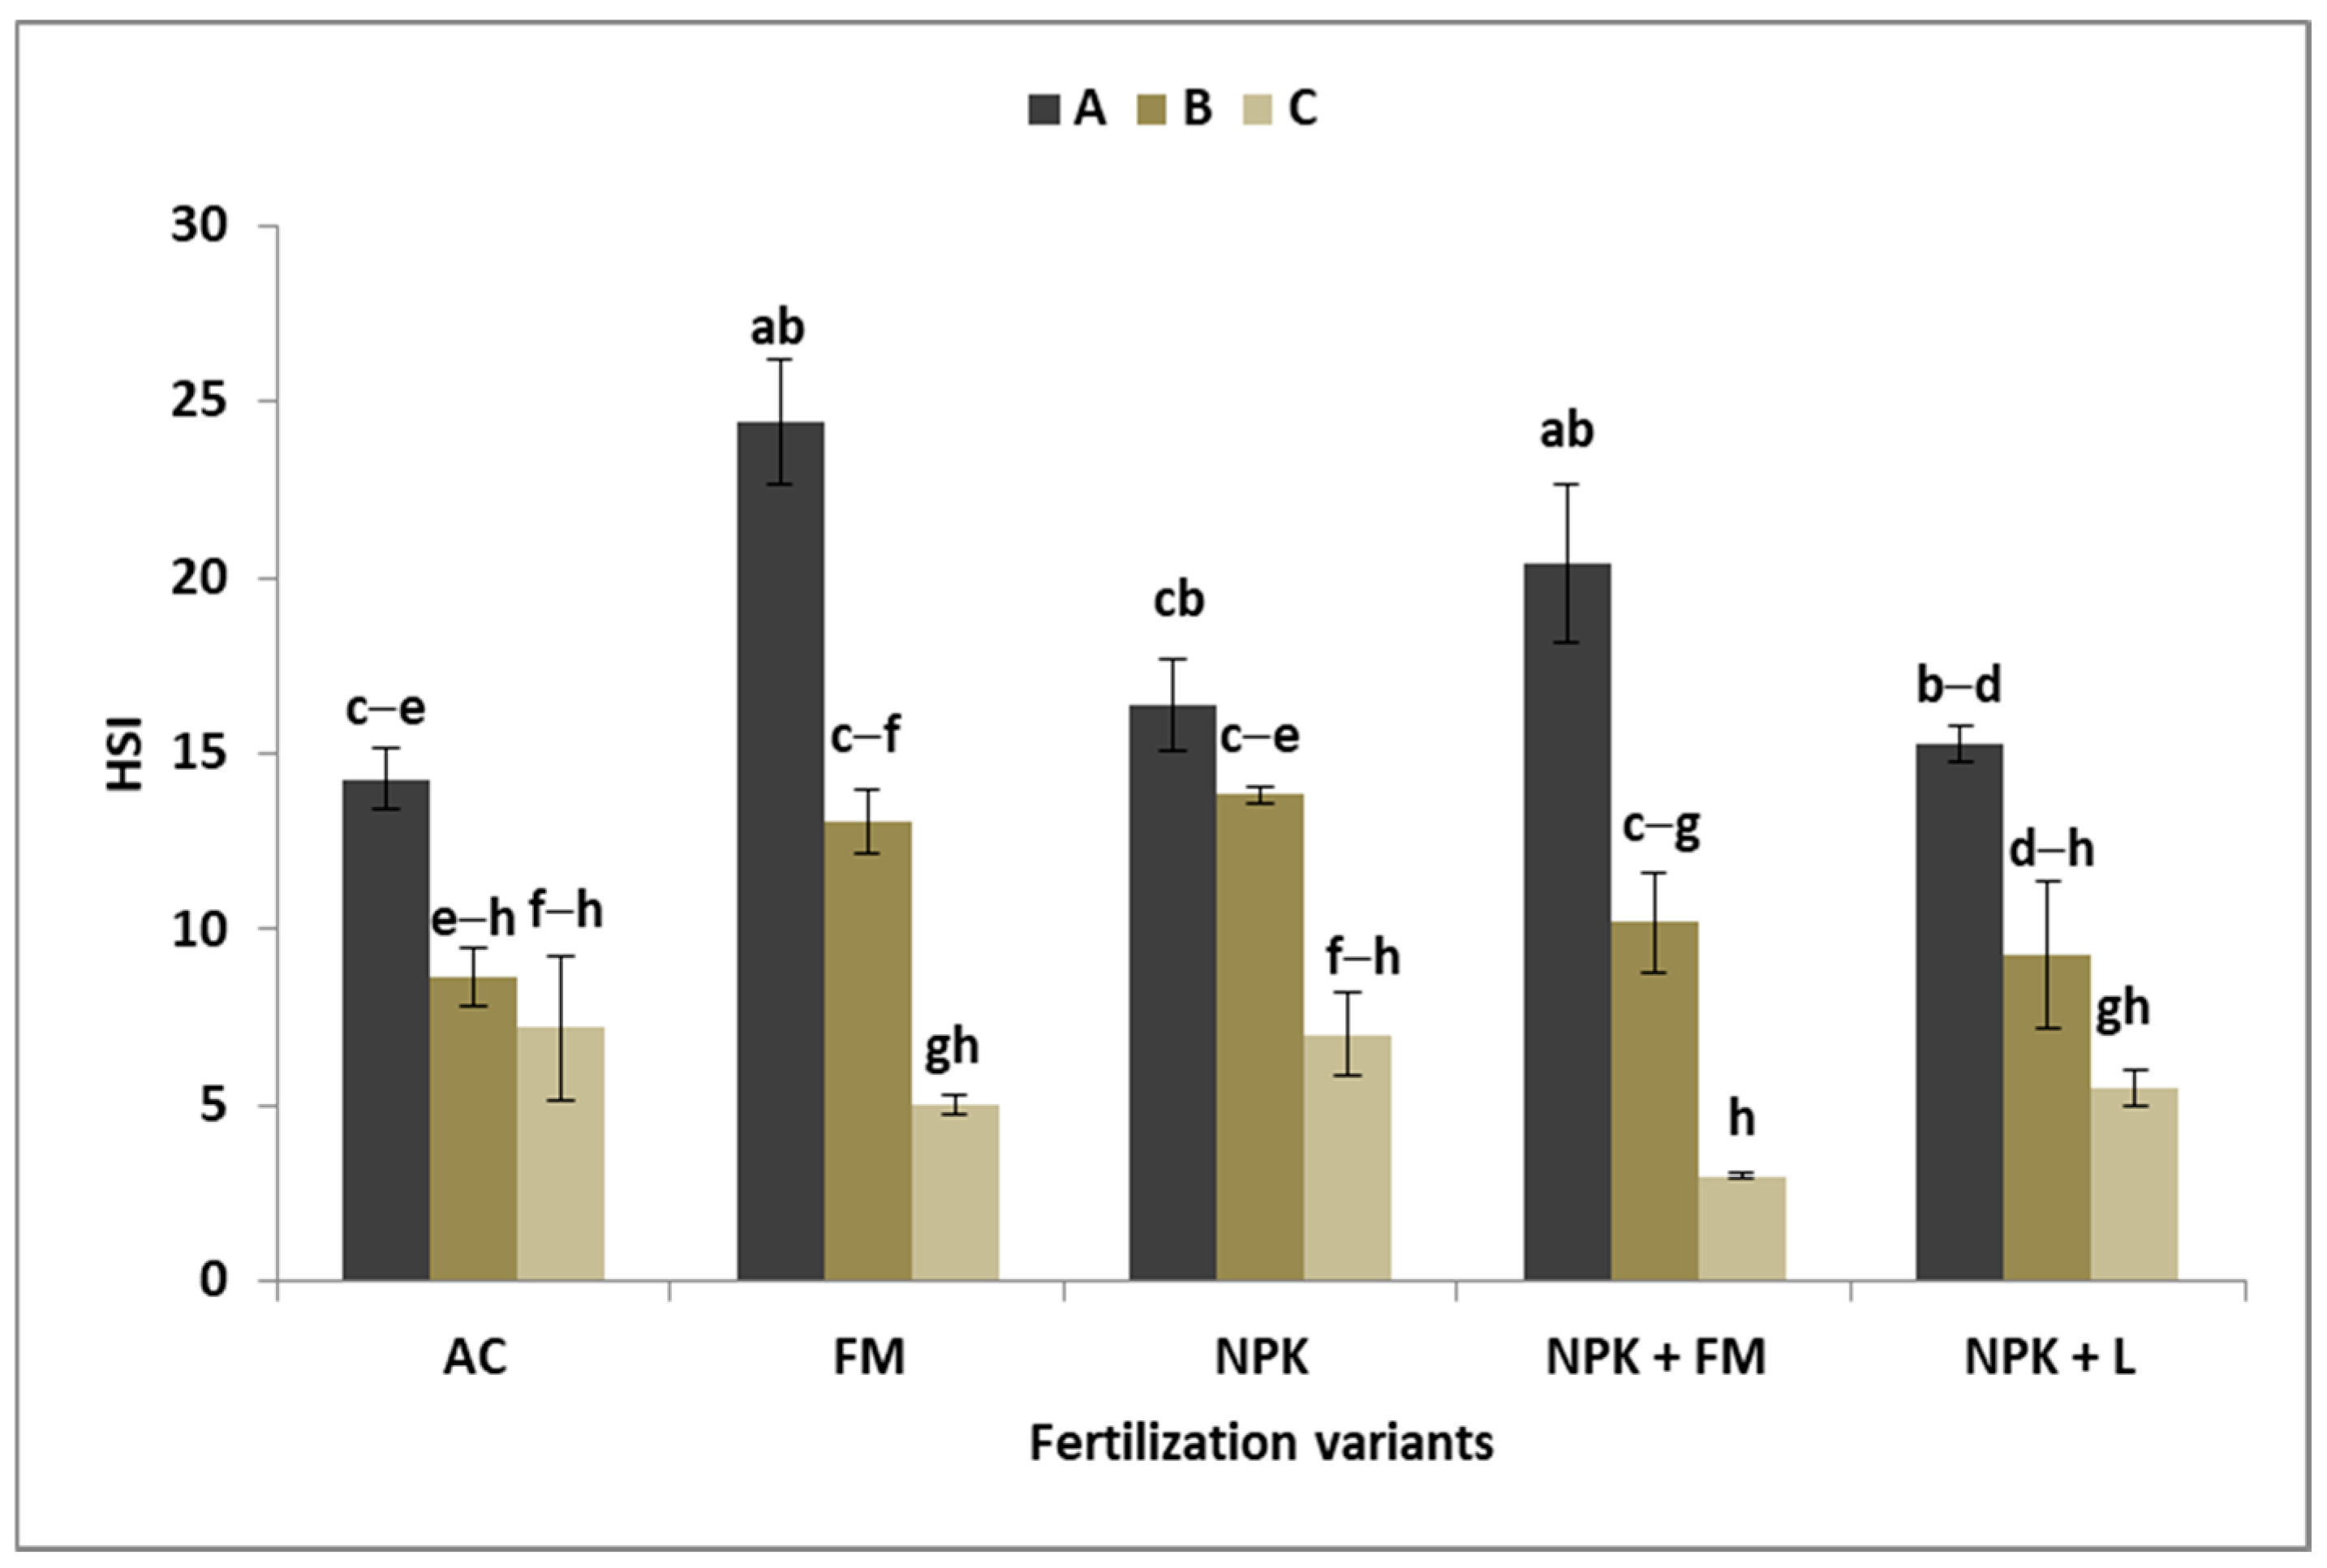
38]. The HSI values for the examined FVs amounted to 8 ± 2 on average for BF. NPK had the lowest index of the entire studied soil profile, thus indicating a high risk of soil degradation. In the topsoil of this variant, the Corg degradation compared to FM reached 42%. This phenomenon also occurred in the subsoil layers of the AC and NPK + L variants. Therefore, fallowing arable soil, even for several years, is not an optimal solution for sustaining soil fertility and therefore for sustainable food production. It leads to a drastic drop in yield [54]. In winter wheat grown in monoculture, the average HSI was 13 ± 4.2, whereas in crop rotation, this index reached 15 ± 3. In both cases, the soil was in a state of humus saturation in the entire soil profile. It can therefore be concluded that the Corg content in the topsoil of 10.5–11 g·kg−1 was sufficient to reach the humus saturation status. The required range of Corg content in layer B was 7.5–8.5 g·kg−1; in C, it was 5–6 g·kg−1. This natural level of humus content was maintained by applying farmyard manure in the BF each year. The amount of dry matter introduced to the soil by manure was 4.2 t·ha−1. In the case of winter wheat, in monoculture and crop rotation, the required humus threshold content was exceeded solely on the basis of the harvest residues left in the NPK variant. No decline in carbon stock was observed in cropped soil, as found in other long-term experiments [55]. It is important to emphasize that this assessment was based on soil texture and not on the initial Corg content. The low requirement for organic matter to maintain an appropriate humus content results from the potentially low degradability of crop residues. This is due to both the larger amount of lignin introduced with crop residues and the smaller amount of nitrogen introduced [56]. However, the examined soil, compared to the standardized European Luvisol, contains approximately 75% of the humus stock in the soil layer 1.0 m deep [57].

4.2. Micronutrients—Indicators of Soil Sustainability

How the content of the examined nutrients changes with soil depth in response to the SUS and long-term constant application of fertilizers is a question that needs to be addressed. First of all, though, the downward trend in Corg content should be assessed. It is well documented that humus is both the key soil component (pool) and a factor determining the availability of micronutrients to crop plants [48]. The order of steepness of Corg decreasing with soil depth was MO ≥ CR > BF. It is worth knowing that its content in the topsoil layer of cropped soils was twice that in BF. These differences, despite a lower Corg content, remained in the subsoil. The greater humus accumulation in the topsoil resulted from the systematic input of organic matter from crop residues, while in BF, the only source of fresh organic matter in two of five variants was manure [56].
The key factor in the observed variability in the content of available micronutrients was iron (Fe). Its average content in the entire soil profile was in the medium availability class and decreased in the order BF (239 ± 109 mg·kg−1) ≥ WW-MO (217 ± 58) ≥ WW-CR (203 ± 62 mg·kg−1). As a rule, it showed a decreasing trend with soil depth. At the same time, the stability of Corg-Fe associations decreased in the following order: BF (Linear, R2 = 0.66) > WW-CR (Quadratic, R2 = 0.62) > WW-MO (L, ns.). The strongest dependency between both soil characteristics was found in the non-cropped soil. The binding strength of the Corg–Fe soil complexes generally increases in the range of 0–20 g C·kg−1, becoming stronger when the pH decreases below the pH range, called a “window of opportunity” [58,59]. The first condition was fully met in BF. In the WW monoculture, this did not apply to the topsoil in FM, NPK + FM, and NPK + L. Excluding these analytical units (soil layers) caused the Corg × Fe relationship to become significant (L, R2 = 0.58). In WW-CR, the exclusion of the same set of units resulted in the linearity of the discussed relationship (L, R2 = 0.66). This short analysis fully confirms the opinion of Ye et al. [58]. The second aspect concerns the geochemical reasons determining the strength of the Corg–Fe complex. The key factor is the mineralogical status of Fe compounds in the soil, which strongly depends on the soil pH [60]. In the studied case, the soil pH was just below the lower range of the transition range (or “window of opportunity”) of 6.3–7.0 pH [59]. In this pH range, Fe oxides have a positive charge that is greater the lower the degree of crystallinity is [61,62]. Hence, the content of available Fe was higher in BF and lower in the subsoil layers and topsoil layers in MO and CR objects with FM and/or lime. The content of available Fe in the soil can therefore be treated as an indicator of soil fertility instability.
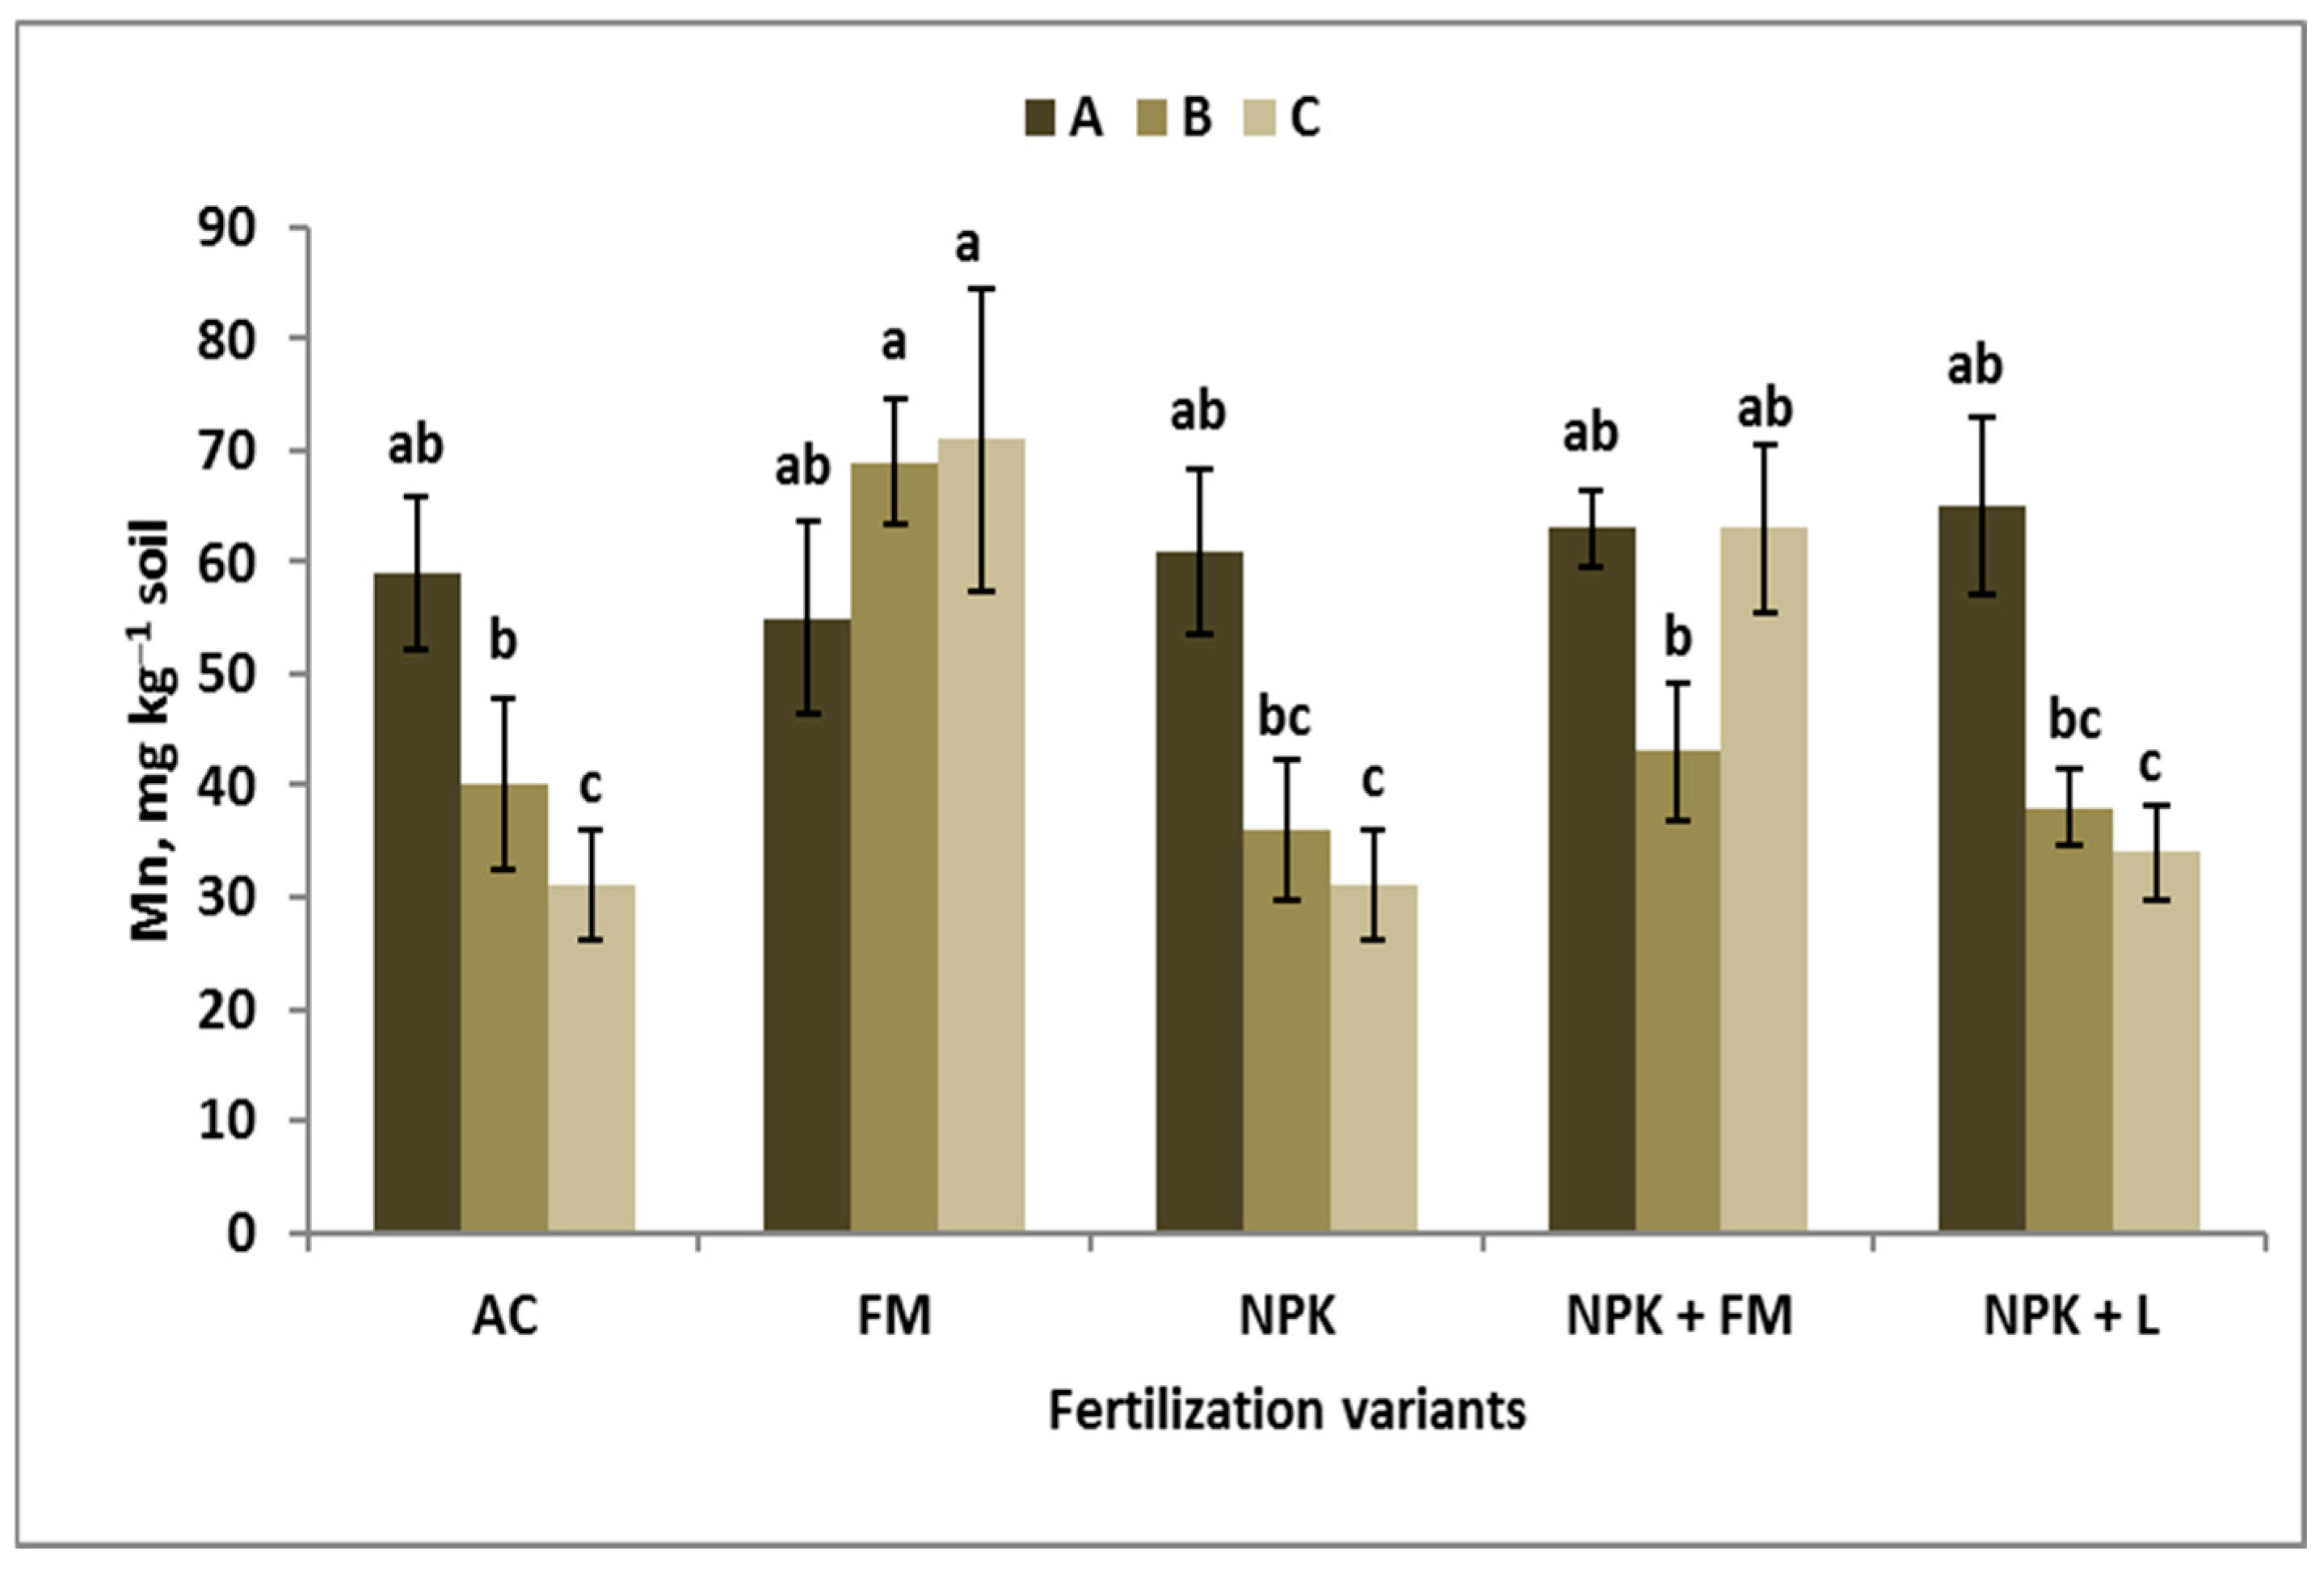
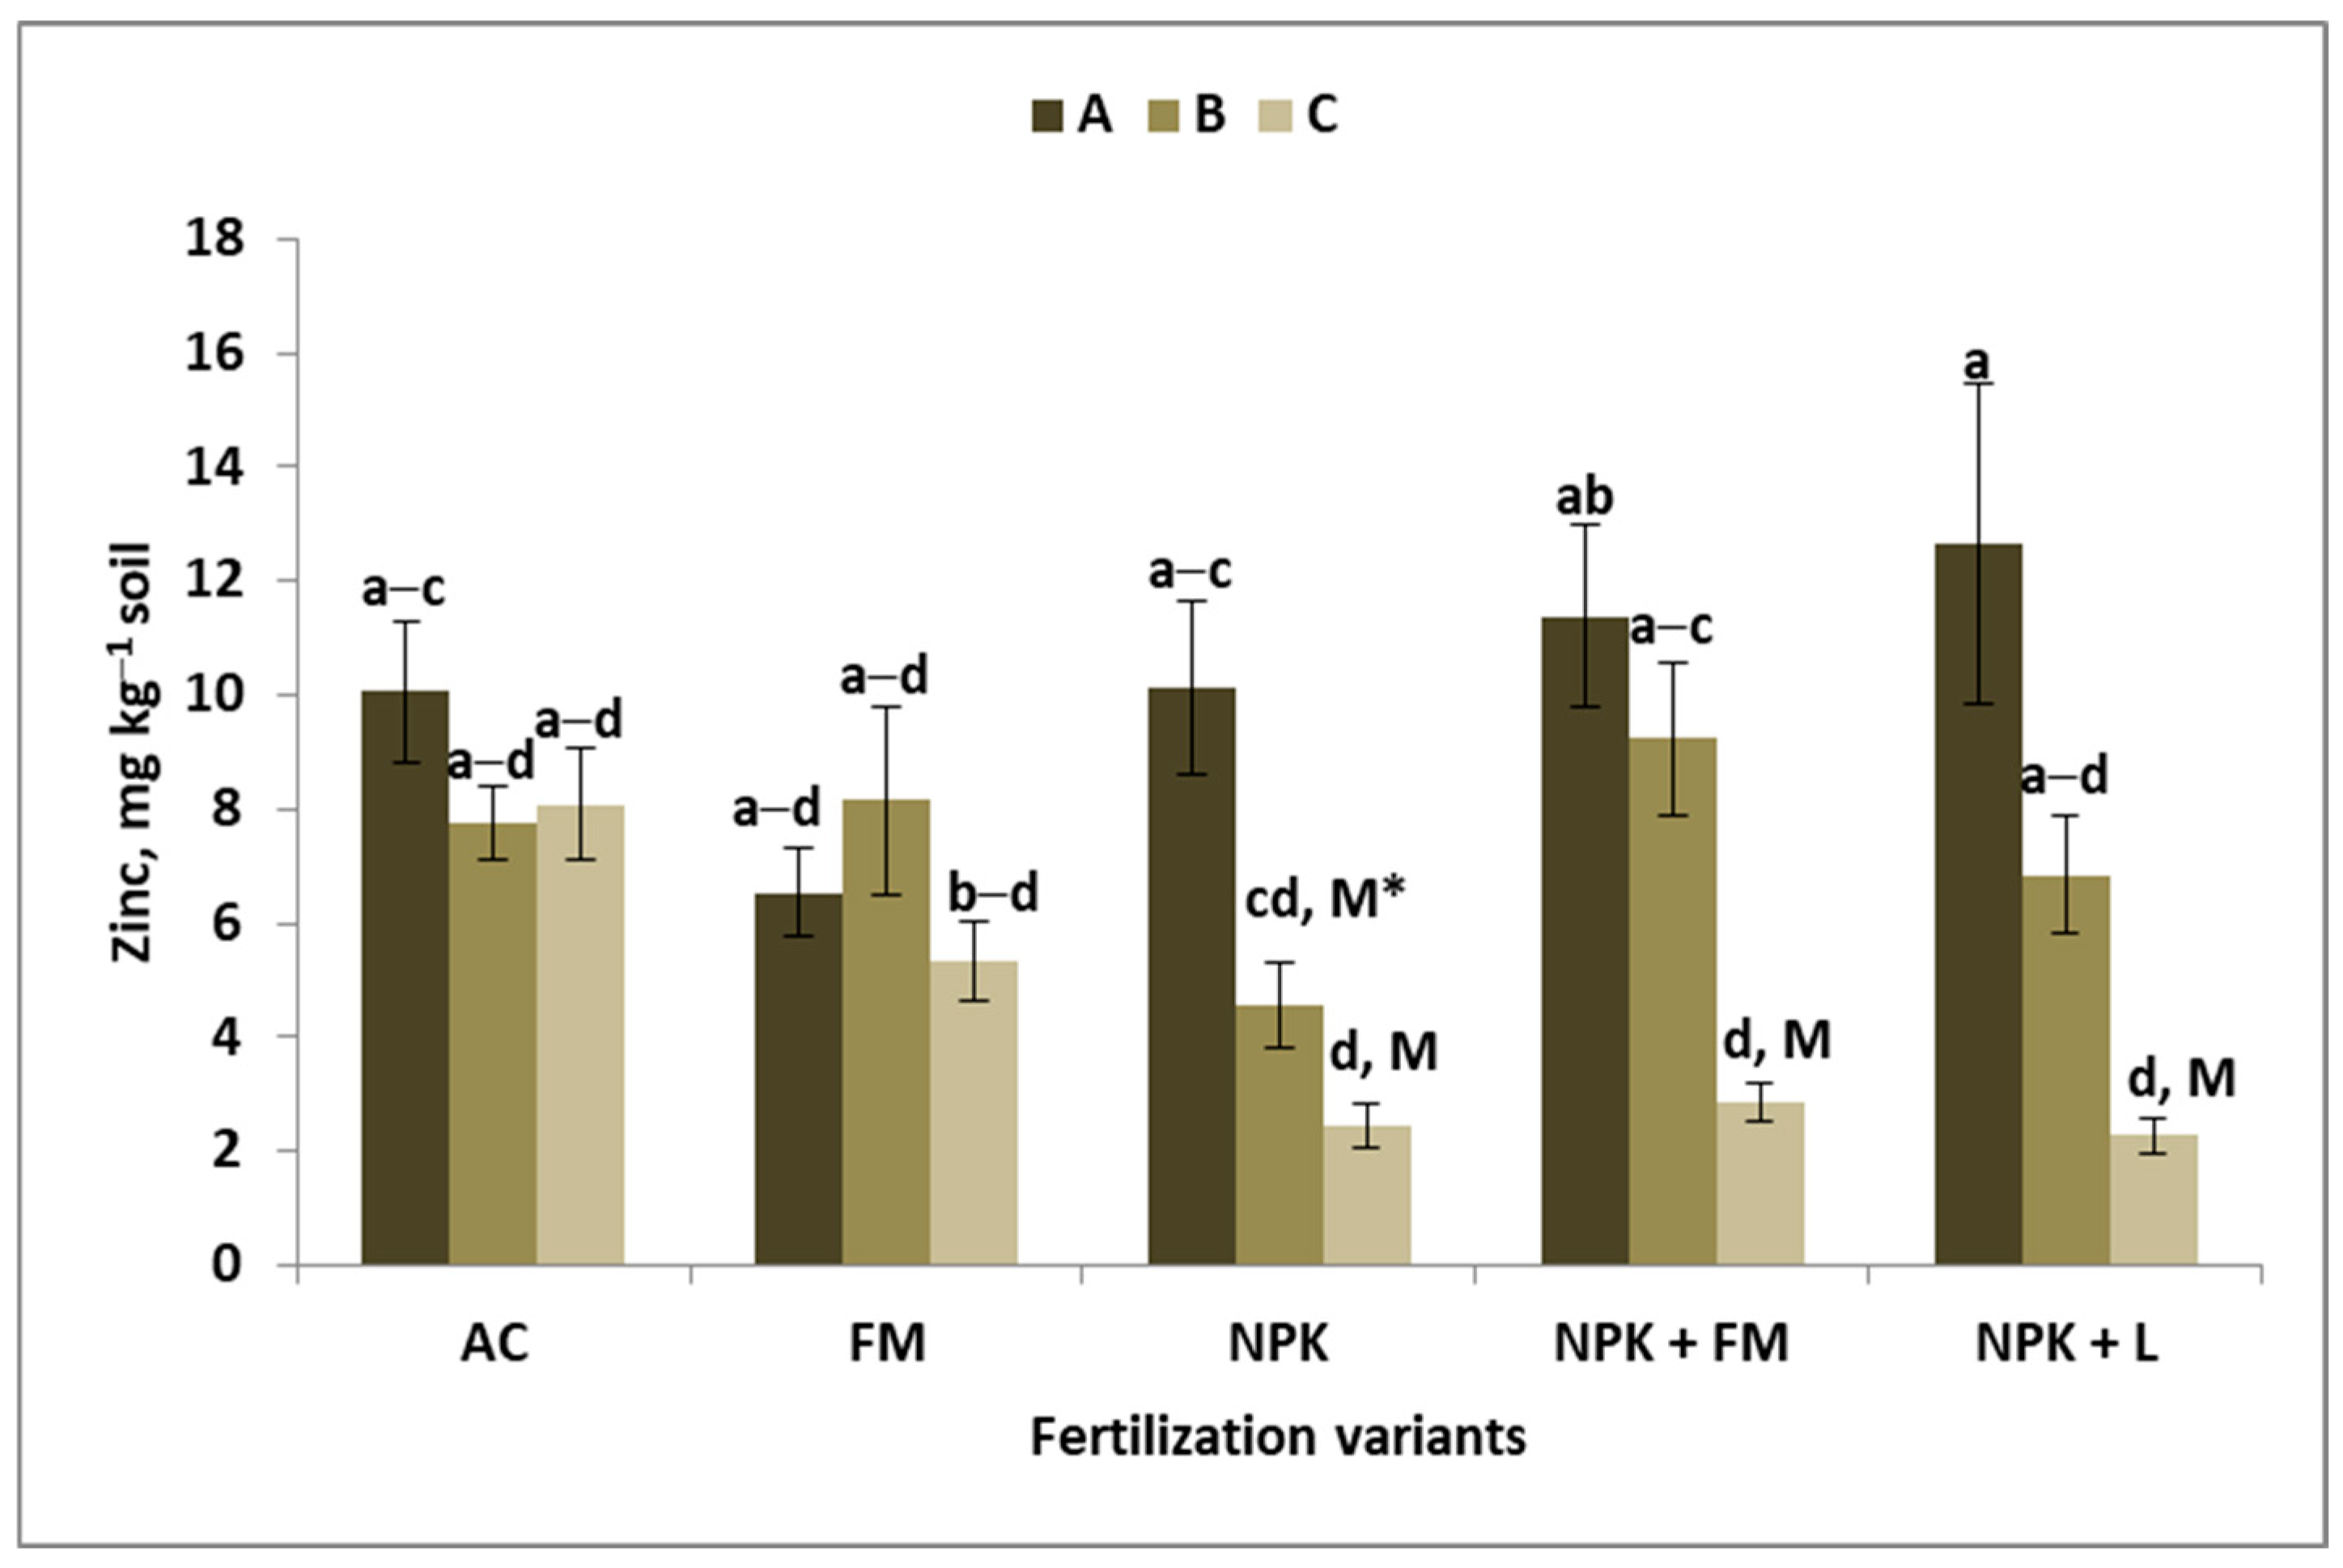
The content of available Mn in the soil, regardless of FVs and soil layer, was in the medium class. The obtained trend was as follows: WW-CR (69 ± 9) > WW-MO (51 ± 7) = BF (51 ± 15 mg·kg−1). For Zn, the trend was similar: WW-CR (7.2 ± 3.2) > WW-MO (5.7 ± 1.4) ≥ BF (5.4 ± 2.2 mg kg−1). At the same time, the values of the coefficient of variation were 45%, 25%, and 40%, respectively. These two series confirm the role of crop rotation in maintaining the sustainability of soil fertility. In WW-CR, the drop to the medium class occurred only in layer C, and in BF already in the entire subsoil. The obtained order resulted from two facts. First, the forecrop for WW grown in crop rotation was alfalfa. Secondly, the mass of crop residues per 1 kg of N in the soil/crop system was lower than in the WW monoculture [56]. In the case of Mn and Zn, the downward trends coincided with the content of humus, which was the highest in CR. In subsoil with winter wheat, the Corg content was lower, and at the same time, the pH was higher. The coincidence of these two soil characteristics resulted in a decrease in the content of micronutrients while being in line with the amount of Corg. The obtained results confirm studies that showed that the resources and availability of Zn in Polish soil are critical for winter wheat [63]. The latest research has shown that, for the formation of the yield structure of winter wheat, which yields at a very high level, Zn is a critical factor [64,
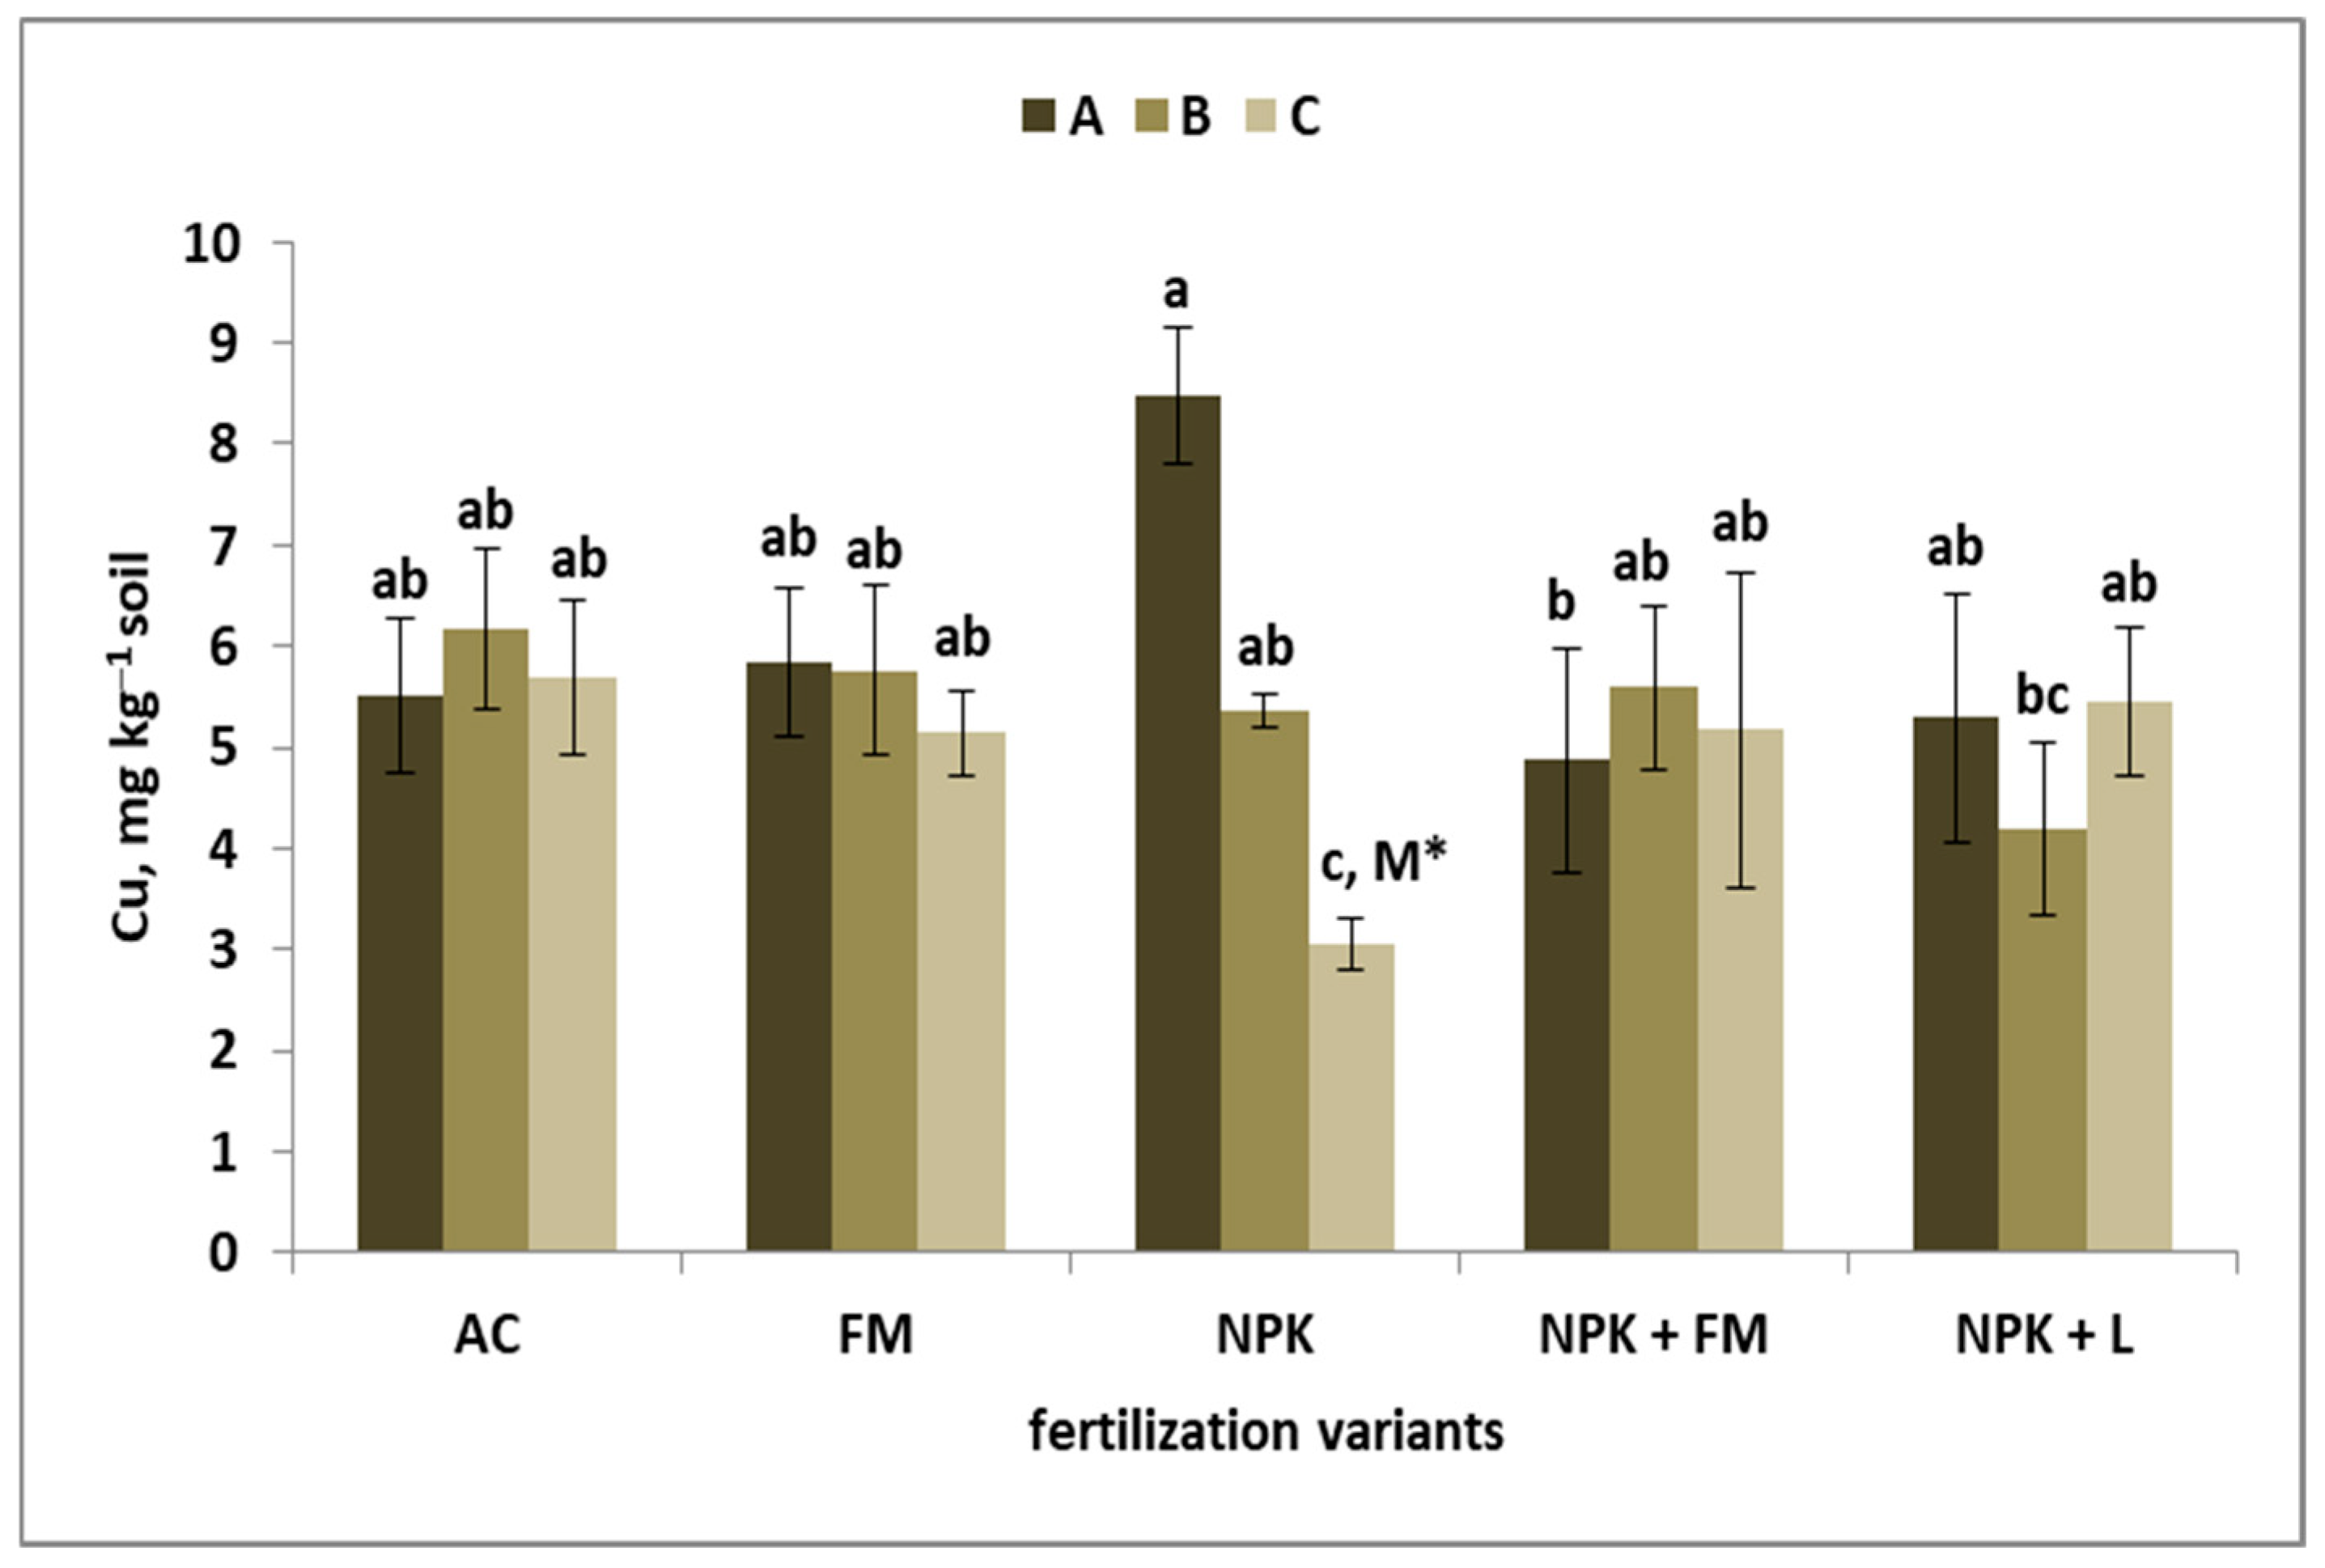
65]. In the case of Cu, its content was in the order WW-MO (5.4 ± 1.1) > WW-CR (4.8 ± 1.2) = BF (4.7 ± 0.9 mg·kg−1). The variability of the results was low because the coefficient of variation was 21%, 24%, and 20%, respectively. These values indicate the dominance of variants, especially in winter wheat with a high content of available Cu.
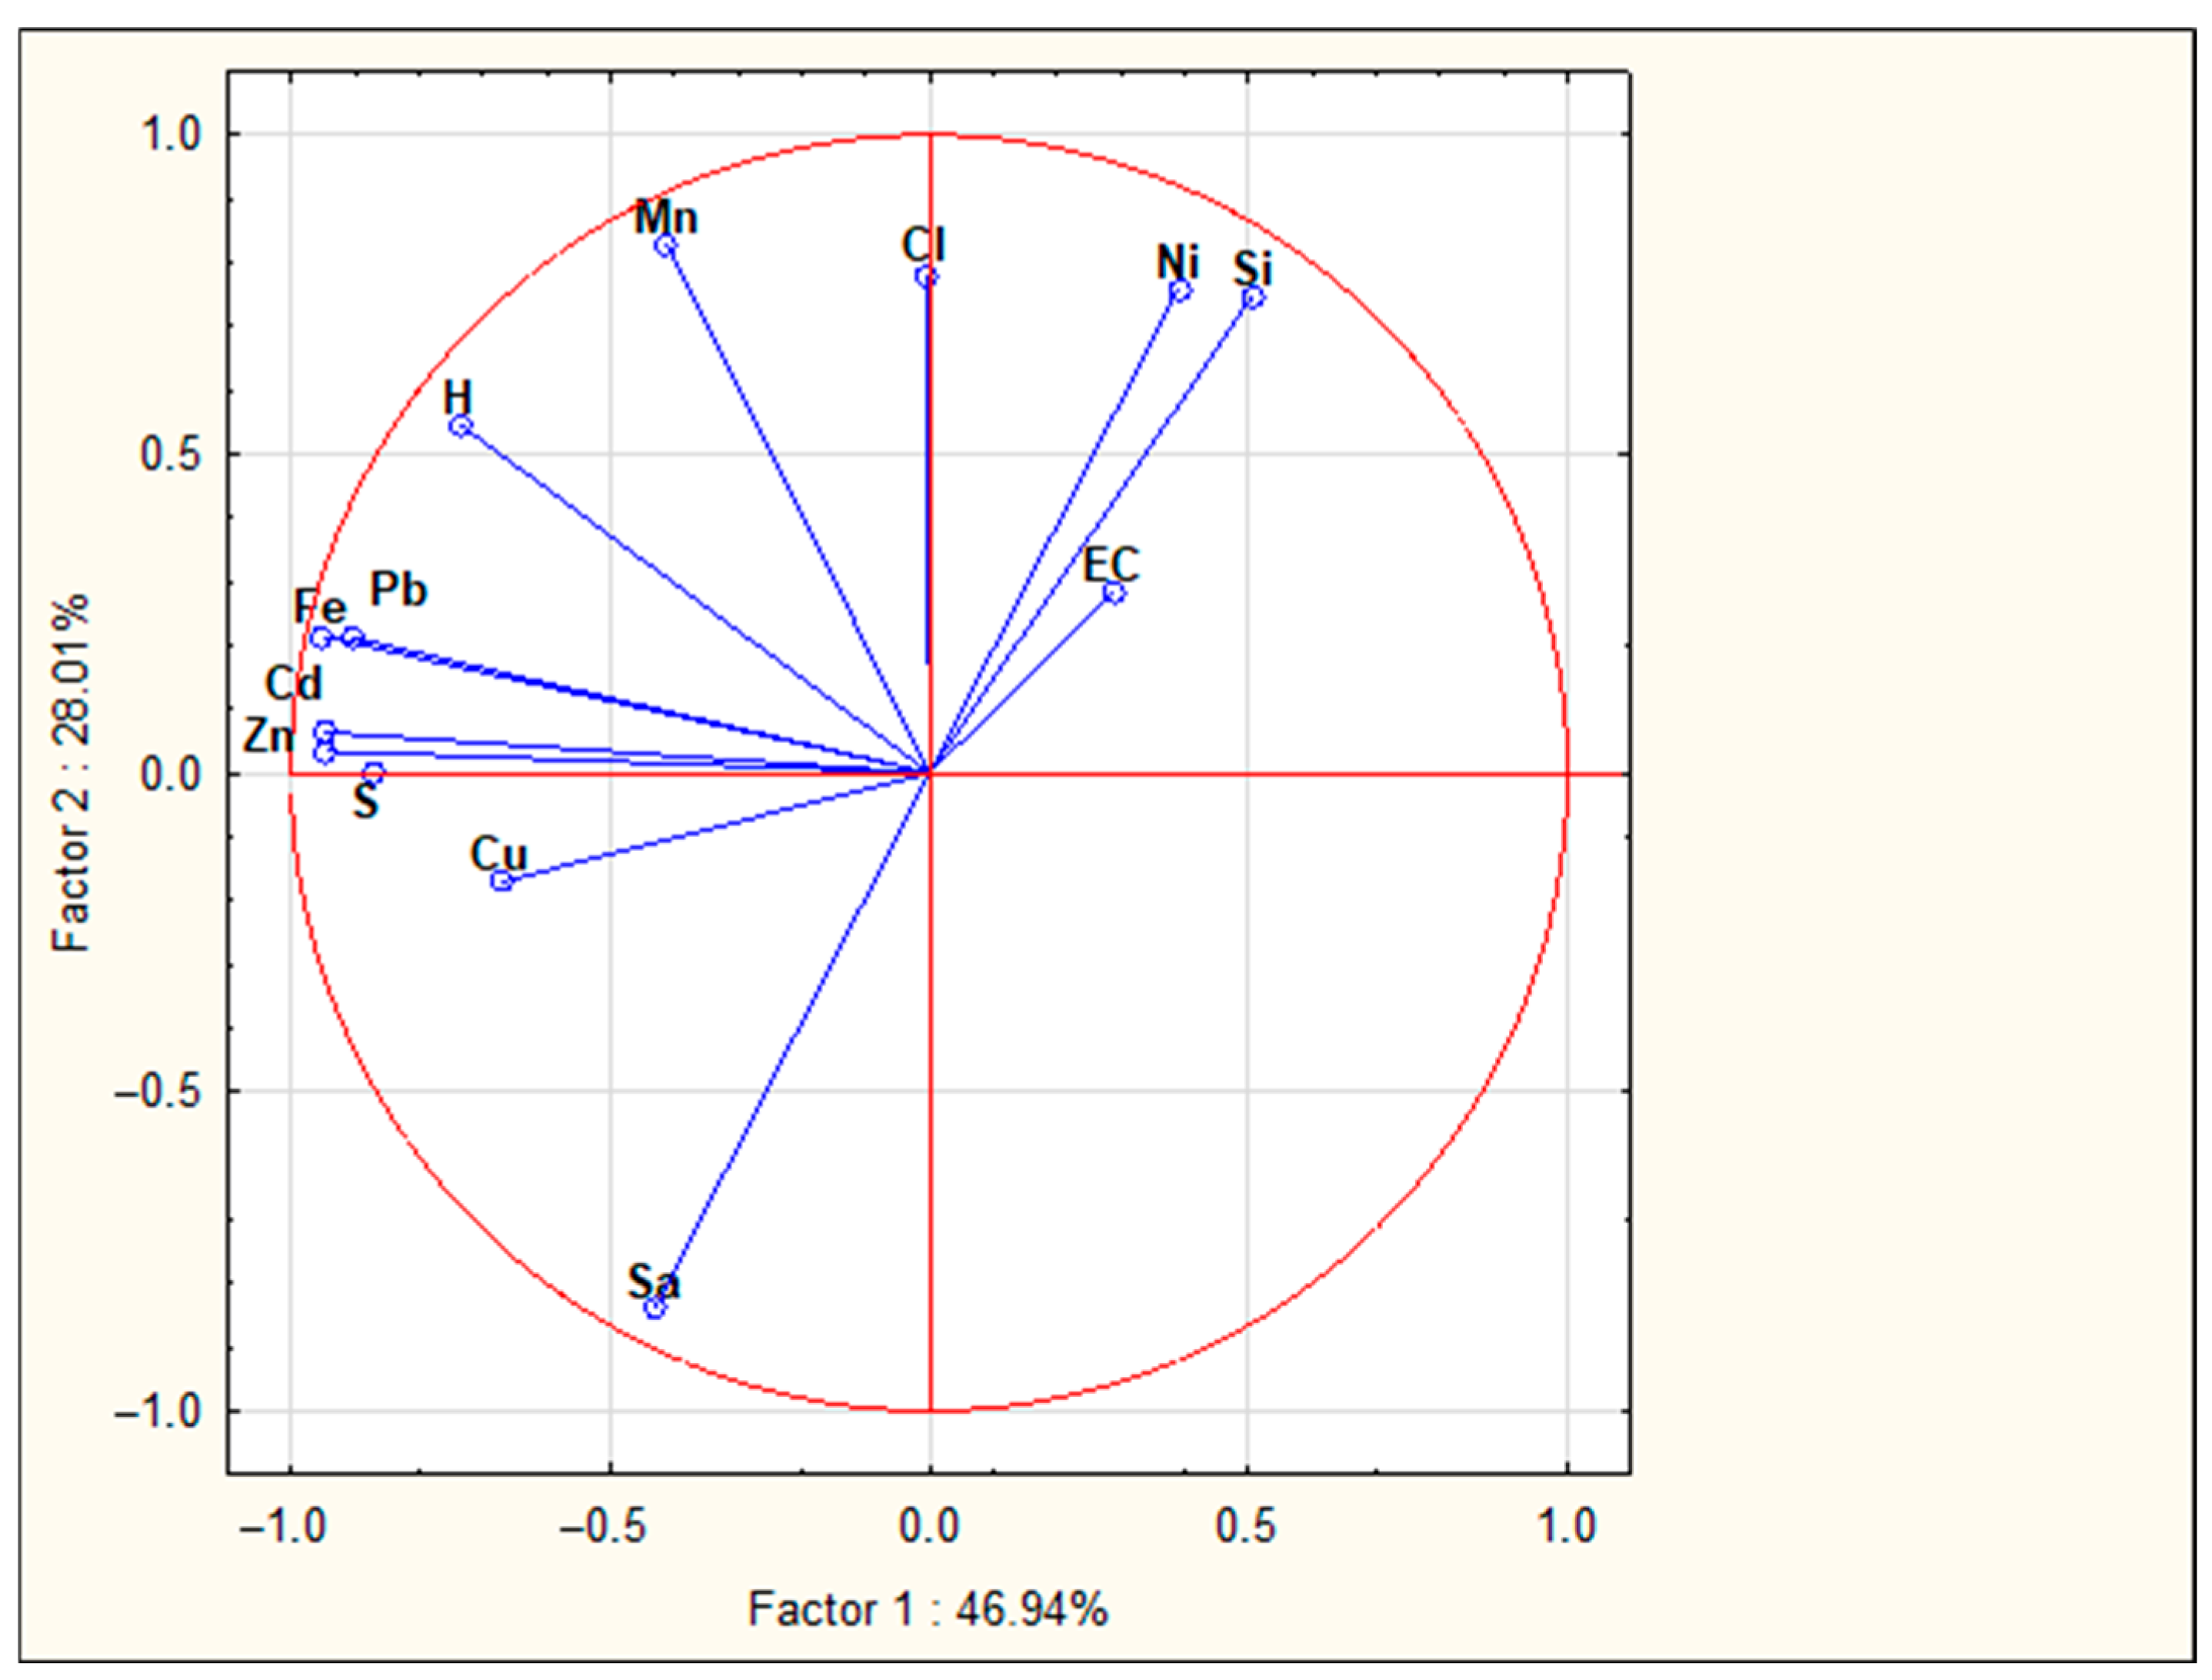
The content of available Fe, regardless of the system of soil use, affected the contents of other micronutrients. The strongest relationship was recorded for Zn (Figure 9). The strength of the obtained relationship decreased in the following order: BF ≥ CR > MO. However, the rate of Zn content increase, in response to an increase in Fe was almost three times greater in CR. The association strength of Fe and Cu was significant but much weaker than that of Zn. It decreased in the following order: CR > MO > BF. The lowest strength in the studied relationships was found for Mn, which was positive but significant only in BF. The greater mobility of Zn over Cu in the tested soil, regardless of its long-term SUS, can be explained by the values of the first hydrolysis equilibrium constant (pK1). It is lower for Cu (pH 6–8) than for Zn (8–9), which results in greater adsorption of Cu in the soil in response to increased pH [66]. The study on the adsorption of trace elements in the examined experiment fully confirmed this rule. The adsorption maxima (amax) of the Langmuir equation was three times higher for Cu compared to Zn [67].

4.3. Bioavailable Heavy Metals—Controlling Factors

A remaining question is how the long-term, one-sided use of organic and/or mineral fertilizer affects the content of a bioavailable pool of heavy metals. It has been well documented that using EDTA (ethylene-diaminetetraacetic acid, EDTA), present in the Mehlich 3 extraction solution, allows for a reliable estimation of the bioavailable Pb and Cd pools in soils [68,69,70].
The basic sources of Pb and Cd in the long-term experiment were manure and mineral fertilizers. With respect to cow manure, the amount of introduced Pb into the soil annually was approximately 19 g·ha−1 and Cd of 1.4 g·ha−1. The second source for all tested NPK variants was phosphorus fertilizer, applied in the form of single or triple superphosphate. The average content of Pb in P fertilizers is 30 mg·kg−1 and 0.8 mg Cd·kg−1 [71]. The amount of heavy metals actually incorporated into the soil annually with P fertilizer was low (Pb—1.4 ± 0.2; Ni—1.0 ± 0.05; Cd—0.6 ± 2 g·ha−1·year−1). In NPK + L, the maximum annual dose of Pb did not exceed 100 g·ha−1. Despite the differences in the amounts of heavy metals introduced into the soil from external sources, their content in the examined soils was very similar.
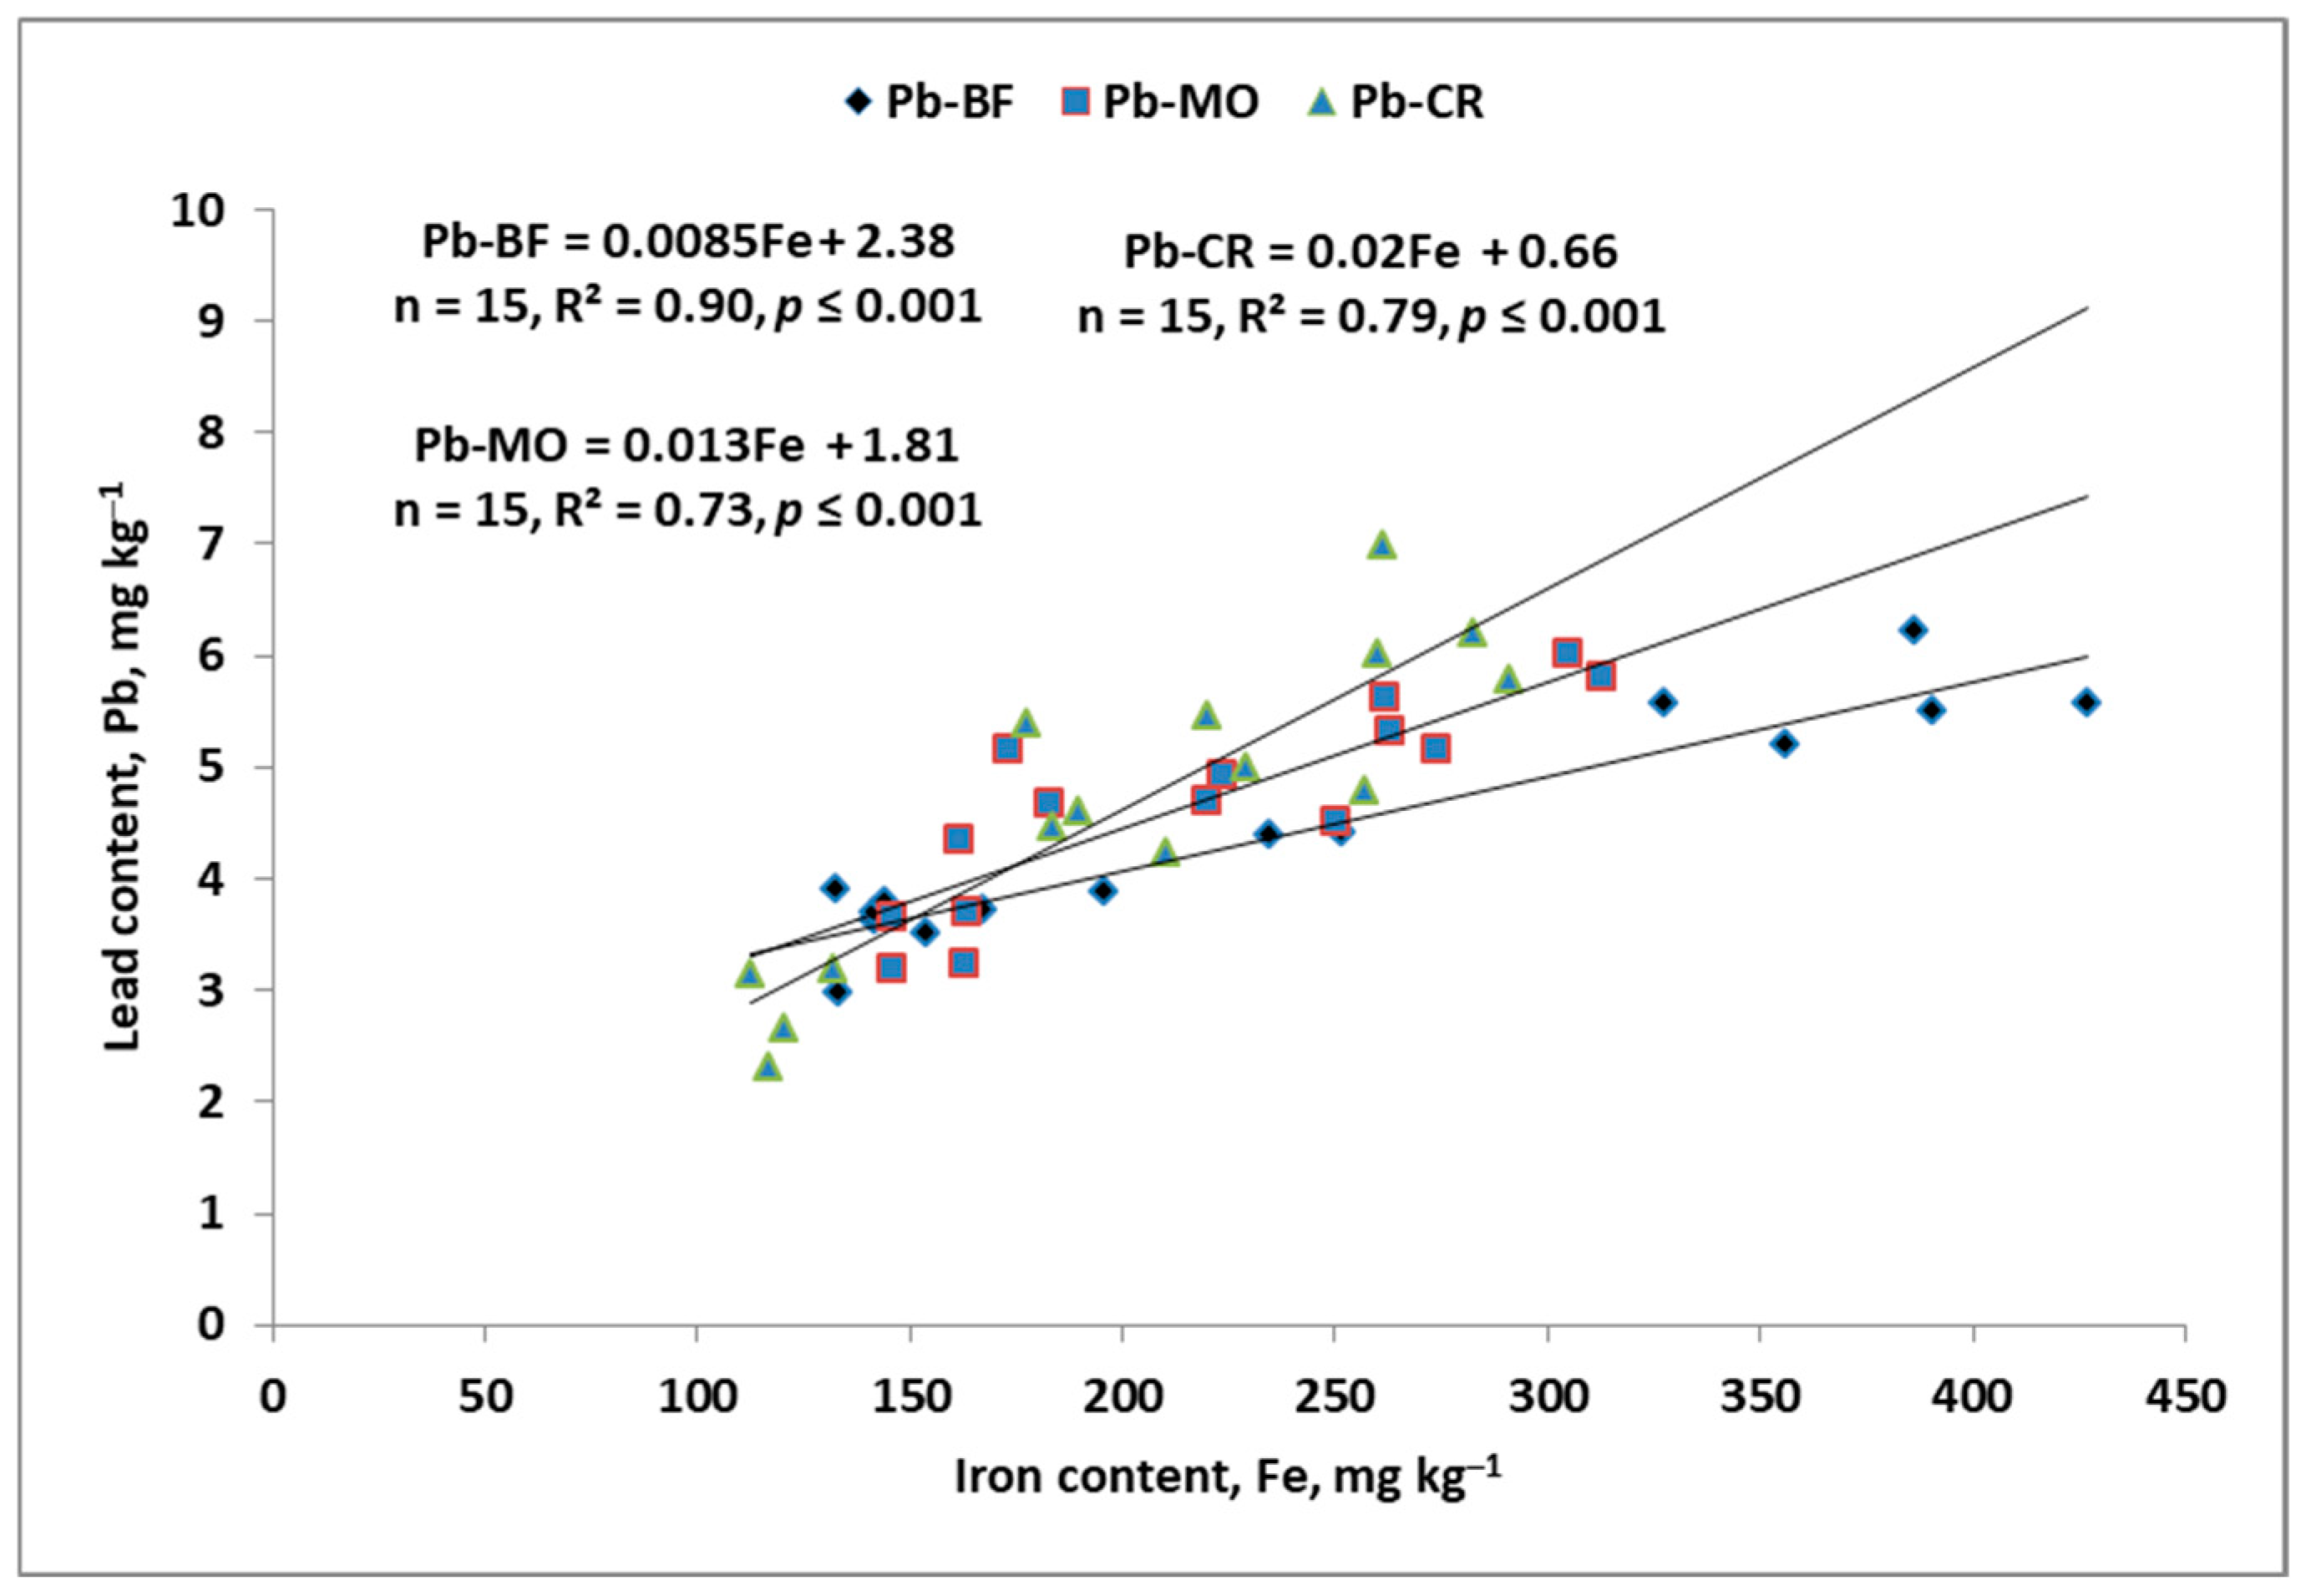
One of the most important dependencies observed in this study was the relationship between the content of available Fe, regardless of the type of long-term SUS, and the bioavailable Pb (Figure 10). Similar relationships were obtained for Cd. The rate of Pb increase, in response to increasing Fe, was in the order CR > MO > BF. This dominant role of Fe, as a driver of Pb content, did not result from the use of manure but probably from the geochemical processes responsible for its release from soil pools. The first hydrolysis equilibrium constant (pK1) for Pb is approximately 6, leading to a fast inactivation of Pb2+ in the soil solution around this pH value [66,72]. The content of available Pb was the highest in CR, in which both the content of Corg and pH were the highest, resulting in a strong release of Pb and Cd. However, the content of Zn, as known from a stepwise regression analysis, was a better predictor of bioavailable Pb than Fe. Therefore, we cannot ignore the role of crops grown in crop rotation. Alfalfa was a direct forecrop for winter wheat. The effect of this crop on element mobility in the soil is multifunctional. Firstly, it acidifies the rhizosphere, even up to two units below the measured value in non-rhizosphere soil [73,74]. Secondly, this crop takes up nutrients from a great depth and accumulates them in the topsoil. This was evidenced for both Zn and Pb in the NPK variants. Thirdly, the alfalfa crop residues are richer in N and, at the same time, poorer in lignin compared to winter wheat residues, as evidenced by this experiment after 30 years [56].
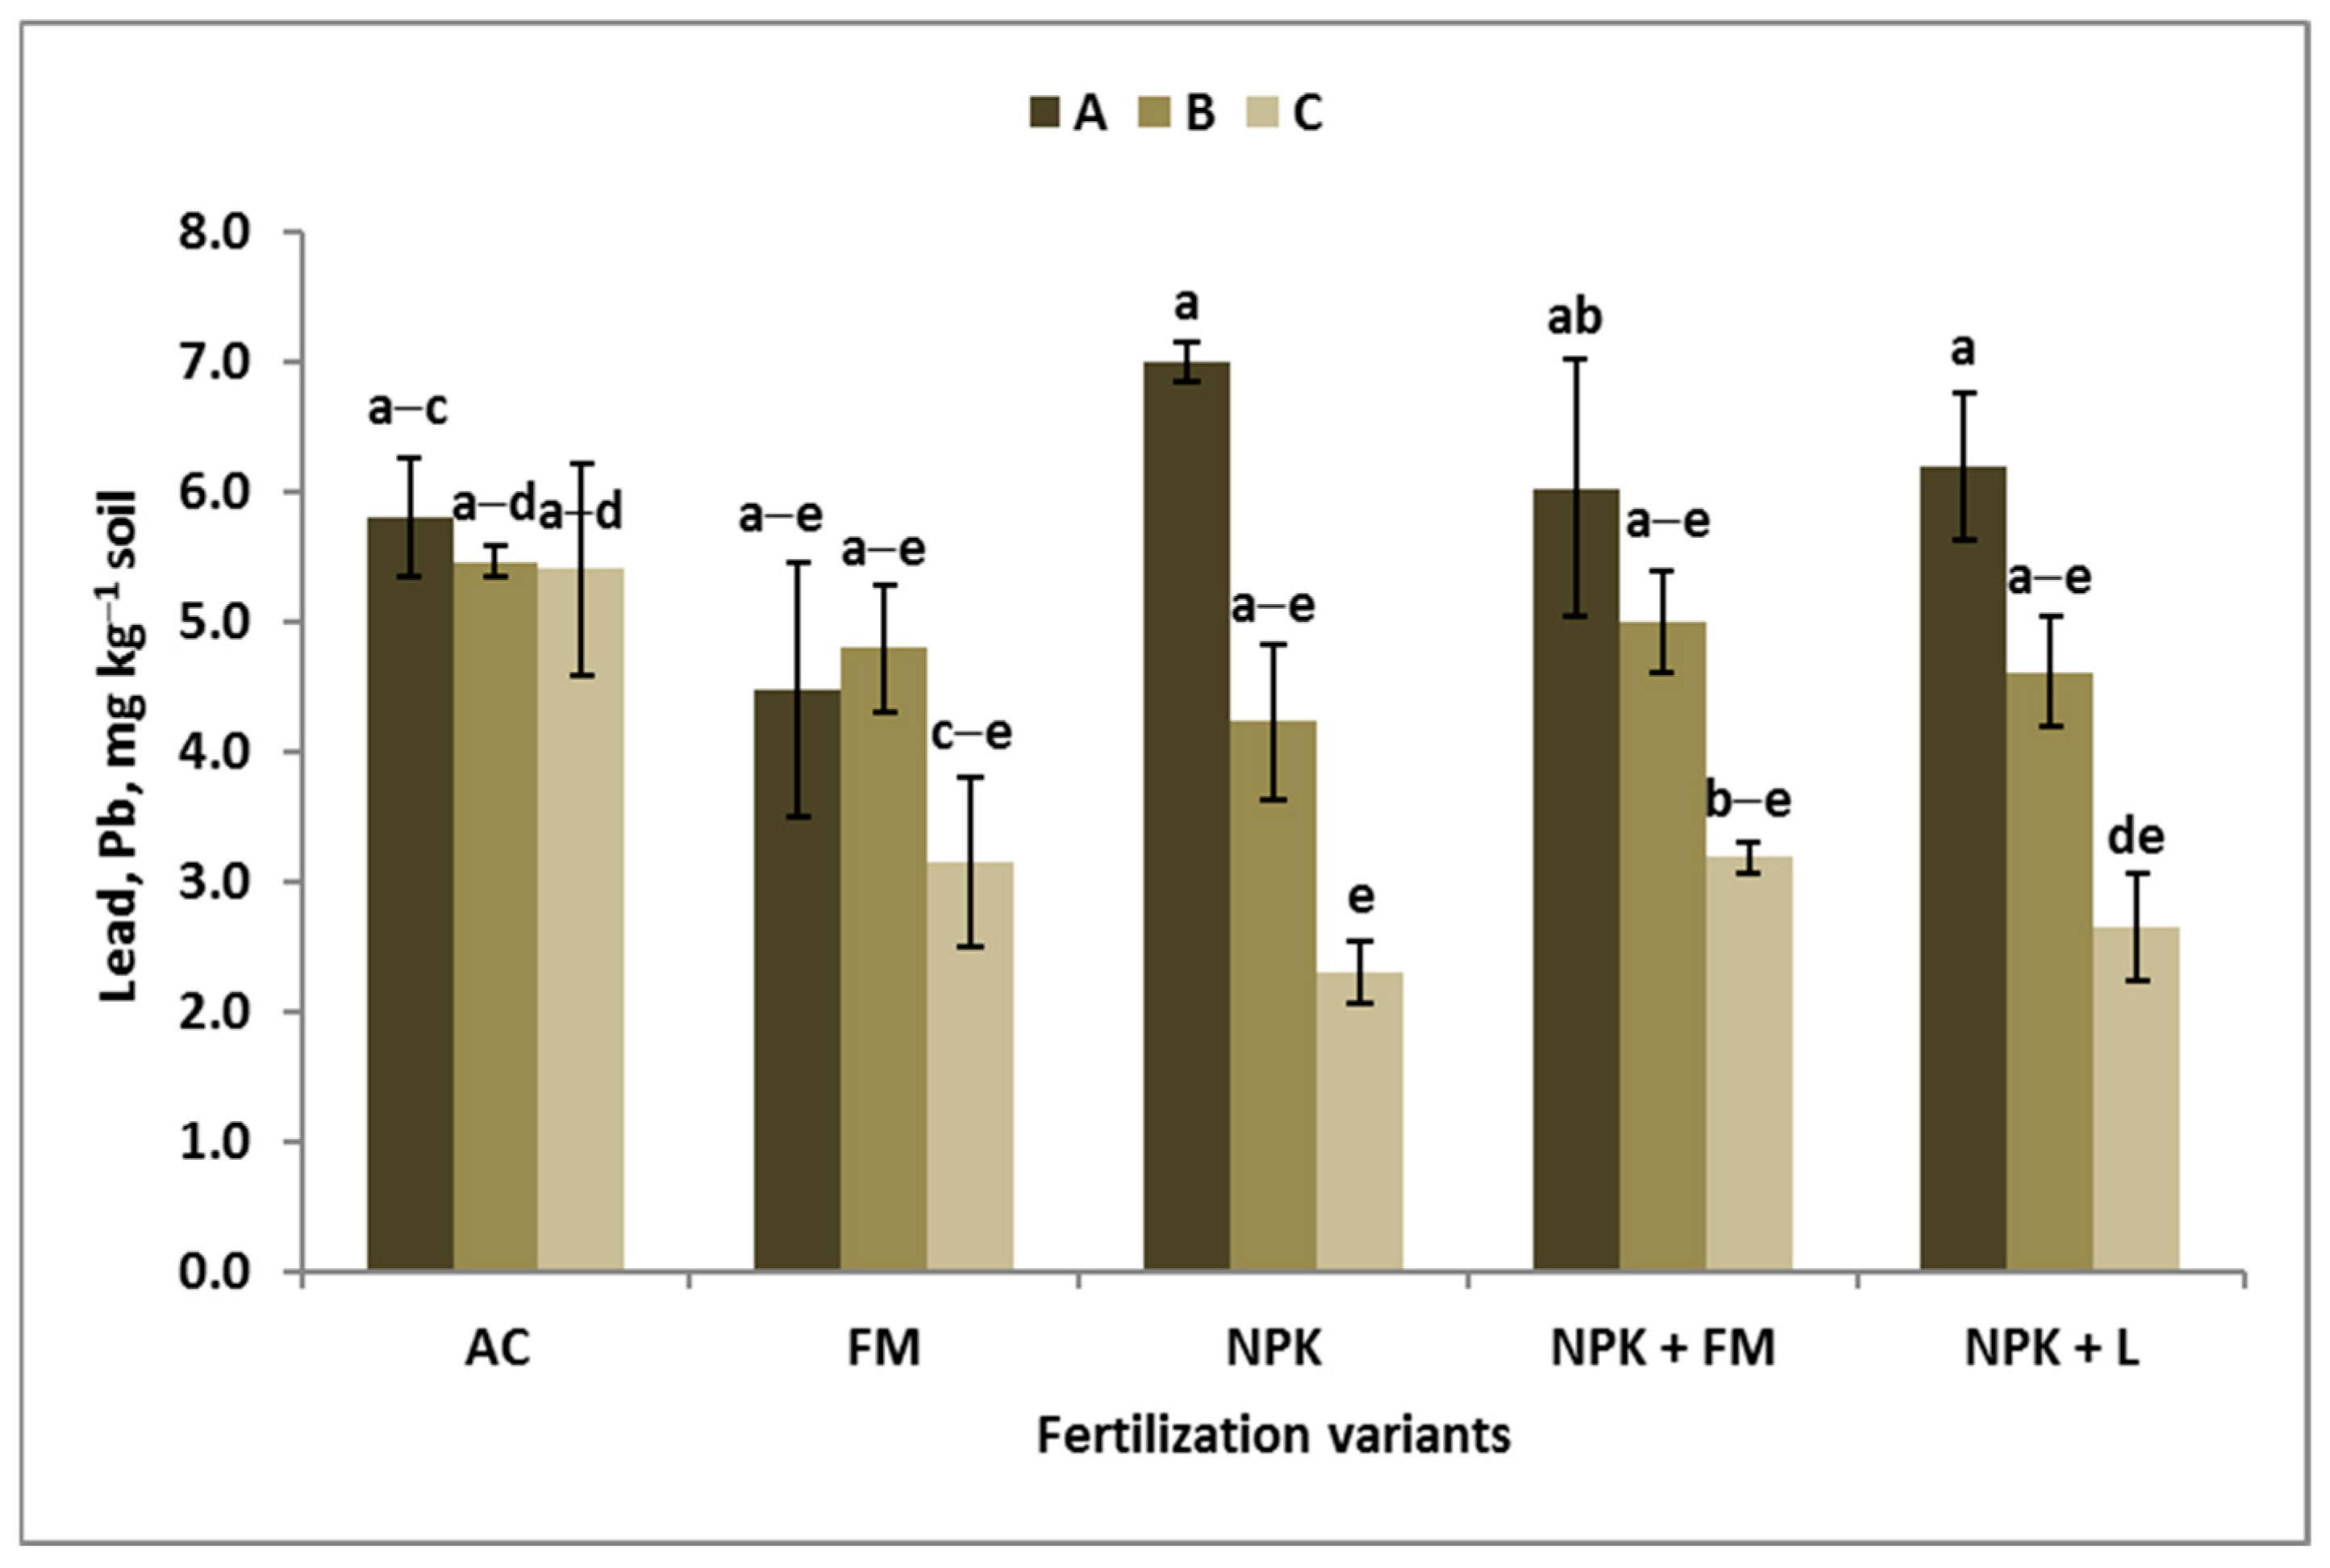
Each of the heavy metals examined responded individually to the long-term system of arable soil use and the continuous application of organic and mineral fertilizers. The average Pb content in the soil of the studied objects remained almost constant. Its distribution depending on soil depth was very similar, but the rate of decline was in the order CR > BF > MO. This series confirms the dominant role of crop rotation in controlling the content of available Pb in the soil. In BF and MO, Pb vertical distribution followed the distribution of Corg, being highest in the topsoil. A significant impact of the fertilizers applied was only found in CR. Fertilizer variants with NPK were characterized by the highest Pb content in the topsoil and a gradual decrease with soil depth. The decrease in Pb content in the subsoil and simultaneous increase in the topsoil indirectly indicate its dependence on the humus content, which did not appear in AC and FM. The drop in Pb content in FM and its much higher values in AC are probably due to the higher yields of winter wheat and the potential for its removal from the soil [12].
The threshold value of 0.27 mg Cd·kg−1 was exceeded only in BF. At the same time, it decreased gradually with soil depth. In cropped soils, the Cd content was below this critical value but also showed a significant decreasing tendency with soil depth. The rate of decline was twice as high in CR compared with MO. The opposite trend for the Cd content in relation to the Corg content indirectly suggests its depletion due to uptake by growing plants. The magnitude of the decline indicates that it was much higher in CR, where the WW yield was much higher compared to MO [12].
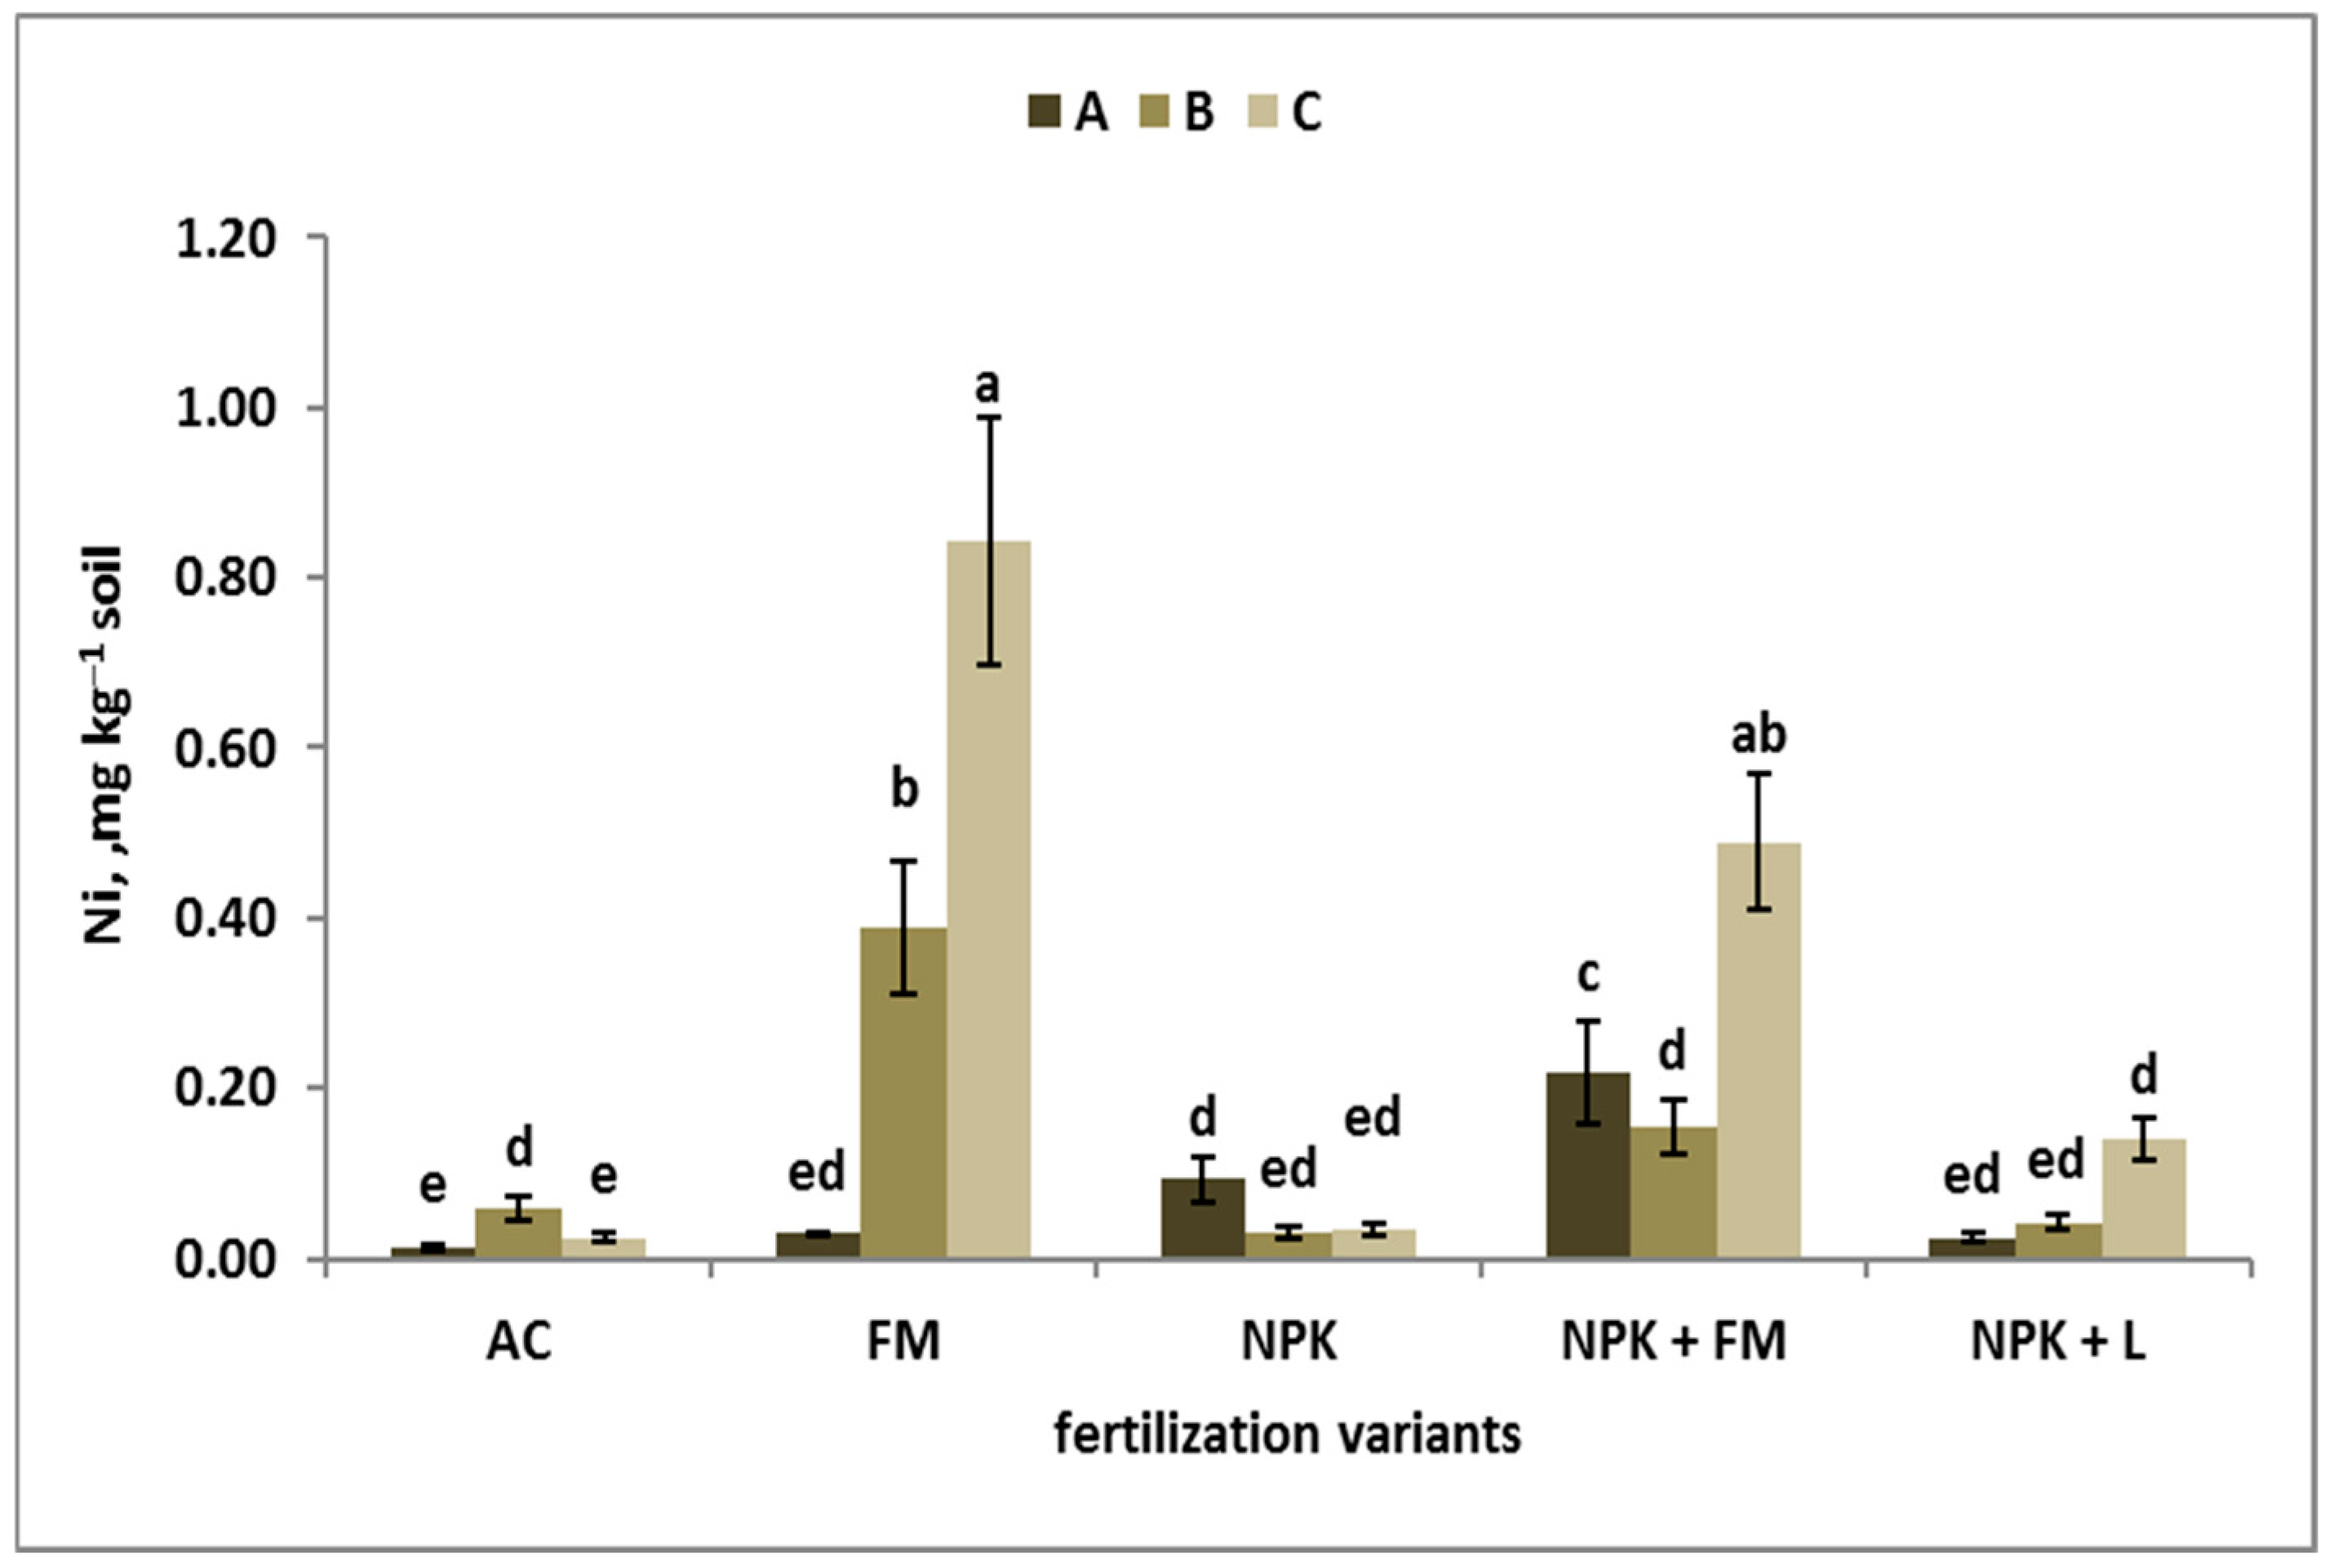
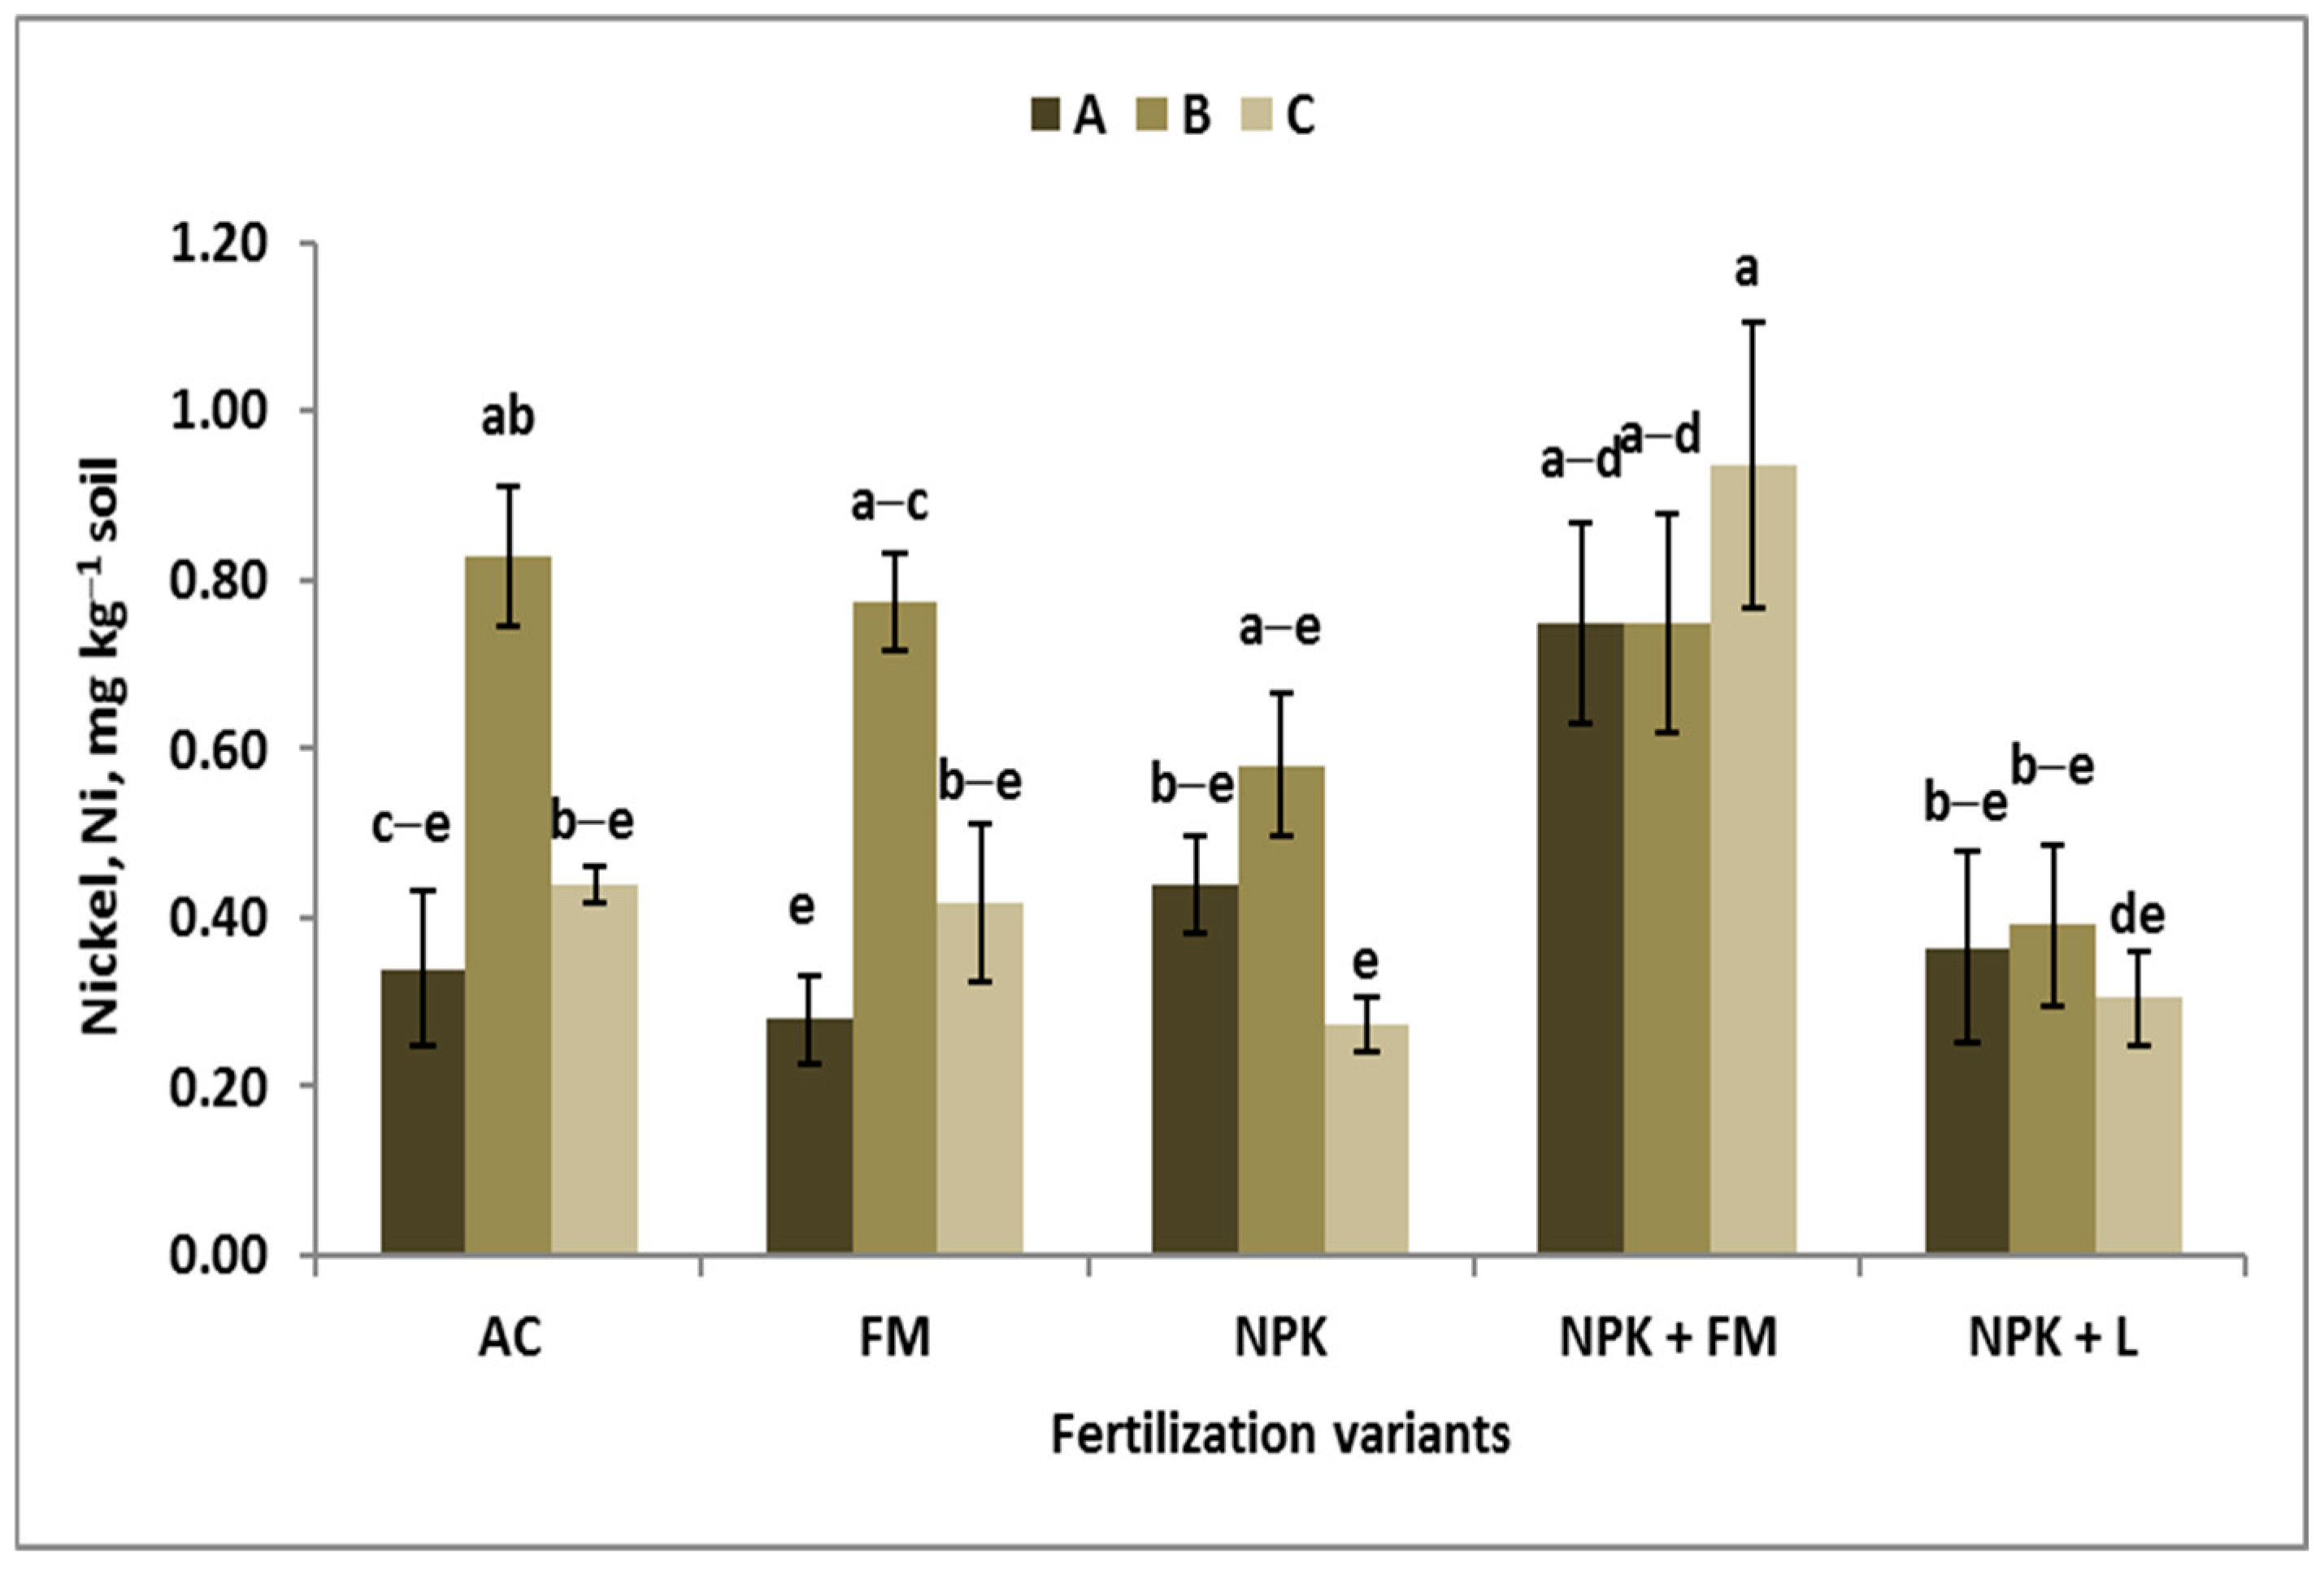
The key factor affecting the content of bioavailable Ni was the long-term SUS. The highest content was recorded in WW-CR—three times higher than BF and 2.5 times higher than WW-MO. The observed differences can be easily explained by the fact that the forecrop for WW in crop rotation was alfalfa and WW in monoculture. Alfalfa takes up and accumulates during the growing season a relatively large amount of Ni to control the processes of urea transformation into nitrogen compounds [75]. The content of Ni in alfalfa hay ranged from 2.0 to 2.5 mg kg−1 and in winter wheat from 0.05 to 0.3 mg·kg−1 [76,77]. The mass of crop residues in the second alfalfa growing season in the studied experiment was approximately 5.5 t·ha−1 dry matter (including 2 t·ha−1 root biomass in the topsoil layer). At the same time, the C:N ratio ranged from 18 to 21. For comparison, the harvest residues of winter wheat amounted to approximately 3 ha−1 (including 2 t ha−1 root biomass in the layer of 0.0–0.3 m), and the C:N ratio ranged from 30(35):1 for roots to 50(65):1 for stubble [78]. A comparison of these two datasets at least partially explains the difference in soil available Ni content between WW-CR and WW-MO.
In BF, the content of Ni averaged for the entire soil profile does not reflect the real content, depending on the fertilization variant. In AC and NPK variants, excluding NPK + FM, the average Ni content was below 0.1 mg kg−1. In FM, it reached 0.42 mg·kg−1, and NPK + FM 0.29 mg·kg−1. At the same time, its content increased strongly with soil depth, especially in FM. This tendency suggests Ni leaching. It has been documented that Ni cations create complexes with organic acids, which accelerates Ni movement into the deeper soil layers [79]. At the same time, the increase in pH reduces the Ni pool’s susceptibility to leaching [75]. This phenomenon was observed in NPK and MPK + L variants in CR.

5. Conclusions

The obtained results clearly indicate that long-term fertilization with NPK + FM, especially in rotation with legumes, strengthens the eluviation/illuviation processes, decreasing the sustainability of soil fertility. Liming is a factor stabilizing the content and distribution of silt and clay particles in the soil. However, the content of silt and clay did not show any significant correlation with the content of the studied trace elements. The average content and distribution with soil depth of available micronutrients and bioavailable heavy metals in arable soil after 75 years reflect fairly well the impact of soil use system (crop plant, fertilization). Despite the observed differences between the examined objects, the contents of Fe and Mn made them in the medium class, while Zn and Cu were in the high class of availability. The Cd content exceeded the critical value of 0.27 mg·kg−1 only in black fallow.
The primary soil fertility characteristic affecting the content of the elements studied and their distribution with soil depth was the content of humus. Its content was halved in BF compared with soil cropped with winter wheat. The soil pH increased in the order BF < WW-MO < WW-CR. This series is crucial for assessing the impact of SUS on the sustainability of soil fertility. The content of available Fe in the soil was affected by two factors, namely Corg, and pH. Its content in the topsoil layer was highest in black fallow despite the lowest content of Corg. The content of available Fe was consistent with the soil pH. However, in the subsoil, it was consistent with the humus content. In the case of Mn and Zn, the downward trend of their contents coincided with the content of humus, which was higher in CR. In the case of Cu, its content was the highest, regardless of the soil depth, in MO.
The content of available Fe, regardless of the system of soil use, affected the content of micronutrients; the strongest impact was recorded for Zn. The same relationship was observed for Pb and Cd. The obtained relationships clearly suggest that the Fe–C complexes in the soil, which depend on soil pH and the content of Corg, were conditioned by the SUS, as the main factor determining the sustainability of soil fertility. The main factor determining Ni content was the system of soil use, as indicated by the highest content of available Ni in crop rotation, in which alfalfa was the winter wheat forecrop. Further research in this area should be focused on creating Fe–C complexes for controlling the mobility of trace elements in agricultural ecosystems.

Supplementary Materials

The following supporting information can be downloaded at: https://www.mdpi.com/article/10.3390/su17072907/s1, Figure S1: Effect of long-term organic and mineral fertilization on the clay content and its distribution in the soil profile of black fallow; Figure S2: Effect of long-term organic and mineral fertilization on the silt content and its distribution in the soil profile of black fallow; Figure S3: Effect of long-term organic and mineral fertilization on the silt content and its distribution in the soil profile of winter wheat grown in crop rotation; Figure S4: Effect of long-term organic and mineral fertilization on Humus Stability Index and its distribution in the soil profile of black fallow; Figure S5: Effect of long-term organic and mineral fertilization on Humus Stability Index and its distribution in the soil profile of winter wheat grown in monoculture.

Author Contributions

Conceptualization, A.A.; methodology, A.A.; software, M.B.; validation, A.A.; formal analysis, A.A.; investigation, A.A. and M.B.; resources, A.A.; data curation, A.A.; writing—original draft preparation, M.B.; writing—review and editing, A.A.; visualization, A.A.; supervision, A.A.; project administration, M.B.; funding acquisition, A.A. All authors have read and agreed to the published version of the manuscript.

Funding

This research was funded by Poznan University of Life Sciences, grant number 2/2023 for the project entitled: resources and availability of micronutrients for crop plants as a result of long-term constant mineral and organic fertilization.

Institutional Review Board Statement

Not applicable.

Informed Consent Statement

Not applicable.

Data Availability Statement

The original contributions presented in the study are included in the article/Supplementary Material, and further inquiries can be directed to the corresponding author.

Acknowledgments

We would like to express our deep gratitude to Zuzanna Sawińska, Head of the Department of Agronomy, University of Life Sciences in Poznań, Poland, for providing the experimental facility, i.e. the long-term experiment conducted at the Brody Experimental Station, for the purposes of the project.

Conflicts of Interest

The authors declare no conflict of interest.

Abbreviations

The following abbreviations are used in this manuscript:
BC—Black fallowH—Humus
CR—Crop rotationHSI—Humus Stability Index
C, Corg—Organic carbonMO—Monoculture
EC—Electrical conductivityNPK—Mineral fertilizers
FM—Farmyard manurepH—Soil reaction
FVs—Fertilizer variants WW—Winter wheat
L—LimeSUS—Soil use system

Appendix A

Table A1. Correlation matrix of the content of micronutrients and bioavailable heavy metals and soil fertility characteristics, black fallow, n = 15.
VariablesSaSiClHHSIFeMnZnCuNiPbCd
EC−0.240.230.180.250.10−0.180.01−0.34−0.74 **0.15−0.35−0.18
Sa1.00−0.97 ***−0.66 **−0.090.500.21−0.450.330.29−0.72 **0.120.38
Si 1.000.47−0.01−0.58 *−0.280.35−0.42−0.330.69 **−0.17−0.45
Cl 1.000.36−0.020.130.58 *0.11−0.040.500.100.01
H 1.000.79 **0.82 ***0.72 **0.68 **0.230.090.72 **0.72 **
HSI 1.000.80 ***0.370.79 ***0.35−0.290.65 **0.82 ***
Fe 1.000.55 *0.90 ***0.54 *−0.250.95 ***0.93 ***
Mn 1.000.440.1030.59 *0.53 *0.39
Zn 1.000.70 **−0.320.84 ***0.85 ***
Cu 1.00−0.330.65 **0.53 *
Ni 1.00−0.26−0.38
Pb 1.000.87 ***
***, **, * indicate significant differences between nutrient traits at p < 0.001, p < 0.01, and p < 0.05, respectively. Legend: EC—electrical conductivity; pH—soil reaction; Sa, Si, Cl—granulometric fractions: sand, silt, clay, respectively; HSI—Humus Stability Index; Fe, Mn, Zn, Cu—micronutrients; Ni, Pb, Cd—heavy metals.
Table A2. Correlation matrix of the content of micronutrients and bioavailable heavy metals and soil fertility characteristics, winter wheat grown in monoculture, n = 15.
VariablesSaSiClHHSIFeMnZnCuNiPbCd
EC−0.360.440.06−0.04−0.170.290.400.010.290.130.350.52 *
Sa1.00−0.89 ***−0.69 **0.53 *0.72 **0.27−0.010.400.36−0.060.370.13
Si 1.000.280.04−0.62 *0.010.01−0.24−0.240.03−0.200.05
Cl 1.00−0.42−0.52 *−0.57 *−0.02−0.44−0.370.07−0.46−0.36
H 1.000.95 ***0.500.370.380.340.150.66 **0.50
HSI 1.000.410.280.360.310.060.62 **0.43
Fe 1.000.440.73 **0.67 **0.100.85 ***0.82 ***
Mn 1.000.70 **0.500.310.54 *0.43
Zn 1.000.60 *0.290.62 *0.46
Cu 1.000.380.53 *0.57 *
Ni 1.000.080.12
Pb 1.000.86 ***
***, **, * indicate significant differences between nutrient traits at p < 0.001, p < 0.01, and p < 0.05, respectively. Legend: EC—electrical conductivity; pH—soil reaction; Sa, Si, Cl—granulometric fractions: sand, silt, clay, respectively; HSI—Humus Stability Index; Fe, Mn, Zn, Cu—micronutrients; Ni, Pb, Cd—heavy metals.
Table A3. Correlation matrix of the content of micronutrients and bioavailable heavy metals and soil fertility characteristics, winter wheat grown in crop rotation, n = 15.
VariablesSaSiClHHSIFeMnZnCuNiPbCd
EC−0.58 *0.67 **0.310.05−0.16−0.210.60 *0.110.320.21−0.010.13
Sa1.00−0.93 ***−0.85 ***0.220.59 *0.40−0.250.130.07−0.310.240.21
Si 1.000.59 *0.03−0.37−0.160.52 *0.150.230.300.050.10
Cl 1.00−0.51−0.75 **−0.63 *−0.19−0.50−0.490.25−0.60 *−0.60 *
H 1.000.88 ***0.68 **0.64 *0.76 **0.66 **−0.060.66 **0.76 ***
HSI 1.000.64 *0.420.59 *0.53 *−0.160.59 *0.66 **
Fe 1.000.420.89 ***0.78 **0.170.89 ***0.76 **
Mn 1.000.68 **0.73 **0.170.66 **0.70 **
Zn 1.000.87 ***0.080.92 ***0.87 ***
Cu 1.000.170.78 **0.83 ***
Ni 1.000.12−0.14
Pb 1.000.84 ***
***, **, * indicate significant differences between nutrient traits at p < 0.001, p < 0.01, and p < 0.05, respectively. Legend: EC—electrical conductivity; pH—soil reaction; Sa, Si, Cl—granulometric fractions: sand, silt, clay, respectively; HSI—Humus Stability Index; Fe, Mn, Zn, Cu—micronutrients; Ni, Pb, Cd—heavy metals.
Figure A1. The effect of long-term organic and mineral fertilization on the content and distribution of organic carbon in subsequent soil layers of black fallow soil. Similar letters indicate a lack of significant difference between experimental treatments using Tukey’s test. Legend: AC—absolute control; FM—farmyard manure; NPK—mineral N, P, K fertilization; NPK + FM—complementary NPK and FM application; NPK + L—NPK plus lime application; A, B, C—soil layers 0.0–30 cm, 30–60 m, 60–90 m, respectively.
Sustainability 17 02907 g0a1
Figure A2. The effect of long-term organic and mineral fertilization on the content and distribution of organic carbon in subsequent soil layers of winter wheat monoculture soil. Similar letters indicate a lack of significant difference between experimental treatments using Tukey’s test. Legend: AC—absolute control; FM—farmyard manure; NPK—mineral N, P, K fertilization; NPK + FM—complementary NPK and FM application; NPK + L—NPK plus lime application; A, B, C—soil layers 0.0–30 cm, 30–60 m, 60–90 m, respectively.
Sustainability 17 02907 g0a2
Figure A3. The effect of long-term organic and mineral fertilization on the content and distribution of organic carbon in subsequent soil layers of winter wheat crop rotation soil. Similar letters indicate a lack of significant difference between experimental treatments using Tukey’s test. Legend: AC—absolute control; FM—farmyard manure; NPK—mineral N, P, K fertilization; NPK + FM—complementary NPK and FM application; NPK + L—NPK plus lime application; A, B, C—soil layers 0.0–30 cm, 30–60 m, 60–90 m, respectively.
Sustainability 17 02907 g0a3
Figure A4. Score plot of micronutrients and selected heavy metals in the soil of black fallow on PC1 and PC2 axes. Legend: EC—electrical conductivity; Sa, Si, Cl—granulometric fractions: sand, silt, and clay, respectively; S = HSI—Humus Stability Index; Fe, Mn, Zn, Cu—micronutrients; Ni, Pb, Cd—heavy metals.
Sustainability 17 02907 g0a4
Figure A5. Score plot of micronutrients and selected heavy metals in the soil of winter wheat grown in monoculture on PC1 and PC2 axes. Legend: EC—electrical conductivity; Sa, Si, Cl—granulometric fractions: sand, silt, and clay, respectively; S = HSI—Humus Stability Index; Fe, Mn, Zn, Cu—micronutrients; Ni, Pb, Cd—heavy metals.
Sustainability 17 02907 g0a5
Figure A6. Score plot of micronutrients and selected heavy metals in the soil of winter wheat grown in crop rotation on PC1 and PC2 axes. Legend: EC—electrical conductivity; Sa, Si, Cl—granulometric fractions: sand, silt, and clay, respectively; S = HSI—Humus Stability Index; Fe, Mn, Zn, Cu—micronutrients; Ni, Pb, Cd—heavy metals.
Sustainability 17 02907 g0a6

References

  1. Licker, R.; Johnston, M.; Foley, J.A.; Barford, C.; Kucharik, C.J.; Monfreda, C.; Ramankutty, N. Mind the gap: How do climate and agricultural management explain the “yield gap” of croplands around the world? Glob. Ecol. Biogeogr. 2010, 19, 769–782. [Google Scholar]
  2. Grzebisz, W.; Łukowiak, R. Nitrogen gap amelioration is a core for sustainable intensification of agriculture—A concept. Agronomy 2021, 11, 419. [Google Scholar] [CrossRef]
  3. Johnston, A.E.; Poulton, P.R. The importance of long-term experiments in agriculture: Their management to ensure continued crop production and soil fertility: The Rothamsted experience. Eur. J. Soil Sci. 2018, 69, 113–125. [Google Scholar] [PubMed]
  4. Kopittke, P.M.; Menzies, N.W.; Wang, P.; McKenza, B.A.; Lombi, E. Soil and the intensification of agriculture for global food security. Environ. Inter. 2019, 132, 105078. [Google Scholar]
  5. Hennessy, D.A. On monoculture and the structure of crop rotations. Agric. Econ. 2006, 88, 900–914. [Google Scholar]
  6. Bruns, H.A. Concepts in crop rotations. In Agricultural Science; Alakpui, G., Ed.; InTech: Rijeka, Croatia, 2012; 26p. [Google Scholar]
  7. Kostrzewska, M.K.; Jastrzębska, M.; Marks, M.; Jastrzębski, W.P. Long-term crop rotation and continuous cropping effects on soil chemical properties. J. Elem. 2022, 27, 335–349. [Google Scholar]
  8. Viet, H.Q. Influence of 96 years of mineral and organic fertilization on selected soil properties: A case of study from long-term experiments in Skiernieiwce, Central Poland. Soil Sci. Annu. 2023, 74, 161945. [Google Scholar]
  9. Bockstaller, C.; Blatz, A.; Rapp, O.; Koller, R.; Slezack, S.; Schaub, A. Sustainable alternative to irrigated maize monoculture in a maize-dominated cropped area: Lessons learned from a system experiment. Heliyon 2024, 10, c30400. [Google Scholar]
  10. Marini, L.; Stomartin, A.; Vici, G.; Baldoni, G.; Berti, A.; Blecharczyk, A.; Małecka-Jankowiak, I.; Morari, F.; Sawińska, Z.; Bommmaeco, R. Crop rotations sustain cereal yields under a changing climate. Environ. Res. Lett. 2010, 15, 124011. [Google Scholar]
  11. Karlen, D.L.; Varvel, G.E.; Bullock, D.G.; Cruse, R.M. Crop Rotations for the 21st Century. Adv. Agron. 1994, 53, 1–45. [Google Scholar]
  12. Blecharczyk, A.; Zawada, D.; Sawińska, Z.; Małecka-Jankowiak, I.; Waniorek, W. Impact of crop sequence and fertilization on yieldof winter wheat. Fragm. Agron. 2019, 36, 27–35. [Google Scholar]
  13. Macholdt, J.; Piepho, H.P.; Honermeier, B.; Perryman, S.; Macdonald, A.; Poulton, P. The effects of cropping sequence, fertilization and straw management on the yield stability of winter wheat (1986–2017) in the Broadbalk Wheat Experiment, Rothamsted, UK. J. Agric. Sci. 2020, 158, 65–79. [Google Scholar]
  14. Hlisnikovsky, L.; Mensik, L.; Roman, M.; Kunzova, E. The evaluation of long-term experiment on the relationships between weather, nitrogen fertilization, preceding crop, and winter wheat yield on Cambisol. Plants 2024, 13, 802. [Google Scholar] [CrossRef]
  15. Nielsen, D.C.; Calderón, F.J. Fallow effects on soil. In Soil Management: Building a Stable Base for Agriculture; Hatfield, J.L., Saur, T.J., Eds.; American Society of Agronomy/ASA Home: Madison, WI, USA, 2011; pp. 297–299. [Google Scholar]
  16. Chorley, G.P.H. The agricultural revolution in Northern Europe, 1750–1880: Nitrogen, legumes, and crop productivity. Econ. Hist. Rev. 1981, 34, 71–93. [Google Scholar]
  17. Benton Jones, J., Jr. Agronomic Handbook: Management of Crops, Soils and Their Fertility; CRC Press LLC: Boca Raton, FL, USA, 2003; 450p. [Google Scholar]
  18. Taiz, L. Agriculture, plant physiology, and human population growth: Past, present, and future. Theor. Exp. Plant Physiol. 2013, 25, 167–181. [Google Scholar]
  19. Stagnari, F.; Maggio, A.; Galieni, A.; Pisante, M. Multiple benefits of legumes for agriculture sustainability. Chem. Biol. Technol. Agric. 2017, 4, 2. [Google Scholar]
  20. Torma, S.; Vilček, J.; Lošák, T.; Kužel, S.; Martensson, A. Residual plant nutrients in crop residues—An important resource. Acta Agric. Scand. Sec. B Soil Plant Sci. 2017, 68, 358–366. [Google Scholar]
  21. Blair, N.; Faulkner, R.D.; Till, A.R.; Korschens, M.; Schulz, E. Long-term management impacts on soil C, N and physical fertility. II. Bad Lauchstadt static and extreme FYM experiments. Soil Tillage Res. 2006, 91, 39–47. [Google Scholar]
  22. Hijbeek, R.; van Ittersum, M.K.; ten Berge, H.F.M.; Gort, G.; Spiegel, H.; Whitmore, A.P. Do organic inputs matter—A meta-analysis of additional yield effect for arable crops in Europe. Plant Soil 2017, 411, 293–303. [Google Scholar]
  23. Janssen, B. Simple models and concepts as tools for the study of sustained soil productivity in long-term experiments. II. Crop nutrient equivalents, balanced supplies of sustainable nutrients, and NPK triangles. Plant Soil 2011, 339, 17–33. [Google Scholar]
  24. Miao, Y.; Stewart, B.A.; Zhang, F. Long-term experiments for sustainable nutrient management in China. Agron. Sustain. Dev. 2011, 31, 397–414. [Google Scholar]
  25. Neugschwandtner, R.W.; Liebhard, P.; Kaul, H.-P.; Wagentristl, H. Soil chemical properties as affected by soil tillage and crop rotation in a long-term field experiment. Plant Soil Environ. 2014, 60, 57–62. [Google Scholar]
  26. Šimon, Y.; Madaras, M.; Mayerová, M.; Kunzová, E. Soil organic carbon dynamics in the long-term experiments with contrasting crop rotations. Agriculture 2014, 14, 818. [Google Scholar]
  27. Kautz, T.; Amelung, W.; Ewert, F.; Gaiser, T.; Horn, R.; Jahn, R.; Javaux, M.; Kemna, A.; Kuzyakova, Y.; Munch, J.-C.; et al. Nutrient acquisition from arable subsoils in temperate climates: A review. Soil Biol. Biochem. 2013, 57, 1003–1022. [Google Scholar]
  28. Fan, J.; McConkey, B.; Wang, H.; Janzen, H. Root distribution by depth for temperate agricultural crops. Field Crops Res. 2016, 189, 68–74. [Google Scholar]
  29. Barraclough, P.B. The growth and activity of winter wheat roots in the field: Nutrient uptakes of high-yielding crops. J. Agric. Sci. Camb. 1986, 106, 45–52. [Google Scholar]
  30. Barłóg, P.; Łukowiak, R.; Grzebisz, W. Predicting the content of soil mineral nitrogen based on the content of calcium chloride-extractable nutrients. J. Plant Nutr. Soil Sci. 2017, 180, 624–635. [Google Scholar]
  31. Jongman, R.H.G.; Bunce, R.G.H.; Metzger, M.J.; Mucher, C.A.; Howard, D.C.; Mateus, V.L. Objectives and applications of a statistical environmental stratification of Europe. Landsc. Ecol. 2006, 21, 409–429. [Google Scholar]
  32. Rząsa, S.; Owczarzak, W. Methods for the granulometric analysis of soil for science and practice. Polish J. Soil Sci. 2013, XLVI/1, 1–50. [Google Scholar]
  33. PN-EN 27888:199; Water Quality–Determination of Electrical Conductivity. Polski Komitet Normalizacyjny: Warsaw, Poland, 2008; ISBN 8371799519.
  34. PN-EN ISO 10523:2012; Water Quality–Soil pH Determination. Polski Komitet Normalizacyjny: Warsaw, Poland, 2012; ISBN 9788326692307.
  35. Mehlich, A. Mehlich 3 soil test extractant: A modification of Mehlich 2 extractant. Com. Soil Sci. Plant. Anal. 1984, 15, 1409–1416. [Google Scholar]
  36. Zbíral, J. Determination of plant-available micronutrients by the Mehlich 3 soil extractant—A proposal of critical values. Plant Soil Environ. 2016, 62, 527–531. [Google Scholar]
  37. Maly, S.; Zbíral, J.; Čižmárová, E. Is Mehlich 3 soil extraction a suitable screening method for determination of some risk elements? Plant Soil Environ. 2021, 67, 499–506. [Google Scholar]
  38. Spychalski, W.; Grzebisz, W.; Diatta, J.; Kostarev, D. Humus stock degradation and its impact on the phosphorus forms in arable soils—A case of Ukrainian Forest-Steppe Zone. Chem. Spec. Bioav. 2018, 30, 33–46. [Google Scholar]
  39. Kim, H.N.; Park, J.H. Monitoring of soil EC for the prediction of soil nutrient regime under different soil water and organic matter content. Appl. Biol. Chem. 2024, 67, 1. [Google Scholar]
  40. Bieganowski, A.; Witkowska-Walczak, B.; Gliński, J.; Sokołowska, Z.; Sławiński, C.; Brzezińska, M.; Włodarczyk, T. Database of Polish arable mineral soil: A review. Int. Agrophys. 2013, 27, 335–350. [Google Scholar]
  41. Kabała, C. Luvisols and related clay-illuvial soil (gleby płowe)–soils of the year 2023. Current view on their origin, classification and services in Poland. Soil Sci. Annu. 2023, 74, 177034. [Google Scholar]
  42. Sauzet, O.; Cammas, C.; Gilliot, J.-M.; Montagne, D. Long-term quantification of the intensity of clay-sized particles transfers due to earthworm bioturbation and eluviation/illuviation in a cultivated Luvisol. Geoderma 2023, 429, 116251. [Google Scholar]
  43. Lavkulich, L.M.; Arocena, J.M. Luvisolic soils of Canada: Genesis, distribution, and classification. Can. J. Soil Sci. 2011, 91, 781–806. [Google Scholar]
  44. Enesi, R.O.; Dyck, M.; Chang, S.; Thilakarathna, M.S.; Fan, X.; Strelkov, S.; Gorim, L.Y. Liming remedies soil acidity and improves crop yield and profitability—A meta-analysis. Front. Agron. 2023, 5, 1194896. [Google Scholar]
  45. Fu, B.; Chen, L.; Huang, H.; Qu, P.; Wei, Z. Impact of crop residues on soil health: A review. Environ. Poll. Bioavail. 2021, 33, 164–173. [Google Scholar]
  46. Barłóg, P.; Grzebisz, W.; Łukowiak, R. Fertilizers and fertilization strategies mitigating soil factors constraining efficiency of nitrogen in plant Production. Plants 2022, 11, 1855. [Google Scholar] [CrossRef] [PubMed]
  47. Zhang, Y.G.; Zhang, Y.Y.; Cai, J.P.; Zhu, P.; Gao, H.J.; Jiang, Y. Variation in available micronutrients in black soil after 30-year fertilization treatment. Plant Soil Environ. 2014, 60, 387–393. [Google Scholar] [CrossRef]
  48. Brady, N.C.; Weil, R.R. The Nature and Properties of Soils, 15th ed.; Pearson Education: Boston, MA, USA, 2017; 1071p. [Google Scholar]
  49. Liu, X.; Herbert, S.J.; Hashemi, A.M.; Zhang, X.; Ding, G. Effects of agricultural management on soil organic matter and carbon transformation—A review. Plant. Soil Environ. 2006, 52, 531–543. [Google Scholar]
  50. Monitoring Chemizmu Gleb Uprawnych. Available online: https://www.gios.gov.pl/chemizm_gleb/index.php?mod=wyniki (accessed on 20 December 2024). (In Polish)
  51. Knebl, L.; Leithold, G.; Schulz, F.; Brock, C. The role of soil depth in the evaluation of management-induced effects on soil organic matter. Eur. J. Soil Sci. 2017, 68, 979–987. [Google Scholar] [CrossRef]
  52. Grzebisz, W.; Diatta, J.; Barłóg, P.; Biber, M.; Potarzycki, J.; Łukowiak, R.; Przygocka-Cyna, K.; Szczepaniak, W. Soil Fertility Clock—Crop rotation as a paradigm in nitrogen fertilizer productivity control. Plants 2022, 11, 2841. [Google Scholar] [CrossRef] [PubMed]
  53. Lacatusu, R.; Lacatusu, A.-C. Complex indicator for assessing soil fertility. Res. J. Agric. Sci. 2011, 43, 95–101. [Google Scholar]
  54. Sienkiewicz, S.; Żarczyński, P.J.; Wierzbowska, J.; Krzebietke, S.J. The impact of long-term fallowing on the yield and quality of winter rape and winter and spring wheat. Agriculture 2024, 14, 567. [Google Scholar] [CrossRef]
  55. Barre, P.; Eglin, T.; Christensen, B.T.; Ciais, P.; Houot, S.; Katterer, T.; van Oort, F.; Peylin, P.; Poulton, P.R.; Romanenkov, V.; et al. Quantifying and isolating stable organic carbon using long-term bare fallow experiment. Biogeosciences 2010, 7, 3839–3850. [Google Scholar]
  56. Grzebisz, W. Effect of monoculture of crops on the soil structure stability. Roczn. Nauk Rol. 1988, 107, 53–65, (In Polish with English summary). [Google Scholar]
  57. Batjes, N.H. carbon and nitrogen stocks in the soils of Central and Eastern Europe. Soil Use Manag. 2002, 18, 324–329. [Google Scholar] [CrossRef]
  58. Ye, C.; Huang, W.; Hall, S.J.; Hu, S. Association of organic carbon with reactive iron oxides driven by soil pH at the global scale. Glob. Biogeochem. Cycles 2022, 36, e2021GB007128. [Google Scholar]
  59. Rowley, M.C.; Grand, S.; Verrecchia, E.P. Calcium-mediated stabilization of organic carbon. Biogeochemistry 2018, 137, 27–49. [Google Scholar]
  60. Lindsay, W.L.; Schwab, A.P. The chemistry of iron in soil and its availability to plants. J. Plant Nutr. 1982, 5, 821–840. [Google Scholar]
  61. Shen, Q.; Demisie, W.; Zhang, S.; Zhang, M. The association of heavy metals with iron oxides in the aggregates of naturally enriched soil. Bull. Environ. Cont. Toxic. 2020, 104, 144–148. [Google Scholar]
  62. Song, X.; Wang, P.; Van Zwieten, L.; Bolan, N.; Wang, H.; Li, X.; Cheng, K.; Yang, Y.; Wang, M.; Liu, T.; et al. Towards a better understanding of the role of Fe cycling in soil for carbon stabilization and degradation. Carbon Res. 2022, 1, 5. [Google Scholar]
  63. Diatta, J. Geoavailability of phyto-concentration of Zn: Facing the critical value challenge (Poland). J. Elem. 2013, 18, 589–604. [Google Scholar]
  64. Grzebisz, W.; Biber, M. Nutrient mass in winter wheat in the Cereal critical Window under different nitrogen levels–effect on grain yield and grain protein content. Agronomy 2024, 14, 2435. [Google Scholar] [CrossRef]
  65. Grzebisz, W.; Szczepaniak, W.; Przygocka-Cyna, K.; Biber, M.; Spiżewski, T. Sources of nutrients for the growing ear of winter wheat in the Critical Cereal Window. Agronomy 2024, 14, 3018. [Google Scholar] [CrossRef]
  66. Schulthess, C.P.; Huang, P. Adsorption of heavy metals by silicon and aluminum oxides surface on clay minerals. Soil Sci. Am. J. 1990, 54, 679–688. [Google Scholar]
  67. Grzebisz, W.; Potarzycki, J. Effect of soil management and fertilization systems on adsorption of trace elements by soil. Rocz. Glebozn. 1996, XLVII, 231–238, (In Polish with English summary). [Google Scholar]
  68. Kociałkowiski, W.Z.; Diatta, J.B.; Grzebisz, W. Evaluation of chelating agents as heavy metals extractants in agricultural soils under threat of contamination. Polish J. Environ. Stud. 1999, 8, 149–154. [Google Scholar]
  69. Wharton, E.S.; Hannah, A.S.; Henry, M.S.; Lydia, G.; Marquez-Bravo, L.R.; Murray, B. McBride. A comparison of screening tests for soil Pb. Soil Sci. 2012, 177, 650–654. [Google Scholar]
  70. Hosseiwwnpur, A.R.; Motaghian, H. Evaluating of many chemical extractants for assessment of Zn and Pb uptake by bean in polluted soils. J. Sci. Plant Nutr. 2015, 15, 24–34. [Google Scholar]
  71. Jarosz, W.; Nowińska, Z. The content of heavy metals in mineral fertilizers and waste lime. Post. Nauk Rol. 1992, 39, 39–43. (In Polish) [Google Scholar]
  72. Magrisso, S.; Belkin, S.; Erel, Y. Lead bioavailability in soil and soil components. Water Air Pollut. 2009, 202, 315–323. [Google Scholar]
  73. Peters, J.B.; Kelling, K.; Speth, P.E.; Offer, S.M. Alfalfa yield and nutrient uptake as affected by pH and applied K. Comm. Soil Sci. Plant Anal. 2005, 36, 583–596. [Google Scholar]
  74. Zielewicz, W.; Grzebisz, W.; Biber, M. Mutual effect of Gypsum and potassium on nutrient productivity in the alfalfa-grass sward-a case study. Plants 2023, 12, 2250. [Google Scholar] [CrossRef]
  75. Macedo, F.G.; Bresolin, J.D.; Santos, E.F.; Furlan, F.; Lops da Silva, W.T.; Polacco, J.C.; Lavres, J. Nickel availability in soil as influenced by liming and its role in soybean nitrogen metabolism. Front. Plant Sci. 2016, 7, 1358. [Google Scholar]
  76. Strączyński, S.J. Nickel content in selected plants species cultivated on areas affected by “Głogów” copper smelter. Zesz. Probl. PNR 2003, 492, 367–373, (In Polish with English summary). [Google Scholar]
  77. Spiak, Z. Sensitivity of various plant species to the high concentration of nickel in soil. Zesz. Probl. PNR 1996, 434, 980–984, (In Polish with English summary). [Google Scholar]
  78. Grzebisz, W. The stand value after alfalfa with timothy. Part I. The evaluation of post-harvest residues value. Rocz. Akad. Rol. W Poznaniu 1985, CLXVI, 57–65, (In Polish with English summary). [Google Scholar]
  79. Rabinovich, A.; Di, R.; Lindert, S.; Heckman, J. Nickel and soil fertility: Review of benefits to environment and food security. Environments 2024, 11, 177. [Google Scholar] [CrossRef]
Figure 1. Effect of long-term organic and mineral fertilization on clay content and its distribution in the soil profile of winter wheat grown in crop rotation. Similar letters indicate a lack of significant difference between experimental treatments using Tukey’s test. The vertical bar in the column is the standard error of the mean. Legend: AC—absolute control; FM—farmyard manure; NPK—mineral N, P, K fertilization; NPK + FM—complementary NPK and FM application; NPK + L—NPK plus lime application; A, B, C—soil layers 0.0–30 cm, 30–60 m, 60–90 m, respectively.
Sustainability 17 02907 g001
Figure 2. Effect of long-term organic and mineral fertilization on Humus Stability Index and its distribution in the soil profile of winter wheat grown in crop rotation. Similar letters indicate a lack of significant difference between experimental treatments using Tukey’s test. The vertical bar in the column is the standard error of the mean. Legend: AC—absolute control; FM—farmyard manure; NPK—mineral N, P, K fertilization; NPK + FM—complementary NPK and FM application; NPK + L—NPK plus lime application; A, B, C—soil layers 0.0–30 cm, 30–60 m, 60–90 m, respectively.
Sustainability 17 02907 g002
Figure 3. Effect of long-term organic and mineral fertilization on manganese (Mn) content and distribution in the soil profile of black fallow. Similar letters indicate a lack of significant difference between experimental treatments using Tukey’s test. The vertical bar in the column is the standard error of the mean. Legend: AC—absolute control; FM—farmyard manure; NPK—mineral N, P, K fertilization; NPK + FM—complementary NPK and FM application; NPK + L—NPK plus lime application; A, B, C—soil layers 0.0–30 cm, 30–60 m, 60–90 m, respectively.
Sustainability 17 02907 g003
Figure 4. Effect of long-term organic and mineral fertilization on nickel (Ni) distribution in the soil profile of black fallow. Similar letters indicate a lack of significant difference between experimental treatments using Tukey’s test. The vertical bar in the column is the standard error of the mean. Legend: AC—absolute control; FM—farmyard manure; NPK—mineral N, P, K fertilization; NPK + FM—complementary NPK and FM application; NPK + L—NPK plus lime application; A, B, C—soil layers 0.0–30 cm, 30–60 m, 60–90 m, respectively.
Sustainability 17 02907 g004
Figure 5. Effect of long-term organic and mineral fertilization on copper (Cu) content and distribution in the soil profile of winter wheat grown in monoculture. Similar letters indicate a lack of significant difference between experimental treatments using Tukey’s test. The vertical bar in the column is the standard error of the mean. Legend: AC—absolute control; FM—farmyard manure; NPK—mineral N, P, K fertilization; NPK + FM—complementary NPK and FM application; NPK + L—NPK plus lime application; * medium Cu availability class; A, B, C—soil layers 0.0–30 cm, 30–60 m, 60–90 m, respectively.
Sustainability 17 02907 g005
Figure 6. Effect of long-term organic and mineral fertilization on zinc (Zn) content and distribution in the soil profile of winter wheat grown in crop rotation. Similar letters indicate a lack of significant difference between experimental treatments using Tukey’s test. The vertical bar in the column is the standard error of the mean. Legend: AC—absolute control; FM—farmyard manure; NPK—mineral N, P, K fertilization; NPK + FM—complementary NPK and FM application; NPK + L—NPK plus lime application. * medium Cu availability class; A, B, C—soil layers 0.0–30 cm, 30–60 m, 60–90 m, respectively.
Sustainability 17 02907 g006
Figure 7. Effect of long-term organic and mineral fertilization on nickel (Ni) content and distribution in the soil profile of winter wheat grown in crop rotation. Similar letters indicate a lack of significant difference between experimental treatments using Tukey’s test. The vertical bar in the column is the standard error of the mean. Legend: AC—absolute control; FM—farmyard manure; NPK—mineral N, P, K fertilization; NPK + FM—complementary NPK and FM application; NPK + L—NPK plus lime application; A, B, C—soil layers 0.0–30 cm, 30–60 m, 60–90 m, respectively.
Sustainability 17 02907 g007
Figure 8. Effect of long-term organic and mineral fertilization on lead (Pb) content and distribution in the soil profile of winter wheat grown in crop rotation. Similar letters indicate a lack of significant difference between experimental treatments using Tukey’s test. The vertical bar in the column is the standard error of the mean. Legend: AC—absolute control; FM—farmyard manure; NPK—mineral N, P, K fertilization; NPK + FM—complementary NPK and FM application; NPK + L—NPK plus lime application; A, B, C—soil layers 0.0–30 cm, 30–60 m, 60–90 m, respectively.
Sustainability 17 02907 g008
Figure 9. Effect of the content of available iron (Fe) on the content of available zinc (Zn). Legend: BF—black fallow; MO—winter wheat monoculture; CR—winter wheat in crop rotation.
Sustainability 17 02907 g009
Figure 10. Available iron (Fe) as a driver of bioavailable lead (Pb).
Sustainability 17 02907 g010
Table 1. The effect of long-term soil system use and diversified fertilization on the basic physical characteristics of soil fertility.
FactorLevel ofEC-BFSa-BFSi-BFCl-BFEC-BFSa-MOSi-MOCl-MOEC-BFSa-CRSi-CRCl-CR
FactormS·m−1%mS·m−1%mS·m−1%
FertilizationControl709 ± 8 #86.5 ± 4.9 a9.8 ± 3.7 c3.7 ± 1.7 b697 ± 1778.1 ± 5.5 ab18.1 ± 4.0 ab3.8 ± 2.0 c711 ± 4179.0 ± 7.7 ab16.1 ± 6.5 ab4.9 ± 2.0 bc
variantsFarmyard manure715 ± 1173.8 ± 6.4 c20.3 ± 4.7 a5.8 ± 2.1 a703 ± 1875.8 ± 3.7 ab18.9 ± 2.8 ab5.3 ± 1.3 bc729 ± 6675.7 ± 9.9 b17.5 ± 7.3 a6.8 ± 3.8 ab
(FV)NPK697 ± 3781.8 ± 1.4 ab14.3 b ± 1.34.0 ± 1.3 b730 ± 10773.3 ± 7.7 b21.3 ± 6.25.4 ± 1.7 bc684 ± 2584.2 ± 3.2 a11.6 ± 3.4 b4.3 ± 2.0 c
NPK + FM710 ± 6.178.4 ± 6.5 bc16.5 ± 5.8 ab5.1 ± 1.7 ab701 ± 2578.9 ± 5.2 a14.9 ± 3.6 b6.2 ± 1.9 b712 ± 2573.5 ± 8.5 b18.3 ± 4.1 a8.2 ± 5.6 a
NPK + Lime710 ± 1278.5 ± 7.5 bc16.4 ± 6.9 b5.1 ± 2.3 ab704 ± 2573.0 ± 1.7 b18.8 ± 1.8 ab8.2 ± 1.3 a700 ± 1375.5 ± 8.5 b17.1 ± 7.7 ab7.4 ± 1.8 a
Fc0. p1.4 ns14.7 ***15.9 ***4.9 ***0.8 ns3.9 **4.5 **15.5 ***2.1 ns6.8 ***3.8 *11.0 ***
Soil layers0–30705 ± 2982.5 ± 3.5 a12.9 ± 3.3 b4.7 ± 1.6 b708 ± 3678.5 ± 4.4 a16.8 ± 3.34.8 ± 2.1 b702 ± 2781.0 ± 4.3 a15.2 ± 3.53.9 ± 2.1 c
(SL), cm30–60713 ± 778.0 ± 7.3 b16.5 ± 5.7 a5.6 ± 2.0 b713 ± 7975.3 ± 5.8 ab19.0 ± 4.65.8 ± 2.2 ab704 ± 3178.3 ± 5.8 b16.1 ± 4.95.7 ± 1.8 b
60–90707 ± 1479.0 ± 8.6 b17.0 ± 7.1 a4.0 ± 2.0 ab701 ± 2473.7 ± 5.5 a19.5 ± 4.76.8 ± 1.7 a715 ± 5773.5 ± 10.3 b17.2 ± 8.09.4 ± 3.8 a
Fc, p1.0 ns6.2 **9.0 ***6.3 **0.3 ns5.4 **3.0 ns10.8 ***0.7 ns9.4 ***0.8 ns52.7 ***
Source variation for the studied interaction
FV × SLns*********nsnsnsnsns*********
Similar letters in a column indicate a lack of significant differences between experimental treatments using Tukey’s test; ***, **, * indicate significant differences at p < 0.001, p < 0.01, and p < 0.05, respectively; ns—nonsignificant. Legend: EC—electrical conductivity; Sa, Si, Cl—granulometric fractions of sand, silt, and clay, respectively; BF—black fallow; MO—winter wheat grown in monoculture; CR—winter wheat grown in crop rotation; #—standard deviation.
Table 2. The effect of long-term soil system use and diversified fertilization on the basic chemical characteristics of soil fertility.
FactorLevel ofpH-BFC-BFHSIpH-MOC-MOHSIpH-CRC-CRHSI
Factor g·kg−1 g·kg−1 g·kg−1
FertilizationControl6.0 ± 0.3 ab #6.3 ± 17 c8.0 ± 1.7 a6.4 ± 0.1 ab12.1 ± 3.9 cd10.2 ± 4.2 b6.6 ± 0.310.8 ± 2.6 c10.0 ± 4.0 ab
variantsFarmyard Manure5.9 ± 0.4 b8.9 ± 2.2 a6.5 ± 3.1 a–c6.0 ± 0.4 c15.2 ± 10 a11.0 ± 7.4 ab6.5 ± 0.316.0 ± 5.1 a14.2 ± 8.6 a
(FV)NPK6.2 ± 0.3 ab4.6 ± 1.2 e4.4 ± 1.0 c6.7 ± 0.3 a10.5 ± 5.8 d7.7 ± 5.5 c6.7 ± 0.211.2 ± 4.6 c12.4 ± 4.4 b
NPK + FM6.2 ± 0.2 ab8.0 ± 2.2 b7.6 ± 5.6 ab6.4 ± 0.2 b13.0 ± 7.3 b12.2 ± 9.2 a6.6 ± 0.213.9 ± 6.8 b11.2 ± 7.9 a
NPK + Lime6.3 ± 0.2 a5.2 ± 2.5 d5.2 ± 3.8 bc6.5 ± 0.2 ab11.0 ± 5.6 cd7.2 ± 3.8 c6.6 ± 0.313.9 ± 7.1 b10.0 ± 4.8 ab
Fc, p 2.7 *205 ***6.0 ***11.4 ***38.7 ***19.9 ***0.4 ns60.7 ***5.7 ***
Soil layers0–306.0 ± 0.49.2 ± 1.9 a9.6 ± 4.0 a6.4 ± 0.320.8 ± 4.6 a17.3 ± 4.9 a6.6 ± 0.319.4 ± 4.0 a18.2 ± 4.7 a
(SL), cm30–606.1 ± 0.26.3 ± 2.2 b5.3 ± 1.8 b6.4 ± 0.49.7 ± 2.0 b7.2 ± 2.6 b6.5 ± 0.312.6 ± 1.9 b11.0 ± 2.8 b
60–906.2 ± 0.24.4 ± 1.4 c4.1 ± 1.8 c6.5 ± 0.36.5 ± 1.0 c4.4 ± 1.1 c6.7 ± 0.37.4 ± 1.9 c5.5 ± 2.5 c
Fc0. p 2.8 ns608 ***35.0 ***3.1 ns1052 ***323 ***1.8 ns786 ***122 ***
Source variation for the studied interaction
FV × SL ns******ns******ns******
Similar letters in a column indicate a lack of significant difference between experimental treatments using Tukey’s test; ***, * indicate significant differences at p < 0.001, p < 0.01, and p < 0.05, respectively; ns—nonsignificant. Legend: pH—soil reaction; C—the content of organic carbon; HSI—Humus Stability Index; BF—black fallow; MO—winter wheat grown in monoculture; CR—winter wheat grown in crop rotation; #—standard deviation.
Table 3. The effect of long-term black fallow on the content of available nutrients and heavy metals (mean ± SD, mg·kg−1) in soil.
FactorLevel ofFeMnZnCuNiPbCd
Factor
FertilizationControl232 ± 127 M #43.3 ± 17 b M4.9 ± 2.0 M/H4.5 ± 1.3 M/H0.03 ± 0.03 c4.3 ± 1.40.27 ± 0.06
variantsFarmyard Manure278 ± 130 M/H64.8 ± 19 a M5.2 ± 2.4 M/H4.0 ± 2.2 M/H0.42 ± 0.4 a4.5 ± 1.10.27 ± 0.04
(FV)NPK223 ± 130 M42.5 ± 17 b M5.6 ± 2.8 M/H5.7 ± 2.0 M/H0.05 ± 0.04 c4.5 ± 1.40.27 ± 0.05
NPK + FM243 ± 123 M56.2 ± 14 ab M5.8 ± 3.5 M/H4.9 ± 2.2 M/H0.2 ± 0.2 b4.4 ± 1.10.28 ± 0.04
NPK + Lime219 ± 129 M45.7 ± 17 b M5.4 ± 3.1 M/H4.2 ± 1.8 M/H0.07 ± 0.03 c4.3 ± 0.90.27 ± 0.05
Fc. p1.1 ns5.7 ***0.4 ns1.7 ns33.7 ***0.2 ns0.1 ns
Soil layers0–30377.5 ± 102 a M60.2 ± 13 a M8.0 ± 2.4 a H5.4 ± 1.7 M/H0.08 ± 0.1 b5.62 ± 1.0 a0.31 ± 0.02 a
(SL), cm30–60198.2 ± 74 b M45.4 ± 16 b M4.3 ± 1.7 b M/H4.3 ± 1.6 M/H0.13 ± 0.2 b4.01 ± 0.6 b0.26 ± 0.1 b
60–90141 ± 35 b M45.9 ± 23 b M3.8 ± 1.3 b M/H4.3 ± 1.9 M/H0.31 ± 0.4 a3.58 ± 0.6 b0.24 ± 0.04 b
Fc. p51.4 ***7.2 **25.9 ***2.7 ns26.9 ***39.5 ***11.8 ***
Source variation for the studied interaction
FV × SLns*nsns***nsns
Similar letters in a column indicate a lack of significant difference between experimental treatments using Tukey’s test; ***, **, * indicate significant differences at p < 0.001, p < 0.01, and p < 0.05, respectively; ns—nonsignificant. Legend: Fe, Mn, Zn, Cu—micronutrients; Ni, Pb, Cd—heavy metals; # Availability classes: M, medium; H, high [36].
Table 4. Spearman correlation matrix between the content of soil available micronutrients and selected heavy metals in the long-term experiment and PCA factors.
VariableBlack FallowWinter Wheat MonocultureWinter Wheat—Crop Rotation
PC1PC2PC3PC1PC2PC3PC1PC2PC3
EC0.290.280.88−0.180.770.21−0.020.800.30
Sa−0.430.84−0.20−0.610.73−0.03−0.380.89−0.01
Si0.510.750.210.410.780.240.060.950.07
Cl0.010.780.070.640.31−0.330.730.57−0.06
H0.730.55−0.330.77−0.260.030.860.050.20
HSI0.870.00−0.430.77−0.440.060.81−0.330.19
Fe0.950.21−0.030.840.320.220.89−0.10−0.36
Mn−0.410.830.04−0.580.46−0.39−0.680.620.19
Zn0.950.060.110.770.12−0.320.920.21−0.11
Cu−0.67−0.170.630.720.22−0.270.860.33−0.07
Ni0.390.760.11−0.220.280.740.000.430.81
Pb0.900.210.200.890.210.230.910.10−0.20
Cd0.950.03−0.100.760.430.310.920.130.18
Bold—correlation coefficients for R2 ≥ 0.50; Legend: EC—electric conductance; pH—soil reaction; H—humus = 1.724 × organic carbon (Corg); HSI—Humus Stability Index; Sa, Si, Cl—granulometric fractions of sand, silt, and clay, respectively; Fe, Mn, Zn, Cu—micronutrients; Ni, Pb, Cd—heavy metals.
Table 5. The effect of long-term winter wheat monoculture on the content of micronutrients and available heavy metals (mean ± SD, mg kg−1) in soil.
FactorLevel ofFeMnZnCuNiPbCd
Factor
FertilizationControl219 ± 83 ab M #50.1 ± 12 M6.1 ± 3.0 H/M5.8 ± 1.4 M/H0.22 ± 0.1 ab4.4 ± 1.50.21 ± 0.1
variantsFarmyard Manure260 ± 78 a M50.3 ± 10 M6.3 ± 2.2 M/H5.6 ± 1.3 M/H0.21 ± 0.1 ab5.1 ± 1.20.25 ± 0.05
(FV)NPK240 ± 102 ab M51.0 ± 16 M5.1 ± 2.5 M/H5.6 ± 2.4 M/H0.22 ± 0.1 ab4.9 ± 1.50.24 ± 0.1
NPK + FM200 ± 78 ab M49.5 ± 14 M5.6 ± 2.1 M/H5.2 ± 2.2 M/H0.13 ± 0.1 b4.7 ± 1.40.22 ± 0.1
NPK + Lime164 ± 51 b M54.5 ± 14 M5.3 ± 2.6 M/H5.0 ± 1.8 M/H0.31 ± 0.1 a4.2 ± 1.30.21 ± 0.1
Fc, p3.2 *0.3 ns0.6 ns0.5 ns5.3 **1.1 ns1.0 ns
Soil layers0–30245 ± 92 a M54.4 ± 12 M6.4 ± 2.5 M/H6.0 ± 2.1 M/H0.27 ± 0.1 a5.4 ± 1.4 a0.24 ± 0.1
(SL), cm30–60231 ± 78 a M51.9 ± 14 M5.7 ± 2.1 M/H5.4 ± 1.5 M/H0.18 ± 0.1 b4.9 ± 1.2 b0.23 ± 0.1
60–90169 ± 62 b M47.0 ± 13 M4.8 ± 2.6 M/H4.9 ± 1.8 M/H0.21 ± 0.1 ab3.7 ± 1.1 c0.21 ± 0.1
Fc, p7.1 **1.7 ns1.6 ns2.1 ns4.8 *9.3 ***1.9 ns
Source variation for the studied interaction
FV × SLnsnsns*nsnsns
Similar letters in a column indicate a lack of significant difference between experimental treatments using Tukey’s test; ***, **, * indicate significant differences at p < 0.001, p < 0.01, and p < 0.05, respectively; ns—nonsignificant. Legend: Fe, Mn, Zn, Cu—micronutrients; Ni, Pb, Cd—heavy metals; # Availability classes: M, medium; H, high [36].
Table 6. The effect of long-term winter wheat grown in crop rotation on the content of available nutrients and heavy metals (mean ± SD, mg·kg−1) in soil.
FactorLevel ofFeMnZnCuNiPbCd
Factor
FertilizationControl230 ± 86 M #68.0 ± 12 M8.6 ± 2.1 H5.3 ± 1.3 M/H0.54 ± 0.3 b5.5 ± 1.0 a0.20 ± 0.04
variantsFarmyard Manure184 ± 83 M73.8 ± 23 M6.7 ± 2.4 M/H5.3 ± 1.6 M/H0.49 ± 0.3 b4.1 ± 1.5 b0.19 ± 0.1
(FV)NPK196 ± 77 M64.5 ± 20 M5.7 ± 3.8 M/H4.3 ± 1.5 M/H0.43 ± 0.2 b4.5 ± 2.1 ab0.20 ± 0.1
NPK + FM207 ± 76 M71.5 ± 19 M7.8 ± 4.4 M/H5.0 ± 2.3 M/H0.81 ± 0.3 a4.7 ± 1.7 ab0.18 ± 0.1
NPK + Lime197 ± 89 M65.3 ± 13 M7.3 ± 5.4 M/H4.2 ± 1.4 M/H0.35 ± 0.2 b4.5 ± 1.7 ab0.18 ± 0.1
Fc, p0.9 ns0.6 ns2.4 ns1.6 ns10.8 ***2.6 *0.6
Soil layers0–30256 ± 72 a M75.0 ± 14 M10.2 ± 3.7 a H5.6 ± 1.6 a M/H0.43 ± 0.2 b5.9 ± 1.5 a0.23 ± 0.04 a
(SL), cm30–60221 ± 62 a M66.3 ± 16 M7.3 ± 2.6 b H5.1 ± 1.4 a M/H0.66 ± 0.2 a4.8 ± 0.9 b0.19 ± 0.04 b
60–90132 ± 58 b M64.6 ± 21 M4.2 ± 2.5 c M/H3.7 ± 1.6 b M/H0.47 ± 0.3 b3.3 ± 1.4 c0.16 ± 0.1 b
Fc, p21.1 ***2.1 ns28.8 ***8.8 ***9.0 ***25.9 ***12.4 ***
FV × SLnsns**ns**ns
Similar letters in a column indicate a lack of significant difference between experimental treatments using Tukey’s test; ***, **, * indicate significant differences at p < 0.001, p < 0.01, and p < 0.05, respectively; ns—nonsignificant. Legend: Fe, Mn, Zn, Cu—micronutrients; Ni, Pb, Cd—heavy metals; # Availability classes: M, medium; H, high [36].
Disclaimer/Publisher’s Note: The statements, opinions and data contained in all publications are solely those of the individual author(s) and contributor(s) and not of MDPI and/or the editor(s). MDPI and/or the editor(s) disclaim responsibility for any injury to people or property resulting from any ideas, methods, instructions or products referred to in the content.

