Article

Multiobjective Optimization of the Economic Efficiency of Biodegradable Plastic Products: Carbon Emissions and Analysis of Geographical Advantages for Production Capacity

1
School of Management, Tianjin University of Technology, Tianjin 300384, China
2
Polymer Research Institute, Sichuan University, Chengdu 610065, China
*
Author to whom correspondence should be addressed.
Sustainability 2025, 17(7), 2874; https://doi.org/10.3390/su17072874
Submission received: 18 February 2025 / Revised: 13 March 2025 / Accepted: 21 March 2025 / Published: 24 March 2025

Abstract

The objective of this study was to address the limitations of biodegradable plastics—low economic benefits and marketing difficulties. To this end, this study analyzed the production processes of two biodegradable plastics: polylactic acid (PLA) and polybutylene adipate terephthalate (PBAT). Based on this analysis, economic, technical, and environmental improvement indicators were constructed, and an optimization model with the three objectives of profit, carbon emission cost, and process risk was established. In this study, we embedded the improved NSGA-III algorithm to obtain the Pareto optimal solution set. We also proposed the entropy-weighted efficiency index (EWEI) for the analysis of transport advantages based on the distribution of biodegradable plastics production, road density, and regional prices. With a production line capacity of 10,000 tons and an 8% discount rate, the 10-year return of PBAT products was 7,039,931.23 yuan higher than that of PLA products. The profit of PBAT products was 488.92 yuan higher than that of PLA products per ton of production. However, PBAT products exhibited higher carbon-emission cost and process risk than PLA products, especially process risk, by 0.11%. The East China region has obvious geographical advantages, but the Southwest region is constrained by limitations in production capacity and the presence of mountainous terrain. Therefore, it is imperative to optimize China’s overall industrial layout of biodegradable plastics, strengthen the profit acquisition of biodegradable plastics, support the sustainable promotion of the biodegradable plastics market, and effectively minimize the environmental pollution caused by traditional plastics.

1. Introduction

For white pollution—solid waste that comes from various types of plastic products, biodegradable plastics represent the best solution because of their capacity to effectively mitigate carbon emission pollution resulting from the incineration and disposal of non-biodegradable plastics [1,2]. However, the promotion and application of biodegradable plastics are subject to the constraints of the traditional plastic market, particularly in terms of cost and performance [3,4]; cost constraints are particularly important for the market share of biodegradable plastics.
The high costs of biodegradable plastics are primarily due to elevated material supply costs of raw materials and at key stages of production processes. For example, the price of corn, the main raw material for polylactic acid (PLA), remains relatively high [5]. Additionally, the supply of lactide, a critical component in PLA polymerization, relies largely on imports, not only raising costs but also increasing risk of supply chain disruption [6]. Furthermore, the mass production of feedstock corn can potentially affect the population’s future food supply because PLA substances, which are from bio-based sources, are unstable [7,8,9], provide limited yields, and require significant land and water resources [10,11,12]. In addition, the production efficiency of such substances is considerably lower than that of synthetic substances, which may explain the rapid growth in production capacity of fossil-based biodegradable plastics as compared to bio-based biodegradable plastics. The cost of butanediol (BDO), the main raw material of polybutylene adipate terephthalate (PBAT), which has a large market size, is much higher than the production cost of ordinary plastics per unit of consumption. Moreover, with increased market demand, the price of BDO has increased significantly [13]; in early 2023, the average price of BDO in China was 9780 yuan per ton, but by the end of February 2023, the highest price reached 14,033 yuan per ton [14]. In the current Chinese market, PLA and PBAT account for the greatest market proportion of biodegradable plastics. Therefore, analyzing the economic indicators of these two products to propose relative cost control measures is a crucial step in accelerating the promotion of biodegradable plastics.
Globally, the majority of plastic production takes place in Asia (accounting for 49% of the world’s output), with China being the largest producer (28%), followed by Europe and North America (each at 19%) [15]. Moreover, only 8.3% of global plastic production is composed of recycled plastic, and only 1.5% comes from renewable resources [15]. This indicates that 90.2% of production still relies on fossil resources. Regarding macroscopic industrial development, the European Union is vigorously promoting the development of the circular economy and bio-economy through the 6R concept (Rethink, Refuse, Reduce, Reuse, Repair, and Recycle) [16]. The European Bio-based Industries (BBI) consortium, in collaboration with the EU, has invested approximately $4.1 billion in advancing new technologies for the production of monomers and polymers from biomass residues and renewable resources, with the aim of replacing at least 30% of fossil-based raw materials with bio-based alternatives by 2030 [17]. The United States is primarily focused on exploring the waste recovery and recycling of biodegradable plastics. It is actively developing technologies such as biological recycling, biodegradable polymers, and recycling processes in eco-design. In South America, Brazil takes the lead. Companies like Braskem and PHB Industrial are utilizing sugarcane to develop biodegradable packaging materials [18]. The Asian region also demonstrates robust development momentum. Thailand, for instance, is striving to establish itself as a regional bioplastic production hub by offering a 25% tax reduction for bioplastic manufacturing enterprises. Malaysia, leveraging its palm oil industry advantage, extracts approximately 19.8 million tons of raw materials annually from palm oil by-products, thereby effectively reducing production costs [19]. Regarding production processes, Existing research on controlling production costs comes mainly from the perspective of raw material substitution, that is, starch-based raw materials such as cassava, rice straw, and food waste extraction [20,21]. Cassava raw materials are cheap, and medium components are easily obtained; the configuration can be completed by adding yeast powder, calcium carbonate, α-amylase, saccharification enzyme, and other components. Raw materials can also be extracted as organic nutrients from food waste and converted into biofuels, including biodiesel, biomethane, and biohydrogen [22]. Waste preparation also provides the basis for the formation of a larger industrial structure. Considering the economic benefits of the whole life cycle, index decomposition can be carried out in terms of the degradation pathway and degradation time of biodegradable plastics [23,24], as is controlling direct economic expenditures on degradation and indirect expenditures on environmental impacts.
Currently, however, the results of these studies are rather one-sided, reflecting a single factor’s impact on the economic efficiency of products. Indeed, relevant studies focus on the modification and degradation mechanisms of biodegradable plastics [25,26,27]. For each of the specific economic indicators throughout the whole life cycle, no data were analyzed. Research on modification processes involving economic benefits mainly includes the selection of raw materials and processing techniques in chemical reactions, the one-step manufacture of PLA and the two-step preparation of lactic acid from lactide [28,29], as well as the manufacture of PBAT from maleic anhydride [30]. These studies have provided support for the industrialization of biodegradable plastics. However, few studies have specifically and quantitatively analyzed the cost indicators for the production of biodegradable plastics, and some studies only focused on a single factor of cheaper raw materials or catalytic processes or just considered more economical preparation methods [31,32]. However, the approach of raw material substitution addresses only local economic optimization and fails to integrate supply chain risk factors, socioeconomic factors, and the economics of environmental pollution [33,34,35]. Studies on the manufacturing itself do not take into account the economic expenditure of environmental protection, which is contrary to China’s overall economic development concept. Moreover, China is vast in territory, and the strategy of optimizing geographical transportation greatly impacts the overall economy of the Chinese biodegradable plastics market [36,37]. Therefore, economic impact can also be analyzed comprehensively from the perspective of an optimized industrial layout of biodegradable plastics in China and globally.
Based on the foregoing research and analysis, although substantial market feedback indicates that the cost of biodegradable plastics remains excessively high, a detailed quantitative analysis of the primary factors contributing to this high cost is lacking. In light of the aforementioned research, this paper analyzed the production process of biodegradable plastics through market research. The economic indicators of each process link were broken down in detail, and carbon emission indicators and process risk indicators were innovatively incorporated. Furthermore, we analyzed the economic influencing factors of the whole process of biodegradable plastics production under the time series and considered the price fluctuations of raw material per unit consumption. The concept of economic net present value was employed to calculate the overall economic benefit. Meanwhile, an improved NSGA-III algorithm for constructing linear hyperplanes was proposed [38] to facilitate the selection of multiobjective optimal solution sets for net profit, carbon emission, and process risk. Ultimately, through comprehensive data analysis, this study offers valuable insights for the development of the biodegradable plastic industry.

2. Analysis on the Production Process of Biodegradable Plastics

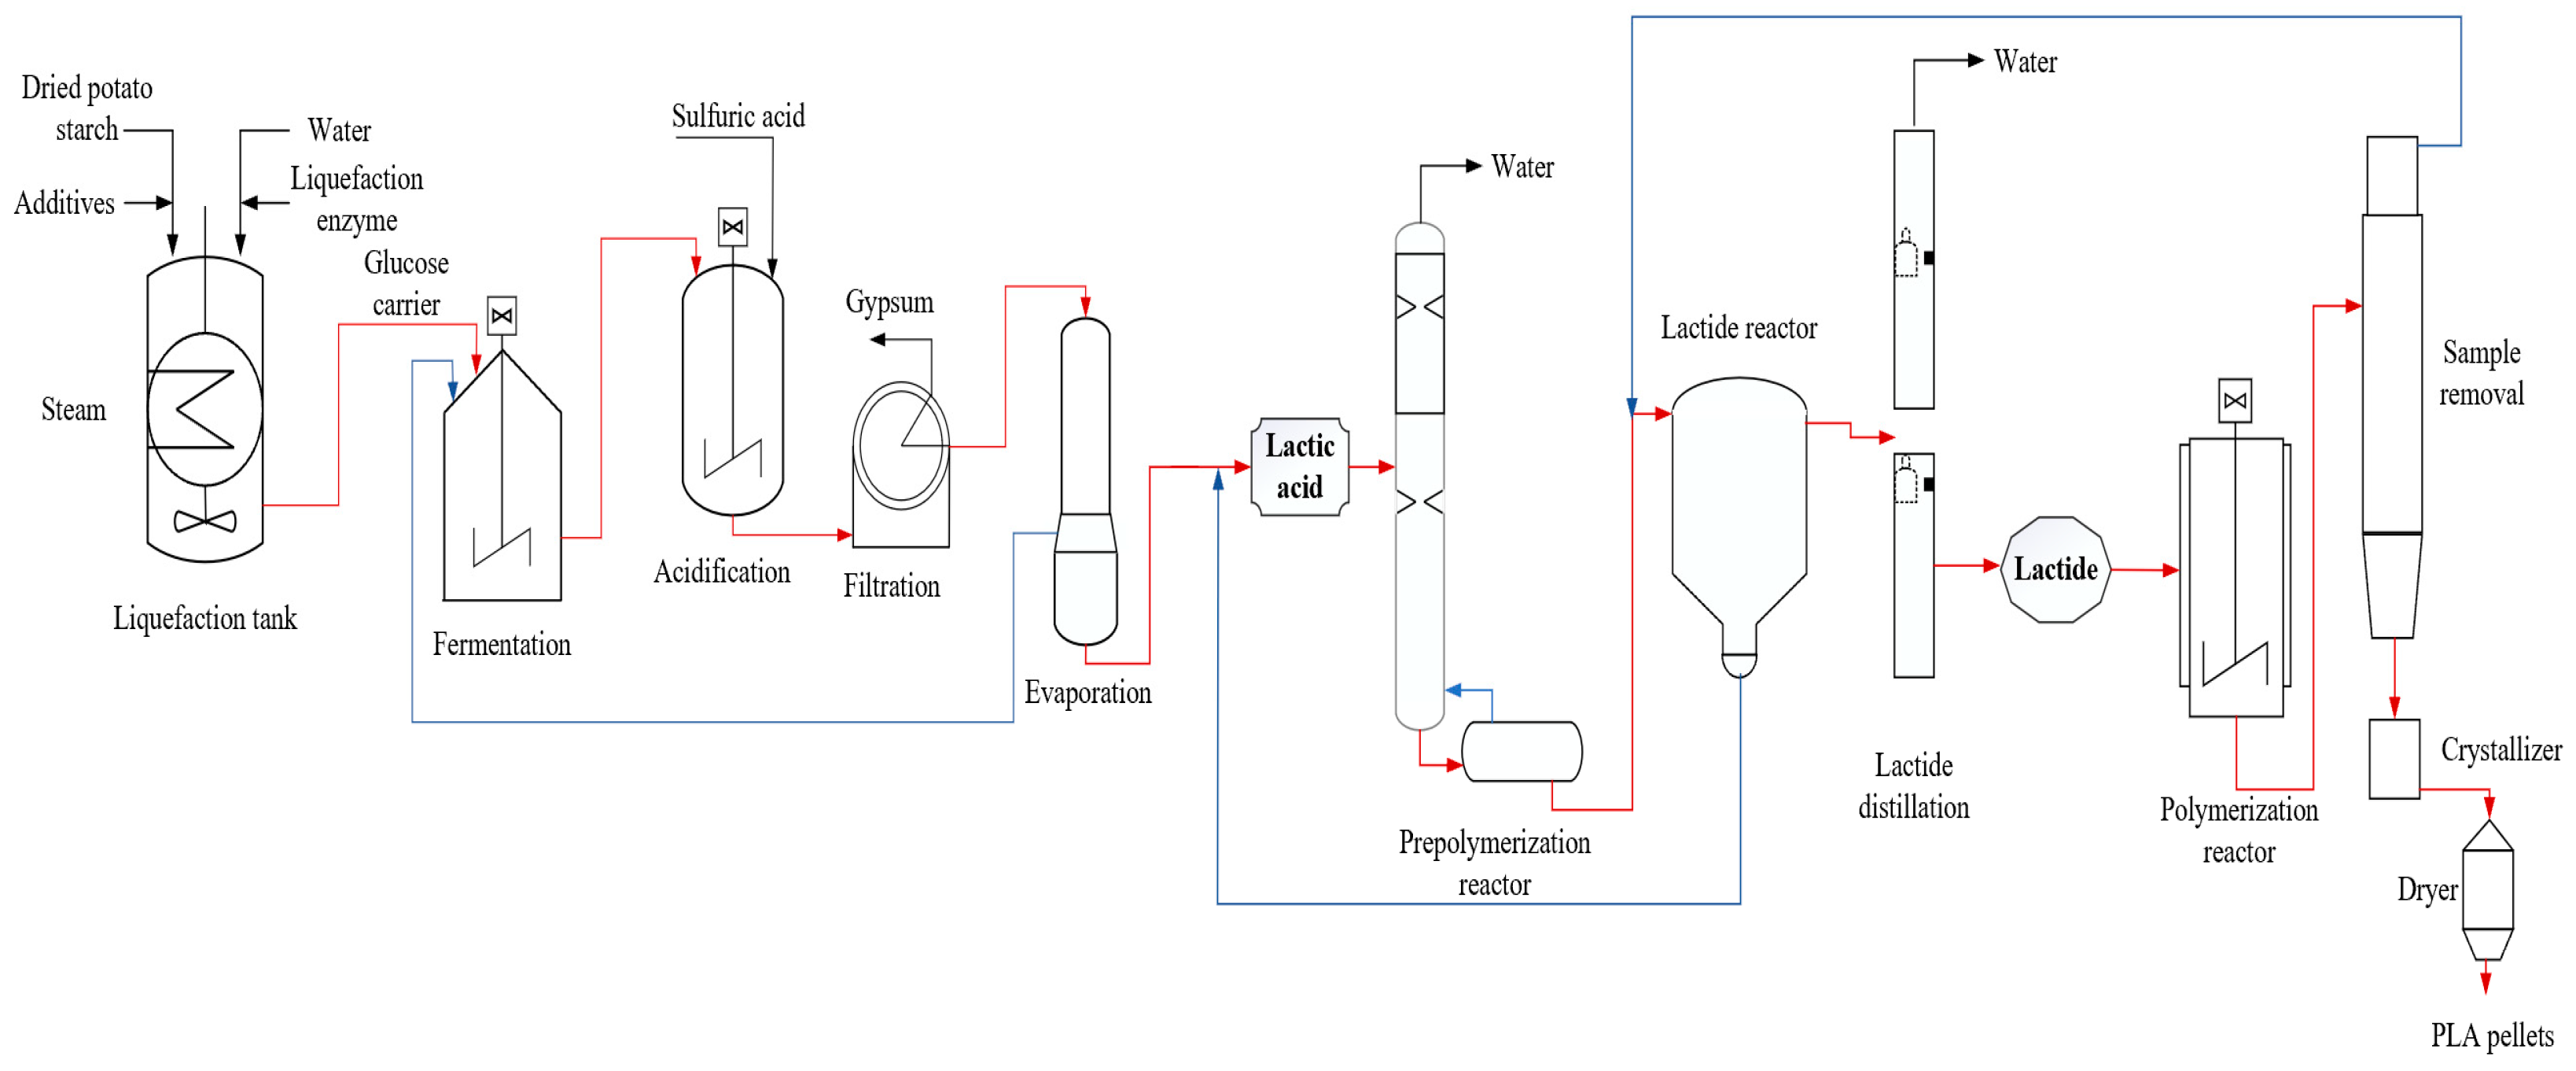
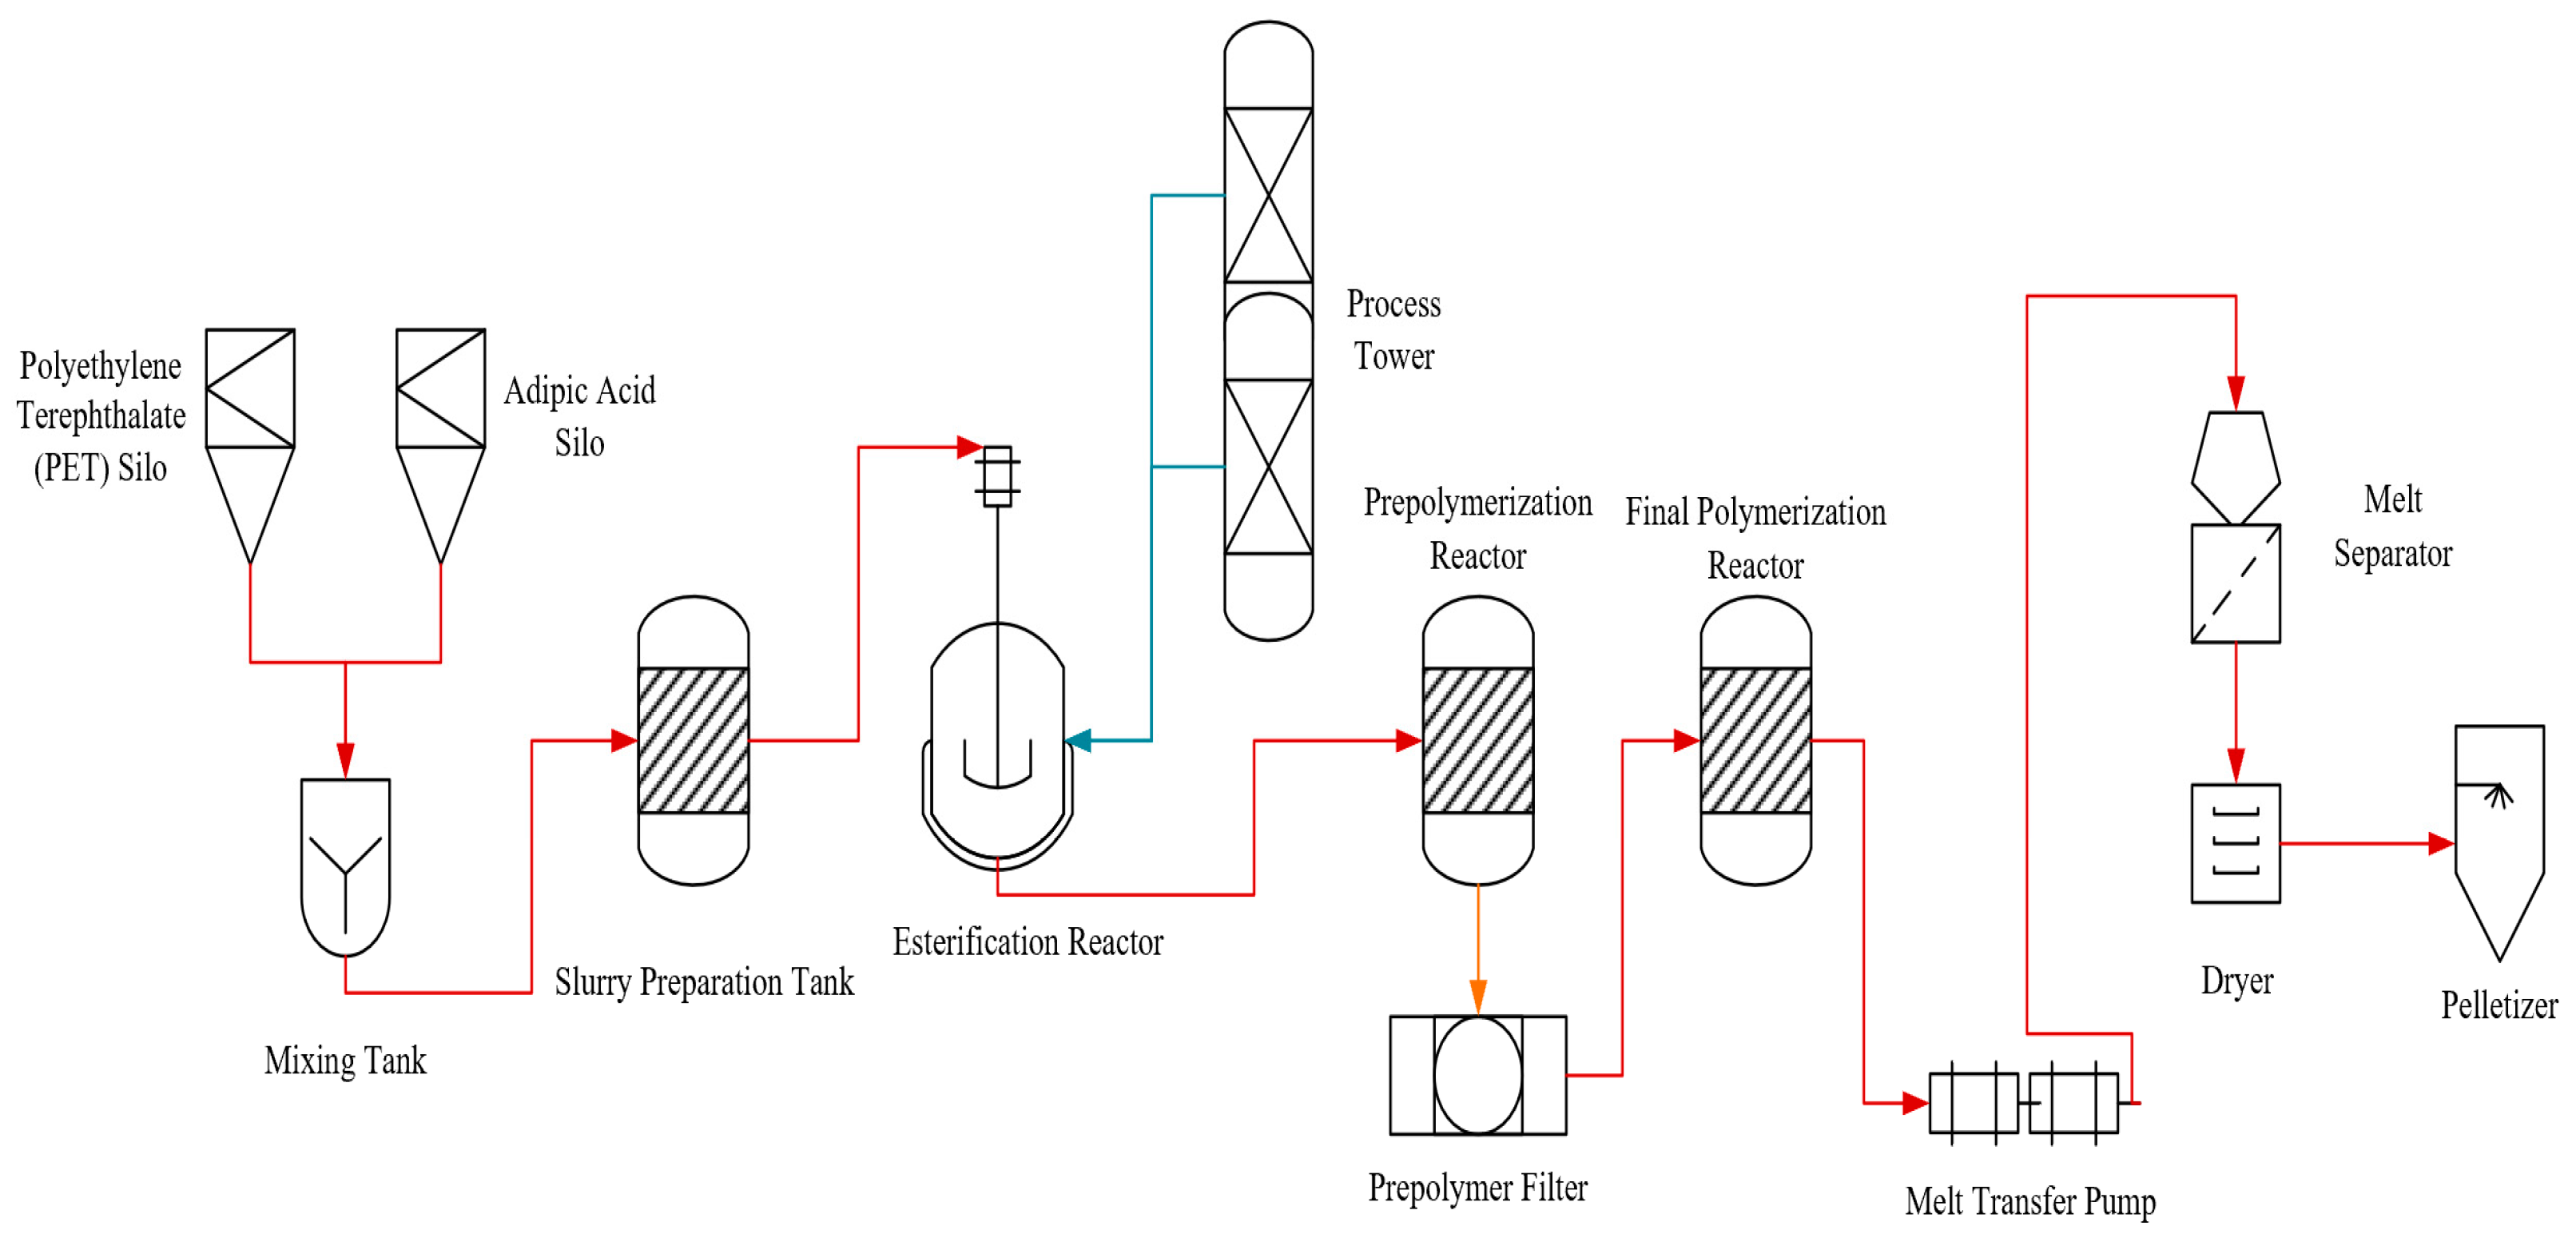
2.1. Decomposition of Processing Technology and Selection of Economic Indicators

The life cycle of biodegradable plastics includes raw material mining, manufacturing, transportation and logistics, use and maintenance, recycling and waste disposal (Figure 1). The economic indicators of the entire process were analyzed and quantified to develop optimal, economically feasible solutions at the national level. To construct an indicator system, four key links in the life cycle of biodegradable plastics, raw material costs, process costs, fixed asset inputs, and waste disposal costs were analyzed below.
The production process of PLA was obtained through an investigation of Guangdong Zhuhai Kingfa Sci.&Tech. Co., Ltd., Zhuhai, China and a review of pertinent literature [39]. The advantage of the process is the polymerization of lactide, which is an intermediate process in the two-step method of preparation. This process allows for the production of high-purity polylactic acid, while simultaneously mitigating the issue of polylactic acid reverse decomposition, which represents a main process adopted in large-scale production facilities in China. The process flow is illustrated in Figure 1. The initial stage of the process entails the formation of industrial-grade lactic acid. In this stage, the raw materials, such as corn or straw, are introduced into the liquefaction tank through which glucose is extracted. The extracted glucose is then transferred to the fermenting tank, where calcium lactate is produced. Subsequently, the calcium lactate undergoes acidification and gypsum filtration, resulting in the formation of crude lactic acid. The crude lactic acid is then evaporated to remove water and purified to remove by-products. Finally, industrial-grade lactic acid is formed. The fermentation stage is of particular significance, representing the primary phase of utilizing microbial activity. At this point, it is imperative to regulate the pH, temperature, and oxygen content, along with other pertinent factors, within the fermenting tank to ensure the optimal microbial activity. Moreover, future improvements to the fermentation method will focus on enhancing the cultivation and screening of lactic acid bacteria, as well as the analysis and separation of enzymes and genes that can efficiently produce lactic acid. In the second stage, lactic acid is dehydrated and condensed to form lactide, which is then subjected to ring-opening polymerization to yield polylactic acid. Specifically, industrial-grade lactic acid is formed into lactic acid oligomer by a prepolymerization reactor, and is injected into a lactide reactor, forming crude lactide by a transesterification reaction, then distilled to obtain refined lactide, and polymerized to form polylactic acid in a polymerization reactor. The resulting polylactic acid is of high purity and exhibits satisfactory performance characteristics. Ultimately, PLA particles are produced following the drying and crystallization process.
The three types of esterification for the preparation of PBAT are coesterification, transesterification, and tandem esterification [40]. Of these methods, coesterification and transesterification are used mostly in industrial production, with transesterification being the mainstream method. Currently, the Chinese market typically adopts a two-step method (See Figure 2 for the specific process) for the preparation of PBAT. The two-step method is represented by the process developed by BASF (Badische Anilin-und-Soda-Fabrik), which employs the same reaction process as the one-step method. The difference between the two methods lies in the duration of the polycondensation process and whether the chain extender is used subsequently to increase molecular weight. The one-step method directly polycondenses the material into a high molecular weight PBAT, while the two-step method first polycondenses the material into a low molecular weight PBAT resin and then adds a chain extender to produce a high molecular weight PBAT. In other words, the two-step method requires less time for polycondensation. PBAT, when prepared by the two-step method, exhibits better physical properties and enhanced anti-aging property. However, the equipment required for the two-step method must be imported, so the equipment investment is higher than that of the one-step method. The chain-extending process involves technical difficulties; dispersion of the chain extender and PBAT is not easy, and if the chain extender is not dispersed uniformly, some melting indices of PBAT will be high and some will be low, negatively affecting the product’s quality.
For the preparation of PBAT, the raw materials are mainly adipic acid (AA), terephthalic acid (PTA), and butanediol (BDO) as monomers, according to a certain ratio, through esterification or an ester exchange reaction and polycondensation reaction to synthesize polybutylene adipate/terephthalate. Currently, the main process adopted in China is the coesterification process, which is characterized by easy availability of raw materials, short processing time, high utilization of raw materials, short reaction time, and high production efficiency [41]. The main process flow is to connect the top of the batching and pulping kettle with the polyterephthalic acid (PTA) and adipic acid (AA) silos, and the bottom of the batching and pulping kettle to the top of the esterification reactor through the slurry conveying pump. The gas phase at the top of the esterification reactor is connected to the central part of the process tower, and the central part of the esterification reactor is connected to the prepolycondensation reactor through the esterification material conveying pump. The esterification process is conducted under strict control of esterification time and requires high temperature and high vacuum. Therefore, the production equipment and process control must meet high standards. After esterification, adipic acid (AA), polyterephthalic acid (PTA), and butanediol (BDO) reach the bottom of the prepolycondensation reactor, which is connected to the final polycondensation reactor through the prepolymerization pump and prepolymerization filter. The final polycondensation reactor is connected to the pelletizing system through the melt transfer pump and melt filter, ultimately to form and produce PBAT. Actual plant research found that the production cost of PBAT comes mainly from raw materials (72%), of which butanediol (BDO) accounts for 34%, and purified terephthalic acid (PTA) accounts for 22%. Thus, the input of raw materials is an important indicator for PBAT production.

2.2. Waste Disposal

Waste disposal includes wastewater, exhaust gas, and solid waste. Wastewater treatment mainly adopts a process of “grating + regulation + coagulation air flotation + AO + filtration + disinfection”, which can extract relevant economic indicators. Such economic indicators also account for the economic impact of wastewater, including organic matter and suspended solids generated during cleaning and crushing processes. Chemical oxygen demand (COD) can reach 2000 mg/L, while suspended solids (SS) can reach 500 mg/L. Exhaust gas components include, for example, benzene, toluene, ethylbenzene, styrene, o-xylene, m-xylene, n-undecane, acetone, butanone, ethyl acetate, and butyl acetate. Production exhaust gas is collected through the collection pipeline, first cooled by the newly added water spray atomizer, then pumped through the existing Roots blower, washed by the newly added spray purification tower, and finally sent into the photo-oxidative exhaust gas treatment equipment, so that the organic exhaust gas in the exhaust gas can be removed. Organic exhaust gas can be discharged in compliance with the standard after being sprayed and filtered by photo-oxidative exhaust gas treatment equipment. Finally, economic indicators of the process equipment and facilities are incorporated into the management of fixed asset expenditure.

2.3. Screening of Technical and Economic Indicators

According to the process flow and other production factors, the cost expenditure of the enterprise is divided into fixed and variable costs. Economic indicators are determined according to the principles of man, machine, material, environment, and management [42,43]. Table 1 displays the construction of the process indicator system.

3. Model Construction

3.1. Objective Function Construction

To optimize the market development strategy for biodegradable plastics, to reduce the white pollution caused by traditional plastics, and to achieve economically feasible integrated planning, this study constructed a multiobjective decision-making optimization model for the market development of biodegradable plastics. The three objectives are maximum economic benefit, minimum carbon emission, and minimum production risk. With the annual carbon emission limit and the production risk of enterprises as constraints, we conducted machine learning using the improved NSGA-III algorithm, to obtain an optimal production plan for the market share of biodegradable plastics during the life cycle of a 10,000-ton production line.

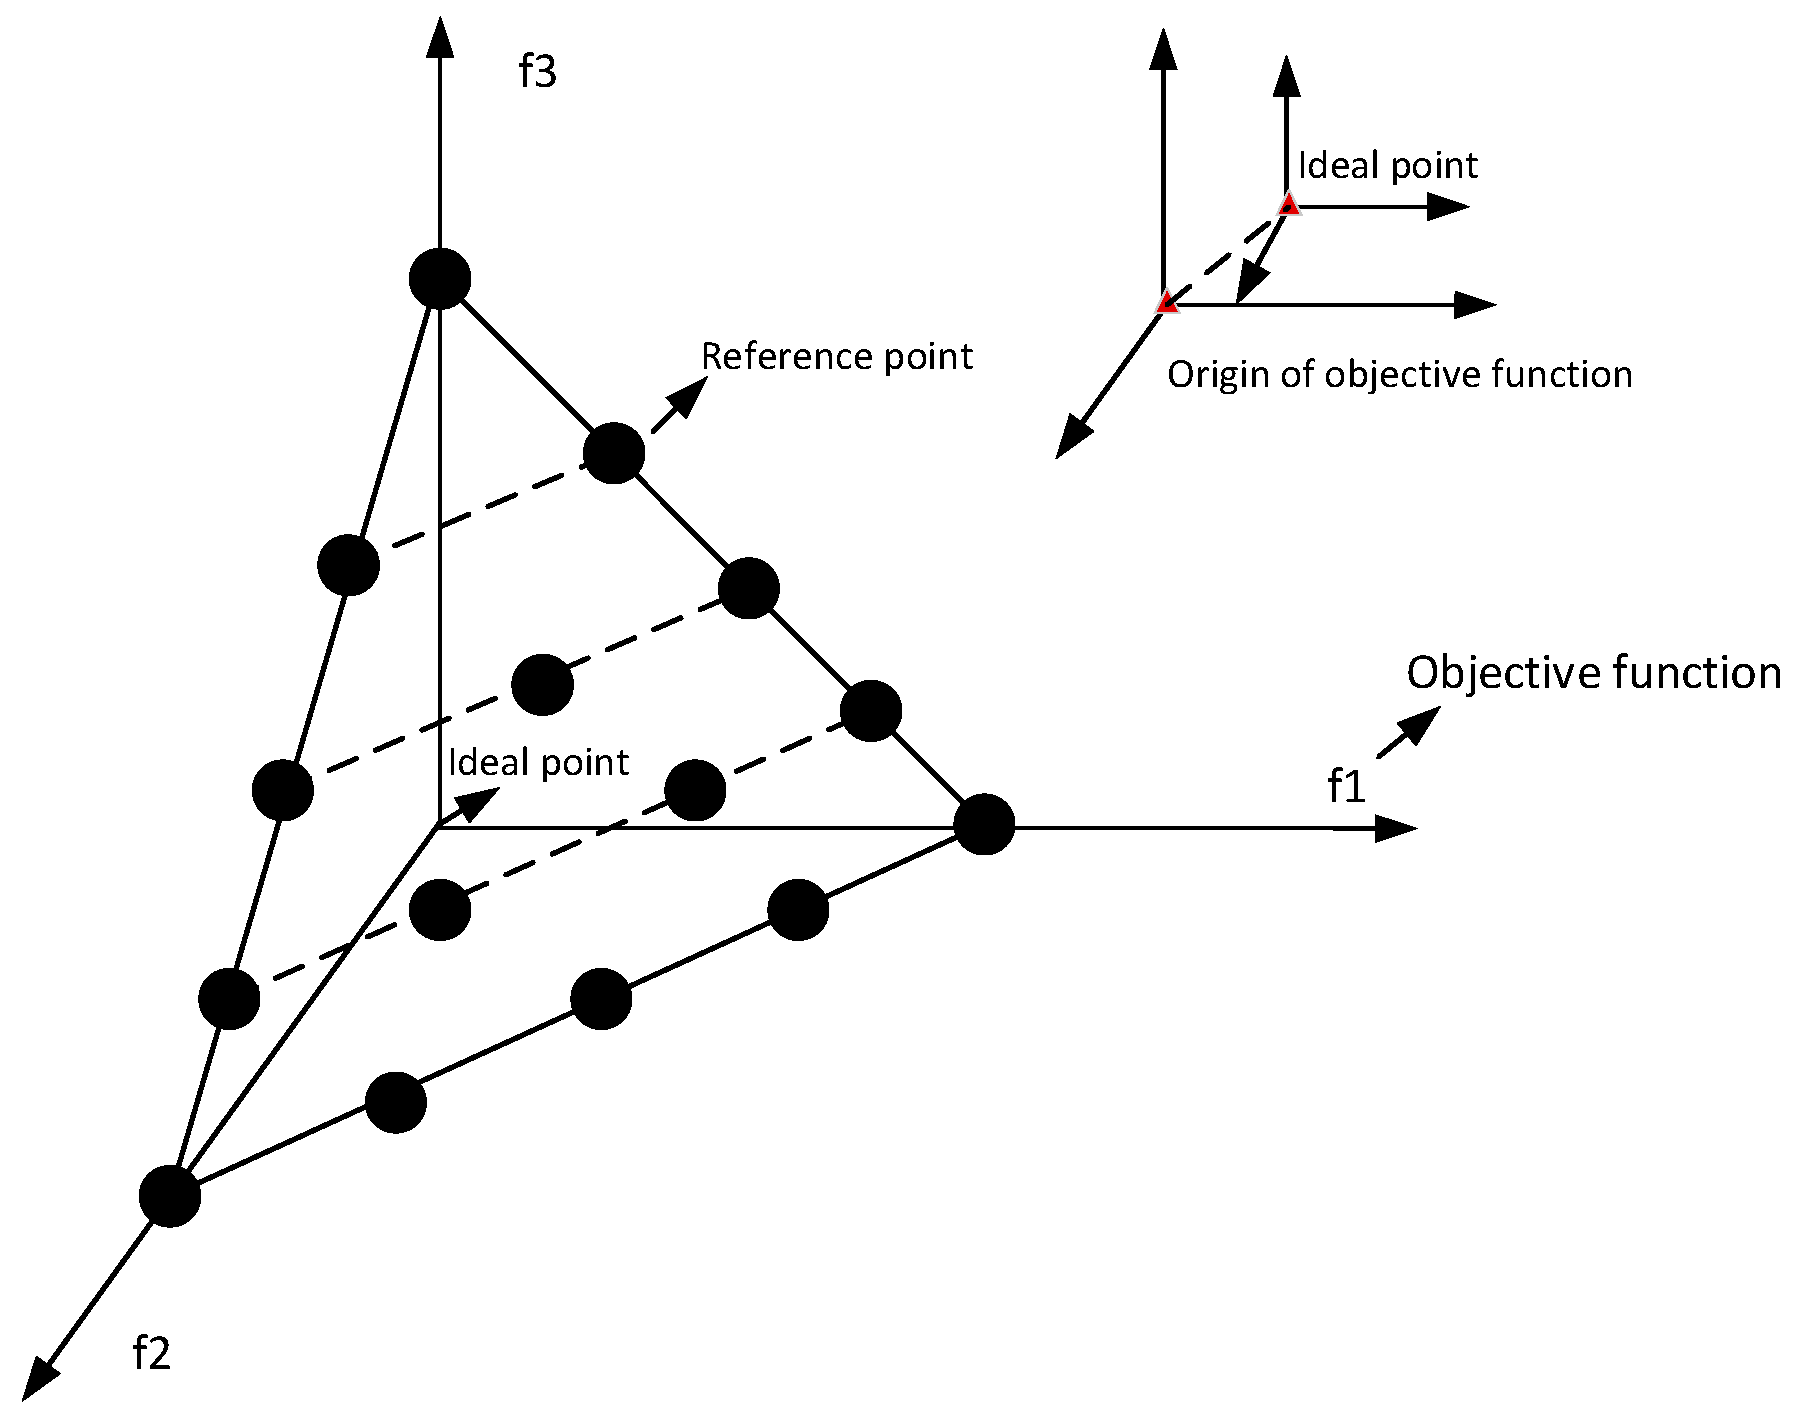
3.1.1. NSGA-III Algorithm

The NSGA-III algorithm [44], an advanced algorithm based on NSGA-II, is used to solve multiobjective optimization problems and find the optimal solution set. It can solve the optimization problems of three or more objectives, and its solutions are evenly distributed on the nondominated layer, solving local optimal problems with better convergence and diversity. The NSGA-III algorithm has the following advantages: (1) it improves the population’s convergence and diversity by introducing a reference point mechanism and can guide the search direction so that the algorithm can adapt to different forms of objective functions and can address multiobjective optimization problems with complex diversity; (2) fast nondominated sorting and efficient selection strategy are used, providing high search and computational efficiencies.
For the NSGA-III algorithm, the adaptive normalization operation of the population is the core of the reference point mechanism. The selection rule for the coordinate value of any reference point is as follows, where H represents the number of reference coordinate segments and M represents the dimension of the objective function, which is three-dimensional in this case:
C j { 0 H , 1 H , , H H } , j = 1 M C j = 1
where C j is the coordinate value of the reference point. On the M-dimensional normalized hyperplane, each objective dimension is divided by H, uniformly generating N(M, H) reference points:
N M , H = M + H 1 ! H ! M 1 !
The hyperplane and reference points are illustrated in the Figure 3, where the quadrant origin of the objective function is the ideal point.
An issue arises when using this method to establish reference points: when H < M, only “boundary reference points” will be generated, and when H = M, only one “middle reference point” will be produced. Therefore, to solve this issue, boundary and middle reference points should be integrated, using the following formula:
C i j = 1 2 C i j + 1 2 · 1 M
The operation steps are as follows:
  • Define the reference point. For a three-dimensional multiobjective optimization problem, the population’s minimum value z m i n in the three objective functions is obtained, and the set it constitutes is defined as reference point set Z ~ .
    Z ~ = z 1 m i n , z 2 m i n , z 3 m i n
  • Translate the target value f i ( x ) . Translate all target values by subtracting the ideal point z i m i n for each target from the target value f i of the population S t to obtain the translated target value.
    f i x = f i x z i m i n , x S t
  • Calculate the extreme point z i , m a x for each target; the extreme value z i , m a x for each one-dimensional coordinate is taken as the minimum of the scalar function in Equation (3).
    A S F x , w = max i = 1 M f i x w i
    z i , m a x = min A S F
Through the calculation of ASF values, specific numerical values for each target direction can be obtained, while min(ASF) yields the extreme value for each target direction.
4.
Construct a linear hyperplane and calculate the intercept a i to achieve normalization of the population’s individual target value. The purpose of normalization is to enable comparison between quantities with different dimensions or ranges, to select superior individuals, and to ensure the convergence of the population.
5.
Normalize the population’s target value; the normalization formula for each individual target value is given in Equation (5).
f i n x = f i x a i z i m i n = f i x z i m i n a i z i m i n
i = 1 , 2 , , N
where i = 1 N f i n = 1 .
In summary, by calculating the number of times each individual in the population is dominated by other individuals, non-dominated sorting ranks are established. Individuals at the same level do not dominate each other, whereas individuals at a higher level dominate those at lower levels. In hierarchical order, individuals from upper layers are preferentially added to the offspring population. For levels that cannot be completely added to the next generation, the process involves setting reference points, calculating extreme points for each objective, constructing a linear hyperplane and calculating intercepts, normalizing population objectives, associating and selecting the closest reference points, and choosing K non-dominated individuals around less-associated reference points to form the new parent generation. This approach not only generates excellent next-generation population individuals but also ensures selection diversity.

3.1.2. Profit Objective

The common method for corporate profit assessment is the net present value (NPV) method [45,46,47], which explicitly considers commissioned funds and the time value of money. The NPV method simplifies benefit–cost analysis by comparing different benefit and cost streams between projects. The financial outlay consists of fixed and variable costs. The variable cost is composed of outlay for raw materials, energy consumption, operation, maintenance, and other non-fixed costs of biodegradable plastics production. The total cost is calculated by considering the effect of time factor and introducing a discount rate, r. Variable production costs are defined as follows: raw materials I, chemical substances C, energy consumption E, transport costs T, waste disposal W, and fixed costs G (operation and maintenance). The economic assessment model is constructed by putting these parameters into the formula. V c o s t is the total production cost incurred in production of each ton of degradable plastic, expressed as follows:
m i n V c o s t = n = 1 N I c o s t 1 + r n + n = 1 N C c o s t 1 + r n + n = 1 N E c o s t 1 + r n + n = 1 N T c o s t 1 + r n + n = 1 N W c o s t 1 + r n n = 1 N B P o u t p u t 1 + r n + G 10,000 n
where B P o u t p u t denotes the output of biodegradable plastics, n is the useful life of fixed asset, and 10,000 means a production line with an annual output of 10,000 tons. Variable production costs incorporate changes caused by the time factor to accurately express the annual operating cost expenditures.

3.1.3. Carbon Emission Objective

The primary sources of carbon emissions from biodegradable plastics are energy consumption, electricity usage, and the transportation of materials during the production process. The main pollutants include carbon oxides (CO2), nitrogen oxides (NOx), and sulfur oxides (SOx). Considering the cost of carbon emissions management and policy constraints, the objective function expression of the annual minimum carbon emission cost is as follows:
m i n V 2 = 1 d P · C · V c o 2 + N · V n o 2 + C T i · V c o 2
where d is the number of days, P is the daily production of biodegradable plastics, C is the total carbon emission per unit of production, V c o 2 , and V n o 2 represent the cost caused by pollution per unit of mass, and C T i is the total carbon emission from transport.
C T i = j = 1 n ( f e c + f e k ) T t r u c k 100 · L r o a d · C c o · Q j
where f e c is the car fuel rate (L/km), f e k is the truck fuel rate (L/km), T t r u c k is the ratio of degradable plastic transport vehicles on the road to the total number of vehicles in normal operation, L r o a d is the total path length, C c o is the vehicle’s carbon emission, and Q j is the daily traffic volume.

3.1.4. Process Risk Objective

A commissioning risk combination and risk contribution model is proposed. The set of risk elements and the evaluation model for commissioning of biodegradable plastics are used to determine the risk system according to man, machine, material, method, and environment, which is refined into five risk categories: safety, quality, financial, supply, and schedule. The risk combination can be obtained from the following formula:
σ x = X T i = 1 m j = 1 m A i A j σ i j X
where i = 1 m j = 1 m A i A j σ i j is the covariance of the rate of return of each risk, σ i j is the covariance of the return of asset i and asset j , and X is a column vector of risk combination weights.
The overall risk contribution of asset i is given by
T R C i = σ i x = x i · M R C i = j x i · x j · σ i j σ x
M R C i = σ x x i = j x j · σ i j σ x
where M R C i is the marginal risk contribution of asset i .
Considering asset correlation, the risk minimization objective function is constructed as follows:
m i n P i = j = 1 N i = 1 N T R C i T R C j

3.1.5. Constraints

(1)
Benefit constraint
The production benefit constraint is determined by considering the production benefit being greater than the annualized return on total assets of 3%, and the net profit formula is as follows:
C I c o s t + C c o s t + E c o s t + T c o s t + W c o s t + N c o s t × 3 %
(2)
Greenhouse gas constraints
The constraints are constructed by considering greenhouse gas emissions in the industrial production process being less than the national target, the different types of greenhouse gas emissions are converted to C O 2 equivalent, and the sum can be obtained as follows:
E G H G   p r o c e s s = E c o 2   p r o c e s s + E N 2 O   p r o c e s s × G W P N 2 O
where G W P N 2 O is the global warming potential ( G W P ) of N 2 O compared with C O 2 . According to the IPCC second assessment report, in a 100-year time scale, 1 ton of N 2 O is equivalent to 310 tons of C O 2 in terms of warming capacity, and G W P N 2 O takes the value of 310. According to the annual emission, by an enterprise, of 10,000 tons of C O 2 , quantifying the carbon emission per 10,000 tons of biodegradable plastics, the following constraint formula is obtained:
0 E G H G   p r o c e s s 416.7
(3)
Risk constraints
To determine process risk parameters accurately, the process risk is weighted to yield constraints as follows:
s t = i = 1 N x i = 1 0 x i 1

3.2. Analysis of the Economic Advantages of Geographical Transport

3.2.1. Road Advantage and Capacity Analysis

To determine the economic advantages of geographical transport, we used road density as an indicator of the transport accessibility of degradable plastic products. Road density is a simple indicator of the structure of the road network, measured by the total length of the regional road network divided by the area of the region. Thus, it is easier to calculate and obtain data for road density as compared to more complex accessibility calculation methods. Given the similarity of the network topology across regions, higher road density implies higher availability of short alternative routes and, thus, better transport accessibility [48]. In addition, road density is more important than quality for road freight transport, which is particularly important for the economic outlay of transporting degradable plastic products. Road density data were calculated based on the national road data set from the Beijing Geographic Data Sharing Infrastructure [49]. Detailed data are shown in Table 2.
Through the investigation of organizations such as Guangdong Zhuhai Kingfa Sci.&Tech. Co., Ltd. and Changchun Institute of Applied Chemistry, Chinese Academy of Sciences (CIAC), and according to the data from the National Bureau of Statistics and Qianzhan database [49,50], we sorted out the information on the production output of biodegradable plastics PLA and PBAT in each province in China, as shown in Figure 4 below.

3.2.2. Entropy-Weighted Efficiency Index (EWEI)

The EWEI integrates data on the economic benefits of biodegradable plastics in different geographical areas with regional transport into a representative value to reflect the benefit potential of plastics for each city [51]. We determined the variance of probability distribution of the economic benefit data of biodegradable plastics for 34 provincial-level administrative regions in China and calculated the EWEI as follows:
Information entropy ( e j ) is defined as Equation (17).
e j = 1 ln n i = 1 n P i j l n P i j
where n is the total number of cities, and P i j is the normalized value of the geo-economic index. P i j is expressed as Equation (18).
P i j = q i j + A i = 1 n q i j + A
We introduced a small offset value A = 0.0001 to avoid ln(0). The geo-economic indicator scale q i j is used to calculate the economic impact component of the j indicator of the city, with local transport factors, biodegradable plastics production capacity and pricing as the elements, as expressed in the equation below:
q i j = C i j × R i j × T i j
where C i j is the price indicator for indicator j in city i , R i j is the regional production capacity, T i j is the transport coefficient, and T i j is the road density of city. Then, the entropy weights of each parameter are calculated according to the equation below:
w j = 1 e j j = 1 m 1 e j
where m is the total number of parameters ( j = 1, 2, 3 … m).
Finally, the E W E I is calculated as Equation (21).
E W E I = j = 1 n w j × q j

4. Analysis of Experimental Results

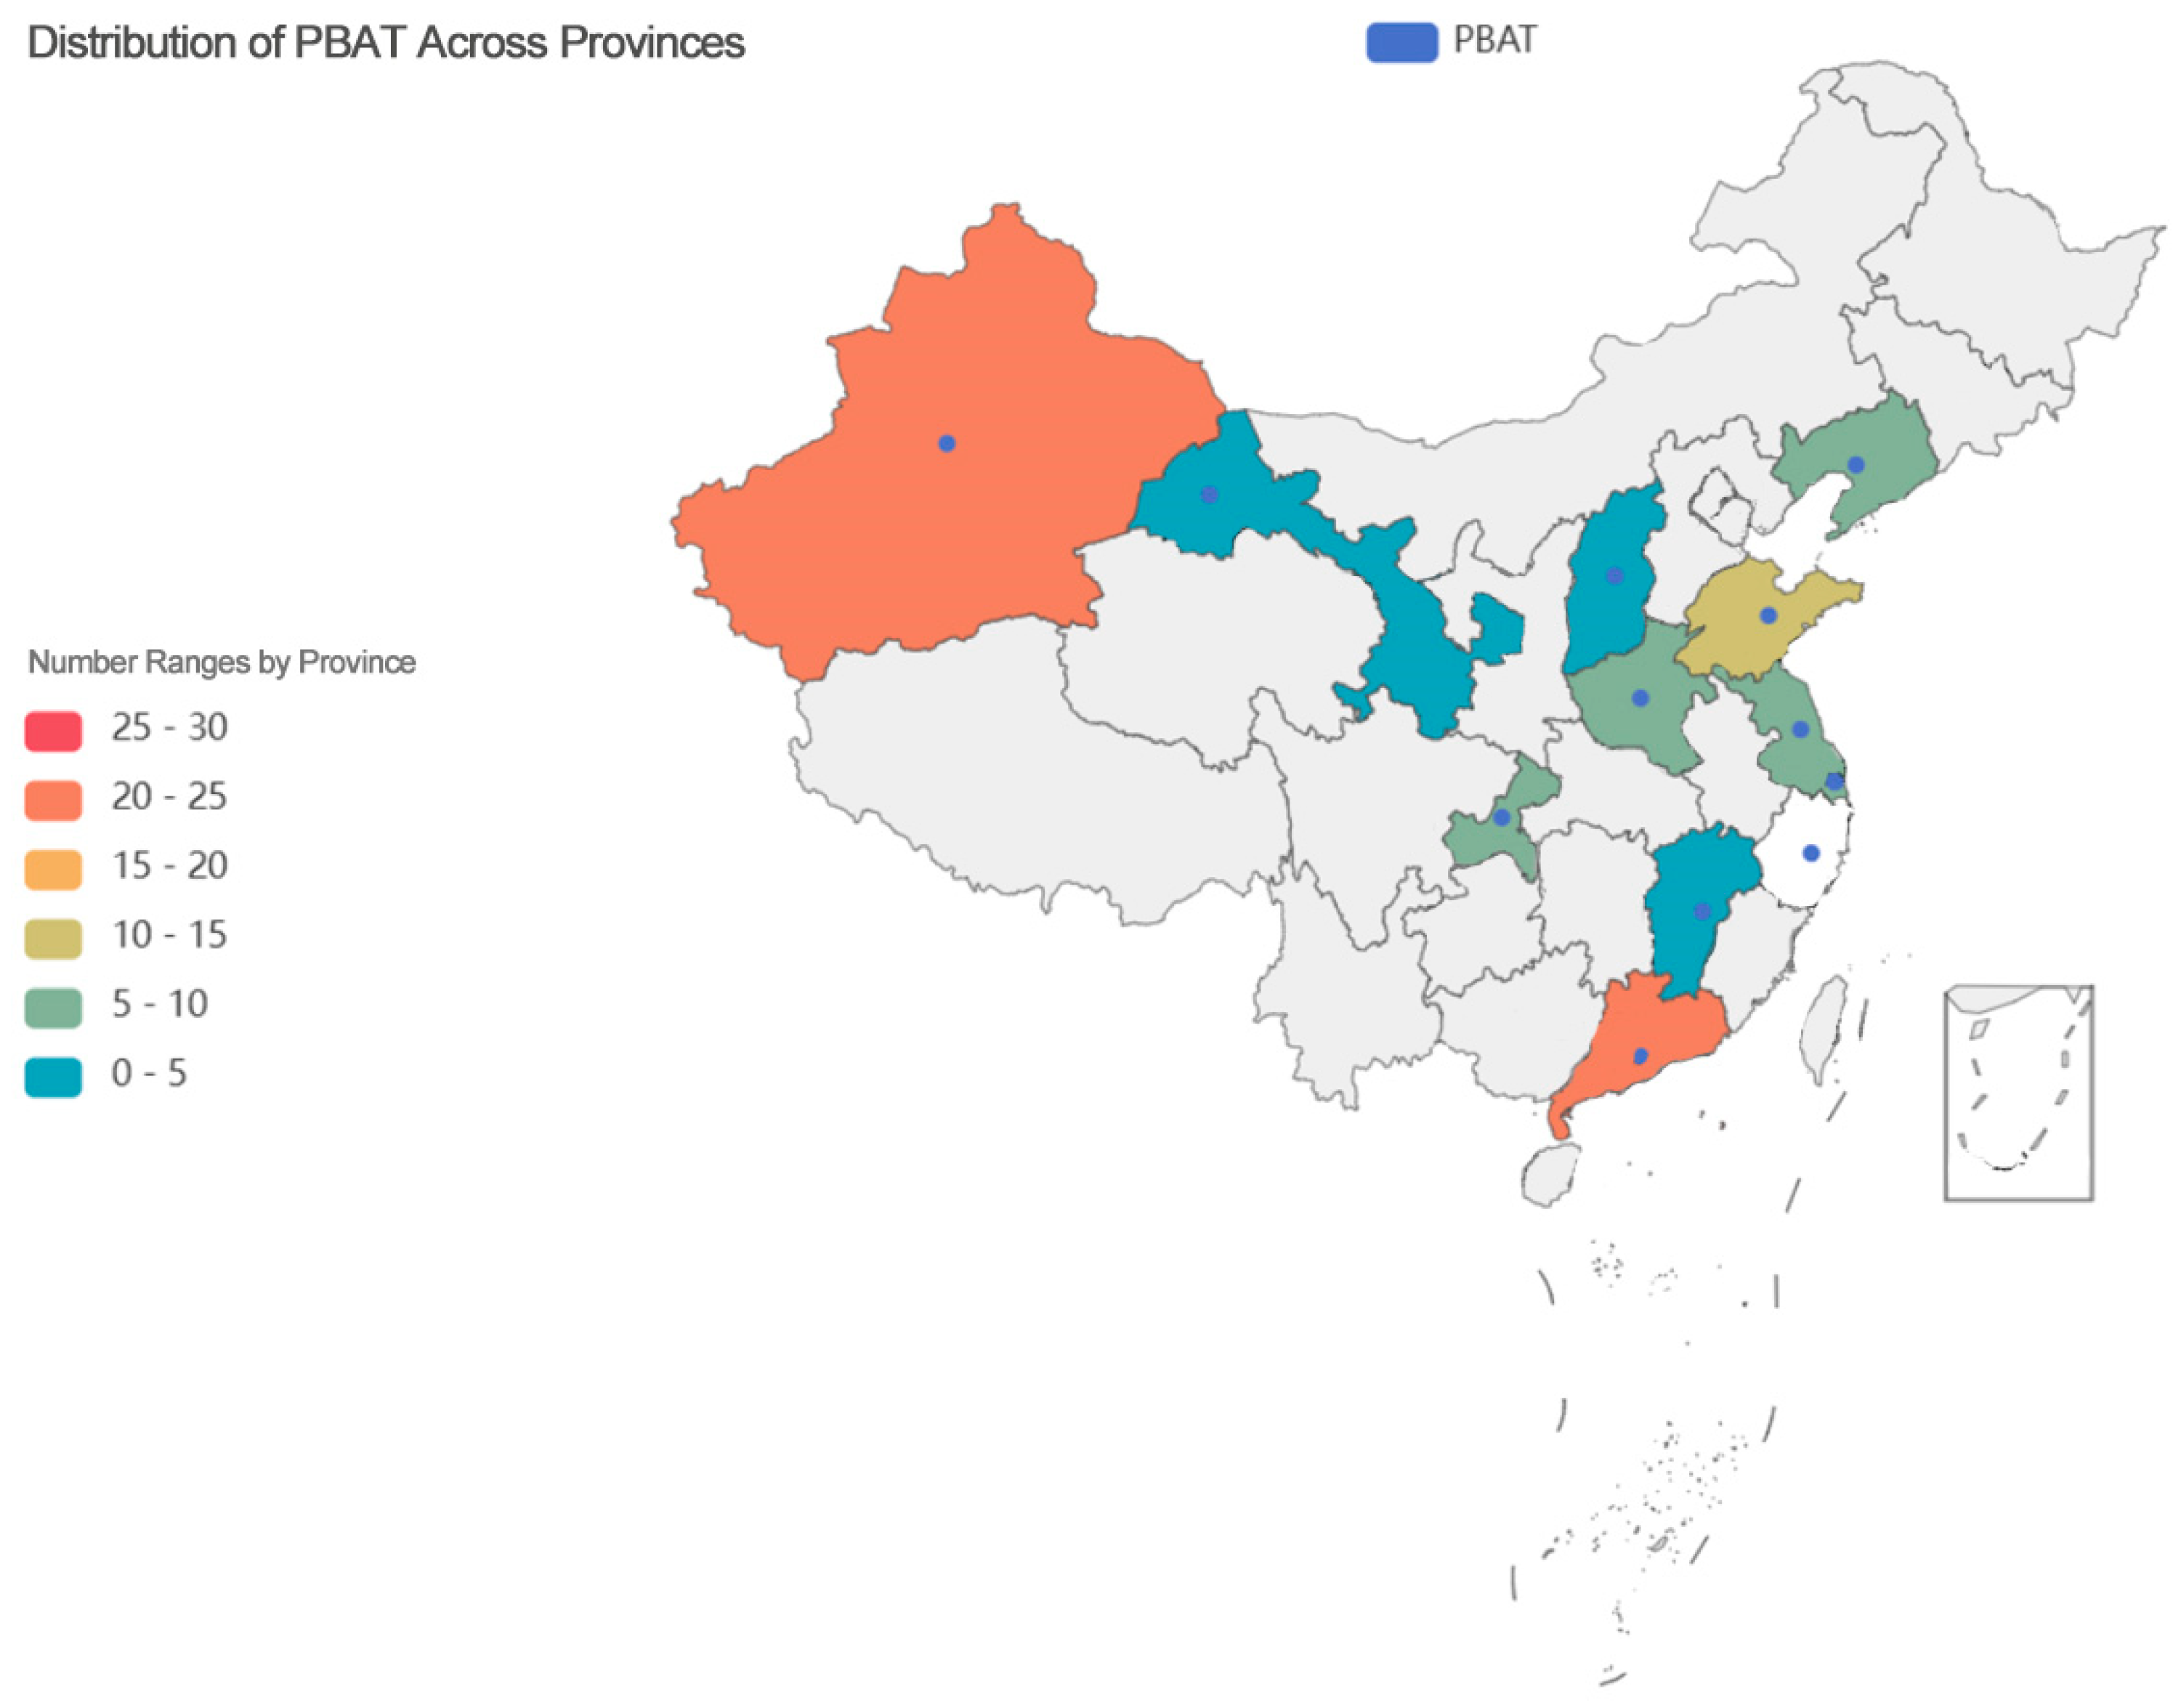
4.1. Project Overview

4.1.1. Economic Data

Multiobjective optimization involves summing basic cost expenditures for the production processes with an annual production of 10,000 tons of PLA and PBAT, respectively. The cost expenditures of each link are sorted out according to the process flow and are normalized to generate data on production cost per ton. For instance, the cost of raw material I of PBAT is the sum of the costs of three kinds of raw materials: terephthalic acid (PTA), butanediol (BDO), and AA. Table 3 summarizes the parameters of these cost indicators.
Considering current consumption and prices among these elements, the analysis of raw materials revealed that 1.5 tons of corn can produce 1 ton of PLA pellets, while each ton of PBAT is mainly synthesized from 0.48 tons of terephthalic acid (PTA), 0.48 tons of Butanediol (BDO), and 0.24 tons of AA. Chemical substances include sodium hydroxide, sulfuric acid, ethyl acetate, yeast extract, and specialized catalysts for PBAT. Energy costs include the costs for the total consumption of water, electricity, steam, gas, and others. Transport costs are derived from the company’s annual average total transport expenditure, and the costs for waste disposal are derived from the annual average cost of waste disposal. Fixed costs are derived by taking into account, for instance, various mixing tanks, reactors, and connecting pipelines, and also encompass fixed cost factors, for instance, construction costs, overheads, maintenance costs, depreciation, and workers’ wages.
An analysis of current market fluctuations reveals that the cost of PBAT comes mainly from raw materials. Over the past 5 years, the price range of BDO has fluctuated from 7000 to 13,000 yuan per ton, while the price range of corn has fluctuated from 2800 to 3000 yuan per ton. Although cost control takes into account raw material-based expenditures, there has not been much analysis of other expenditures. Moreover, the comprehensive economic evaluation of the disposal of the three wastes and the greenhouse gas emissions generated during production, which consider environmental factors, has not been conducted.

4.1.2. Carbon Emission Data

Carbon emissions are calculated using China’s specified standard coal conversion factor. Steam, water, electricity, and fuel oil are converted into each kilogram of standard coal and calculated according to the actual condition of consumption during the production process. The emission coefficients of carbon (C) produced by the complete combustion of one ton of standard coal are divided into three types: the recommended value of 0.67 by the Energy Research Institute of the National Development and Reform Commission of China, the reference value of 0.68 by the Institute of Energy Economics, Japan, and the reference value of 0.69 by the U.S. Energy Information Administration. In this study, the value is 0.68. Table 4 presents data according to equivalent coefficients from the China Energy Statistical Yearbook 2022.

4.1.3. Process Risk

Considering various product manufacturing and safety factors involved in the entire process, process risks are categorized into five types: safety, quality, financial, supply, and schedule risks. Correlation between these risks was evaluated using gray relational analysis. An expert scoring method was employed to construct an evaluation matrix, and the obtained data are presented in Table 5.

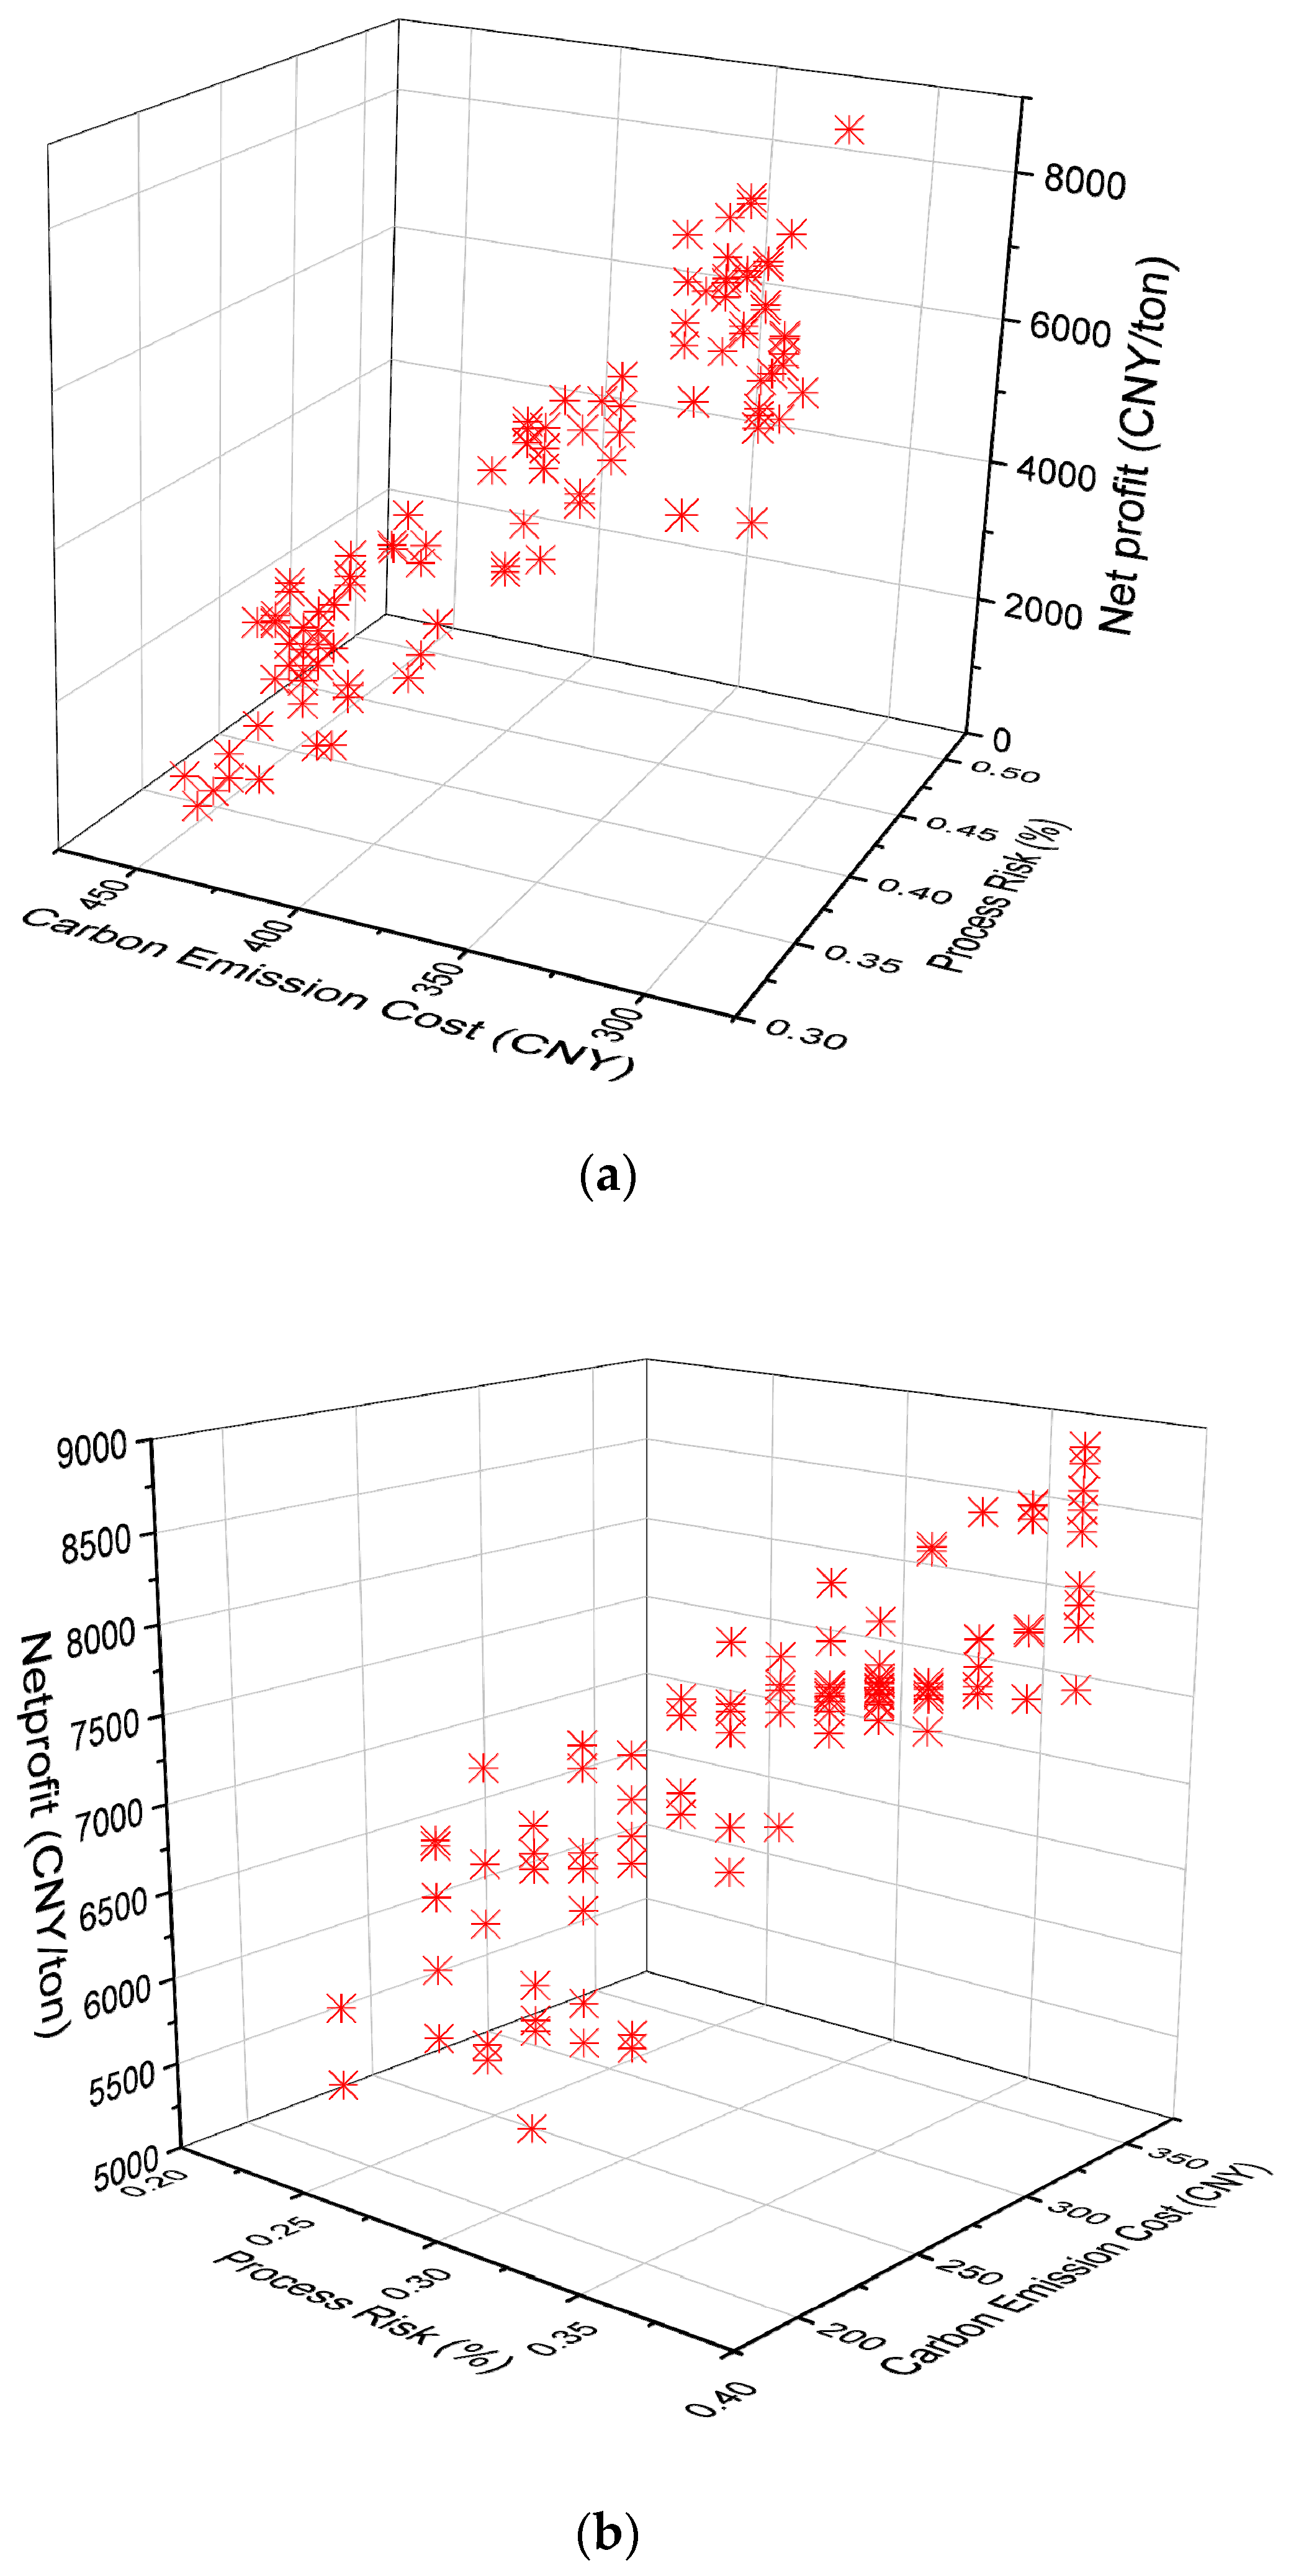
4.2. Analysis of Results

4.2.1. Profitability Analysis

The profitability analysis is primarily based on a ten-year period of net profit data. The economic analysis also considers cumulative cash flows at different discount rates and examines the net present value (NPV) in conjunction with changes in interest rates [52,53]. The discount rate is an important tool that allows future cash flows to be adjusted to the present value. The quality of investment in the industry can be reflected by the discount rate, which, in turn, maps the level of risk or uncertainty that the investment can withstand. According to the current situation of the manufacturing industry, the range of the discount rate is set at 8–12%. Therefore, in this study, the discount rates of 8%, 10%, and 12% were used, and the NPVs of PLA and PBAT were calculated according to the NPV calculation table. Figure 5 shows the obtained results of the ten-year return.
As shown in Figure 5, under the three discount rate bases, a 10,000-ton production line of PBAT can reach a positive profit in the sixth year, and a 10,000-ton production line of PLA can attain a positive net profit in the seventh year when using the discount rate of 8%. With different discount rates, the PBAT production line can achieve a positive net profit by the eighth year at the latest, that is, the overall investment’s full payback, while the PLA line takes, at the latest, nine years to see a payback. Therefore, the same production line construction of PBAT offers greater economic benefits in comparison to PLA and yields a 10-year total return of 74,224,191.39 yuan, which is higher than the 10-year return of PLA of 67,184,260.16 yuan. Under the current economic situation, the production of PBAT products will be better than the production of PLA products, so priority can be given to the unified planning and construction of PBAT production lines in China.

4.2.2. Multiobjective Optimization Analysis of the NSGA-III Algorithm

The key factor in the effectiveness of the NSGA-III algorithm is the selection of reference points. To search accurately for the Pareto optimal solution set, this study built a selection mechanism of hyperplane reference points. To ensure convergence of the iterative process, the initial population was defined as 100, the probability of variance was defined as 0.1, and the simulation was conducted for 200 iterations, resulting in the scatter diagram of the Pareto solution set, as shown in Figure 6. For PBAT products with different strategies, the profit target is 2269.46–8607.57 yuan, the carbon emission cost is 306.94–455.73 yuan, and the process risk ranges from 0.33 to 0.49. For PLA products, the profit target is 5463.13–8925.47 yuan, the carbon emission cost is 227.75–346.18 yuan, and the process risk ranges from 0.23 to 0.38.
Figure 6 shows that the slope of increased net profit on process-risk impact is larger, and increased process risk reduces carbon emissions cost, which is likely due to the use of advanced processes that reduce the production of carbon emission products. Considering the marginal benefits, the following formula was applied to select the optimal solution:
M C = d T C / d W
where M C is the marginal cost, T C is the total cost, and W is the process risk. The optimal solutions for the multiobjective production of the two biodegradable plastics were derived as shown in Table 6.
As illustrated in Table 6, according to the relevant process commonly used in the market, the profit of PBAT products is slightly higher than that of PLA products. However, the market sales price of PLA products is higher than that of PBAT products. This is due to the higher cost of PLA products, which results in lower profits than those earned by PBAT products. The primary cause is that the production process of PLA products is influenced by the key technology of lactide. At present, lactide is predominantly imported, and the raw materials utilized in the preparation of lactic acid, such as corn, are more expensive, also affecting the overall profit of PLA products. The expenditures on carbon emission management for PLA and PBAT are similar; however, the esterification process for PBAT necessitates the use of higher-cost equipment, and the waste disposal costs are also higher, affecting the overall carbon emission expenditure for PBAT. At present, the scale of capacity expansion of PBAT manufacturers in China is significantly larger than that of PLA, primarily due to the existence of technological barriers associated with lactide production. This discrepancy has the potential to give rise to challenges in the product supply chain. Although the overall risk of PBAT products is slightly higher than that of PLA products, when Chinese manufacturers seek a preparation process with lower process risk, PBAT products will offer greater profit, thereby addressing the issue of insufficient production and the difficulties encountered in market promotion of biodegradable plastics due to key technological barriers such as those associated with lactide production.

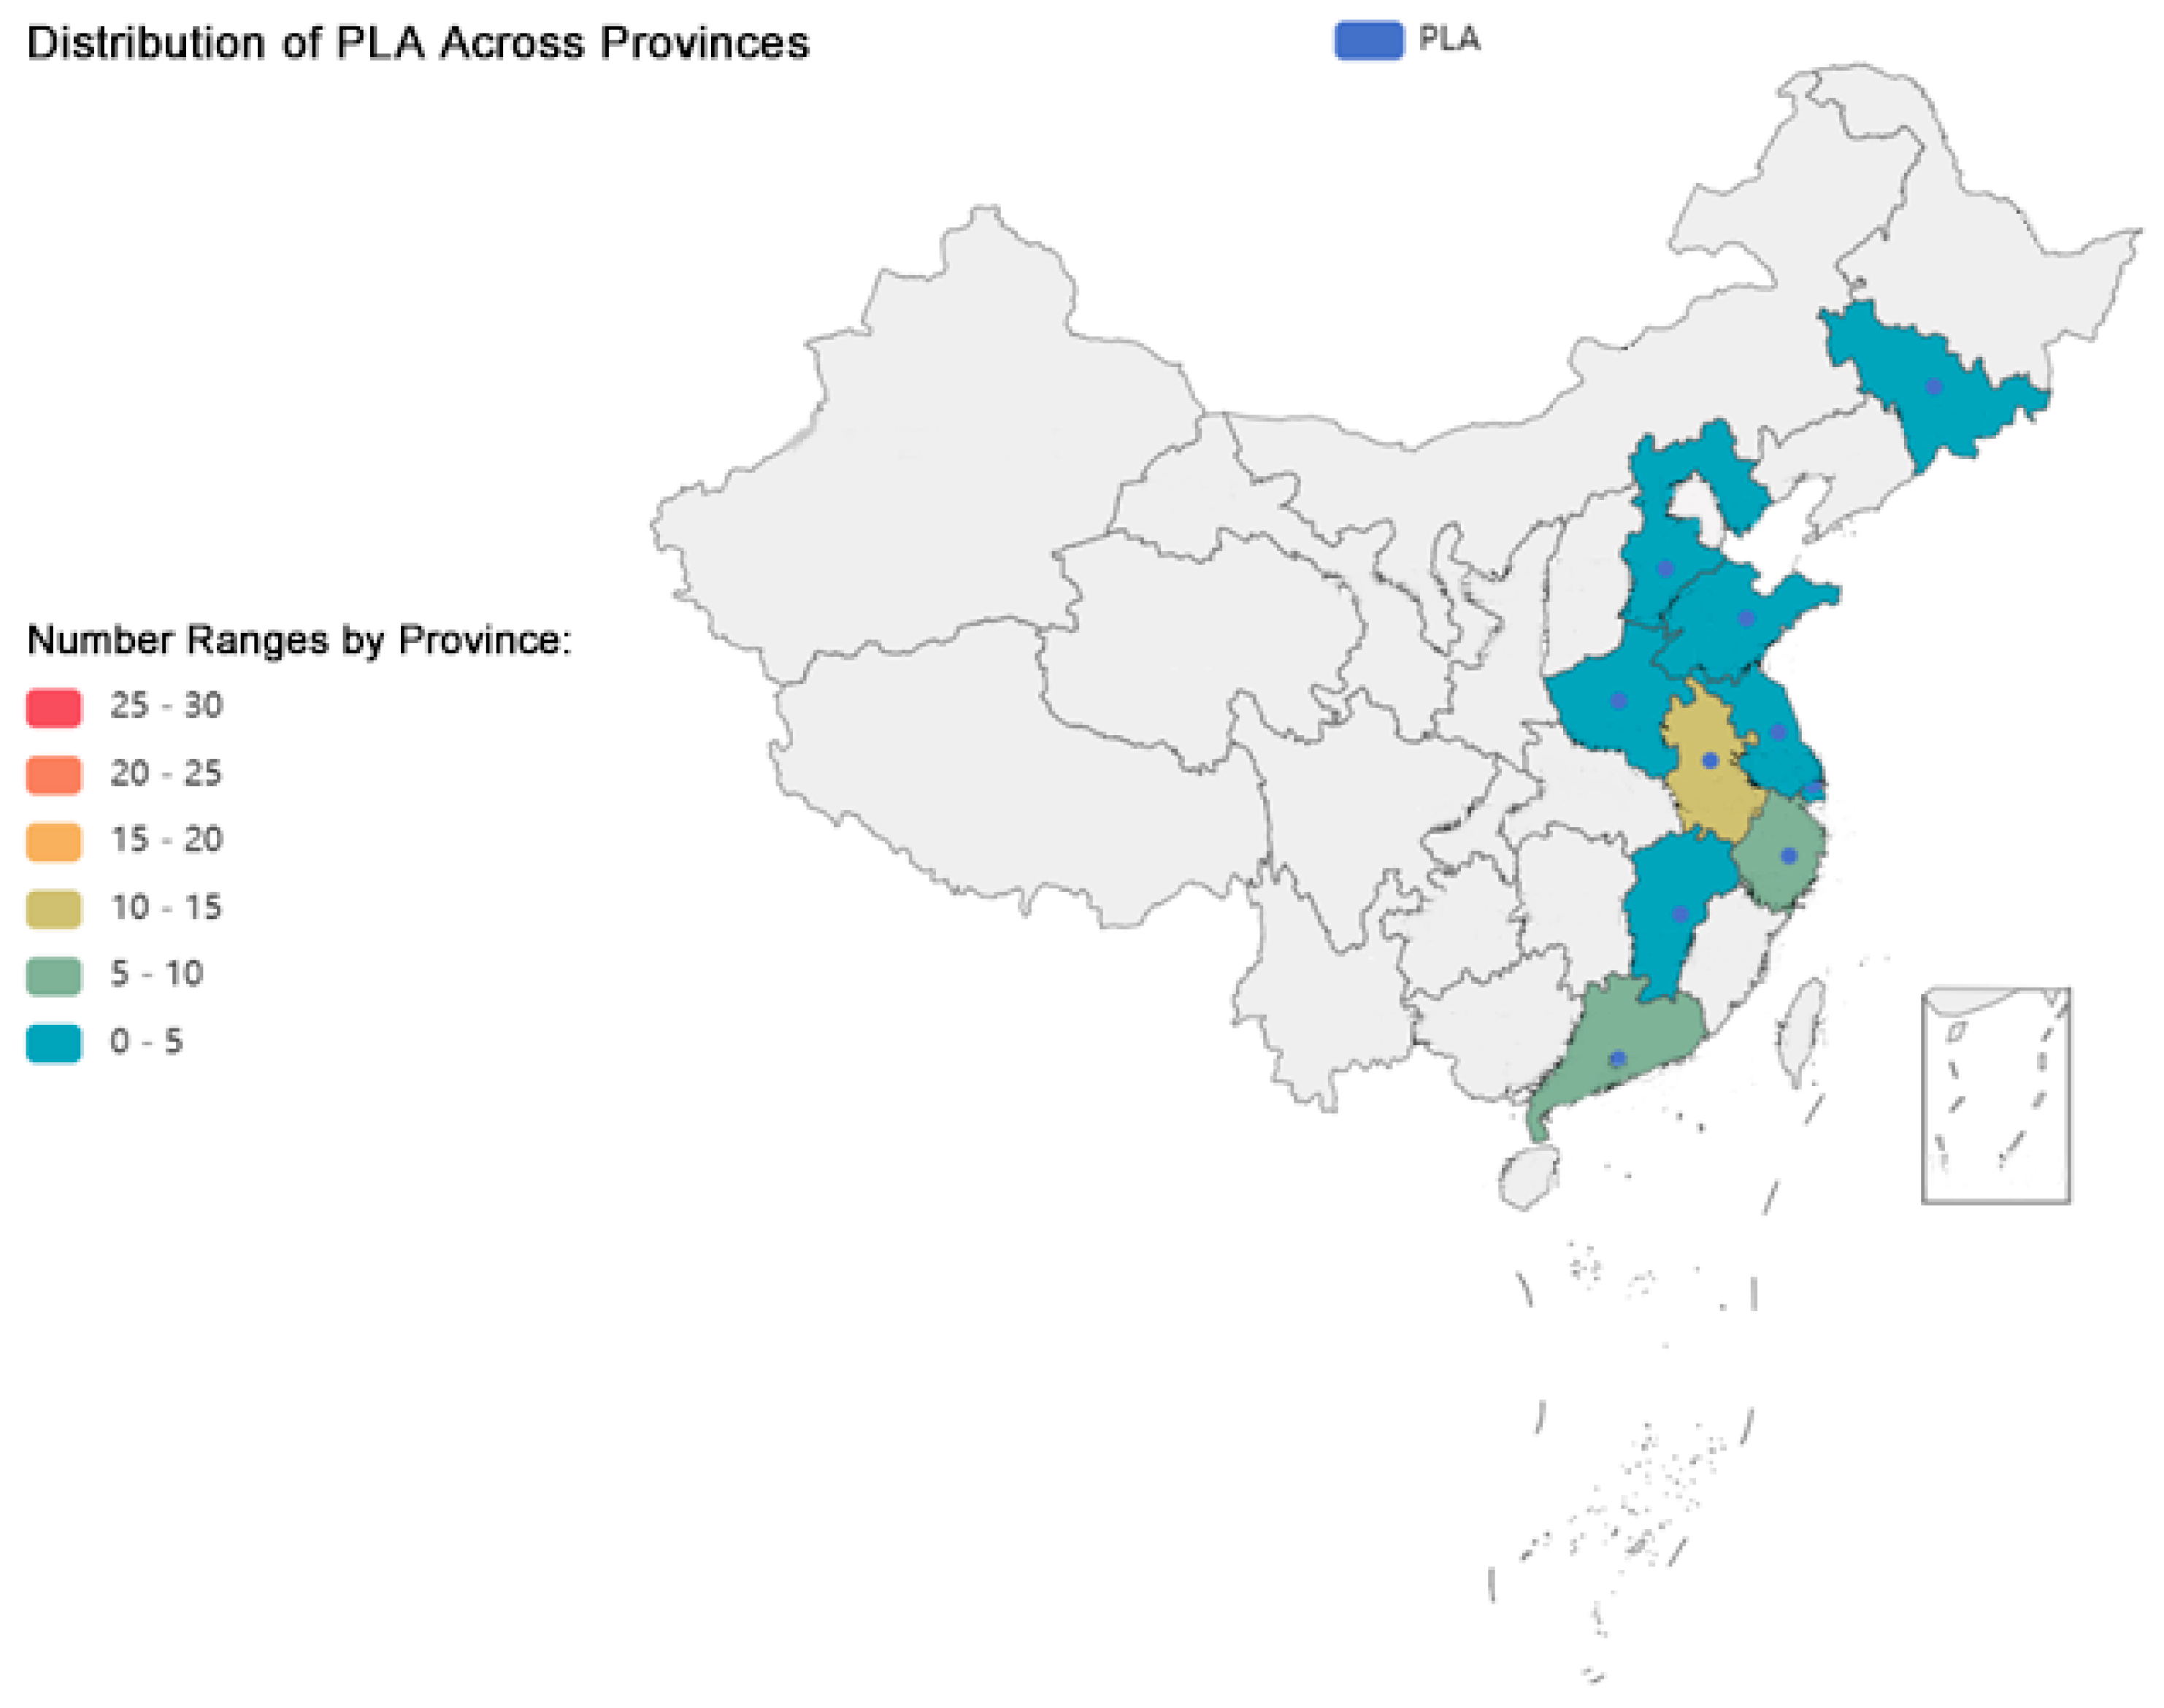
4.3. Analysis of Geographical Economic Advantages

In examination of the overall transport difficulty and production capacity distribution of each region, the entropy weight method was used to derive the geographical transport advantage of each provincial administrative region. The overall advantage of the East China region is obvious, with an entropy weight value of 0.93, in comparison, the value is 0.32 in the South China region, 0.22 in the Central China region, 0.15 in the North China region, 0.12 in the Northeast China region, 0.07 in the Northwest China region, and 0.05 in the Southwest China region. The East China region exhibits a high road density, a relatively developed economy, and an optimal industrial structure, conferring a high weight advantage. The Guangdong province in the South China region is a significant player in the production and sales of biodegradable plastics, conferring a relatively good advantage. The Central China region relies on the production capacity of Henan and Jiangxi provinces, with transport routes accessible from four directions, conferring a relatively good weight advantage. Other regions are constrained by the influence of their industrial structures and geographic terrain, resulting in a reduction in their geographic and economic advantages. Although the PBAT production capacity in Xinjiang is high, the high transport costs will impede the future sales of its biodegradable plastics throughout the country.
As shown in Figure 7, the distribution of the production capacity of biodegradable plastics exhibits distinct regional characteristics. In Eastern China, provinces like Zhejiang and Jiangsu, boasting advanced technologies and well-established industrial chains, account for more than 40% of the national production capacity. In Southern China, regions such as Guangdong and Guangxi leverage their rich agricultural resources and port advantages, contributing over 15% to the national total. In contrast, the Northern and Western regions, although using corn and sugarcane residues as raw materials, have lower production capacity due to infrastructure constraints. The mountainous terrain in the Southwest region, in particular, further increases transportation difficulties. When the production capacity is high, the difficulty in transportation leads to significant fluctuations in the overall economic impact. To optimize economic efficiency, it is advisable to establish production bases in the Southwest region where raw materials are abundant and improve mountain transportation infrastructure. The multimodal transport system should also be promoted, which involves integrating rail, road, and waterway transportation. For instance, long-distance transport can rely on railway trunk lines, while short-distance road transport can link mountainous areas to railway hubs. Developing inland waterway shipping in the Southwest can also cut down logistics costs. Additionally, policy support, such as subsidies and tax incentives, can stimulate localized production and circular economy models. These measures can reduce transportation costs and promote sustainable industrial development.
Regarding the regional transportation layout, it is recommended to strengthen transportation efficiency within core areas while reducing the efficiency in peripheral areas (Figure 8). This involves coordinating the planning and construction of major transportation infrastructure that spans two or more cities within a region, including trunk road networks, intercity rails, national railways, urban rails, ports, airports, regional comprehensive passenger hubs, and regional logistics parks. Digital technologies should be introduced to advance the construction of the regional “Internet of Vehicles” and promote the integration among the operational organizations of railway, civil aviation, highway, and urban transportation enterprises, as well as the logistics batch allocation linkage systems, so as to enable seamless “one-ticket-through” service for goods across different transportation modes. Simultaneously, to guarantee the spatial requirements for regional transportation development, strict spatial regulation policies should be established at the provincial level, and hierarchical control should be implemented over regional transportation corridors, major transportation hubs, and intercity coordinated construction areas.

5. Discussion and Conclusions

In this study, we proposed an entropy-weighted efficiency index (EWEI) method for the analysis of regional transportation advantages in the production of biodegradable plastics. We also used an improved NSGA-III algorithm and incorporated economic indicators of carbon emission and process risk in the production process, plus the technical and economic indicators of the whole technological process, to build a multiobjective optimization model. The regional economic advantages can be quantified, with a high degree of precision. The incorporation of data related to road traffic density allows for an effective description of the economic advantages of each region in the transportation of products. In terms of comprehensive economic evaluation, the reference point selection of the NSGA-III algorithm was innovatively improved, thereby reducing the model search time. For the selection of multiobjective indicators of the NSGA-III algorithm, the net present value and the economic conversion value of carbon emission under the influence of time factors and five kinds of risk quantification were introduced in order to obtain the optimal Pareto solution set. Furthermore, marginal cost, an important economic index, was introduced in order to select the optimal solution of the solution set, thereby providing strategies for the production of biodegradable plastics.

5.1. Economic Evaluation and Analysis of Road Transport Advantages

At present, the market share of biodegradable plastics is primarily composed of PBAT and PLA products. Through the optimization of three objectives, the net profit of PBAT is 8178.64 yuan/ton, which is 488.92 yuan/ton greater than that of PLA (7689.72 yuan/ton). For the construction of production lines with the capacity of more than 10,000 tons, the profit variance can be nearly 5 million yuan, accounting for about 5.98% of the total profit in the case of the production of 10,000 tons of PBAT. This has a significant impact on the investment preferences of biodegradable plastics enterprises, who may be more inclined to establish large-scale production lines of PBAT in order to ensure a favorable return on their investments. It is important to note that the process risk of PBAT production is 11% higher than that of PLA production, which may influence the strategic decisions of enterprises with conservative development concepts, who may choose to establish large-scale production lines of PLA. In the analysis of regional transport advantages, 34 provincial-level administrative regions were taken as the object of analysis. The road density was simply divided into seven regions without being detailed to prefecture-level cities. Given the vast territory of China, the further refinement of road influence factors will help distinguish regional transport advantages more effectively. For example, the transport weight of the South China region is 0.61 less than that of the East China region. However, Guangdong Province in the South China region and the city of Guangzhou under its jurisdiction have obvious advantages in road transport. Follow-up detailed research is needed in order to draw specific conclusions.
In addition, a number of research and development institutions in China are gradually promoting studies on the modification of biodegradable plastics. These studies explore the replacement of cheap raw materials and high-quality catalysts, such as the study on the production process of PHA using a variety of different strains to produce PHA (polyhydroxyalkanoate) with different chain lengths, considering strengthening the impact of extreme halomonas on the cost reduction in mass production of PHA. There are also scholars who study the process of polycondensation of glycollic acid, glycolate, glycolide, and other raw materials of PGA (also known as polyglycolic acid) in the presence of a catalyst. It is believed that there will be a more mature process in the future to prepare cheaper degradable plastic products, achieve the replacement of traditional plastic products, and effectively reduce “white pollution”.

5.2. Practical Implications

The practical implications of the study are reflected in two main aspects. First, we explored the moderating effect of road factors and the actual production capacity of products for the economic advantages of transport. We also ranked the provincial administrative regions in China in terms of their advantages for the production of biodegradable plastics. An effective operation strategy and the future development focus for the distribution planning of production plants in China’s biodegradable plastics market were provided. Given the positive impact of the carbon emission policy on the demand for biodegradable plastics, the findings of this study suggest that relevant market planning and construction should actively consider the economic expenditure on regional transportation and optimize the deployment of production capacity. Such an approach would result in a reduction in the overall carbon emissions of the biodegradable plastics market, achieved through the optimization of transportation routes and the acceleration of the achievement of the carbon neutrality goal. Such a measure would improve economic and environmental sustainability. Second, the centralization of the supply chain for raw materials and the optimal allocation of inventory would have a positive impact on the overall production of biodegradable plastics. Therefore, to optimize the advantages of the production process and circumvent key technological barriers, such as those associated with lactide production, Chinese manufacturers should seek to minimize their reliance on external resources, pursue better alternative processes such as supplier diversification and process refinement for one-step PLA production, and maximize the use of renewable resources for the effective substitution of petroleum-based raw materials. For example, as a strategy to improve resource efficiency, they can use starch-based raw materials and food waste for the research and development of cleaner production technologies to reduce the environmental pollution caused by the production of petroleum-based plastics.
Additionally, this study examined the impact factors of the discount rate in time cost, providing a long-term strategy for the control of production costs. Furthermore, this study provided a detailed list of cost expenditure indicators for raw materials, chemical substances, energy substances, and other major categories. In order to achieve effective cost control, manufacturers can analyze key expenditures according to relevant production stages and control resource consumption and fixed cost expenditures with larger cost weighting.

5.3. Policy Implications

The findings of this study have significant implications for policymakers. The global plastics market is expected to grow to more than $810 billion by 2030, from $580 billion in 2020 to $593 billion in 2021, and is expected to grow to more than $810 billion by 2030 [54]. The large number of biodegradable plastics coming into the market will effectively control the generation of pollutants. Denmark and Germany began banning plastic bags in 1991, and polyethylene bags were banned in North America, the United Kingdom, Australia, and New Zealand. After 2002, bans were implemented in Asian, African, and European countries. India’s Ministry of Environment, Forests and Climate Change has formulated the Plastic Waste Management Amendment Rules, 2021, which limit the single-use of plastic items [55]. Compared to manufacturers of traditional plastics, manufacturers of biodegradable plastics have strongly and positively responded to environmental protection strategies for carbon emissions and neutrality. Incentives should be increased for enterprises to achieve carbon neutrality. For example, industrial enterprises above designated size that achieve zero-carbon emissions should be rewarded with 500,000 yuan. Moreover, for enterprises whose carbon emissions are lower than the national allocation targets, proportional tax reductions should be provided. In regions with transportation disadvantages, to stimulate the development of local enterprises, biodegradable plastic production can be granted tax reductions of over 10%. The market promotion of biodegradable plastics will contribute to the alleviation of the continuous accumulation of white waste. Therefore, the effective degradation of biodegradable plastics and the cleanliness of degradation products will contribute to the continual environmental improvement. The effective distribution of production capacity and the cost control of biodegradable plastics will promote their market growth. In cost management, which can focus on key parameters such as temperature, pH, and oxygen that promote microbial survival [56], the high cost of enzyme purification is a major obstacle to cell-free procedures. Therefore, unrefined enzymes are also used in plastic biodegradation studies to reduce expenditure. Policymakers should, therefore, consider providing financial incentives for the production of biodegradable plastics, particularly in the field of carbon credits, in order to encourage the expansion of production capacity and the undertaking of related projects. Such policy support has the potential to incentivize enterprises to adopt cleaner technologies and promote environmental sustainability, while steering industrial development towards a greener trajectory.

5.4. Limitations and Future Research

This study has some limitations, and improvements are needed in future research endeavors. First, it is challenging to obtain a data set that is close to a uniform standard due to the limited availability of data and the fact that some variables, including chemical substance expenditures and energy expenditures, are derived from overall national statistics and localized market research data. These data sources may not fully encompass the diverse production patterns of various enterprises. Moreover, the dynamic capacity expansion and data linkage updates of each manufacturer make it challenging to define the data boundary with precision. This may contribute to a discrepancy between a comprehensive economic assessment and the actual cost-effectiveness. Nevertheless, in order to maintain academic rigor, we attempted to establish a robust linkage between variable costs and process links, and to analyze fixed costs as long-term cost indicators, and by doing so, strong credibility of the overall research data will be provided.
Second, due to the wide distribution of the biodegradable plastic market and in order to focus on key enterprises’ production data, enterprises with a production capacity less than 5000 tons were not included in the geographical transport economic analysis. The integration of the market scale for biodegradable plastics and the harsh market competition introduce greater uncertainty for small-scale producers. Therefore, in the next few years, the study data will be continuously updated, particularly with regard to the analysis of geographical advantages.
In future research, alternative raw materials, such as non-food biomass including crop stalks, cellulose, and food waste, can be adopted, and can be combined with innovative processes like efficient enzymatic catalysis and continuous polymerization technologies to enhance production efficiency. Simultaneously, the development of waste resource recycling systems are crucial. These systems can promote cost reduction and efficiency improvement across the entire industrial chain and accelerate the large-scale application and sustainable development of biodegradable plastics. Additionally, research can focus on the biodegradation differences and scenario compatibility of PLA and PBAT throughout their life cycles. PLA requires high-temperature industrial composting (50–60 °C) for complete degradation and has an extremely low degradation efficiency in natural environments. In contrast, PBAT can partially degrade in ambient soil conditions, yet the residual fragments may pose microplastic risks. Future studies should quantify the degradation costs and environmental externalities under different disposal scenarios (industrial composting, landfill, and natural environment) to optimize the compatibility between material design and recovery systems. For example, modification technologies can be used to enhance PLA’s degradation capabilities at ambient temperature, or controlled fragmentation technologies for PBAT can be developed to reduce life cycle management costs and improve economic feasibility, thereby providing strategies for the overall development of the Chinese biodegradable plastics market.

Author Contributions

Conceptualization, J.Z. and W.Z.; methodology, N.C.; software, J.Z. and Y.W.; validation, J.Z., W.Z. and N.C.; formal analysis, J.Z.; investigation, N.C.; resources, W.Z.; data curation, J.Z.; writing—original draft preparation, J.Z.; writing—review and editing, J.Z. and W.Z.; visualization, Y.W.; supervision, J.Z.; project administration, W.Z.; funding acquisition, W.Z. All authors have read and agreed to the published version of the manuscript.

Funding

This research was funded by the (National Key Research and Development Program of China) grant number (2022YFC3901805). The APC was funded by (National Key Research and Development Program of China).

Institutional Review Board Statement

The study did not require ethical approval.

Informed Consent Statement

Not applicable.

Data Availability Statement

The relevant data in our study are mainly from the National Bureau of Statistics, National Bureau of Statistics and Qianzhan Database. Other information comes from related research reports of listed companies, and relevant data can be found in the research reports published on the official website of degradable plastics listed companies.

Conflicts of Interest

The authors declare that they have no known competing financial interests or personal relationships that could have appeared to influence the work reported in this paper.

References

  1. Chen, G.; Li, J.; Sun, Y.; Wang, Z.; Leeke, G.A.; Moretti, C.; Cheng, Z.; Wang, Y.; Li, N.; Mu, L.; et al. Replacing Traditional Plastics with Biodegradable Plastics: Impact on Carbon Emissions. Engineering 2024, 32, 152–162. [Google Scholar] [CrossRef]
  2. Mishra, R.; Chavda, P.; Kumar, R.; Pandit, R.; Joshi, M.; Kumar, M.; Joshi, C. Exploring genetic landscape of low-density polyethylene degradation for sustainable troubleshooting of plastic pollution at landfills. Sci. Total Environ. 2024, 912, 168882. [Google Scholar] [CrossRef] [PubMed]
  3. Idris, S.N.; Amelia, T.S.M.; Bhubalan, K.; Lazim, A.M.M.; Zakwan, N.A.M.A.; Jamaluddin, M.I.; Santhanam, R.; Amirul, A.-A.A.; Vigneswari, S.; Ramakrishna, S. The degradation of single-use plastics and commercially viable bioplastics in the environment: A review. Environ. Res. 2023, 231, 115988. [Google Scholar]
  4. Haider, T.P.; Völker, C.; Kramm, J.; Landfester, K.; Wurm, F.R. Plastics of the future? The impact of biodegradable polymers on the environment and on society. Angew. Chem. Int. Ed. 2019, 58, 50–62. [Google Scholar] [CrossRef] [PubMed]
  5. Kim, P.; Park, H.; Rajendran, N.; Yu, J.; Min, J.; Kim, S.K.; Han, J. Economic and environmentally viable preparation of a biodegradable polymer composite from lignocellulose. J. Ind. Eng. Chem. 2023, 122, 221–230. [Google Scholar]
  6. Venschott, M.; Hoelderich, W.F.; Eisenacher, M. 2nd generation PLA; Lactide formation directly from aqueous lactic acid. Catal. Commun. 2023, 177, 106636. [Google Scholar] [CrossRef]
  7. Gamiz-Conde, A.K.; Burelo, M.; Franco-Urquiza, E.A.; Martínez-Franco, E.; Luna-Barcenas, G.; Bravo-Alfaro, D.A.; Treviño-Quintanilla, C.D. Development and Properties of Bio-Based Polymer Composites Using PLA and Untreated Agro-Industrial Residues. Polym. Test. 2024, 139, 108576. [Google Scholar]
  8. Kim, J.K.; Oh, S.H.; Song, M.O.; Jang, S.; Kang, S.J.; Kwak, S.K.; Jin, J. Wholly bio-based, ultra-tough, transparent PLA composites reinforced with nanocellulose and nanochitin. Compos. Part B Eng. 2024, 281, 111563. [Google Scholar]
  9. Wang, W.; Niu, B.; Liu, R.; Chen, H.; Fang, X.; Wu, W.; Wang, G.; Gao, H.; Mu, H. Development of bio-based PLA/cellulose antibacterial packaging and its application for the storage of shiitake mushroom. Food Chem. 2023, 429, 136905. [Google Scholar] [CrossRef]
  10. Li, J.; Wang, Y.; Xu, C.; Liu, S.; Dai, J.; Lan, K. Bioplastic derived from corn stover: Life cycle assessment and artificial intelligence-based analysis of uncertainty and variability. Sci. Total Environ. 2024, 946, 174349. [Google Scholar] [CrossRef]
  11. Cheroennet, N.; Pongpinyopap, S.; Leejarkpai, T.; Suwanmanee, U. A trade-off between carbon and water impacts in bio-based box production chains in Thailand: A case study of PS, PLAS, PLAS/starch, and PBS. J. Clean. Prod. 2017, 167, 987–1001. [Google Scholar]
  12. Zheng, Y.; Xu, M.; Tian, J.; Yu, M.; Tan, B.; Zhao, H.; Tang, Y. Study on the properties of esterified corn starch/Polylactide biodegradable blends. J. Renew. Mater. 2022, 10, 2949–2959. [Google Scholar]
  13. Ratshoshi, B.K.; Farzad, S.; Görgens, J.F. A techno-economic study of Polybutylene adipate terephthalate (PBAT) production from molasses in an integrated sugarcane biorefinery. Food Bioprod. Process. 2024, 145, 11–20. [Google Scholar]
  14. National Bureau of Statistics. Statistical data [EB/OL]. Available online: https://www.stats.gov.cn/sj/ (accessed on 7 December 2024).
  15. Mehta, J.; Dilbaghi, N.; Deep, A.; Hai, F.I.; Hassan, A.A.; Kaushik, A.; Kumar, S. Plastic waste upcycling into carbon nanomaterials in circular economy: Synthesis, applications, and environmental aspects. Carbon 2024, 234, 119969. [Google Scholar] [CrossRef]
  16. Yıldız, N.Ç.; Avunduk, Z.B.; Erdiaw-Kwasie, M.O. Circular economy in Turkish manufacturing sector: The roles of green manufacturing and innovation. In Circular Economy Strategies and the UN Sustainable Development Goals; Springer Nature: Singapore, 2023; pp. 381–415. [Google Scholar]
  17. Ramesh; Kumar, S.; Shaiju, P.; O’Connor, K.E. Bio-based and biodegradable polymers-State-of-the-art, challenges and emerging trends. Curr. Opin. Green Sustain. Chem. 2020, 21, 75–81. [Google Scholar] [CrossRef]
  18. Lima, L.R.; Gutierrez, R.F.; Cruz, S.A. Challenges in the context of single-use plastics and bioplastics in Brazil: A legislative review. Waste Manag. Res. 2022, 40, 998–1006. [Google Scholar] [PubMed]
  19. Barone, A.S.; Maragoni-Santos, C.; de Farias, P.M.; Cortat CM, G.; Maniglia, B.C.; Ongaratto RS Ferreira, S.; Fai, A.E.C. Rethinking single-use plastics: Innovations, polices, consumer awareness and market shaping biodegradable solutions in the food packaging industry. Trends Food Sci. Technol. 2025, 158, 104906. [Google Scholar]
  20. Rajendran, N.; Han, J. Integrated polylactic acid and biodiesel production from food waste: Process synthesis and economics. Bioresour. Technol. 2022, 343, 126119. [Google Scholar]
  21. Bilo, F.; Pandini, S.; Sartore, L.; Depero, L.E.; Gargiulo, G.; Bonassi, A.; Federici, S.; Bontempi, E. A sustainable bioplastic obtained from rice straw. J. Clean. Prod. 2018, 200, 357–368. [Google Scholar]
  22. Swetha, T.A.; Ananthi, V.; Bora, A.; Sengottuvelan, N.; Ponnuchamy, K.; Muthusamy, G.; Arun, A. A review on biodegradable polylactic acid (PLA) production from fermentative food waste-Its applications and degradation. Int. J. Biol. Macromol. 2023, 234, 123703. [Google Scholar]
  23. Liu, L.; Xu, M.; Ye, Y.; Zhang, B. On the degradation of (micro) plastics: Degradation methods, influencing factors, environmental impacts. Sci. Total Environ. 2022, 806, 151312. [Google Scholar] [PubMed]
  24. Sun, J.; Wang, X.; Zheng, H.; Xiang, H.; Jiang, X.; Fan, J. Characterization of the degradation products of biodegradable and traditional plastics on UV irradiation and mechanical abrasion. Sci. Total Environ. 2024, 909, 168618. [Google Scholar]
  25. Wang, F.; Wu, N.; Wang, M.; Deng, S.; Jia, H. Synthesis of phenylphosphorylated microcrystal cellulose biobased flame retardants and its flame-retardant modification on PLA biomaterials. Polym. Degrad. Stab. 2024, 227, 110843. [Google Scholar]
  26. Fu, Y.; Zhu, L.; Liu, B.; Zhang, X.; Weng, Y. Biodegradation behavior of poly (glycolic acid) (PGA) and poly (butylene adipate-co-terephthalate) (PBAT) blend films in simulation marine environment. Polymer 2024, 307, 127295. [Google Scholar]
  27. Cheung, C.K.H.; Not, C. Degradation efficiency of biodegradable plastics in subtropical open-air and marine environments: Implications for plastic pollution. Sci. Total Environ. 2024, 938, 173397. [Google Scholar] [PubMed]
  28. Zhao, Y.; Ming, J.; Cai, S.; Wang, X.; Ning, X. One-step fabrication of polylactic acid (PLA) nanofibrous membranes with spider-web-like structure for high-efficiency PM0. 3 capture. J. Hazard. Mater. 2024, 465, 133232. [Google Scholar]
  29. Meng, X.; Yu, L.; Cao, Y.; Zhang, X.; Zhang, Y. Progresses in synthetic technology development for the production of l-lactide. Org. Biomol. Chem. 2021, 19, 10288–10295. [Google Scholar]
  30. Pan, X.; Yang, X.; Li, X. Evaluation of maleic anhydride-modified chitosan as filler reinforced PBAT composite film. Int. J. Polym. Anal. Charact. 2024, 29, 64–74. [Google Scholar]
  31. Colucci, G.; Lupone, F.; Bondioli, F.; Messori, M. 3D printing of PBAT-based composites filled with agro-wastes via selective laser sintering. Eur. Polym. J. 2024, 215, 113197. [Google Scholar] [CrossRef]
  32. Arzumanova, N.B. Polymer biocomposites based on agro waste: Part iii. shells of various nuts as natural filler for polymer composites. New Mater. Comp. Appl. 2021, 5, 19–44. [Google Scholar]
  33. Aljabhan, B. Economic strategic plans with supply chain risk management (SCRM) for organizational growth and development. Alex. Eng. J. 2023, 79, 411–426. [Google Scholar]
  34. Bhatti, U.A.; Marjan, S.; Wahid, A.; Syam, M.; Huang, M.; Tang, H.; Hasnain, A. The effects of socioeconomic factors on particulate matter concentration in China’s: New evidence from spatial econometric model. J. Clean. Prod. 2023, 417, 137969. [Google Scholar]
  35. Wang, Z.; Duan, L.; Zhang, Z. Multi-objective optimization of gas turbine combined cycle system considering environmental damage cost of pollution emissions. Energy 2022, 261, 125279. [Google Scholar]
  36. Liu, H.; Shao, L.; Min, J.; Ji, X. Regional differences and determinants of environmental efficiency in China’s road transportation industry. Econ. Anal. Policy 2024, 81, 931–946. [Google Scholar]
  37. Ignatov, A. European highway networks, transportation costs, and regional income. Reg. Sci. Urban Econ. 2024, 104, 103969. [Google Scholar]
  38. Wu, P.; Zou, D.; Yu, N.; Zhang, G.; Kong, L. An improved NSGA-III for the dynamic economic emission dispatch considering reliability. Energy Rep. 2022, 8, 14304–14317. [Google Scholar]
  39. Ahmad, A.; Banat, F.; Taher, H. A review on the lactic acid fermentation from low-cost renewable materials: Recent developments and challenges. Environ. Technol. Innov. 2020, 20, 101138. [Google Scholar]
  40. Wang, J.; Xu, M.; Yan, J.; Guo, G.; Wang, Y.; Zhang, J.; Wu, J. Biodegradable poly (butylene adipate-co-terephthalate) (PBAT) modified by 1, 4 cyclohexanedimethanol. Polymer 2024, 308, 127348. [Google Scholar]
  41. Luo, C.; Zhou, Y.; Chen, Z.; Bian, X.; Chen, N.; Li, J.; Wu, Y.; Yang, Z. Comparative life cycle assessment of PBAT from fossil-based and second-generation generation bio-based feedstocks. Sci. Total Environ. 2024, 954, 176421. [Google Scholar]
  42. Dong, X.; Chen, N.; Zhang, X.; Wang, C.; Qiao, N.; Long, H. Research on the environment & economic indicators for electricity trading. Energy Rep. 2023, 9, 1774–1783. [Google Scholar]
  43. Zhu, S.; Tian, H.; Wang, C. Economic Indicator Accuracy and Corporate ESG Performance. Econ. Lett. 2024, 243, 111907. [Google Scholar]
  44. Ranjan, S.; Gupta, R.; Nanda, S.J. Threshold based constrained θ-NSGA-III algorithm to solve many-objective optimization problems. Inf. Sci. 2025, 697, 121751. [Google Scholar]
  45. Jung, S.; Jung, H.; Ahn, Y. Plastic-to-energy: Process and economic–environmental assessment of a recycling technology. Process Saf. Environ. Prot. 2024, 183, 1051–1058. [Google Scholar]
  46. Žižlavský, O. Net present value approach: Method for economic assessment of innovation projects. Procedia-Soc. Behav. Sci. 2014, 156, 506–512. [Google Scholar]
  47. Cao, Y.; Salem, M.; Nasr, S.; Sadon, S.H.; Singh, P.K.; Abed, A.M.; Dahari, M.; Almoneef, M.M.; Wae-Hayee, M.; Galal, A.M. A novel heat recovery for a marine diesel engine with power and cooling outputs; exergetic, economic, and net present value investigation and multi-criteria NSGA-II optimization. Ain Shams Eng. J. 2023, 14, 102067. [Google Scholar]
  48. Sun, B.; Zhang, Q.; Mao, H.; Li, K. Road energy capacity model for sustainable Transportation: Assessing energy consumption under road attributes and traffic condition. Sustain. Energy Technol. Assess. 2024, 70, 103930. [Google Scholar]
  49. National Bureau of Statistics. China Energy Statistical Yearbook [EB/OL]. Available online: https://www.stats.gov.cn/sj/ndsj/2022/indexch.htm (accessed on 9 December 2024).
  50. Qianzhan Database [EB/OL]. Available online: https://x.qianzhan.com/xdata/ (accessed on 20 December 2024).
  51. Li, G.; Deng, H.; Yang, H. A multi-factor combined traffic flow prediction model with secondary decomposition and improved entropy weight method. Expert Syst. Appl. 2024, 255, 124424. [Google Scholar]
  52. Biakhmetov, B.; Li, Y.; Zhao, Q.; Dostiyarov, A.; Flynn, D.; You, S. Transportation and process modelling-assisted techno-economic assessment of resource recovery from non-recycled municipal plastic waste. Energy Convers. Manag. 2025, 324, 119273. [Google Scholar]
  53. Bressanin, J.M.; Sampaio, I.L.d.M.; Geraldo, V.C.; Klein, B.C.; Chagas, M.F.; Bonomi, A.; Filho, R.M.; Cavalett, O. Techno-economic and environmental assessment of polylactic acid production integrated with the sugarcane value chain. Sustain. Prod. Consum. 2022, 34, 244–256. [Google Scholar]
  54. Boschi, A.; Scieuzo, C.; Salvia, R.; Arias, C.F.; Perez, R.P.; Bertocchini, F.; Falabella, P. Beyond microbial biodegradation: Plastic degradation by Galleria mellonella. J. Polym. Environ. 2024, 32, 2158–2177. [Google Scholar]
  55. Kapoor, R.T.; Rafatullah, M. Leveraging biotechnological approaches for the degradation of plastics: A sustainable tool for plastic waste management and environment protection. J. Water Process Eng. 2025, 69, 106736. [Google Scholar] [CrossRef]
  56. Samak, N.A.; Jia, Y.; Sharshar, M.M.; Mu, T.; Yang, M.; Peh, S.; Xing, J. Recent advances in biocatalysts engineering for polyethylene terephthalate plastic waste green recycling. Environ. Int. 2020, 145, 106144. [Google Scholar] [CrossRef] [PubMed]
Figure 1. Flow chart of the PLA production process.
Sustainability 17 02874 g001
Figure 2. Flow chart of the PBAT production process.
Sustainability 17 02874 g002
Figure 3. Reference Point Mechanism Diagram.
Sustainability 17 02874 g003
Figure 4. Geographical distribution of PLA and PBAT production capacity by province.
Sustainability 17 02874 g004aSustainability 17 02874 g004b
Figure 5. Net Present Values (NPVs) of PBAT and PLA. (a) Net present value of PBAT; (b) Net present value of PLA.
Sustainability 17 02874 g005
Figure 6. Multiobjective solution set for the economic benefits of PBAT and PLA. (a) Multiobjective optimization chart of the economic benefits of PBAT. (b) Multiobjective optimization chart of the economic benefits of PLA.
Sustainability 17 02874 g006
Figure 7. Map of the geographical advantages of each provincial administrative region.
Sustainability 17 02874 g007
Figure 8. Regional Transportation Optimization Strategy Diagram.
Sustainability 17 02874 g008
Table 1. Technical and Economic Indicators.
Attributes TypeIndicators
Economic indicatorsFixed costsFacilities costs
Maintenance costs
Management costs
Construction costs
Depreciation of fixed assets
Insurance costs
Variable costsRaw materials
Chemical substances
Energy substances
Transport costs
Waste disposal
Research and development costs
Marketing costs
Taxes
Carbon emission indicatorsCost of carbon oxide emissions control
Cost of nitrogen oxide emissions control
Cost of sulfur oxide emissions control
Table 2. Geographical Road Density and Geographical Capacity Data.
RegionRoad Density km/km2Biodegradable Plastics Production (per 10,000 Tons)
PLAPBAT
East China0.193261.6
South China0.11821.2
Southwest China0.04010
Northwest China0.02029
North China0.0652
Northeast China0.0538.3
Central China0.1249
Table 3. Normalized Cost Data Per Ton of PLA and PBAT.
Cost ElementsPLAPBAT
Raw material I57505153.04
Chemical substance C3380.461760
Energy E1336.10712
Transport costs T159.25165.75
Waste disposal W8001500
Fixed costs G30602817
Table 4. Carbon Emission Data.
Energy SourceStandard Coal Conversion (kg)CO2 Emissions (kg)Carbon (C) Emissions (kg)Cost (Yuan)
1 kg standard coal2.4930.6800.042
1 kWh electricity0.40.9970.272
1 kg steam (1 MPa grade)0.1085710.2710.074
1 t fresh water0.24290.6060.165
1 t recycled water0.14290.3560.097
1 L petrol0.9232.3010.628
1 L diesel1.0552.6300.717
Table 5. Quantitative Data of Process Risk.
Risk CategoryWeightPercentageCorrelation
Safety risk0.350.4330.312
Quality risk0.300.1270.269
Financial risk0.100.2110.174
Supply risk0.150.1060.148
Schedule risk0.100.1230.097
Table 6. Optimal Solutions for Biodegradable plastics.
TypeObjective I (Profit/Yuan)Objective II (Carbon Emissions/Yuan)Objective III (Process Risk/%)
PBAT product8178.64316.220.44
PLA product7689.72300.630.33
Disclaimer/Publisher’s Note: The statements, opinions and data contained in all publications are solely those of the individual author(s) and contributor(s) and not of MDPI and/or the editor(s). MDPI and/or the editor(s) disclaim responsibility for any injury to people or property resulting from any ideas, methods, instructions or products referred to in the content.

