Article

The Role of Urban Food Forests in Promoting Environmental Sustainability and Public Health: A Focus on Temperature Regulation and Mental Health

1
Department of Landscape Architecture, National Chin Yi University of Technology, No. 57, Sec. 2, Chung Shan Rd., Taiping, Taichung City 411030, Taiwan
2
Taichung City Government, No. 99, Sec. 3, Taiwan Boulevard, Xitun Dist., Taichung City 407610, Taiwan
3
Office of Sustainable Development and Low Carbon City Promotion, Taichung City Government, No. 99, Sec. 3, Taiwan Boulevard, Xitun Dist., Taichung City 407610, Taiwan
*
Author to whom correspondence should be addressed.
Sustainability 2025, 17(7), 2875; https://doi.org/10.3390/su17072875
Submission received: 11 February 2025 / Revised: 18 March 2025 / Accepted: 20 March 2025 / Published: 24 March 2025
(This article belongs to the Section Environmental Sustainability and Applications)

Abstract

:
As urbanization accelerates, the urban heat island effect and residents’ mental health issues are becoming increasingly severe. This study aims to explore the impact of the Urban Food Forest Program on urban environmental comfort, the mitigation of the heat island effect, and the mental health of middle-aged and elderly residents. The research methods include on-site field measurements and questionnaire surveys, which were used to analyze the environmental comfort of green spaces in urban heat island hotspots and assess participants’ mental health. The results indicate that the Urban Food Forest Program significantly reduced the surrounding environmental temperature, particularly in soil areas, with an average cooling effect of 2.4 °C. Regarding the mitigation of the heat island effect, the program effectively lowered the intensity of the heat island effect in surrounding areas, reducing it by 15%. Green spaces showed a notable positive impact on improving the urban microclimate, especially in alleviating the heat island effect. The mental health survey results revealed that male participants had significantly higher mental health scores than female participants (p = 0.017). Middle-aged and elderly individuals who participated in activities more than five times per week exhibited significantly better mental health, with their scores being 17% higher than those of the low-frequency participants. However, this study has several limitations. The relatively small sample size and limited observation period may affect the generalizability of the findings. Additionally, the study focused on a specific urban area, which may not fully represent the broader urban context. Future research should aim to expand the sample size, extend the observation period, and explore the impact of the Urban Food Forest Program in different urban settings to verify the findings’ robustness and applicability. Based on these findings, future efforts should focus on expanding green coverage, enhancing humidity regulation, and encouraging greater social and outdoor participation among middle-aged and elderly populations. Specifically, increasing activity frequency and promoting social interactions can further improve urban environmental quality and residents’ well-being.

1. Introduction

With the rapid advancement of global urbanization, population and economic activities are increasingly concentrated in urban areas. Currently, more than 50% of the world’s population resides in cities, and this proportion is expected to continue rising in the future [1,2,3]. However, urbanization not only presents opportunities for economic and social development but also brings with it multiple challenges, particularly concerning environmental sustainability and food security. The expansion of urban areas, population growth, shifts in lifestyle, and transformations in economic structures have led to excessive land development, further degrading natural ecosystems. For instance, as urban green spaces are replaced by buildings and roads, vegetation coverage declines, evapotranspiration weakens, and the natural cooling effect diminishes, thereby exacerbating the urban heat island effect [4,5,6,7].
Moreover, demographic shifts pose additional challenges to urban development. According to the United Nations’ World Population Prospects 2022 report, the global proportion of individuals aged 65 and above is projected to rise to 16% by 2050. Similarly, Taiwan is expected to enter a super-aged society by 2025. As the middle-aged and elderly population surges, the burden on the working-age population intensifies, leading to increased psychological stress [8,9,10,11,12,13]. At the same time, due to the effects of urbanization, many older adults spend prolonged periods indoors with limited social interactions, thereby elevating the risk of mental health issues [14]. This phenomenon not only influences the structural development of urban societies but also poses potential threats to the psychological well-being of residents.

1.1. Research Background

Against this backdrop, this study explores how Urban Food Forest, as an innovative model of urban agriculture, can foster interactions between people and the environment while enhancing the physical and mental well-being of residents in the context of rapid urbanization and an aging society. The concept of food forests, introduced by Clark and Nicholas (2013) [15], aims to promote the sustainable development of urban ecosystems through a multi-layered food network that mimics natural succession. Compared to conventional industrial agriculture, which requires significant energy and fertilizer inputs, food forests offer both ecological benefits and productivity. These systems, which incorporate perennial edible plants, trees, and animals, effectively enhance biodiversity while contributing to urban greening and ecological restoration [16,17,18,19].
Furthermore, urban agriculture has demonstrated strong social cohesion and community resilience. Following the 2008 financial crisis, major metropolitan areas in the United States began to emphasize urban farming, gradually integrating food forest designs to improve food security, restore ecological balance, and strengthen community ties [20]. Research has also indicated that participation in urban gardening significantly enhances emotional well-being, providing psychological benefits comparable to activities such as cycling and walking [21]. Therefore, food forests not only improve the quality of life for urban residents but also lay a foundation for sustainable urban development.

1.2. The Role of Urban Agriculture in Sustainable Cities

As cities face increasing spatial constraints, shrinking green spaces, and the intensification of the urban heat island effect, urban agriculture is expected to play a crucial role in sustainable urban development. In particular, rooftop farming has been proven to enhance community cohesion, foster neighborhood interactions, and improve participants’ physical and mental well-being through shared knowledge and production processes. For middle-aged and elderly urban residents, food forests not only provide access to fresh food but also encourage outdoor activities and social engagement, helping to mitigate the urban heat island effect while enhancing overall life satisfaction [22,23,24,25].
This study aims to explore how food forests can serve as a key strategy for urban environmental sustainability and public health, with a specific focus on their impact on urban microclimates and psychological well-being. Through urban green space planning and food forest design, we seek to improve the quality of life for city residents, promote community interaction, and achieve both ecological and social benefits within the constraints of limited urban space.

2. Research Framework and Methodology

This study adopts a comprehensive, multilayered approach to examine the impact of urban agriculture (food forests) on mental health. The research framework is designed with clear functional components, incorporating both textual and visual elements to enhance clarity. The framework is organized into the following sections: Structure Description, Functional Roles, Advantages and Limitations, and Innovation of the Framework, as shown in Figure 1.

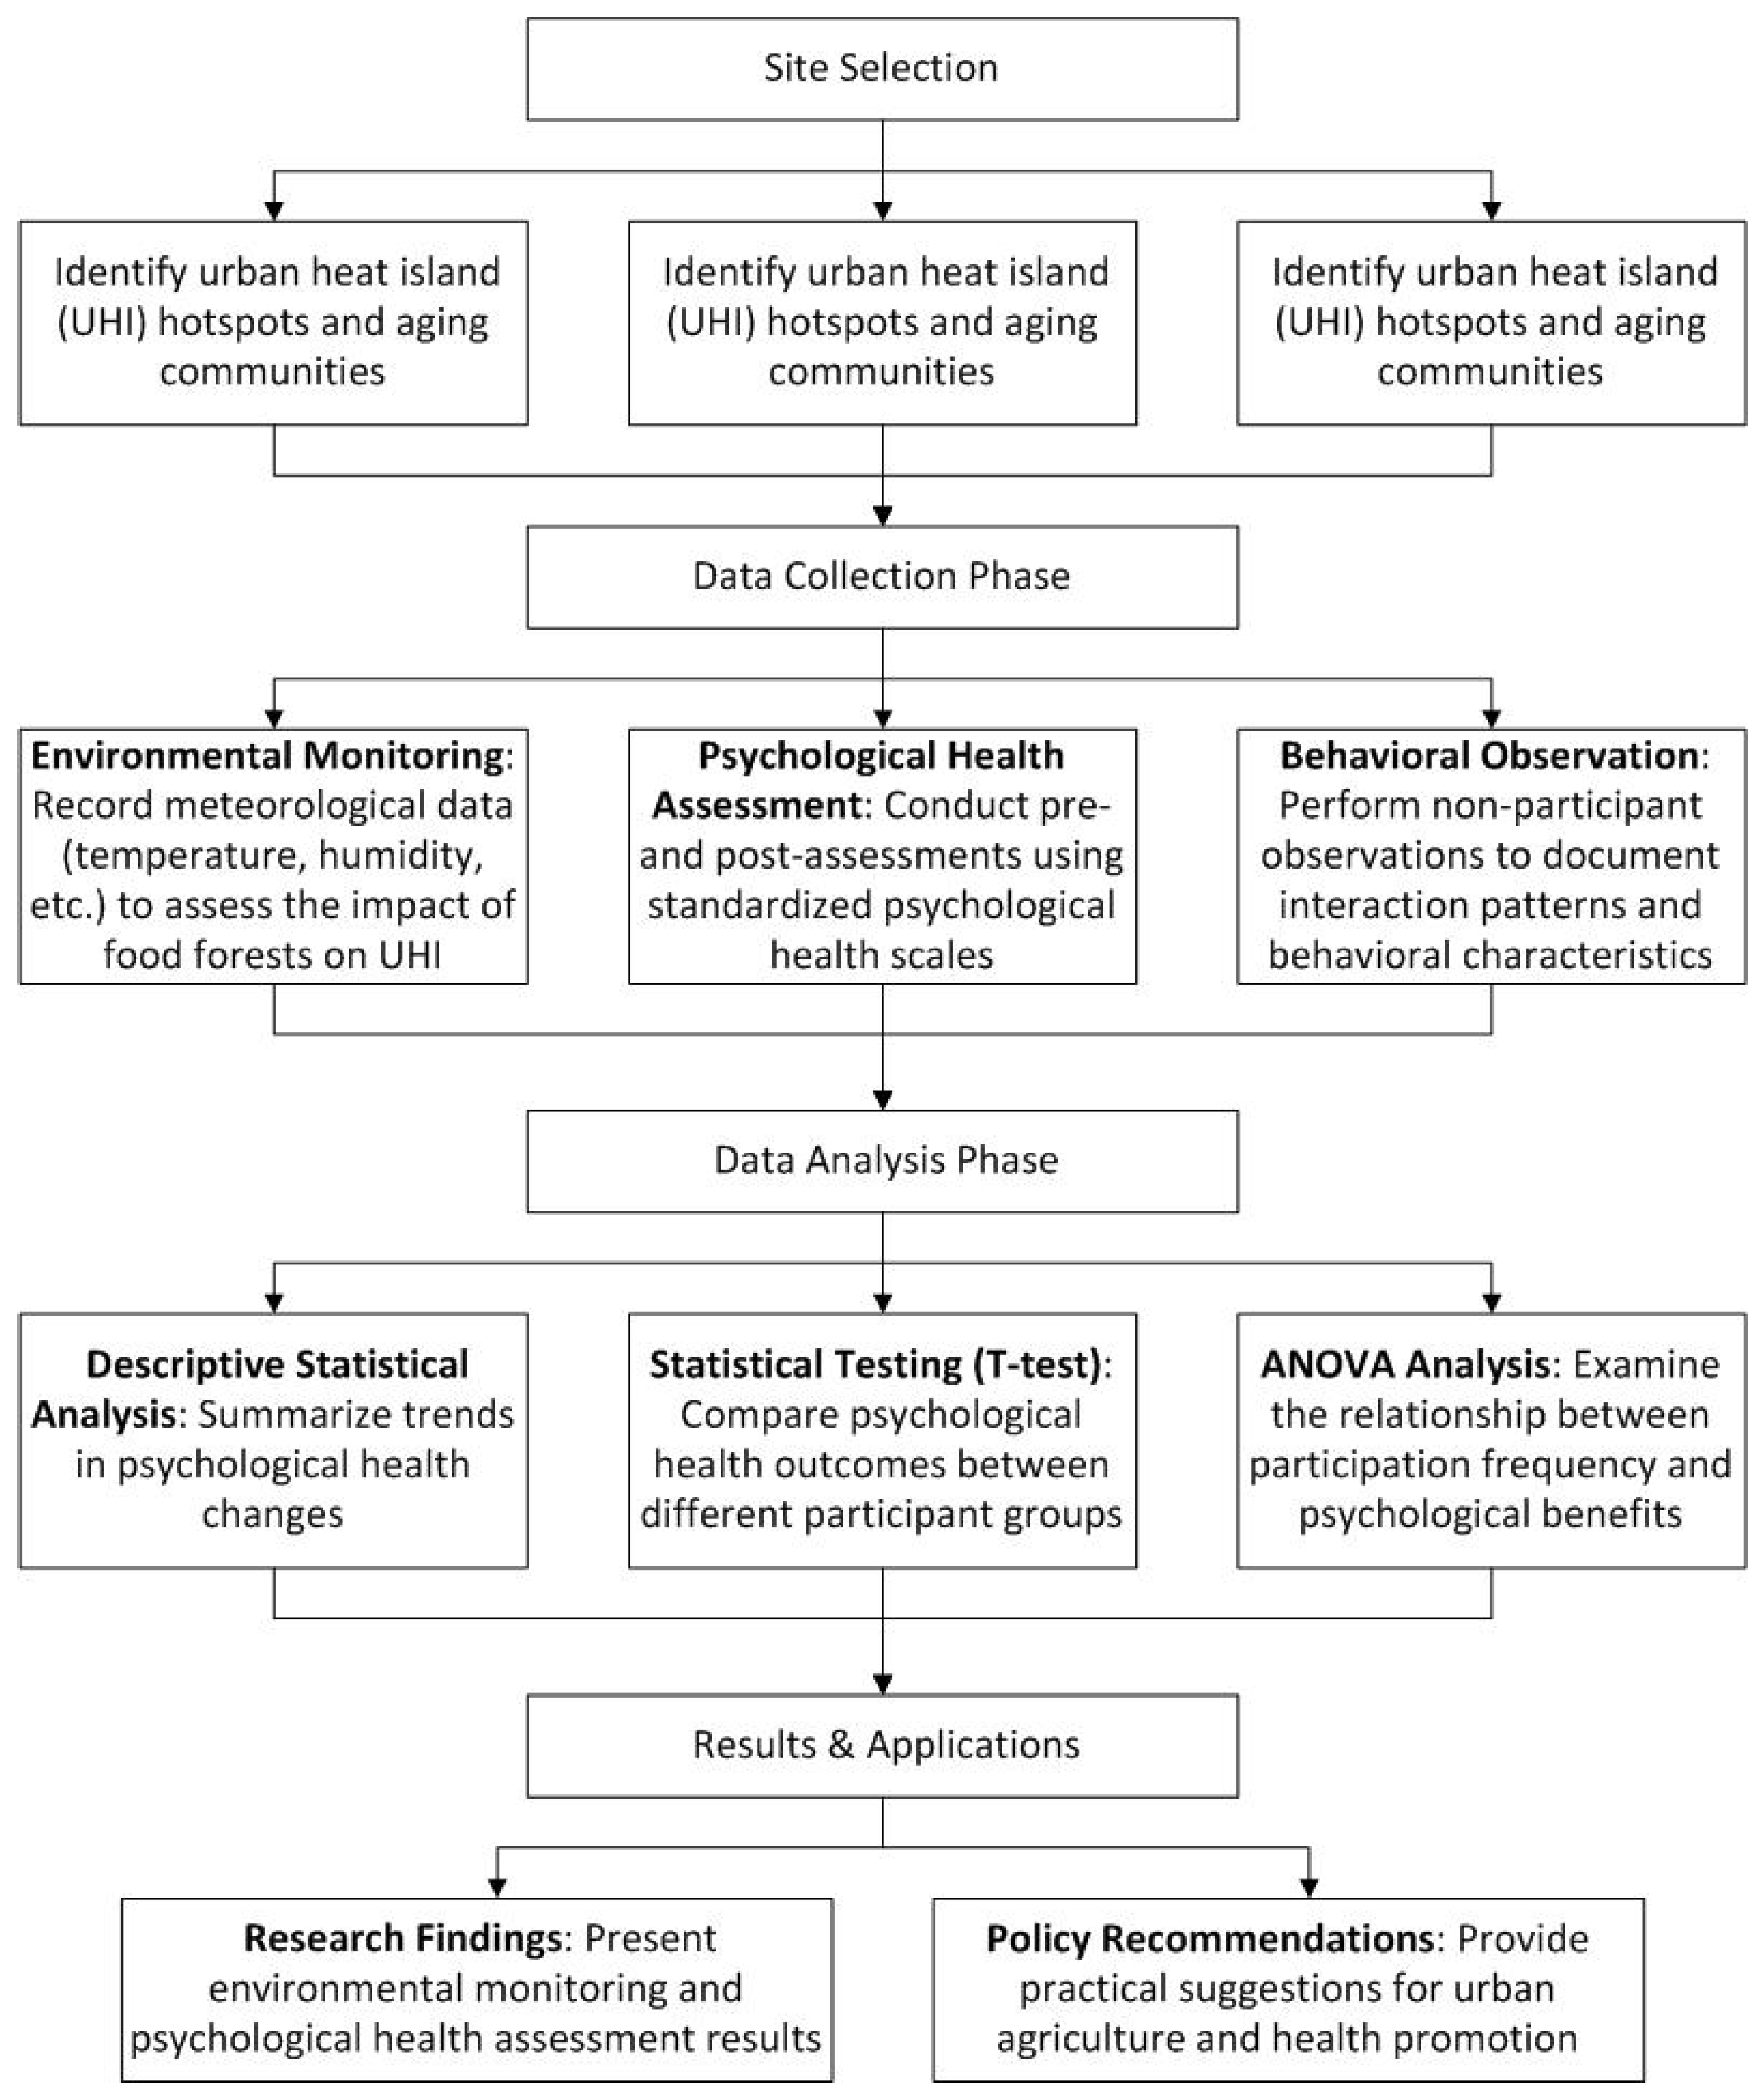
2.1. Structure Description

The research framework is built around three core elements that guide the systematic investigation of the effects of urban agriculture on mental health:
  • Environmental Data Monitoring: Advanced multi-sensor technology is employed to continuously collect meteorological and environmental data, such as temperature and humidity. This approach provides a precise environmental context that enables a quantifiable assessment of how urban agriculture can contribute to mitigating the urban heat island effect.
  • Mental Health Analysis: To measure the psychological impact of engaging in urban agricultural activities, standardized psychological health scales, surveys, and behavioral observations are utilized. This comprehensive approach helps to track changes in participants’ mental well-being and identifies the direct psychological benefits associated with food forest participation.
  • Impact Assessment of Participation: By comparing participants with varying levels of involvement, the study examines the extent of psychological improvements. The relationship between participation frequency and mental health outcomes is analyzed, enabling the identification of the optimal intervention model for urban agriculture.

2.2. Functional Roles

Each of these core elements plays a distinct yet complementary role in addressing the research question:
  • Environmental Data Monitoring: Provides an objective and precise environmental context, enabling the quantification of the potential role of urban agriculture in heat mitigation.
  • Mental Health Analysis: Serves as the primary measure of psychological benefits, offering a comprehensive understanding of the impact of urban agriculture on well-being.
  • Impact Assessment of Participation: Investigates the correlation between involvement in urban agriculture and improvements in mental health, identifying key factors that optimize mental health benefits.

2.3. Advantages and Limitations

  • Advantages: This framework offers a comprehensive approach by integrating environmental data, mental health analysis, and participation assessment, providing a holistic understanding of the impacts of urban agriculture. The combination of these elements ensures a well-rounded perspective on how food forests can influence both urban environments and public health. Additionally, the use of advanced multi-sensor technology and standardized psychological scales enables the collection of objective, quantifiable data. This enhances the reliability of the findings and allows for the precise measurement of both environmental and psychological outcomes, contributing to the robustness of the study’s results.
  • Limitations: Despite its strengths, the framework does have some limitations. One challenge is the variability in participants’ psychological responses, as individual differences may lead to differing effects, making it difficult to generalize findings across all population groups. Additionally, external environmental factors, such as seasonal changes or local weather conditions, may influence the environmental data collected, potentially impacting the accuracy of the heat island mitigation assessments. These factors need to be considered when interpreting the results, as they could introduce variability in the data.

2.4. Innovation of the Framework

This study introduces an innovative approach by combining environmental data monitoring with psychological health assessments in the context of urban agriculture. The integration of real-time environmental data with mental health analysis provides a unique opportunity to assess how urban agriculture, specifically food forests, can improve public health outcomes while addressing urban environmental challenges.
The research framework employs non-participatory behavioral observations to complement the survey data, enhancing the depth of the analysis and providing a richer, more holistic understanding of the effects of food forest participation.

2.5. Research Process Overview

The study follows a structured research process, as illustrated in Figure 1. The initial phase involves site selection, prioritizing communities that experience significant urban heat island effects, particularly those with a higher proportion of middle-aged and elderly residents. A field survey is conducted, and environmental monitoring equipment is installed and tested to ensure stability in data collection. Additionally, psychological health assessment questionnaires and behavioral observation indicators are developed, with clearly defined evaluation criteria.

2.6. Data Collection Phase

The data collection phase consists of three key components:
  • Environmental Monitoring: Continuous recording of meteorological conditions (e.g., temperature, humidity) is conducted to assess the influence of food forests on urban heat mitigation.
  • Mental Health Assessment: Pre- and post-intervention measurements are taken using standardized psychological health scales, enabling the tracking of changes in participants’ well-being.
  • Behavioral Observation: Non-participatory observation is employed to document participants’ interactions and behavioral patterns within the food forest, supplementing survey data with real-world behavioral evidence.

2.7. Data Analysis Phase

In the data analysis phase, descriptive statistical analysis is used to summarize the results from the questionnaires. An independent sample t-test is performed to compare mental health outcomes across different groups, verifying the effectiveness of urban agricultural interventions. Additionally, an analysis of variance (ANOVA) is conducted to explore the relationship between participation frequency and psychological well-being, providing deeper insights into how the intensity of participation influences mental health benefits.

2.8. Results Reporting and Application

During the final phase, we integrate findings from both environmental monitoring and psychological assessments to present the impact of food forests on urban environments and public health. Data visualizations are used to clearly communicate the results. The study will also explore the policy implications of these findings, offering practical recommendations for urban agricultural development and health promotion. These recommendations will serve as empirical references for future sustainable city planning initiatives.

3. Methodology

This study examines the impact of urban agriculture on the microclimate and mental health of residents. The methodology is structured as follows: first, the research methods are introduced, and this is followed by a description of the data sources and collection methods.

3.1. Research Site and Participants

This study is conducted at the rooftop Urban Self-Sustaining Farm located at the Zhongde Public Market in Mingde Village, North District, Taichung City, which serves as a demonstration site for the Urban Food Forest project (Figure 2). The farm aims to mitigate the urban heat island (UHI) effect and enhance green coverage, thereby improving the urban thermal environment. In addition to its ecological benefits, the farm offers a therapeutic and socially engaging space for community residents, particularly middle-aged and elderly individuals. It promotes mental well-being through social interactions and collaborative farming, while also fostering environmental sustainability.
The rooftop farm addresses the challenges posed by an aging population and serves as a collective effort by the community. Participation in urban farming activities helps retirees and older adults to alleviate psychological stress, strengthens social support networks, and improves mental health. The farm’s dual role—combining ecological regulation with social value—highlights its contribution to both the environment and community cohesion.
Environmental monitoring is conducted to assess the farm’s impact on the urban microclimate. The data collected are compared to meteorological records from the Taichung Weather Station to ensure accuracy. In addition, the study uses a combination of survey questionnaires and non-participatory observation to evaluate residents’ satisfaction and psychological changes after engaging with the farm, providing a comprehensive assessment of its impact on community well-being.

3.2. Target Participants

This study focuses on two primary groups:
  • The Middle-aged and Elderly Population (55 years and older): Many individuals in this group seek new life pursuits after retirement. Engaging in urban farming offers benefits such as stress relief, mental health improvements, and increased social interactions, which contribute to higher life satisfaction and a sense of belonging.
  • Working Residents (around 55 years old): Residents who are closely connected to the market environment in their daily lives also benefit from the multifunctionality of urban green spaces. Their participation enhances community cohesion, strengthens environmental awareness, and promotes a balance between work and leisure.
By incorporating both groups, this study investigates how urban agriculture can simultaneously improve the environment and foster social connectivity, demonstrating the multifaceted value of urban farming.

3.3. Monitoring Equipment and Data Collection

To comprehensively assess environmental factors, a range of monitoring equipment is employed to ensure accurate and continuous data collection. The equipment setup is shown in Figure 3, and the specifications and functions are summarized in Table 1.
This study employs continuous environmental monitoring, with sensors recording temperature, humidity, and solar radiation data every 10 min to ensure a comprehensive assessment of microclimate variations throughout the day. To evaluate the impact of the rooftop farm on the urban heat island (UHI) effect, sensors were strategically placed in three locations: within the farm’s green vegetation area to measure its cooling effect, on the exposed rooftop outside the farm as a non-greened control site, and at ground level around the market to assess overall urban thermal conditions. This setup allows us to distinguish temperature variations under different environmental conditions and further quantify the farm’s cooling contribution.
Additionally, this study utilizes meteorological data from the nearby Taichung Weather Station as a reference to ensure data comparability and accuracy. The comparative methodology includes analyzing temperature trends across the farm’s interior, exterior, and ground-level areas while cross-referencing them with weather station data; calculating temperature differences between the farm and the urban background to assess its cooling effect; and employing a rigorous environmental monitoring and a statistical comparison approach to accurately evaluate the rooftop farm’s microclimate regulation capacity and validate its contribution to mitigating the urban heat island effect.

3.4. Survey

Psychological health data are collected using the Geriatric Depression Scale (GDS-15), which assesses emotional states, stress perception, and life satisfaction among elderly participants. The scale consists of 15 simple questions, with responses indicating the presence of depressive symptoms. The findings are used to evaluate the mental health status of participants before and after engaging in the Urban Food Forest program.
The GDS-15 scoring criteria are as follows:
  • A score of 7 or below indicates good psychological health, with no significant depressive symptoms.
  • A score between 7 and 10 suggests mild depressive symptoms and recommends further evaluation.
  • A score above 11 indicates significant depressive symptoms, and referral for medical or psychological treatment is necessary.
This tool is used to compare psychological conditions before and after participation in the program, and to assess the mental health benefits of engaging in urban farming activities.

3.5. Non-Participatory Observation

Non-participatory observation is used to study participants’ behavior and emotional responses during their involvement in urban farming activities. Our observations are categorized into three main areas:
  • Behavioral Observations: Recording participation frequency, interactions, and non-verbal behaviors (e.g., smiling, nodding).
  • Interaction Analysis: Tracking social interactions and assessing their depth, focusing on the impact of activities on interpersonal communication.
  • Emotional Change Observations: Analyzing facial expressions and body language to assess emotional states (e.g., relaxation, happiness, anxiety).
These observational data complement the survey results and provide valuable insights into how the activities affect participants’ social dynamics, emotional well-being, and overall engagement.

3.6. Research Limitations and Ethical Considerations

This study was conducted over three years in urban areas of Taichung that were significantly affected by the UHI effect, with a high proportion of middle-aged and elderly residents. Due to resource and time constraints, the sample size was limited, and the observation period was relatively short. These limitations may affect the robustness and generalizability of the findings. Additionally, the study lacks a control group, which may influence our ability to establish causal relationships. The presence of potential confounding variables, such as variations in local microclimates and socio-economic factors, further complicates the interpretation of the results.
Future research should expand the sample size and extend the observation period to verify the stability and universality of the results. Establishing a control group and implementing methods to account for confounding variables would enhance the study’s reliability. Additional resources would enable broader studies, improving the applicability of the findings to other regions.
In this study, we explicitly stated that participants were informed of the study’s purpose and procedures. Furthermore, all participants provided informed consent before participation, ensuring compliance with ethical research standards.

4. Statistical Analysis Methods

4.1. Environmental Parameter Statistical Analysis

To comprehensively assess the impact of the “City Food Forest” on the environmental microclimate, this study performs statistical analysis on key environmental parameters, including atmospheric temperature, surface temperature, soil surface temperature, and relative humidity. The following equations are used to calculate the mean, standard deviation (SD), coefficient of variation (CV), and extreme values (minimum and maximum) to evaluate the stability and variability of the environmental data:
Formulas for Statistical Indicators:
(1)
Mean value (Mean x ¯ ), shown as follows:
x ¯ = 1 n i = 1 n x i
where xi represents the individual data values and n represents the total number of data points.
(2)
Standard Deviation, SD, σ, expressed as follows:
σ = 1 n 1 i = 1 n ( x i x ¯ ) 2
(3)
Coefficient of Variation, CV:
C V = σ x ¯ × 100 %
(4)
Extreme values (minimum and maximum values, Min and Max):
x m i n = m i n x 1 , x 2 , , x n x m a x = m a x ( x 1 , x 2 , , x n )
where xmin represents the smallest value in the data set, and xmax represents the largest value in the data set.

4.2. Correlation Analysis and Regression Models

To explore the relationships between environmental variables, this study employs Pearson’s correlation coefficient (r) for analysis, expressed as follows:
r = ( x i x ¯ ) ( Y i Y ¯ ) ( x i X ¯ ) 2 × ( Y i Y ¯ ) 2

4.3. Thermal Comfort Assessment (PMV Index)

This study utilizes Fanger’s PMV (predicted mean vote) model to assess human thermal comfort, as shown in the following formula, as follows:
PMV = (0.303e−0.036M + 0.028) × [(M − W) − 3.05 × 10−3 × (5733 − 6.99 × (M − W) − Pa) − 0.42 × ((M − W) − 58.15) − 1.7 × 10⁻⁵ × M × (5867 − Pa) − 0.0014 × M × (34 − Ta) − 3.96 × 10⁻⁸ × fcl × ((Tr + 273)4 − (Tcl + 273)4) − fcl × hc × (Tcl − Ta)]
where M is the metabolic rate of the human body (W/m2), typically 70 W/m2 for walking; W is external power, generally 0; Pa is the partial vapor pressure of water (Pa); Tr is the mean radiant temperature (°C); Tcl is the surface temperature of clothing (°C); hc is the convective heat transfer coefficient (W/m2K); and fcl is the clothing thermal resistance influencing factor.
Urban Heat Island Mitigation Analysis: the cooling effect of the “Urban Food Forest” is calculated using the urban heat island intensity (UHI) formula:
UHI = Turban − Trural
where Turban is the temperature in the urban area (typically the temperature of the city or urban environment), and Trural is the temperature in the rural area (the temperature in non-urban areas or areas away from the city).
This study uses the results of these statistical analyses as a crucial basis for urban greening and environmental regulation planning. It will provide decision makers with specific scientific data to enhance urban living quality and promote sustainable development.

4.4. Statistical Analysis of Questionnaire Data and Mental Health Impact

Statistical analysis methods are used to explore the relationship between the questionnaire results, participants’ behavior, and their mental health status. The specific analytical methods used are as follows:
  • Descriptive Statistical Analysis:first, we use descriptive statistical analysis to provide an overview of the questionnaire results. This will help organize and present the basic characteristics of the data, such as means, standard deviations, and maximum and minimum values, offering an intuitive understanding of the overall data.
  • Independent Sample t-test:next, to compare the mental health status between different groups (e.g., different age groups or employment status groups), we perform an independent sample t-test. This helps us to determine whether there are significant differences in mental health between the groups, providing deeper insights into the differences between them.
  • One-Way Analysis of Variance (ANOVA): To explore the impact of different participation frequencies on mental health, we use a one-way Analysis of Variance (ANOVA). This method helps us to analyze whether participation frequency (e.g., high-frequency vs. low-frequency participants) significantly affects mental health status, providing valuable data support for activity design and effect evaluation.
To determine whether there are significant differences between groups, we use Tukey’s test for post-hoc multiple comparisons. The formula for the ANOVA: F-Test is expressed as follows:
F = Between-group sum of squares (SSB)/Between-group degrees of freedom (dfB) ÷ Within-group sum of squares (SSW)/Within-group degrees of freedom (dfW)
where the between-group sum of squares (SSB) measures the sum of squared differences between groups; the within-group sum of squares (SSW) measures the variation within each group; between-group degrees of freedom (dfB) are equal to the number of groups minus 1; and within-group degrees of freedom (dfW) are equal to the total sample size minus the number of groups.
The F value is used to measure the ratio of variation between groups to the variation within groups. A larger F value indicates a more significant difference between the groups.
4.
Paired-Sample t-test: To analyze the changes within the same group before and after the activity, we use the paired-sample t-test. This method is particularly useful for comparing differences within the same group and further assessing the impact of participation on mental health and improvements in agricultural knowledge. The formula for the paired sample t-test is as follows:
t = d ¯ μ d S d / n
where d ¯ is the mean of the differences between paired observations; μd assumes that the population mean difference is zero (i.e., no difference before and after the activity); Sd is the standard deviation of the differences; and n is the number of paired samples.
The test level is set at α = 0.05. This statistical test helps to determine whether there is a significant difference in the mental health status and agricultural knowledge of the participants before and after the activity.
Using the statistical analysis methods mentioned above, we are able to comprehensively analyze the environmental monitoring data and survey results. This enables a precise assessment of the impact of the “Urban Food Forest” project on environmental changes and its effects on the mental health status of different groups. The findings provide strong data support for optimizing activity design. We utilize Excel and Origin 2020 statistical software for data organization, and the analysis results are presented in charts, complemented by written explanations to further clarify and supplement the findings.

5. Results and Discussions—Outdoor Space Experimental Results

5.1. Outdoor Space Experimental Results

This study investigates the impact of outdoor environmental factors on microclimates and human thermal comfort. Using environmental monitoring instruments, continuous automatic measurements were conducted to track variations in environmental parameters across different seasons (autumn, winter, and summer). The collected data were organized using Excel and Origin 2020 statistical software, with results presented in charts and supplemented by written explanations. The study found that outdoor environmental factors significantly improved the microclimate and thermal comfort of the site after the establishment of the Urban Food Forest.
The field data cover autumn, winter, and summer, with hourly measurements taken every 15 min from 00:00 to 24:00 each day. To enhance data reliability, the measurements were compared with data from a nearby weather station in Taichung.
Based on the observed data, the wind rose diagrams for the autumn and winter seasons at the experimental site indicate that the predominant wind direction is from the east, with wind speeds primarily ranging from 0.6 to 0.8 m/s (Figure 4). In contrast, during the summer, the predominant wind direction shifts to the northwest, with wind speeds mainly ranging from 1.2 to 1.4 m/s (Figure 5).
The measured results indicate that the highest atmospheric temperature during the autumn and winter seasons was 31.9 °C (10 December 2023, 12:00 p.m.) and the lowest was 18.6 °C (9 December 2023, 7:00 a.m.), as shown in Figure 6. Compared to the Taichung weather station, the temperature fluctuations at the study site were relatively moderate, suggesting that the establishment of the Urban Food Forest had a positive impact on mitigating the urban heat island effect.
In contrast, the measured results for the summer season showed the highest atmospheric temperature at 36 °C (6 September 2024, 12:00 p.m.) and the lowest at 24.7 °C (9 September 2024, 5:00 a.m.), as shown in Figure 7. Although the maximum temperature at the study site was higher than that recorded at the Taichung weather station, the overall temperature variation was more stable. While the temperature differences were more pronounced, the variation at the study site was smaller than at the Taichung weather station.
The experimental station is located on a rooftop garden. In addition to the paved surface, the garden’s soil area covers a large portion of the roof. The paving material consists of cement concrete tiles. According to the experimental results, during the autumn and winter seasons, the highest surface temperature of the pavement was 50.1 °C (10 December 2023, 12:00 p.m.), and the lowest was 17.8 °C (9 December 2023, 6:00 a.m.). The highest soil temperature was 26.1 °C (12 December 2023, 2:00 p.m.) and the lowest was 18 °C (9 December 2023, 7:00 a.m.), as shown in Figure 8. The surface temperature varies with atmospheric temperature, but both the maximum and minimum surface temperatures exceeded the atmospheric temperatures.
In comparison, the summer experimental results showed the highest surface temperature of the cement concrete paving at 56.5 °C (6 September 2024, 12:00 p.m.) and the lowest at 24.3 °C (9 September 2024, 5:00 a.m.). The highest soil temperature was 32.5 °C (6 September 2024, 12:00 p.m.), and the lowest was 24.5 °C (9 September 2024, 5:00 a.m.), as shown in Figure 9.
It can be observed that, due to its rapid heat absorption and slow heat release properties, the cement pavement absorbs heat during the day and gradually releases it at night. This helps to reduce excessive heat radiation during the day, with the release of a certain amount of heat at night. On the other hand, the soil surface temperature is mostly lower than the atmospheric temperature, which may be related to its shading effect, reducing solar radiation from entering the soil. The soil’s higher thermal capacity allows it to absorb a large amount of heat, but due to its slower heating rate, its temperature changes are also slower. Therefore, during the autumn and winter seasons, soil temperature changes are more stable and remain lower than both atmospheric and paving surface temperatures. In the summer, the soil temperature remains lower than the atmospheric temperature.
Next, relative humidity measurements were conducted at the project site. According to the experimental data, during the autumn and winter seasons, the maximum relative humidity was 81% (9 December 2023, 2:00 a.m.) and the minimum was 49% (9 December 2023, 2:00 p.m.), as shown in Figure 10. During the summer, the maximum relative humidity was 90% (9 September 2024, 7:00 p.m.) and the minimum was 51% (6 September 2024, 12:00 p.m.), as shown in Figure 11.
In autumn and winter, the relative humidity at the Taichung weather station was higher than the measurements at the project site for most of the time. This could be due to the large areas of greenery at the site, which effectively maintain the outdoor environment’s humidity, resulting in more stable relative humidity fluctuations. In the summer, the relative humidity at the project site was noticeably lower than at the Taichung weather station, with milder day–night changes. This could be attributed to the large amounts of surrounding concrete and other building materials, which quickly absorb heat and store thermal energy, leading to an increase in the atmospheric temperature and a subsequent decrease in relative humidity.
Therefore, the Urban Food Forest plays a significant role in regulating environmental humidity, effectively reducing extreme fluctuations in humidity levels, enhancing the microclimate stability of outdoor spaces, and helping mitigate the urban heat island effect to some extent.

5.2. Statistical Analysis of Environmental Improvement and Detection Results

5.2.1. Statistical Analysis of Environmental Parameters

To comprehensively assess the impact of the Urban Food Forest on the environmental microclimate, this study conducted a statistical analysis of key environmental parameters, including the atmospheric temperature, surface pavement temperature, soil surface temperature, and relative humidity. We calculated their mean values, standard deviations, coefficients of variation, and extreme values to evaluate the stability and variability of the environmental data. The results of the analysis are presented in Table 2.

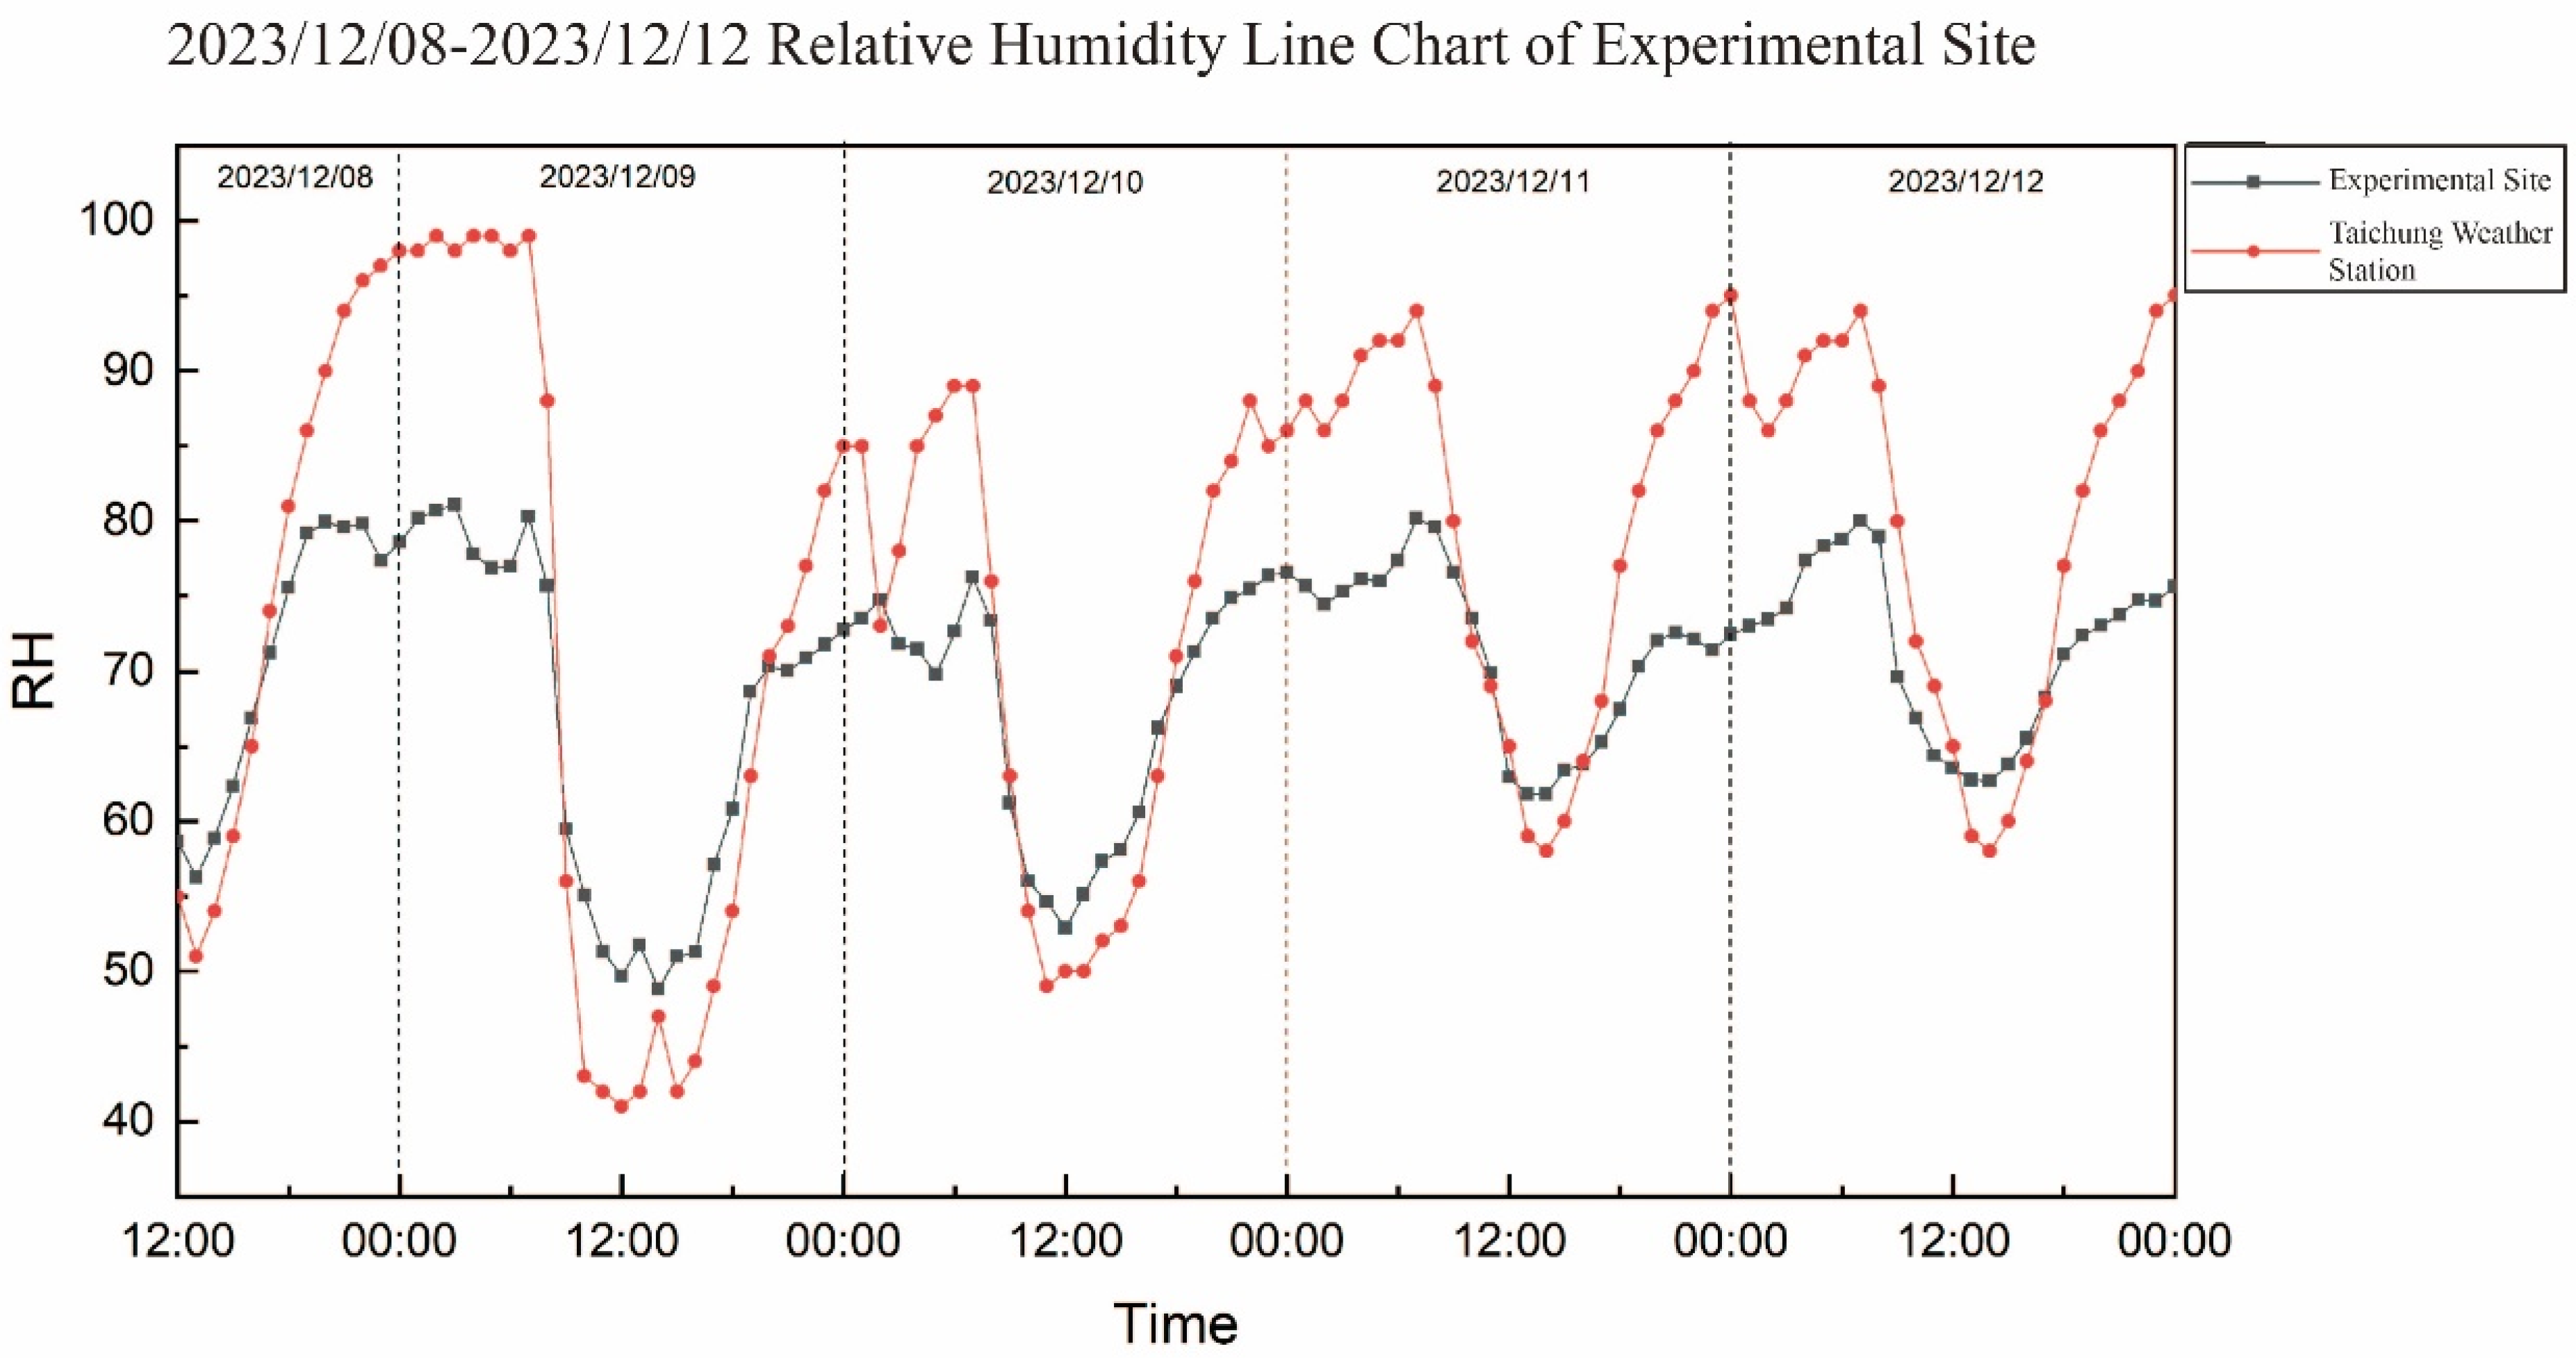
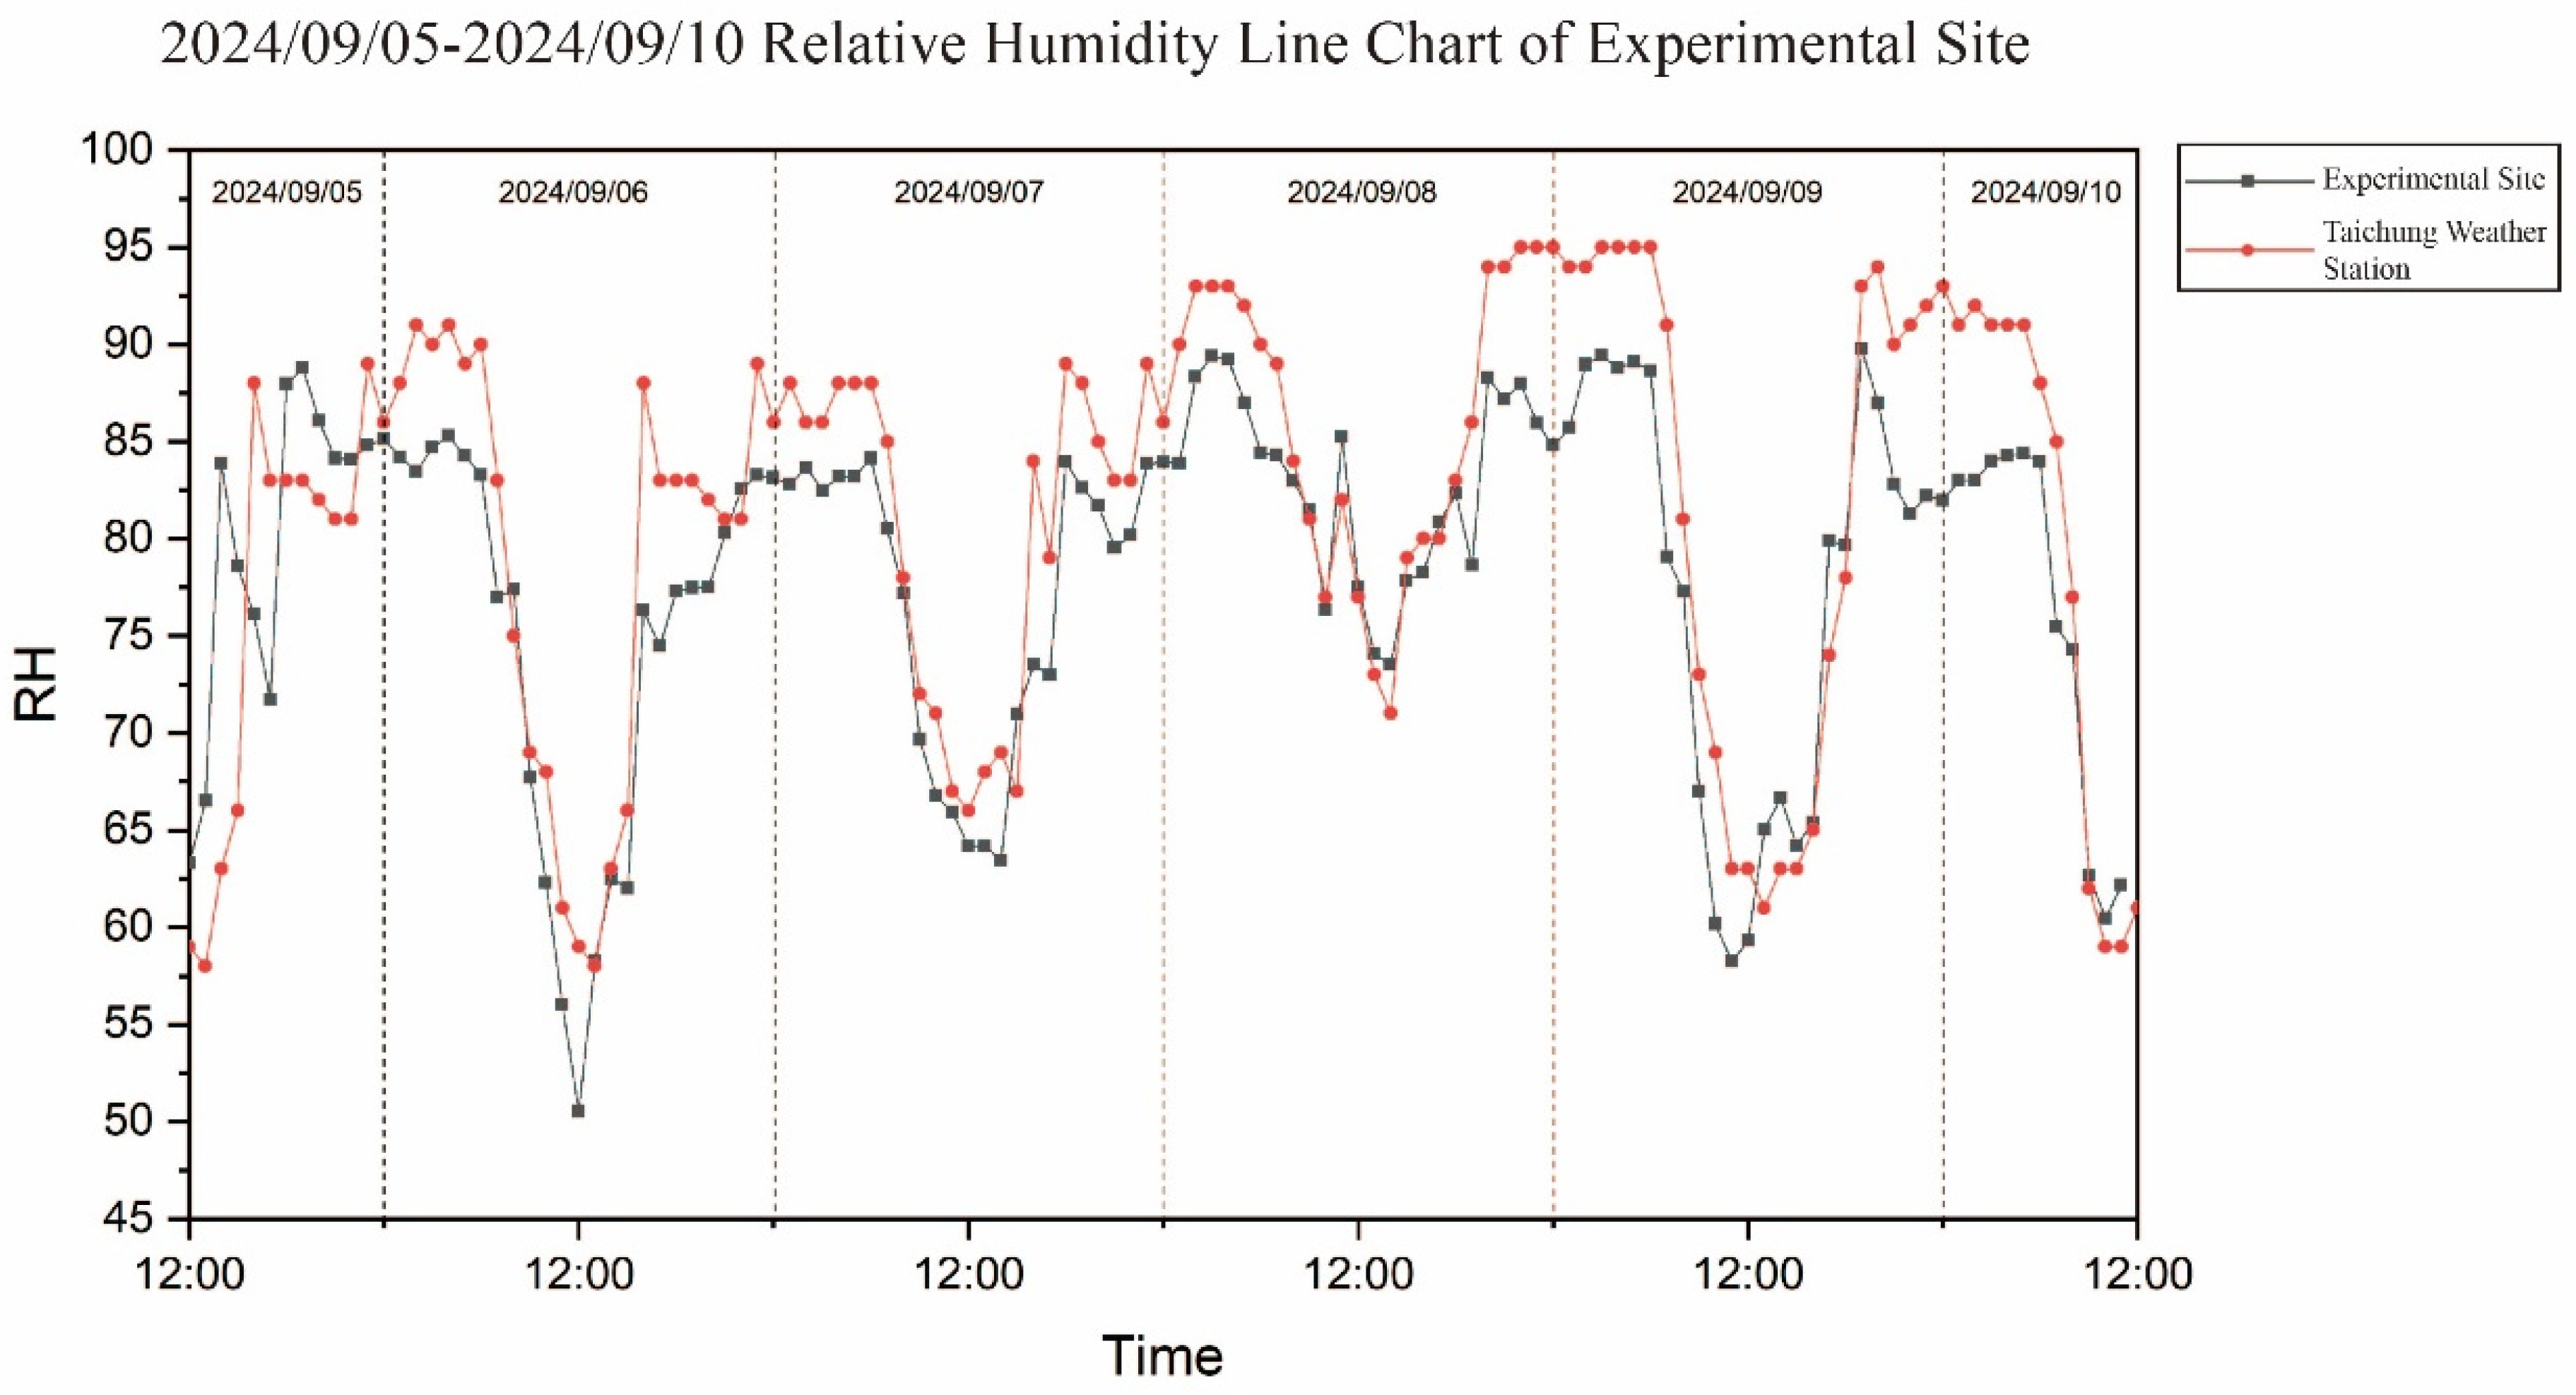
5.2.2. Analysis and Discussion of Environmental Test Results

The results reveal significant seasonal variations in environmental parameters. The average atmospheric temperature was 25.2 °C during the autumn and winter seasons, while it increased to 30.3 °C in the summer, reflecting a notable seasonal fluctuation.
The pavement surface temperature exhibited the highest variability, especially in summer, with a maximum value of 56.5 °C. This highlights the heat absorption and slow heat-release characteristics of cement surfaces, which contribute to the urban heat island effect. In contrast, the soil surface temperature was more stable during autumn and winter, with smaller fluctuations, demonstrating the effective temperature regulation of natural surfaces such as soil.
Relative humidity also displayed significant seasonal variation. While the maximum relative humidity reached 90% in the summer, the higher coefficient of variation suggested a negative correlation with temperature. This indicates that, as temperatures rise in summer, humidity levels tend to decrease, a common phenomenon in urban areas with dense concrete infrastructure.
The results of the statistical analysis support the hypothesis that the Urban Food Forest contributes positively to improving the microclimate. By moderating temperature extremes, enhancing humidity regulation, and promoting environmental stability, this urban intervention helps mitigate urban heat island effects and improve the overall thermal comfort of the space.

5.2.3. Correlation Analysis and Regression Model

To explore the relationships between the various environmental variables, this study included a correlation analysis. The results, along with the regression model analysis, are presented in Table 3.

5.2.4. Analysis and Discussion of Regression Results

The correlation analysis offers important insights into the interactions between key environmental parameters. The strong positive correlation (r = 0.85) between the atmospheric temperature and pavement surface temperature underscores the significant influence of impervious materials such as cement pavements on the urban microclimate. These materials absorb solar radiation and subsequently elevate local temperatures, contributing to the urban heat island effect. This highlights the critical need to incorporate heat-reflective or green materials in urban environments to mitigate temperature extremes and reduce the urban heat island effect.
The moderate positive correlation (r = 0.62) between the soil surface temperature and atmospheric temperature demonstrates the important role of soil in regulating temperatures. Unlike impervious surfaces, soil has the ability to retain and gradually release heat, which helps to moderate fluctuations in atmospheric temperatures. This finding emphasizes the advantages of using natural surfaces, such as soil and vegetation, to improve the stability of microclimates in urban settings and reduce the impact of extreme weather conditions, such as heat waves.
Furthermore, the negative correlation (r = −0.78) between relative humidity and atmospheric temperature provides insight into the inverse relationship between temperature and moisture levels. As temperatures rise, relative humidity tends to decrease, which aligns with the urban heat island effect. In urban environments, higher temperatures and lower humidity levels are typically observed compared to surrounding rural areas. This result underscores the importance of integrating effective humidity regulation strategies in urban planning, especially as climate change intensifies extreme temperature and humidity fluctuations.
In summary, these findings highlight the critical role of natural elements such as soil and vegetation in urban environments for enhancing microclimate regulation and mitigating the adverse effects of urbanization. By strategically designing urban spaces that address both temperature and humidity fluctuations, cities can create more sustainable, resilient, and livable environments. Furthermore, these results suggest that urban planning should incorporate natural surfaces and green infrastructure to reduce the impact of climate-related challenges, ultimately contributing to a more balanced and harmonious urban ecosystem.

5.2.5. Thermal Comfort Assessment

This study performed a thermal comfort assessment to examine how the human body responds to varying environmental conditions across different seasons. The results of the thermal comfort analysis are shown in Table 4.

5.2.6. Results Analysis and Discussion

The thermal comfort index for the autumn and winter seasons reveals a generally comfortable environment, where the slightly cool temperature is conducive to pleasant outdoor experiences. This finding underscores the effectiveness of the Urban Food Forest in maintaining a favorable climate during the cooler seasons, contributing to a comfortable microclimate for people.
In contrast, during the summer, the thermal comfort index indicates a warmer environment, though it remains within an acceptable range. This suggests that green spaces, such as the Urban Food Forest, have a moderating effect on the thermal environment by mitigating the intensity of the heat. While the summer temperatures may still be elevated, the presence of natural elements such as vegetation and soil helps to reduce the perceived heat, offering a more tolerable outdoor experience. This highlights the significant role of greenery in urban areas, especially in combating the urban heat island effect, where artificial surfaces contribute to excessive heat buildup.
Overall, the results emphasize the importance of integrating green spaces into urban environments to improve thermal comfort. These spaces not only help moderate temperature extremes but also enhance the quality of outdoor spaces, making them more comfortable and inviting throughout the year. Green infrastructure, such as the Urban Food Forest, plays a key role in reducing the adverse effects of urban heat islands and creating more resilient, livable urban environments.

5.2.7. Urban Heat Island Effect Mitigation Analysis

This study assesses the impact of the Urban Food Forest on mitigating the urban heat island effect by comparing the temperature differences between the project site and the surrounding urban area. The findings are summarized in Table 5.

5.2.8. Analysis and Discussion of UHI Results

The study found that the maximum temperature at the project site was 2.2 °C lower than in the surrounding urban area, suggesting that the Urban Food Forest is effective in mitigating the urban heat island (UHI) effect. This result aligns with previous studies, indicating that green spaces, particularly urban food forests, play a crucial role in lowering ambient temperatures by providing shade and promoting evapotranspiration [26]. These findings demonstrate the potential of urban greenery to reduce the heat burden in cities, similar to the cooling effects documented by other researchers in urban settings [27].
In particular, the cooling effect was more significant in soil-covered areas, highlighting the importance of integrating natural surfaces into urban design. This supports the existing research, which emphasizes the benefits of soil and vegetation in terms of regulating microclimates and reducing heat [28]. Such findings challenge traditional urban planning strategies that prioritize impervious materials such as cement, which contribute to increased heat and environmental stress.
Moreover, the cooling impact of the Urban Food Forest supports the notion that urban food forests are not only sustainable but also contribute to the resilience of cities in the face of climate change. The reduction in the UHI effect is particularly important in densely populated urban areas, where the combination of high population density and extensive impervious surfaces exacerbates the urban heat island phenomenon [29].
In conclusion, these findings underscore the need for more research into the role of urban food forests in mitigating the UHI effect, particularly in tropical climates. By incorporating green infrastructure into urban planning, cities can enhance thermal comfort, improve environmental quality, and create more sustainable, livable spaces.

6. Results and Discussions: Survey and Analysis Results

6.1. Mental Health Survey Results of Middle-Aged and Older Adults

This study included a survey about the mental health of middle-aged and older adults using the GDS-15 (Geriatric Depression Scale-15), provided by the Taiwan Depression Prevention Association. This scale is specifically designed for older adults and aims to assess their mental health status, covering emotional well-being, stress perception, and life satisfaction. After data collection, descriptive statistical analysis was performed to comprehensively interrogate the participants’ mental health, the impact of activities on their mental well-being, and their satisfaction with the activities.
The descriptive statistics generated in this study present the distribution of mental health status across different groups and help us to explore psychological changes before and after participation in the activities. The results include the range of scores on the GDS-15, mental health differences among groups, and satisfaction with the activities. Table 6 presents the detailed data analysis of the survey results and provides in-depth insights into the effects of the activities.

6.2. Results Discussion of Mental Health Survey Results

Based on the descriptive statistics presented in Table 6, we conducted a detailed analysis of mental health status across different groups. The results indicate that, in the gender-based grouping, male participants had an average GDS score of 5.8, with a standard deviation of 1.9, and a range between 3.2 and 9.2, showing relatively stable mental health, but with some individual variability. Female participants had an average GDS score of 5.0, with a standard deviation of 1.6, and a range between 2.8 and 8.0, demonstrating stable mental health with a certain degree of variability.
Regarding the frequency of weekly participation in activities, the group with no participation (zero times per week) had an average GDS score of 8.0, with a standard deviation of 2.5 and a range from 3.5 to 13.0, indicating that their mental health was less stable and exhibited higher fluctuations. The group participating in activities one to two times per week had an average GDS score of 6.5, with a standard deviation of 1.8, and a range from 3.8 to 9.5, suggesting relatively stable mental health. The group participating three to four times per week showed better mental health, with an average GDS score of 5.2, a standard deviation of 1.5, and a range from 3.0 to 8.5. The group participating in activities five or more times per week displayed the best mental health, with an average GDS score of 4.5, a standard deviation of 1.2, and a range from 2.8 to 7.2, indicating higher and more stable mental health levels.
Overall, there is a clear positive correlation between the frequency of participation in activities and mental health status. Groups with higher participation frequency showed more stable and better mental health, suggesting that regular involvement in activities helps improve the mental well-being of older adults. These results not only highlight the positive impact of activities on mental health but also suggest that increasing participation could be an effective strategy for promoting mental health.

6.3. Independent Samples t-Test: Male vs. Female Statistical Significance

Independent-Samples t-Test: Male vs. Female
This section aims to compare whether there is a statistically significant difference in mental health scores between male and female participants.
Test Hypotheses
  • Null Hypothesis (H0): The mean mental health scores of male and female participants are equal.
  • Alternative Hypothesis (H1): The mean mental health scores of male and female participants are different.
Regarding the t-Test results, as shown in Table 7, an independent-samples t-test was conducted to compare the mental health scores of male and female participants. The results are as follows:

6.4. Results and Discussion of t-Test

Based on the results of the independent-samples t-test, the t-value was 2.45 and the p-value was 0.017, which is below the established significance level of 0.05. Therefore, we reject the null hypothesis (H₀) and accept the alternative hypothesis (H₁). This indicates that there is a significant difference in the mental health scores between male and female participants, with male participants scoring significantly higher than female participants.
This result demonstrates that gender has a significant impact on mental health scores, with male participants generally showing better mental health than their female counterparts. This finding not only reveals the effect of gender on mental health within the elderly population but also provides important reference points for future mental health promotion strategies. Gender differences may be related to variations in emotional expression, stress coping mechanisms, and socio-cultural roles, all of which can influence mental health outcomes.
Further analysis shows that the difference in mental health scores between males and females reached statistical significance, with a t-value of 2.45 and a p-value of 0.017. This suggests that there is a significant difference in mental health status between the two groups. Since the p-value is less than 0.05, we reject the null hypothesis and conclude that male participants’ mental health scores are significantly higher than those of female participants. This may reflect more proactive participation from male participants in the program, or it may indicate that men are less likely to express distress when facing mental health issues.
This result highlights the potential impact of gender differences on mental health status among older adults, which is possibly influenced by socio-cultural factors, gendered expectations, and differences in emotional expression. Therefore, when designing future interventions or policies, it is essential to consider gender differences and develop more targeted strategies to improve mental health for both male and female groups.

6.5. One-Way Analysis of Variance (ANOVA): Participation Frequency Groups

Objective of the Test:
This analysis aims to compare the differences in mental health scores among participants with varying frequencies of participation, in order to explore the impact of weekly participation on mental health status.
Group Description:
To examine the relationship between different weekly participation groups and mental health status, this study divided participants into four groups based on their weekly participation frequency. The sample size, mean GDS scores, and standard deviations for each group are presented in Table 8. The analysis shows that there are differences in mental health scores among the groups, providing insights into how participation frequency affects mental health.
Test Hypotheses:
  • Null Hypothesis (H0): There is no significant difference in mental health scores among participants with different participation frequencies.
  • Alternative Hypothesis (H1): At least one group shows a significant difference in mental health scores.
ANOVA Results:
To examine whether there is a statistically significant difference in mental health scores among the groups with different participation frequencies, a one-way ANOVA was conducted. As shown in Table 9, the results indicate significant differences in mental health scores among the groups, suggesting that participation frequency has a significant impact on mental health.
Tukey Test:
Further analysis was performed using the Tukey test to compare the mental health scores between each pair of groups. The results in Table 10 show significant differences between the following groups:

6.6. Results and Discussion of ANOVA

The results of the one-way ANOVA show that participants with different frequencies of participation exhibited significant differences in mental health scores. Specifically, as weekly participation increased, the mental health scores of participants significantly improved, indicating better mental health outcomes. Based on the mean GDS scores of each group, participants who did not engage (0 times group) had the highest scores (8.0), while those participating more than five times per week had the lowest scores (4.5), suggesting the best mental health status within this group.
The F value of the ANOVA was 14.85, with a p-value less than 0.001, confirming that there was a significant difference between the participation frequency groups. Subsequent Tukey test results show significant differences between the zero times group and the five-times-or-more group (p < 0.001), the zero-times group and the three-to-four-times group (p = 0.002), and the one-to-two-times group and the five-times-or-more group (p = 0.018). These findings suggest that, the more frequently participants engage in activities, the more significantly their mental health scores improve.
This result highlights the positive impact of participation frequency on mental health, especially for the group with five or more sessions per week, whose mental health scores were significantly lower than those of groups with no participation or less frequent participation. This finding provides strong empirical support for promoting increased participation in activities aimed at improving mental health.

6.7. Non-Participant Observation Results

In this study, we used non-participant observation to conduct an in-depth behavioral study of participants in the Sino–German market, focusing specifically on their interaction patterns, mental health status, and dining frequency. Using this method, we collected and analyzed a large amount of data to better understand participants’ behavior in the market and explore the characteristics of their social interactions. Based on these data, we not only analyzed behavioral patterns in the market but also further examined the potential correlation between dining frequency and participants’ mental health.
Specifically, we observed different emotional expressions and interaction behaviors among the participants in social settings, including the frequency of interactions, communication methods, and their roles within groups. Additionally, the frequency and format of dining had a significant impact on participants’ mental states, particularly in terms of strengthening social connections and promoting improvements in mental health. These observations suggest that dining frequency plays an active role in participants’ mental health and has a profound impact on their emotions and social behaviors. Table 11 shows the relevant analysis results, and we present specific findings based on the observation data.

6.8. Results and Discussion of Non-Participant Observation

  • Participant Behavior and Interaction: During the observation period, 100 participants were recorded to assess their behaviors and interactions. The results revealed that approximately 62% of participants primarily interacted with acquaintances, and 43% of these interactions took place within fixed small groups. This preference for stable social connections with familiar members aligns with existing research on social behavior, which suggests that people tend to gravitate toward familiar social networks to reduce uncertainty and enhance social bonding [30]. Additionally, around 30% of participants exhibited anxious or uneasy behaviors while waiting, including constant movement, frequent time-checking behaviors, or scanning their surroundings. These anxious behaviors were more prominent during peak periods, which may indicate heightened stress or tension during waiting times. Previous studies on public space behaviors have shown that crowded environments often lead to increased stress levels and anxiety, particularly in urban settings where people experience sensory overload [31].
  • Mental Health Status: Approximately 22% of participants showed signs of anxiety or stress, particularly in crowded areas. These participants displayed emotional instability, such as frowning, remaining silent, or exhibiting restless body language. Such behaviors are indicative of a higher psychological burden in certain environments, which mirrors findings from previous studies on environmental stressors. For instance, research has demonstrated that crowded and noisy environments can exacerbate feelings of stress and anxiety [32]. Among elderly participants (over 60 years old), the prevalence of mental health concerns was more pronounced, with 35% showing signs of low mood or anxiety. This trend is consistent with the literature on aging, which highlights that older individuals are more susceptible to psychological distress, particularly in social or environmental contexts that may feel overwhelming or isolating [33]. Additionally, the elderly participants demonstrated slower response patterns, which could be attributed to age-related psychological and cognitive factors, as well as social challenges associated with aging.
  • Dining Frequency: The observation data indicated that 70% of participants chose to dine after engaging in market activities, with 50% dining with members of the same small group, particularly on weekends when dining frequency significantly increased. This behavior suggests a strong preference for collective gatherings and socialization following communal events, which aligns with research on the social role of dining in fostering connection and reinforcing group bonds [34]. The typical dining duration was between 45 min and 1 h, and most participants chose to dine in areas close to the event site. This tendency to dine near the activity location supports the idea that people prefer convenient and accessible spaces for social interaction, which in turn facilitates the continuation of social connections in informal settings.
  • Facial Expressions, Activity Patterns, and Time Allocation: Our observations revealed that 58% of participants exhibited mild smiles or relaxed expressions during conversations, suggesting a relatively positive and cheerful demeanor in social interactions. However, about 30% displayed bored or disinterested expressions, indicating a lower level of engagement in the activity. These findings are consistent with studies on emotional contagion and the role of facial expressions in social interactions, which suggest that participants’ emotional states influence and are influenced by the emotions of others [35]. In terms of activity patterns, participants spent about 60% of their time selecting products, reflecting a high level of interest in market goods. This is in line with consumer behavior research, which emphasizes the importance of product selection in retail environments as a primary factor driving engagement [36,37]. Additionally, 30% of the time was spent on social interactions, underscoring the significance of communication and connection in these types of settings, while about 10% was dedicated to dining or resting. Overall, the average stay in the market was 90 min, with 20% of that time allocated to socializing or dining, highlighting the importance of social dynamics and community engagement in market-based activities.

7. Conclusions and Recommendations

7.1. Conclusions

This study conducted field measurements and analysis of the microclimate regulation effects in the Urban Food Forest green space. The results showed that the area significantly alleviates the urban heat island effect. In the experimental site, which is located in a high-temperature potential heat island zone, the green plant coverage area effectively reduced surrounding temperatures during the summer, significantly improving outdoor comfort. Specifically, the soil surface temperature was about 24 °C lower than the cemented pavement, confirming its excellent cooling effect. Additionally, the green space stabilized humidity fluctuations, reducing the impact of extreme humidity changes. Although the humidity regulation effect was weaker than expected, the overall microclimate improvement was still significant, contributing to the enhancement of urban living quality.
The study also showed that the green area provided a suitable microclimate environment during the autumn and winter, further improving outdoor comfort. Overall, the results highlight the crucial role of urban greening in environmental regulation and ecological value enhancement, providing valuable scientific evidence for urban planning and decision makers.
The specific conclusions are as follows:
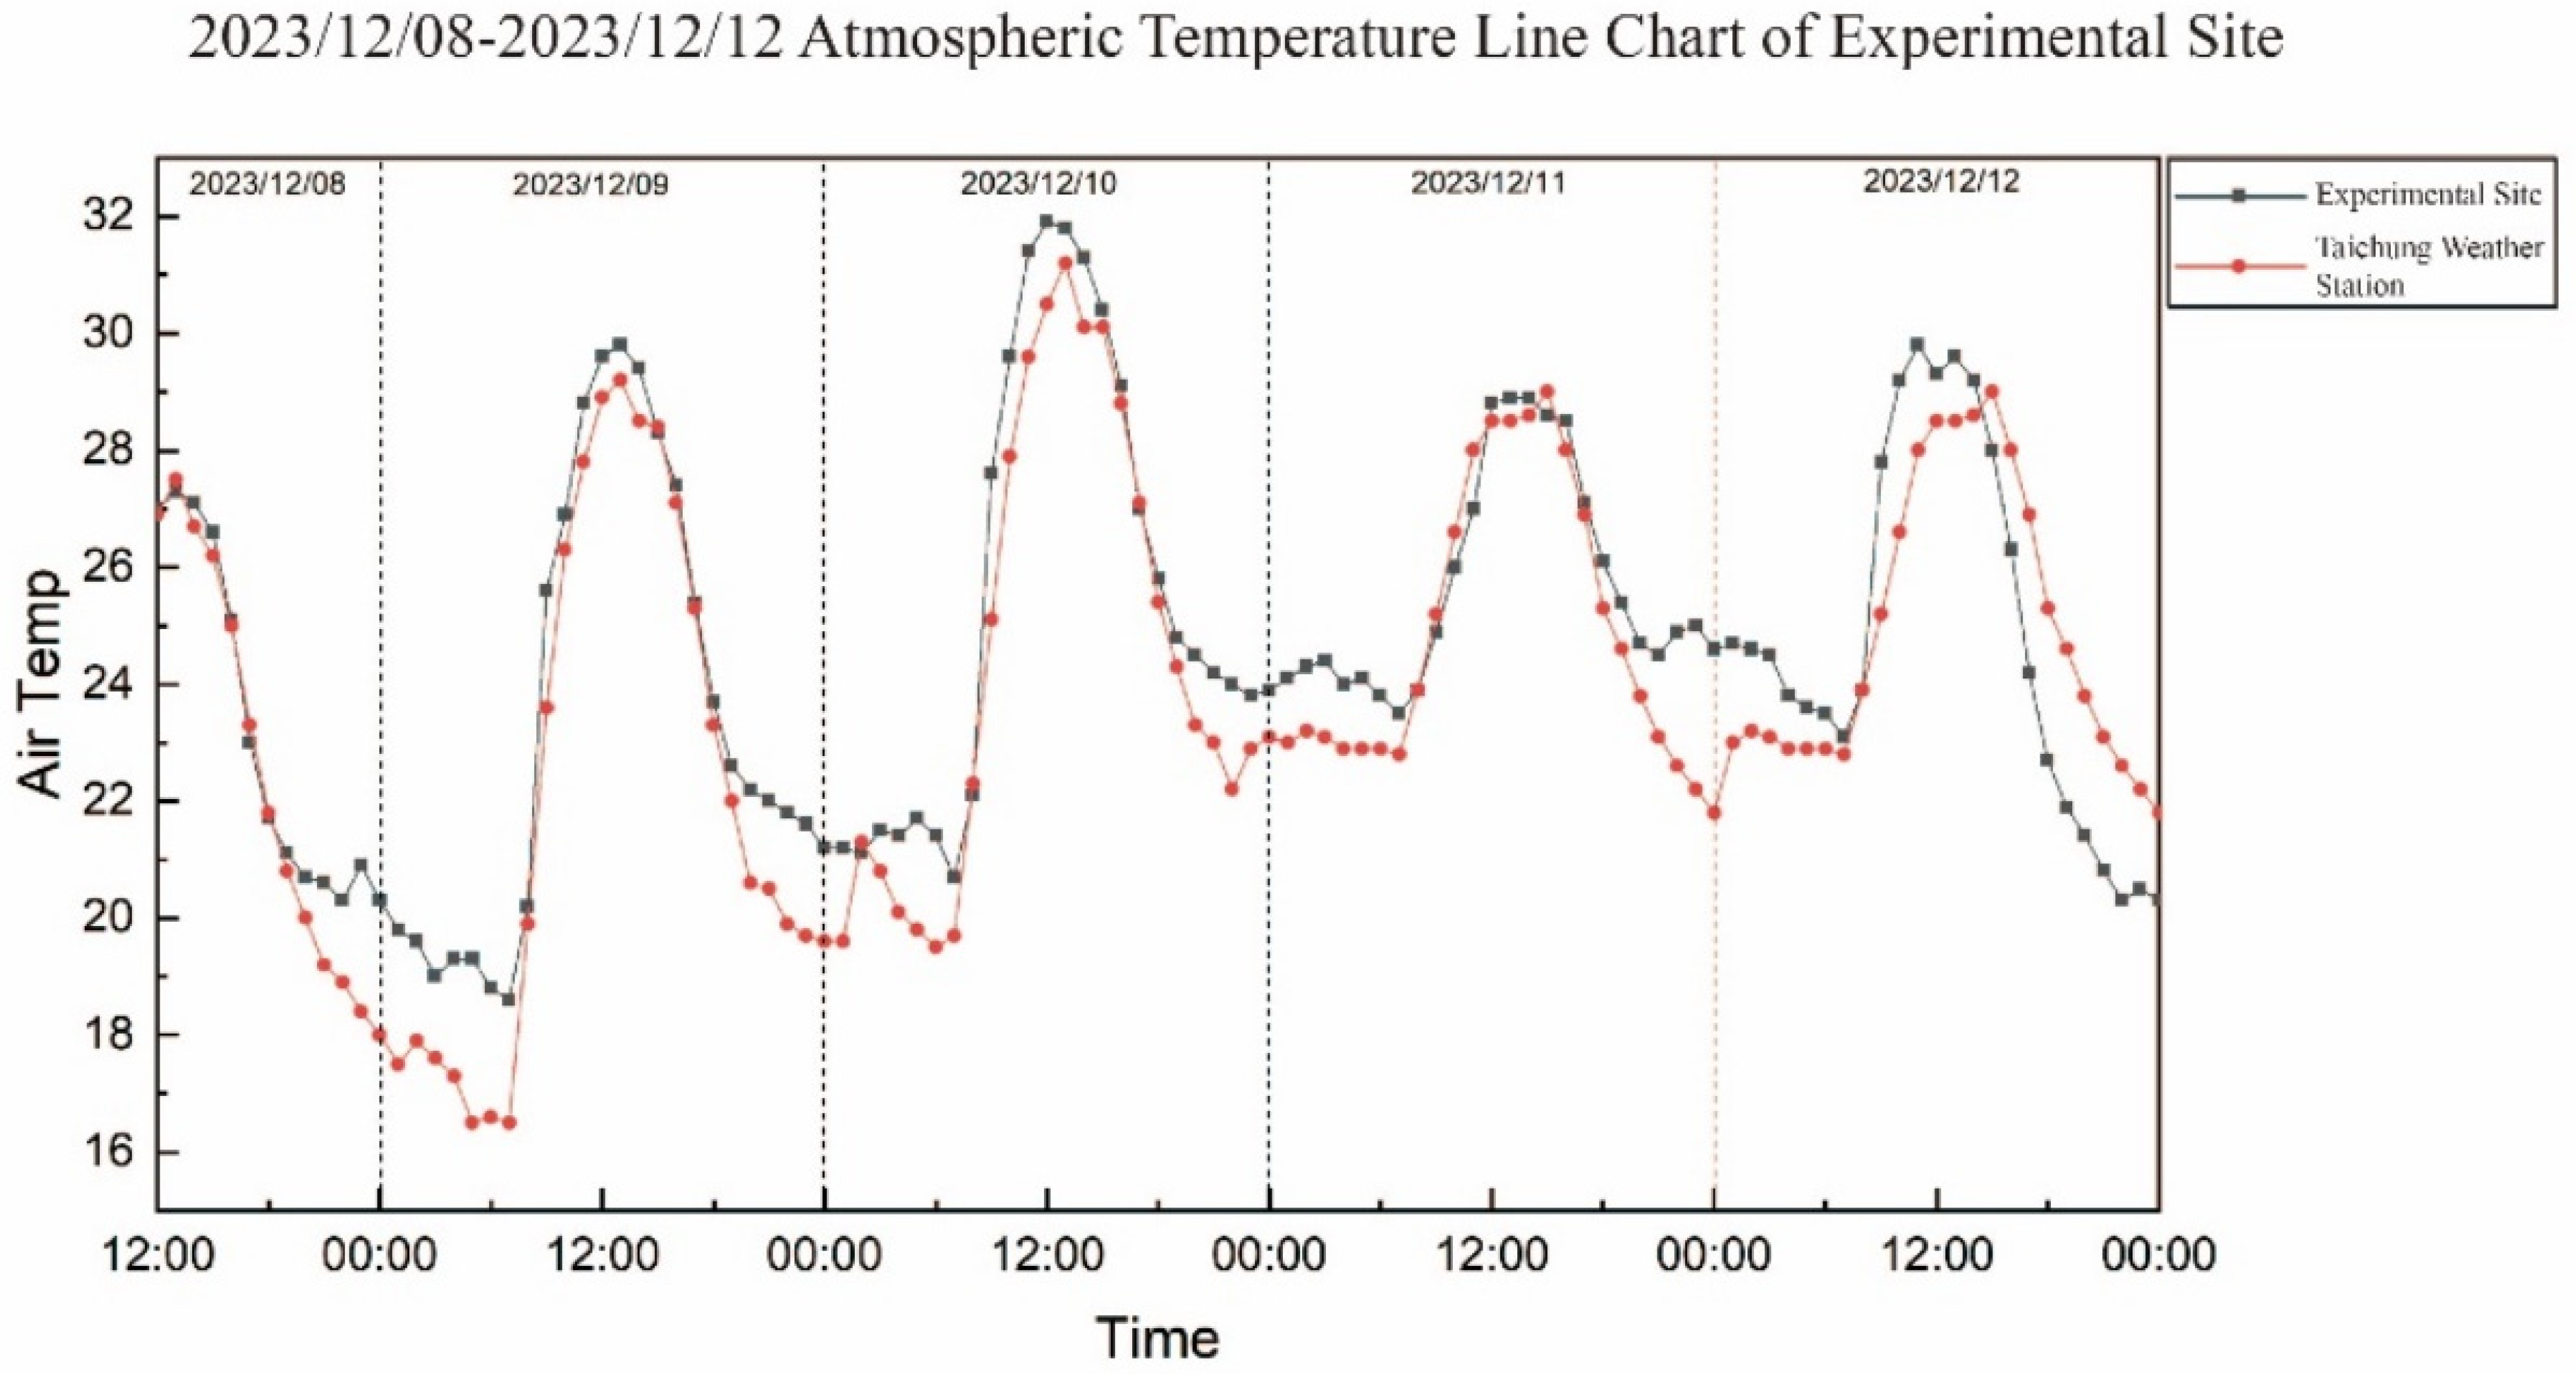
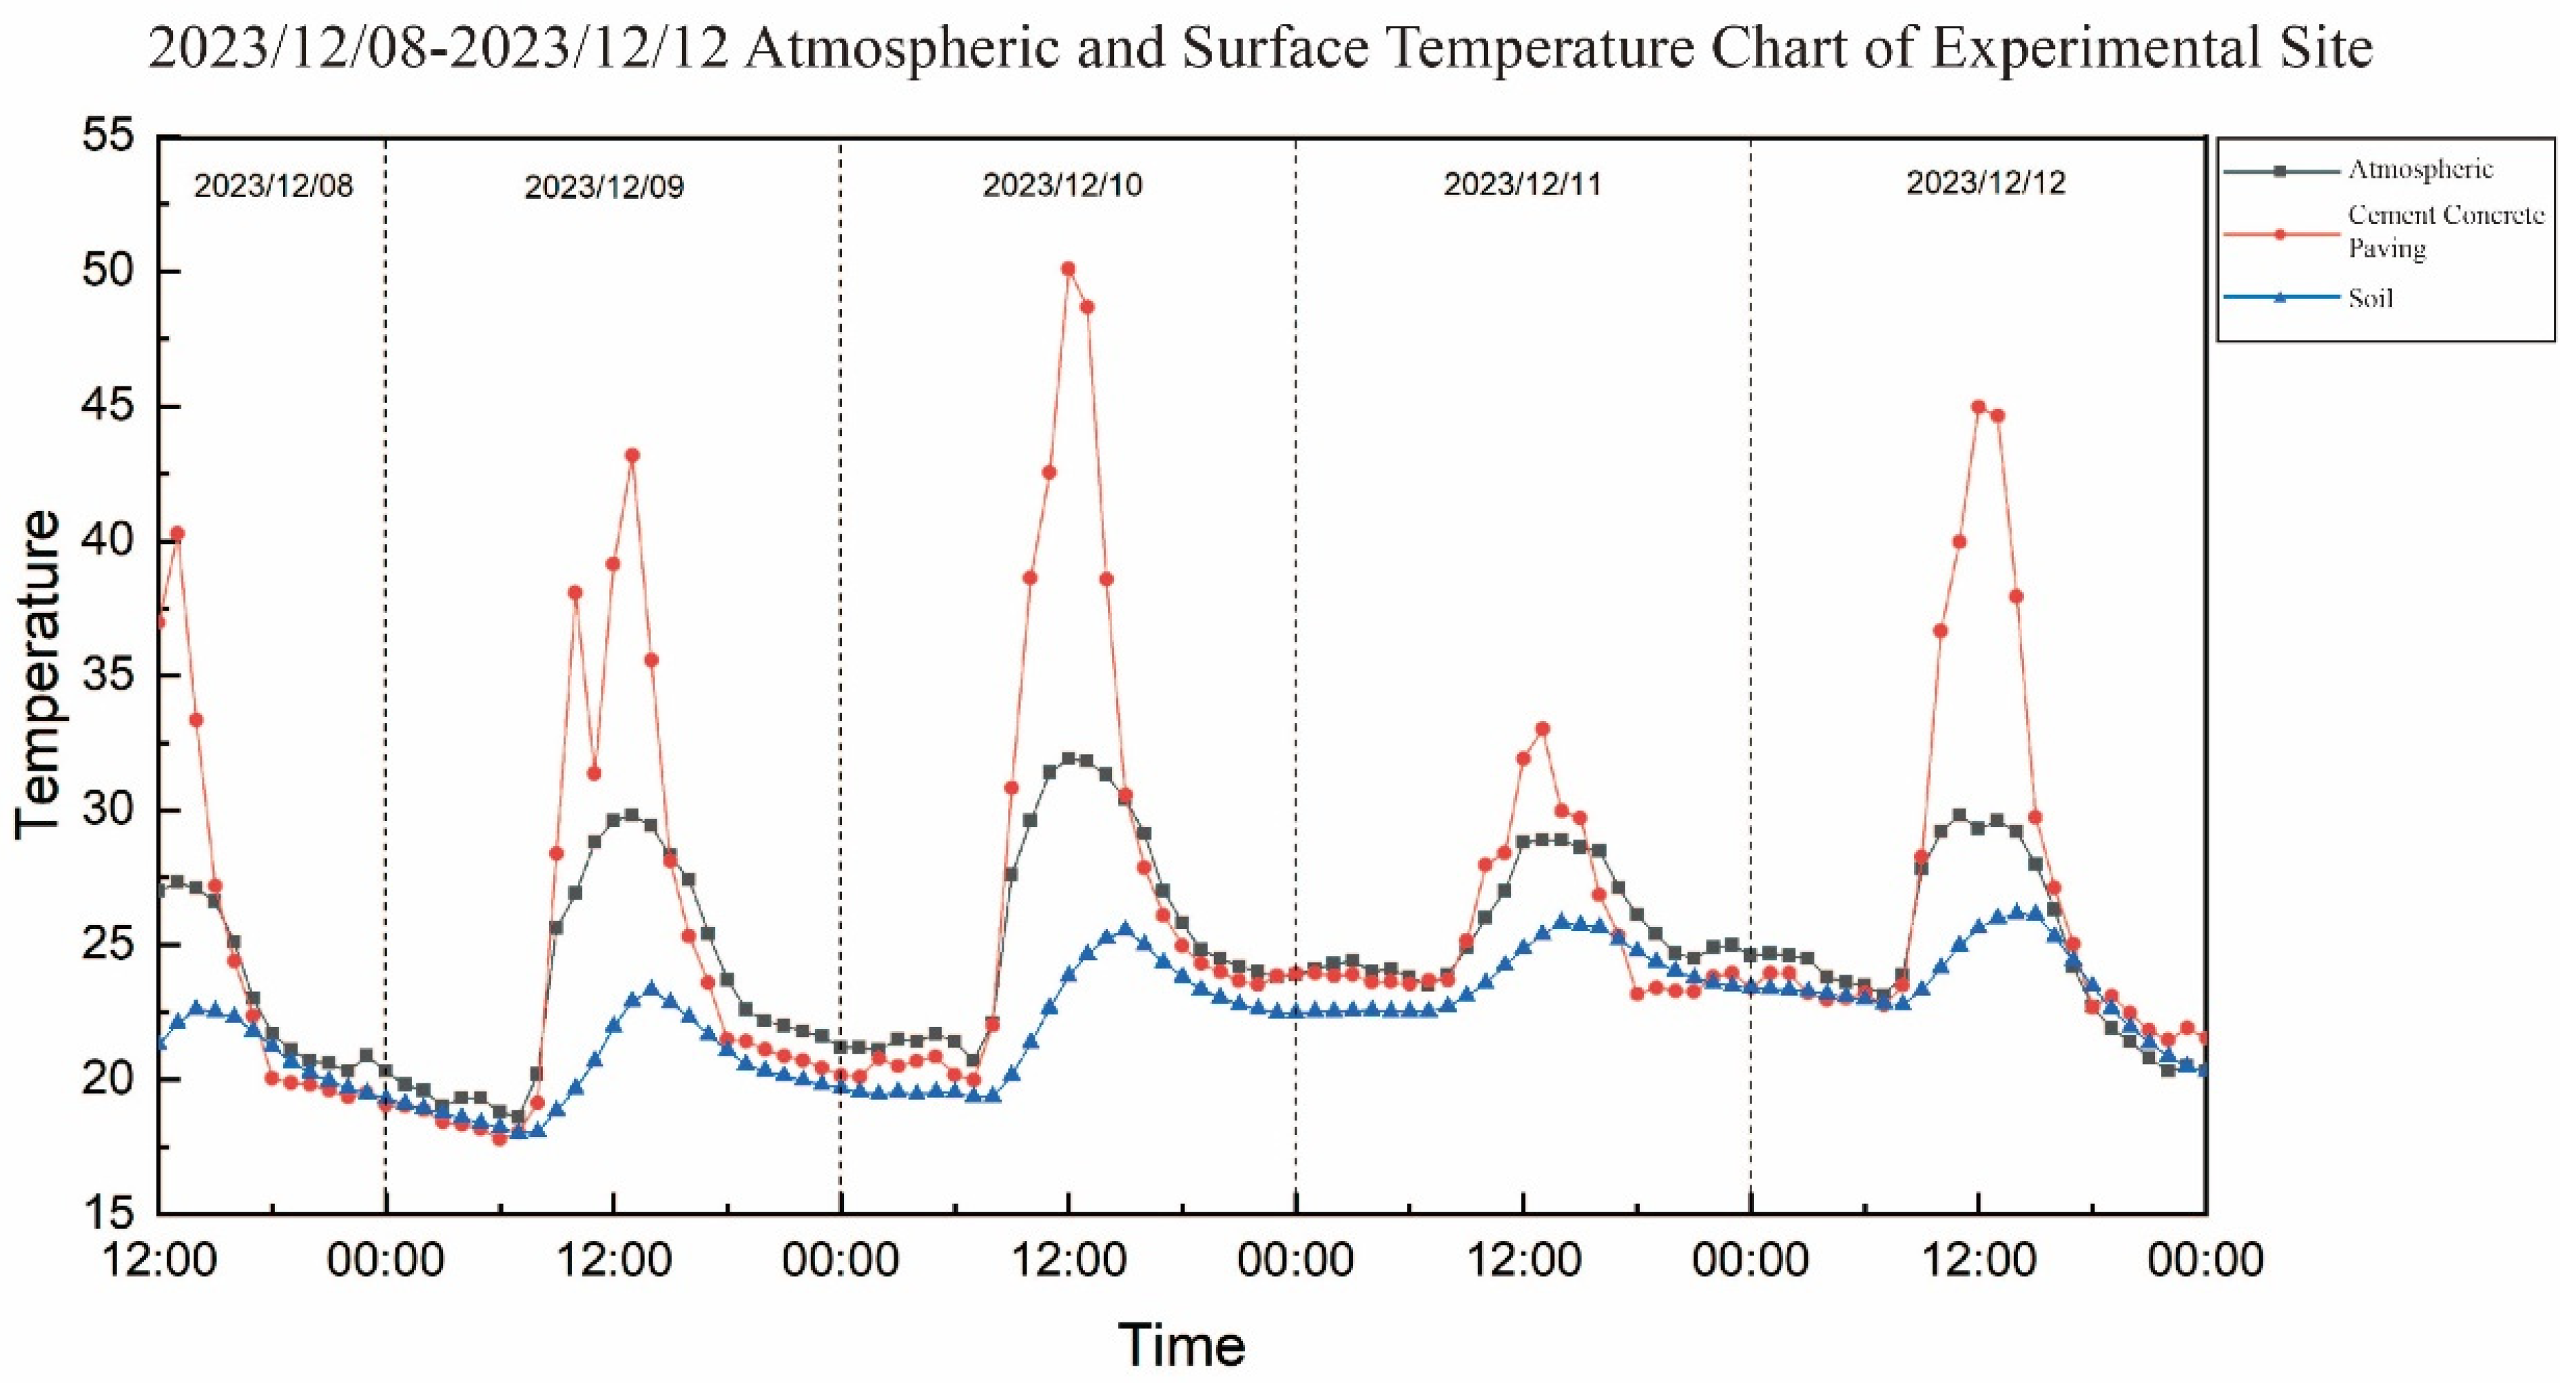
  • Significant Temperature Regulation Effect: The experimental data showed the notable cooling effect of the green space, especially in the soil-covered areas, effectively reducing surrounding temperatures by approximately 2.2 °C, contributing significantly to alleviating the urban heat island effect. Additionally, the green space provided more comfortable microclimate conditions during the autumn and winter, improving outdoor comfort.
  • Weaker Humidity Regulation Effect: Although the green space had a positive impact on improving environmental comfort, its effect on humidity regulation was relatively weak. The increase in humidity regulation was only 7%, falling short of the expected target, indicating that further improvements in humidity regulation mechanisms are needed.
  • Positive Impact of Plant Coverage on Urban Microclimate: Plant coverage had a clear positive impact on improving the urban microclimate. The study showed that green spaces effectively mitigated the heat island effect and improved the quality of the surrounding living environment.
  • Gender Differences in Mental Health Among Older Adults: In the survey on mental health among older adults, male participants had significantly higher mental health scores than female participants, suggesting that gender differences significantly affect mental health. More gender-specific interventions will be needed in the future.
  • Positive Correlation Between Activity Frequency and Mental Health: The survey results showed a positive correlation between mental health and activity frequency among older adults. Those with higher participation frequencies (more than five times per week) exhibited significantly better mental health, indicating that regular participation in activities significantly improves and enhances mental health.
Despite these findings, the study has several limitations, including a relatively small sample size, the absence of a control group, and the influence of potential confounding factors. Future research should adopt more rigorous methodologies, such as randomized controlled trials and larger-scale longitudinal studies, to strengthen the validity and applicability of the results.
This study provides empirical support for urban greening and microclimate regulation and can serve as a reference for future urban planning and health promotion measures, contributing to sustainable environmental development and improving the livability of cities.

7.2. Recommendations

  • Expansion of Green Spaces: Based on the findings of this study, we recommend further expanding the coverage of green plants in the Zhongde Market, especially in areas where humidity regulation is weaker. By incorporating more plants that help regulate humidity, the market’s humidity control may be made more effective, thereby improving overall comfort and ecological value.
  • Enhance Consideration of Gender Differences: Given the significant differences in psychological health between men and women (p = 0.017), future intervention designs should consider the impact of gender on mental health. Specifically, for the female group, we recommend introducing activities focused on emotional regulation and stress management to improve their psychological well-being.
  • Promote Higher Activity Frequency: The study found a strong correlation between higher activity participation frequency and better mental health. We suggest designing more activities that encourage older adults to participate in social or outdoor events at least five times a week. These activities should incorporate elements that benefit mental health, thereby promoting overall psychological improvement among the senior population.
  • Foster Social Interaction: Participants in the experimental site primarily interacted within familiar circles, but some individuals, particularly older adults, exhibited signs of anxiety and stress. We recommend creating more open social events where participants from diverse backgrounds can engage with each other. This could help reduce anxiety and improve the overall social support system, ultimately enhancing mental health.
This study shows that, by implementing the Urban Food Forest project, it is not only possible to significantly enhance urban environmental comfort but also to effectively mitigate the urban heat island effect, improving the overall microclimate. Furthermore, the project had a positive impact on participants’ mental health by offering green spaces and opportunities for social interaction, which fostered psychological well-being and the establishment of a supportive social network. The combined positive effects ultimately improved the urban living environment, enhancing the overall well-being and quality of life of residents. Therefore, the “City Food Forest” project holds profound significance for promoting sustainable urban development and enhancing the quality of life for city dwellers.

Author Contributions

Conceptualization, W.-P.S. and M.-C.L.; methodology, W.-P.S. and H.-L.P.; software, W.-P.S.; formal analysis, W.-P.S., H.-L.P. and M.-C.L.; data curation, W.-P.S., H.-L.P. and C.-T.H.; writing—original draft preparation, W.-P.S., H.-L.P. and C.-T.H.; writing—review and editing, W.-P.S., H.-L.P. and M.-C.L.; visualization, W.-P.S., H.-L.P. and C.-T.H.; project administration, W.-P.S., C.-T.H., Y.-J.C. and J.-J.W.; funding acquisition, W.-P.S., C.-T.H., Y.-J.C. and J.-J.W. All authors have read and agreed to the published version of the manuscript.

Funding

This research was funded by the Taichung City Government, which provided financial support for the establishment of the experimental site. All related experiments and research were conducted by our team. The APC was funded by National Chin-Yi University of Technology.

Institutional Review Board Statement

Our study used environmental measurements and anonymous questionnaire surveys to assess urban environmental comfort and mental well-being. The questionnaire responses were collected anonymously, without any personally identifiable information or sensitive health data. According to Taiwan’s “Scope of Human Research Exempt from Obtaining Subject Consent” (announced on 5 July 2012), research that falls under “public policy effectiveness evaluation studies conducted by government agencies or professional institutions entrusted by government agencies” is exempt from obtaining Institutional Review Board (IRB) approval. Our study aligns with this exemption, and, therefore, formal IRB approval was not required. https://ethics.moe.edu.tw/files/demo/demo_u27/p08.html (accessed on 3 February 2025).

Informed Consent Statement

Informed consent was obtained from all individual participants included in the study.

Data Availability Statement

All data are available within the article and from the corresponding author upon request.

Acknowledgments

This paper was primarily planned and executed with the assistance of the Taichung City Government and the Taichung City Low Carbon Office. Special thanks to them.

Conflicts of Interest

The authors declare no conflicts of interest.

References

  1. Al-Kodmany, K.; Govind, M.; Khan, S.; Pinheiro, A.; Kole, C. Navigating Urban Agriculture and Sustainability; CRC Press: Boca Raton, FL, USA, 2024; pp. 1–8. [Google Scholar] [CrossRef]
  2. Pallathadka, A.; Chang, H.; Ajibade, I. Urban sustainability implementation and indicators in the United States: A systematic review. City Environ. Interact. 2023, 19, 100108. [Google Scholar] [CrossRef]
  3. Upreti, M.; Saikia, P.; Lal, P.; Kumar, A. Major challenges in the urbanizing world and role of earth observations for livable cities. In Earth Observations for Urban Sustainability; Amsterdam, The Netherlands; Elsevier BV, 2024; pp. 23–52. [Google Scholar] [CrossRef]
  4. Tiwari, P.; Arora, A.; Nagpal, K. Interrelationship of climate change and urbanization. In Urban Climate and Sustainability; Informa: London, UK, 2023; pp. 17–25. [Google Scholar] [CrossRef]
  5. Tyagi, S.K.; Kumar, V.; Kumar, D. Environmental health quality and the consequences of urbanization: A review. Int. J. Adv. Agric. Sci. Technol. 2023, 10, 13–23. [Google Scholar] [CrossRef]
  6. Healing, T. The Impacts of Urbanising the World’s Population on Emergencies, Incidents, Disasters, and Disease Outbreaks; Cambridge University Press: Cambridge, UK, 2024; pp. 30–35. [Google Scholar] [CrossRef]
  7. Korabelnikova, Y.L. Problems of urban development at the contemporary global urbanization stage and solutions. Gradostroitelʹnoe Pravo 2024, 2024, 11–14. [Google Scholar] [CrossRef]
  8. Liu, Y.; Yan, L.; Wang, Y.; Tang, X.; Gao, M.; Yang, J.; Liu, Z.; Hu, X. The impact of urban agglomeration planning on depression in older adults. Front. Public Health 2024, 12, 1456729. [Google Scholar] [CrossRef]
  9. Wang, Y. Development strategy of urban public cultural service system under the perspective of positive aging: A study based on the practice of “age-friendly cities” in New York and Shanghai. Sci. Soc. Res. 2024, 6, 157–169. [Google Scholar] [CrossRef]
  10. Khan, H.T.A. Public health challenges and responses to the growing ageing populations: A review of literature. Preprint 2024. [Google Scholar] [CrossRef]
  11. Phillipson, C.; Doran, P.; Yarker, S.; Buffel, T. Aging in the urban context. In Aging in the Urban Context; Edward Elgar Publishing: Cheltenham, UK, 2024; pp. 259–276. [Google Scholar] [CrossRef]
  12. Warner, M.E.; Zhang, X.; Guillemot, J. Demographic ageing: An opportunity to rethink economy, society and regions. Camb. J. Reg. Econ. Soc. 2024, 18, 79–92. [Google Scholar] [CrossRef]
  13. Duminy, J.W.A.; Ezeh, A.; Galea, S.; Harpham, T.; Montgomery, M.R.; Salas, J.M.I.; Weber, D.; Weimann, A.; You, D. Demographic change and urban health: Towards a novel agenda for delivering sustainable and healthy cities for all. F1000Research 2023, 12, 1017. [Google Scholar] [CrossRef]
  14. United Nations; Department of Economic and Social Affairs; Population Division. World Population Prospects 2022: Summary of Results; UN DESA/POP/2021/TR/NO.3; United Nations: New York, NY, USA, 2022. [Google Scholar]
  15. Clark, K.H.; Nicholas, K. Introducing urban food forestry: A multifunctional approach to increase food security and provide ecosystem services. Landsc. Ecol. 2013, 28, 1649–1669. [Google Scholar] [CrossRef]
  16. Oncini, F.; Hirth, S.; Mylan, J.; Robinson, C.H.; Johnson, D. Where the wild things are: How urban foraging and food forests can contribute to sustainable cities in the Global North. Urban For. Urban Green. 2024, 93, 128216. [Google Scholar] [CrossRef]
  17. Rockwell, C.A.; Kohnstamm Crow, A.; Guimarães, É.R.; Recinos, E.R.R.; La Belle, D. Species richness, stem density, and canopy in food forests: Contributions to ecosystem services in an urban environment. Urban Plan. 2022, 7, 139–154. [Google Scholar] [CrossRef]
  18. Homan, J. Edible Landscapes: Relocalising Food and Bringing Nature into North London; Springer: Tokyo, Japan, 2021; pp. 77–103. [Google Scholar] [CrossRef]
  19. Skar, S.L.G.; Pineda-Martos, R.; Timpe, A.; Pölling, B.; Bohn, K.; Külvik, M.; Delgado, C.; Pedras, C.M.G.; Paço, T.A.; Ćujic, M.; et al. Urban agriculture as a keystone contribution towards securing sustainable and healthy development for cities in the future. Blue-Green Syst. 2020, 2, 1–27. [Google Scholar] [CrossRef]
  20. Salleh, A.M.; Harun, N.Z.; Halim, S.A. Urban food insecurity: The relationship between community resilience and urban agriculture. Asian J. Qual. Life 2020, 5, 57–73. [Google Scholar] [CrossRef]
  21. Ambrose, G.; Das, K.; Fan, Y.; Ramaswami, A. Is gardening associated with greater happiness of urban residents? A multi-activity, dynamic assessment in the Twin-Cities region, USA. Landsc. Urban Plan. 2020, 198, 103776. [Google Scholar] [CrossRef]
  22. Fauzia, A.; Frimawaty, E.; Arifin, H.S. Urban Agriculture as Ecosystem Services Provider: A Review. Holist. J. Trop. Agric. Sci. 2024, 2, 31–45. [Google Scholar] [CrossRef]
  23. Krishnaveni, S.A.; Malathi, G.; Devi, T.S.; Gomadhi, G.; Kumar, G.S.; Senthilkumar TM, A.; Prabhavathi, S.J.; Devi, T.S.; Ramasamy, M. Urban Agriculture: Exploring Its Potential, Challenges, and Socio-Economic Impacts. J. Sci. Res. Rep. 2024, 30, 54–64. [Google Scholar] [CrossRef]
  24. Ristianti, N.; Bashit, N.; Ulfiana, D.; Windarto, Y. The edible green roof: Sustainable urban landscape design through biophilic concept for food security in Semarang Metropolitan Region, Indonesia. IOP Conf. Ser. Earth Environ. Sci. 2024, 1394, 012006. [Google Scholar] [CrossRef]
  25. Teoh, S.H.; Wong, G.R.; Mazumdar, P. A review on urban farming: Potential, challenges and opportunities. Innov. Agric. 2024, 7, 1–11. [Google Scholar] [CrossRef]
  26. Zhan, J.; He, W.; Huang, J. Comfort, carbon emissions, and cost of building envelope and photovoltaic arrangement optimization through a two-stage model. Appl. Energy 2024, 356, 122423. [Google Scholar] [CrossRef]
  27. Zhan, J.; He, W.; Huang, J. Dual-objective building retrofit optimization under competing priorities using Artificial Neural Network. J. Build. Eng. 2023, 70, 106376. [Google Scholar] [CrossRef]
  28. Li, X.; Lu, W.; Peng, Z.; Zhang, Y.; Huang, J. Generative design of walkable urban cool spots using a novel heuristic GAN × GAN approach. Build. Environ. 2024, 266, 112027. [Google Scholar] [CrossRef]
  29. Kong, Y.S. The Relationship Between Urban Morphology and the Urban Heat Island Effect: A Study of Cooling Strategies in Urbanized Areas. Appl. Comput. Eng. 2025, 122, 77–83. [Google Scholar] [CrossRef]
  30. Ross, L.P.; Inagaki, T.K. Recalling prior experiences with a close other can fulfill the need for social connection. Emotion 2022, 23, 321–331. [Google Scholar] [CrossRef] [PubMed]
  31. Anand, S.; Pujara, T. Towards anxiety alleviating streetscape design: A comprehensive literature review. Cities Health 2024, 8, 1134–1152. [Google Scholar] [CrossRef]
  32. Guo, F.; Luo, M.; Zhao, H.; Du, Z.; Zhang, Z.; Zhang, H.; Dong, J.; Zhang, D. Qualitative mechanisms of perceived indoor environmental quality on anxiety symptoms in university. Buildings 2024, 14, 3530. [Google Scholar] [CrossRef]
  33. Mirzaei-Alavijeh, M.; Parsafar, S.; Moradinazar, M.; Jalilian, F. Socio-economic and demographic factors associated with psychological distress among elderly. J. Health Rep. Technol. 2025, 11, e151784. [Google Scholar] [CrossRef]
  34. Lee, D. The Origins of an Everyday Behavior: Why Do People Share Meals? Honors Theses 2014, 254. Available online: https://egrove.olemiss.edu/hon_thesis/254 (accessed on 3 January 2025).
  35. Kavanagh, E.; Whitehouse, J.; Waller, B.M. Being facially expressive is socially advantageous. Sci. Rep. 2024, 14, 12798. [Google Scholar] [CrossRef]
  36. Sapara, N.J.; Patel, H. Consumer behavior analysis through advanced-data techniques: A review for utilities in retail marketing. Indian Sci. J. Res. Eng. Manag. 2024, 08, 1–5. [Google Scholar] [CrossRef]
  37. Roy, P. Theory and Models of Consumer Buying Behaviour: A Descriptive Study. 11 February 2022. Available online: https://ssrn.com/abstract=4205489 (accessed on 3 January 2025).
Figure 1. Research framework and process of examining urban agriculture’s impact on mental health.
Sustainability 17 02875 g001
Figure 2. Location map of the Research Site. (a) Map of the experimental site, (b) map of satellite aerial images for this test site.
Sustainability 17 02875 g002
Figure 3. Current status of the experimental site and instrument setup diagram. (a) experimental equipment used in this study, (b) status of the experimental site.
Sustainability 17 02875 g003aSustainability 17 02875 g003b
Figure 4. Wind rose diagram of the experimental site for autumn and winter.
Sustainability 17 02875 g004
Figure 5. Wind rose diagram of the experimental site for summer.
Sustainability 17 02875 g005
Figure 6. Atmospheric temperature variation line chart: autumn and winter.
Sustainability 17 02875 g006
Figure 7. Atmospheric temperature variation line chart for summer.
Sustainability 17 02875 g007
Figure 8. Atmospheric and surface temperature variation line chart for autumn and winter.
Sustainability 17 02875 g008
Figure 9. Atmospheric and surface temperature variation line chart for summer.
Sustainability 17 02875 g009
Figure 10. Relative humidity variation line chart for autumn and winter.
Sustainability 17 02875 g010
Figure 11. Relative humidity variation line chart for summer.
Sustainability 17 02875 g011
Table 1. Specifications and functions of experimental equipment.
EquipmentFunction Description
Data Logger (ZL6)Integrates and records all sensor data, serving as the central hub for research data collection.
Temperature and Humidity Sensor (VP-4)Accurately monitors variations in air temperature and humidity, reflecting the microclimatic characteristics of the study site.
Solar Radiation Sensor (PYR Solar Radiation)Measures solar radiation levels, providing critical data on energy exchange.
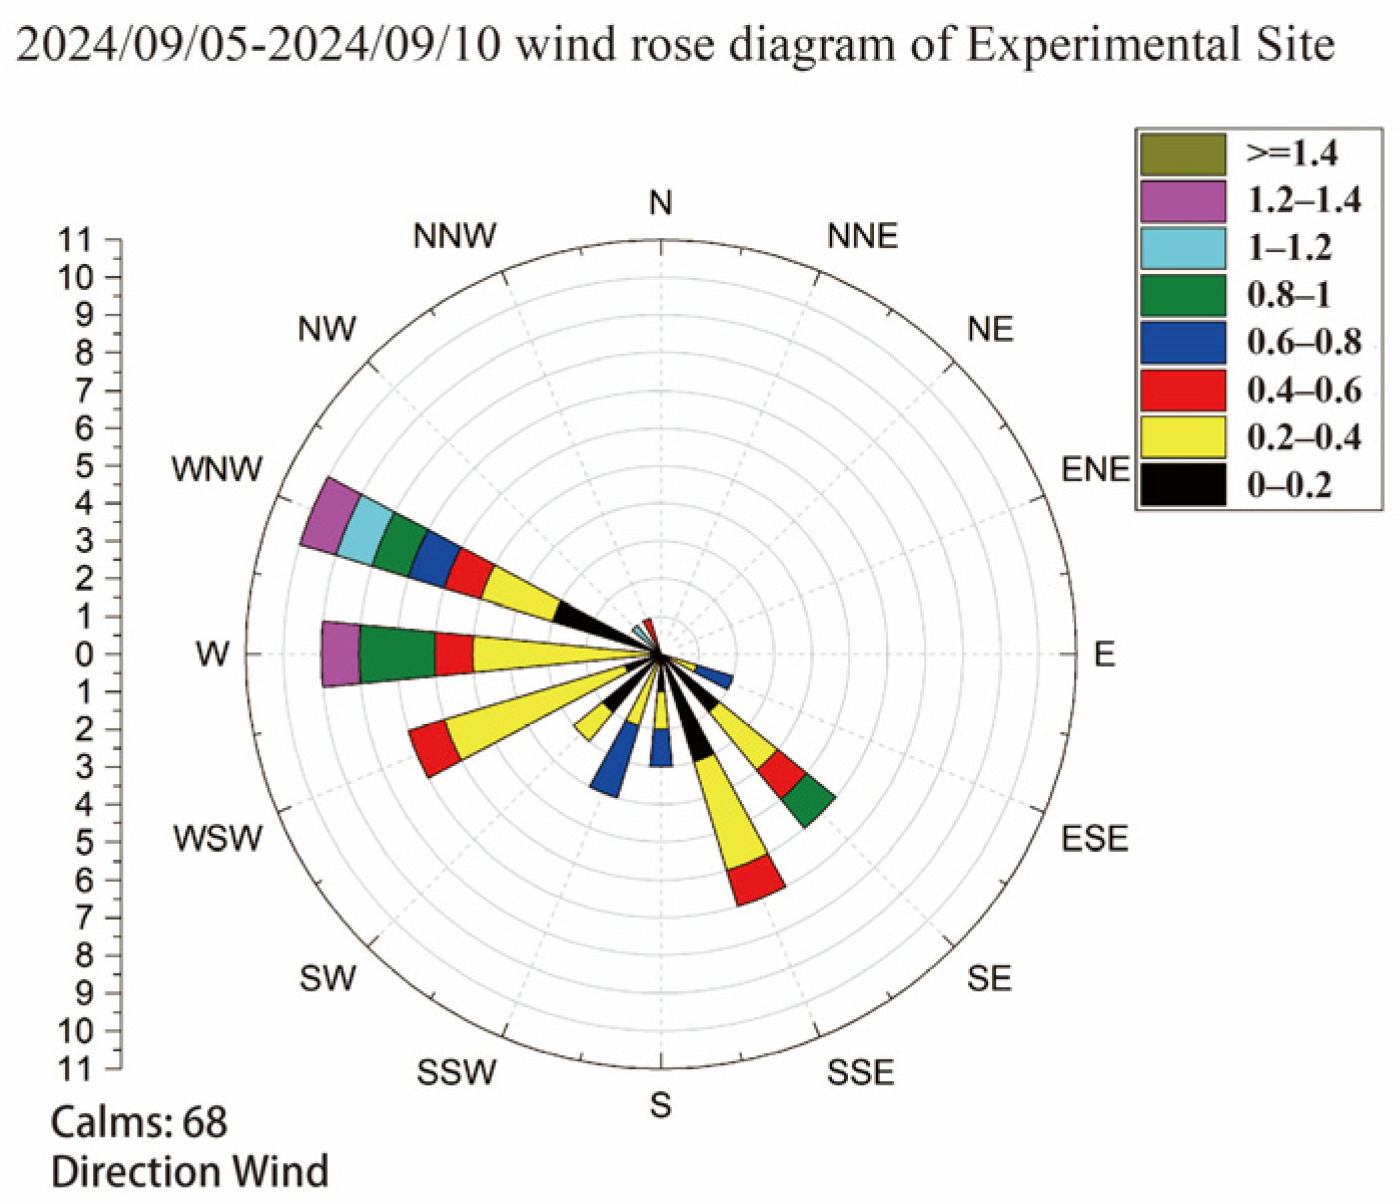
Wind Speed and Direction Sensor (Davis Cup)Captures wind dynamics, offering insights into the ventilation conditions of the study site.
Surface Temperature Sensor (RT-1)Records surface temperature fluctuations, assessing the impact on the local microclimate.
Table 2. Statistical analysis of environmental parameters.
Environmental ParameterSeasonMean
(°C)
Standard Deviation (SD) (°C)Coefficient of Variation (CV, %)Min
(°C)
Max
(°C)
Atmospheric Temperature (°C)Autumn/Winter25.24.517.918.631.9
Atmospheric Temperature (°C)Summer30.34.213.924.736.0
Pavement Surface Temperature (°C)Autumn/Winter34.69.828.317.850.1
Pavement Surface Temperature (°C)Summer40.411.327.924.356.5
Soil Surface Temperature (°C)Autumn/Winter22.83.113.618.026.1
Soil Surface Temperature (°C)Summer28.34.014.124.532.5
Relative Humidity (%)Autumn/Winter65.210.315.84981
Relative Humidity (%)Summer70.413.218.85190
Table 3. Correlation and regression model analysis of environmental parameters.
Variable RelationshipCorrelation Coefficient (r)Result Analysis
Atmospheric Temperature and Pavement Surface Temperature0.85Highly correlated. The cement pavement absorbs solar radiation, which directly influences atmospheric temperature.
Soil Surface Temperature and Atmospheric Temperature0.62The soil has a regulating effect, reducing the influence of atmospheric temperature.
Relative Humidity and Atmospheric Temperature−0.78Negative correlation. As temperature rises, humidity typically decreases, as is consistent with the urban heat island effect.
Table 4. Thermal comfort evaluation results.
SeasonThermal Comfort ResultHuman Perception
Autumn/Winter−0.4Slightly cool, and the human body feels comfortable.
Summer1.3Warm, but still within an acceptable range, indicating that green spaces provide some improvement to the thermal environment.
Table 5. Urban heat island effect mitigation analysis results for the Urban Food Forest.
AreaMaximum Temperature (°C)Cooling Effect (°C)
Taichung Urban Area38.2-
Project Site36.02.2
Table 6. Survey results and analysis of the mental health of middle-aged and older adult participants.
GroupSample Size (n)Average GDS ScoreStandard Deviation (SD)Minimum (Min)Maximum (Max)
Male Participants405.81.93.29.2
Female Participants605.01.62.88.0
No Weekly Participation508.02.53.513.0
1–2 Times Weekly Participation416.51.83.89.5
3–4 Times Weekly Participation325.21.53.08.5
5 or More Times Weekly Participation314.51.22.87.2
Table 7. Independent-samples t-test analysis of male vs. female participants.
Comparisont-Valuep-ValueConclusion
Male vs. Female2.450.017Significant difference, males scored higher than females.
Table 8. Descriptive statistics of mental health scores by participation frequency group.
Weekly Participation FrequencySample Size (n)Mean GDS ScoreStandard Deviation (SD)
0 times508.02.5
1–2 times416.51.8
3–4 times325.21.5
5 times or more314.51.2
Table 9. One-way ANOVA results.
IndicatorResult
F-Value14.85
p-Value<0.001
ConclusionSignificant difference
Table 10. Tukey test results.
Significant Difference Groupsp-Value
0 times vs. 5 times or more<0.001
0 times vs. 3–4 times0.002
1–2 times vs. 5 times or more0.018
Table 11. Non-participant observation results and descriptions.
Observation ItemDescriptionData Support
Participant Behavior and InteractionPrimarily, interactions among acquaintances, with less communication among strangers. Most interactions are low-key, occasional anxiety is observed.In total, 62% of interactions occurred among acquaintances, and 30% of participants exhibited anxious or uneasy behaviors.
Mental Health StatusSome participants showed signs of anxiety or stress, particularly the elderly, exhibiting mood swings or low moods.In total, 22% of participants showed anxiety, and 35% of the elderly showed signs of low mood or anxiety.
Dining FrequencyDining activities were frequent, especially on weekends; participants usually dined in small groups.Here, 70% of participants dined, 50% in small groups, with dining times ranging from 45 min to 1 h.
Facial ExpressionsMost participants displayed smiles or slightly bored expressions during conversations.In total, 58% of participants displayed smiles or relaxed expressions, 30% showed bored or uninterested expressions.
Activity PatternShopping and socializing were the main activities, few stayed in the dining area, and time spent browsing products was longer.In total, 60% of time was spent on product selection, 30% on socializing, and 10% in the dining area.
Time AllocationMost time was spent on product selection and social activities, with dining times typically being longer.On average, each participant stayed in the market for 90 min, with 20% of the time spent on socializing or dining.
Disclaimer/Publisher’s Note: The statements, opinions and data contained in all publications are solely those of the individual author(s) and contributor(s) and not of MDPI and/or the editor(s). MDPI and/or the editor(s) disclaim responsibility for any injury to people or property resulting from any ideas, methods, instructions or products referred to in the content.

