Article

Defining CO2 Geological Storage Capacity in Unmineable Coal Seams Through Adsorption Data in 3D: Case Study of the Chico Lomã Deposit, Southern Brazil

by
Saulo B. de Oliveira
1,*,
Haline V. Rocha
2,
Cristina F. A. Rodrigues
3,4,5,
Manuel J. Lemos de Sousa
3,4,5 and
Colombo C. G. Tassinari
2
1
Instituto de Geociências, Universidade de São Paulo, São Paulo 05508-080, SP, Brazil
2
Instituto de Energia e Ambiente, Universidade de São Paulo, São Paulo 05508-900, SP, Brazil
3
Faculdade de Ciência e Tecnologia, Fundação/Universidade Fernando Pessoa, Praça de 9 de Abril, 349, 4249-004 Porto, Portugal
4
MARE–Centro de Ciência do Mar e Ambient, URI Coimbra, 3004-517 Coimbra, Portugal
5
Academia das Ciências de Lisboa, 19, 1200-168 Lisboa, Portugal
*
Author to whom correspondence should be addressed.
Sustainability 2025, 17(7), 2856; https://doi.org/10.3390/su17072856
Submission received: 3 February 2025 / Revised: 8 March 2025 / Accepted: 17 March 2025 / Published: 24 March 2025
(This article belongs to the Section Energy Sustainability)

Abstract

:
The concentration of greenhouse gases in the atmosphere has led to irreversible climate changes, emphasizing the need for effective strategies to mitigate emissions. Carbon capture, utilization, and storage (CCUS) technologies, including geological CO2 storage, have gained recognition worldwide due to their potential for CO2 emissions abatement. Among potential geological reservoirs, coal seams are significant due to their efficiency in securing CO2 storage, through their adsorption storage capacity. This study presents an innovative methodology for estimating the theoretical CO2 storage capacity in unmineable coal seams, focusing on the Chico Lomã deposit in southern Brazil. The methodology integrates a comprehensive drillhole database and adsorption isotherm data to define the coal reservoir zone and calculate its CO2 storage capacity. The results indicate a total theoretical CO2 storage capacity of 47.8 Gt in the Chico Lomã deposit, with the potential to mitigate emissions from local thermoelectric plants for over 500 years. The study encourages the application of the proposed methodology to assess CO2 storage capacity in other unmineable coal deposits worldwide.

1. Introduction

The concentration of greenhouse gases in the atmosphere has undergone an increase, leading to irreversible climate changes [1]. Carbon capture, utilization, and storage (CCUS) technologies, including CO2 geological storage, have been widely acknowledged as effective strategies for greenhouse gas emission mitigation [2,3,4]. About 80% of long-term low-emission development strategies submitted to the United Nations Framework Convention on Climate Change (UNFCCC) recognize the importance of CCUS technologies. According to the IEA Roadmap to Net Zero by 2050, CCUS is projected to reach an abatement capacity of 7.6 Gt (billion metric tons) of CO2 per year by 2050 [4]. Global coal burning in 2022 resulted in the emission of 15.22 Gt (billion metric tons) of CO2, representing a 1.6% rise from the previous year [5]. Among the different options for CO2 geological reservoirs, coal seams should play a major role in CCUS technologies, due to their high CO2 storage capacity, as well as high efficiency in ensuring permanent and secure CO2 geological storage [6]. Both the CO2 storage capacity and efficiency of traps within coal seams are closely related to the inherent characteristics of coal. The CO2 is mainly stored in the internal pore surfaces of the organic particles in a condensed form that is very close to a liquid state. This enables the storage of a CO2 volume that significantly exceeds the pore volume capacity [6]. The efficiency of the trap is enhanced by the high organic matter content of coal (more than 50% by weight) (ISO 11760 2005 [7]), as CO2 has a high adsorption affinity for organic matter and can therefore be safely stored in a coal seam.
There are currently three coal power plants fitted with CCUS in operation in the world as follows: the Boundary Dam in Canada, and the Jinjie Power and Taizhou Power stations in China. The Taizhou project recently began operating in June 2023 and has a significant capacity to capture approximately 550,000 metric tons of CO2 per year [8]. Other industrial sectors with CO2 emissions eligible for carbon capture deployment are the iron and steel industry, cement industry, chemicals, refineries, and pulp and paper [9]. Coal is currently acknowledged as one of the best CO2 removal solutions, in the CCUS technologies portfolio, for achieving CO2 neutrality by 2050. However, other studies using coal, such as the traditional oil production system by direct coal liquefaction technology, are currently being replaced by a carbon-neutral technology-based direct coal liquefaction system coupled with green hydrogen, green electricity, or CCUS technologies [10].
CCUS presents significant potential for reducing CO2 emissions in Brazil, especially due to the increased use of fossil fuels [11,12]. The implementation of CCUS in Brazil is essential, but other solutions are also needed, such as changes in land use and the agricultural sector [13]. However, public acceptance is hindered by the limited information about the technology, and Brazil lacks a robust regulatory framework, putting it at a disadvantage compared to countries like the U.S. and Canada [13]. Brazil may probably only achieve capturing up to 40 million tons of CO2 annually by 2050, with a high investment requirement of around USD 58 billion for capturing 190 million tons per year [13]. The successful adoption of CCUS depends on significant investments in research, creating a clear regulatory framework, and fostering international collaboration and public engagement to ensure the technology’s implementation [11,12,13,14].
Studies considering geological storage of CO2 in the Paraná Basin, Brazil, were conducted focusing on the black shales of the Irati Formation [15,16,17,18,19,20], as well as sandstone reservoirs [21,22,23], hydrocarbon reservoirs [24] and saline aquifers of the Rio Bonito Formation [25,26,27]. More specifically, the coal seams of the Rio Bonito Formation were also the subject of studies for underground CO2 storage [28,29,30,31] and on coal mining waste [32]. Few studies combining 3D geological modeling and CO2 storage capacity estimates were conducted in Brazil [16,17,33], although this approach has become more frequent in recent decades [34,35,36,37,38,39]. These few studies have the advantage of using 3D implicit modeling, which better represents geological surfaces [40,41,42]; however, they were applied to other types of CO2 reservoirs and have not been applied to coal seams. The current work is the first application of 3D implicit modeling in CO2 geological storage in coal deposits in Brazil.
The main methodologies for calculating CO2 storage capacity in coal [43,44,45,46,47,48,49] initially determine the volume and then apply an adsorption parameter. This work proposes that the adsorption data be used first to determine the volume, and consequently, the CO2 storage capacity. This approach has advantages, especially when applied at the Site Selection and Initial Characterization stages of the Exploration Phase [46].
Thus, our research introduces an innovative methodology for calculating the theoretical CO2 storage capacity in unmineable coal seams using the most modern 3D implicit modeling techniques together with analytical adsorption isotherm data. The new methodology introduced here already employs isotherm data to initially define the volume in 3D, thereby ensuring the minimum and maximum CO2 adsorption values for calculating storage capacity.

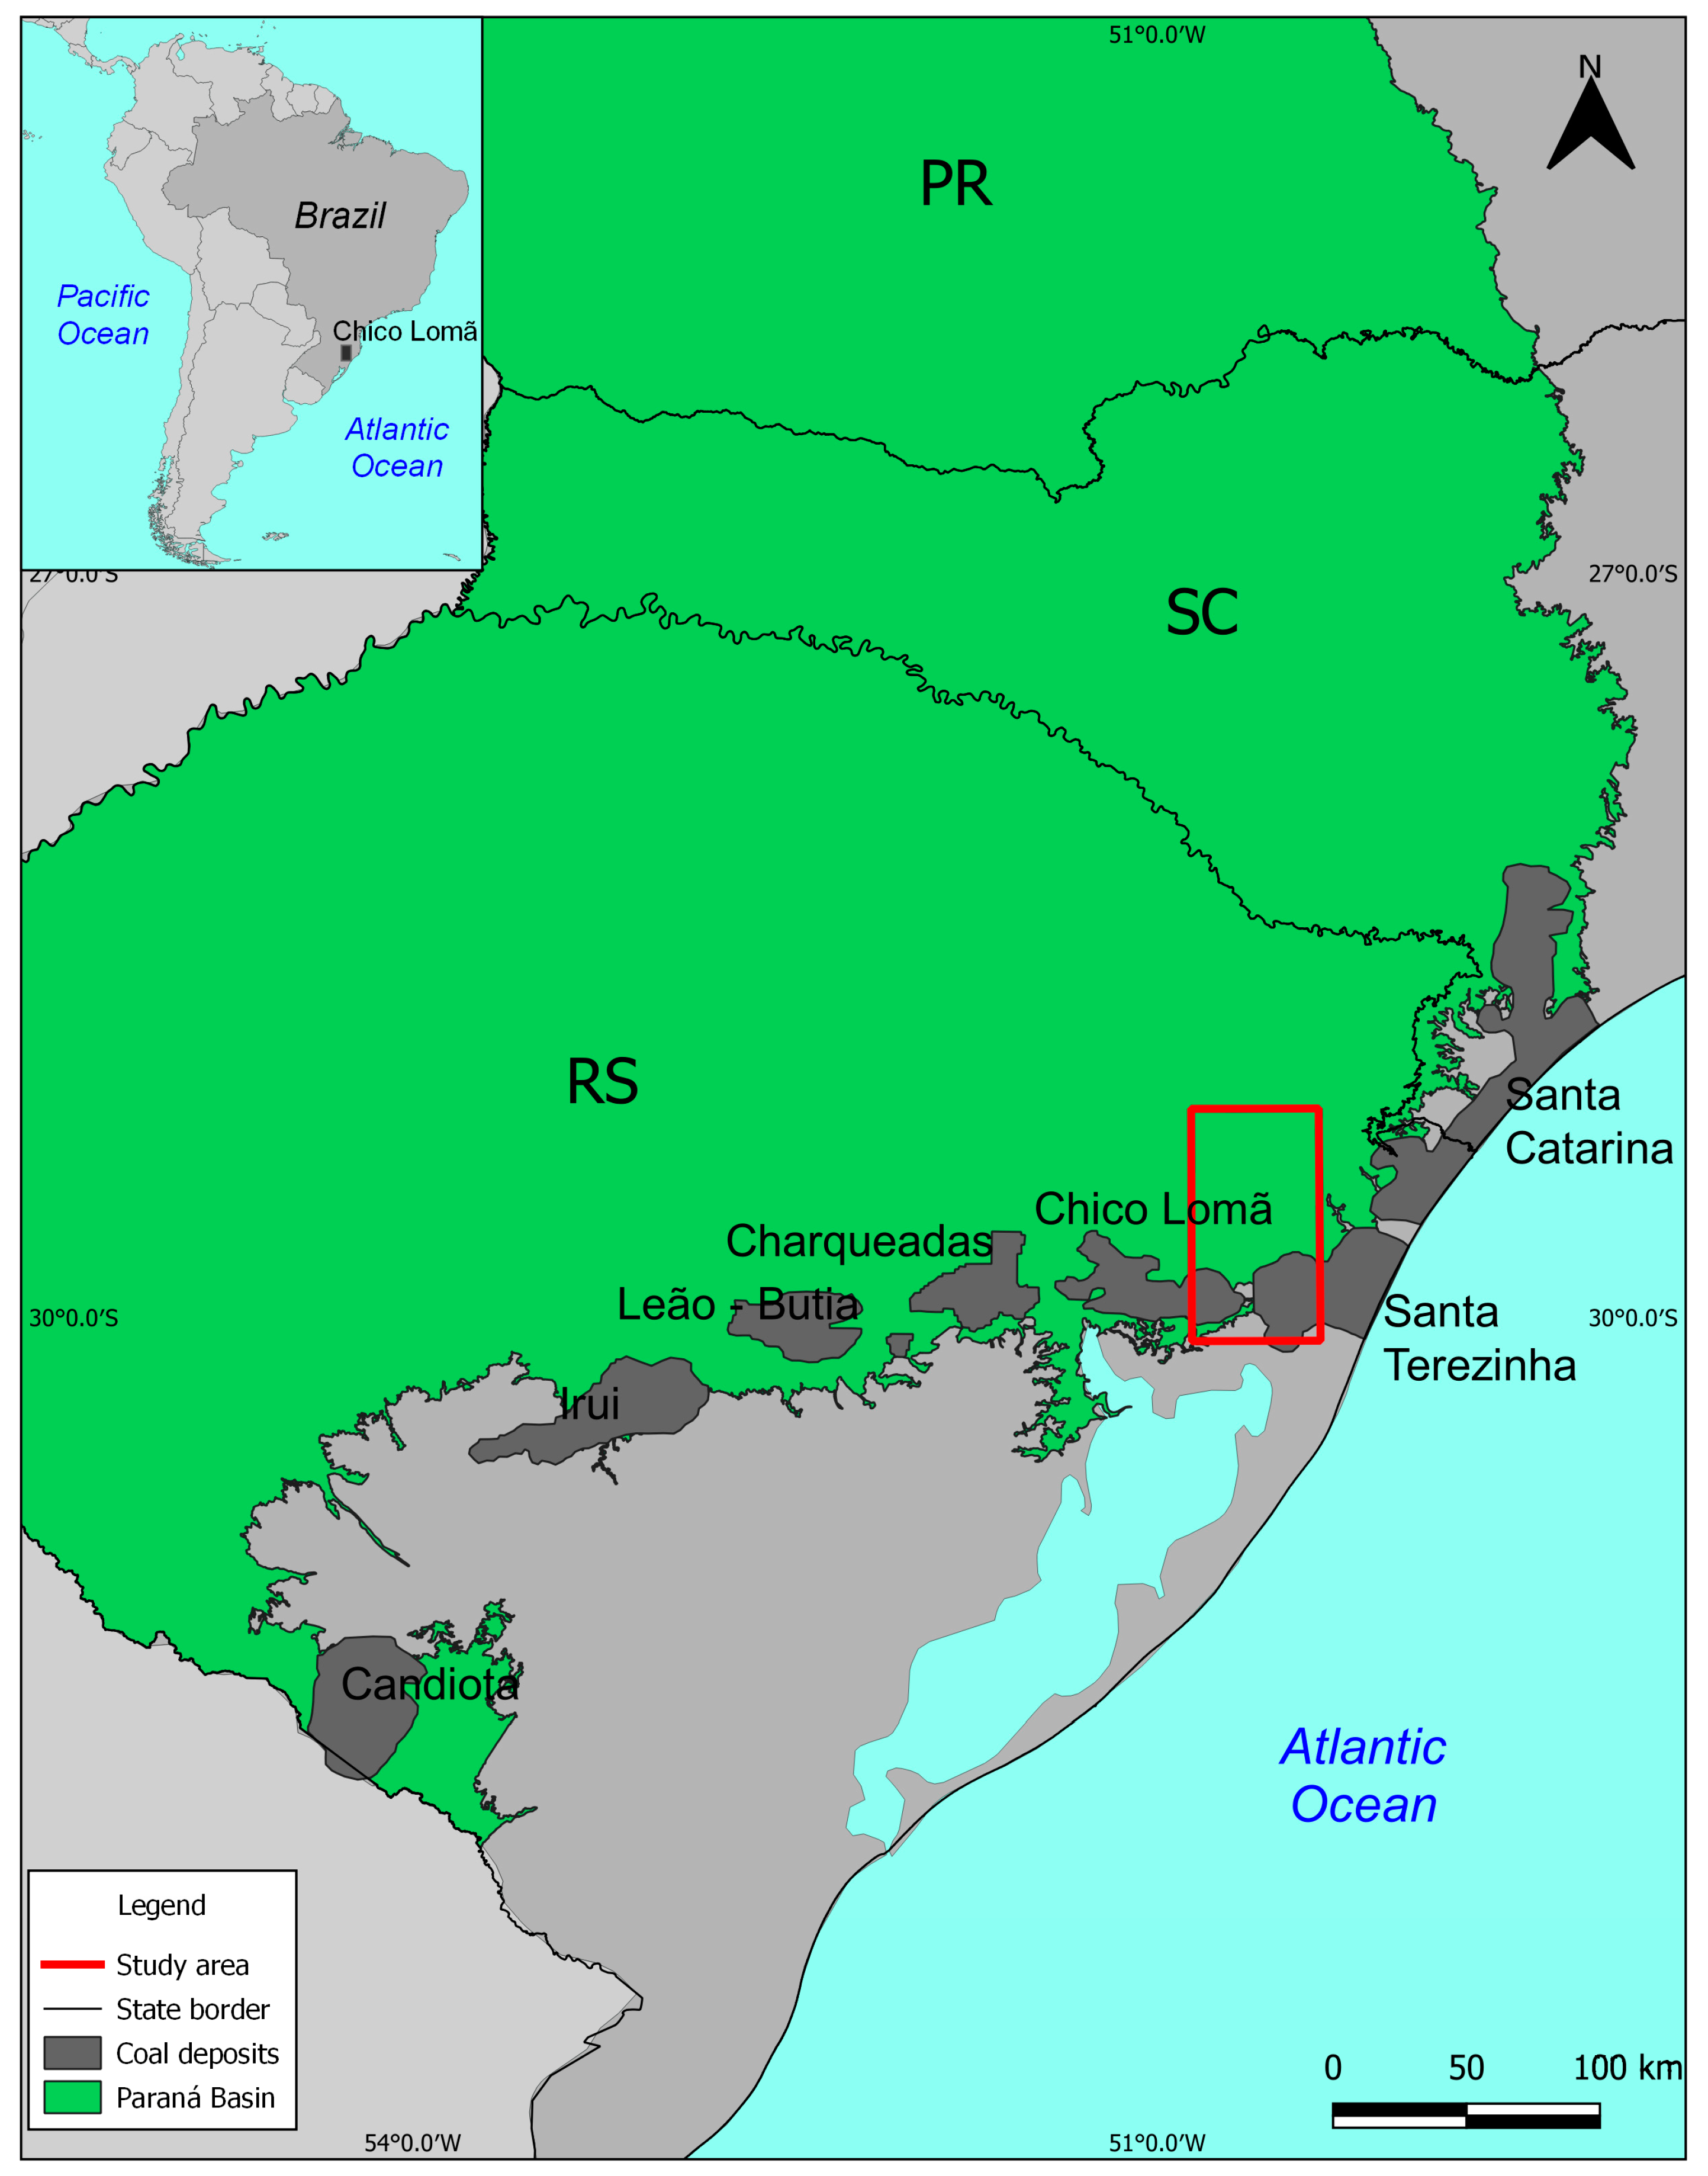
2. Geological Setting

2.1. Rio Bonito Formation

The Paraná Basin covers an extensive area exceeding 1,000,000 km2 in southern Brazil, comprising six depositional supersequences from Late Ordovician to Cretaceous as follows: Rio Ivaí, Paraná, Gondwana I, Gondwana II, Gondwana III, and Bauru [50,51]. The Chico Lomã coal seams are part of the Rio Bonito Formation, which compose the Sequence Gondwana I. The Rio Bonito Formation was deposited over sedimentary layers of the Itararé Group and is part of the Guatá Group and the Tubarão Supergroup. It extends across the following three Brazilian states: Rio Grande do Sul, Santa Catarina, and Paraná (Figure 1). The Rio Bonito Formation is subdivided into three members, which are, from bottom to top, as follows: (a) the Triunfo Member, consisting mainly of sandstone and conglomerate, with subordinate shale and siltstone, mostly organic-rich, and coal layers; (b) the Paraguaçu Member, composed of shale, siltstone, and subordinate fine-grained sandstone; and (c) the Siderópolis Member, comprising sandstone, black shale, and coal layers [52]. In the state of Rio Grande do Sul, varied-textured sandstones, siltstones, and conglomerates have been essentially described, with carbonate breccia, carbonaceous shale, and coal (Figure 2), corresponding to the Rio Bonito Formation. In this region, there are about seven main coal deposits of greater importance (Figure 1), including the Chico Lomã deposit [53,54].
According to de Oliveira et al. [16], the Paraná Basin is a typical intra-plate region presenting a low level of seismic activity. Only five earthquakes with a magnitude above 5.0 (with two being of large magnitude: 6.3 and 6.8) have occurred in the studied region within the last 220 years, according to the bulletins of Centro de Sismologia da Universidade de São Paulo (USP), Brazil (http://moho.iag.usp.br/eq/bulletin, accessed on 20 June 2024) [56]. This scenario also indicates a favorable location for a CO2 reservoir according to IEA-GHG recommendations [57].

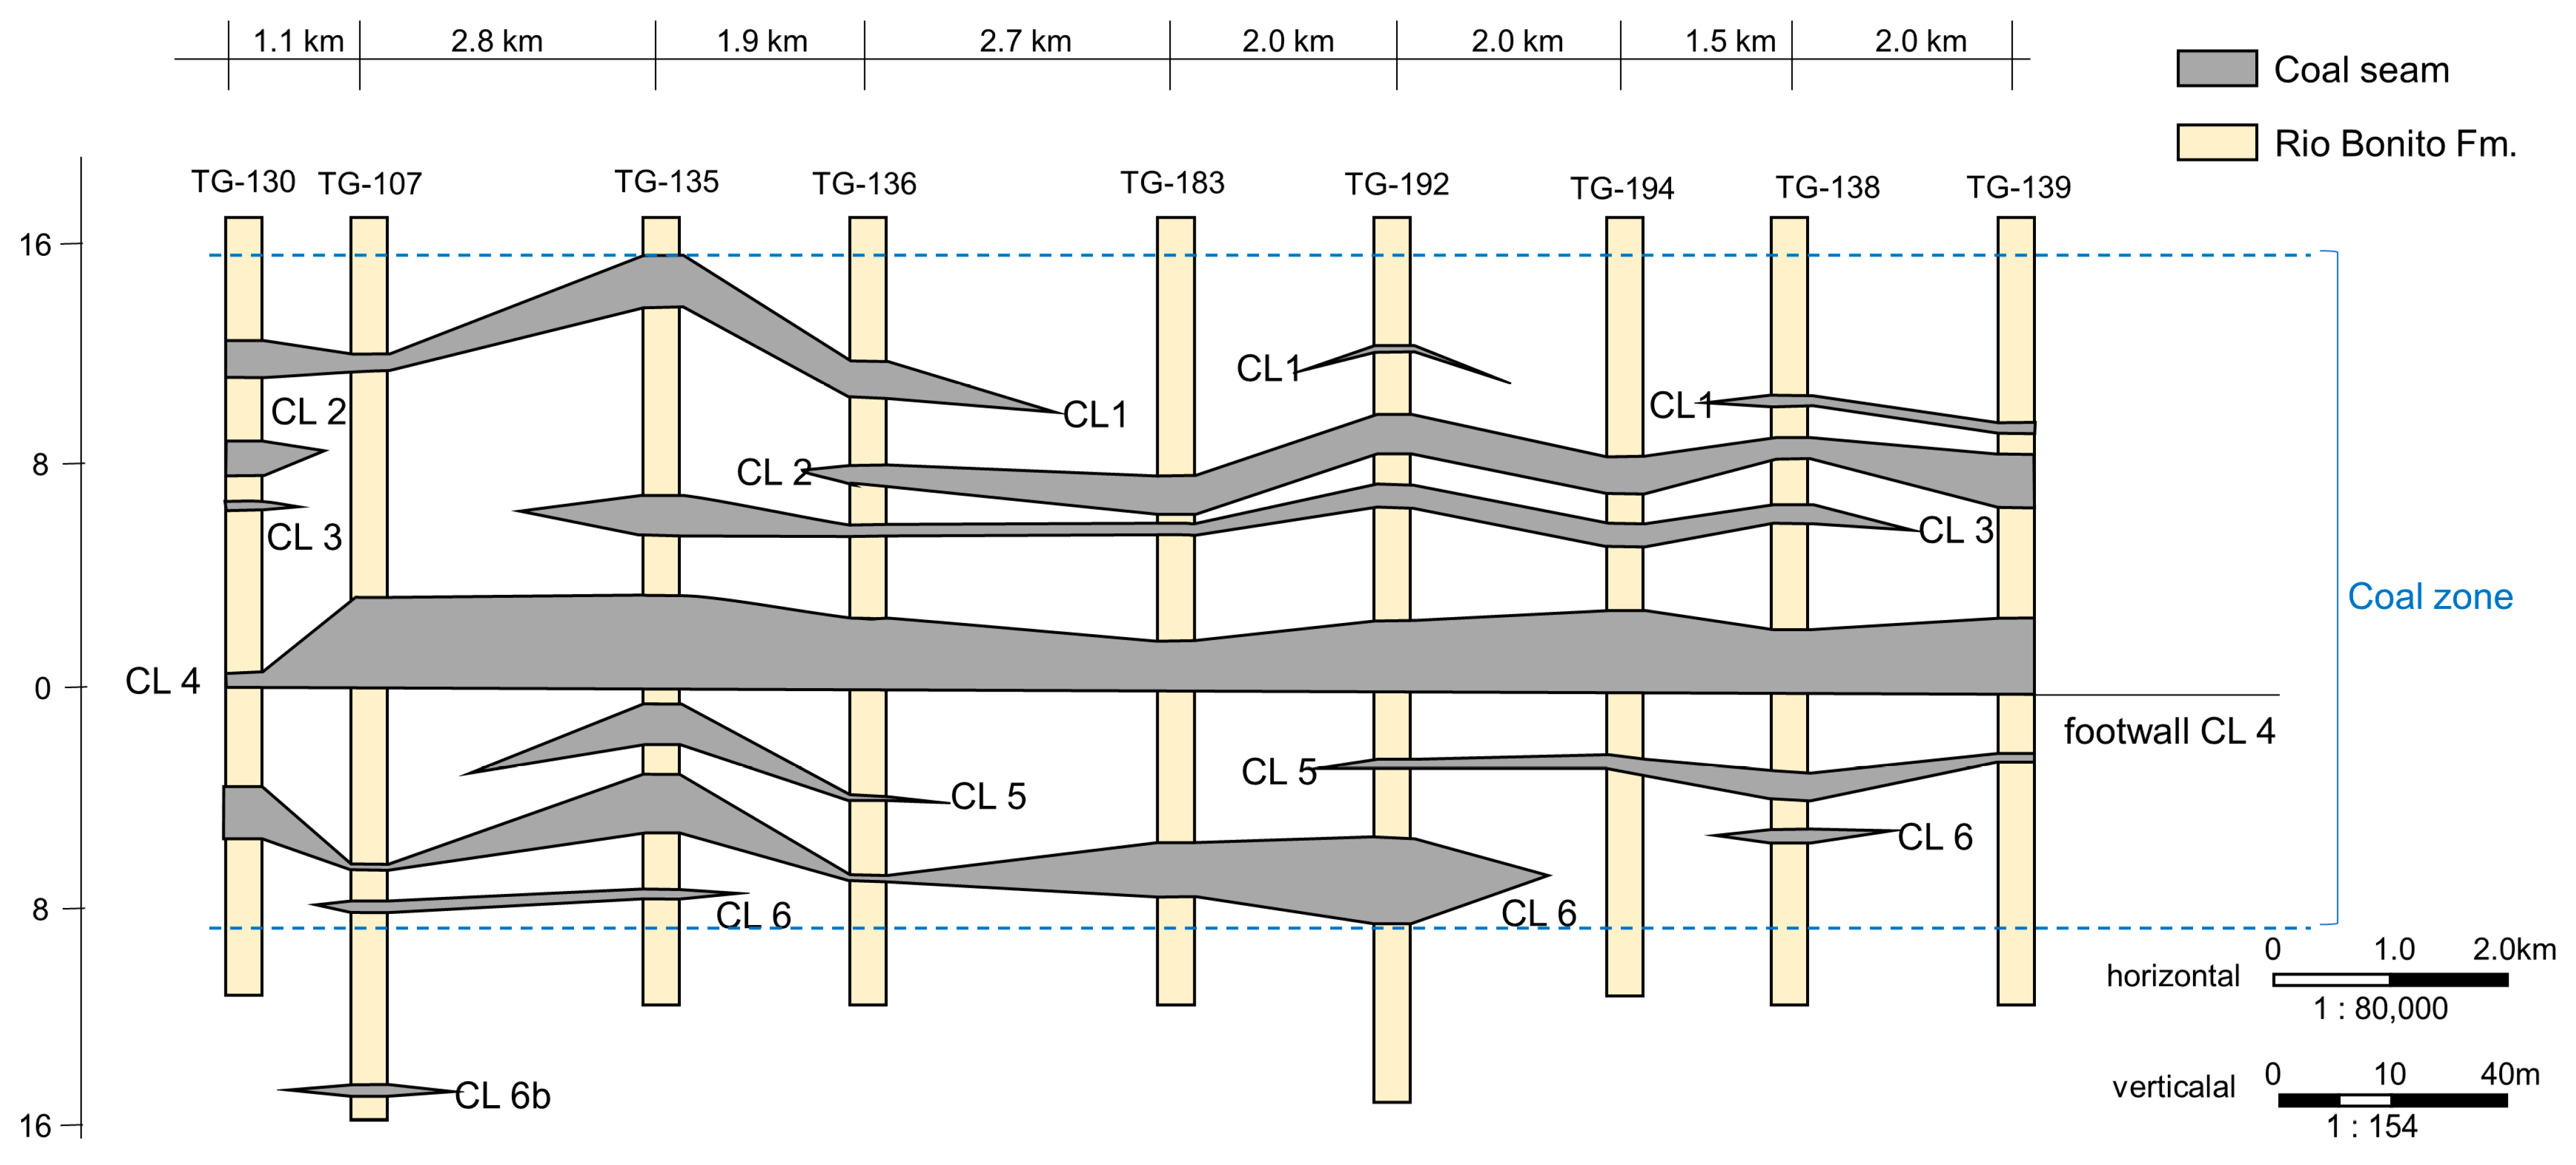
2.2. Chico Lomã Coal Deposit

The Chico Lomã is an unmined coal deposit located in the southern region of Brazil (Figure 1), whose resources were discovered and defined in the early 1970s and mid-1980s [54]. The deposit is generally formed by six coal layers, named from CL1 to CL6, from the stratigraphic top to bottom, hosted in the Rio Bonito Formation [58]. The main coal seam in terms of thickness and lateral continuity is CL4 (Figure 3). The coal seams at Chico Lomã dip eastward towards the contiguous Santa Terezinha deposit. In the southwestern portion of the deposit, the coal seams are found at depths of 50 m or less; in the central portion, the depths vary between 50 m and 300 m, in the north-central, southeastern, and northeastern parts, with depths equal to or greater than 300 m [54].
The Santa Terezinha deposit covers an area of approximately 1000 km2 and the coal layers of interest occur only at depth, with no outcropping. Coal layers in Santa Terezinha occur under a minimum sediment cover of 450 m, sometimes reaching depths of up to 1000 m. The main coal seam in the deposit is ST4. Despite the lack of continuity between the two deposits (Chico Lomã and Santa Terezinha), the layers of the Santa Terezinha deposit can be directly correlated to the Chico Lomã layers, e.g., CL4 = ST4 [54]. Both deposits show similar values for total carbon, ash, sulfur, and calorific values (Table 1) [59]. A study considering coalbed methane (CBM) in the Chico Lomã deposit has indicated an average value of 0.374 cm3 gas/g of coal [55].

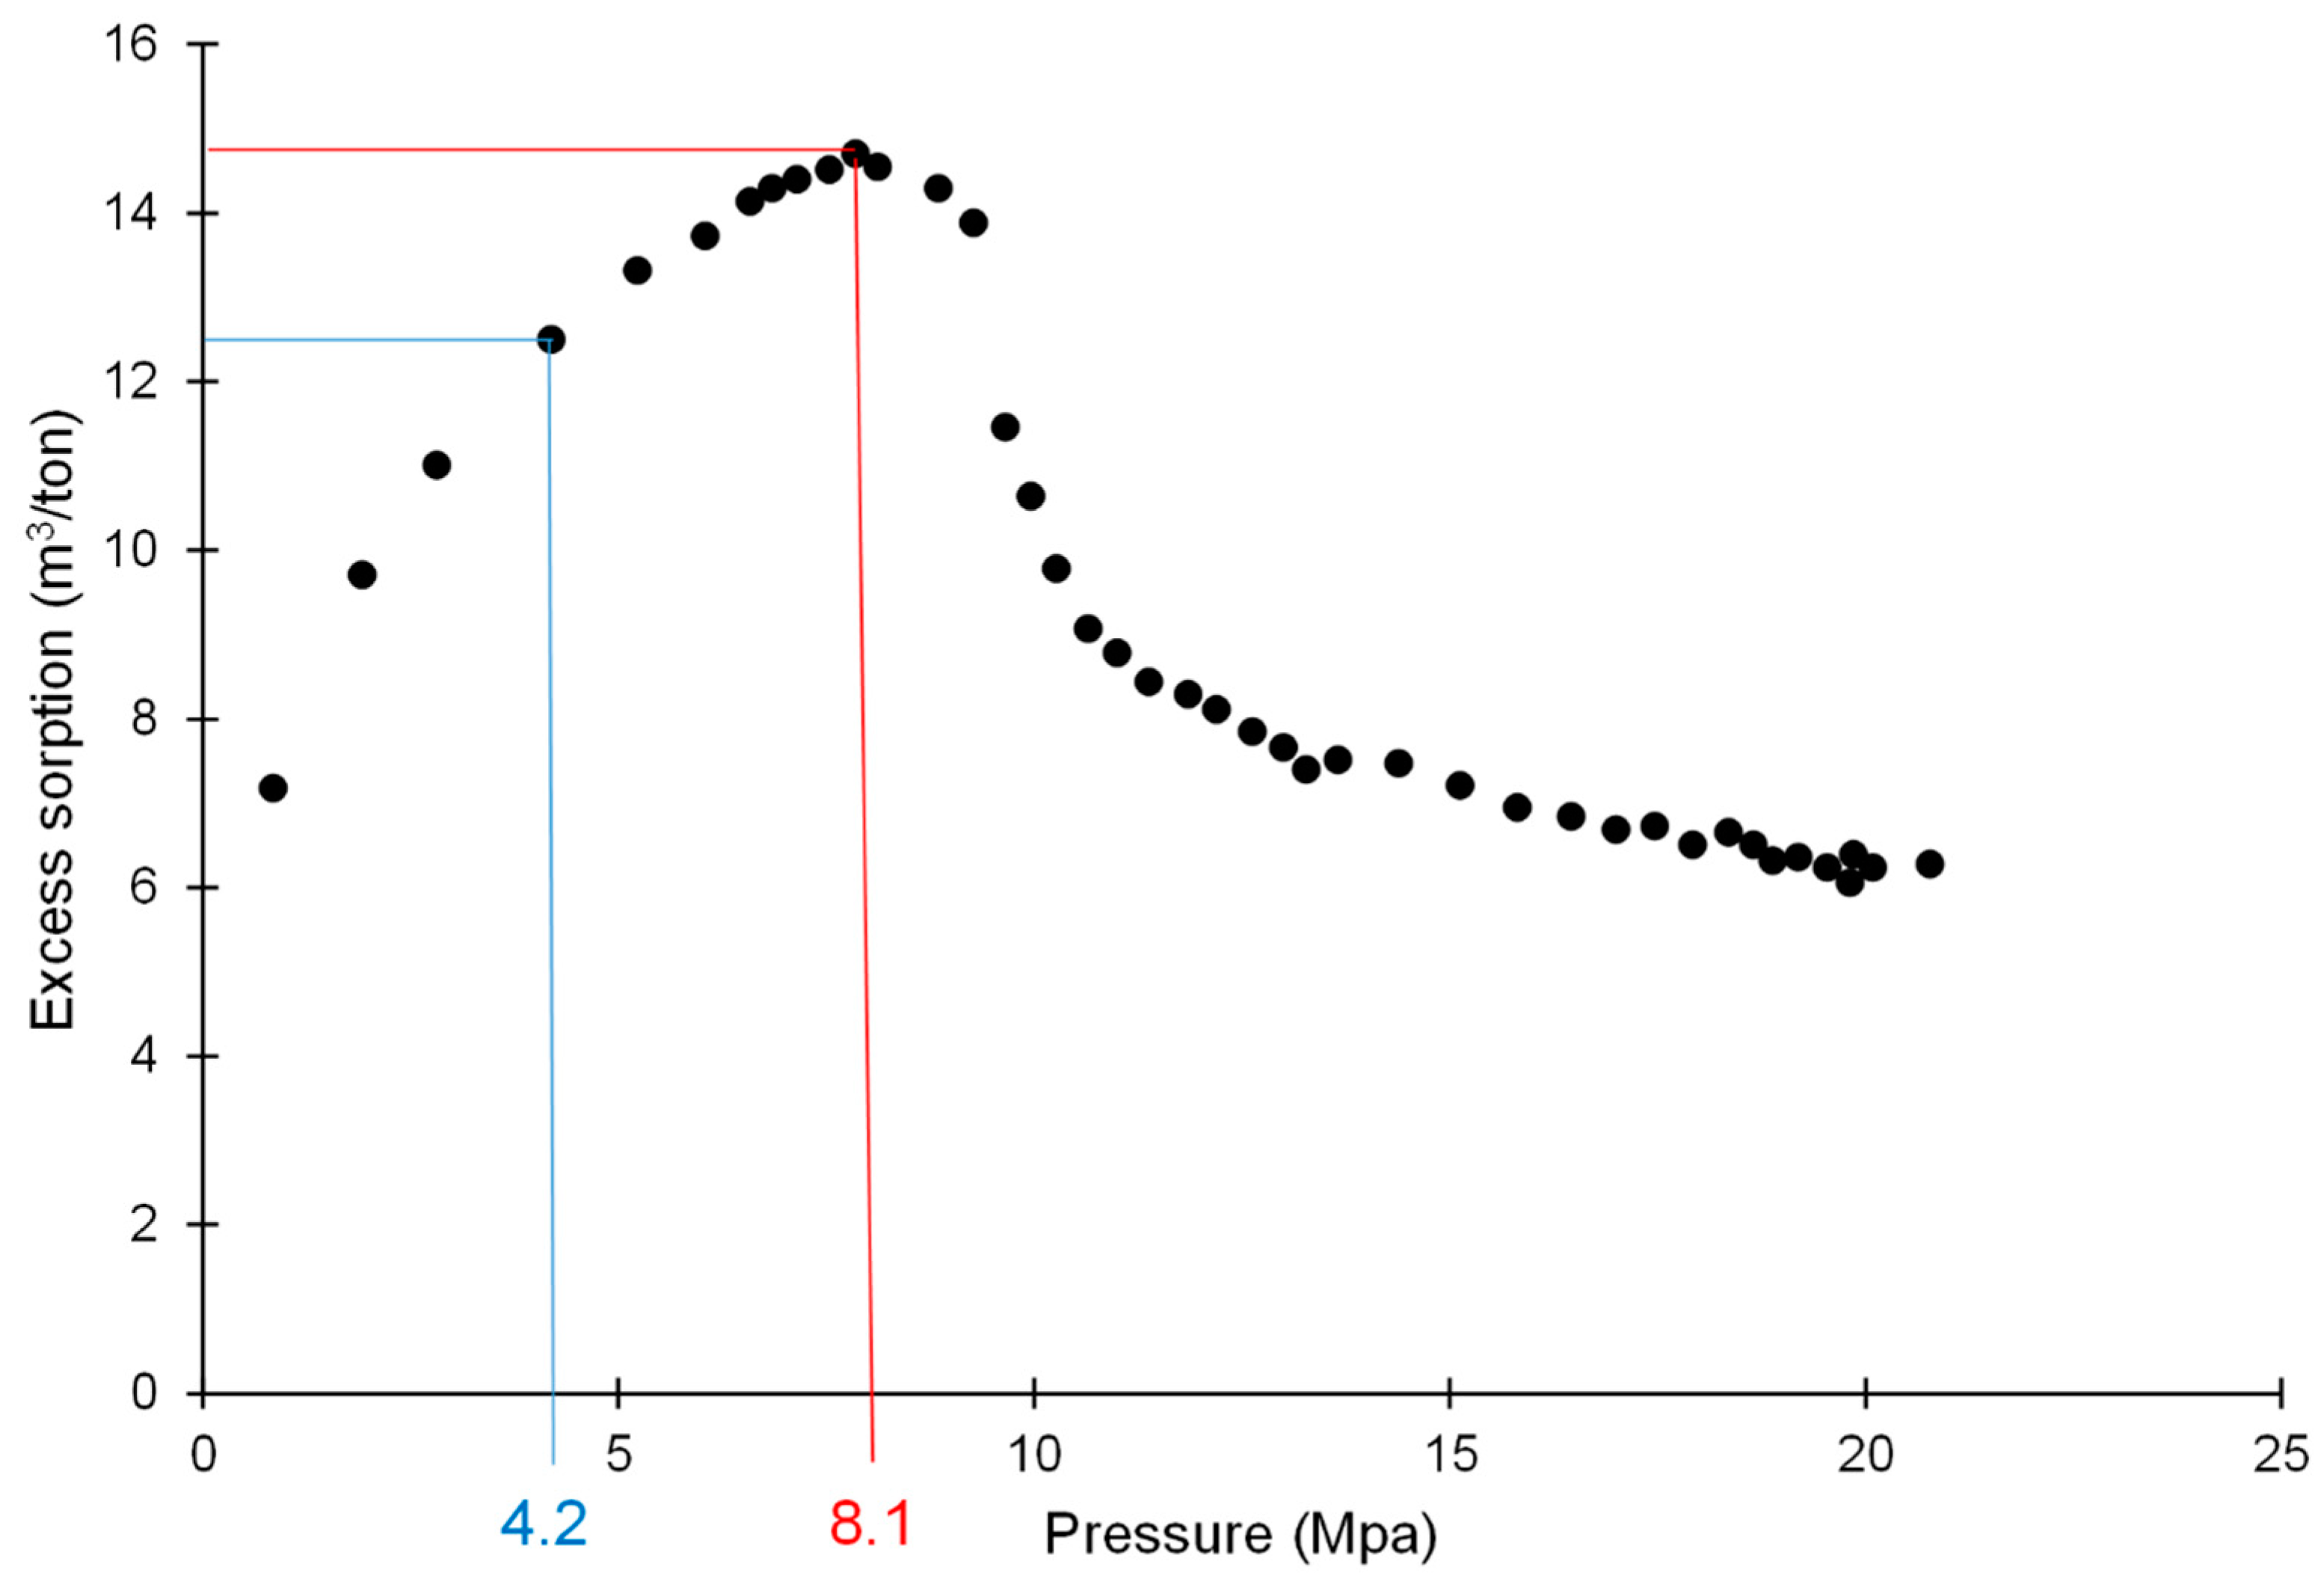
2.3. CO2 Adsorption in Coal Seams
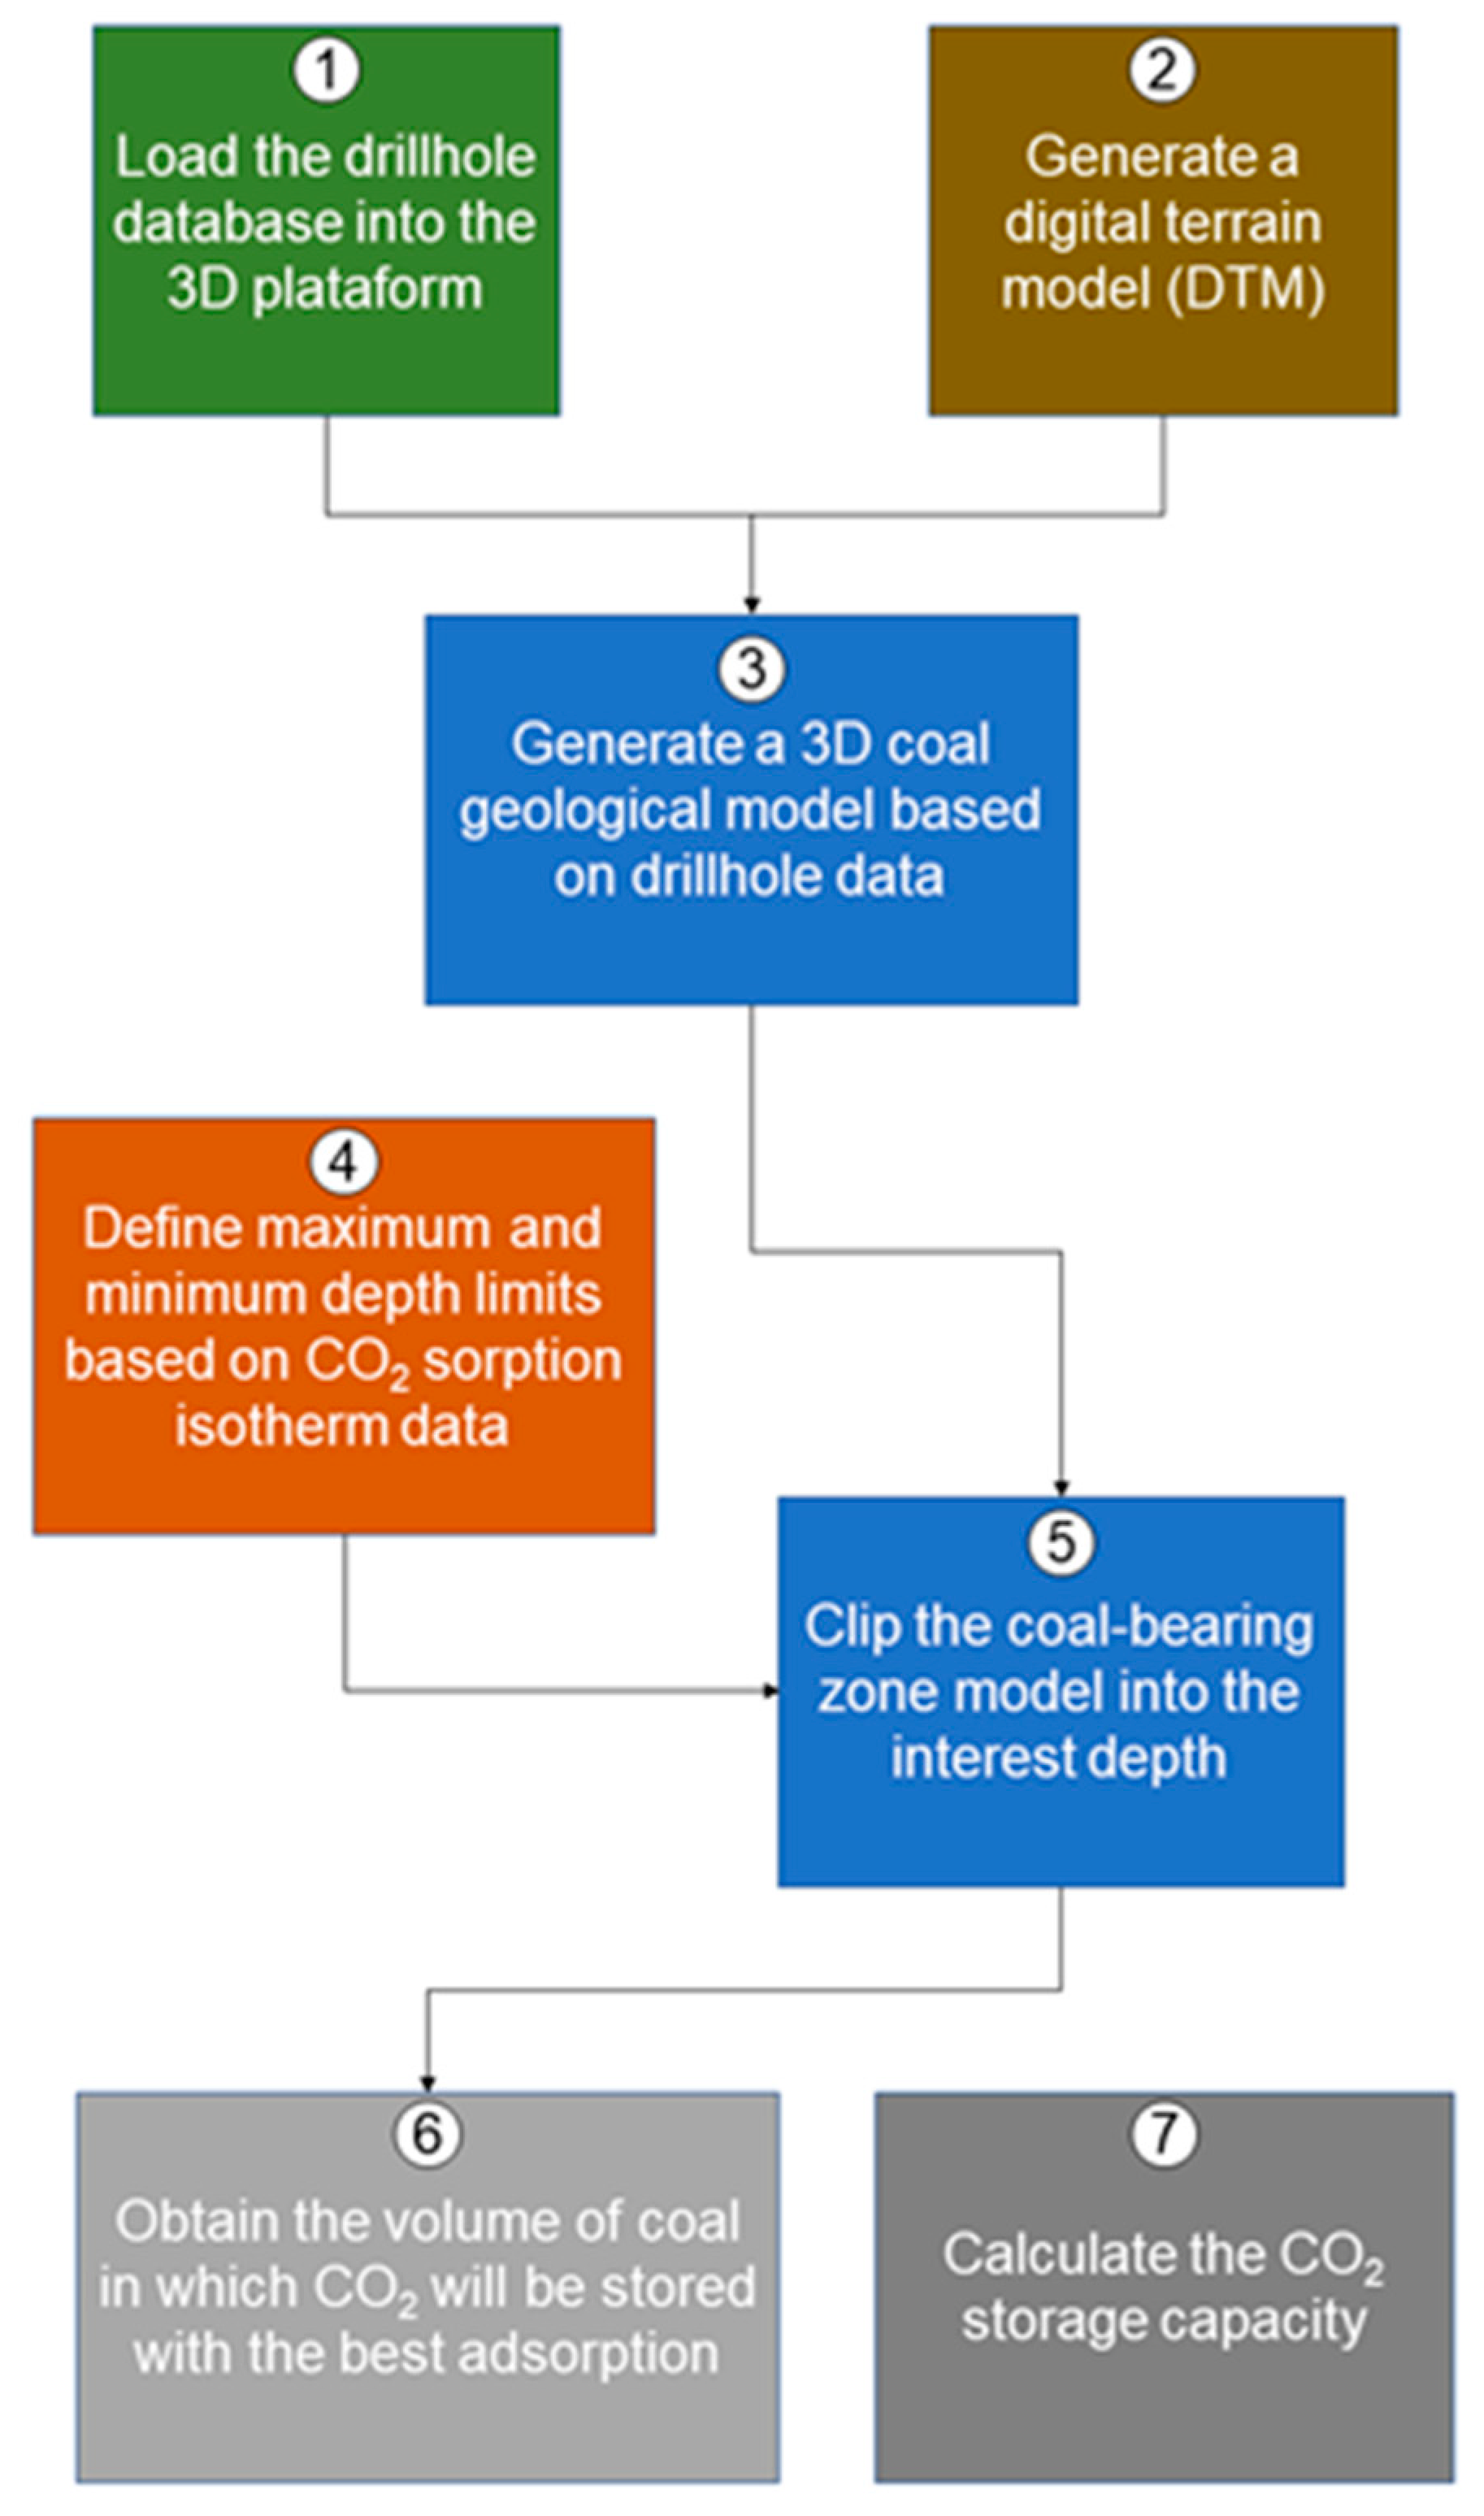
Potential reservoirs for CO2 geological storage vary between saline aquifers, salt caverns, or depleted hydrocarbon reservoirs to unmineable coalbeds and shale gas reservoirs [60,61]. The last two are classified as unconventional reservoirs due to their low permeability. In addition, both reservoirs are organic-rich and have different storage and gas flow properties compared to conventional reservoirs. Therefore, CO2 geological storage in unconventional organic-rich reservoirs, such as coal seams (≥50% organic content in weight), is driven by its organic microporous structure and inherent CO2 adsorption properties due to its high internal surface area and, consequently, high sorption capacities [6,62].
Furthermore, due to the high organic matter content present in coal seams, both trap and seal geological parameters do not play a significant role in the storage process, as CO2 entrapment is achieved through organic matter adsorption behavior [63,64], attributing the permanent and secure storage of CO2 to coal seams in the medium- to long-term.
The primary mechanism for CO2 storage in coal seams is adsorption, which differs from the mechanisms in other geologic reservoirs [49]. Thus, the main equations for calculating capacity, such as the CSL methodology [45], the DOE NETL methodology [46], and the in situ coalbed methane resource conversion method [47], are based on adsorption, usually obtained through the Langmuir isotherm. Some equations, as proposed by Van Bergen et al. [43], also consider the enhanced coalbed methane (ECBM) potential, which has been applied in the Santa Terezinha coal deposit [29]. Xu et al. [65] detached the neglected CO2 storage capacity of free gas and soluble gas with an increasing trend trough depth.
Depth limits for CO2 injection and storage in coal seams vary in each basin, depending on the geothermal and geo-pressure gradients [46]. However, some technical operational limits are indicated in the literature. For instance, in the case of considering enhanced coalbed methane recovery (ECBM) combined with CO2 injection, the increase in effective stress induces the cleat closure, reducing permeability to the extent that coalbed methane cannot be produced below 1500 m [60]. At greater depths, supercritical CO2 can cause swelling of the coal matrix, generating injectivity problems [66,67]. CO2 storage is also limited by compression costs, which rise significantly below 3300 m [46,68]. In the recent compilation from Wu et al. [69] of 23 pilot experiments and theoretical studies conducted worldwide on coal deposits, the depths range from 273 m to 1260 m.

3. Methodology

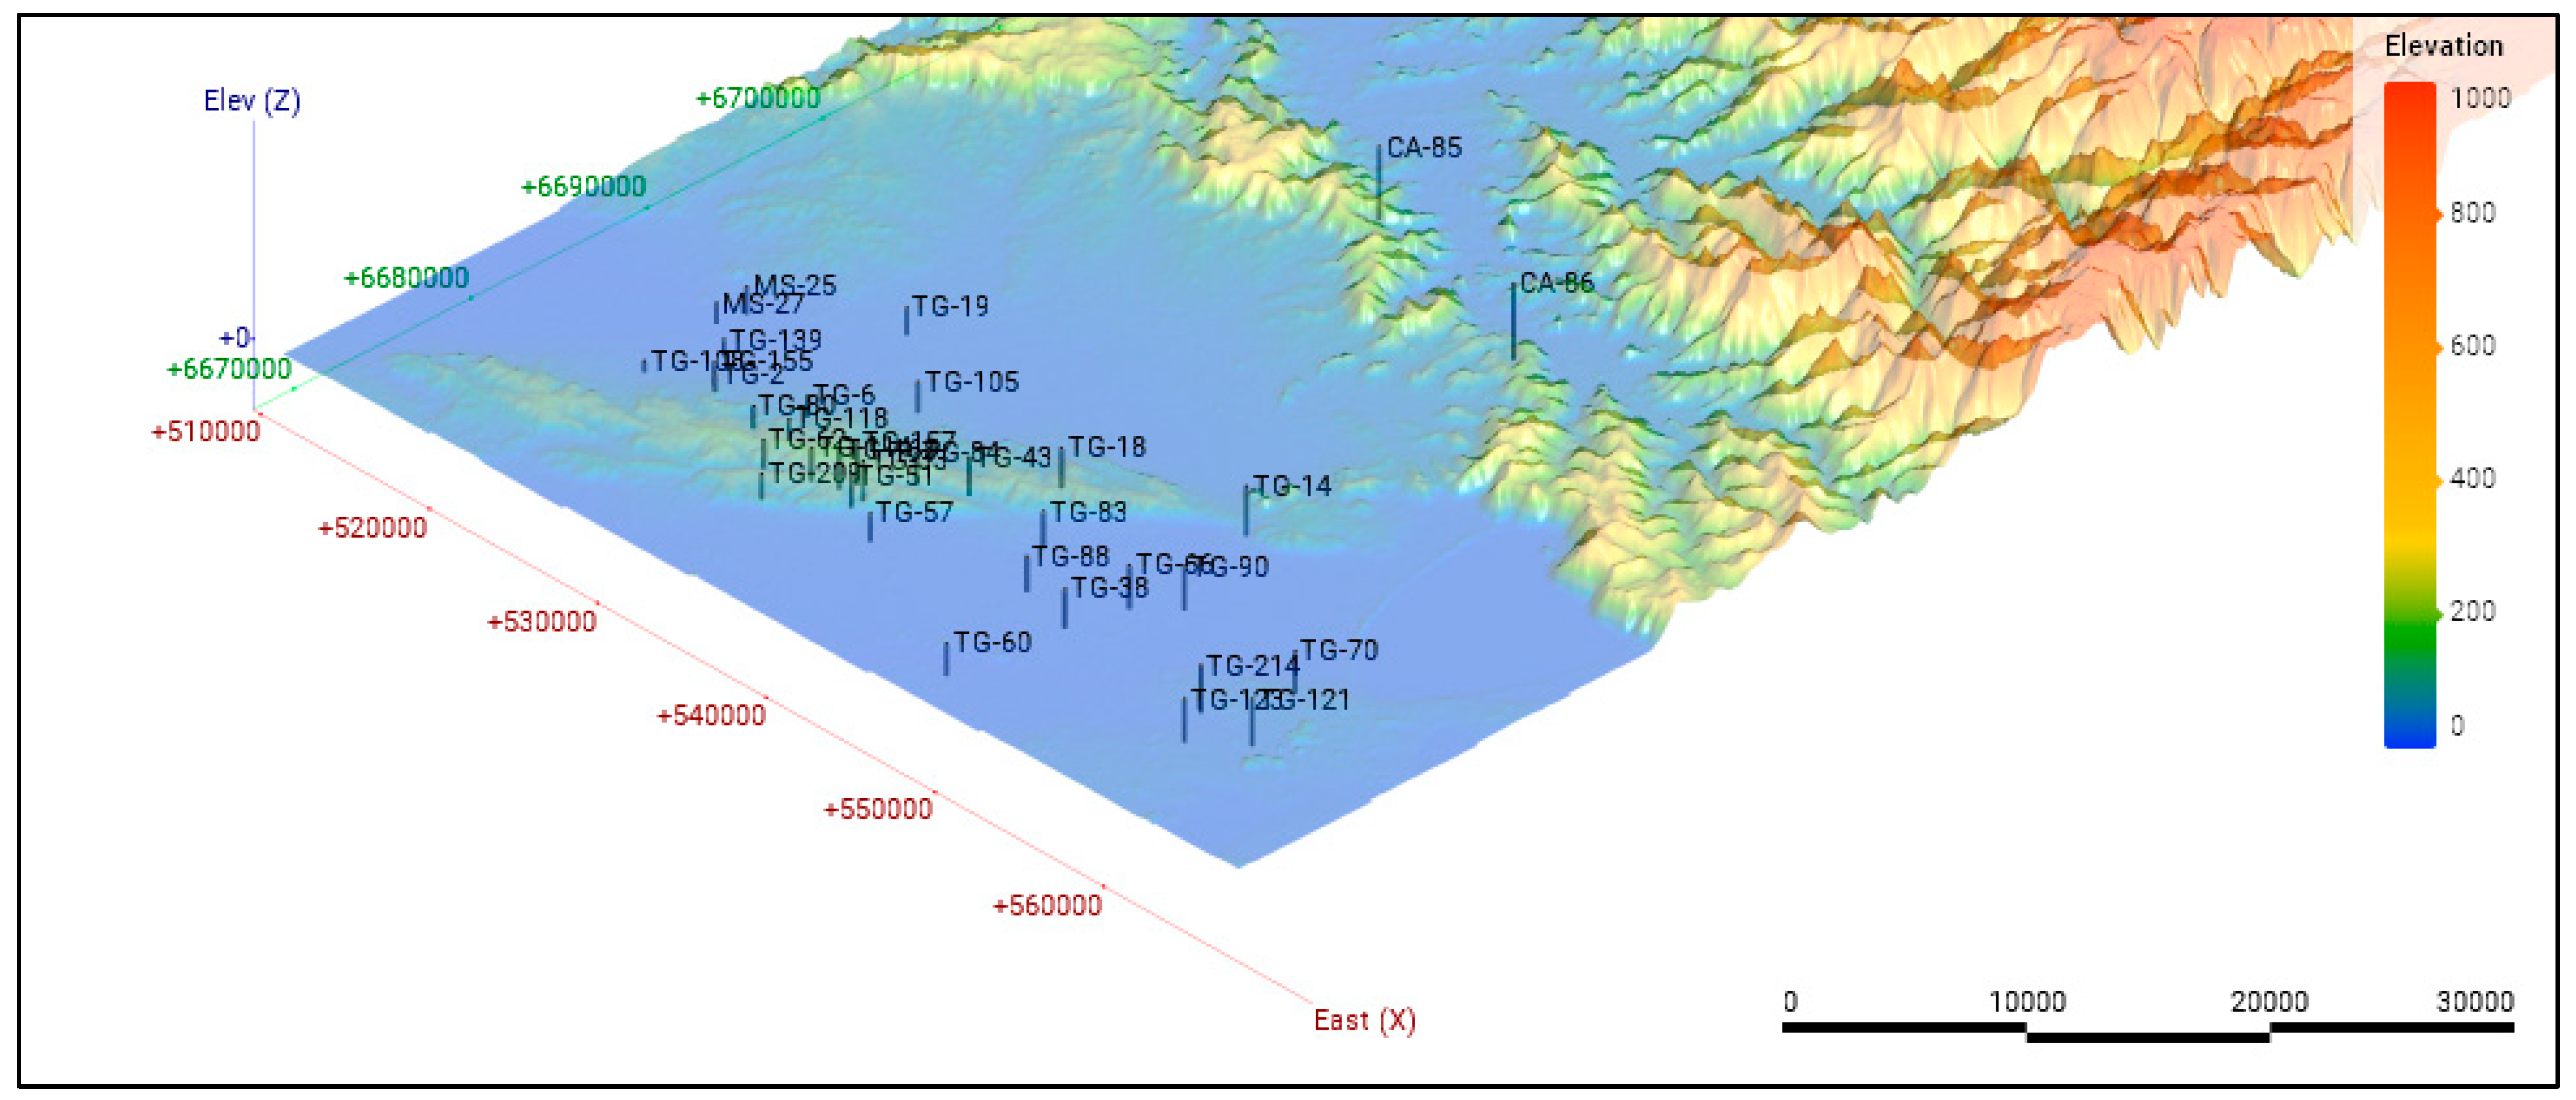
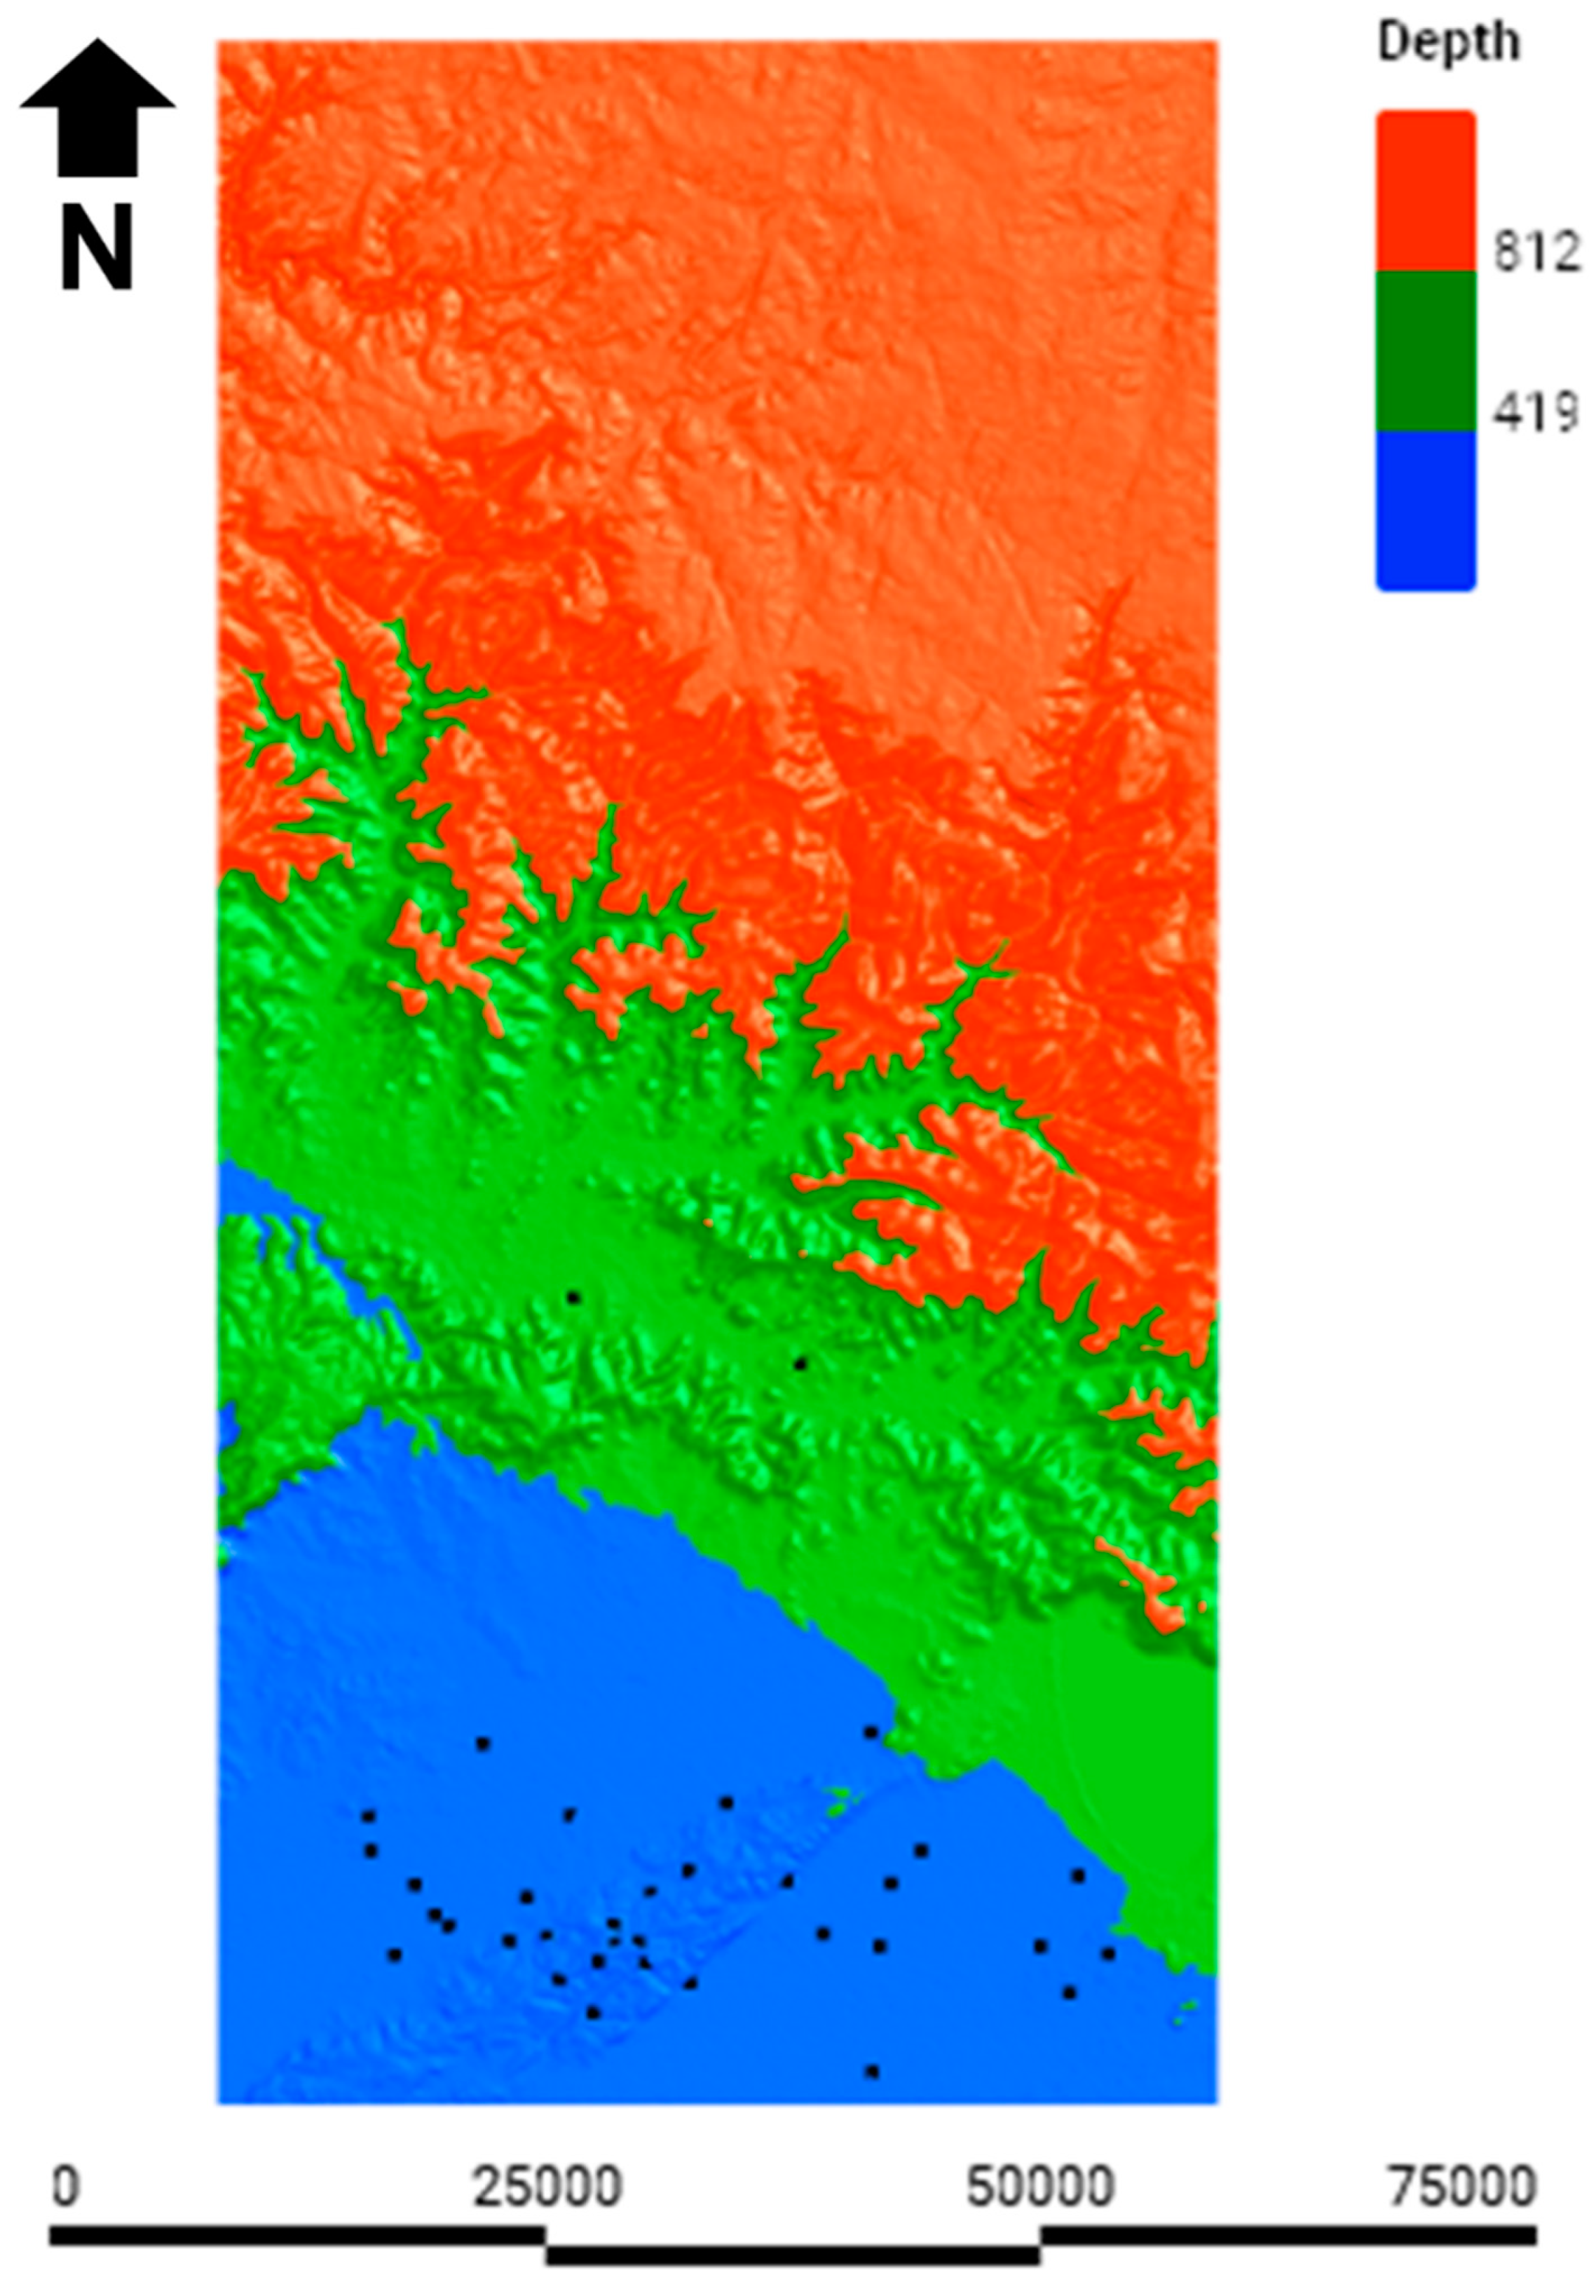
3.1. Drillhole Database and Digital Terrain Model

The database used in this study consists of 37 vertical drillholes [55] in a total of approximately 11,584 m, where the average depth per hole is 300 m. Exceptions include two drillholes (CA-85 and CA-86) located further north with depths of ~700 m (Figure 2). All drillholes possess data regarding the top (first) and base (last) of the coal seams, depth (m), cumulative and net coal thicknesses, and information on the underlying geological formation and the basin’s crystalline basement.
A digital terrain model (DTM) was generated from the SRTM (Shuttle Radar Topography Mission), based on the public data available on the EarthExplorer website (https://earthexplorer.usgs.gov, accessed on 27 March 2023) in the QGIS software, version 3.34.11-Prizren. The DTM surface and the drillhole data spreadsheets were loaded in the Leapfrog Geo software, version 2024.1.2 where all subsequent 3D modeling steps, described below, were performed (Figure 4). The 3D solids and volumes were generated in the software (Figure 5) using algorithms based on fast radial basis functions (RBF) [42,70,71]. In general, the software has 4 main interpolation algorithms known as follows: “Intrusion”, “Vein”, “Stratigraphic” and “Deposit” [33,72,73], the latter being the one that best depicted the Chico Lomã coal seams geologically in 3D. A complete explanation of the mathematics behind this method is outside the scope of this paper. However, it is important to note that the methodology relies on the principle that infinite precision is neither necessary nor anticipated when performing fast RBF computations [42,70,71,74].
The 3D model of the coal-bearing zone was generated using the top and base data and the “Deposit” algorithm of the software through implicit modeling [42]. The coal-bearing zone 3D model dips gently one degree northeast N25, as defined by the drillhole intersections (Figure 6).

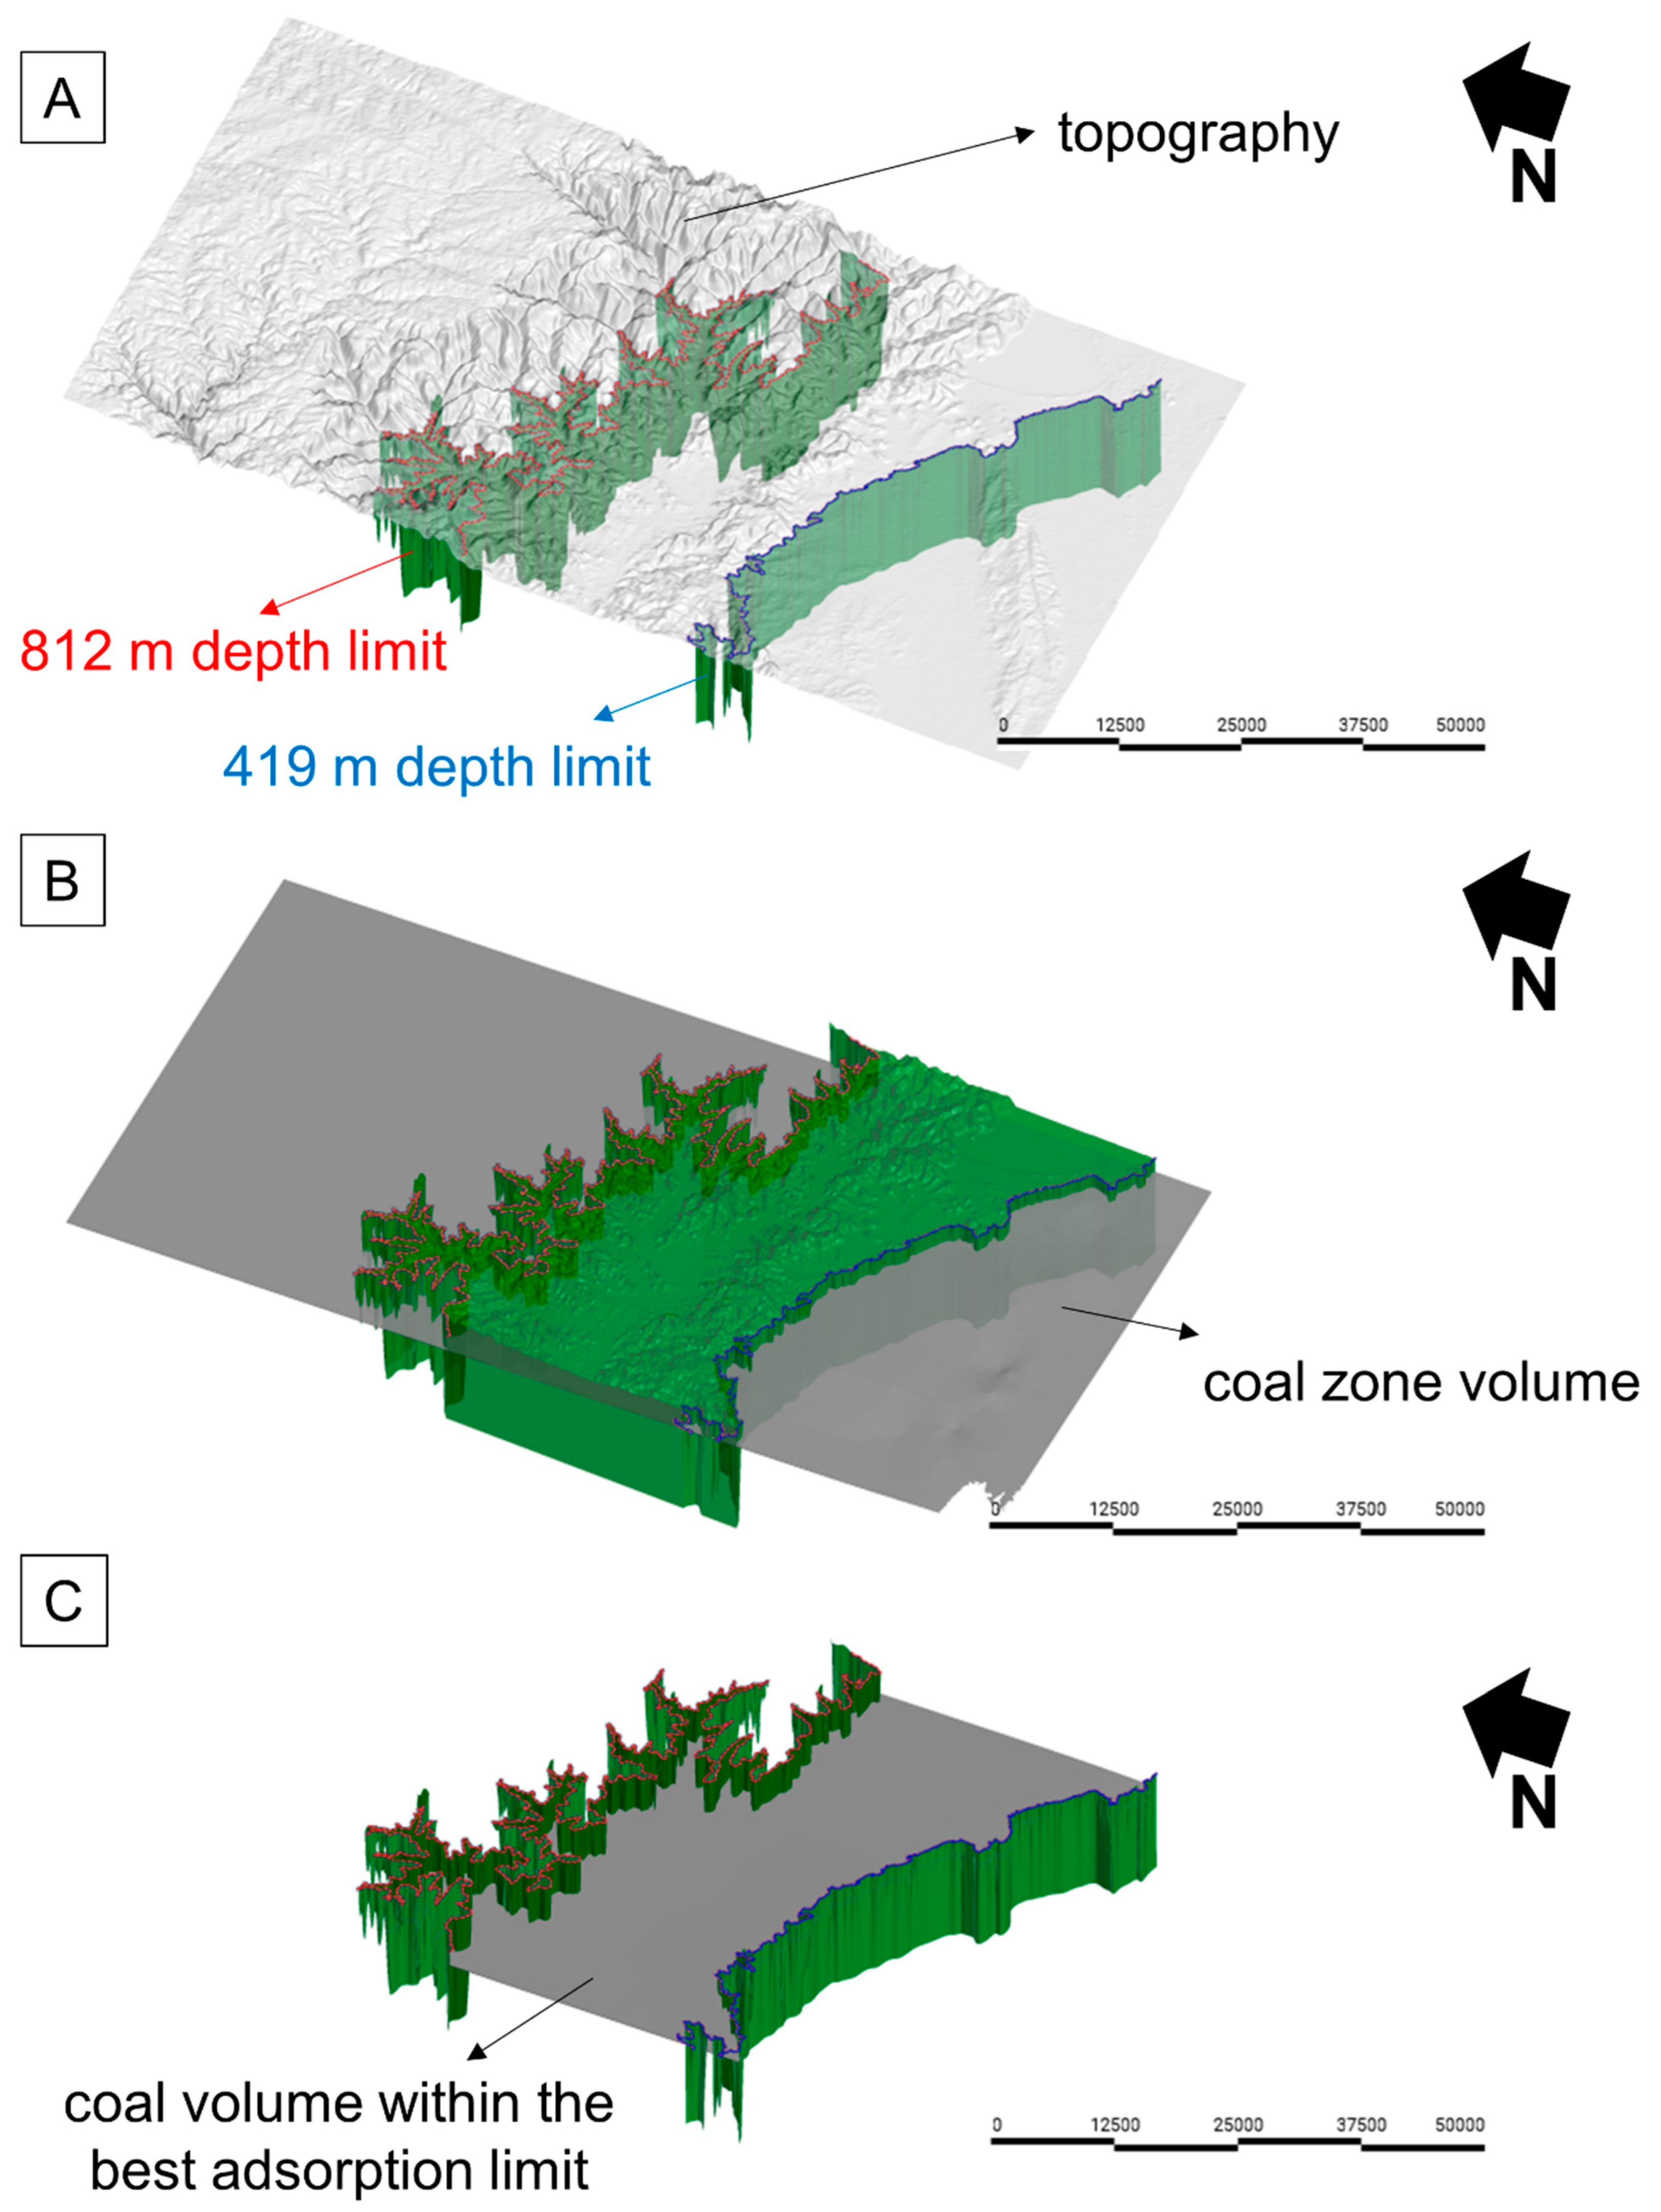
3.2. Defining the Depth of the Coal-Bearing Zone for CO2 Storage

To define the favorable CO2 storage portions that are spatially within the coal-bearing zone model of the Chico Lomã deposit, the CO2 sorption isotherm data from the sample, identified as “07-166” from Weniger et al. [28], was used. The 07-166 sample consists of a coal sample from the Rio Bonito Formation, collected from a drillhole at a depth of 620.80 m, from the contiguous coal deposit of Santa Terezinha (Figure 1), due to the lack of data available in the literature for Chico Lomã deposit. The TOC value for the 07-166 sample is 43.9%, vitrinite reflectance is 0.92%Rr, moisture content is 0.93%, and ash wield is 41.99% [28]. The 07-166 sample presents a maceral composition with vitrinite content of 53%, liptinite content of 9%, and inertinite content of 38% [28]. The CO2 sorption isotherms were measured at 45 °C on a raw basis and were determined up to pressures of more than 20 MPa [28]. The temperature level is consistent with a geothermal gradient (28.8 °C/km) determined from the bottom hole temperature of a nearby Petrobras petroleum exploration well [75] and the average annual temperature of the area [55]. The isotherm used in this study exhibits a maximum in the 8.1 MPa and then shows a continuous decline (Figure 7). This is a typical behavior of excess adsorption isotherms [76], where the curve decreases with increasing temperature, because of the exothermic nature of the sorption process [77]. This phenomenon was also observed by Busch et al. [78], Pini et al. [76], and Zhang et al. [79] for CO2 adsorption on coal, as characterized by a maximum absorption peak. Assuming the interval between 4.2 MPa and 8.1 MPa as the best adsorption range, and a pressure gradient of 10 MPa/km [22], the maximum and minimum depth values of 419 m and 812 m are obtained.

3.3. Clipping the Coal-Bearing Zone Model into the Interest Depth

Initially, a 3D model was implicitly generated based on information from the upper portion of the coal-bearing zone, that is, based on the drillhole intervals overlying the coal-bearing zone. This model represents, in 3D, the vertical distances from the topographic surface to the top of the coal-bearing zone. The maximum and minimum depth limits were defined based on CO2 sorption isotherm data and then filtered into this model (Figure 8). The intersection between these limits with the DTM generates two polylines (Figure 9A). The two polylines were projected vertically at depth to create a surface, and then, a solid bounded by these polylines was generated to define the volume of interest, where the coal-bearing zone is located between 419 and 812 m depth (Figure 9B). Finally, a cutting operation was carried out between the model of the total coal-bearing zone within the entire study area and the solid block that represents the interval of interest depth (Figure 9C). In the software, surfaces and solid blocks, in the form of vertices and triangles, define the 3D shape of the models and are called meshes. The software operation used is called “clip mesh”. This approach has some similarities with the methodology presented by Kaufmann and Martin [34], although the studies have different goals.

3.4. CO2 Storage Capacity Calculation

The CO2 storage capacity calculation in the Chico Lomã coal deposit was performed using the DOE NETL [46] equation as follows:
G C O 2 = A h C s ρ C O 2 E c o a l
where G C O 2 is the mass estimate of the CO2 resource of one or more coal beds within the coal-bearing zone. The product of the total area and the thickness ( A h ) account for the total bulk volume containing the coal to be assessed and was obtained directly from the 3D-generated model of the coal deposit zone. The C s is the maximum volume of CO2 at standard conditions that can be adsorbed per volume of coal (e.g., the Langmuir isotherm volume constant), and it is assumed to be on an in situ or “as it is” basis. As mentioned before, in this research we assumed the results of the high-pressure isotherms from Weniger et al. [28], considering the minimum and maximum values of 12.50 and 14.55 m3/t, respectively (Figure 7). ρ C O 2 is the standard density of CO2. According to Bachu et al. [60], to express the CO2 storage capacity in mass rather than volume of CO2, the results have to be multiplied by CO2 density at standard conditions of 1.873 kg/m3. The storage efficiency factor ( E c o a l ) represents the portion of the total bulk coal volume that can store the injected CO2 and ranges between 21 and 48 percent at the 10th to 90th percent probability interval [46]. This methodology can be applied in equations for capacity calculation based on direct CO2 storage in coal seams like DOE NETL [46], as well as in equations considering ECBM [43,48]. As the innovation presented here basically refers to the definition of the volume in 3D before the calculation, in both types of equations, simply apply the proposed methodology and substitute the 3D volume obtained into the volumes in the ( A h ) from any of the equations [46,48]. Table 2 shows the values used in this study with their respective sources.

4. Results

The coal-bearing zone volume within the Chico Lomã deposit is 92,044 million m3 within the study area. The coal-bearing zone volume at depths of interest for CO2 storage, between 419 m and 812 m, is 27,130 million m3. The average thickness of the coal-bearing zone in the drillhole data is 18.7 m [55], and the cumulative coal seam thickness of the two deepest drillholes CA-85 and CA-86 are 24.00 m and 17.76 m, respectively. Therefore, the total coal volume was estimated at 2320 million m3. Previous works that have used 3D modeling have presented different volumes of coal. Araújo et al. [54] present a total coal volume of 1064 million m3 for the Chico Lomã deposit with an average thickness of 0.90 m, while Kalkreuth et al. [55] present a coal volume of 3489 million m3 with an average thickness of 2.41 m. The volumes mainly vary according to the area that has been defined for the deposit. The coal seams show continuity and extension at depth and laterally. Boundaries in this study are in accordance with the availability of drillhole data (Figure 1 and Figure 4).
Applying the coal seam efficiency factors ( E c o a l ) of 21%, 37%, and 48% (P10, P50, and P90, respectively) from Goodman et al. [46], the total theoretical CO2 storage capacity of the Chico Lomã deposit would range from 27.2 Gt to 62.2 Gt (Table 3).
The CO2 storage efficiency factor from the DOE NETL methodology [46] is a function of geologic parameters, such as area, thickness, and displacement, and efficiency components, such as areal, vertical, gravity, and the degree of CO2 saturation (with respect to the maximum predicted by the Langmuir isotherm) within the CO2-accessible deposit, which reflect the portion of a region’s coal bulk volume and primarily the pore internal surfaces of organic matter with which CO2 is expected to contact. However, this equation cannot be used to obtain information about micropore structures from a single adsorption isotherm, such as the Dubinin–Astakhov equation adsorption model [80].
The efficiency factors for coal seams were determined by using the Log Odds Method when applied with Monte Carlo sampling [81]. The overall storage efficiency factor for coal seams ranges from 21 to 48 percent over the 10 and 90 percent probability range. The P10 and P90 values computed in this manner serve as the nominal lower and upper bounds that demark a plausible range of efficiency factors, defined in a consistent probabilistic manner [46]. Because these limits are based on a combination of data with varying quality and expert judgment, the P10 and P90 limits should be interpreted as general (rather than strictly mathematical) limits [46].

5. Discussion

The CO2 storage capacity of the Chico Lomã coal deposit has been evaluated for the first time in this study. A similar calculation, although without using the original methodology presented here, was performed in the nearby Santa Terezinha coal deposit (Figure 2), reaching a total CO2 storage capacity of 13.8 Gt while also considering the coalbed methane (CBM) potential [29].
The total capacity obtained, despite being restricted by the volume of coal within the best adsorption limit, is still higher than that presented for Santa Terezinha [29] and other similar global cases [69]. This is probably because we are working with a projection of the dip of the coal zone at depth and only two deep drillholes (Figure 6 and Figure 8), and due to the specific coal characteristics (maceral composition and vitrinite reflectance) between the different deposits. With the development of the project and new drillholes detailing this information, increasing geological reliability, this number will most likely be lower, as pointed out by Bachu et al. [60].
In the assessment of the Chico Lomã deposit, we chose to use the DOE NETL equation [46] due to its efficiency factors and ease of application, emphasizing the adsorption, which was used in the previous definition of the volume (Figure 7). However, any of the literature equations for coal seams [43,45,46,47,65] and other similar ones can be applied to the workflow we present here since the main difference lies in the determination of the volume before calculation.
Although the Chico Lomã is an unmined coal deposit, the approach introduced here can also be extended to abandoned coal mines by applying the appropriate volume discounts for shafts, pillars, and other underground mine structures, according to Ray and Dey [82].
Following the capacity classification of Bachu et al. [60], which considers the technical and economic aspects in CO2 storage capacity evaluations, the tonnages discussed and presented in this study are assumed as the Theoretical Capacities (Table 3). To achieve satisfactory performance in the categories of Effective or Practical Capacities [60], it is recommended that future works perform adsorption tests on individual samples of each of the main coal seams (CL1 to CL3, Figure 3) of the Chico Lomã deposit and carry out 3D modeling of each seam individually. As highlighted by [83], experiments in the laboratory need to reproduce the underground conditions as closely as possible in order to be useful for field application. Another important aspect would be to increase the number of samples for adsorption isotherms. Our initial demonstration is based on just one sample. Ideally, in order to achieve a reliable Effective Capacity classification [60], tests should be carried out on several samples from the various coal seams, which can present different heterogeneities in the coal reservoir. For the subsequent classification of Practical Capacity, it is recommended that tests be conducted in a pilot plant [83], with a greater representativeness given by a larger volume of samples or even initial injection tests in field scale [67].
In this work, we assumed that the coal seams of the Santa Terezinha and Chico Lomã deposits would have similar adsorption isotherms because they have some similar characteristics and parameters (Table 1), and because they are contiguous (Figure 1) and almost spatially continuous [54]. This approach can be accepted at this assessment stage because the aim is to validate the methodology and demonstrate a minimum of feasibility for the Chico Lomã deposit as a CO2 potential reservoir. However, subsequent studies should properly generate adsorption isotherms with samples from the Chico Lomã deposit.
Although the coal from the Chico Lomã deposit has a high average ash content (40.0 to 56.2%), and this content usually results in a blockage of the pores, thus generating a low adsorption capacity [69,84,85], detailed studies, which are beyond the scope of this work, addressing this aspect as well as porosity and permeability should be conducted in the future. For comparison, in the studies conducted by De Silva et al. [47], coal deposits with an ash content of up to 57% were considered for CO2 storage.
Another important aspect, that should be incorporated into future work, is the structural geology information on faults and fractures, which should be added to the 3D model [86], such as the SE-NW striking fault system presented by Burger et al. [87] for the Santa Terezinha deposit. The lack of structural geology data directly impacts the 3D model and therefore the volume used in the capacity calculation. Incorporating an understanding of structural geology into the geological model is a logical approach that can enhance their accuracy [88]. Studies on natural analog CO2 reservoirs show that leakage to the surface through faults or other geological structures is globally rare, obtaining very low leak rates, even in places that would not be considered adequately safe for CO2 storage [89,90,91,92]. The most likely routes for leakage are improperly sealed wellbores [2,93,94].
The methodology proposed in this paper effectively defines the coal volume within the best absorption limit in 3D, providing a scientific basis for determining denser sampling and better defining the location of CO2 injection points, or even gas production wells (in the case of ECBM), ultimately leading to safer and more cost-effective research programs. The advantage of this method, besides its intrinsic implicit modeling advantages [42], is its ability to provide the smoothest surface of interpolation [40], which is ideally suited for geological modeling [41], and also that it can provide a more realistic volume than the common product of the deposit area multiplied by the average thickness. This methodology is ideal for the initial stages of the Exploration Phase of assessing a deposit or region for CO2 geological storage, as the Site Selection and Initial Characterization stages [46].
Three-dimensional numerical models that consider regular model grid block formats or simplified tabular coal seams, e.g., Perera et al. [95], Ekneligoda and Marshall [96], Pratama et al. [97], Asif et al. [98], and others, would also benefit from this methodology, adding greater geological reliability with the better representativeness of the contact surfaces generated from the 3D implicit modeling of the geological contacts of the coal seams from the drillhole intervals.
However, drawbacks of the methodology presented here are its high dependence on the representativeness of available CO2 adsorption isotherms, the assumption of geological homogeneous coal seams, and the number of accessible drillholes with trustworthy geological data that will allow the coal seams to be modeled reliably in terms of their depths. If the adsorption isotherms are not representative or if there are not enough drillholes, the capacity calculations may not be realistic. In terms of pressure gradient, De Silva et al. [47], analyzing a comprehensive set of data for CO2 storage in coal seams, concluded that better estimation can be obtained by expressing adsorption capacity as a power function of pressure rather than assuming a linear relationship between adsorption capacity and pressure. Future research should focus on refining these aspects, optimizing sample collection and processing, and exploring their applicability in various geological contexts to improve the reliability of the estimative, enabling the CO2 project to move into the Site Characterization Phase [46].
In a subsequent economic viability assessment, the ECBM potential will also need to be considered along with CO2 injection in the Chico Lomã deposit, which was not considered in this initial appraisal. Recent studies have shown a high correlation between coal storage capacity, maceral composition, and vitrinite reflectance values [6,85]. For Chico Lomã, the fixed carbon and vitrinite reflectance average values are 13% and 0.63%, respectively [55,99], which also indicate a high potential for CO2 sequestration.
Another important aspect to take into account is the thermal effects on coals and black shales in the proximity of dikes and sills of the Serra Geral magmatism (Cretaceous) [17,100,101,102,103]. In the present study, this type of information was not included in the 3D geological model. Nevertheless, recent works have modeled the sills and dikes in this region in three dimensions [104,105], so in future assessment studies, these data should be integrated.
The DOE NETL [46] equation is simplified and does not consider CO2 density variations or fluctuations. CO2 can reside in nanopores as sorbed and free phases, which may depend on the pressure, temperature, and pore size. However, as mentioned above, the methodology presented here can be incorporated into different flows by considering other more complete volume-based equations.
To assess the potential for CO2 storage in the region, as the primary factor in the choice of the storage location is the proximity to the capture site [61], data on the location of thermoelectric plants were used from the Agência Nacional de Energia Elétrica [106]. This also provides data on the individual power and fuel for each plant. The CO2 emission rates in tons per year were estimated for each plant, based on an assumed capacity factor of 80% and a heat rate assumption of 40% efficiency. Emission factors were taken from Eggleston et al. [107] and vary according to the fuel consumed by the power plant. According to Allah et al. [12] and Moore et al. [14], there is an opportunity for increased flexibility in the context of fossil fuel power plants, with CCUS technologies exhibiting lower environmental impacts, being competitive and reliable energy sources compared to renewables.
In the project region, there are 12 power plants within a radius of 55 km [22], and they have a total CO2 emission per year of approximately 9.2 Mt [106]. Among these plants, 10 are diesel-fueled thermoelectric plants and 2 have natural gas-based sources. Therefore, considering the calculated theoretical average capacity of 47.8 Gt of CO2 (Table 3) in the Chico Lomã deposit and the emission of 9.2 Mt/year emitted in the region by the 12 power plants, it is possible to achieve a potential for CO2 storage for at least 520 years. The study area therefore has a high potential for geological storage of CO2, since the Chico Lomã coal seam shows both lateral and depth continuity, making it possible to install a hub for CO2 geological storage captured in all the thermoelectric power plants in the region.

6. Concluding Remarks

The innovative methodology proposed, which combines the most advanced 3D implicit modeling techniques and coal seam sorption isotherms analytical data, proves to be an efficient alternative for evaluating this type of geological reservoir in CO2 storage studies, offering a new alternative that could be applied not only to other coal deposits in this southern Brazil province but also to other unmineable coal deposits around the world.
The coal seams of the Chico Lomã deposit exhibit thicknesses, volumes, lateral continuity, and depths compatible with the requirements considered worldwide for the geological storage of CO2 in unmined coal deposits.
The theoretical total CO2 storage capacity of 47.8 Gt achieved in this study is compatible with and could mitigate CO2 emissions from local thermoelectric power plants, while still providing a surplus for storing other potential stationary industrial sources in the surrounding areas for more than 500 years.
Given the great geological heterogeneity within these layers, future studies are recommended to include a greater number of detailed adsorption isotherm analyses for each coal seam, as well as more drillholes reaching the seams at greater depths, to provide more realistic data.

Author Contributions

Conceptualization, S.B.d.O.; methodology, S.B.d.O.; software, S.B.d.O.; validation, S.B.d.O., H.V.R., and C.F.A.R.; formal analysis, S.B.d.O.; investigation, S.B.d.O.; resources, S.B.d.O.; data curation, S.B.d.O.; writing—original draft preparation, S.B.d.O.; writing—review and editing, H.V.R., C.F.A.R., C.C.G.T., and M.J.L.d.S.; visualization, S.B.d.O.; supervision, S.B.d.O.; project administration, S.B.d.O.; funding acquisition, S.B.d.O. and C.C.G.T. All authors have read and agreed to the published version of the manuscript.

Funding

This research received no external funding.

Institutional Review Board Statement

Not applicable.

Informed Consent Statement

Not applicable.

Data Availability Statement

The data presented in this study are available upon request from the corresponding author.

Acknowledgments

The authors would like to thank Seequent Limited for providing the Leapfrog academic license. Part of this work was developed as a graduation monograph by Nicóli Gonçalves França, to whom we give due recognition and acknowledgment. We would like to thank Sandra Liu for the invitation and for dealing with the charges. We thank the three anonymous reviewers for carefully reading our manuscript and providing comments and suggestions.

Conflicts of Interest

The authors declare no conflicts of interest.

References

  1. IPCC. Summary for Policymakers. In Climate Change 2021: The Physical Science Basis. Contribution of Working Group I to the Sixth Assessment Report of the Intergovernmental Panel on Climate Change; Masson-Delmotte, V., Zhai, P., Pirani, A., Connors, S.L., Péan, C., Berger, S., Caud, N., Chen, Y., Goldfarb, L., Gomis, M.I., et al., Eds.; Cambridge University Press: Cambridge, UK; New York, NY, USA, 2021; pp. 3–32. [Google Scholar]
  2. IPCC. Intergovernmental Panel on Climate Change Special Report on Carbon Dioxide Capture and Storage; Intergovernmental Panel on Climate Change: Cambridge, UK; New York, NY, USA, 2005; p. 442. [Google Scholar]
  3. Stephens, J.C. Growing interest in carbon capture and storage (CCS) for climate change mitigation. Sustain. Sci. Pract. Policy 2006, 2, 4–13. [Google Scholar] [CrossRef]
  4. IEA. Net Zero by 2050: A Roadmap for the Global Energy Sector. Available online: https://www.iea.org/events/net-zero-by-2050-a-roadmap-for-the-global-energy-system (accessed on 25 May 2024).
  5. Bose, D.; Bhattacharya, R.; Kaur, T.; Pandya, R.; Sarkar, A.; Ray, A.; Mondal, S.; Mondal, A.; Ghosh, P.; Chemudupati, R.I. Innovative approaches for carbon capture and storage as crucial measures for emission reduction within industrial sectors. Carbon Capture Sci. Technol. 2024, 12, 100238. [Google Scholar] [CrossRef]
  6. Rodrigues, C.F.A.; Dinis, M.A.P.; Lemos de Sousa, M.J. Review of European energy policies regarding the recent “carbon capture, utilization and storage” technologies scenario and the role of coal seams. Environ. Earth Sci. 2015, 74, 2553–2561. [Google Scholar] [CrossRef]
  7. ISO 11760:2005; Classification of Coals. ISO: Geneva, Switzerland, 2005.
  8. IEA. Tracking Clean Energy Progress 2023; International Energy Agency: Paris, France, 2023. [Google Scholar]
  9. Cachola, C.d.S.; Ciotta, M.; Azevedo dos Santos, A.; Peyerl, D. Deploying of the carbon capture technologies for CO2 emission mitigation in the industrial sectors. Carbon Capture Sci. Technol. 2023, 7, 100102. [Google Scholar] [CrossRef]
  10. Kong, H.; Sun, Y.; Li, Z.; Zheng, H.; Wang, J.; Wang, H. The development path of direct coal liquefaction system under carbon neutrality target: Coupling green hydrogen or CCUS technology. Appl. Energy 2023, 347, 121451. [Google Scholar] [CrossRef]
  11. Lima, P.R.; Pereira, A.A.M.; Chaves, G.d.L.D.; Meneguelo, A.P. Environmental awareness and public perception on carbon capture and storage (CCS) in Brazil. Int. J. Greenh. Gas Control 2021, 111, 103467. [Google Scholar] [CrossRef]
  12. Allah, F.U.M.; Marques, A.d.S.; Carvalho, M. Current status, challenges and future prospects of carbon capture and storage (CCS) for thermal power plants in Brazil. Int. J. Greenh. Gas Control 2024, 136, 104198. [Google Scholar] [CrossRef]
  13. Machado, P.G.; Hawkes, A.; Ribeiro, C.d.O. What is the future potential of CCS in Brazil? An expert elicitation study on the role of CCS in the country. Int. J. Greenh. Gas Control 2021, 112, 103503. [Google Scholar] [CrossRef]
  14. Moore, C.C.S.; Antunes, C.H.; Kulay, L. Economic, Environmental and Energy analysis of carbon capture systems coupled in coal power plants for the reduction of CO2 emissions in Brazil. Int. J. Greenh. Gas Control 2022, 114, 103606. [Google Scholar] [CrossRef]
  15. Abraham-A, R.M.; Tassinari, C.C.G. CO2 storage algorithms involving the hybrid geological reservoir of the Irati Formation, Parana Basin. Int. J. Greenh. Gas Control 2021, 112, 103504. [Google Scholar] [CrossRef]
  16. de Oliveira, S.B.; Tassinari, C.C.G.; Abraham-A, R.M.; Torresi, I. 3D implicit modeling applied to the evaluation of CO2 geological storage in the shales of the Irati Formation, Paraná Basin, Southeastern Brazil. Greenh. Gases Sci. Technol. 2021, 11, 1024–1042. [Google Scholar] [CrossRef]
  17. de Oliveira, S.B.; Rocha, H.V.; Tassinari, C.C.G. 3D geochemical characterization of organic-rich shales of the Irati Formation, Paraná Sedimentary Basin: New perspective for CO2 geological storage in southeastern Brazil. Int. J. Greenh. Gas Control 2022, 114, 103563. [Google Scholar] [CrossRef]
  18. Rocha, H.d.V.; Sant’Anna, L.G.; Musarra, R.M.L.M.; Tassinari, C.C.G.; San Martín Cañas, S. CO2 Geological Storage Through Adsorption in Organic-Rich Shales: A Case Study of Irati Formation Shales from the Paraná Basin, Brazil. In Perspectives to CO2 Geological Storage and Greenhouse Gas Negative Emissions in South-Southeastern Brazil: Paraná and Santos Sedimentary Basins, 1st ed.; Musarra, R.M.L.M., Tassinari, C.C.G., San Martín Cañas, S., Eds.; Blucher Open Access: São Paulo, Brazil, 2022; pp. 73–94. [Google Scholar]
  19. Abraham-A, R.M.; Tassinari, C.C.G. Carbon dioxide storage efficiency involving the complex reservoir units associated with Irati and Rio Bonito Formations, Paraná Basin, Brazil. AAPG Bull. 2023, 107, 357–386. [Google Scholar] [CrossRef]
  20. Rocha, H.V.; Sant’Anna, L.G.; Rodrigues, C.F.A.; Mendes, M.; Pereira, Z.; Lopes, G.; Fernandes, P.; Pereira, E.; Tassinari, C.C.G.; Lemos de Sousa, M.J. The paleoenvironmental and thermal histories of the Permian Irati Formation shale in the Paraná Basin, Brazil: An integrated approach based on mineralogical and organic imprints. Mar. Pet. Geol. 2023, 154, 106328. [Google Scholar] [CrossRef]
  21. Abraham-A, R.M.; San Martín Cañas, S.; Miranda, I.F.S.; Tassinari, C.C.G. Assessment of CO2 storage prospect based on physical properties of Rio Bonito Formation rock units. Energy Geosci. 2023, 5, 100163. [Google Scholar] [CrossRef]
  22. de Oliveira, S.B.; Weber, N.; Yeates, C.; Tassinari, C. Geological screening for onshore CO2 storage in the Rio Bonito Formation, Paraná Basin, Brazil. J. Maps 2023, 19, 2171817. [Google Scholar] [CrossRef]
  23. Abraham-A, R.M.; Rocha, H.V.; de Oliveira, S.B.; Tassinarri, C.C.G.; da Silva, O.C. Hydrocarbon indication in Rio Bonito Formation sandstone: Implication for CO2 storage in São Paulo, Brazil. Energy Geosci. 2024, 5, 100168. [Google Scholar] [CrossRef]
  24. Abraham-A, R.M.; Tassinari, C.C.G.; Taioli, F.; Rocha, H.V.; da Silva, O.C. Reservoir quality evaluation as a measure to forecast hydrocarbon and CO2 storage prospects in Irati and Rio Bonito Formations, Paraná Basin. Results Geophys. Sci. 2023, 14, 100059. [Google Scholar] [CrossRef]
  25. Ketzer, J.M.; Iglesias, R.; Einloft, S.; Dullius, J.; Ligabue, R.; de Lima, V. Water–rock–CO2 interactions in saline aquifers aimed for carbon dioxide storage: Experimental and numerical modeling studies of the Rio Bonito Formation (Permian), southern Brazil. Appl. Geochem. 2009, 24, 760–767. [Google Scholar] [CrossRef]
  26. Lima, V.d.; Einloft, S.; Ketzer, J.M.; Jullien, M.; Bildstein, O.; Petronin, J.-C. CO2 Geological storage in saline aquifers: Paraná Basin caprock and reservoir chemical reactivity. Energy Procedia 2011, 4, 5377–5384. [Google Scholar] [CrossRef]
  27. Weber, N.; de Oliveira, S.B.; Cavallari, A.; Morbach, I.; Tassinari, C.C.G.; Meneghini, J. Assessing the potential for CO2 storage in saline aquifers in Brazil: Challenges and Opportunities. Greenh. Gases Sci. Technol. 2024, 14, 319–329. [Google Scholar] [CrossRef]
  28. Weniger, P.; Kalkreuth, W.; Busch, A.; Krooss, B.M. High-pressure methane and carbon dioxide sorption on coal and shale samples from the Paraná Basin, Brazil. Int. J. Coal Geol. 2010, 84, 190–205. [Google Scholar] [CrossRef]
  29. Kalkreuth, W.; Holz, M.; Levandowski, J.; Kern, M.; Casagrande, J.; Weniger, P.; Krooss, B. The Coalbed Methane (CBM) Potential and CO2 Storage Capacity of the Santa Terezinha Coalfield, Paraná Basin, Brazil—3D Modelling, and Coal and Carbonaceous Shale Characteristics and Related Desorption and Adsorption Capacities in Samples from Exploration Borehole CBM001-ST-RS. Energy Explor. Exploit. 2013, 31, 485–527. [Google Scholar] [CrossRef]
  30. Santarosa, C.S.; Crandall, D.; Haljasmaa, I.V.; Hur, T.-B.; Fazio, J.J.; Warzinski, R.P.; Heemann, R.; Ketzer, J.M.M.; Romanov, V.N. CO2 sequestration potential of Charqueadas coal field in Brazil. Int. J. Coal Geol. 2013, 106, 25–34. [Google Scholar] [CrossRef]
  31. Pelissari, M.R.; Cañas, S.S.M.; Barbosa, M.O.; Tassinari, C.C.G. Decarbonizing coal-fired power plants: Carbon capture and storage applied to a thermoelectric complex in Brazil. Results Eng. 2023, 19, 101249. [Google Scholar] [CrossRef]
  32. Weiler, J.; Tassinari, C.C.G.; De Aquino, T.F.; Bonetti, B.; Viola, V.O. Using mining waste for CO2 sequestration: Exploring opportunities through mineral carbonation, nature-based solutions, and CCUS. Int. J. Min. Reclam. Environ. 2024, 38, 425–441. [Google Scholar] [CrossRef]
  33. de Oliveira, S.B.; Costa, J.F.C.L.; Ciotta, M. Use of 3D modelling in the CO2 geological storage, possible applications for Paraná and Santos Basins. In Perspectives to CO2 Geological Storage and Greenhouse Gas Negative Emissions in South-Southeastern Brazil: Paraná and Santos Sedimentary Basins; Musarra, R.M.L.M., Tassinari, C.C.G., San Martín Cañas, S., Eds.; Blucher: São Paulo, Brazil, 2022; pp. 95–130. [Google Scholar]
  34. Kaufmann, O.; Martin, T. 3D geological modelling from boreholes, cross-sections and geological maps, application over former natural gas storages in coal mines. Comput. Geosci. 2008, 34, 278–290. [Google Scholar] [CrossRef]
  35. Claprood, M.; Gloaguen, E.; Giroux, B.; Konstantinovskaya, E.; Malo, M.; Duchesne, M.J. Workflow using sparse vintage data for building a first geological and reservoir model for CO2 geological storage in deep saline aquifer. A case study in the St. Lawrence Platform, Canada. Greenh. Gases Sci. Technol. 2012, 2, 260–278. [Google Scholar] [CrossRef]
  36. Alcalde, J.; Marzán, I.; Saura, E.; Martí, D.; Ayarza, P.; Juhlin, C.; Pérez-Estaún, A.; Carbonell, R. 3D geological characterization of the Hontomín CO2 storage site, Spain: Multidisciplinary approach from seismic, well-log and regional data. Tectonophysics 2014, 627, 6–25. [Google Scholar] [CrossRef]
  37. Gamboa, D.; Williams, J.D.O.; Bentham, M.; Schofield, D.I.; Mitchell, A.C. Application of three-dimensional fault stress models for assessment of fault stability for CO2 storage sites. Int. J. Greenh. Gas Control 2019, 90, 102820. [Google Scholar] [CrossRef]
  38. Vo Thanh, H.; Sugai, Y.; Nguele, R.; Sasaki, K. Integrated workflow in 3D geological model construction for evaluation of CO2 storage capacity of a fractured basement reservoir in Cuu Long Basin, Vietnam. Int. J. Greenh. Gas Control 2019, 90, 102826. [Google Scholar] [CrossRef]
  39. AlRassas, A.M.; Ren, S.; Sun, R.; Thanh, H.V.; Guan, Z. CO2 storage capacity estimation under geological uncertainty using 3-D geological modeling of unconventional reservoir rocks in Shahejie Formation, block Nv32, China. J. Pet. Explor. Prod. Technol. 2021, 11, 2327–2345. [Google Scholar] [CrossRef]
  40. Franke, R. Scattered data interpolation: Tests of some methods. Math. Comput. 1982, 38, 181–200. [Google Scholar]
  41. Cowan, E.J.; Beatson, R.K.; Fright, W.R.; McLennan, T.J.; Mitchell, T.J. Rapid geological modelling. In Proceedings of the Applied Structural Geology for Mineral Exploration and Mining, International Symposium, Kalgoorlie, Australia, 23–25 September 2002; pp. 23–25. [Google Scholar]
  42. Cowan, E.J.; Beatson, R.K.; Ross, H.J.; Fright, W.R.; McLennan, T.J.; Evans, T.R.; Carr, J.C.; Lane, R.G.; Bright, D.V.; Gillman, A.J. Practical implicit geological modelling. In Proceedings of the Fifth International Mining Geology Conference, Bendigo, VIC, Australia, 17–19 November 2003; pp. 89–99. [Google Scholar]
  43. Van Bergen, F.; Pagnier, H.J.M.; Kroos, B.M.; Van der Meer, L.G.H. CO2-sequestration in the Netherlands: Inventory of the potential for the combination of subsurface carbon dioxide disposal with enhanced coalbed methane production. In Proceedings of the 5th International Conference on Greenhouse Gas Control Technologies, Cairns, Australia, 13–16 August 2000; pp. 555–560. [Google Scholar]
  44. Hendriks, C.; Graus, W.; van Bergen, F. Global Carbon Dioxide Storage Potential and Costs; Ecofys: Utrecht, The Netherlands, 2004; 64p. [Google Scholar]
  45. White, C.M.; Smith, D.H.; Jones, K.L.; Goodman, A.L.; Jikich, S.A.; LaCount, R.B.; DuBose, S.B.; Ozdemir, E.; Morsi, B.I.; Schroeder, K.T. Sequestration of Carbon Dioxide in Coal with Enhanced Coalbed Methane Recovery—A Review. Energy Fuel. 2005, 19, 659–724. [Google Scholar] [CrossRef]
  46. Goodman, A.; Hakala, A.; Bromhal, G.; Deel, D.; Rodosta, T.; Frailey, S.; Small, M.; Allen, D.; Romanov, V.; Fazio, J.; et al. U.S. DOE methodology for the development of geologic storage potential for carbon dioxide at the national and regional scale. Int. J. Greenh. Gas Control 2011, 5, 952–965. [Google Scholar] [CrossRef]
  47. De Silva, P.N.K.; Ranjith, P.G.; Choi, S.K. A study of methodologies for CO2 storage capacity estimation of coal. Fuel 2012, 91, 1–15. [Google Scholar] [CrossRef]
  48. Liu, S.; Liu, T.; Zheng, S.; Wang, R.; Sang, S. Evaluation of carbon dioxide geological sequestration potential in coal mining area. Int. J. Greenh. Gas Control 2023, 122, 103814. [Google Scholar] [CrossRef]
  49. Han, S.; Wang, S.; Guo, C.; Sang, S.; Xu, A.; Gao, W.; Zhou, P. Distribution of the adsorbed density of supercritical CO2 onto the anthracite and its implication for CO2 geologic storage in deep coal. Geoenergy Sci. Eng. 2024, 234, 212624. [Google Scholar] [CrossRef]
  50. Milani, E.J.; Faccini, U.F.; Scherer, C.M.; Araújo, L.M.d.; Cupertino, J.A. Sequences and stratigraphic hierarchy of the Paraná Basin (Ordovician to Cretaceous), southern Brazil. Bol. IG-USP 1998, 29, 125–173. [Google Scholar] [CrossRef]
  51. Thomaz Filho, A.; Mizusaki, A.M.P.; Antonioli, L. Magmatism and petroleum exploration in the Brazilian Paleozoic basins. Mar. Pet. Geol. 2008, 25, 143–151. [Google Scholar] [CrossRef]
  52. Holz, M.; França, A.B.; Souza, P.A.; Iannuzzi, R.; Rohn, R. A stratigraphic chart of the Late Carboniferous/Permian succession of the eastern border of the Paraná Basin, Brazil, South America. J. S. Am. Earth Sci. 2010, 29, 381–399. [Google Scholar] [CrossRef]
  53. Gomes, A.J.P.; Cruz, P.R.; Borges, L.P. Recursos Minerais Energéticos: Carvão e Urânio; CPRM: Brasilia, Brazil, 2003; pp. 577–601. [Google Scholar]
  54. Araújo, L.L.; Vieira Júnior, H.T.; Wosniak, R. Avaliação dos Recursos Minerais do Brasil, Reavaliação do Patrimônio Mineral, Área Torres-Gravataí (Carvão); CPRM: Porto Alegre, Brazil, 2019; p. 356. [Google Scholar]
  55. Kalkreuth, W.; Levandowski, J.; Weniger, P.; Krooss, B.; Prissang, R.; da Rosa, A.L. Coal characterization and coalbed methane potential of the Chico-Lomã Coalfield, Paraná Basin, Brazil—Results from exploration borehole CBM001-CL-RS. Energy Explor. Exploit. 2020, 38, 1589–1630. [Google Scholar] [CrossRef]
  56. Berrocal, J.; Fernandes, C.; Bassini, A.; Barbosa, J.R. Earthquake hazard assessment in southeastern Brazil. Geofísica Int. 1996, 35, 257–272. [Google Scholar]
  57. IEA-GHG. IEA Greenhouse Gas R&D Programme: CCS Site Characterisation Criteria; IEA-GHG: Cheltenham, UK, 2009; p. 112. [Google Scholar]
  58. CPRM. Projeto Torres-Gravataí: Bloco Chico Lomã, Setor rio Gravataí. Relatório Final de Pesquisa. Áreas Q-1, Q-4, Q-6 e Q-7; CPRM—Companhia de Pesquisa de Recursos Minerais: Porto Alegre, Brazil, 1987. [Google Scholar]
  59. Bizzi, L.A.; Schobbenhaus, C.; Vidotti, R.M.; Gonçalves, J.H. Geologia, Tectônica e Recursos Minerais do Brasil: Texto, Mapas e SIG; CPRM: Brasilia, Brazil, 2003. [Google Scholar]
  60. Bachu, S.; Bonijoly, D.; Bradshaw, J.; Burruss, R.; Holloway, S.; Christensen, N.P.; Mathiassen, O.M. CO2 storage capacity estimation: Methodology and gaps. Int. J. Greenh. Gas Control 2007, 1, 430–443. [Google Scholar] [CrossRef]
  61. Rasool, M.H.; Ahmad, M.; Ayoub, M. Selecting Geological Formations for CO2 Storage: A Comparative Rating System. Sustainability 2023, 15, 6599. [Google Scholar] [CrossRef]
  62. Rodrigues, C.F.; Lemos de Sousa, M.J. The measurement of coal porosity with different gases. Int. J. Coal Geol. 2002, 48, 245–251. [Google Scholar] [CrossRef]
  63. Almeida, J.R.L.; Vasconcellos Rocha, H.; Medeiros Costa, H.; Santos, E.M.; Rodrigues, C.F.; Sousa, M.J.L. Analysis of civil liability regarding CCS: The Brazilian case. Mod. Environ. Sci. Eng. 2017, 3, 382–395. [Google Scholar] [CrossRef]
  64. Rodrigues, C.; Pinheiro, H.; De Sousa, M.L. Clean Energy Transition Challenge: The Contributions of Geology. In Transitioning to Affordable and Clean Energy; Constable, E.C., Ed.; MDPI: Basel, Switzerland, 2022; pp. 47–94. [Google Scholar]
  65. Xu, H.; Sang, S.; Yang, J.; Liu, H. CO2 storage capacity of anthracite coal in deep burial depth conditions and its potential uncertainty analysis: A case study of the No. 3 coal seam in the Zhengzhuang Block in Qinshui Basin, China. Geosci. J. 2021, 25, 715–729. [Google Scholar] [CrossRef]
  66. Metz, B.; Davidson, O.; De Coninck, H.C.; Loos, M.; Meyer, L. IPCC Special Report on Carbon Dioxide Capture and Storage; Cambridge University Press: Cambridge, UK, 2005. [Google Scholar]
  67. Hosseinzadeh, S.; Haghighi, M.; Salmachi, A.; Shokrollahi, A. Carbon dioxide storage within coal reservoirs: A comprehensive review. Geoenergy Sci. Eng. 2024, 241, 213198. [Google Scholar] [CrossRef]
  68. van der Meer, L.G.H. The conditions limiting CO2 storage in aquifers. Energy Convers. Manag. 1993, 34, 959–966. [Google Scholar] [CrossRef]
  69. Wu, M.; Qin, Y.; Zhang, Y.; Zhu, S.; Zhang, G.; Lan, F.; Song, X.; Feng, L.; Qin, Y. Influence Factors and Feasibility Evaluation on Geological Sequestration of CO2 in Coal Seams: A Review. ACS Omega 2023, 8, 16561–16569. [Google Scholar] [CrossRef] [PubMed]
  70. Beatson, R.K.; Cherrie, J.B.; Mouat, C.T. Fast fitting of radial basis functions: Methods based on preconditioned GMRES iteration. Adv. Comput. Math. 1999, 11, 253–270. [Google Scholar] [CrossRef]
  71. Carr, J.C.; Beatson, R.K.; Cherrie, J.B.; Mitchell, T.J.; Fright, W.R.; McCallum, B.C.; Evans, T.R. Reconstruction and representation of 3D objects with radial basis functions. In Proceedings of the 28th Annual Conference on Computer Graphics and Interactive Techniques, SIGGRAPH 2001, Los Angeles, CA, USA, 12–17 August 2001; pp. 67–76. [Google Scholar]
  72. de Oliveira, S.B.; Torresi, I.; Rossi, D.A.L. 3D structural control and spatial distribution of Zn-Pb-Cu grades in the Palmeirópolis VMS deposit, Brazil. Appl. Earth Sci. 2022, 131, 69–85. [Google Scholar] [CrossRef]
  73. de Oliveira, S.B.; Bertossi, L.G. 3D structural and geological modeling of the Kwatebala Cu–Co deposit, Tenke-Fungurume district, Democratic Republic of Congo. J. Afr. Earth Sci. 2023, 199, 104825. [Google Scholar] [CrossRef]
  74. Billings, S.D.; Beatson, R.K.; Newsam, G.N. Interpolation of geophysical data using continuous global surfaces. Geophysisc 2002, 67, 1810–1822. [Google Scholar] [CrossRef]
  75. Gomes, A.J.L. Avaliação de Recursos Geotermais da Bacia do Paraná; Observatório Nacional: Rio de Janeiro, Brazil, 2009. [Google Scholar]
  76. Pini, R.; Ottiger, S.; Burlini, L.; Storti, G.; Mazzotti, M. Sorption of carbon dioxide, methane and nitrogen in dry coals at high pressure and moderate temperature. Int. J. Greenh. Gas Control 2010, 4, 90–101. [Google Scholar] [CrossRef]
  77. Yang, R.T. Gas Separation by Adsorption Processes; Butterworth-Heinemann: Stoneham, MA, USA, 1997; Volume 1. [Google Scholar]
  78. Busch, A.; Gensterblum, Y.; Krooss, B.M.; Littke, R. Methane and carbon dioxide adsorption–diffusion experiments on coal: Upscaling and modeling. Int. J. Coal Geol. 2004, 60, 151–168. [Google Scholar] [CrossRef]
  79. Zhang, Y.; Xing, W.; Liu, S.; Liu, Y.; Yang, M.; Zhao, J.; Song, Y. Pure methane, carbon dioxide, and nitrogen adsorption on anthracite from China over a wide range of pressures and temperatures: Experiments and modeling. RSC Adv. 2015, 5, 52612–52623. [Google Scholar] [CrossRef]
  80. Dubinin, M.M. Progress in Surface and Membrane Science; Academic Press: New York, NY, USA, 1975. [Google Scholar]
  81. Devore, J.L. Probability and Statistic for Engineering and the Sciences; Brooks/Cole-Thomson Learning: Belmont, CA, USA, 2004. [Google Scholar]
  82. Ray, S.; Dey, K. Feasibility of CO2 Sequestration as a Closure Option for Underground Coal Mine. J. Inst. Eng. (India) Ser. D 2018, 99, 57–62. [Google Scholar] [CrossRef]
  83. Mazzotti, M.; Pini, R.; Storti, G.; Burlini, L. 5—Carbon dioxide (CO2) sequestration in unmineable coal seams and use for enhanced coalbed methane recovery (ECBM). In Developments and Innovation in Carbon Dioxide (CO2) Capture and Storage Technology; Maroto-Valer, M.M., Ed.; Woodhead Publishing: Cambridge, UK, 2010; Volume 2, pp. 127–165. [Google Scholar]
  84. Guo, Z.; Cao, Y.; Zhang, Z.; Dong, S. Geological Controls on the Gas Content and Permeability of Coal Reservoirs in the Daning Block, Southern Qinshui Basin. ACS Omega 2022, 7, 17063–17074. [Google Scholar] [CrossRef]
  85. Safaei-Farouji, M.; Misch, D.; Sachsenhofer, R.F. A review of influencing factors and study methods of carbon capture and storage (CCS) potential in coals. Int. J. Coal Geol. 2023, 277, 104351. [Google Scholar] [CrossRef]
  86. Unver, B. Fundamentals of 3D modelling and resource estimation in coal mining. J. Min. Environ. 2018, 9, 623–639. [Google Scholar] [CrossRef]
  87. Burger, H.; Prissang, R.; Holz, M.; Kalkreuth, W. 3D modeling of the Santa Terezinha coalfield, Brazil—Implications for estimation of the CBM potential. In Proceedings of the IAMG 2006—11th International Congress for Mathematical Geology: Quantitative Geology from Multiple Sources, Liege, Belgium, 3–8 September 2006. [Google Scholar]
  88. Reid, R.J.; Cowan, E.J. Towards quantifying uncertainties in geological models for mineral resource estimation through outside-in deposit-scale structural geological analysis. Aust. J. Earth Sci. 2023, 70, 990–1009. [Google Scholar] [CrossRef]
  89. Keating, E.H.; Hakala, J.A.; Viswanathan, H.; Carey, J.W.; Pawar, R.; Guthrie, G.D.; Fessenden-Rahn, J. CO2 leakage impacts on shallow groundwater: Field-scale reactive-transport simulations informed by observations at a natural analog site. Appl. Geochem. 2013, 30, 136–147. [Google Scholar] [CrossRef]
  90. Miocic, J.M.; Gilfillan, S.M.V.; Roberts, J.J.; Edlmann, K.; McDermott, C.I.; Haszeldine, R.S. Controls on CO2 storage security in natural reservoirs and implications for CO2 storage site selection. Int. J. Greenh. Gas Control 2016, 51, 118–125. [Google Scholar] [CrossRef]
  91. Roberts, J.J.; Wilkinson, M.; Naylor, M.; Shipton, Z.K.; Wood, R.A.; Haszeldine, R.S. Natural CO2 Sites in Italy Show the Importance of Overburden Geopressure, Fractures and Faults for CO2 Storage Performance and Risk Management; Geomechanics and Geology; Geological Society: London, UK, 2017; Volume 458, pp. 181–211. [Google Scholar] [CrossRef]
  92. Miocic, J.M.; Gilfillan, S.M.V.; Frank, N.; Schroeder-Ritzrau, A.; Burnside, N.M.; Haszeldine, R.S. 420,000 year assessment of fault leakage rates shows geological carbon storage is secure. Sci. Rep. 2019, 9, 769. [Google Scholar] [CrossRef]
  93. Alcalde, J.; Flude, S.; Wilkinson, M.; Johnson, G.; Edlmann, K.; Bond, C.E.; Scott, V.; Gilfillan, S.M.V.; Ogaya, X.; Haszeldine, R.S. Estimating geological CO2 storage security to deliver on climate mitigation. Nat. Commun. 2018, 9, 2201. [Google Scholar] [CrossRef]
  94. Roberts, J.J.; Stalker, L. What have we learnt about CO2 leakage from CO2 release field experiments, and what are the gaps for the future? Earth-Sci. Rev. 2020, 209, 102939. [Google Scholar] [CrossRef]
  95. Perera, M.S.A.; Ranjith, P.G.; Viete, D.R.; Choi, S.K. The Effects of Injection and Production Well Arrangement on Carbon Dioxide Sequestration in Deep, Unmineable Coal Seams: A Numerical Study. Int. J. Coal Prep. Util. 2012, 32, 211–224. [Google Scholar] [CrossRef]
  96. Ekneligoda, T.C.; Marshall, A.M. A coupled thermal-mechanical numerical model of underground coal gasification (UCG) including spontaneous coal combustion and its effects. Int. J. Coal Geol. 2018, 199, 31–38. [Google Scholar] [CrossRef]
  97. Pratama, E.; Ismail, M.S.; Ridha, S. Identification of coal seams suitability for carbon dioxide sequestration with enhanced coalbed methane recovery: A case study in South Sumatera Basin, Indonesia. Clean Technol. Environ. Policy 2018, 20, 581–587. [Google Scholar] [CrossRef]
  98. Asif, M.; Junussov, M.; Longinos, S.; Hazlett, R.; Satibekova, S. CO2 storage capacity of coal seams: A screening and geological review of carboniferous coal formations of Kazakhstan. Int. J. Coal Sci. Technol. 2025, 12, 18. [Google Scholar] [CrossRef]
  99. Kalkreuth, W.; Sherwood, N.; Cioccari, G.; Corrêa da Silva, Z.; Silva, M.; Zhong, N.; Zufa, L. The application of FAMM (Fluorescence Alteration of Multiple Macerals) analyses for evaluating rank of Paraná Basin coals, Brazil. Int. J. Coal Geol. 2004, 57, 167–185. [Google Scholar] [CrossRef]
  100. Araújo, C.V.; Corrêa da Silva, Z.C.; Rodrigues, R. Petrographic and geochemical study of coals from the Santa Terezinha Coalfield, Rio Grande do Sul, Brazil. Rev. Lat. Am. Geoquimica Org. 1995, 1, 28–45. [Google Scholar]
  101. Santos, R.V.; Dantas, E.L.; Oliveira, C.G.d.; Alvarenga, C.J.S.d.; Anjos, C.W.D.d.; Guimarães, E.M.; Oliveira, F.B. Geochemical and thermal effects of a basic sill on black shales and limestones of the Permian Irati Formation. J. S. Am. Earth Sci. 2009, 28, 14–24. [Google Scholar] [CrossRef]
  102. Spacapan, J.B.; Palma, J.O.; Galland, O.; Manceda, R.; Rocha, E.; D’Odorico, A.; Leanza, H.A. Thermal impact of igneous sill-complexes on organic-rich formations and implications for petroleum systems: A case study in the northern Neuquén Basin, Argentina. Mar. Pet. Geol. 2018, 91, 519–531. [Google Scholar] [CrossRef]
  103. Bicca, M.M.; Kalkreuth, W.; Rosa, A.L.; Simão, G.; Levandowski, J.; Silva, T.F.; Anzolin, H.M. Effect of diabase intrusion on the CBM-bearing coalfields of southern Brazil: A review. J. S. Am. Earth Sci. 2022, 119, 104041. [Google Scholar] [CrossRef]
  104. Araújo, L.L.d.; Barbosa Curto Ma, J.; Yokoyama, E. Serra Geral Group plumbing system and 3D geological framework in Morungava region, southern Paraná–Etendeka LIP (Brazil): Combining 3D geologic and magnetic models. J. S. Am. Earth Sci. 2023, 132, 104660. [Google Scholar] [CrossRef]
  105. Araújo, L.L.d.; Curto Ma, J.B.; Yokoyama, E.; Victoria, A.M. Serra Geral Group plumbing system and 3D geological framework in Morungava region, southern Paraná-Etendeka LIP (Brazil): Evidence from borehole, geochemical, and petrophysical data. J. S. Am. Earth Sci. 2024, 133, 104678. [Google Scholar] [CrossRef]
  106. ANEEL-SIGEL. Banco de dados do Sistema de Informações de Geração da ANEEL. Available online: https://sigel.aneel.gov.br/portal/home/ (accessed on 13 May 2023).
  107. Eggleston, H.S.; Buendia, L.; Miwa, K.; Ngara, T.; Tanabe, K. IPCC Guidelines for National Greenhouse Gas Inventories; IGES: Tokyo, Japan, 2006. [Google Scholar]
Figure 1. Regional map of the Paraná Basin with the distribution of coal deposits (after [55]) and the study area limits. The location of the drillholes and depth limits of the coal-bearing zone are shown in the inset.
Sustainability 17 02856 g001
Figure 2. Stratigraphic reference chart of Late Carboniferous/Permian of the Paraná Basin in southern and southeastern Brazil, highlighting the Rio Bonito Formation (modified from Holz et al. [52]).
Sustainability 17 02856 g002
Figure 3. Geological section showing the coal-bearing zone and the coal layers thickness and lateral extension in the Chico Lomã deposit after CPRM [58]).
Sustainability 17 02856 g003
Figure 4. Flowchart summarizing the main methodology steps.
Sustainability 17 02856 g004
Figure 5. Digital terrain model of the study area with drillholes in a 3D view. Vertical exaggeration 5×.
Sustainability 17 02856 g005
Figure 6. Bounding box of the 3D model with drillholes (in blue) and modeled coal-bearing zone volume in dark gray. Vertical exaggeration 5×.
Sustainability 17 02856 g006
Figure 7. CO2 sorption isotherm for the Santa Terezinha coal sample on a raw basis measured at 45 °C from Weniger et al. [28], with the minimum and maximum pressure values used in this work.
Sustainability 17 02856 g007
Figure 8. Plan map of the study area with the drillholes (black dots) and depth limits of the coal-bearing zone, based on CO2 sorption isotherm data. The map limits correspond to the study area rectangle in red in Figure 1.
Sustainability 17 02856 g008
Figure 9. Sequential steps to outline the volume of the coal-bearing zone in three dimensions, based on the limits defined by the CO2 isotherm. (A) Definition of the depth limits. (B) Definition of the coal zone volume. (C) Definition of the coal volume within the best adsorption limit. The boundaries of the images correspond to the red rectangle of the study area in Figure 1. Vertical exaggeration 10x.
Sustainability 17 02856 g009
Table 1. Comparative parameters between the adjacent Chico Lomã and Santa Terezinha coal deposits [59].
DepositCalorific Value (kcal/kg) Carbon (%) Ash (%) Sulfur (%)
Santa Terezinha 3800–4300 28.0–30.0 41.0–52.5 0.5–1.9
Chico Lomã 3700–4500 27.5–30.5 40.0–56.2 0.6–2.0
Table 2. Used parameters in the CO2 storage capacity calculation of the Chico Lomã coal deposit.
ParameterValuesSource
A h 2320 million m3This study
C s 12.50 m3/t and 14.55 m3/t[28]
ρ C O 2 1.87 kg/m3[60]
E c o a l 21% to 48%[46]
ρ c o a l 2.05 kg/m3[55]
Table 3. Total theoretical CO2 storage capacity in the Chico Lomã coal deposit, in accordance with different coal seam efficiency factors from Goodman et al. [46].
P10 (21%)P50 (37%)P90 (48%)
27.2 Gt47.8 Gt62.2 Gt
Disclaimer/Publisher’s Note: The statements, opinions and data contained in all publications are solely those of the individual author(s) and contributor(s) and not of MDPI and/or the editor(s). MDPI and/or the editor(s) disclaim responsibility for any injury to people or property resulting from any ideas, methods, instructions or products referred to in the content.

