Article

Towards Sustainability: How Does Climate Policy Uncertainty Affect Regional Green Innovation in China?

Department of Economics, University of Bath, Bath BA2 7AY, UK
*
Author to whom correspondence should be addressed.
Sustainability 2025, 17(7), 2857; https://doi.org/10.3390/su17072857
Submission received: 5 March 2025 / Revised: 19 March 2025 / Accepted: 21 March 2025 / Published: 24 March 2025

Abstract

:
So far, the existing literature has examined the impact of climate policy uncertainty (CPU) on the green innovation (GI) of listed firms. However, there is still a lack of research on how climate policy uncertainty affects regional innovation compared to its impact at the firm level. In fact, green innovation is not solely driven by listed firms. Unlisted firms, government, and government-affiliated scientific research institutions also play a crucial role in the research, development, and promotion of green technologies. This paper examines the impact of climate policy uncertainty on green innovation based on panel data for 30 provinces in China from 2013 to 2021 using a fixed effects model. The study finds that moderate climate policy uncertainty promotes regional green innovation. However, further analysis reveals that when a region’s climate policy uncertainty is excessively high, it instead hinders green innovation. The mechanism analysis shows that climate policy uncertainty encourages government investment in innovation while constraining firms’ investment in innovation. Additionally, this paper finds that regional financial development can alleviate firms’ financing constraints, thereby mitigating the negative impact of climate policy uncertainty on firms. Financial development enhances the role of climate policy uncertainty in promoting regional green innovation. The findings of this paper provide a basis for the government if it designates climate policies to promote the realization of green innovation. At the same time, this study also puts forward policy recommendations to improve financial policies and strengthen government support in order to promote the process of green technology research and development, marketization, and industrialization, and to promote the green transformation and sustainable development of China’s economy.

1. Introduction

Climate change, driven by global warming, has emerged as a major factor influencing human society’s development [1]. The increasing frequency of extreme weather events worldwide has drawn growing attention to the extensive impact of climate change on ecosystems, economic progress, and human well-being. Tackling climate change and promoting environmental sustainability are among the most urgent challenges for humanity, directly affecting our survival and quality of life [2]. However, this phenomenon, coupled with the growing pressures of economic and social development, has further complicated climate and environmental governance [3]. Although governments have introduced various policies to address climate change and promote sustainable development, frequent policy changes can create significant challenges [4].
China places great importance on climate change and actively fulfills its international responsibilities in global climate governance. In September 2020, China announced its commitment to reaching peak carbon emissions by 2030 and achieving carbon neutrality by 2060. Chinese climate policy has been evolving under the impetus of the ‘carbon neutral’ goal, but climate policy uncertainty (CPU) is aggravated by the dynamics of policy adjustments, the variability of local governments’ implementation, and the uncertainty of international cooperation. The carbon trading mechanism is still being improved, and issues such as carbon pricing and the allocation of emission allowances remain variable. In addition, different regions have different implementation strengths in terms of industrial restructuring and energy transformation, which may lead to bias in the effect of policy implementation. In addition, the periodic turnover and irregular transfers of local officials lead to changes in the local political environment and interruptions in policy implementation, making them one of the primary sources of policy uncertainty risks [5]. When a new local official takes office, they may choose to adjust or even overturn policies set by their predecessors, leading to a lack of stability in policy execution. This can lead to inefficiencies in policy enforcement and create uncertainty for businesses, investors, and other stakeholders who rely on a predictable policy environment. Furthermore, as local officials are often evaluated based on short-term performance metrics, they may prioritize quick results over long-term policy goals, exacerbating policy volatility.
China has long relied on a crude development model represented by high inputs of resources, high consumption of energy, high emissions of pollution, and other salient features, and this development model is destined to be unsustainable [6]. China’s economic system is at a critical juncture, transitioning between development models and shifting growth momentum. Achieving high-quality economic growth requires not only focusing on the speed of economic expansion but also placing greater emphasis on its overall quality. Green innovation (GI) is undoubtedly a key driver of China’s sustainable economic development [7]. The core objective of GI is to achieve sustainable development, focusing on economic benefits as well as social and environmental benefits, with the fundamental aim of reducing resource consumption and environmental pollution through innovation. In addition, GI helps save resources, improve the environment, reduce energy consumption, and enhance corporate performance by boosting environmental reputation and obtaining support from green policies [8]. Enterprises establish technological barriers and first-mover advantages through GI, rapidly capturing markets and limiting the entry of competitors. By proactively developing and adopting green technologies in order to remain competitive in the policy environment, such proactive innovation can help to enhance a company’s image and credibility, earning it trust in the marketplace as well as recognition from a wider range of consumers and partners, and increasing its brand value and market share.
Climate risk is essentially a carbon risk, climate policy tends to target carbon emissions, and the focus of climate policy should be on helping to find ways to reduce carbon emissions. GI, as an important way to help the economy undergo a green transformation and reduce carbon emissions, is inevitably affected by changes in climate policy. As China’s understanding of technological innovation gradually deepens, a series of development policies, such as “Rejuvenating the Country through Science and Education” and “Innovative Country”, have become national strategies. These policies highlight the key role of the government in the field of technological innovation and have a significant impact on various innovation entities.
So far, the existing literature has primarily examined the impact of CPU on the GI of listed firms [9,10,11], and further compared how this impact varies across different types of listed firms [12]. However, there is still a lack of research on how CPU affects regional innovation compared to its impact at the firm level. In fact, GI is not solely driven by listed firms. Unlisted firms, government, and government-affiliated scientific research institutions also play a crucial role in the research, development, and promotion of green technologies. Additionally, the financial investment required for GI does not come exclusively from enterprises but also significantly depends on government financial support and policy guidance. Therefore, to fully understand the impact of CPU on regional GI, it is essential to comprehensively analyze the investment behaviors of both governments and enterprises and examine their decision-making under different policy environments, so as to reveal how CPU shapes the pattern and evolution path of regional GI.
The contributions of this study are as follows. This study contributes to the literature by shifting the focus from firm-level to regional-level analysis of climate policy uncertainty and green innovation, offering a broader perspective on how policy fluctuations shape innovation. Unlike previous studies that only assume a linear relationship, this paper identifies a nonlinear inverted U-shaped effect, where moderate climate policy uncertainty stimulates innovation by prompting proactive adaptation and government support, but excessive uncertainty hinders it by increasing financial constraints and investment risks. Furthermore, this paper uncovers the pathways through which climate policy uncertainty operates—government-led innovation investment can partially offset the decline in enterprise R&D. Additionally, this paper introduces financial development and the dominance of state-owned enterprises (SOEs) as key moderating factors, showing that well-developed financial systems and government-backed enterprises can mitigate CPU’s negative effects.
This paper focuses on whether CPU promotes or inhibits regional green innovation, and further analyzes its linear and nonlinear relationship to reveal whether moderate uncertainty may incentivize innovation and whether excessive uncertainty may inhibit innovation. In addition, the paper delves into the dual mechanism by which CPU affects green innovation, i.e., government-led investment in innovation may drive innovation in the short run, while firms’ investment in autonomous innovation is hampered by uncertainty, leading to impaired innovation in the long run. The paper also examines the moderating role of financial development and the share of state-owned enterprises (SOEs) to analyze how the institutional environment affects the relationship between CPUs and green innovation. In order to more comprehensively measure the degree of marketization of green innovation, this paper introduces technology market turnover as a complementary indicator, breaking through the limitations of measuring green innovation by the number of patents, and paying more attention to the market acceptance and economic contribution of green technologies. Ultimately, this study hopes to provide effective recommendations for policymakers to ensure the effectiveness of innovation incentives while coping with climate policy adjustments, and to prevent policy uncertainty from hindering the marketization and sustainable development of green technologies.
The remainder of this study is structured as follows. Section 2 reviews the relevant literature and presents the research hypotheses. Section 3 presents the research design. Section 4 reports the empirical results. Section 5 discusses the results. Section 6 draws conclusions.

2. Literature Review and Theoretical Hypothesis Development

2.1. Literature Review

The concept of policy uncertainty was first explored by Baker et al. [13] who introduced an index-based approach to measure economic policy uncertainty by analyzing the frequency of articles discussing economic policy in major newspapers. Later, the same methodology was applied to create other indices, including those for CPU, trade policy uncertainty, and others [14,15]. CPU refers to the ambiguity and unpredictability surrounding climate-related policies, including regulatory measures, incentives, and long-term climate goals [16,17]. CPU has increased as a result of the evolution of climate change and the occurrence of extreme weather events [18]. Research based on U.S. survey data by Stroebel and Wurgler [19] indicated that CPU adversely affects corporate financing and operations. Similarly, Ilhan et al. [20] found that CPU, based on U.S. carbon emissions and options market data, directly impacts investors’ expectations for high-carbon firms, leading to tail risks and increased financing costs for these companies. Climate policy instability can contribute to energy price volatility, impacting the expectations of businesses and consumers and resulting in market uncertainty [20,21]. Hoang [22] found that the unpredictability of future climate policies compels high-emission U.S. firms to adopt a wait-and-see approach, leading to reduced long-term investments due to regulatory uncertainty. Similarly, Sun et al. [23] found that U.S. CPU significantly inhibits GI among Chinese firms, as increased uncertainty tends to discourage the development of new environmentally-friendly technologies. However, on the other hand, Gavriilidis [24] presented an opposing view, suggesting that heightened CPU can actually promote green investments and encourage firms to engage in clean energy R&D. This perspective implies that, under certain circumstances, uncertainty in policy could act as a catalyst for firms to proactively invest in reducing their environmental impact, perhaps as a hedge against potential future regulations. In line with this, Bai et al. [9] argued that the considerable CPU in China has prompted an increase in governmental environmental regulations, which, in turn, has compelled companies to boost their investments in R&D, particularly in the area of green technology. Bai et al. [9] found that the uncertainty of climate policy may lead to higher production costs in the short term; enterprises choose to cope with this uncertainty by increasing green R&D investment, strengthening green technological transformation, and upgrading old production equipment, so as to enhance their GI capacity in order to occupy a favorable position in future market competition. Olasehinde-Williams et al. [25] thought that uncertain climate policies have led investors to pay more attention to sustainable development and environmental considerations. This market-driven approach makes GI key to gaining competitive advantage and expanding market share [26]. Tian and Li [27] found that rising CPU can lead to a reduction in carbon emissions in many parts of China, which contributes to mitigating environmental degradation. Shang et al. [28] found that, in the short term, CPU reduces the demand for non-renewable energy in the United States. However, in the long term, it has a positive impact on the demand for renewable energy, suggesting a shift towards cleaner energy sources as firms and consumers adapt to an uncertain policy landscape.
GI is of paramount importance to China’s sustainable development [29]. In the face of multiple challenges, such as resource constraints, environmental pollution, and global climate change, GI provides an effective way to balance economic growth and environmental protection [30,31]. Through technological innovation and breakthroughs, GI can help to reduce pollutant emissions, improve energy efficiency, and conserve resources, thereby achieving harmonious economic and ecological development [32]. Existing studies have largely analyzed the factors influencing GI in China through two predominant perspectives. The first perspective is grounded in institutional theory, focusing on the external pressures and supports that shape GI. This line of research emphasizes the role of environmental regulation, including climate policy, as an institutional pressure that drives firms toward sustainable practices, as well as the importance of supportive mechanisms such as green financial policies, which facilitate access to funding and incentives for green projects [33,34]. This internal view recognizes that organizational culture, managerial expertise, and innovation capacity are essential components in the pursuit of green development [35]. These institutional factors are seen as crucial motivators that encourage firms to adopt environmentally friendly technologies and processes in response to regulatory requirements and financial support structures designed to foster a greener economy. Climate risk, inherently tied to carbon emissions, plays a central role in shaping both regulatory environments and organizational strategies [36]. Xu et al. [37] pointed that GI becomes a critical mechanism for achieving climate-related targets, as it encompasses the development and adoption of technologies and processes that contribute to environmental sustainability and carbon emission reductions. The second perspective shifts the focus inward, examining the internal characteristics of firms that influence their ability and willingness to pursue GI. Studies in this area have highlighted various internal determinants, such as the availability of financial resources, corporate governance structures, leadership attitudes toward sustainability, and the capabilities of research and development (R&D) teams [38,39,40]. These factors determine whether a firm can effectively respond to both internal ambitions and external pressures to innovate in a way that reduces environmental impact.
From the above literature review, it can be seen that although the existing literature has examined the impact of CPU on the GI of listed firms, there is still a lack of research on how CPU affects regional innovation. Additionally, existing literature primarily focuses on the linear relationship when analyzing the impact of CPU on GI, often overlooking potential nonlinear effects, without considering that its influence may vary at different intensities of uncertainty.

2.2. Theory and Hypothesis Development

How does CPU affect GI in the region? The realization of GI relies on the joint investment of enterprises and governments, with enterprises undertaking market-driven innovation and governments promoting the construction of innovation environments through financial support and policy guidance. In the context of CPU, changes in innovation decision-making by firms and governments directly determine the level and direction of regional GI.
An in-depth exploration of government and firm innovative investment behavior in an environment of climate policy certainty first requires a systematic analysis of the sources of CPU in China. Although China’s climate policy has maintained stability in terms of long-term goals, including the clearly stated ‘dual-carbon’ target of carbon peaking by 2030 and carbon neutrality by 2060, uncertainties persist in policy adjustments and implementation. Against the backdrop of China’s ‘dual-carbon’ targets, China’s green policies as a whole tend to be strengthened in order to promote emissions reduction and sustainable development [41]. However, under this long-term goal, there is still some uncertainty and room for adjustment in terms of when and how to reach the peak, as well as the distribution of carbon emission responsibilities among industries and regions of China. There are large differences in technology levels, carbon intensity, and industrial upgrading capabilities among industries, making it difficult to plan a uniform carbon peaking path. In addition, due to China’s vast territory, the different levels of economic development, industrial structure, and energy structure of different regions, resulting in a carbon emissions reduction path, is difficult to cut across the board, the implementation of policies varies from place to place, some regions have a strong industrial transformation capacity, can promote the process of carbon emissions reduction faster, while the traditional energy industry accounted for a high proportion of the region in the process of energy transition faces more challenges, thus exacerbating the uncertainty.
At the same time, when implementing carbon emission reduction policies, local governments often need to seek a balance between multiple objectives, such as economic growth, energy security, and social stability, so the adaptive adjustment of policies has become an inevitable trend [42]. China is still in the process of industrialization and urbanization, and the stage of economic development determines that carbon emission reduction policies cannot be implemented at the expense of economic growth and employment stability, especially when the downward pressure on the economy increases, and the pace of policies may be adjusted accordingly [17]. When economic growth slows down or external demand shrinks, the government may appropriately adjust restrictions on energy-consuming industries to ensure short-term economic growth and employment stability. And when the economic environment improves and the optimization of the industrial structure accelerates, the policy may be tightened again to promote the implementation of emission reduction targets with stricter standards. Such adaptive policy adjustments reflect the government’s trade-off between short-term economic fluctuations and long-term low-carbon development strategies, and determine that climate policy may be characterized by phased adjustments in the course of implementation.
Looking at the sources of CPU described above, uncertainty does not exclusively imply risk, but can also lead to flexibility, adaptation, and new opportunities. Traditionally, policy uncertainty is often seen as an unfavorable factor affecting market stability and corporate decision-making, especially in long-term investment, industrial planning, and corporate strategic layout, where too much uncertainty may lead to wait-and-see market players and destabilizing capital flows [43]. However, policy uncertainty also has a positive effect to a certain extent, as it implies that policies have room for adjustment and can be optimized in accordance with changes in economic development, scientific, and technological progress, and the international environment, so as to find a more suitable development policy in the course of continuous evolution [44].
On the other hand, a large part of the uncertainty about local climate policy in China also stems from the change of local officials. The formulation and implementation of local policies are heavily influenced by the characteristics of individual officials who occupy key positions of power [45]. Local government officials play a crucial role in the formulation and execution of policies at the regional level [46]. Frequent changes in local leadership further complicate the situation, as each new official may bring their own priorities and preferences, often leading to the abandonment of existing policies and the introduction of new initiatives, which contributes significantly to CPU. The current political promotion system of China further strengthens the incentives for new officials to prioritize economic development [47]. The promotion of local officials depends to a large extent on their performance during their term of office. During their tenure, these officials often see expanding the scale of investment as the most practical approach to improve local economic indicators, which helps boost regional GI efforts. In 2012, the Chinese government proposed to implement an innovation-driven development strategy. China’s appraisal system for local officials determines the importance local governments place on science and technology innovation. Traditionally, local governments mainly conduct performance appraisals around GDP growth, investment attraction, and infrastructure construction, but with the country’s emphasis on innovation-driven development, the weight of innovation appraisals in the appraisal system of local officials has gradually increased. Against this backdrop, CPU is often accompanied by increased China local government investment in innovation. Therefore, this paper proposes Hypotheses 1 and 2:
Hypotheses 1. 
CPU promotes regional GI.
Hypotheses 2. 
The higher the CPU, the higher the local government’s investment in innovation.
Prospect theory suggests that firms, when faced with high uncertainty, tend to avoid potential losses rather than actively pursue gains, thus reducing investment or postponing major capital expenditure decisions [48]. Due to the complexity of climate issues and their long-term nature, policy adjustments are often subject to greater uncertainty, which exposes enterprises to higher risks and unpredictability in their investment decisions [23]. In an economic environment that is highly dependent on macro policies, firms’ expectations of future market and policy directions directly affect their investment behavior. When the policy direction is unpredictable, enterprises tend to adopt more cautious strategies to reduce potential losses [43]. The GI output of enterprises depends on their investment in innovation. As firms’ investment behavior is highly dependent on macro policies, higher uncertainty may weaken the stability of firms’ expectations of future markets compared to a stable policy system, which in turn affects their resource allocation and investment strategies. When CPU rises, firms’ expectations of the future policy environment and market demand become more ambiguous, leading them to adjust their investment strategies, preferring to remain on the sidelines or reduce long-term, highly irreversible capital expenditures to avoid possible policy risks. In addition, policy instability may also lead to increased market volatility, further raising firms’ expectations of uncertainty about future cash flows, causing them to favor increasing cash reserves over expanding investments. In addition, the implementation of climate policies has the potential to enhance firms’ financing constraints and increase their financing costs, thereby affecting their investment behavior. Commercial banks are the main source of external financing for enterprises, and when uncertainty rises, commercial banks usually increase loan loss provisions and reduce the supply of high-risk loans for the sake of preventing and avoiding risks, which will increase the cost and difficulty of enterprise loans and bring higher financing costs to enterprises. CPU therefore reduces firms’ investment in innovation.
CPU can inhibit regional GI if it is too high and if CPU discourages firms from investing in innovation more than it increases government investment in innovation. Therefore, this paper proposes Hypotheses 3 and 4:
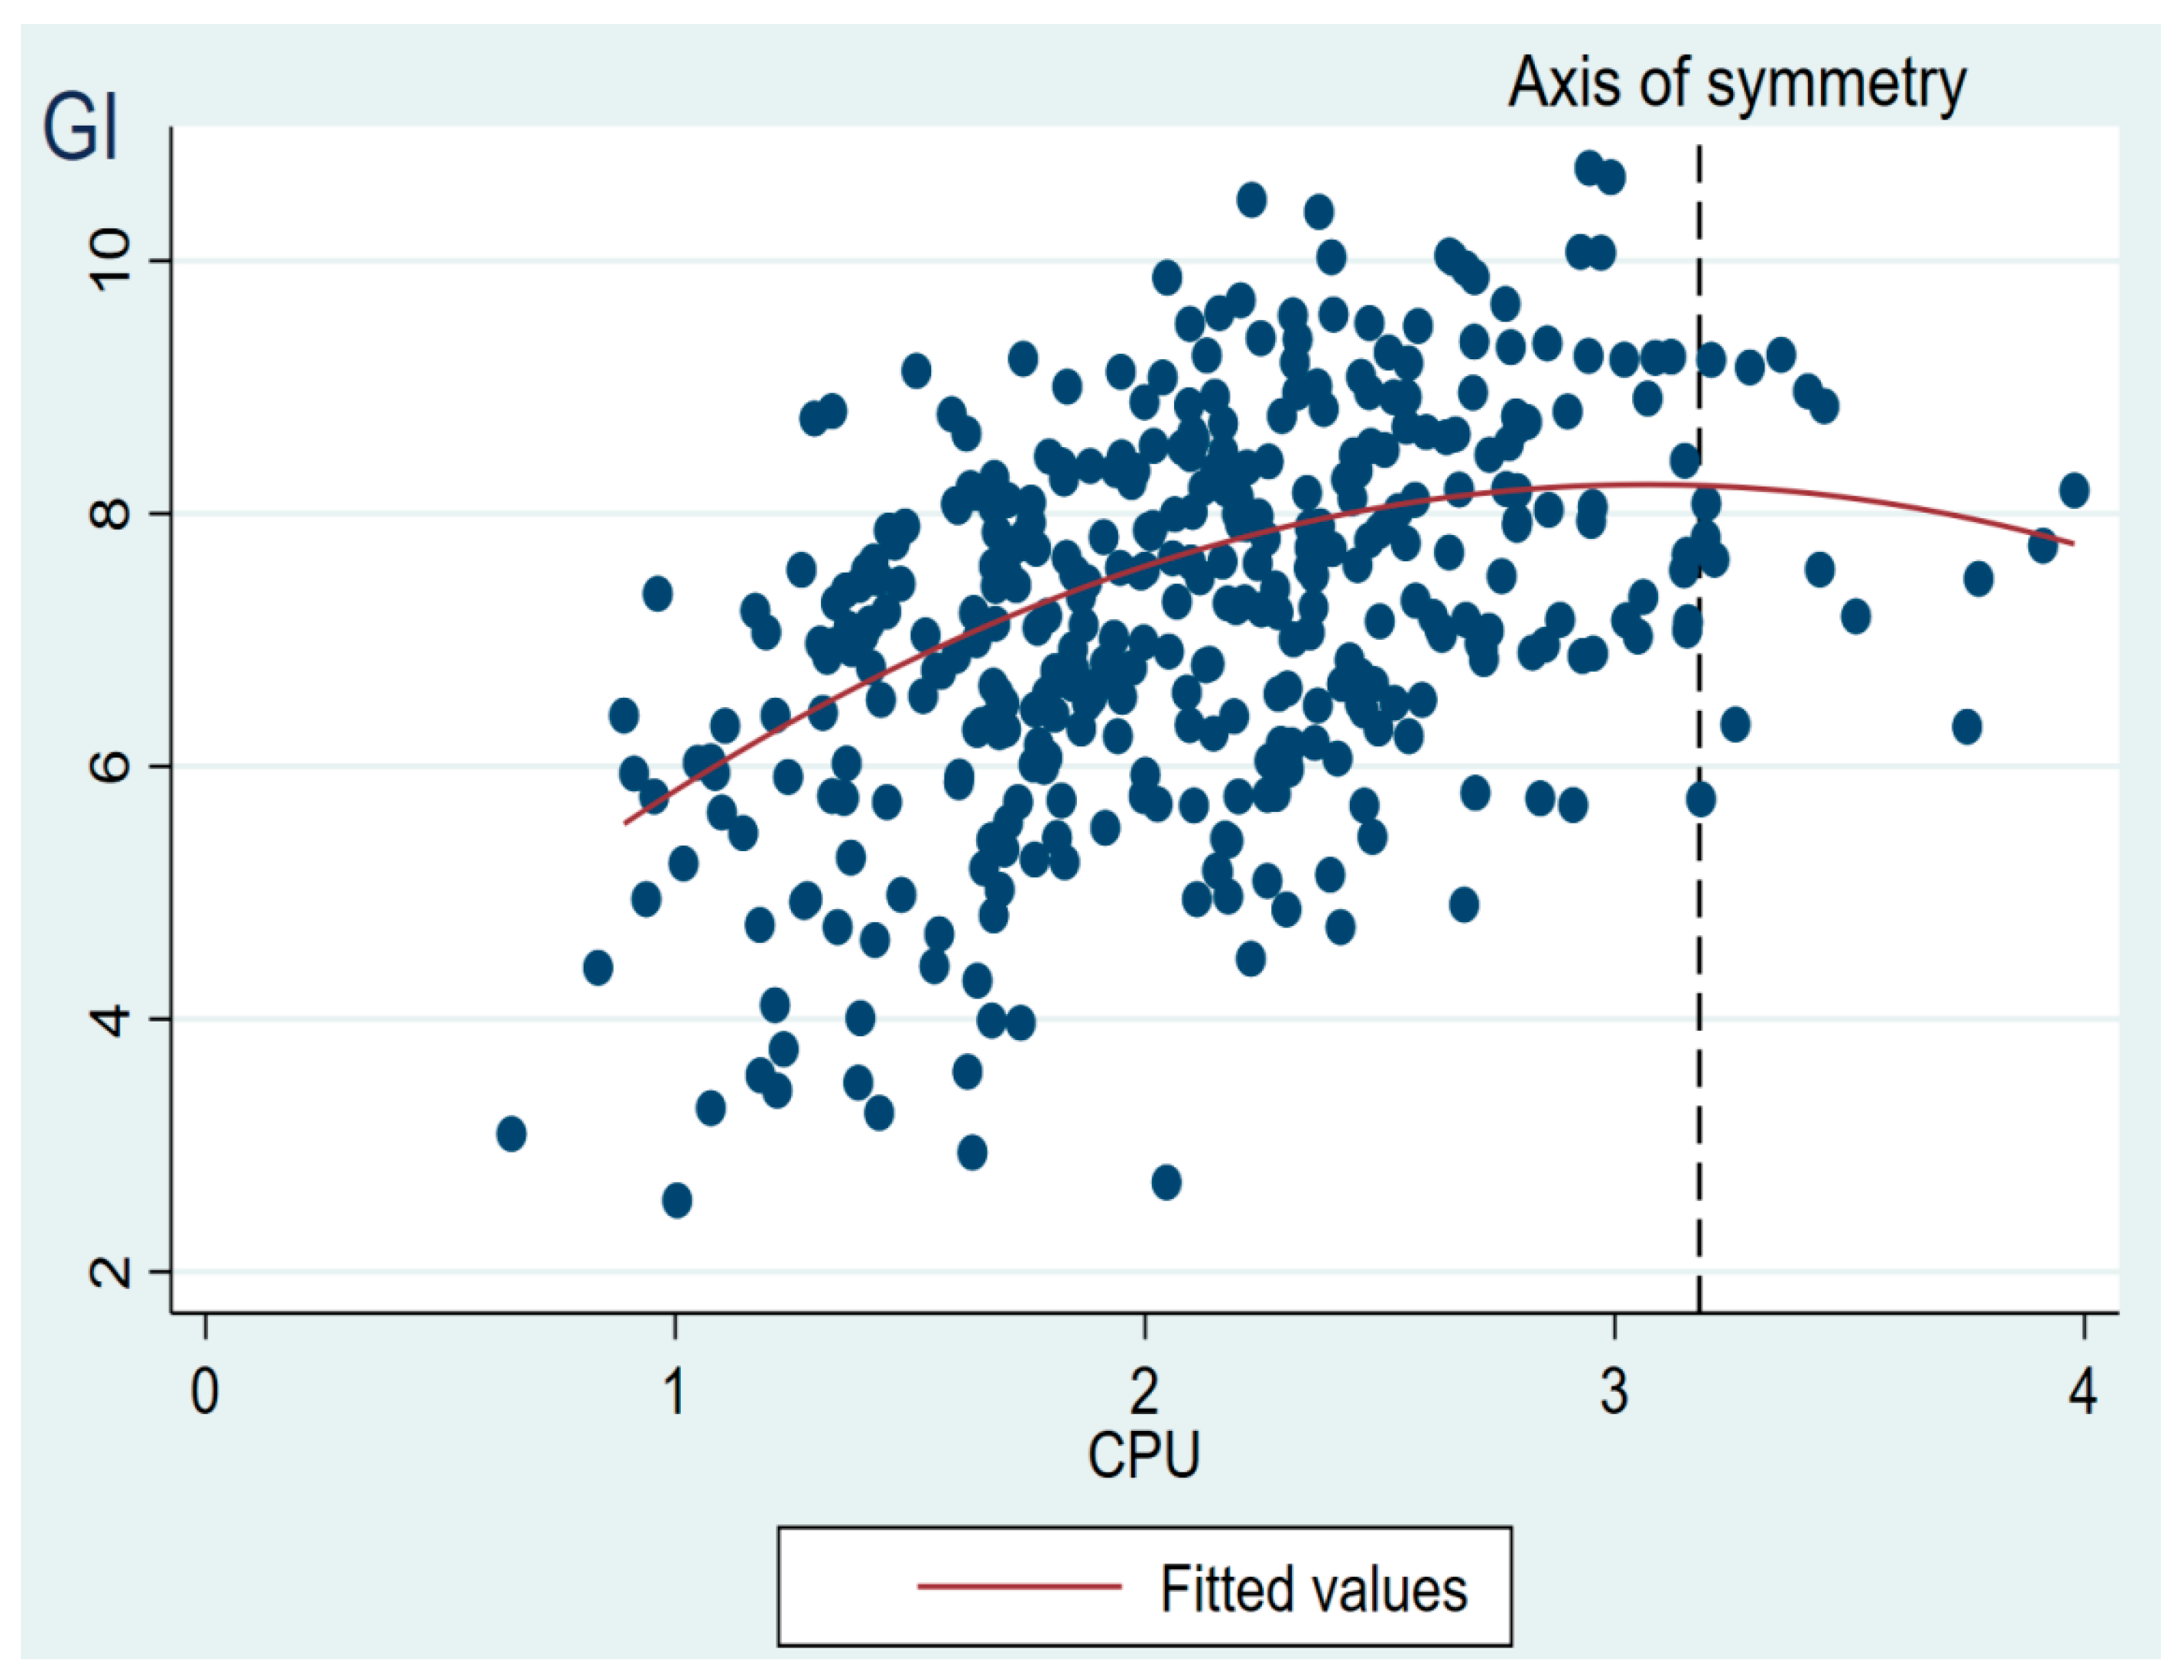
Hypotheses 3. 
Regional GI is promoted when CPU is low, and can be hindered if CPU is too high.
Hypotheses 4. 
CPU hinders firms’ investment in innovation.
Based on the financial deepening theory proposed by Shaw [49] and McKinnon [50], improving the financial system can increase the efficiency of capital allocation and help promote social and economic development. At the micro-firm level, CPU can lead to an increase in investment risk for firms. Innovation investments, however, are generally characterized by high risk, low upfront returns, and long lead times, which makes it possible for firms to suffer from external financing constraints when investing in innovation [51]. In this scenario, when the cost of financing firms’ investment in innovation is high, firms may have less to gain from innovation and thus refrain from making active investments in innovation [52]. However, if firm investment and financing constraints are relaxed and the cost of financing firms is low, the incentive for firms to make innovative investments increases. Firms’ financing constraints are not only influenced by their own factors (e.g., size, growth, profitability, and asset structure), but also depend to a large extent on the level of financial development in the region [53]. Regional financial development can alleviate the financing constraints of enterprises and promote their investment in innovation and R&D through various ways. Firstly, as regional financial instruments continue to diversify, and the number of financial institutions increases, the capacity of regional financial systems to channel local savings into productive investments is significantly strengthened. This progression enhances the overall availability of financial resources within the region, thereby improving enterprises’ access to funding and alleviating their financing constraints [54]. Secondly, the scale effect enhances financial institutions’ ability to manage credit risks and process information. As a result, the cost and risk of fund supply are reduced, information asymmetry between borrowers and lenders is mitigated, and the financing costs and constraints faced by enterprises are effectively alleviated. Financial development can weaken the inhibitory effect of CPU on enterprise R&D investment to provide stronger support for regional GI, thus promoting GI and enabling the overall GI capacity of the region to be continuously enhanced. Therefore, this paper proposes Hypothesis 5:
H5. 
Financial development enhances the promotion of CPU on regional GI.
China’s market economy system is a mixed economic model in which state-owned enterprises (SOEs) and private enterprises develop together [55]. SOEs are funded or controlled by the state and directly or indirectly managed by the government, and their business objectives include not only profitability, but also the task of carrying out government policy orientations, such as low-carbon development and green transformation. Compared to the private sector, SOEs enjoy more stable resources in terms of financial support, tax incentives, subsidies, and policy loans, and their sources of funding are relatively abundant even in the face of policy uncertainty [56]. In addition, SOEs usually have stronger technology R&D capabilities and complete industry chain integration advantages, and can better cope with short-term impacts brought by policy changes [9]. As a result, SOEs can still maintain stable investment in the face of increased CPU, while private firms may scale back innovation investment due to financing constraints and policy fluctuations. Therefore, the higher the share of SOEs, the less adverse impact CPU has on firms’ GI. This paper proposes Hypothesis 6:
H6. 
The greater the dominance of SOEs over the economy, the greater the contribution of CPU to regional GI.

3. Research Methodology

3.1. Sample Selection and Data Sources

This paper selects 30 provinces in mainland China from 2009 to 2021 as the research sample, including all provinces in mainland China except Tibet. Tibet is not included due to its geographic and economic peculiarities, which are also quite different from other provinces and some data are seriously missing. To ensure a balanced panel data, this paper excludes Tibet, as an unbalanced panel could affect the comparability and robustness of the results. At the end of 2012, China formally proposed the implementation of the innovation-driven development strategy, which marks a major shift in China’s development model and elevates innovation to an unprecedented strategic level. Innovation is no longer just an auxiliary means for industrial upgrading, but becomes the core engine driving economic growth and an important element in the assessment of officials. Based on this important policy node, this paper chooses 2012 as the starting time of the data. The data used in this paper are macro data macro climate policy index from Ma et al.’s [57] study; the rest of the variables are from the website of the China Bureau of Statistics, China Statistical Yearbook, and the website of the State Intellectual Property Office of China.

3.2. Definition of Key Variables

This paper uses the provincial-level climate policy uncertainty index constructed by Ma et al. [57]. Specifically, the climate uncertainty index is based on analyzing news articles from six major Chinese newspapers, namely People’s Daily, Guangming Daily, Economic Daily, Global Times, Science and Technology Daily, and China News Service. The MacBERT deep learning model is used to evaluate and classify the news texts to extract content related to CPU. This model does not depend on predefined dictionaries, allowing for more accurate extraction of information. The resulting data are then standardized to calculate the annual provincial-level indices, reflecting the proportion of news articles discussing CPU for each province. The index provides a comprehensive picture of the trend of CPU over time, and shows a clear upward trend, indicating the increasing policy uncertainty in China’s response to climate change.
Green innovation (GI): Referring to the method of Xiang et al. and Liu et al. [52,58], this study adopts the number of green patents granted to measure GI. Data on green patents are obtained from the China National Intellectual Property Administration (CNIPA). Green patents are identified using the International Patent Classification provided by the World Intellectual Property Organization (WIPO). To enhance comparability and stability, the aggregated number of green patent applications is logarithmic, which helps mitigate heteroskedasticity.

3.3. Model Construction

The benchmark regression model in this paper is set as follows:
GIit = β0 + β1CPUit + γControlit + μ + ε+ eit
Equation (1) is a linear model that does not account for the potential nonlinear effects of CPU on GI. However, CPU may have a complex impact on GI. As described in the Hypothesis 3, we also need to consider that when CPU is increasing, the result of CPU affecting GI may change. To address this, this paper extends the baseline model by adding a quadratic term for CPU, constructing a quadratic equation to capture the potential nonlinear effects of CPU on GI. By including this quadratic term, we aim to identify whether there is an “inverted U-shaped” or “U-shaped” relationship, allowing for a more comprehensive understanding of the multifaceted influence of CPU on corporate innovation behavior:
GIit = β0 + β1CPUit + β2CPU2it + γControlit + μ + ε + eit
Financial development may play a moderating role. In this paper, based on Equation (1), the following model is constructed:
GIit = β0 + β1CPUit + β2Finit + β3CPUit × Finit + γControlit + μ + ε + eit
The dominance of state-owned enterprises in the economy may play a moderating role. In this paper, based on Equation (1), the following model is constructed:
GIit = β0 + β1CPUit + β2Dsoit + β3CPUit × Finit + γControlit + μ + ε + eit
where i represents i province, t represents t year. GI represents green innovation. CPU represents the climate policy uncertainty. Fin represents financial development. Dso represents the dominant role of state-owned enterprises. Control represents a set of control variables.
Since the concept of financial deepening was introduced, a large body of literature has used “total financial assets as a percentage of GDP” to measure the level of financial deepening or monetization in a region [50,59,60]. Following the literature, this paper uses the financial deepening rate indicator (FD), which is the ratio of loan balances to GDP, to measure the financial development of provinces. This indicator is particularly relevant in the context of innovation, as a well-developed financial system facilitates access to credit, reduces funding constraints, and enhances firms’ ability to invest in research and development (R&D). By capturing the scale of finance in each province, the financial development provides insights into the role of finance in fostering technological advancement and supporting innovation-driven growth.
This paper uses the ratio of total assets of state-owned enterprises (SOEs) to total assets of private firms to measure the degree of dominance of SOEs over the economy. The size of total assets is an important indicator of a firm’s market influence; larger assets usually mean a higher share of the market. The higher the proportion of SOEs’ total assets relative to the total assets of private firms, the stronger the role of SOEs in economic activity. The size of total assets is an important indicator of a firm’s market influence, and the greater the assets of a firm, the higher its market share.
Referring to the practice of Irfan et al. [61], Meng and Zhang et al. [62], and Shen et al. [63], a range of provincial control variables have also been selected for this paper, as shown in Table 1.

3.4. Statistical Description

The descriptive statistics of the full sample of this paper are shown in Table 2. After testing, all of the variance expansion factors (VIFs) are less than 10, indicating that there is not a significant issue with multiple collinearities between the interpretative variables. From Table 2, it can be seen that the standard deviation of the explanatory variable GI is 7.684, and its maximum value of 10.735 is much larger than the minimum value of 3.434, which suggests that there are some differences in GI among different provinces. The standard deviation of the core explanatory variable CPU is 0.559, while its mean is 2.26. The relatively small standard deviation of the CPU index compared to its mean suggests that while variations exist across provinces, the overall dispersion is not high.
Figure 1 illustrates the evolution of the CPU index across Chinese provinces from 2013 to 2021, highlighting significant regional variations in policy uncertainty over time. The results indicate that most provinces experienced an overall upward trend in CPU, with a particularly pronounced surge from 2020 to 2021. This spike is likely driven by the introduction of China’s “dual carbon” (carbon peak and carbon neutrality) goals and intensified environmental regulations. Most provinces exhibit an upward trend in the CPU index, indicating increasing uncertainty in climate-related policies over time. Eastern coastal provinces (e.g., Hebei, Shanghai, Jiangsu, Shandong): The index remains relatively stable, with smaller increases. This suggests that climate policies in these regions might be more predictable. Central and western provinces (e.g., Gansu, Ningxia, Qinghai): The CPU index exhibits larger fluctuations.

4. Empirical Results and Analyses

4.1. Benchmark Regression Analysis

Table 3 presents the benchmark regression results examining the relationship between CPU and GI. Among them, column (1) shows the regression result controlling only for year and province fixed effects. The results show that there is a significant positive relationship between CPU and regional GI, indicating that the CPU promotes regional GI. Column (2) adds control variables on the basis of column (1). The results show that the sign and significance level of CPU are not significantly changed. The above analyses show that CPU has a significant contribution to regional GI. Hypothesis 1 of this paper is verified, that is, CPU will significantly promote regional GI. This result supports Hypothesis 1.
In Section 2.2, this paper’s theoretical analysis pointed out that the impact of climate policy on regional GI is jointly determined by both government and corporate actions, rather than a single entity alone. Specifically, while CPU may have a negative effect on firms’ innovation investment due to increased risks and financing constraints, the government often responds by increasing investments in research and development (R&D) and green technology initiatives to guide the direction of GI. As a result, the net effect of CPU on regional GI depends on whether the government’s additional innovation expenditures outweigh the reduction in corporate R&D investments caused by policy uncertainty. The benchmark regression results provide empirical evidence that CPU significantly promotes regional GI. This finding suggests that, in practice, although policy uncertainty may discourage some firms from engaging in innovation [12], the government’s increased R&D investment is more substantial, effectively offsetting the decline in corporate innovation. Thus, the regression results ultimately show that the CPU promotes regional GI.
However, when CPU rises, its impact on regional GI depends on the relative magnitudes of two opposing forces: the reduction in corporate R&D investment due to increased uncertainty and the expansion of government-led innovation efforts. Higher uncertainty raises firms’ expected risks, weakens the stability of their future market expectations, and increases financing constraints, leading to a decline in their willingness and ability to invest in GI. If the reduction in corporate innovation investment exceeds the compensatory effect of government support, the overall level of regional GI will decline. Beyond a certain threshold, excessive CPU may become a negative force on regional GI.
Table 4 reports the regression results based on Equation (2). In Table 4, the regression coefficient of the primary term of CPU is significantly positive while the regression coefficient of the quadratic term is significantly negative, which indicates that there is an inverted U-shaped relationship between CPU and GI. That is, when CPU is at a low level, regional GI activities increase with policy uncertainty. When CPU is too high, its impact on GI is negative. This result proves Hypothesis 2, indicating that while a moderate level of policy uncertainty may foster innovation, excessive uncertainty ultimately hinders GI. This result supports Hypothesis 3.
To further explain the differences in the regression results of the linear model and the quadratic model (i.e., Equations (1) and (2)), the scatter plots of CPU and GI are plotted. Figure 2 illustrates the scatter plots of CPU and GI as well as the quadratic fitting curves. Most of the fallout points of the sample data are actually concentrated in the left-hand region of the symmetry axis of the quadratic model and CPU is predominantly at low or medium levels, and therefore the linear model fails to exhibit the inverted U-shaped declining part of the quadratic model, and instead only shows a tendency for GI to increase as uncertainty increases. Since on the left side of the symmetry axis, CPU has a positive effect in most provinces, this leads to a significant positive relationship in the linear model.
Although the quadratic model captures this complex nonlinear relationship, both the quadratic and primary models yield a positive relationship when uncertainty is low, showing the consistency between the two in their analytical conclusions. The positive correlation of the benchmark model is mainly due to the fact that most of the provinces in China are located in the lower-level region of the CPU, where uncertainty has a positive impact on GI, and therefore the benchmark model is able to describe this trend well, while the secondary model further reveals the negative impact of uncertainty at higher levels. The robustness of the analyses can be tested by comparing the results of the two models, which give similar conclusions within a consistent range, indicating the robustness and reliability of the model results.

4.2. Robustness Check

To ensure the robustness and reliability of the findings on the impact of CPU on regional GI, this paper intends to re-analyzed the relationship using a variety of methods. By replacing the variable measures and adjusting the sample range, we will systematically test the robustness of the impact of CPU on GI. The application of these methods aims to verify the consistency of the findings under different conditions and to ensure that the conclusions are not influenced by specific model assumptions or data choices, thereby enhancing the scientific validity and credibility of the study.

4.2.1. Exclusion of Specific Samples

To ensure the robustness of our findings, this paper conducts analyses by excluding certain samples that might introduce bias. (i) Adjusting the Time Frame: The COVID-19 pandemic, which began in December 2019, led to widespread business shutdowns across China, significantly impacting corporate operations [9]. To mitigate the potential effects of the pandemic on our results, we re-estimate our models by excluding data from the years 2020 and 2021. (ii) Modifying the Sample Scope: Given Beijing’s role as the political center and Shanghai’s status as the economic hub of China, their economic development trajectories may differ markedly from other provincial-level regions. To address this, we perform regression analyses after removing data pertaining to Beijing and Shanghai, ensuring that our findings are not disproportionately influenced by these unique cases. These steps were undertaken to validate that our conclusions regarding the impact of CPU on regional GI remain consistent and reliable across different sample configurations.
Table 5 reports the regression results. The first and second columns show the regression results after excluding the effect of COVID-19 and excluding Beijing and Shanghai, respectively. The regression coefficients for CPU are all significantly positive, showing the robustness of the results.

4.2.2. Changing the Key Variables

To enhance the robustness of our analysis, we re-estimated the original model by disaggregating the dependent variable into two distinct categories: green invention patents (GIP) and green utility patents (GUP). Green patents include GIP and GUP. This approach allows for a more nuanced examination of the impact of CPU on different types of GI. By separately analyzing the effects on GIP and GUP, we aim to determine whether CPU exerts differential influences on these two forms of green patents, thereby providing a more comprehensive understanding of its role in promoting various dimensions of green technological advancement.
The results presented in Table 6 provide insights into how CPU affects different aspects of GI and how national-level CPU affects GI. Specifically, column (1) presents the regression results for GUP, showing a positive and statistically significant coefficient of 0.122 at the 1% level, indicating a robust impact of CPU on GUP. Column (2) presents the results for GIP, with a coefficient of 0.123, significant at the 1% level, suggesting that CPU also positively influences green invention activities, to a little more extent than utility patents.

4.3. Endogeneity Issues and Dynamic Panel Data Models

To effectively address potential endogeneity issues that may arise, such as reverse causality between observable variables, this paper implements the two-stage least squares (2SLS) estimation method. Specifically, this paper uses lagged first-period instrumental variables within two linear regression equations to help mitigate potential endogeneity between our independent and dependent variables. The choice of instrumental variables is based on their theoretical relevance and presumed exogeneity. By employing lagged values, we ensure that the instruments are sufficiently correlated with the endogenous regressors, while minimizing their direct correlation with the error term in the primary regression model, thereby satisfying the necessary conditions for valid instruments.
Additionally, given the limitations of using fixed effects, which is a time-invariant process and may lead to loss of information, this paper adopts the approach of Arellano and Bover and employs System GMM estimation for re-estimation [64]. System GMM effectively addresses unobserved heterogeneity, potential dynamic endogeneity, and autocorrelation in the data.
GMM is a dynamic panel data model which accounts for the persistence of dependent variables over time [65]. By employing System GMM, this study enhances the robustness of its findings by not only addressing endogeneity concerns but also ensuring that the long-term dynamic effects of climate policy uncertainty on green innovation are captured.
The first column of Table 7 reports the regression results for 2SLS. The estimation results indicate that the direction and statistical significance of the coefficient on the Chinese CPU index remain consistent with those obtained from the benchmark model. This consistency across estimation methods enhances the robustness and reliability of our findings, suggesting that the influence of CPU on the outcome variable is not driven by endogeneity concerns. Overall, our use of the 2SLS method, coupled with rigorous instrument validity testing, strengthens the credibility of our empirical results and mitigates concerns regarding potential endogeneity biases. The second column of Table 7 reports the regression results for GMM. The final results align with the benchmark findings, confirming the robustness of our conclusions and further validating the relationships established in the study.

4.4. Analysis of Mechanisms: Government Investment in Innovation and Firm Investment in Innovation

As a large developing country, China is under pressure to maintain high economic growth. The formulation of stringent climate policies may inhibit the economic viability of certain high-emission and high-pollution industries, thereby affecting overall economic development. In order to strike a balance between economic development and environmental protection, the government sometimes takes a gradual and flexible approach to climate policy, increasing policy uncertainty [66]. In addition, China’s economy has long relied on heavy industry and manufacturing, which have high emissions. In order to achieve long-term economic transformation and structural adjustment, the government maintains a certain degree of uncertainty in policy formulation and implementation to buffer the economy from short-term impacts [67]. For example, the Chinese government sometimes pilots policies in different regions and cities to test the effectiveness of different measures [68]. This incremental approach to policy development can lead to policy inconsistency and uncertainty across the country. Thus climate policy uncertainty does not exclusively imply risk.
On the other hand, Chinese local climate policy uncertainty in China is largely driven by changes in local officials. Policy formulation and implementation are significantly influenced by the priorities of those in key positions. Frequent leadership changes often lead to policy shifts, contributing to CPU. China’s political promotion system further reinforces this dynamic, as officials’ career advancement depends on their performance, often measured by economic growth. Expanding investment is a common strategy to boost local economic indicators and support regional GI efforts. The most effective way to achieve the win–win combination of economic development and reduced emissions is through technological innovation. Since 2012, China has emphasized an innovation-driven development strategy, increasing the importance of technological innovation in local government evaluations. While GDP growth and infrastructure investment traditionally dominated assessments, innovation has gained greater weight. As a result, CPU is often accompanied by increased local government investment in innovation.
The Chinese government’s investment in innovation plays a crucial role in fostering GI [69]. By investing upfront in technology, governments can more easily respond to changes and reduce social and economic shocks when climate policies are put in place, and the government can create favorable conditions that encourage firms to engage in sustainable practices and develop environmentally friendly technologies [70,71]. Thus, local government investment on innovation under policy uncertainty can be regarded as an important mechanism which promotes GI.
The level of GI output by firms is closely tied to their investment in innovation, which is significantly influenced by macroeconomic policy conditions. When policy uncertainty increases, firms face greater difficulty in forecasting future market conditions compared to a stable regulatory environment, leading to disruptions in their resource allocation and strategic investment planning. According to prospect theory, firms tend to prioritize loss avoidance over potential gains when faced with heightened uncertainty [48]. As CPU rises, firms’ confidence in the predictability of the regulatory and market landscape diminishes, prompting them to adopt more conservative investment approaches. Rather than committing to long-term, capital-intensive projects with uncertain payoffs, firms may delay or scale down their innovation investments to mitigate potential regulatory risks. Furthermore, unstable climate policies can amplify market fluctuations, increasing firms’ perceived uncertainty regarding future revenue streams. In response, firms may opt to accumulate liquidity rather than expand investment, prioritizing financial flexibility over long-term growth initiatives [72]. Additionally, shifting climate policies can exacerbate financing constraints by raising firms’ borrowing costs. Given that commercial banks serve as a primary external funding source for enterprises, heightened uncertainty often leads financial institutions to tighten credit conditions, increase loan loss provisions, and limit high-risk lending. This contraction in credit supply raises firms’ cost of capital and further discourages investment in innovation. Thus, CPU discouraging firms from investing in innovation can be seen as a negative factor for regional innovation.
Based on Equation (1), the following model is constructed in this paper:
GRDit = β0 + β1CPUit + γcontrolit + μ + ε + eit
FRDit = β0 + β1CPUit + γcontrolit + μ + ε + eit
where GRD stands for government investment in innovation and FDR stands for corporate investment in innovation. The remaining variables are the same as in Equation (1). Additionally, as CPU increases, its inhibitory effect on innovation investment is likely to intensify. Therefore, this paper constructs a quadratic model to examine the impact and potential nonlinear relationship between CPU and firms’ innovation investment:
FRDit = β0 + β1CPUit + β2CPU2it + γcontrolit + μ + ε + eit
This paper measures the intensity of government R&D investment using the ratio of government R&D expenditure to GDP. Similarly, the intensity of enterprise R&D investment is measured by the ratio of total R&D expenditure by enterprises within the province to GDP. Data from the China Science and Technology Statistical Yearbook.
Table 8 reports the results of the analysis of mechanisms. Column (1) shows the impact of CPU on government R&D investment intensity, which is significantly positive. This suggests that under heightened CPU, local governments could increase their investment in innovation. By doing so, governments can foster GI. Column (2) presents the impact of CPU on business R&D investment intensity, which is significantly negative. This indicates that increased policy uncertainty discourages firms from committing to R&D investments. These results support Hypothesis 2 and the Hypothesis 4. The third column reports the regression results based on Equation (6). The regression coefficient for CPU2 is significantly negative, indicating that the marginal inhibitory effect of CPU on firms’ investment in innovation becomes stronger as CPU increases.
It is the opposite effect of CPU on government and enterprise R&D investment that leads to the nonlinear effect of CPU on regional GI in the form of facilitation followed by inhibition. On the one hand, a moderate CPU will prompt the government to increase R&D investment to cope with the uncertainty of policy changes, thus promoting GI. On the other hand, as the CPU rises further, the market instability and financing constraints faced by firms increase, and risk aversion increases, leading firms to cut back on R&D investment, thus inhibiting the development of GI [73]. As CPU increases, its inhibitory effect on firms’ innovation investment grows stronger. When the negative impact of CPU on firms’ innovation spending surpasses the positive effect of increased government innovation investment, CPU becomes a significant obstacle to regional GI. In addition, since the current average CPU level in China is still low, the linear model mainly captures the positive effect of CPU, and thus the linear model exhibits the result that CPU promotes regional GI.

4.5. Moderating Effects of Financial Development

The development of the financial system directly affects firms’ financing environment. In regions with a high level of financial development, capital markets are more mature, and firms have access to a diverse range of financing channels, including banks, securities markets, and venture capital. These financial institutions provide more flexible funding support, reducing the financing constraints imposed on firms by CPU. Additionally, financial instruments such as green credit and green bonds help channel capital into green technology research and development, improving firms’ ability to adapt to uncertain policy environments. Consequently, in regions with a well-developed financial system, the suppressive effect of CPU on firms’ innovation investment is relatively weaker and may even transform into a positive incentive, ultimately promoting regional GI.
Conversely, in regions with a lower level of financial development, firms often face limited financing options, exacerbating financial constraints [74]. Moreover, in the absence of a mature capital market, the financial system provides weaker support for green technology innovation. As a result, firms in these regions are more likely to scale back innovation investment due to policy uncertainty. Therefore, in areas with lower financial development, CPU tends to have a more pronounced negative impact on GI, as firms lack sufficient financial resources to sustain GI efforts.
Table 9 reports the results of the regression with financial development as a moderating variable based on Equation (3). The first column reports the results of the regression without the control variables and the second column reports the results of the regression with the control variables. The regression coefficients for the interaction term CPU × Fin are significantly positive in both the first and second columns. These results suggest that financial development can mitigate the negative impact of CPU on firms’ GI, thereby enhancing the overall positive effect of CPU on regional GI. This result supports Hypothesis 5.

4.6. Moderating Effects of Dominance of SOEs over the Economy

The regression results in Section 4.4 demonstrate that CPU has a negative effect on firm-level investment in innovation. China’s market economy system is a mixed economic model with SOEs and private firms. Compared to private firms, SOEs enjoy more stable policy and resource support, including financial subsidies, tax incentives, policy loans, and government funds. In the event of market volatility or an uncertain policy environment, SOEs are still able to receive government support to sustain their operations and long-term investments [9]. CPU therefore has a less negative impact on innovation investment by SOEs than on private firms. Thus in regions where SOEs play a dominant role in the economy, the negative impact of CPU on innovation investment is attenuated, leading to a stronger promotion of regional GI by CPU.
Table 10 reports the regression results based on Equation (4). The first column reports the results of the regression without the control variables and the second column reports the results of the regression with the control variables. The regression coefficients for the interaction term CPU × Dso are significantly positive in both the first and second columns. These results suggest that the greater the dominance of SOEs over the economy, the greater the contribution of CPU to regional GI. These results support Hypothesis 6.

4.7. Heterogeneity Analysis

To better capture the heterogeneous impact of policy uncertainty across different economic landscapes, this paper considers the regional disparities in China’s development. The country exhibits significant economic and innovation gaps between regions, with the eastern provinces generally being more developed, possessing stronger technological foundations, and having better access to financial and human capital. In contrast, the central and western regions often face structural limitations that hinder their ability to adapt to policy fluctuations. Given these differences, it is essential to examine how CPU influences GI in each region separately to uncover potential variations in its role in shaping innovation decisions, resource allocation, and technological advancements.
Based on the categorization provided by the National Bureau of Statistics of China, this paper further divides Chinese provinces into two regions: eastern region and central–western region, to examine the impact of CPU on GI in each of these regions separately.
The results, presented in Table 11, reveal that the positive effect of CPU on GI is significantly more pronounced in the eastern region compared to the other regions, while no significant effect is observed in the central and western regions. This finding indicates that the eastern provinces, which generally have more developed economies, stronger innovation infrastructure, and greater access to resources, are better positioned to leverage policy uncertainty as a driver for GI. In contrast, the central–western regions, which tend to lag behind in terms of economic development and technological capabilities, result in a lack of significant influence.

4.8. The Marketization and Practical Application of Innovation Technologies

In a baseline regression, this paper explores the impact of CPU on GI. Although the number of green patents is an important indicator of green innovation and has been widely used in related research, it may not fully reflect the degree of marketization and practical application of green technologies. The number of patents mainly reflects the output of technological research and development and does not directly indicate whether these technologies have successfully entered the market, achieved industrialization, or generated economic value. Therefore, relying solely on the number of patents to measure green innovation may overlook key aspects of the process of technology transformation from R&D to the market.
To compensate for this limitation, this paper further examines the impact of climate policy uncertainty on technology market turnover, an indicator that more directly reflects the market acceptance and industrialization of innovative technologies. Table 12 reports the regression results. The regression results for CPU in both the first and second columns are significantly negative. The results show that CPU has a significant negative impact on technology market turnover, which implies that under high policy uncertainty, the market becomes more cautious about trading and transforming innovative technologies, and the process of marketization of technological achievements is hindered.
Although increased government investment may promote green patenting in the short term, CPU in fact discourages firms from investing in independent innovation. Faced with an unstable policy environment, firms are more inclined to reduce their long-term innovation investments, and are especially less willing to invest in commercialization and industrial applications.
From a market perspective, the aforementioned suggests that the CPU may not really promote the development of green innovation, but rather inhibits the marketization of innovative technologies. Even though policy uncertainty has stimulated the growth of green patents, the commercialization and industrialization of green technologies have been seriously hampered by damaged business confidence and unstable market environment. It can be seen that to truly promote green innovation and facilitate the marketization of new technologies, a stable and predictable climate policy is crucial, which not only reduces the policy risk for enterprises, but also improves the market’s acceptance of green technologies, promotes green innovation from the laboratory to the market, and ultimately achieves sustainable development.

5. Discussion

The paper finds that moderate CPU promotes regional GI. However, further analysis reveals that when a region’s CPU is excessively high, it instead hinders GI. The mechanism analysis shows that CPU encourages government investment in innovation while constraining firms’ investment in innovation. Additionally, this paper finds that regional financial development can alleviate firms’ financing constraints, thereby mitigating the negative impact of CPU on firms. Furthermore, the stronger the dominance of SOEs over the economy, the stronger the contribution of CPU to regional GI. The findings of this paper provide a basis for the government if it designates climate policies to promote the realization of green innovation. At the same time, this study also puts forward policy recommendations to improve financial policies and strengthen government support in order to promote the process of green technology research and development, marketization and industrialization, and to promote the green transformation and sustainable development of China’s economy.
As the world’s second-largest economy and the largest carbon emitter, China faces the challenge of balancing economic growth with environmental sustainability. In response, the government has set climate goals, committing to carbon peaking by 2030 and carbon neutrality by 2060. However, frequent policy adjustments, regional disparities, and uncertainties in global climate cooperation contribute to CPU, which affects economic stability and investment in GI. China’s socioeconomic structure—characterized by rapid industrialization, regional economic imbalances, and reliance on energy-intensive industries—complicates climate policy implementation. While coastal provinces lead in industrial upgrading and clean energy adoption, resource-dependent inland regions struggle with structural transformation. Local governments, evaluated on short-term economic performance, often shift policy priorities, causing instability in enforcement. Furthermore, China’s regulatory framework, including its evolving carbon trading system, fluctuating carbon pricing, and emission allowance policies, adds another layer of uncertainty. Despite these challenges, GI plays a crucial role in China’s transition toward high-quality economic growth, driving technological advancements in clean energy, emissions reduction, and sustainable industrial practices.
Based on the findings of this study and China’s economic, social, and policy background, several policy recommendations can be proposed to enhance the positive effects of CPU on regional GI while mitigating its potential negative consequences:
Moderate CPU can stimulate GI, but excessive uncertainty may discourage firms from investing in research and development. Policymakers should strive to maintain a stable and predictable regulatory environment while allowing for gradual policy adjustments. This requires providing clear long-term policy roadmaps and ensuring that any regulatory changes have sufficient transition periods. Such measures can help firms adjust their strategies accordingly and reduce the risk of policy uncertainty discouraging innovation investments.
Financial development can mitigate the negative impact of CPU on firms’ GI. To ensure that enterprises, particularly private firms, have access to low-cost and stable financing for green projects, policymakers should strengthen green financial mechanisms. This includes expanding green credit programs and government-backed loans to encourage private firms to invest in green technology, promoting the issuance of green bonds and enhancing financial incentives for sustainable investments, and encouraging financial institutions to develop risk-sharing mechanisms such as credit guarantees to alleviate financing constraints caused by policy uncertainty.
State-owned enterprises are less affected by CPU due to their stronger financial backing and government support. In contrast, private firms are more vulnerable to policy fluctuations and financing constraints, making it essential for policymakers to support their GI investments. Targeted tax incentives and subsidies can help private firms invest in green technology research and development. Public–private partnerships can facilitate risk-sharing and cost distribution in GI projects. Additionally, establishing innovation incubators and technology transfer platforms can enhance collaboration between private firms and research institutions, fostering a more dynamic GI ecosystem.
The impact of CPU on GI is found to be more significant in economically developed regions, while less developed areas do not benefit as much. To address these regional disparities, policymakers should provide targeted support to underdeveloped regions by increasing government research and development investment, offering greater financial and technical assistance, and fostering the development of regional GI clusters that integrate firms, universities, and research institutions. Promoting cross-regional cooperation can also enable less developed areas to leverage the expertise and resources available in more advanced regions, facilitating a more balanced distribution of GI benefits.
Regions with a higher dominance of state-owned enterprises tend to experience a stronger positive effect of CPU on GI. Given this, policymakers should encourage state-owned enterprises to take a leading role in green technology development and commercialization. Strengthening collaboration between state-owned enterprises, private firms, research institutions, and startups can accelerate the diffusion of green technologies.

6. Conclusions

So far, the existing literature has primarily examined the impact of CPU on the GI of listed firms [9,10,11]. However, there is still a lack of research on how CPU affects regional innovation compared to its impact at the firm level. In fact, GI is not solely driven by listed firms. Unlisted firms, government, and government-affiliated scientific research institutions also play a crucial role in the research, development, and promotion of green technologies. Additionally, the financial investment required for GI does not come exclusively from enterprises but also significantly depends on government financial support and policy guidance. Additionally, existing literature primarily focuses on the linear relationship when analyzing the impact of CPU on GI, often overlooking potential nonlinear effects, without considering that its influence may vary at different intensities of uncertainty [9,10,11,12]. This paper examines the impact of climate policy uncertainty on green innovation based on panel data for 30 provinces in China from 2013 to 2021. This study provides relevant support for China’s green transition, reveals how climate policy uncertainty affects regional green innovation, and provides policymakers with a rationale for optimizing a stable and predictable policy regime for the development of sustainable technologies. As a global leader in renewable energy and green technologies, China’s policy uncertainty may affect the stability of long-term investment and innovation as it pushes for a green transition, making it critical to understand the role of CPU in ensuring the continued development of green technologies. At the global level, other emerging economies identified in this study provide empirical mechanisms that offer new research perspectives on global climate governance and sustainable financial policies, which can help them to strike a balance between policy adjustment and innovation, and to ensure that green innovations are not hindered by policy volatility.
It is important to mention the limitations of this study. The first limitation of this study is the relatively short time span, which is due to data limitations. Future research could further extend the research period and use updated data, where data are available, to include longer-term data to more comprehensively assess the dynamic impacts of CPU on GI and examine whether the impact of CPUs on green innovation has adjusted over time. The second limitation of this study is that the calculation method of the CPU index depends on news report data, and there may be media bias, that is, periods with more policy discussions may not necessarily represent an increase in real policy uncertainty. Future research could introduce policy text mining to directly calculate the ambiguity indicators of policy documents, in order to improve the accuracy of measurement.

Author Contributions

Methodology, H.L.; Software, H.L.; Validation, H.L.; Formal analysis, H.L.; Data curation, H.L.; Writing—original draft, H.L.; Writing—review & editing, H.L. and A.H.; Supervision, A.H.; Funding acquisition, H.L. All authors have read and agreed to the published version of the manuscript.

Funding

This paper receives funding from the China Scholarship Council and the APC was funded by University of Bath Institutional Open Access Fund.

Institutional Review Board Statement

Not applicable.

Informed Consent Statement

Not applicable.

Data Availability Statement

The original contributions presented in this study are included in the article. Further inquiries can be directed to the corresponding author.

Conflicts of Interest

The authors declare no conflict of interest.

Abbreviations

CPUClimate policy uncertainty
GIGreen innovation
SOEsState-owned enterprises

References

  1. Leichenko, R.; O’Brien, K. Climate and Society: Transforming the Future; John Wiley & Sons: Hoboken, NJ, USA, 2024. [Google Scholar]
  2. Raihan, A. A review of the global climate change impacts, adaptation strategies, and mitigation options in the socio-economic and environmental sectors. J. Environ. Sci. Econ. 2023, 2, 36–58. [Google Scholar]
  3. Carleton, T.A.; Hsiang, S.M. Social and economic impacts of climate. Science 2016, 353, aad9837. [Google Scholar] [PubMed]
  4. Van der Ploeg, F.; Rezai, A. The risk of policy tipping and stranded carbon assets. J. Environ. Econ. Manag. 2020, 100, 102258. [Google Scholar]
  5. Jones, B.F.; Olken, B.A. Do leaders matter? National leadership and growth since World War II. Q. J. Econ. 2005, 120, 835–864. [Google Scholar]
  6. Lu, H.; Hunt, A.; Morley, B. The Impact of Heterogeneous Environmental Regulation Tools on Economic Growth: Can Environmental Protection and Economic Growth Be Win-Win? Sustainability 2024, 16, 5585. [Google Scholar] [CrossRef]
  7. Dou, Q.; Gao, X. The double-edged role of the digital economy in firm green innovation: Micro-evidence from Chinese manufacturing industry. Environ. Sci. Pollut. Res. 2022, 29, 67856–67874. [Google Scholar]
  8. Chen, Y.; Ma, Y. Does green investment improve energy firm performance? Energy Policy 2021, 153, 112252. [Google Scholar]
  9. Bai, D.; Du, L.; Xu, Y.; Abbas, S. Climate policy uncertainty and corporate green innovation: Evidence from Chinese A-share listed industrial corporations. Energy Econ. 2023, 127, 107020. [Google Scholar]
  10. Huo, M.; Li, C.; Liu, R. Climate policy uncertainty and corporate green innovation performance: From the perspectives of organizational inertia and management internal characteristics. Manag. Decis. Econ. 2024, 45, 34–53. [Google Scholar]
  11. Li, J.; Kong, T.; Gu, L. The impact of climate policy uncertainty on green innovation in Chinese agricultural enterprises. Financ. Res. Lett. 2024, 62, 105145. [Google Scholar]
  12. Sun, G.; Fang, J.; Li, T.; Ai, Y. Effects of climate policy uncertainty on green innovation in Chinese enterprises. Int. Rev. Financ. Anal. 2024, 91, 102960. [Google Scholar]
  13. Baker, S.R.; Bloom, N.; Davis, S.J. Measuring economic policy uncertainty. Q. J. Econ. 2016, 131, 1593–1636. [Google Scholar]
  14. Lee, K.; Cho, J. Measuring Chinese climate uncertainty. Int. Rev. Econ. Financ. 2023, 88, 891–901. [Google Scholar]
  15. Caldara, D.; Iacoviello, M.; Molligo, P.; Prestipino, A.; Raffo, A. The economic effects of trade policy uncertainty. J. Monet. Econ. 2020, 109, 38–59. [Google Scholar]
  16. Lin, B.; Zhao, H. Tracking policy uncertainty under climate change. Resour. Policy 2023, 83, 103699. [Google Scholar]
  17. Zhao, X.; Ma, X.; Chen, B.; Shang, Y.; Song, M. Challenges toward carbon neutrality in China: Strategies and countermeasures. Resour. Conserv. Recycl. 2022, 176, 105959. [Google Scholar]
  18. Dong, F.; Li, Z.; Huang, Z.; Liu, Y. Extreme weather, policy uncertainty, and risk spillovers between energy, financial, and carbon markets. Energy Econ. 2024, 137, 107761. [Google Scholar]
  19. Stroebel, J.; Wurgler, J. What do you think about climate finance? J. Financ. Econ. 2021, 142, 487–498. [Google Scholar]
  20. Ilhan, E.; Sautner, Z.; Vilkov, G. Carbon tail risk. Rev. Financ. Stud. 2021, 34, 1540–1571. [Google Scholar]
  21. Dokas, I.; Oikonomou, G.; Panagiotidis, M.; Spyromitros, E. Macroeconomic and uncertainty shocks’ effects on energy prices: A comprehensive literature review. Energies 2023, 16, 1491. [Google Scholar] [CrossRef]
  22. Hoang, K. How does corporate R&D investment respond to climate policy uncertainty? Evidence from heavy emitter firms in the United States. Corp. Soc. Responsib. Environ. Manag. 2022, 29, 936–949. [Google Scholar]
  23. Sun, L.; Jia, R.; Qi, X. The impact and path of policy uncertainty on regional substantive innovation. Ind. Technol. Econ. 2024, 43, 140–150. [Google Scholar]
  24. Gavriilidis, K. Measuring Climate Policy Uncertainty. 2021. Available online: https://papers.ssrn.com/sol3/papers.cfm?abstract_id=3847388 (accessed on 20 March 2025).
  25. Olasehinde-Williams, G.; Özkan, O.; Akadiri, S.S. Effects of climate policy uncertainty on sustainable investment: A dynamic analysis for the US. Environ. Sci. Pollut. Res. 2023, 30, 55326–55339. [Google Scholar]
  26. Zhang, Q.; Ma, Y. The impact of environmental management on firm economic performance: The mediating effect of green innovation and the moderating effect of environmental leadership. J. Clean. Prod. 2021, 292, 126057. [Google Scholar]
  27. Tian, L.; Li, X. Does climate policy uncertainty affect carbon emissions in China? A novel dynamic ARDL simulation perspective. Humanit. Soc. Sci. Commun. 2023, 10, 1–10. [Google Scholar]
  28. Shang, Y.; Han, D.; Gozgor, G.; Mahalik, M.K.; Sahoo, B.K. The impact of climate policy uncertainty on renewable and non-renewable energy demand in the United States. Renew. Energy 2022, 197, 654–667. [Google Scholar]
  29. Guo, J.; Zhou, Y.; Ali, S.; Shahzad, U.; Cui, L. Exploring the role of green innovation and investment in energy for environmental quality: An empirical appraisal from provincial data of China. J. Environ. Manag. 2021, 292, 112779. [Google Scholar]
  30. Söderholm, P. The green economy transition: The challenges of technological change for sustainability. Sustain. Earth 2020, 3, 6. [Google Scholar]
  31. Fontoura, P.; Coelho, A. How to boost green innovation and performance through collaboration in the supply chain: Insights into a more sustainable economy. J. Clean. Prod. 2022, 359, 132005. [Google Scholar]
  32. Lin, T.; Wang, L.; Wu, J. Environmental regulations, green technology innovation, and high-quality economic development in China: Application of mediation and threshold effects. Sustainability 2022, 14, 6882. [Google Scholar] [CrossRef]
  33. Chen, X.; Yi, N.; Zhang, L.; Li, D. Does institutional pressure foster corporate green innovation? Evidence from China’s top 100 companies. J. Clean. Prod. 2018, 188, 304–311. [Google Scholar]
  34. Huang, J.; Wang, Z.; Jiang, Z.; Zhong, Q. Environmental policy uncertainty and corporate green innovation: Evidence from China. Eur. J. Innov. Manag. 2023, 26, 1675–1696. [Google Scholar]
  35. Hafeez, M.; Yasin, I.; Zawawi, D.; Odilova, S.; Bataineh, H.A. Unleashing the power of green innovations: The role of organizational ambidexterity and green culture in achieving corporate sustainability. Eur. J. Innov. Manag. 2024; ahead-of-print. [Google Scholar]
  36. Dowbiggin, A. Climate Risk and Organizational Challenges. In Climate Risk and Business: New Challenges for Organizations; Springer: Berlin/Heidelberg, Germany, 2021; pp. 1–24. [Google Scholar]
  37. Xu, D.; Abbas, S.; Rafique, K.; Ali, N. The race to net-zero emissions: Can green technological innovation and environmental regulation be the potential pathway to net-zero emissions? Technol. Soc. 2023, 75, 102364. [Google Scholar]
  38. Li, D.; Zheng, M.; Cao, C.; Chen, X.; Ren, S.; Huang, M. The impact of legitimacy pressure and corporate profitability on green innovation: Evidence from China top 100. J. Clean. Prod. 2017, 141, 41–49. [Google Scholar]
  39. Zhou, M.; Govindan, K.; Xie, X.; Yan, L. How to drive green innovation in China’s mining enterprises? Under the perspective of environmental legitimacy and green absorptive capacity. Resour. Policy 2021, 72, 102038. [Google Scholar]
  40. Wang, J.; Ma, M.; Dong, T.; Zhang, Z. Do ESG ratings promote corporate green innovation? A quasi-natural experiment based on SynTao Green Finance’s ESG ratings. Int. Rev. Financ. Anal. 2023, 87, 102623. [Google Scholar]
  41. Qi, R.; Shi, C.; Wang, M.Y. Carbon emission rush in response to the carbon reduction policy in China. China Inf. 2023, 37, 100–122. [Google Scholar]
  42. Roseland, M. Sustainable community development: Integrating environmental, economic, and social objectives. Prog. Plan. 2000, 54, 73–132. [Google Scholar]
  43. Zhao, L.; Ma, Y.; Chen, N.; Wen, F. How does climate policy uncertainty shape corporate investment behavior? Res. Int. Bus. Financ. 2025, 74, 102696. [Google Scholar]
  44. Istiak, K.; Serletis, A. Economic policy uncertainty and real output: Evidence from the G7 countries. Appl. Econ. 2018, 50, 4222–4233. [Google Scholar] [CrossRef]
  45. Li, H.; Zhou, L.A. Political turnover and economic performance: The incentive role of personnel control in China. J. Public Econ. 2005, 89, 1743–1762. [Google Scholar] [CrossRef]
  46. Lin, J.Y.; Liu, Z. Fiscal decentralization and economic growth in China. Econ. Dev. Cult. Change 2000, 49, 1–21. [Google Scholar] [CrossRef]
  47. An, H.; Chen, Y.; Luo, D.; Zhang, T. Political uncertainty and corporate investment: Evidence from China. J. Corp. Financ. 2016, 36, 174–189. [Google Scholar] [CrossRef]
  48. Kahneman, D.; Tversky, A. Prospect theory: An analysis of decision under risk. In Handbook of the Fundamentals of Financial Decision Making: Part I; World Scientific: Singapore, 2013; pp. 99–127. [Google Scholar]
  49. Shaw, E. Financial Deepening in Economic Development; Oxford University Press: New York, NY, USA, 1973. [Google Scholar]
  50. Mckinnon, R.I. Money and Capital in Economic Development; Brookings Institution: Washington, DC, USA, 1973. [Google Scholar]
  51. Zhang, D.; Jin, Y. R&D and environmentally induced innovation: Does financial constraint play a facilitating role? Int. Rev. Financ. Anal. 2021, 78, 101918. [Google Scholar]
  52. Xiang, X.; Liu, C.; Yang, M. Who is financing corporate green innovation? Int. Rev. Econ. Financ. 2022, 78, 321–337. [Google Scholar] [CrossRef]
  53. Zhang, J.; Chen, S. Financial development, environmental regulations and green economic transition. J. Financ. Econ 2021, 47, 78–93. [Google Scholar]
  54. Tang, M.; Wang, X.; Niu, W.; Fu, J.; Zhu, M. How financial development scale and R&D influence regional innovation efficiency: Empirical evidence from the financial industry. Environ. Sci. Pollut. Res. 2021, 30, 61257–61270. [Google Scholar]
  55. Beck, K.I. Reforming the Chinese state sector: Mixed ownership reforms and state-business relations. J. Contemp. China 2023, 32, 264–279. [Google Scholar] [CrossRef]
  56. Zhan, J.; Zhu, J. The effects of state ownership on innovation: Evidence from the state-owned enterprises reform in China. Appl. Econ. 2021, 53, 145–163. [Google Scholar] [CrossRef]
  57. Ma, Y.R.; Liu, Z.; Ma, D.; Zhai, P.; Guo, K.; Zhang, D.; Ji, Q. A news-based climate policy uncertainty index for China. Sci. Data 2023, 10, 881. [Google Scholar] [PubMed]
  58. Liu, J.; Zhao, M.; Zhang, C.; Ren, F. Analysis of the influence of heterogeneous environmental regulation on green technology innovation. Sustainability 2023, 15, 3649. [Google Scholar] [CrossRef]
  59. Beck, T. Financial development and international trade: Is there a link? J. Int. Econ. 2002, 57, 107–131. [Google Scholar] [CrossRef]
  60. Ngo, T.; Trinh, H.H.; Haouas, I.; Ullah, S. Examining the bidirectional nexus between financial development and green growth: International evidence through the roles of human capital and education expenditure. Resour. Policy 2022, 79, 102964. [Google Scholar]
  61. Irfan, M.; Razzaq, A.; Sharif, A.; Yang, X. Influence mechanism between green finance and green innovation: Exploring regional policy intervention effects in China. Technol. Forecast. Soc. Change 2022, 182, 121882. [Google Scholar]
  62. Meng, F.; Zhang, W. Digital finance and regional green innovation: Evidence from Chinese cities. Environ. Sci. Pollut. Res. 2022, 29, 89498–89521. [Google Scholar]
  63. Shen, C.; Li, S.; Wang, X.; Liao, Z. The effect of environmental policy tools on regional green innovation: Evidence from China. J. Clean. Prod. 2020, 254, 120122. [Google Scholar]
  64. Arellano, M.; Bover, O. Another look at the instrumental variable estimation of error-components models. J. Econom. 1995, 68, 29–51. [Google Scholar]
  65. Blundell, R.; Bond, S.; Windmeijer, F. Estimation in Dynamic Panel Data Models: Improving on the Performance of the Standard GMM Estimator; Institute for Fiscal Studies (IFS): London, UK, 2000. [Google Scholar]
  66. Wei, H.; Xianjun, D.; Khan, K. The race to zero emission: Can climate policy uncertainty threaten decarbonization? Environ. Dev. Sustain. 2024, 1–19. [Google Scholar] [CrossRef]
  67. Kong, Q.; Li, R.; Wang, Z.; Peng, D. Economic policy uncertainty and firm investment decisions: Dilemma or opportunity? Int. Rev. Financ. Anal. 2022, 83, 102301. [Google Scholar]
  68. Fu, Y.; He, C.; Luo, L. Does the low-carbon city policy make a difference? Empirical evidence of the pilot scheme in China with DEA and PSM-DID. Ecol. Indic. 2021, 122, 107238. [Google Scholar]
  69. Li, R.; Xu, G.; Ramanathan, R. The impact of environmental investments on green innovation: An integration of factors that increase or decrease uncertainty. Bus. Strategy Environ. 2022, 31, 3388–3405. [Google Scholar]
  70. Bhattacharya, A.; Oppenheim, J.; Stern, N. Driving Sustainable Development Through Better Infrastructure: Key Elements of a Transformation Program; Brookings Global Working Paper Series; Brookings: Washington, DC, USA, 2015. [Google Scholar]
  71. Wan, X.; Wang, Y.; Qiu, L.; Zhang, K.; Zuo, J. Executive green investment vision, stakeholders’ green innovation concerns and enterprise green innovation performance. Front. Environ. Sci. 2022, 10, 997865. [Google Scholar]
  72. Li, G.; Hei, B.; Ma, Q.; Wang, H. Subjective perception of economic policy uncertainty and ESG performance: Evidence from China. Invest. Anal. J. 2025, 54, 93–109. [Google Scholar]
  73. Zhang, Z.; Cheng, S.; Wang, C.; Song, S.; Feng, Y. Climate policy uncertainty and corporate investment efficiency: Evidence from China. J. Environ. Plan. Manag. 2025, 68, 957–977. [Google Scholar]
  74. Yang, L.; Ni, M. Is financial development beneficial to improve the efficiency of green development? Evidence from the “Belt and Road” countries. Energy Econ. 2022, 105, 105734. [Google Scholar]
Figure 1. Trends in CPU index across provinces (2013–2021).
Sustainability 17 02857 g001
Figure 2. Scatter plot of CPU and GI.
Sustainability 17 02857 g002
Table 1. Variable definitions and explanations.
Variable TypeVariable SymbolVariable NameVariable Definition
Dependent variableGIGreen innovationLogarithm of green patent grants
Independent variableCPUClimate policy uncertaintyReferring to the data from Ma et al. [57]
Control variablesFDISize of foreign direct investmentForeign direct investment/GDP
EduHigher educationLogarithm of the number of students in higher education
SciScale of science and technology expendituresLocal fiscal expenditure on science and technology/GDP
InvFixed-asset investmentLogarithm of investment in fixed assets
IndIndustrial structureSecondary sector output/GDP
μProvince fixed effects
εYear fixed effects
eRandom error term
Other variablesFinLevel of financial developmentGross loans to financial institutions/GDP
DsoThe degree of dominance of SOEs over the economyThe ratio of total assets of SOEs to total assets of private firms
Table 2. Statistical description.
VariableObsMeanStd. Dev.MinMax
GI2707.6841.2993.43410.735
CPU2702.2600.5590.8913.978
Fin2701.5440.8120.7312.762
FDI2701.7411.4040.0067.959
Edu27013.5290.79510.83314.804
Sci2700.0050.0030.0020.014
Inv2709.6440.8017.73411.041
Ind2700.4120.0830.1580.568
Table 3. Benchmark regression.
Variable(1)(2)
CPU0.155 ***0.121 ***
(4.42)(3.59)
FDI 0.031 **
(2.03)
Edu 0.800 ***
(4.80)
Sci 34.041 ***
(2.90)
Inv −0.166 ***
(−2.99)
Ind −0.048
(−0.10)
Constant6.678 ***−2.601
(97.60)(−1.22)
Observations360360
R-squared0.9240.935
Number of regions3030
Fixed effectsYESYES
F312.0231.1
Note: *** and ** denote significance at 1% and 5% significance levels, respectively, and t-values are in parentheses.
Table 4. Nonlinear model regression results.
Variable(1)(2)
CPU0.526 ***0.571 ***
(3.68)(4.08)
CPU2−0.076 ***−0.092 ***
(−2.67)(−3.31)
FDI 0.000 **
(2.17)
Edu 0.870 ***
(5.29)
Sci 27.662 **
(2.38)
Inv −0.202 ***
(−3.65)
Ind −0.060
(−0.13)
Constant6.273 ***−3.663 *
(37.82)(−1.73)
Observations270270
R-squared0.9140.926
Number of regions3030
Fixed effectsYESYES
F289.0226.0
Note: ***, **, and * denote significance at 1%, 5%, and 10% significance levels, respectively, and t-values are in parentheses.
Table 5. Exclusion of specific samples.
Variable(1)(2)
CPU0.141 ***0.087 **
(2.73)(2.18)
FDI−0.0000.001 ***
(−0.68)(2.72)
Edu1.293 ***0.814 ***
(5.37)(3.78)
Sci33.059 **29.612 **
(2.20)(2.00)
Inv−0.087−0.237 ***
(−1.27)(−3.62)
Ind0.1460.488
(0.23)(0.86)
Constant−10.201 ***−2.666
(−3.30)(−0.98)
Observations210252
R-squared0.8750.928
Number of regions3028
Fixed effectsYESYES
F97.63192.3
Note: *** and ** denote significance at 1% and 5% significance levels, respectively, and t-values are in parentheses.
Table 6. Changing the independent and dependent variables.
Variable(1) GUP(2) GIP
CPU0.122 ***0.123 ***
(3.12)(3.20)
FDI0.0000.000 *
(0.44)(1.87)
Edu−0.0300.972 ***
(−0.16)(5.10)
Sci33.930 **33.488 **
(2.50)(2.50)
Inv0.170 ***−0.220 ***
(2.64)(−3.46)
Ind−1.216 **0.138
(−2.15)(0.25)
Constant4.348 *−4.743 *
(1.76)(−1.94)
Observations270270
R-squared0.8730.924
Number of regions3030
Fixed effectsYESYES
F110.5195.2
Note: ***, **, and * denote significance at 1%, 5%, and 10% significance levels, respectively, and t-values are in parentheses.
Table 7. Endogeneity issues.
Variable(1) 2SLS(2) GMM
GIt−1 0.912 ***
(39.10)
CPU0.369 **0.038 ***
(2.59)(4.31)
Control variablesYESYES
Number of regions3030
Fixed effectsYESYES
Sargan test p-value0.00
Hensen test p-value 0.999
Note: *** and ** denote significance at 1% and 5% significance levels, respectively, and t-values are in parentheses.
Table 8. Analysis of mechanisms.
Variable(1)(2)(3)
CPU2.386 *−8.904 ***
(1.75)(−3.59)
CPU2 −1.874 ***
(−3.80)
FDI−0.025 ***0.0040.004
(−4.12)(0.31)(0.35)
Edu18.113 ***−56.100 ***−54.557 ***
(2.68)(−4.56)(−4.43)
Sci1745.293 ***3553.898 ***3430.454 ***
(3.67)(4.11)(3.99)
Inv−3.26316.073 ***15.332 ***
(−1.45)(3.92)(3.75)
Ind−50.835 **60.122 *60.048 *
(−2.56)(1.67)(1.67)
Constant−152.562 *680.390 ***657.554 ***
(−1.76)(4.31)(4.17)
Observations270270270
R-squared0.2740.6830.685
Number of regions303030
Fixed effectsYESYESYES
F6.10034.7535.08
Note: ***, **, and * denote significance at 1%, 5%, and 10% significance levels, respectively, and t-values are in parentheses.
Table 9. Moderating effects of financial development.
Variable(1)(2)
CPU−0.029−0.066
(−0.33)(−0.77)
Fin−0.265 **−0.271 **
(−2.26)(−2.37)
CPU × Fin0.125 **0.125 **
(2.28)(2.34)
FDI 0.030 **
(2.01)
Edu 0.770 ***
(4.64)
Sci 37.231 ***
(3.17)
Inv −0.138 **
(−2.43)
Ind −0.102
(−0.21)
Constant7.054 ***−2.062
(39.07)(−0.97)
Observations270270
R-squared0.9260.936
Number of regions3030
Fixed effectsYESYES
F259.3205.8
Note: *** and ** denote significance at 1% and 5% significance levels, respectively, and t-values are in parentheses.
Table 10. Moderating effects of dominance of SOEs over the economy.
Variable(1)(2)
CPU0.078 *0.046
(1.84)(1.12)
Dso−0.018−0.020
(−1.05)(−1.22)
CPU × Dso0.018 ***0.018 ***
(2.80)(2.78)
FDI 0.000 *
(1.83)
Edu 0.726 ***
(4.33)
Sci 38.594 ***
(3.32)
Inv −0.139 **
(−2.50)
Ind 0.222
(0.45)
Constant6.742 ***−1.935
(73.90)(−0.91)
Observations270270
R-squared0.9270.937
Number of region3030
Fixed effectsYESYES
F266.3209.6
Note: ***, **, and * denote significance at 1%, 5%, and 10% significance levels, respectively, and t-values are in parentheses.
Table 11. Regional heterogeneity.
Variable(1)
Eastern Region
(2)
Eastern Region
(3)
Central–Western Region
(4)
Central–Western Region
CPU0.128 **0.438 *0.1930.534 ***
(2.57)(1.68)(1.52)(2.98)
CPU2 −0.067 −0.086 **
(−1.21) (−2.40)
Control variablesYESYESYESYES
Number of regions11111919
Fixed effectsYESYESYESYES
R20.9580.9590.9700.970
Note: ***, **, and * denote significance at 1%, 5%, and 10% significance levels, respectively, and t-values are in parentheses.
Table 12. The marketization and practical application of innovation technologies.
Variable(1)(2)
CPU−0.235 **−0.360 ***
(−2.24)(−3.69)
FDI −0.032
(−0.77)
Edu −0.001
(−0.03)
Sci 2.259 ***
(4.70)
Inv 181.233 ***
(5.33)
Ind 0.029
(0.18)
Constant −0.893
(−0.63)
Observations270270
R-squared0.6480.720
Number of region3030
Fixed effectsYESYES
F47.2038.63
Note: *** and ** denote significance at 1% and 5% significance levels, respectively, and t-values are in parentheses.
Disclaimer/Publisher’s Note: The statements, opinions and data contained in all publications are solely those of the individual author(s) and contributor(s) and not of MDPI and/or the editor(s). MDPI and/or the editor(s) disclaim responsibility for any injury to people or property resulting from any ideas, methods, instructions or products referred to in the content.

