
Spatial Patterns and Drivers of China’s Agricultural Ecological Efficiency: A Super-Efficiency EBM–GeoDetector Approach

 ,
,  and
and 
Abstract
1. Introduction
2. Methods and Data
2.1. Methods
2.1.1. Undesirable EBM Efficiency Measurement Model
2.1.2. Spatial Autocorrelation Analysis
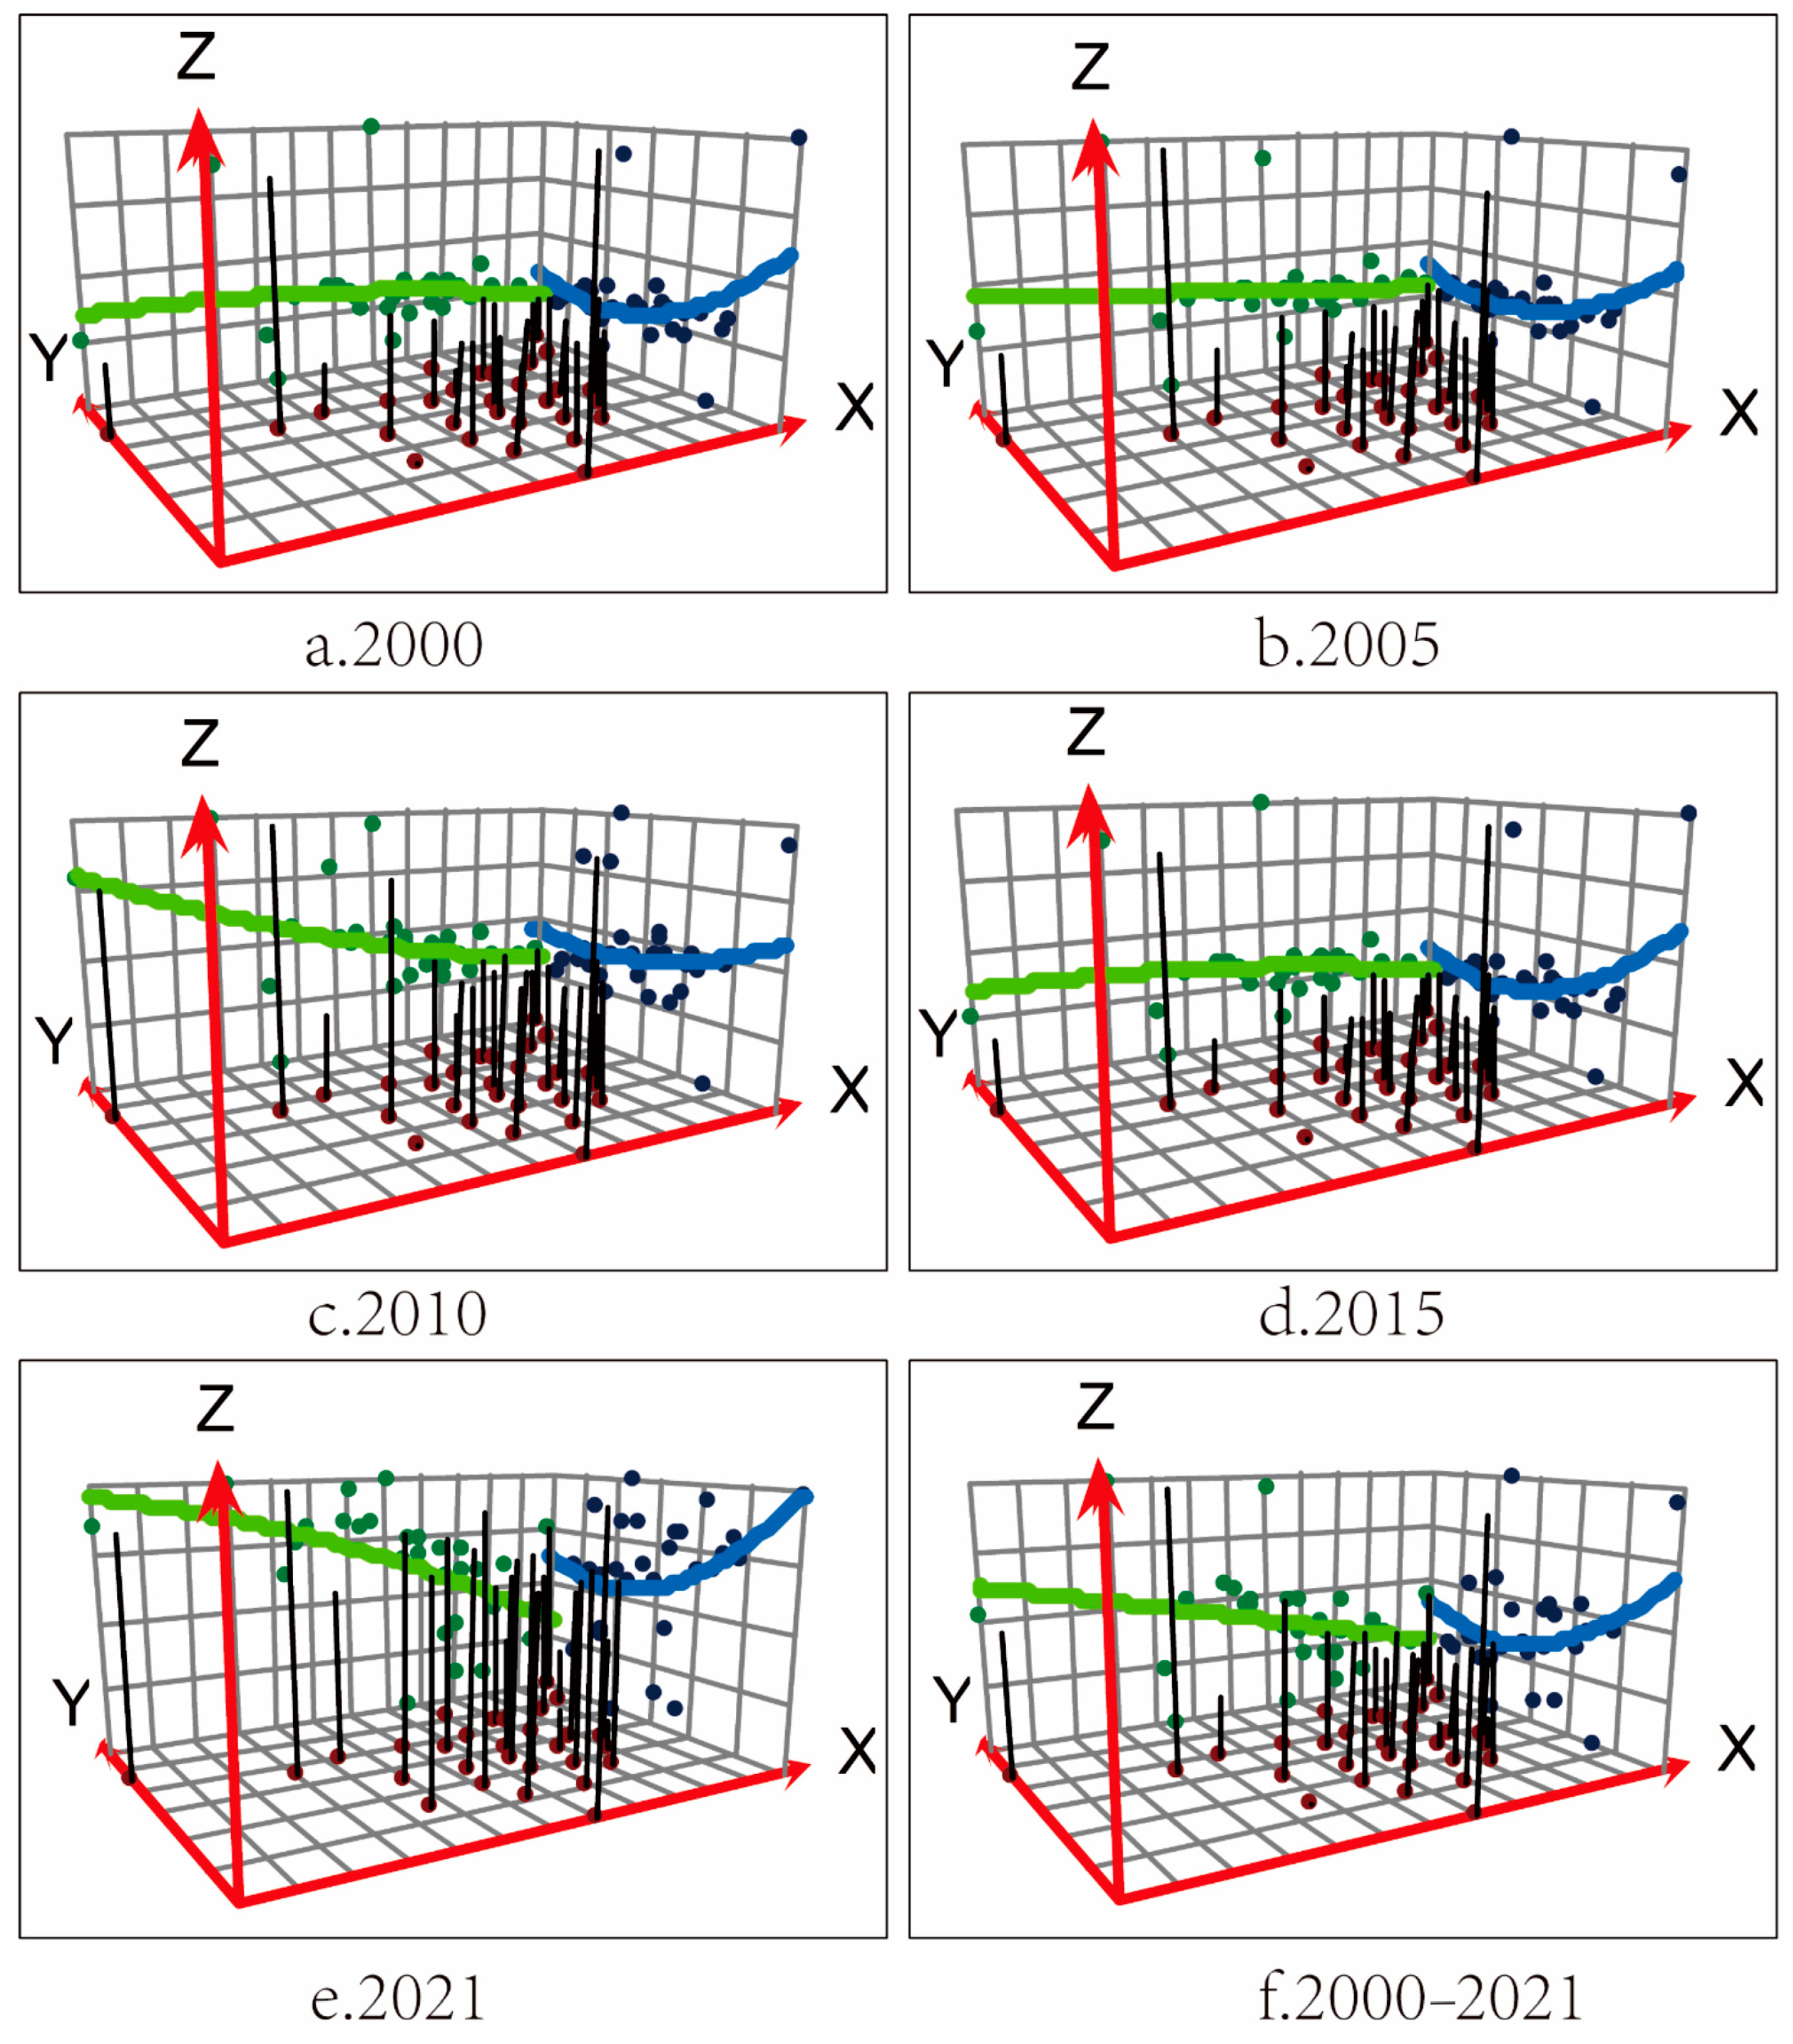
2.1.3. Trend Surface Analysis
2.1.4. Dagum Gini Coefficient and Its Decomposition
2.1.5. Kernel Density Estimation Method
2.1.6. Geodetector
2.1.7. Visual Representation of Models
2.2. Indicator Selection and Data Sources
3. Measurement and Spatial Distribution Dynamics of AEE in China
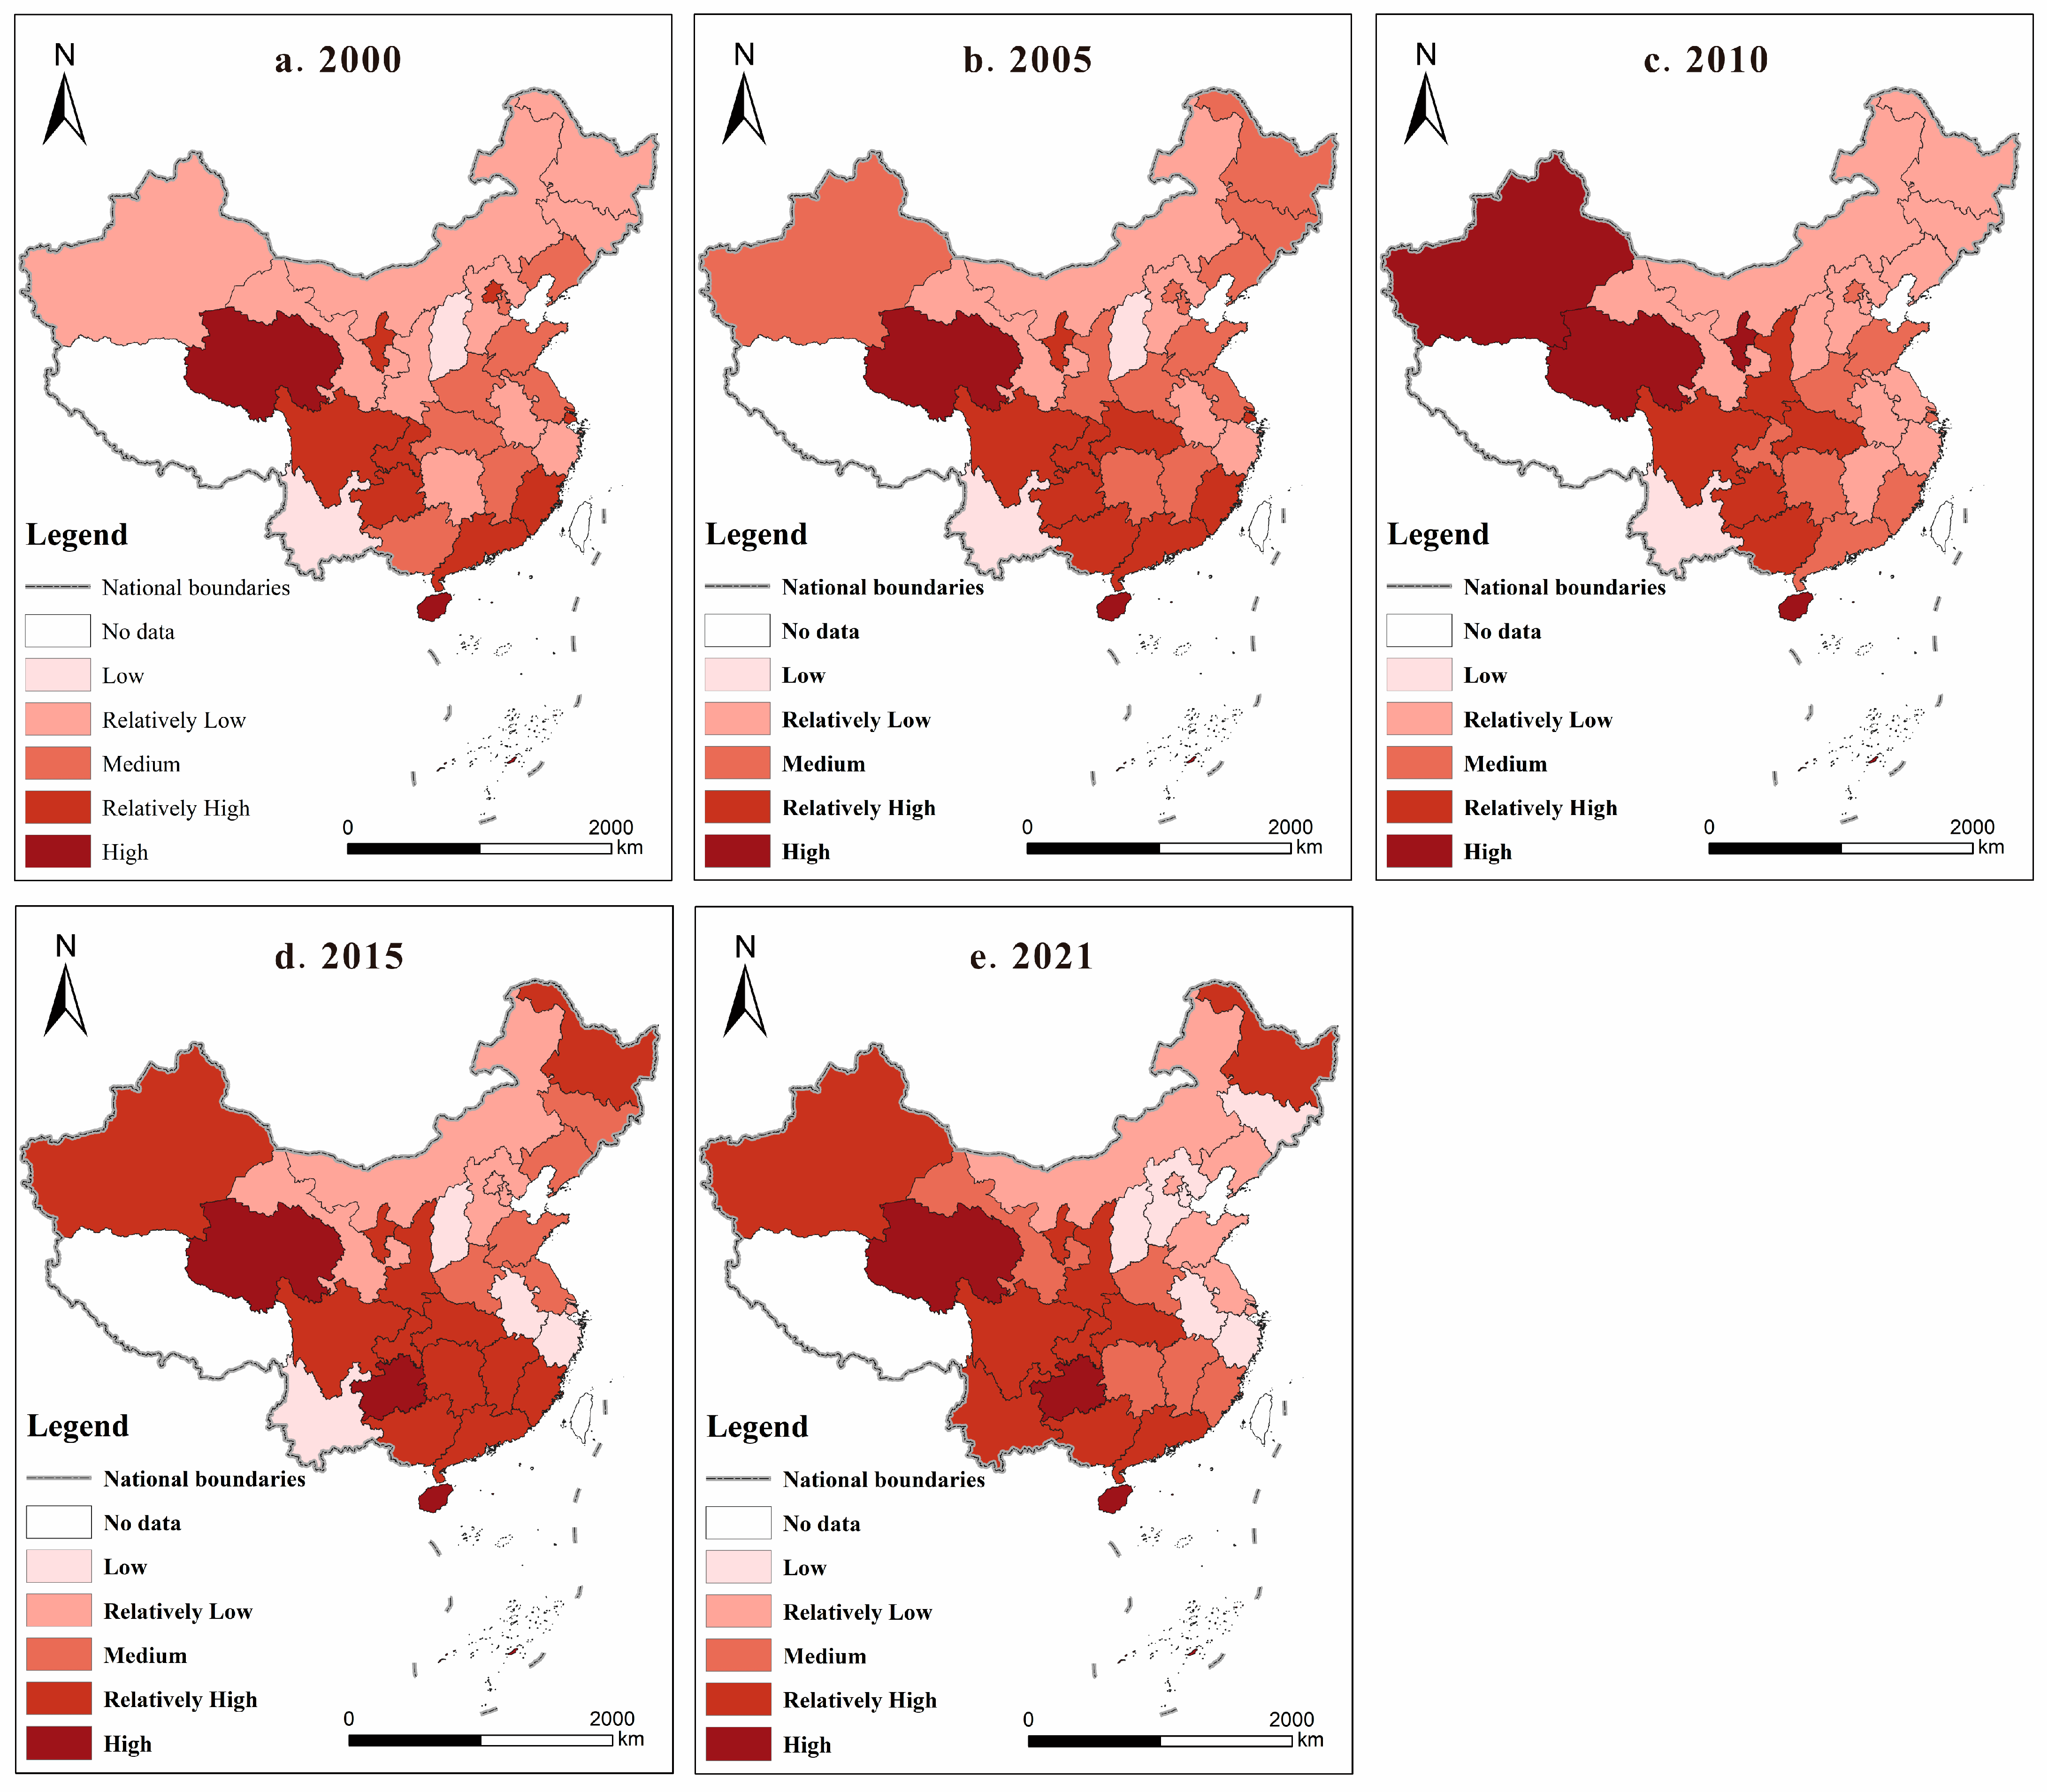
3.1. Measurement and Evaluation of AEE in China
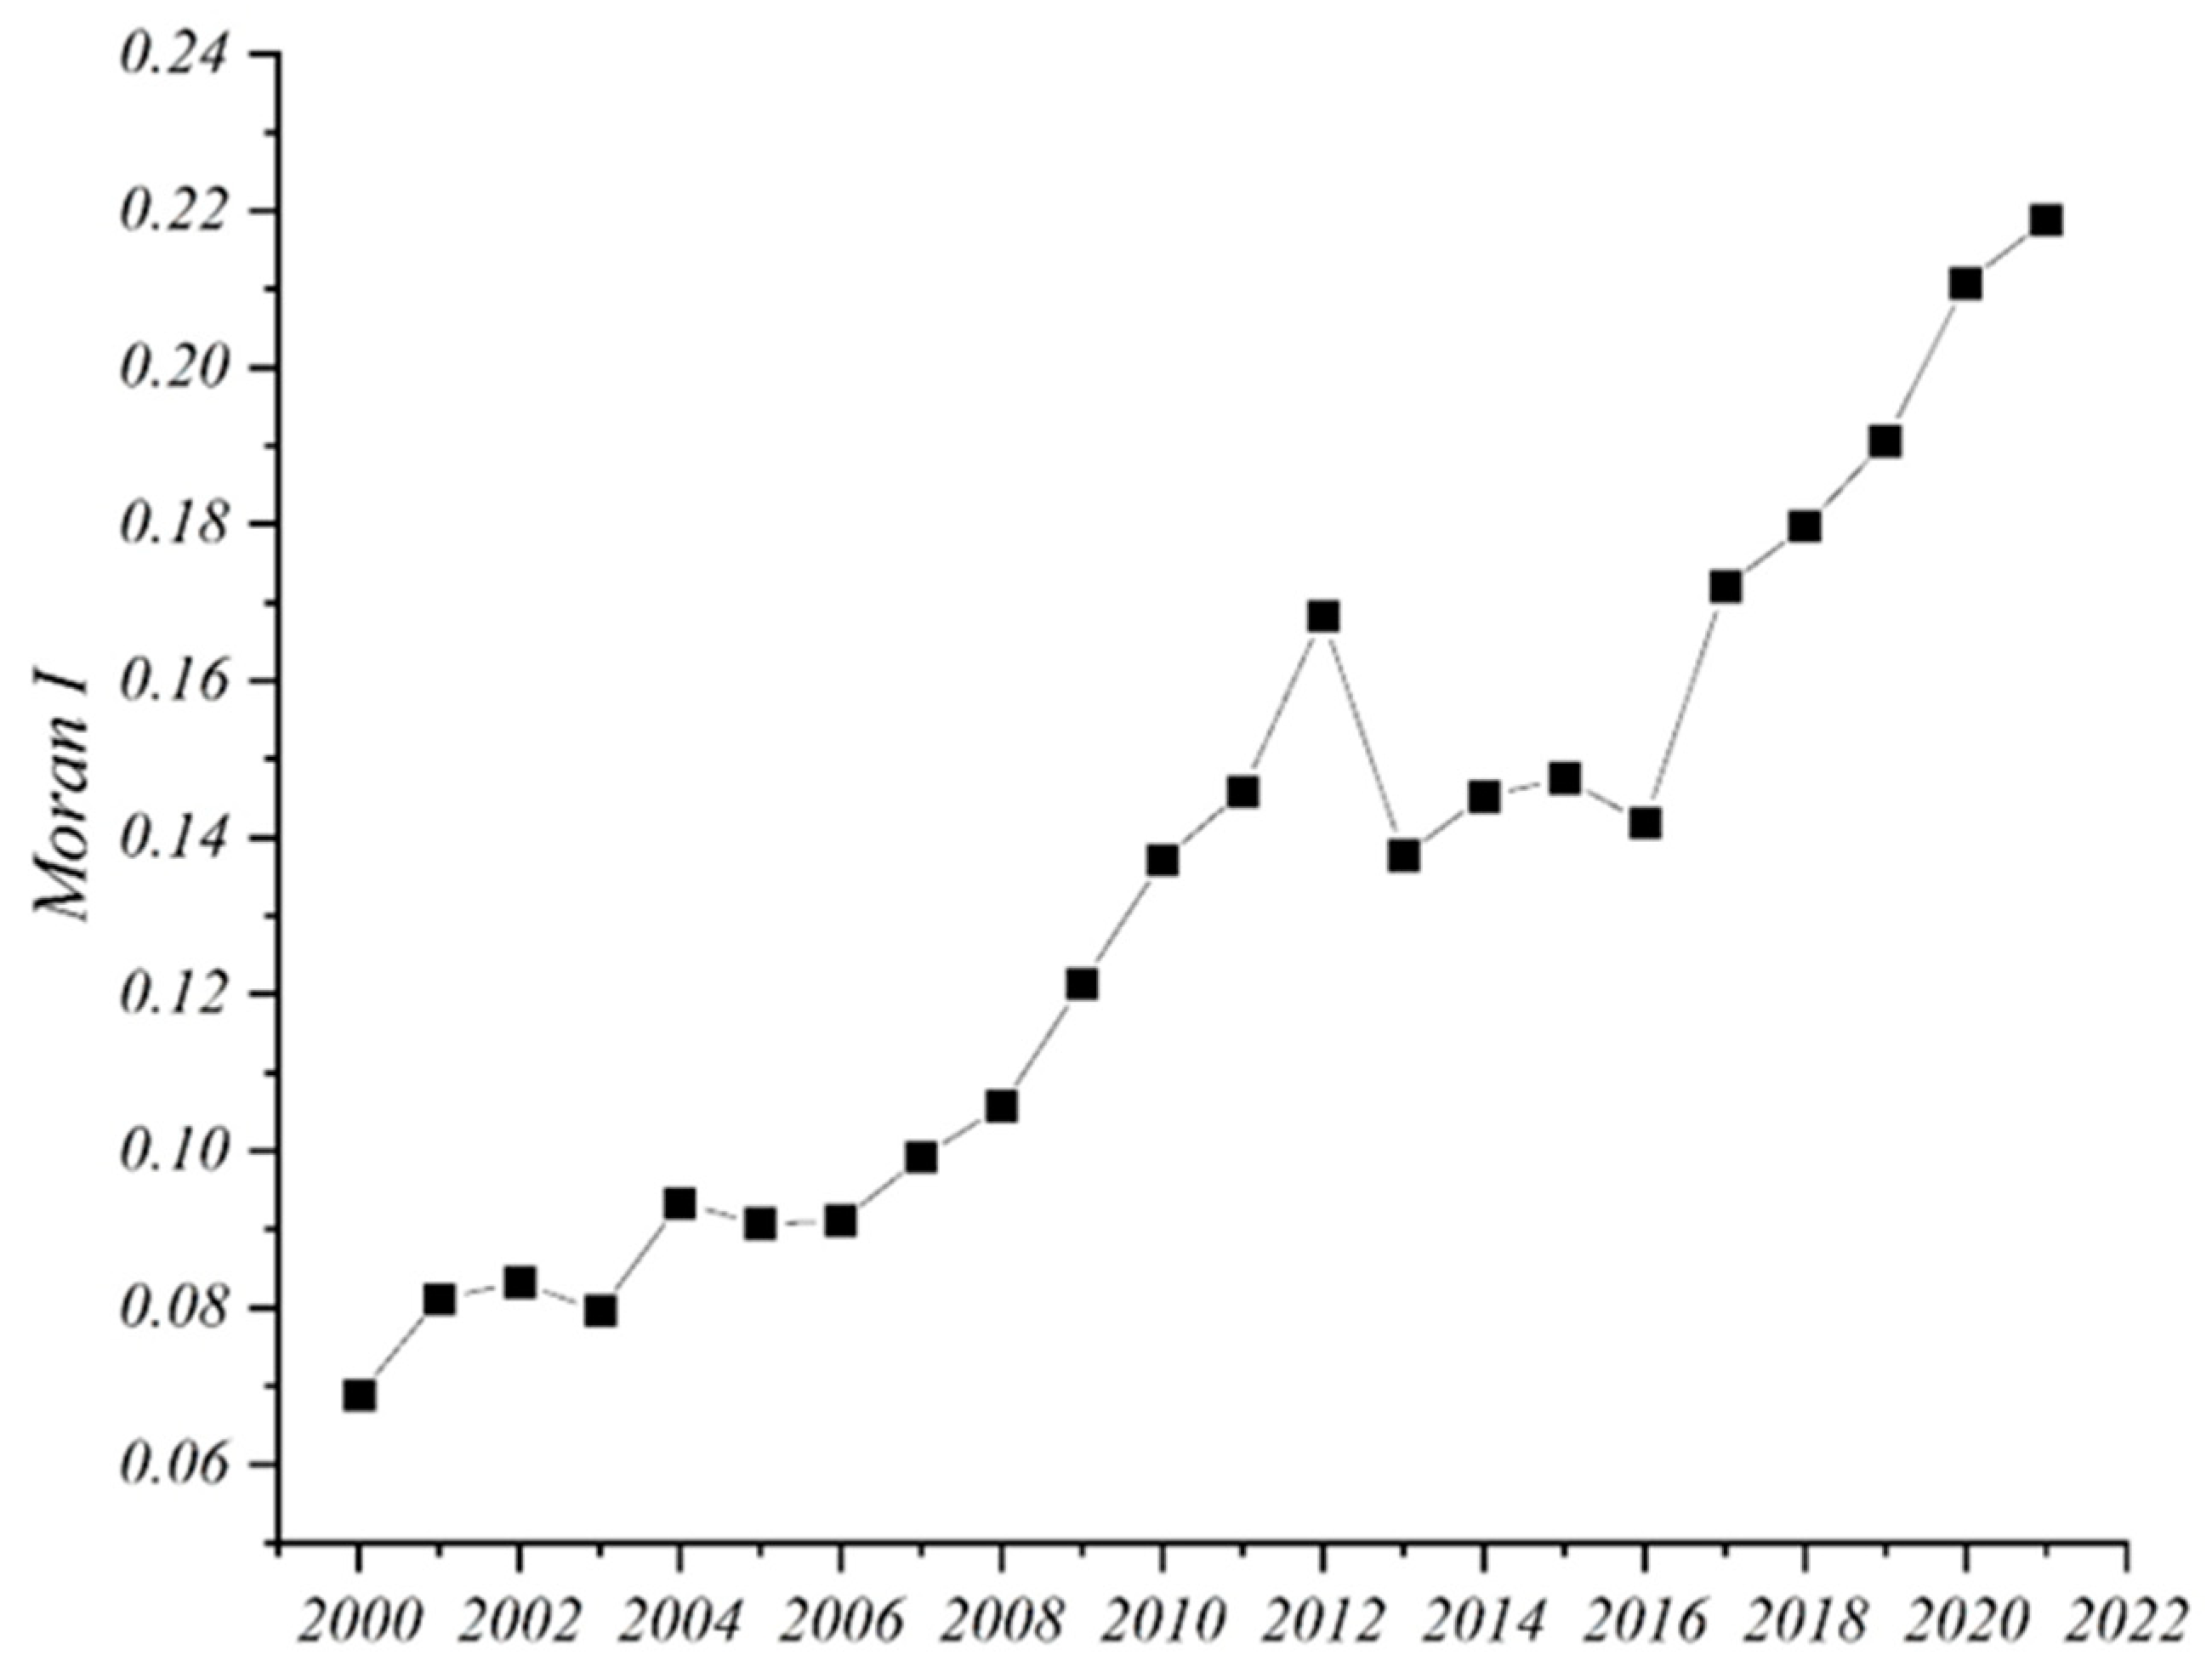
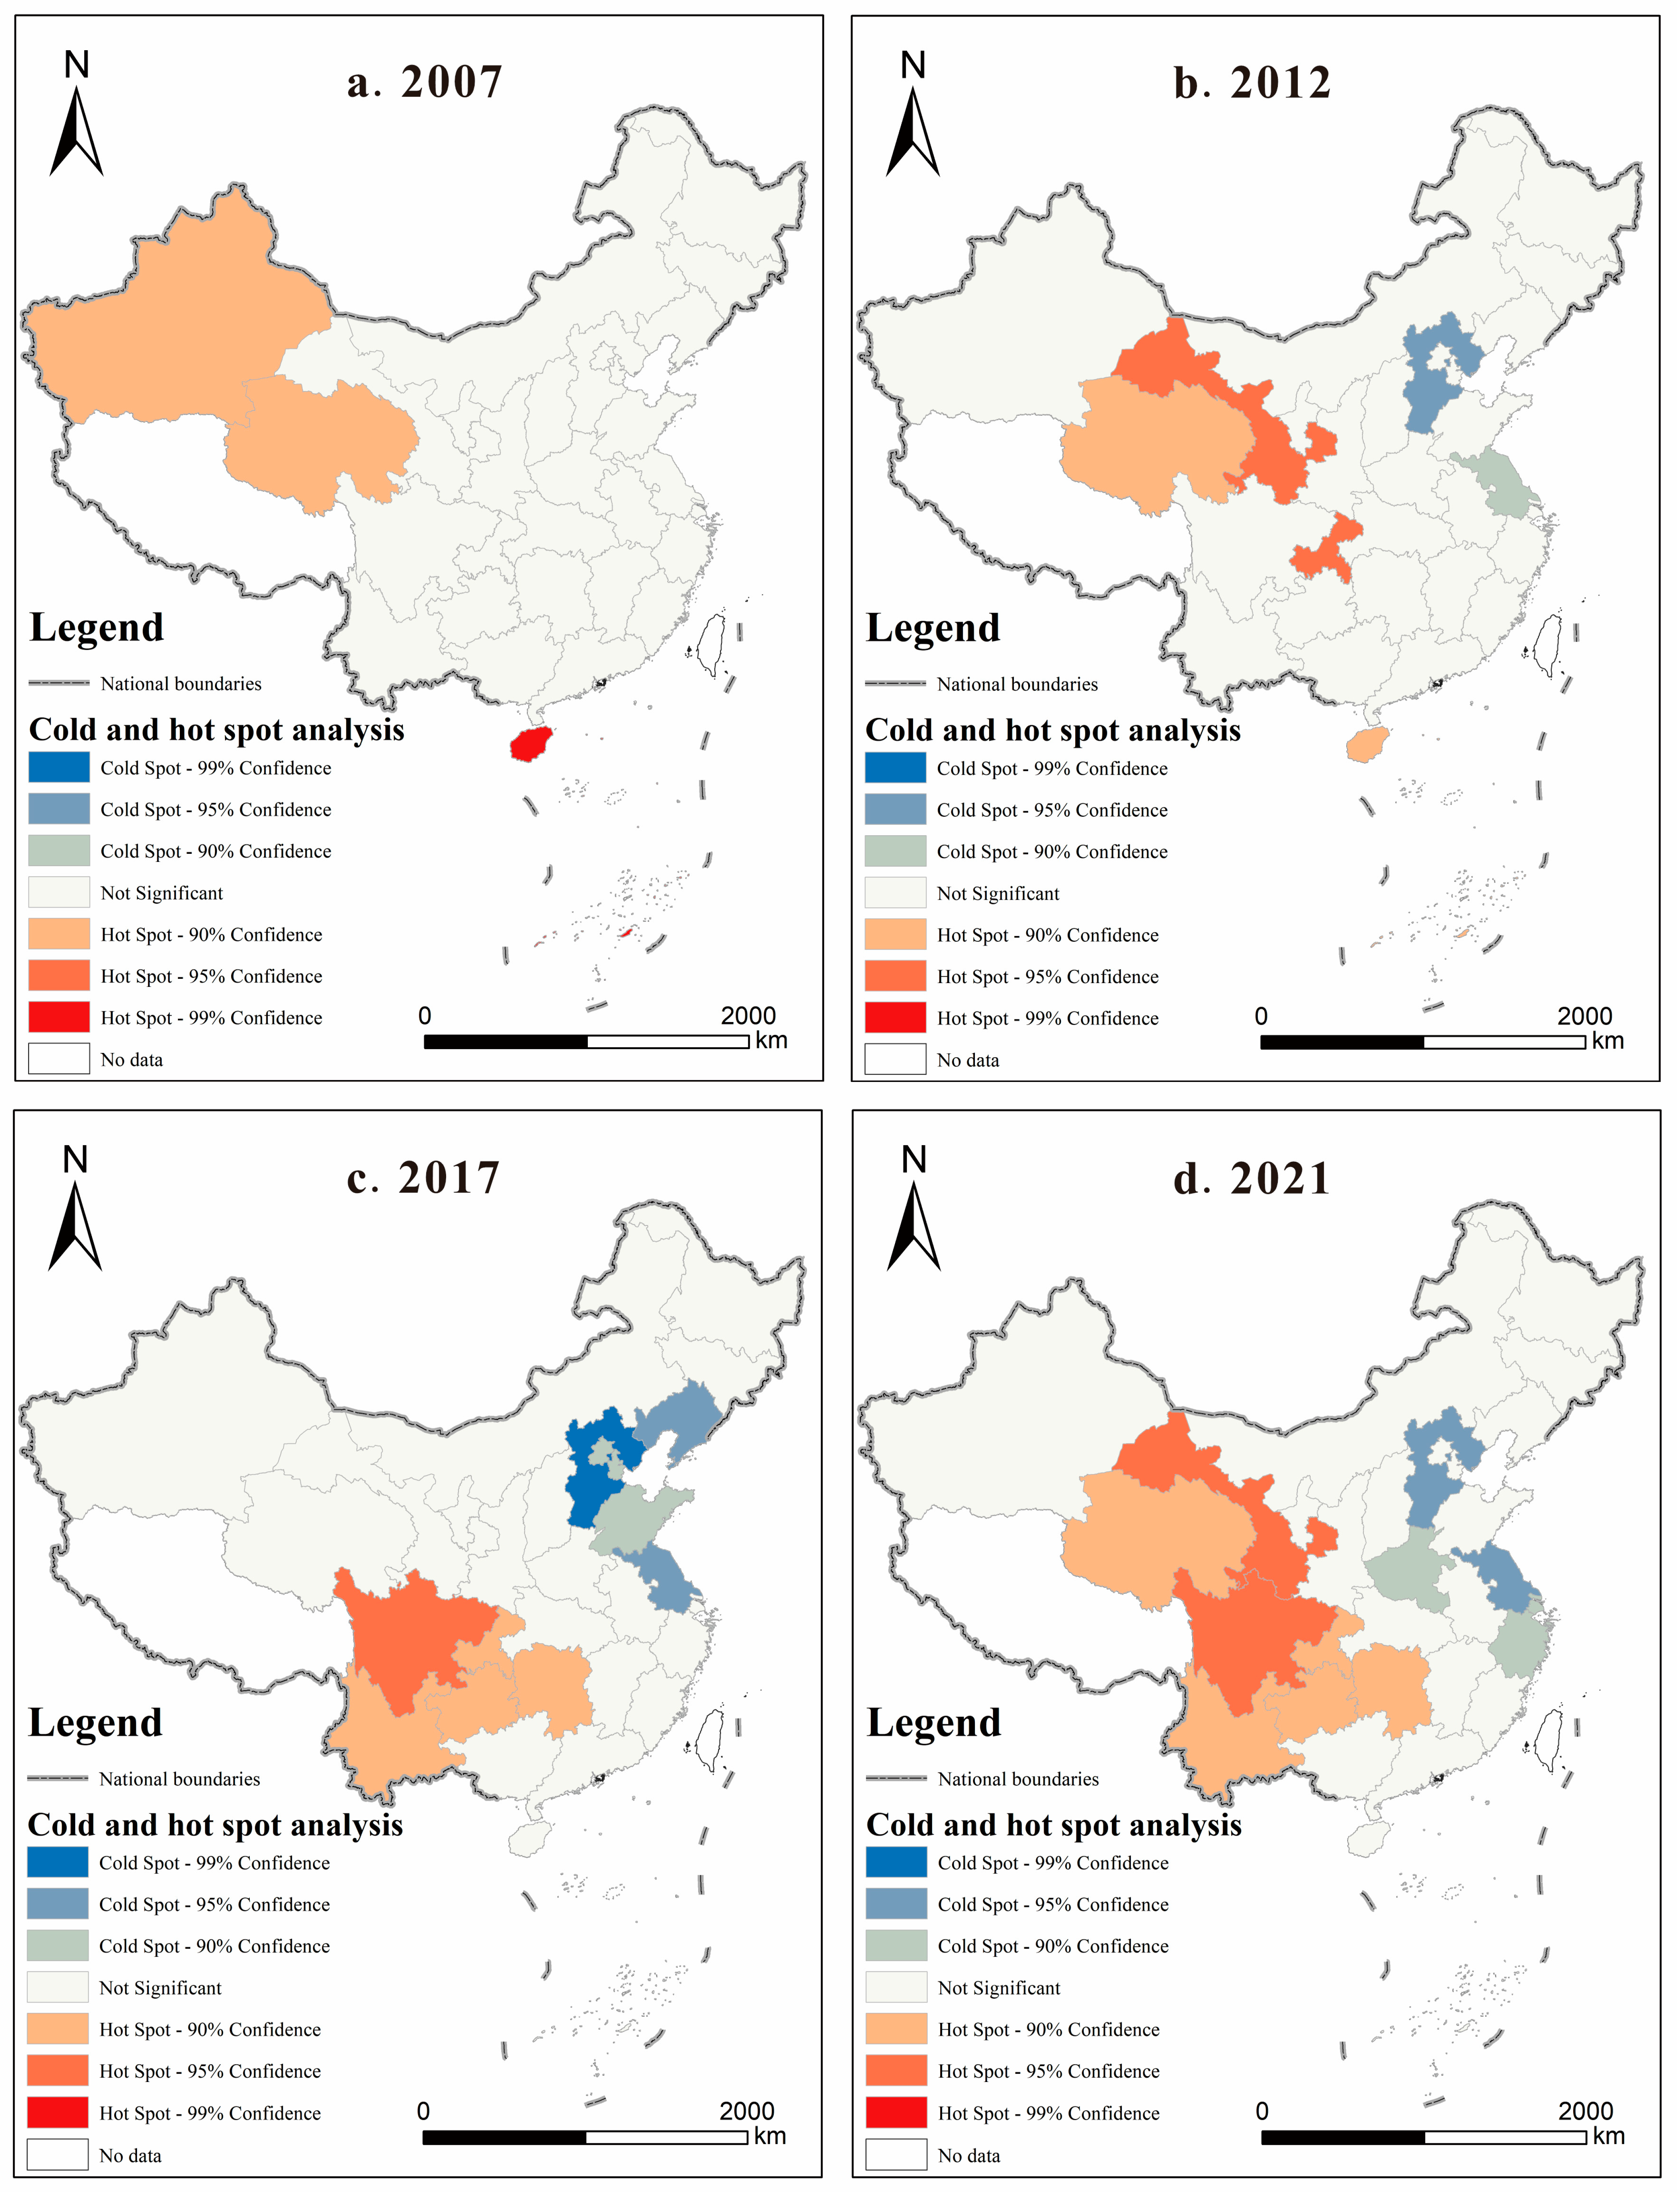
3.2. Spatial Correlation Analysis
4. Spatial Disparities and Their Origins in AEE in China
4.1. The Overall and Regional Differences in China’s AEE
4.2. Regional Differences in AEE in China
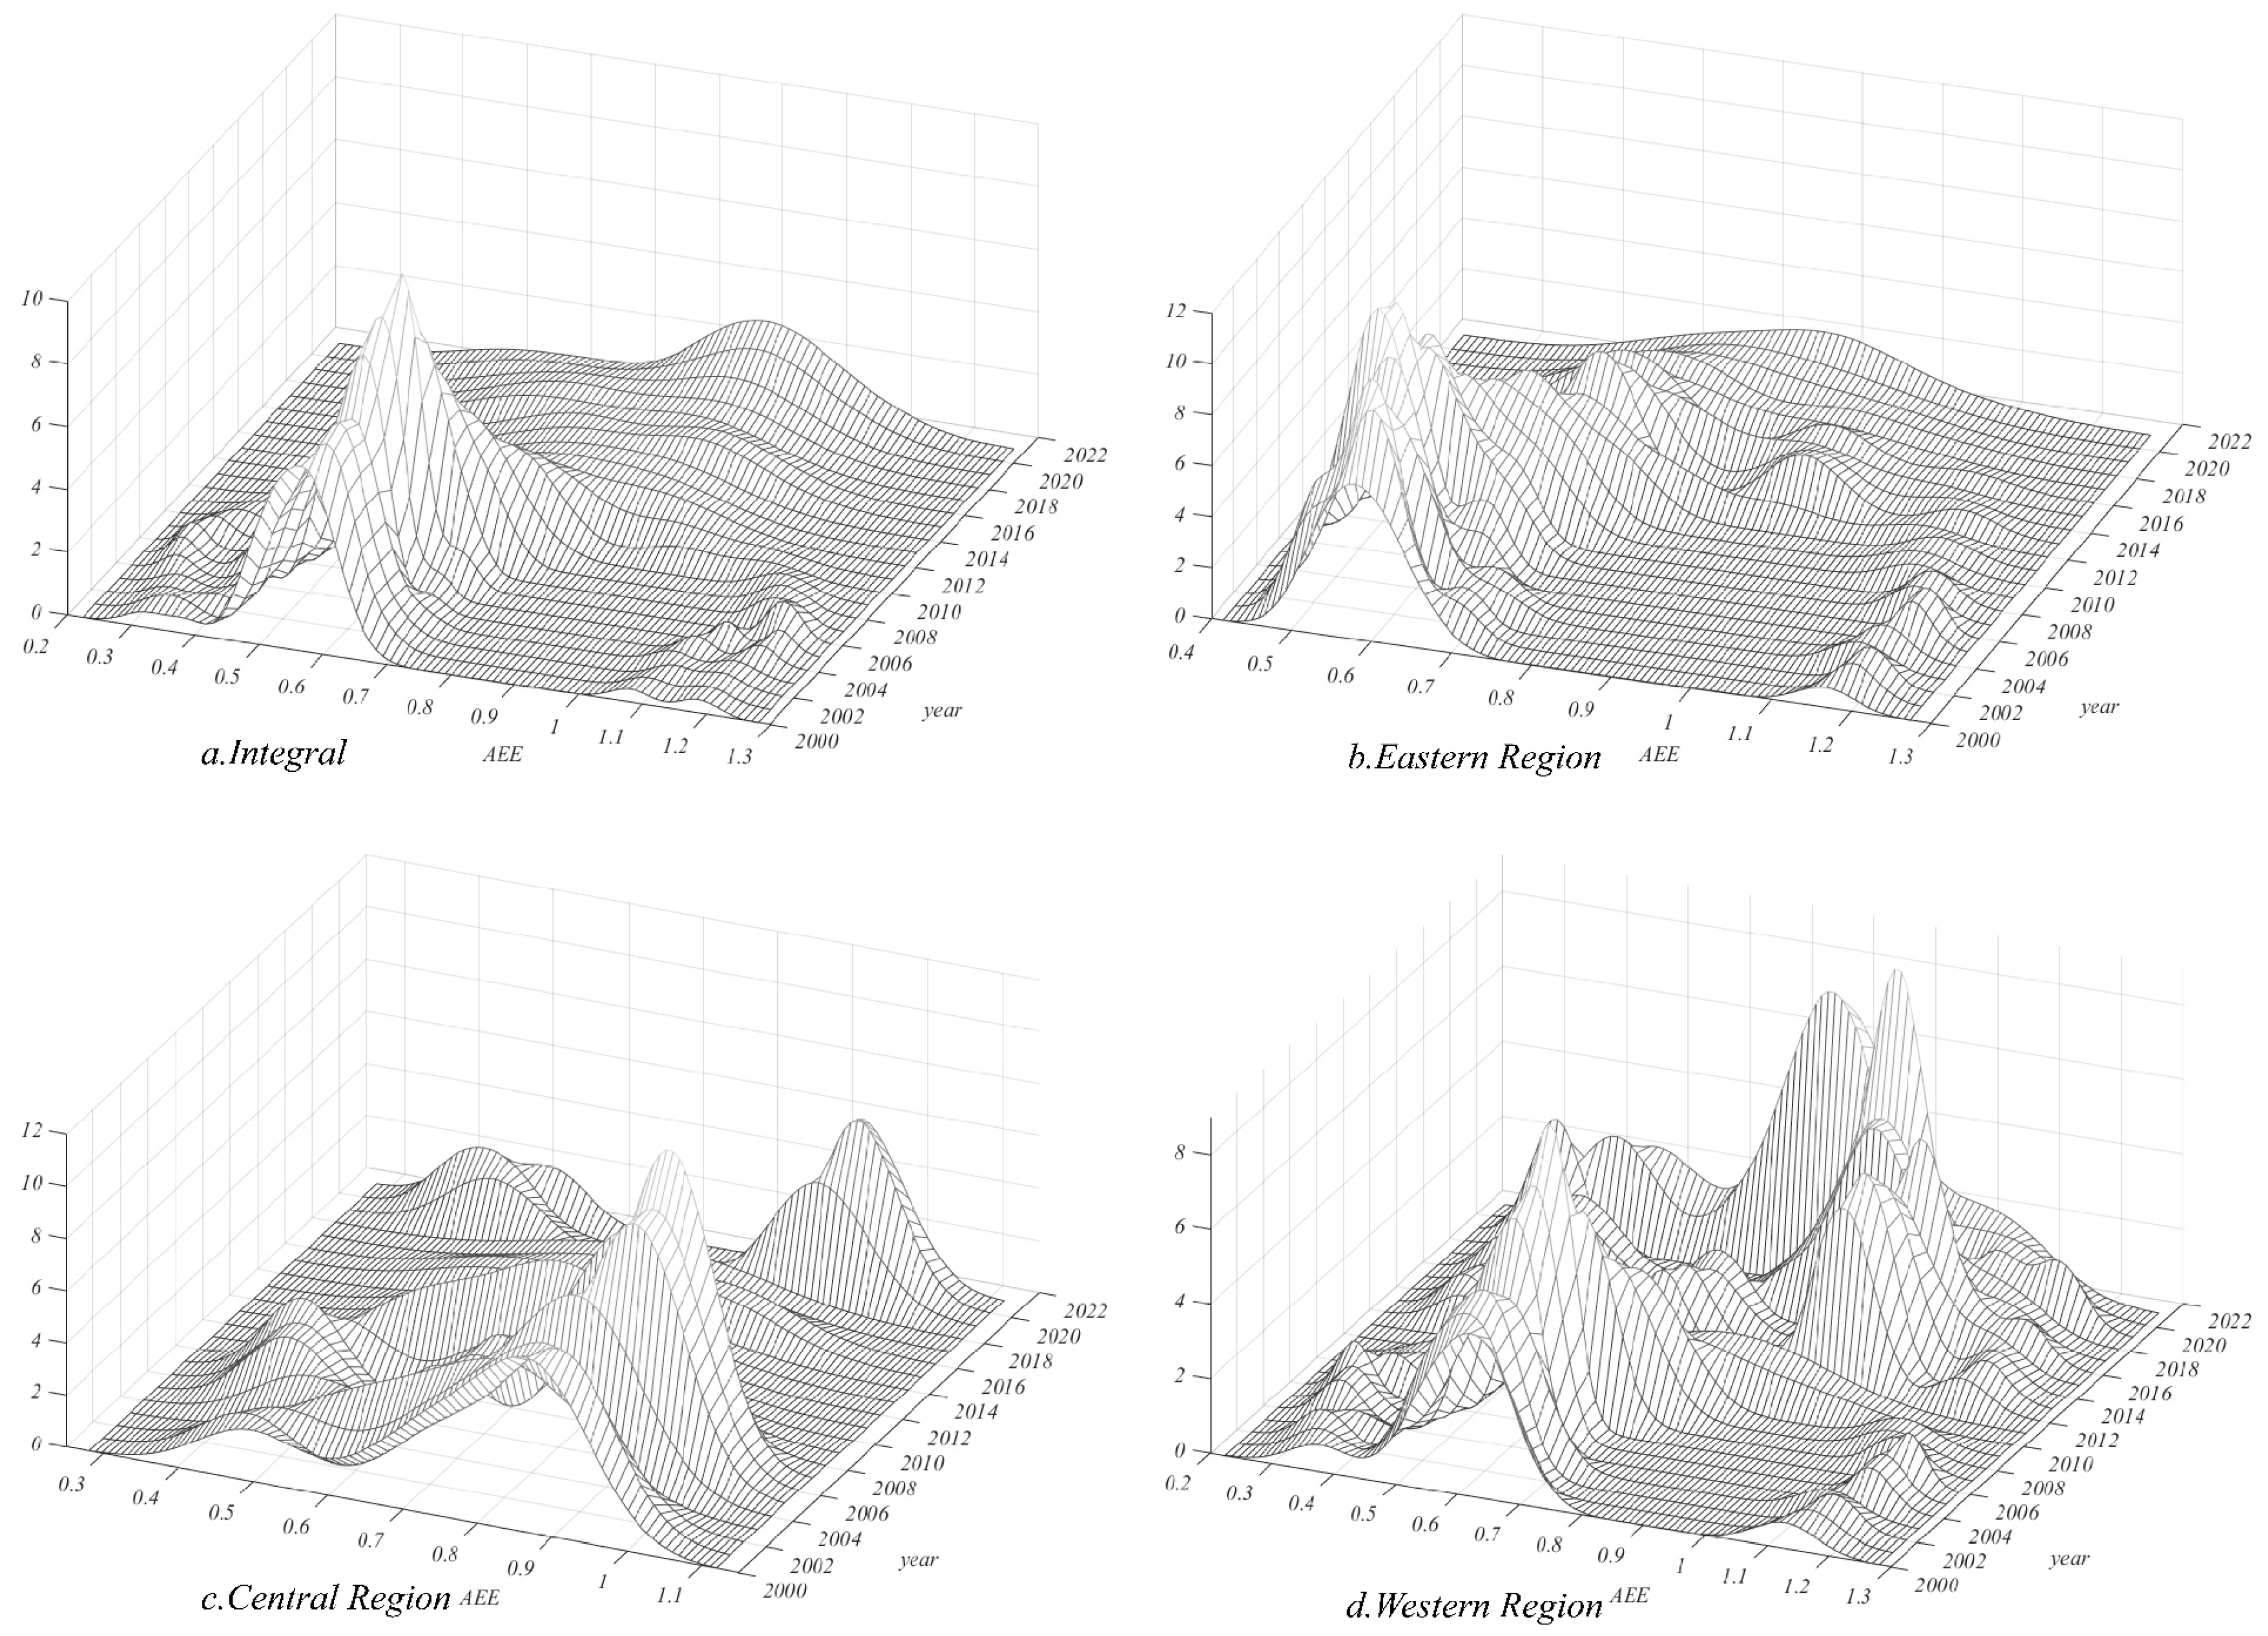
4.3. Absolute Differences in AEE in China
5. Drivers of Spatiotemporal Differentiation in AEE in China
6. Discussion
7. Conclusions and Policy Recommendations
7.1. Conclusions
7.2. Policy Recommendations
Author Contributions
Funding
Data Availability Statement
Conflicts of Interest
References
- Wu, X.R.; Zhang, J.B.; Tian, Y.; Li, P. Provincial Agricultural Carbon Emissions in China: Calculation, Performance Change and Influencing Factors. Resour. Sci. 2014, 36, 129–138. [Google Scholar]
- Kuosmanen, T.; Kortelainen, M. Measuring eco-efficiency of production with data envelopment analysis. J. Ind. Ecol. 2005, 9, 59–72. [Google Scholar] [CrossRef]
- Godoy-Durán, A.; Martínez-Paz, J.M.; Martínez-Carrasco, F. Assessing eco-efficiency and the determinants of horticultural family-farming in southeast Spain. J. Clean. Prod. 2017, 140, 784–793. [Google Scholar] [CrossRef] [PubMed]
- Roy, P.; Nei, D.; Orikasa, T.; Xu, Q.; Okadome, H.; Nakamura, N.; Shiina, T. A review of life cycle assessment (LCA) on some food products. J. Food Eng. 2009, 90, 1–10. [Google Scholar] [CrossRef]
- Ma, L.; Zhangm, Y.N.; Chen, S.C.; Yu, L.; Zhu, Y.L. Environmental effects and their causes of agricultural production: Evidence from the farming regions of China. Ecol. Indic. 2022, 144, 109549. [Google Scholar] [CrossRef]
- Lio, M.C.; Hu, J.L. Governance and Agricultural Production Efficiency: A Cross-Country Aggregate Frontier Analysis. J. Agric. Econ. 2009, 60, 40–61. [Google Scholar] [CrossRef]
- Tone, L. A slacks-based measure of efficiency in data envelopment analysis. Eur. J. Oper. Res. 2001, 130, 498–509. [Google Scholar] [CrossRef]
- Pan, D.; Ying, R.Y. Agricultural eco-efficiency evaluation in China based on SBM model. Acta Ecol. Sin. 2013, 33, 3837–3845. [Google Scholar] [CrossRef]
- Liao, J.J.; Yu, C.Y.; Feng, Z.; Zhao, H.F.; Wu, K.N.; Ma, X.Y. Spatial differentiation characteristics and driving factors of agricultural eco-efficiency in Chinese provinces from the perspective of ecosystem services. J. Clean. Prod. 2021, 288, 125466. [Google Scholar] [CrossRef]
- Hou, M.Y.; Yao, S.B. Convergence and differentiation characteristics on agro-ecological efficiency in China from a spatial perspective. China Popul. Resour. Environ. 2019, 29, 116–126. [Google Scholar]
- Liu, Y.; Zou, L.; Wang, Y. Spatial-temporal characteristics and influencing factors of agricultural eco-efficiency in China in recent 40 years. Land Use Policy 2020, 97, 104794. [Google Scholar] [CrossRef]
- Wang, Y.Q.; Yao, S.B.; Hou, M.Y.; Jia, L.; Li, Y.Y.; Deng, Y.J.; Zhang, X. Spatial-temporal differentiation and its influencing factors of agricultural eco-efficiency in China based on geographic detector. J. Appl. Ecol. 2021, 32, 4039–4049. [Google Scholar]
- Wang, B.Y.; Zhang, W.G. A research of agricultural eco-efficiency measure in China and space-time differences. China Popul. Resour. Environ. 2016, 26, 11–19. [Google Scholar]
- Zhang, T.Y.; Hou, M.Y.; Chu, L.Q.; Wang, L.L. The impact of agricultural comprehensive development on agro-ecological efficiency of China—Evidence from perspective of scale and structure. Ciência Rural Univ. Fed. Santa Maria 2023, 53, e20220096. [Google Scholar] [CrossRef]
- Qiao, G.; Chen, F.; Xu, C.; Li, Y.; Zhang, D. Study with agricultural system resilience and Agro-ecological efficiency synergistic evolutionary in China. Food Energy Secur. 2024, 13, e514. [Google Scholar] [CrossRef]
- Tang, W.; Zhou, F.; Peng, L. Does agricultural productive service promote agro-ecological efficiency? Evidence from China. Therm. Sci. 2023, 27 Pt A, 2109–2118. [Google Scholar] [CrossRef]
- Hou, M.Y.; Yao, S.B. Spatial spillover effects and threshold characteristics of rural labor transfer on agricultural eco-efficiency in China. Resour. Sci. 2018, 40, 2475–2486. [Google Scholar]
- Hou, M.Y.; Deng, Y.J.; Yao, S.B. Rural Labor Transfer, Fertilizer Use Intensity and Agro—Ecological Efficiency: Interaction Effects and Spatial Spillover. J. Agrotech. Econ. 2021, 10, 79–94. [Google Scholar]
- Fan, H.; Yang, C.H.; Wang, C.; Bi, X.; Zhang, M.M. Temporal-spatial variation and the affecting factors of protected areas in Guizhou, China. Chin. J. Appl. Ecol. 2021, 32, 1005–1014. [Google Scholar]
- Simar, L.; Wilson, P.W. Sensitivity analysis of efficiency scores: How to bootstrap in nonparametric frontier models. Manag. Sci. 1998, 44, 49–61. [Google Scholar] [CrossRef]
- Li, L.; Liu, J.; Yang, J.; Ma, X.; Yuan, H. Investigating the efficiency of container terminals through a network DEA cross efficiency approach. Res. Transp. Bus. Manag. 2024, 53, 101107. [Google Scholar] [CrossRef]
- Wei, X.; Zhao, R. Evaluation and spatial convergence of carbon emission reduction efficiency in China’s power industry: Based on a three-stage DEA model with game cross-efficiency. Sci. Total Environ. 2023, 867, 167851. [Google Scholar] [CrossRef] [PubMed]
- Sun, J.; Wang, Z.; Li, G. Hybrid DEA and neural network model for agricultural eco-efficiency prediction. Agriculture 2023, 13, 567. [Google Scholar]
- Zhao, P.; Zeng, L.; Li, P.; Lu, H.; Li, C.; Zheng, M.; Li, H.; Yu, Z.; Yuan, D. China’s transportation sector carbon dioxide emissions efficiency and its influencing factors based on the EBM DEA model with undesirable outputs and spatial Durbin model. Energy 2022, 238, 121934. [Google Scholar] [CrossRef]
- Mu, X.Q.; Guo, X.Y.; Ming, Q.Z. The Spatio-Temporal Evolution and Impact Mechanism of County Tourism Poverty Alleviation Efficiency from the Perspective of Multidimensional Poverty: A Case Study of 25 Border Counties (Cities) in Yunnan Province. Econ. Geogr. 2020, 40, 199–210. [Google Scholar]
- Dagum, C. A New Approach to the Decomposition of the Gini Income Inequality Ratio; Springer: Berlin/Heidelberg, Germany, 1998. [Google Scholar]
- Du, S.Y.; Liu, D.R.; Niu, W.T. Regional differences and distribution dynamic evolution of agriculture-oriented industries development in the context of comprehensive rural revitalization in China. China Soft Sci. 2023, 2, 46–60. [Google Scholar]
- Zhang, Y.; Li, H.; Zhang, X.; Xiong, Y. Spatial-temporal differentiation and influencing factors of agricultural eco-efficiency in China based on geographic detector. Sustainability 2021, 13, 12141. [Google Scholar]
- Zhang, K.F.; Wang, S.; Song, C.; Zhang, S.; Liu, B. Spatiotemporal heterogeneity analysis of provincial road traffic accidents and its influencing factors in China. Sustainability 2024, 16, 7348. [Google Scholar] [CrossRef]
- Wang, L.; Zhang, L.; Zhang, T.; Han, X. Infection risk factor measurement based on spatial and temporal distribution of COVID-19 nucleic acid test sites: An example from Shenzhen. Front. Public Health 2024, 12, 1420497. [Google Scholar] [CrossRef]
- Wang, J.F.; Xu, C.D. Geodetector: Principle and prospective. Acta Geogr. Sin. 2017, 72, 116–134. [Google Scholar]
- Li, B.; Zhang, J.B.; Li, H.P. Research on Spatial-temporal Characteristics and Affecting Factors Decomposition of Agricultural Carbon Emission in China. China Popul. Resour. Environ. 2011, 21, 80–86. [Google Scholar]
- Zhang, Z.; Liao, X.P.; Li, C.H.; Yang, C.; Yang, S.S.; Li, Y.H. Spatio-temporal Characteristics of Agricultural Eco-efficiency and Its Determinants in Hunan Province. Econ. Geogr. 2022, 42, 181–189. [Google Scholar]
- Wang, Z.Y.; Zhang, W.G. Cross-provincial Differences in Determinants of Agricultural Eco-efficiency in China: An Analysis Based on Panel Data from 31 Provinces in 1996–2015. Chin. Agric. Econ. 2018, 1, 46–62. [Google Scholar]
- Chen, M.H.; Liu, H.J.; Sun, Y.N. Research on the spatial differences and distributional dynamic evolution of financial development of five megalopolises from 2003 to 2013 in China. J. Quant. Tech. Econ. 2016, 33, 130–144. [Google Scholar]
- Chi, M.; Guo, Q.; Mi, L.; Wang, G.; Song, W. Spatial Distribution of Agricultural Eco-Efficiency and Agriculture High-Quality Development in China. Land Multidiscip. Digit. Publ. Inst. 2022, 11, 722. [Google Scholar] [CrossRef]
- Hou, M.Y.; Yao, S.B. Spatial-temporal evolution and trend prediction of agricultural eco-efficiency in China: 1978–2016. Acta Geogr. Sin. 2018, 73, 2168–2183. [Google Scholar]
- Chen, J.Q.; Xin, M.; Ma, X.J.; Chang, B.S.; Zhang, Z.Y. Chinese agricultural eco-efficiency measurement and driving factors. China Environ. Sci. 2020, 40, 3216–3227. [Google Scholar]
- Wang, S.Y.; Lin, Y.J. Spatial evolution and its drivers of regional agro-ecological efficiency in China’s from the perspective of water footprint and gray water footprint. Sci. Geogr. Sin. 2021, 41, 290–301. [Google Scholar]
- Zeng, F.S.; Liu, J.H. Regional Heterogeneity in China Agricultural Eco-efficiency Evaluation and Spatial Differences: Based on Combined DEA and Sptial Autocorrelation Analysis. Ecol. Econ. 2019, 35, 107–114. [Google Scholar]


| Indicator | Variables | Variables Description |
|---|---|---|
| Land input | Total crop sowing area (km2) | Reflects the actual cultivated area in agricultural production |
| Labor input | Agricultural labor force (per 10,000 people) | Converted based on the number of workers in the primary sector (gross agricultural output/gross rural agriculture, forestry, animal husbandry, and fishery output) |
| Machinery input | Total agricultural machinery power (per 10,000 kW) | Agricultural machinery is a representative tool of agricultural modernization |
| Water input for production factors | Effective irrigation area (per km2) | Agricultural water use is primarily for irrigation, which is used as a proxy |
| Fertilizer input | Amount of chemical fertilizers applied (10,000 tons, adjusted to pure content) | The inputs of fertilizers, pesticides, agricultural films, diesel, etc., are the main sources of pollution in agricultural production |
| Pesticide input | Pesticide usage (10,000 tons) | |
| Agricultural film input | Agricultural film usage (10,000 tons) | |
| Energy input | Amount of agricultural diesel used (10,000 tons) | |
| Desirable output | Total agricultural output (in 100 million yuan) | Adjusted to constant 2000 prices using the CPI index to eliminate the impact of price changes |
| Undesirable output | Carbon emissions | Explained in the text |
| Symbol | Meaning | Category | Category Description |
|---|---|---|---|
| URBAN | Urban population/total population at year-end | 5 | <10%; 10~30%; 30~50%; 50~70%; >70% |
| MCI | Average number of crop plantings per year on the same plot of land | 5 | <100%; 100~120%; 120~150%; 150~180%; >180% |
| PS | Area of food crop cultivation/area of non-food crop cultivation | 8 | Equal interval classification |
| pCDI | Per capita disposable income of rural residents | 5 | Natural breakpoint method |
| SOFSTA | Fiscal expenditure on agriculture, forestry, and water affairs/total sown area of crops | 6 | Natural breakpoint method |
| GDA | Disaster-affected agricultural area/total sown area of crops | 5 | Natural breakpoint method |
| MECH | Total agricultural machinery power/total sown area of crops | 8 | Equal interval classification |
| FUPA | Total fertilizer use/cultivated land area | 3 | <300; 300~500; >500 |
| AYOS | (Number of primary school students × 6 + number of middle school students × 3 + number of high school students × 3 + 12 + number of students with higher education)/total population | 5 | <6; 6~7; 7~8; 8~9; >9 |
| PRE | Average precipitation | 6 | Natural breakpoint method |
| TEM | Temperature | 6 | Natural breakpoint method |
| Tier | Zone | Province (Autonomous Region, Municipality) | Mean | Ranking |
|---|---|---|---|---|
| First Tier | Western | Qinghai | 1.1940 | 1 |
| Eastern | Hainan | 1.1575 | 2 | |
| Second Tier | Western | Ningxia | 0.8778 | 3 |
| Western | Guizhou | 0.8615 | 4 | |
| Western | Xinjiang | 0.8492 | 5 | |
| Western | Sichuan | 0.8438 | 6 | |
| Western | Guangxi | 0.8238 | 7 | |
| Central | Hubei | 0.8173 | 8 | |
| Western | Chongqing | 0.8139 | 9 | |
| Eastern | Guangdong | 0.8129 | 10 | |
| Western | Shaanxi | 0.8044 | 11 | |
| Eastern | Fujian | 0.7900 | 12 | |
| Eastern | Heilongjiang | 0.7776 | 13 | |
| Central | Jiangxi | 0.7397 | 14 | |
| Central | Hunan | 0.7326 | 15 | |
| Central | Henan | 0.7110 | 16 | |
| Eastern | Shanghai | 0.7082 | 17 | |
| Third Tier | Eastern | Beijing | 0.6933 | 18 |
| Eastern | Jiangsu | 0.6856 | 19 | |
| Eastern | Shandong | 0.6845 | 20 | |
| Eastern | Liaoning | 0.6753 | 21 | |
| Western | Gansu | 0.6375 | 22 | |
| Western | Inner Mongolia | 0.6363 | 23 | |
| Eastern | Jilin | 0.6278 | 24 | |
| Eastern | Hebei | 0.6259 | 25 | |
| Eastern | Tianjin | 0.6255 | 26 | |
| Eastern | Zhejiang | 0.5600 | 27 | |
| Central | Anhui | 0.5405 | 28 | |
| Central | Shanxi | 0.4846 | 29 | |
| Western | Yunnan | 0.4809 | 30 |
| Year | Moran I | Z | P |
|---|---|---|---|
| 2000 | 0.0689 | 1.2951 | 0.1953 |
| 2001 | 0.0812 | 1.449 | 0.1473 |
| 2002 | 0.0832 | 1.4768 | 0.1397 |
| 2003 | 0.0796 | 1.4304 | 0.1526 |
| 2004 | 0.0934 | 1.6102 | 0.1074 |
| 2005 | 0.0907 | 1.571 | 0.1162 |
| 2006 | 0.0911 | 1.5723 | 0.1159 |
| 2007 | 0.0992 | 1.6741 | 0.0941 |
| 2008 | 0.1057 | 1.7543 | 0.0794 |
| 2009 | 0.1213 | 1.9528 | 0.0508 |
| 2010 | 0.1371 | 2.1336 | 0.0329 |
| 2011 | 0.1459 | 2.2368 | 0.0253 |
| 2012 | 0.1682 | 2.5140 | 0.0119 |
| 2013 | 0.1377 | 2.1316 | 0.0330 |
| 2014 | 0.1452 | 2.2285 | 0.0259 |
| 2015 | 0.1476 | 2.2604 | 0.0238 |
| 2016 | 0.1419 | 2.1856 | 0.0288 |
| 2017 | 0.1721 | 2.5693 | 0.0102 |
| 2018 | 0.1797 | 2.6741 | 0.0075 |
| 2019 | 0.1906 | 2.8213 | 0.0048 |
| 2020 | 0.2108 | 3.0950 | 0.0020 |
| 2021 | 0.2188 | 3.2155 | 0.0013 |
| Year | Overall | Eastern | Central | Western |
|---|---|---|---|---|
| 2000 | 0.1343 | 0.1230 | 0.0798 | 0.1602 |
| 2001 | 0.1326 | 0.1044 | 0.0928 | 0.1706 |
| 2002 | 0.1298 | 0.1040 | 0.0808 | 0.1695 |
| 2003 | 0.1329 | 0.1049 | 0.0786 | 0.1719 |
| 2004 | 0.1201 | 0.0984 | 0.0691 | 0.1586 |
| 2005 | 0.1173 | 0.0954 | 0.0739 | 0.1501 |
| 2006 | 0.1150 | 0.0968 | 0.0722 | 0.1445 |
| 2007 | 0.1135 | 0.0935 | 0.0677 | 0.1452 |
| 2008 | 0.1161 | 0.0943 | 0.0671 | 0.1481 |
| 2009 | 0.1154 | 0.0960 | 0.0525 | 0.1491 |
| 2010 | 0.1333 | 0.0906 | 0.0773 | 0.1690 |
| 2011 | 0.1379 | 0.0906 | 0.1146 | 0.1572 |
| 2012 | 0.1386 | 0.1010 | 0.1153 | 0.1287 |
| 2013 | 0.1310 | 0.1050 | 0.1126 | 0.1195 |
| 2014 | 0.1277 | 0.1038 | 0.1208 | 0.1159 |
| 2015 | 0.1250 | 0.1023 | 0.1204 | 0.1160 |
| 2016 | 0.1276 | 0.1043 | 0.1225 | 0.1143 |
| 2017 | 0.1289 | 0.1261 | 0.1236 | 0.0779 |
| 2018 | 0.1204 | 0.1133 | 0.1224 | 0.0713 |
| 2019 | 0.1124 | 0.1106 | 0.1129 | 0.0622 |
| 2020 | 0.0998 | 0.1006 | 0.1064 | 0.0371 |
| 2021 | 0.0861 | 0.0858 | 0.0997 | 0.0335 |
| Year | East–Central | East–West | Central–West | Gw | Gnb | Gt |
|---|---|---|---|---|---|---|
| 2000 | 0.1179 | 0.1449 | 0.1340 | 0.0488 | 0.0336 | 0.9176 |
| 2001 | 0.1140 | 0.1423 | 0.1447 | 0.0470 | 0.0308 | 0.9222 |
| 2002 | 0.1078 | 0.1412 | 0.1391 | 0.0463 | 0.0299 | 0.9237 |
| 2003 | 0.1141 | 0.1428 | 0.1468 | 0.0469 | 0.0326 | 0.9204 |
| 2004 | 0.0954 | 0.1327 | 0.1258 | 0.0432 | 0.0238 | 0.9330 |
| 2005 | 0.0992 | 0.1266 | 0.1267 | 0.0417 | 0.0267 | 0.9316 |
| 2006 | 0.1007 | 0.1233 | 0.1208 | 0.0411 | 0.0299 | 0.9290 |
| 2007 | 0.0951 | 0.1225 | 0.1232 | 0.0405 | 0.0254 | 0.9341 |
| 2008 | 0.0937 | 0.1262 | 0.1296 | 0.0411 | 0.0232 | 0.9357 |
| 2009 | 0.0852 | 0.1304 | 0.1257 | 0.0409 | 0.0227 | 0.9363 |
| 2010 | 0.0902 | 0.1576 | 0.1577 | 0.0440 | 0.0378 | 0.9182 |
| 2011 | 0.1088 | 0.1592 | 0.1667 | 0.0436 | 0.0366 | 0.9198 |
| 2012 | 0.1140 | 0.1624 | 0.1735 | 0.0414 | 0.0477 | 0.9108 |
| 2013 | 0.1169 | 0.1434 | 0.1669 | 0.0408 | 0.0448 | 0.9145 |
| 2014 | 0.1185 | 0.1398 | 0.1539 | 0.0402 | 0.0394 | 0.9204 |
| 2015 | 0.1204 | 0.1357 | 0.1441 | 0.0398 | 0.0333 | 0.9269 |
| 2016 | 0.1243 | 0.1409 | 0.1446 | 0.0400 | 0.0348 | 0.9252 |
| 2017 | 0.1296 | 0.1458 | 0.1482 | 0.0383 | 0.0563 | 0.9054 |
| 2018 | 0.1240 | 0.1344 | 0.1441 | 0.0351 | 0.0548 | 0.9101 |
| 2019 | 0.1257 | 0.1260 | 0.1214 | 0.0328 | 0.0471 | 0.9201 |
| 2020 | 0.1162 | 0.1152 | 0.1098 | 0.0270 | 0.0489 | 0.9241 |
| 2021 | 0.1003 | 0.0938 | 0.1035 | 0.0239 | 0.0440 | 0.9321 |
| 2000 | 2005 | 2010 | 2015 | 2021 | ||||||
|---|---|---|---|---|---|---|---|---|---|---|
| q | p | q | p | q | p | q | p | q | p | |
| URBAN | 0.057 | 0.000 | 0.144 | 0.000 | 0.340 | 0.000 | 0.316 | 0.000 | 0.209 | 0.000 |
| MCI | 0.196 | 0.000 | 0.058 | 0.000 | 0.601 | 0.000 | 0.307 | 0.000 | 0.191 | 0.000 |
| PS | 0.526 | 0.000 | 0.588 | 0.000 | 0.108 | 0.000 | 0.029 | 0.000 | 0.201 | 0.000 |
| pCDI | 0.043 | 0.000 | 0.029 | 0.000 | 0.113 | 0.000 | 0.133 | 0.000 | 0.295 | 0.000 |
| SOFSTA | 0.154 | 0.000 | 0.711 | 0.000 | 0.500 | 0.000 | 0.520 | 0.000 | 0.225 | 0.000 |
| GDA | 0.262 | 0.000 | 0.317 | 0.000 | 0.379 | 0.000 | 0.130 | 0.000 | 0.099 | 0.000 |
| MECH | 0.324 | 0.000 | 0.344 | 0.000 | 0.225 | 0.000 | 0.105 | 0.000 | 0.081 | 0.000 |
| FUPA | 0.167 | 0.000 | 0.190 | 0.000 | 0.231 | 0.000 | 0.180 | 0.000 | 0.286 | 0.000 |
| AYOS | 0.027 | 0.000 | 0.171 | 0.000 | 0.499 | 0.000 | 0.192 | 0.000 | 0.172 | 0.000 |
| PRE | 0.110 | 0.000 | 0.170 | 0.000 | 0.093 | 0.000 | 0.217 | 0.000 | 0.431 | 0.000 |
| TEM | 0.207 | 0.000 | 0.207 | 0.000 | 0.237 | 0.000 | 0.291 | 0.000 | 0.114 | 0.000 |
Disclaimer/Publisher’s Note: The statements, opinions and data contained in all publications are solely those of the individual author(s) and contributor(s) and not of MDPI and/or the editor(s). MDPI and/or the editor(s) disclaim responsibility for any injury to people or property resulting from any ideas, methods, instructions or products referred to in the content. |
© 2025 by the authors. Licensee MDPI, Basel, Switzerland. This article is an open access article distributed under the terms and conditions of the Creative Commons Attribution (CC BY) license (https://creativecommons.org/licenses/by/4.0/).
Share and Cite
Peng, M.; Zhang, X.; Luo, J.; Jize, D.; Li, P.; Wang, H.; Xie, T.; Li, H.; Deng, Y. Spatial Patterns and Drivers of China’s Agricultural Ecological Efficiency: A Super-Efficiency EBM–GeoDetector Approach. Sustainability 2025, 17, 2739. https://doi.org/10.3390/su17062739
Peng M, Zhang X, Luo J, Jize D, Li P, Wang H, Xie T, Li H, Deng Y. Spatial Patterns and Drivers of China’s Agricultural Ecological Efficiency: A Super-Efficiency EBM–GeoDetector Approach. Sustainability. 2025; 17(6):2739. https://doi.org/10.3390/su17062739
Chicago/Turabian StylePeng, Minghong, Xiaolong Zhang, Ji Luo, Dingdi Jize, Pengju Li, Haijun Wang, Tianhui Xie, Hu Li, and Yuanjie Deng. 2025. "Spatial Patterns and Drivers of China’s Agricultural Ecological Efficiency: A Super-Efficiency EBM–GeoDetector Approach" Sustainability 17, no. 6: 2739. https://doi.org/10.3390/su17062739
APA StylePeng, M., Zhang, X., Luo, J., Jize, D., Li, P., Wang, H., Xie, T., Li, H., & Deng, Y. (2025). Spatial Patterns and Drivers of China’s Agricultural Ecological Efficiency: A Super-Efficiency EBM–GeoDetector Approach. Sustainability, 17(6), 2739. https://doi.org/10.3390/su17062739