Article

An Integrated Approach to Schedule Passenger Train Plans and Train Timetables Economically Under Fluctuating Passenger Demands

1
School of Traffic and Transportation, Beijing Jiaotong University, Beijing 100044, China
2
School of Logistics, Beijing Wuzi University, Beijing 101149, China
3
Shudao Investment Group Co., Ltd., Chengdu 610000, China
*
Author to whom correspondence should be addressed.
Sustainability 2025, 17(6), 2703; https://doi.org/10.3390/su17062703
Submission received: 22 January 2025 / Revised: 3 March 2025 / Accepted: 17 March 2025 / Published: 18 March 2025

Abstract

:
High-speed railways (HSRs), with their advantages of safety, energy conservation, and convenience, are increasingly becoming the preferred mode of transportation. Railway operators schedule full-schedule timetables to operate as many trains and serve as many passengers as possible. However, due to the fluctuation in passenger demands, it is not necessary to operate all trains in full-schedule timetable, which results in high operation costs and too much energy consumption. Based on this, we propose an integrated approach to schedule passenger train plans and train timetables by selecting trains to operate from the full-schedule timetable, adjusting their stopping scheme and operation sequence to reduce operation costs and energy consumption and contribute to sustainable development. In the scheduling process, both operation costs and passenger service quality are considered, and a two-objective model is established. An algorithm is designed based on Non-dominated Sorting Genetic Algorithms-II (NSGA-II) to solve the model, containing techniques for acceleration that utilize overtaking patterns, in which overtaking chromosomes are used to illustrate the train operation sequence, and parallel computing, in which the decoding process is computed in parallel. A set of Pareto fronts are obtained to offer a diverse set of results with different operation costs and passenger service quality. The model and algorithm are verified by cases based on the Beijing–Shanghai HSR line. The results indicate that compared to the full-schedule timetable, the operation costs under three sets of passenger demands decreased by 35.4%, 27.7%, and 15.7% on average. Compared to the genetic algorithm with weighting multiple objectives and NSGA-II without acceleration techniques, the algorithm proposed in this paper with the two acceleration techniques of utilizing overtaking patterns and parallel computing can significantly accelerate the solution process, with an average reduction of 42.9% and 38.3% in calculation time, indicating that the approach can handle the integrated scheduling problem economically and efficiently.

1. Introduction

Over the past few years, HSRs have witnessed remarkable expansion and have become a prominent mode of transportation globally. HSRs offer numerous advantages, including environmental protection and energy efficiency [1,2]. Notably, the primary energy source for HSRs is electricity rather than fossil fuels such as oil. Consequently, they significantly reduce reliance on oil, enhance the energy consumption framework, and propel sustainable energy progress.
The passenger train plan and train timetable are scheduled before HSR operation. The passenger train plan specifies the frequency and stopping patterns of trains, and the timetable contains the arrival and departure time of trains at the stations along the railway line. The passenger train plan determines the capacity of serving passengers with different origin and destination stations. The train timetable assures the safety and efficiency of train operation, which is scheduled according to the passenger train plan [2]. Stations A, B, C, and D are four stations along the railway line. Figure 1a shows a schematic of a passenger train plan, and Figure 1b shows a schematic of the train timetable corresponding to the plan. We can see that the passenger train plan in Figure 1a shows the origin and destination station of the trains and the stops along the journey, while the train timetable in Figure 1b further shows their departure and arrival times at the stations and the operation sequence in the sections.
The railway operators schedule a large-capacity train timetable, including plenty of trains, which is referred to as the full-schedule timetable, to serve large passenger demands. However, passenger demands fluctuate significantly over time, and it is not necessary to operate trains according to the full-schedule timetable all the time. When passenger demands decrease, some trains in the full-schedule timetable can be canceled to reduce the operation costs and energy consumption, which holds significant implications for sustainable development.
We suppose that the train timetable in Figure 2b is a full-schedule timetable, and the passenger train plan corresponding to it is shown in Figure 2a. Stations A, B, C, and D are four stations along the railway line. We can see that four trains are operated, and the service frequency of passenger demand A–D (the passenger demands from station A to D; the same below), A–C, B–D, A–B, B–C, and C–D are 2, 3, 1, 2, 1, and 1, respectively.
Given that the passenger demands decrease, and the minimum service frequencies of demand A–D, A–C, B–D, A–B, B–C, and C–D decrease to 2, 2, 1, 2, 1, and 1, we can consider implementing the following two scheduling schemes to meet current demands, which are scheme 1 as shown in Figure 3a,b and scheme 2 as shown in Figure 3c,d. In scheme 1, two trains operate, which is fewer than the three in scheme 2, thereby reducing the operating costs. Nevertheless, owing to the departure and arrival supplement time and the dwell time in stations, the operation time of trains ① and ② in scheme 1 is longer than that in scheme 2. Thus, compared with scheme 2, the passenger demands served by trains ① and ② will take a longer time to finish their trips in scheme 1, which decreases the passenger service quality. From the perspective of railway operators, they want to operate as few trains as possible to meet passenger demands. From the perspective of passengers, a passenger train plan and train timetable with high service quality are expected, aiming to enhance the travel experience. Thus, it is of great significance to sustainability to study how to schedule passenger train plans and train timetables according to the full-schedule timetable.
Based on the above analysis, we illustrate the problem to be studied in this paper. Due to the fluctuation in passenger demands, in certain situations, the passenger transportation capacity of a full-schedule timetable is far greater than the passenger demands. In such cases, operating the full-schedule timetable will lead to serious operation costs and energy consumption. Therefore, based on the full-schedule timetable, we propose an integrated approach to schedule train timetables and passenger train plans by selecting operating trains, adjusting train stopping schemes, and adjusting train operation sequences so as to deal with the reduced passenger demands. Then, all passengers are assigned to the trains in the timetable. This paper aims to minimize operation costs and maximize passenger service quality. The operation costs are related to the train operation distance and the number of train stops. The longer the operation distance and the more the number of stops, the greater the economic cost and energy consumption. Passenger service quality is related to the passengers’ travel distance and extra travel time. The longer the travel distance and the shorter the extra travel time, the higher the passenger service quality.
Figure 4 shows an example of the integrated scheduling approach. Suppose that the timetable in Figure 4a is a full-schedule timetable, including four stations, which are stations A–D, and five trains, which are trains ①–⑤. The timetable scheduled by the integrated approach is shown in Figure 4b, including four trains. For the two adjacent trains in one section, we denominate the train in front as the preceding train and the one behind as the following train. For example, train ② is the preceding train of train ③, and train ③ is the following train of train ② in section C–D. We can see that after adjusting, train ① is canceled, train ② adds an additional stop at station B, trains 3 and 4 swap their initial operation sequences, train ③ overtakes train ④ at Station C, and train ⑤ cancels a stop at station C. Then, with the objective of maximizing passenger services, a passenger assignment plan is generated to serve passengers in the optimized timetable shown in Figure 4b.
The following assumptions are made:
  • The arrival and departure time, origin and destination stations, running time, and maximum passenger capacity of the trains in the full-schedule timetable are known.
  • The passenger demands are known, and all passengers are aware of their travel information in advance and can board and get off trains efficiently, without considering the impact of waiting, boarding, and alighting processes on passenger service quality.
  • It is assumed that the train operation time is strictly in accordance with the timetable, without considering the impact of train delays on passenger service quality.
  • It is assumed that the operating costs generated by each stop are the same.
  • For the trains that operate on more than one railway line, which we call “cross-line trains”, we only consider the portion operating on the current railway line to simplify the problem.
On this basis, considering minimizing operation costs and maximizing passenger service quality, a two-objective model is established, and a series of constraints are implemented to ensure safe and efficient operation for trains. Based on the NSGA-II, an algorithm is proposed, employing two acceleration techniques utilizing overtaking chromosomes and parallel computing. A Pareto front can be obtained, considering both operation costs and passenger service quality, to offer a range of solutions for operators to select from, so as to meet passenger demands.
The contribution of this paper can be summarized as follows:
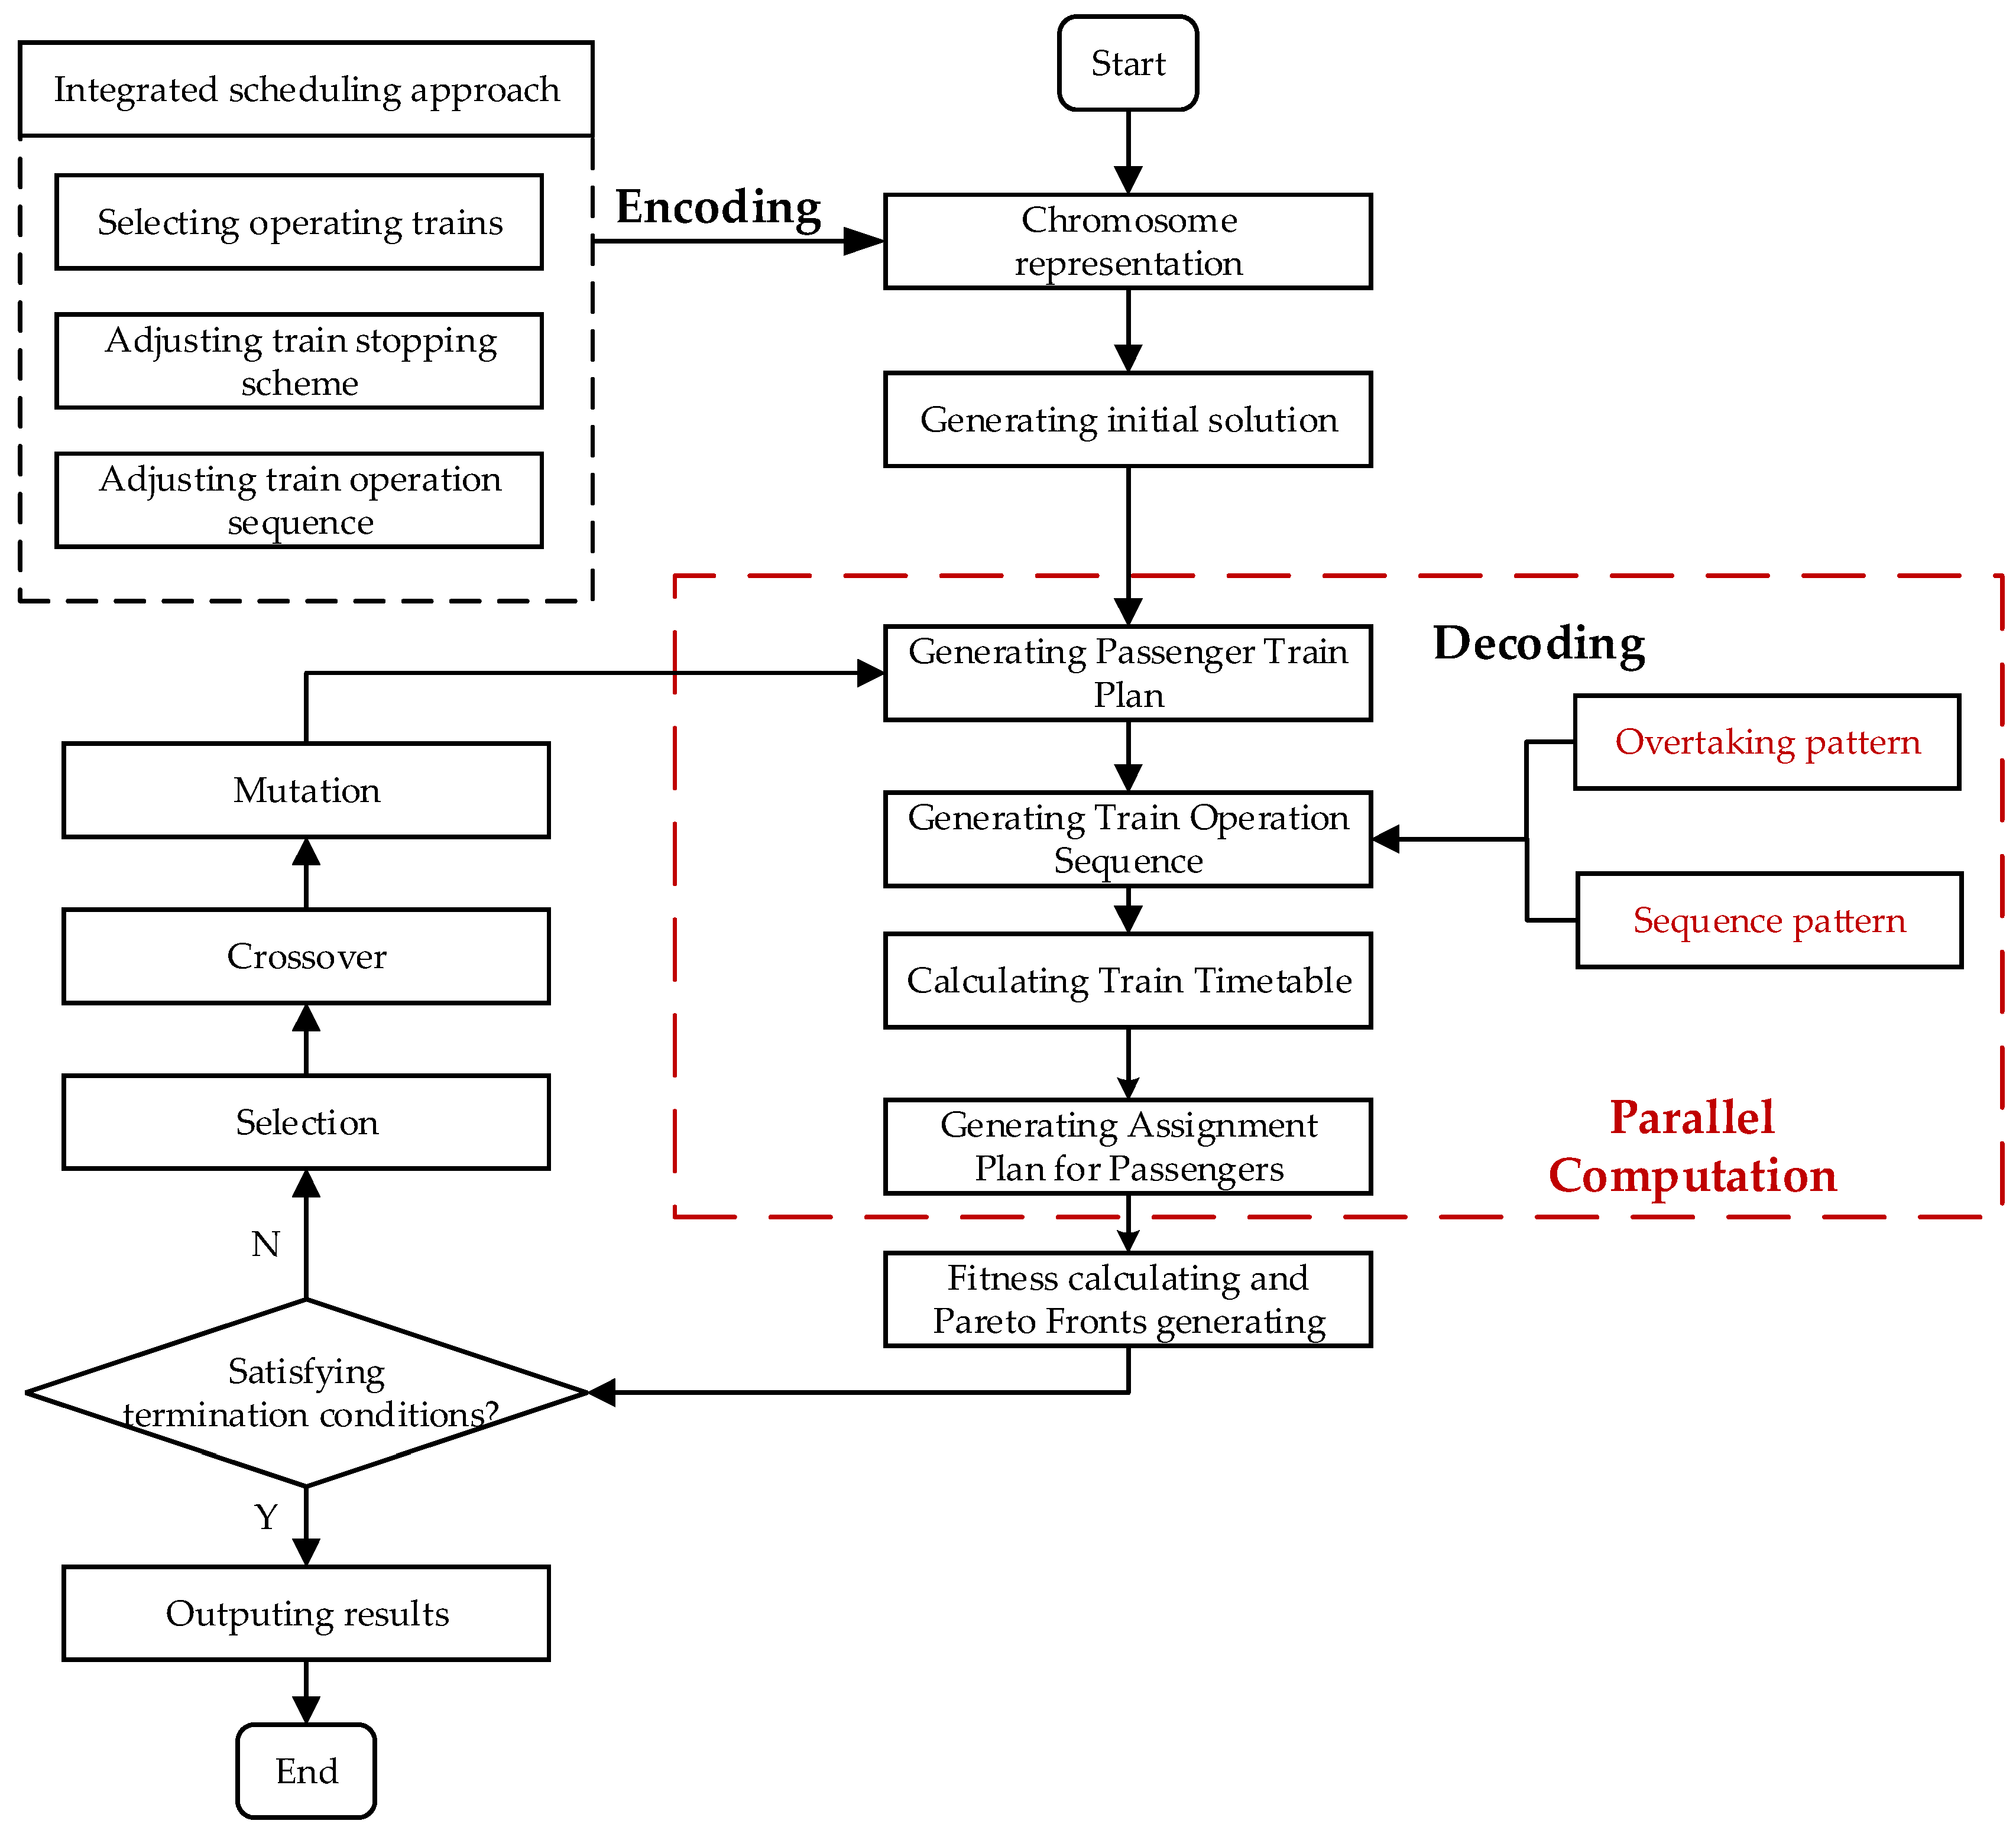
  • An integrated approach is proposed to synergistically schedule the passenger train plan and train timetable, containing measures of selecting operating trains, adjusting the train stopping scheme, and adjusting the train operation sequence.
  • A two-objective model is established to integrally optimize the timetable and passenger train plan, aiming to minimize train operation costs and maximize passenger service quality, and an algorithm based on NSGA-II is designed to solve the model.
  • Two key acceleration techniques, which utilize overtaking chromosomes and parallel computing, are designed to accelerate the algorithm.
The remainder of this paper is organized as follows. In Section 2, we conduct a literature review, summarize the limitations of existing studies on scheduling the train timetable and passenger train plan, and further introduce the contribution and novelty of this paper. In Section 3, we establish a two-objective model to handle the integral scheduling of the train timetable and passenger train plan. In Section 4, we design an algorithm based on NSGA-II to solve the model. In Section 5, we design cases based on the Beijing–Shanghai HSR line to verify the validity of the model and algorithm. In Section 6, we summarize our research and propose a future research direction.

2. Literature Review

In recent years, sustainable development has received considerable attention within the research community. Yadav [3] examined the Green Lean Six Sigma (GLSS) methodology and illustrated the current application landscape and the potential advantages it offers, thereby paving the way for subsequent research. Yaser [4] conducted an extensive review on lean manufacturing and Industry 4.0, and, based on this, formulated a conceptual framework designed to facilitate the integration of lean manufacturing principles with the technological advancements of Industry 4.0.
High-speed rail (HSR) is emerging as a significant area of research in the context of sustainable development, with an increasing number of studies focusing on its sustainability aspects. Azzouz [1] identified key social, economic, and environmental factors that are crucial for assessing the sustainable performance of HSR systems to evaluate the sustainable performance of HSRs.
Passenger train planning and train timetable scheduling are critical components of high-speed rail (HSR) research, receiving considerable attention in the literature. From the perspective of research scope, this field can be categorized into three main aspects: passenger train planning, train timetable scheduling, and the integrated scheduling of passenger train plans and train timetables.
As for passenger train planning, several studies have contributed to the advancement of this field by proposing diverse methodologies and models that handle various problems of railway transportation organization. Wu [5] studied the passenger flow distribution method, introduced the level of passenger service through the three-dimensional passenger service network, and formulated a reasonable passenger flow distribution algorithm formula. Liu [6] proposed a multi-objective optimization model, aiming to minimize the total passenger train stop times and extra passenger transportation costs, which was applied to the Beijing–Tianjin intercity railway line. Nie [7] proposed a weekly line planning (WLP) model considering both peak and nonpeak passenger demands, aiming to maximize the defined supply–demand matching utility and minimize train operational cost, and developed a customized genetic algorithm (GA). Xia [8] studied a mixed-integer linear programming model to collaboratively optimize train stop planning and ticket pricing, aiming to maximize the total ticket revenue. Li [9] investigated train line planning under multiple formations (MFTLP) to enhance adaptation to passenger demand fluctuations. A multi-objective, mixed-integer, programming model was constructed, aiming to minimize comprehensive train operation costs, maximize passenger demand satisfaction, and maximize the stability of the train line planning. Qi [10] studied an optimization model of a passenger train plan based on a stop schedule plan, considering the train–origin/terminal–station, paths, train grade, quantity of dispatched trains, stop schedule plan, and MATLAB 7.1, which was used to calculate the model.
As for train timetable scheduling, the optimization of train timetables is a critical area of research in railway transportation, aiming to enhance operational efficiency and service quality. Recent studies have explored various models and algorithms to address the complicated train timetabling problem. Zhi [11] proposed a common model for railway train timetable optimization using an event–activity network to represent the timetable. Constraints and possible objectives for the model were defined, providing a foundation for future research. Higgins [12] presented a model for optimizing train timetables in single-track corridors, prioritizing train passage based on remaining trains and current delays to reduce delays and energy use. Ghoseiri [13] utilized a multi-objective model to minimize fuel consumption and travel time. Zhou [14] explored single-track timetabling, recognizing section and station capacities as constraints. They applied branch-and-bound and Lagrangian relaxation algorithms to compute timetables that limit total travel time and minimize delays under resource limitations. Liao [15] addressed the train timetabling problem under complex real-life conditions, and a Lagrangian relaxation-based approach was used to decompose the problem into train-independent, shortest path sub-problems, which are solved in parallel. Wu [16] focused on optimizing train timetables for mixed passenger and freight railway transportation, and a multi-objective optimization model was proposed. Li [17] proposed a multi-agent, deep reinforcement learning approach for different railway systems, and a multi-agent, actor–critic algorithm framework was used to decompose the decision space. Meng [18] studied stability in train timetabling. A complex network model utilizing complex network theory for optimization was established, and a solving algorithm was designed and validated through a computing case. Chen [19] proposed a common model for railway train timetable optimization using an event–activity network, with constraints and objectives defined for further research.
As for the integrated scheduling of passenger train plans and train timetables, there are few studies that have focused on it. Qi [20] proposed a joint optimization model for train scheduling, stop planning, and passenger distribution on high-speed railways, considering passenger demands for each origin–destination (OD) pair. A two-stage algorithm was designed for solving the model. Qi [21] proposed a two-stage collaborative optimization model for train timetabling and stop planning under uncertain travel times. The model first generated train stop plans and timetables under different scenarios; then, it optimized a robust timetable and stop plan using GAMS with CPLEX and BARON solvers, minimizing variance between scenarios.
The summary of the research scopes and objectives of some of the literature mentioned above are shown in Table 1, and several limitations of existing studies can be summarized as follows.
  • In terms of research scope, most research handles the passenger train plan and train timetable independently, such as [4,5,6,7,8,9,10,11,12,13,14,15,16,17,18,19]. However, there exists a strong interrelation between them, and independent studies may make it difficult to optimize train operation from an overall perspective. Some research focuses on the integrated scheduling of train stopping plans and train timetables by adopting a two-stage collaborative optimization model, such as [20,21]. However, when the passenger demands decrease, in addition to adjusting the train stopping plan, the number of operating trains should also be adjusted, so as to reduce operational costs and energy consumption. The research in this field is relatively limited.
  • In terms of objectives, some research adopts one objective. However, the train operation process is complex, and it is difficult to handle train operation optimization with one objective under different scenarios. Some research adopts multiple objectives and sums them up with weighted coefficients, which makes it difficult to reflect the interrelationships between the objectives and obtain diverse results. Thus, more research is needed to explore more diverse methods to address multiple objectives in train operation optimization issues, and the research within this domain is relatively restricted.
From the perspective of algorithms, many algorithms have been widely applied in the field of optimizing train operation. Some heuristic algorithms have been designed for solving train timetable scheduling, such as the generation algorithm [22], ant colony algorithm [23], and particle swarm algorithm [24]. Wu [25] reviewed the applications of particle swarm optimization in the railway domain. Some exact optimization algorithms have also been utilized, such as column generation [26], Lagrange relaxation [27], and alternating direction method of multipliers [28]. Some research has investigated parallel computing approaches to improve the efficiency of algorithmic solutions, such as [29,30]. The optimization algorithms in [22,23,24,26,27,28,29,30] are mostly used to solve single-objective optimization or weighted multi-objective optimization problems. In recent years, NSGA-II, which was initially put forward by Deb [31] in 2002, has been adopted to solve multi-objective optimization problems, such as [32,33,34]. In the solving process of NSGA-II, various acceleration techniques can be designed to improve algorithm efficiency, such as NSGA-II-SA in [33] and p-NSGA-II in [34].
By analyzing the algorithms employed in the references mentioned above, some limitations of the algorithms can be summarized. Most algorithms are effective and efficient in solving single-objective optimization problems or weighted multi-objective optimization problems, such as [26,27,28]. However, algorithms that can generate a variety of high-quality solutions, such as NSGA-II, are less commonly applied.
Based on the analysis and limitations presented above, the contributions and novelty of this paper are summarized as follows in detail:
  • Based on the limitations of the integrated scheduling of passenger train plans and train timetables, instead of scheduling the passenger train plan and train timetable separately or adopting a two-stage approach, an integrated approach is proposed to synergistically schedule the passenger train plan and train timetable, containing measures of selecting operating trains, adjusting the train stopping scheme, and adjusting the train operation sequence.
  • Based on the limitations of handling multi-objective optimization, we formulate a model with two objectives: minimizing train operation costs to reduce energy consumption and maximizing passenger service quality to enhance travel experience. Instead of weighing the two objectives, we designed an algorithm based on NSGA-II to yield a Pareto front containing a set of non-dominated results, from which the railway operators can select suitable solutions under specific scheduling scenarios.
  • To accelerate the algorithm, we have designed two key acceleration techniques. Firstly, a chromosome coding method based on initial train sequence and train overtaking is employed to describe the train operation sequence. Secondly, parallel computing technology is utilized to concurrently solve each independent process of the algorithm.

3. Integrated Scheduling Model Formulation

3.1. Notations

Table 2 illustrates the sets used in this paper.
Table 3 illustrates the parameters used in this paper.
Table 4 illustrates the decision variables used in this paper.

3.2. Objective Functions

  • Operation costs
In terms of operation costs, the more trains operate, the more operation costs are spent. In addition, more stops result in an increase in station operations costs, which incurs higher costs. Thus, the operation costs are composed of two parts: the fixed costs of operating trains related to the operation mileage, and the additional costs of train stops. The objective of minimizing operation costs can be described as objective (1), as follows:
min Z 1 = k K c k x k + k K s S c s z k , s
2.
Passenger service quality
For passengers, they aspire to minimize the duration of their journey. For passenger demand, travel without stopping at intermediate stations will take the least time. Based on this, the longer the travel time is, the more significant the loss of passenger service quality becomes. Thus, passenger service quality is composed of two parts: the basic quality of serving passengers and the loss of passenger service quality caused by extra travel time. The maximization of the passenger service quality can be described as objective (2), as follows:
max Z 2 = p P k K w p , k ( Γ p , k c p ( τ k , d s p a r r τ k , o s p d e p t p , k d i r ) )
where ( τ k , d s p a r r τ k , o s p d e p t p , k d i r ) represents the extra travel time for passenger demand p served by train k .

3.3. Constraints

3.3.1. Constraints of Operating Trains

If one train is canceled in the train operating scheme, it must have no arrival and departure times, stop plans and operation sequences, nor can it serve passengers, as expressed in Constraints (3)–(7).
τ k , s a r r x k M , s S
τ k , s d e p x k M , s S
z k , s x k M , s S
w p , k x k M , p P
s e q k , k g x k , g G k G k

3.3.2. Constraints of Headway

The headway constraints, as shown in Constraints (8) and (9), should be satisfied in sections to ensure safe and efficient operation for trains. The headway determination method for h d e p and h a r r is detailed in Equations (A1)–(A10) in Appendix A.1.
s e q k , k g ( τ k , o s g d e p τ k , o s g d e p ) + ( 1 s e q k , k g ) M h d e p , k , k K , g G k G k
s e q k , k g ( τ k , d s g a r r τ k , d s g a r r ) + ( 1 s e q k , k g ) M h a r r , k , k K , g G k G k

3.3.3. Constraints of Train Stopping Scheme

For each train, the total number of stops needs to meet the constraints of the minimum and maximum number of stops simultaneously, as expressed in Constraint (10).
n k m i n s s S k z k , s n k m a x s , k K
Owing to the considerable amount of passenger demand at some stations, there are some compulsory stops for the train during its operation. At these stations, the train must stop, as expressed in Constraint (11).
z k , s σ k , s x k , k K , s S k
Trains must stop at the origin and destination stations, as shown in Constraints (12) and (13).
z k , o s k = x k , k K
z k , d s k = x k , k K

3.3.4. Constraints of Operation Time

The arrival and departure time at stations for every train must adhere to the travel time constraint, as depicted in Constraint (14).
τ k , o s g d e p + z k , o s g t d e p e x t r a + x k t k , g r u n + z k , d s g t a r r e x t r a τ k , d s g a r r k K , g G k
When a train stops at a station, the dwelling time must fall within the established range, neither below the minimum nor above the maximum. For a train that passes through a station without stopping, the departure time must coincide with the arrival time, as illustrated in the following Constraint (15).
z k , s m i n t k , s d e w τ k , s d e p τ k , s a r r z k , s m a x t k , s d e w , k K , s S k

3.3.5. Constraints of Passenger Assignment Plan

If passengers are assigned to a train, the train must stop at the origin station, as well as the destination station of the passengers, as indicated in Constraints (16) and (17).
z k , o s p M w p , k , k K , p P
z k , d s p M w p , k , k K , p P
Since the passenger capacity of each train is different, within every section, passengers carried by a train must not go beyond its capacity, as indicated in Constraint (18).
p P δ p , g w p , k c a p k , k K , g G k
All passengers must be assigned to trains, as depicted in Constraint (19).
k K w p , k = q k , p P

3.3.6. Constraints of Cross-Line Trains

For cross-line trains in the full-schedule timetable, they must operate in accordance with the full-schedule timetable, as indicated in Constraints (20)–(23).
x k = 1 , k K c
z k , s = s t o k , s , k K c , s S k
τ k , s a r r = a f k , s , k K c , s S k
τ k , s d e p = d f k , s , k K c , s S k

3.3.7. Constraints of Maximum Deviation of Departure and Arrival Time

In order to ensure the stability of train operation and reduce the difficulty of transportation organization, the deviation of the trains’ arrival and departure times from those in the full-schedule timetable should be maintained within a certain range, as shown in Constraints (24) and (25).
Δ t τ k , s a r r a f k , s Δ t , k K , s S k
Δ t τ k , s d e p d f k , s Δ t , k K , s S k

4. Algorithm Based on NSGA-II

NSGA-II is recognized as an effective algorithm for addressing multi-objective optimization problems. It has the capability to generate a diverse set of Pareto-optimal solutions and boasts advantages such as swift convergence, low computational complexity, and the ability to preserve elite individuals. Over recent years, its application has been widespread across various domains, including mechanical engineering, transportation, and other disciplines. In this paper, we propose an enhanced algorithm based on NSGA-II, with the two acceleration techniques of utilizing a chromosome coding method, based on the initial sequence and train overtaking scheme, and parallel computing to significantly accelerate the solution process.

4.1. Conceptions About Pareto

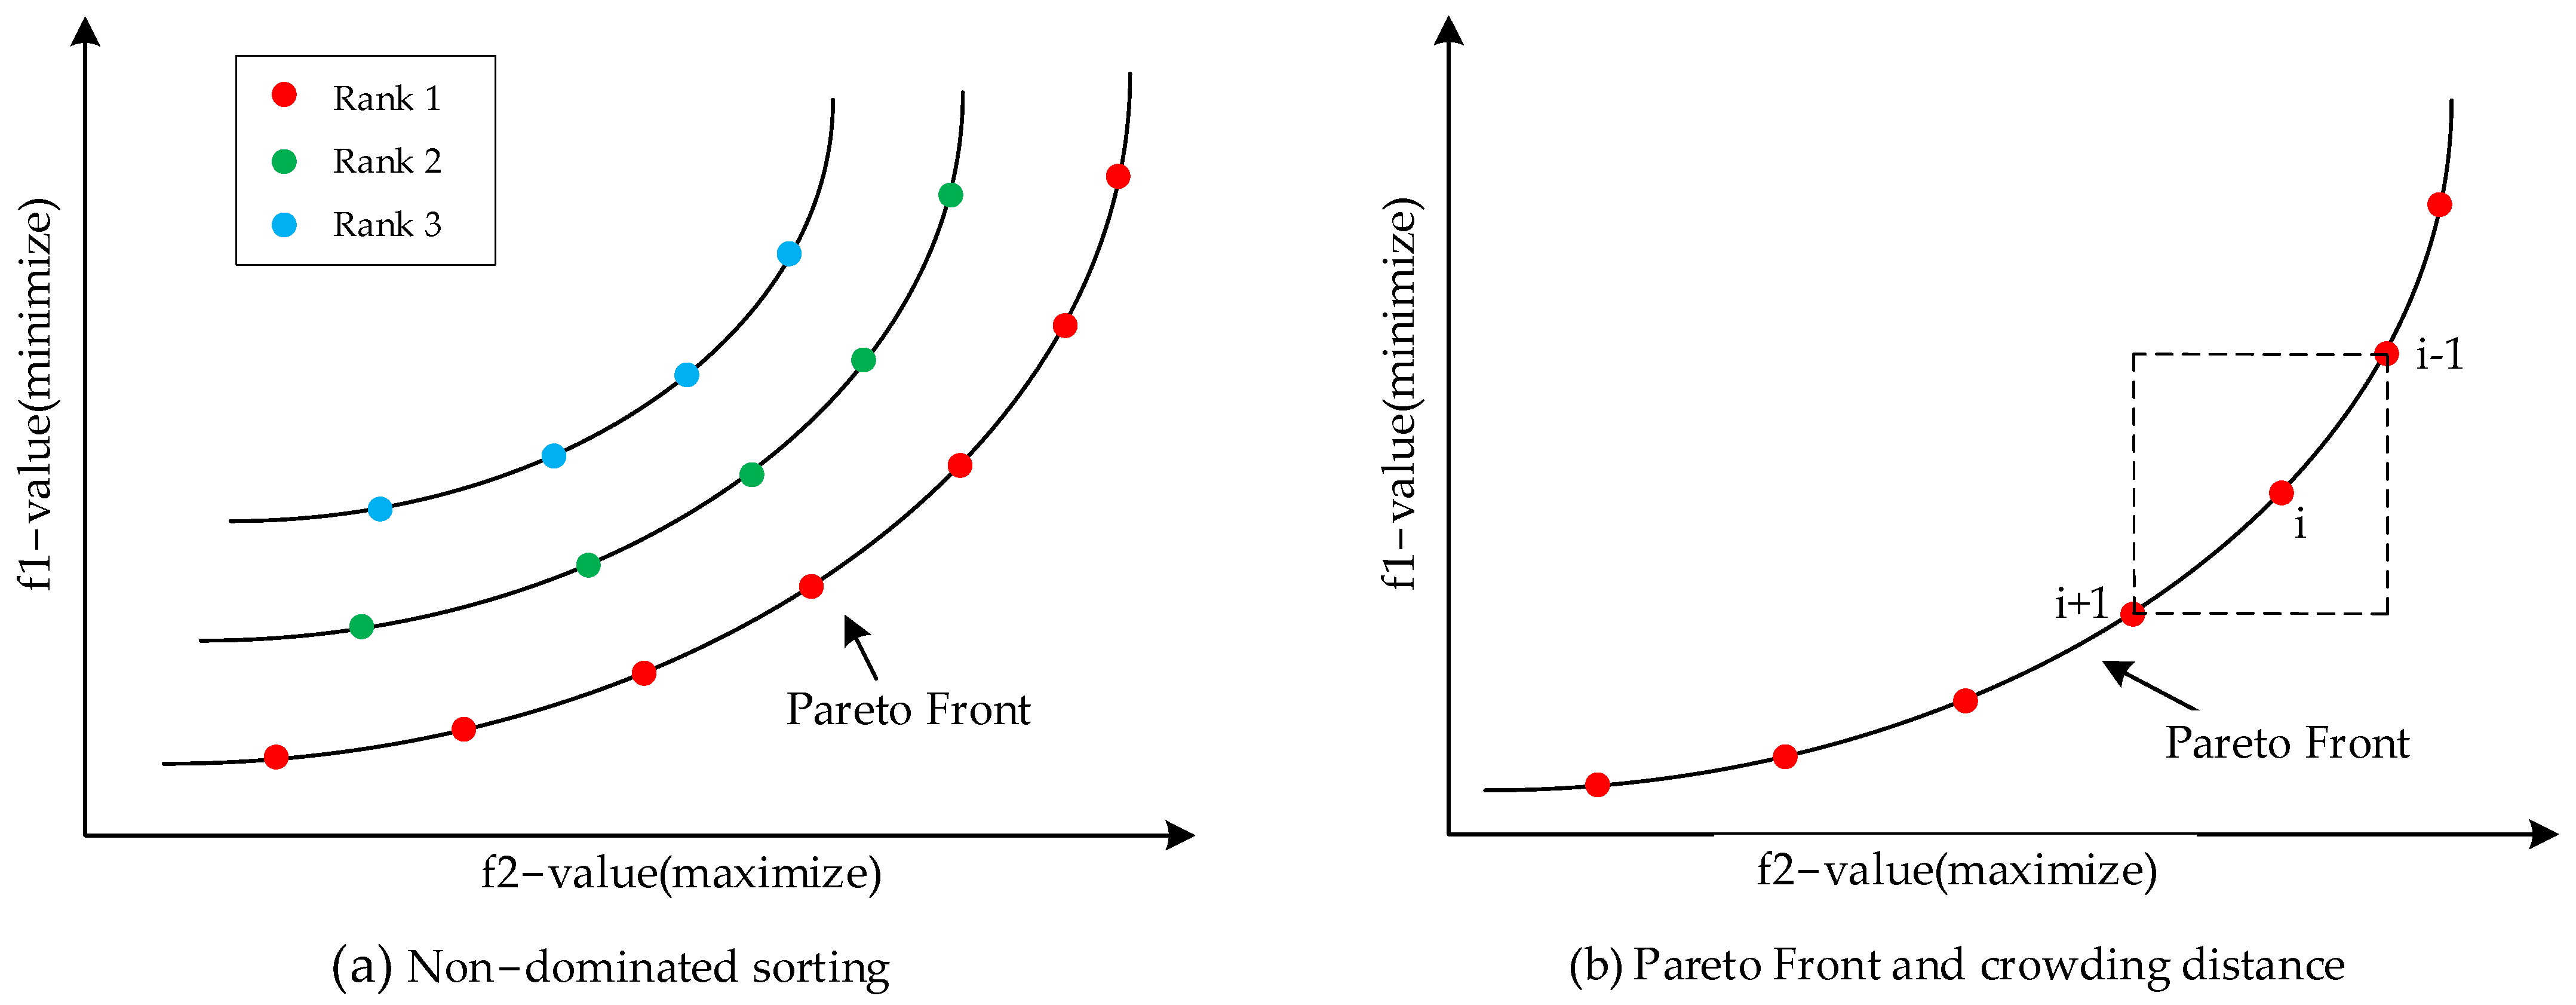
4.1.1. Pareto Dominance

Given that an optimization problem contains two objectives of minimizing f 1 and maximizing f 2 , x a , x b are two solutions for the problem. x a is considered superior to solution x b , if condition (26) is met.
f 1 ( x a ) < f 1 ( x b ) f 2 ( x a ) f 2 ( x b ) , o r f 1 ( x a ) f 1 ( x b ) f 2 ( x a ) > f 2 ( x b )
where f 1 ( x ) and f 2 ( x ) are the two objective values for solution x . Under this condition, x a dominates x b .

4.1.2. Non-Dominated Sorting

The procedure commences by identifying all non-dominated individuals from the initial population and designating them as the first rank. Subsequently, these individuals of the first rank are taken out of the original population. Following that, non-dominated individuals are picked out from the remaining population and designated as the second rank. This process is carried out repeatedly until every individual in the population has been allotted a rank. The individuals with the first rank make up the Pareto front, as depicted in Figure 5.

4.1.3. Crowding Distance

The concentration of solutions in a population can be assessed by the crowding distance. A greater crowding distance for a solution means that it is situated in a less congested area. Choosing solutions with larger crowding distances to the next generation aids in preserving the diversity of the population. The crowding distance is calculated in (A11) in Appendix A.2.

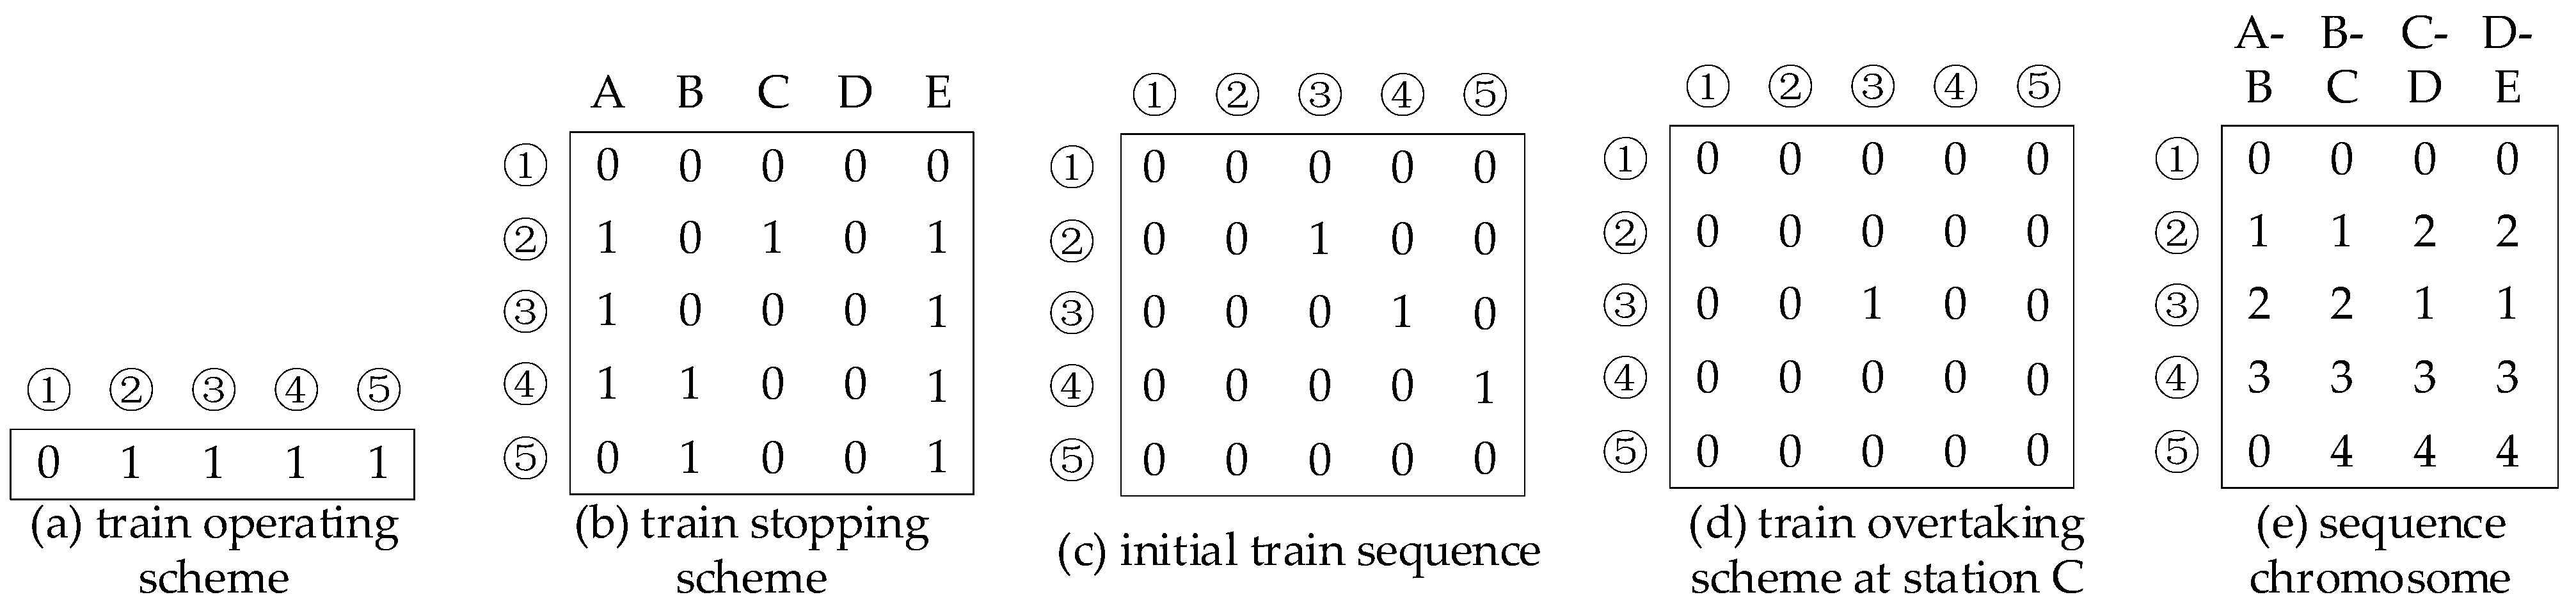
4.2. Chromosome Encoding Method

In the algorithm, some variables about the passenger train plan and train timetable, which are x k , z k , s , s e q k , k g , are encoded into chromosomes, as illustrated in Figure 6. A, B, C, D and E are five stations, and A-B, B-C, C-D and D-E are four sections. Especially for the variables s e q k , k g , most studies encode it into a sequence chromosome, as shown in Figure 6e. In this paper, we proposed a train sequence encoding technique that utilizes the initial train sequence and train overtaking scheme to describe the operation sequence in sections and encodes them into the chromosomes, as shown in Figure 6c,d. We denominate the encoding pattern of utilizing sequence chromosomes as the sequence pattern and the pattern of utilizing the initial train sequence and train overtaking chromosomes as the overtaking pattern.
Chromosome I illustrates the train operating scheme. Each gene in this chromosome has a value of either 1 or 0, signifying whether the trains in the full-schedule timetable are selected to operate (1) or not (0). Figure 6a shows that trains ②, ③, ④, and ⑤ in the full-schedule timetable are selected to operate.
Chromosome II illustrates the train stopping scheme. Each gene in this chromosome has a value of either 1 or 0, signifying whether the trains stop at certain stations (1) or not (0). Figure 6b shows that trains ②, ④, and ⑤ stop at station C, B, and B, respectively.
Chromosomes III and IV are the chromosomes of the overtaking pattern. Chromosome III illustrates the initial train operation sequence. The value of the gene in row i and column j is represented as ( i , j ) . In Chromosome III, each gene has a value of either 1 or 0, signifying whether train i operates before train j without overtaking it. Figure 6c shows that the initial train sequence is ②-③-④-⑤. Chromosome IV is a matrix representing the train overtaking scheme at a certain station. If ( i , j ) equals 1, train i overtakes train j at the station. Taking station C as an example, Figure 6d shows that train ③ overtakes train ② at station C.
Chromosome V is the chromosome of the sequence pattern, and the numbers in the matrix represent the operation sequence of trains in each section.
In this paper, both the overtaking pattern (utilizing Chromosomes I, II, III, and IV) and sequence pattern (utilizing Chromosomes I, II, and V) will be tested to determine which pattern is more applicable and effective.
The chromosomes presented in Figure 6 can be decoded into the timetable shown in Figure 7. A, B, C, D and E are five stations. We can see that train ① is canceled. Train ② stops at station C, and train ④ stops at station B. Train ③ overtakes train ② at station C.

4.3. Generating Initial Solution

For Chromosome I, the values are randomly generated. For Chromosome II, the values for canceled trains are set to 0, while the remaining trains follow the stopping scheme as outlined in the full timetable. For Chromosome III, the values for canceled trains are also set to 0, while the values for other trains are randomly generated. For Chromosome IV, no overtaking is allowed between trains in the initial solutions. For Chromosome V, the train sequences in sections are generated according to the initial sequence in Chromosome III.

4.4. Feasibility of Solutions

Some chromosomes in certain individuals might not meet the constraints. Hence, every chromosome for each individual must be evaluated to detect and modify any infeasible conditions. The procedure of adjustment is as follows:
  • If the value of the i gene in Chromosome I equals 0, signifying train i is not selected to operate, each value of the genes in the row i within Chromosome II must also be modified to 0, signifying train i does not stop at any stations; values of genes in column and row i in Chromosome III must also be modified to 0, signifying train i does not operate before or after other trains; values of genes in column and row i in Chromosome IV must also be modified to 0, signifying train i does not overtake or be overtaken by other trains in any station; and values of genes in row i in Chromosome IV must also be modified to 0, signifying train i has no operation sequence in any section.
  • In Chromosome II, if station j is a compulsory stop station of train i , the value of i should be set to 1. If the stop frequency of train i exceeds the maximum number, some stops that are not compulsory stops should be randomly canceled; that is, the corresponding values should be set to 0.
  • In Chromosome V, the operation sequences in the sections should be adjusted to the consecutive sequence of positive integers. For example, the sequences in a section of 1-1-3-2-4 should be adjusted to 1-2-4-3-5; the sequences in another section of 0-1-4-3-0 should be adjusted to 0-1-3-2-0.

4.5. Chromosomes Decoding Method

The individuals are composed of five chromosomes, each representing distinct aspects of the train operation: the train operating scheme, the train stopping scheme, the initial train sequence, the train overtaking scheme, and the train sequence in sections. Based on the full-schedule timetable, these chromosomes must be decoded to generate the train timetable and the passenger assignment plan. The decoding process is divided into four distinct components.

4.5.1. Generating Passenger Train Plan

According to the chromosomes of the train operating scheme and train stopping scheme, the values of variables x k and z k , s can be determined, and a passenger train plan can therefore be generated as well.

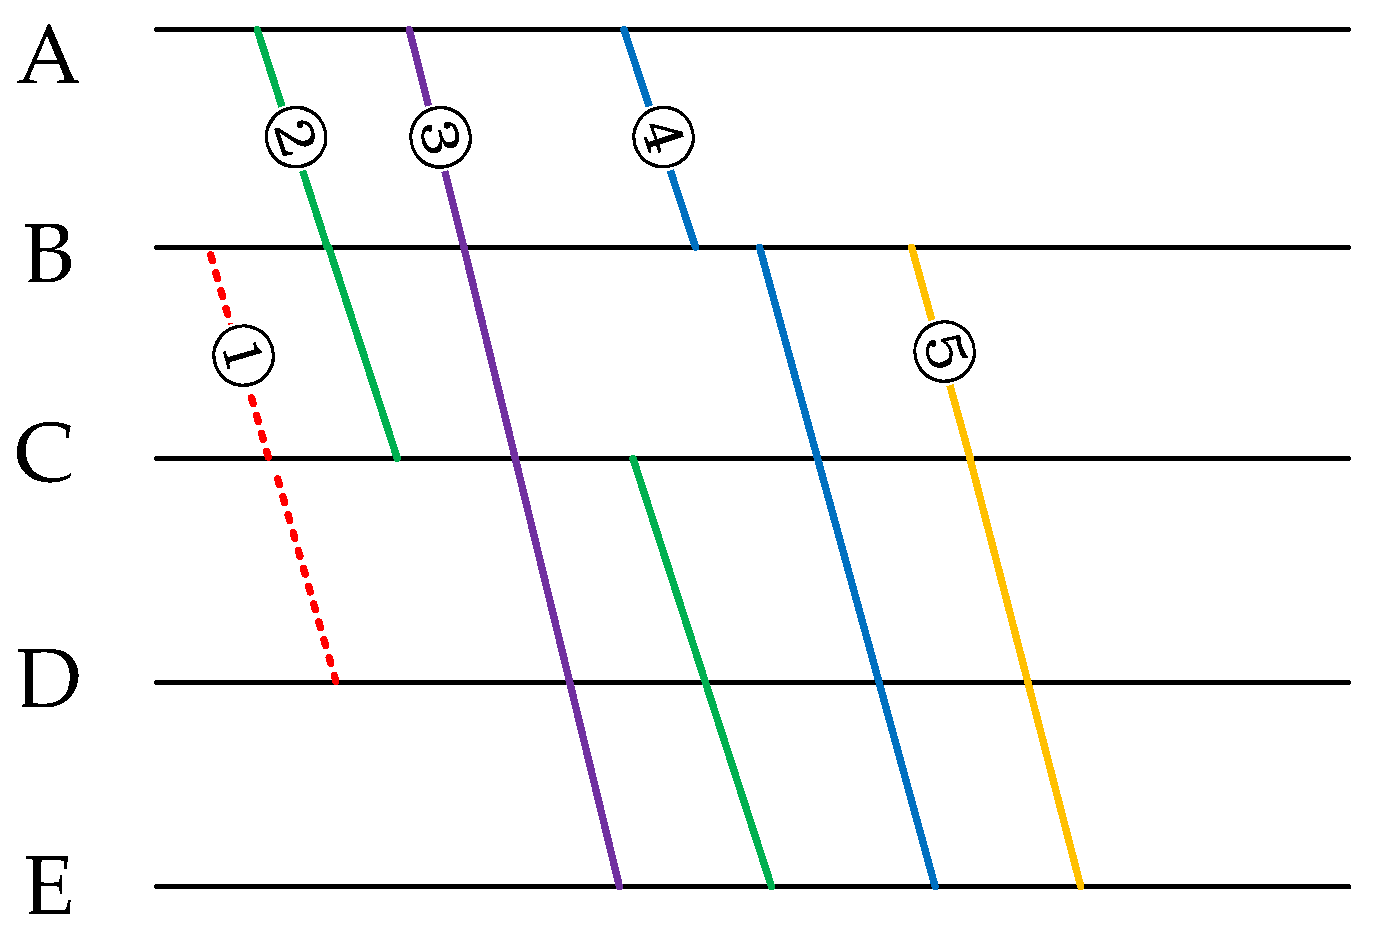
4.5.2. Generating Train Operation Sequence

For the sequence pattern, the s e q k , k g can be determined by the train sequence chromosome directly.
For the overtaking pattern, the s e q k , k g can be determined by following steps.
Step 1: According to the chromosome of the initial train sequence, we can obtain the train operation sequence in each section without overtaking, and initial values can be assigned to variable s e q k , k g .
Step 2: Traverse the chromosome of the train overtaking scheme. If train k overtakes train k in station s in the chromosome, examine whether the following two conditions are fulfilled:
Condition 1: in the current s e q k , k g , train k is the preceding train of train k in section g , whose origin station is station s ;
Condition 2: in the chromosome of the train stopping scheme, train k stops at station s .
If the two conditions are both fulfilled, train k will overtake train k at station s , and s e q k , k g should be adjusted as follows.
  • In the common operational section of train k and train k after the overtaking station, train k and k should swap the operation sequence, as shown in (27).
    s e q k , k g = 0 , s e q k , k g = 1 , g G k G k , o s g s
  • The trains whose following train is train k should adjust their following trains to train k , as shown in (28).
    i f s e q k , k g = 1 , t h e n s e q k , k g = 0 , s e q k , k g = 1 , k K , g G k G k , o s g s
  • The trains whose preceding train is train k should adjust their following trains to train k , as shown in (29).
    i f s e q k , k g = 1 , t h e n s e q k , k g = 0 , s e q k , k g = 1 , k K , g G k G k , o s g s
Once all the values in the chromosome of train overtaking scheme have been traversed, the sequence of the train is generated, and the variable s e q k , k g is determined.

4.5.3. Calculating Train Timetable

Under the circumstance of where the values of s e q k , k g and x k , z k , s are already available, we can use CPLEX 20.10 to solve the train timetable, with the objective of minimizing train operation time, as shown in (30), and satisfying the constraints in (31).
min Z 3 = k K ( τ k , d s k a r r τ k , o s k d e p )
t e a r τ k , s d e p t l a t , k K , s S k t e a r τ k , s a r r t l a t , k K , s S k s e q k , k g ( τ k , o s g d e p τ k , o s g d e p ) + ( 1 s e q k , k g ) M h d e p , k , k K , g G k G k , s e q k , k g ( τ k , d s g a r r τ k , d s g a r r ) + ( 1 s e q k , k g ) M h a r r , k , k K , g G k G k , τ k , o s g d e p + z k , o s g t d e p e x t r a + x k t k , g r u n + z k , d s g t a r r e x t r a τ k , d s g a r r k K , g G k z k , s m i n t k , s d e w τ k , s d e p τ k , s a r r z k , s m a x t k , s d e w , k K , s S k τ k , s a r r = a f k , s , k K c , s S k τ k , s d e p = d f k , s , k K c , s S k Δ t τ k , s a r r a f k , s Δ t , k K , s S k Δ t τ k , s d e p d f k , s Δ t , k K , s S k
After calculating the timetable, the variables τ k , s d e p and τ k , s a r r can be obtained. If no timetable can be solved, the individual is unfeasible. Delete the individual from the current population and randomly select an individual from the parent population to join the population.

4.5.4. Generating Assignment Plan for Passengers

After the values of s e q k , k g , x k , z k , s , τ k , s d e p , and τ k , s a r r are already available, CPLEX 20.10 is used to generate the assignment plan for passengers, with the objective of maximizing the passenger service quality in (32) and satisfying the constraints in (33).
max Z 2 = p P k K w p , k ( Γ p , k c p ( t k , d s p a r r t k , o s p d e p t p , k d i r ) )
z k , o s p M w p , k , k K , p P z k , d s p M w p , k , k K , p P p P δ p , g w p , k c a p k , k K , g G k k K w p , k = q k , p P
After generating an assignment plan for passengers, the values of variable w p , k are obtained. If no passenger assignment plan can be solved, the individual is unfeasible. Delete the individual from the current population and randomly select an individual from the parent population to join the population.
After decoding the chromosomes according to the method in Section 4.5.1, Section 4.5.2, Section 4.5.3 and Section 4.5.4, the decision variables are all obtained and the train timetable, passenger train plan, and passenger assignment plan are generated.

4.6. Fitness Functions

According to the two objectives of the model, the fitness functions can be expressed as expressed in (34) and (35).
Z 1 = k K c k x k + k K s S c s z k , s
Z 2 = p P k K w p , k ( Γ p , k c p ( τ k , d s p a r r τ k , o s p d e p t p , k d i r ) )
Within each iteration, subsequent to the computation of the fitness functions, the Pareto fronts can be determined by utilizing the calculated fitness values, as outlined in Section 4.1.

4.7. Genetic Operators

The genetic algorithm utilizes three core operators: selection, crossover, and mutation. The selection operator identifies high-performing individuals from the current population to generate a new generation. The crossover operator combines genes from two selected parent chromosomes to create offspring. The gene values are altered by the mutation operator with a predetermined probability.

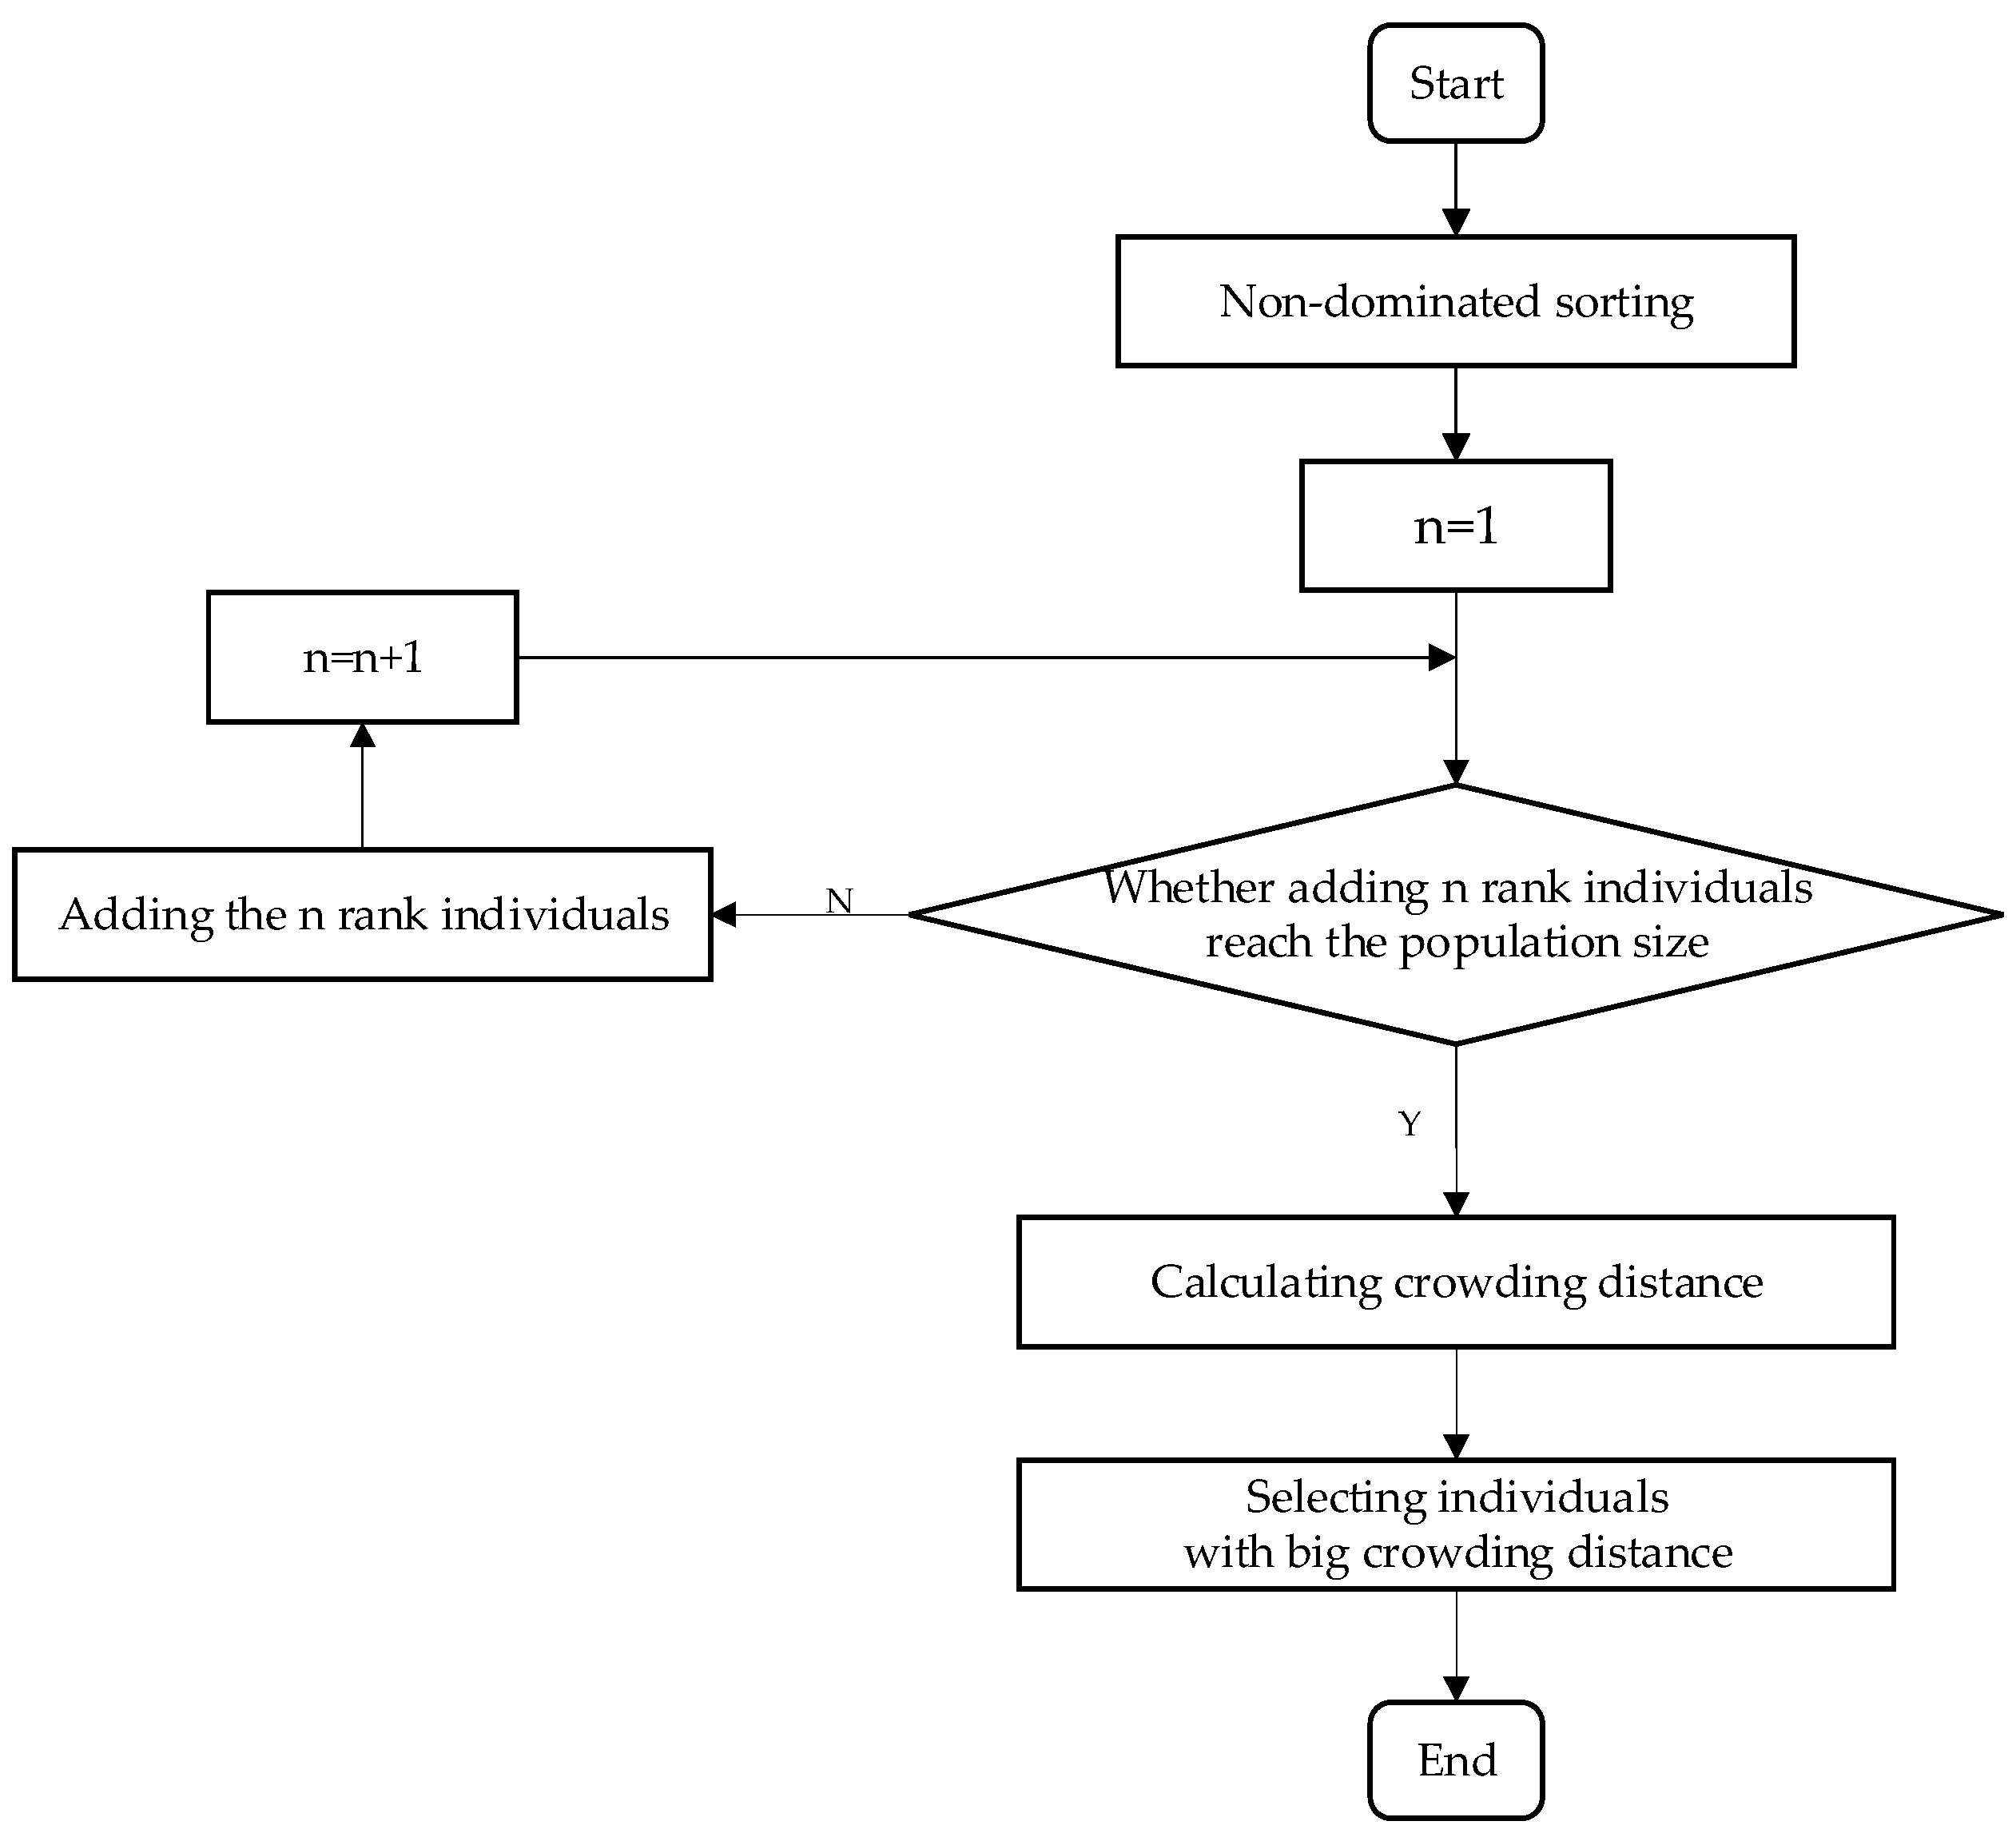
4.7.1. Selection Process

In the selection phase, identifying high-performing individuals from the existing population is crucial for generating a new generation. The process begins with non-dominated sorting of the current individuals and assigning them their respective ranks. Starting with the first rank, it is determined whether all individuals at this rank can be included in the new population. If the inclusion of these individuals does not exceed the population size limit, they are added to the new population, and the evaluation proceeds to the next rank. If the population size is exceeded, the crowding distance of the individuals at the current rank is calculated, and those with the largest crowding distance values are selected until the population size is reached.
Figure 8 shows the process of selection.

4.7.2. Crossover Process

When selecting crossover partners, each population individual is paired with another one from the current population. The probability of being chosen, expressed as P c r o s s , is contingent on the non-dominated sorting rank. The higher the Pareto rank, the higher the probability of being selected. The calculation method of P c r o s s is detailed in (A12)–(A14) in Appendix A.3. The two parent individuals are utilized to create new offspring individuals. Randomly select a position to divide each chromosome of parent individuals into two parts, and then cross-combine the two parts to form new chromosomes of offspring individuals.

4.7.3. Mutation Process

The processes of mutation for each chromosome are presented as follows.
For Chromosomes I and II, the values of genes within these chromosomes change from 0 to 1 or from 1 to 0. This binary alteration corresponds to either canceling or operating trains and modifying the train stops at certain stations.
For Chromosome III, two adjacent trains are randomly chosen, and their initial sequences are interchanged. For instance, if ( i , j ) equals 1, a mutation would involve adjusting the value of ( i , j ) to 0 and the value of ( j , i ) to 1. The preceding and following trains of the two trains should also be adjusted.
For Chromosome IV, we randomly change the overtaking pattern of two trains, that is canceling the overtaking between two trains or adding overtaking at a certain station for two adjacent trains. For instance, if the value of ( i , j ) at a station is 1, a mutation that adjusts the value of ( i , j ) to 0, and train i would not overtake train j at the station.
For Chromosome V, we randomly select two trains and swap their operation sequence in all sections that are after a certain station.
After crossover and mutation, the new generated chromosomes need to be inspected and adjusted to be feasible, as mentioned in Section 4.3.

4.8. Termination Conditions

When there have been 50 successive generations without any individuals being introduced to the Pareto front, or when it reaches 1000 iterations, the iteration would terminate.

4.9. Parallel Computation

In the algorithm, many processes are computed independently. Thus, a parallel computing technique can be employed to accelerate the computing process.
In this paper, during the iterative process, the decoding operation is the most complex, incurs the highest computational load, and results in the most time consumption. Furthermore, the decoding of different individuals is entirely independent. Consequently, in the proposed algorithm, a parallel computing technique is employed for the decoding phase to simultaneously decode multiple individuals and accelerate the algorithm.

4.10. Algorithm Procedure
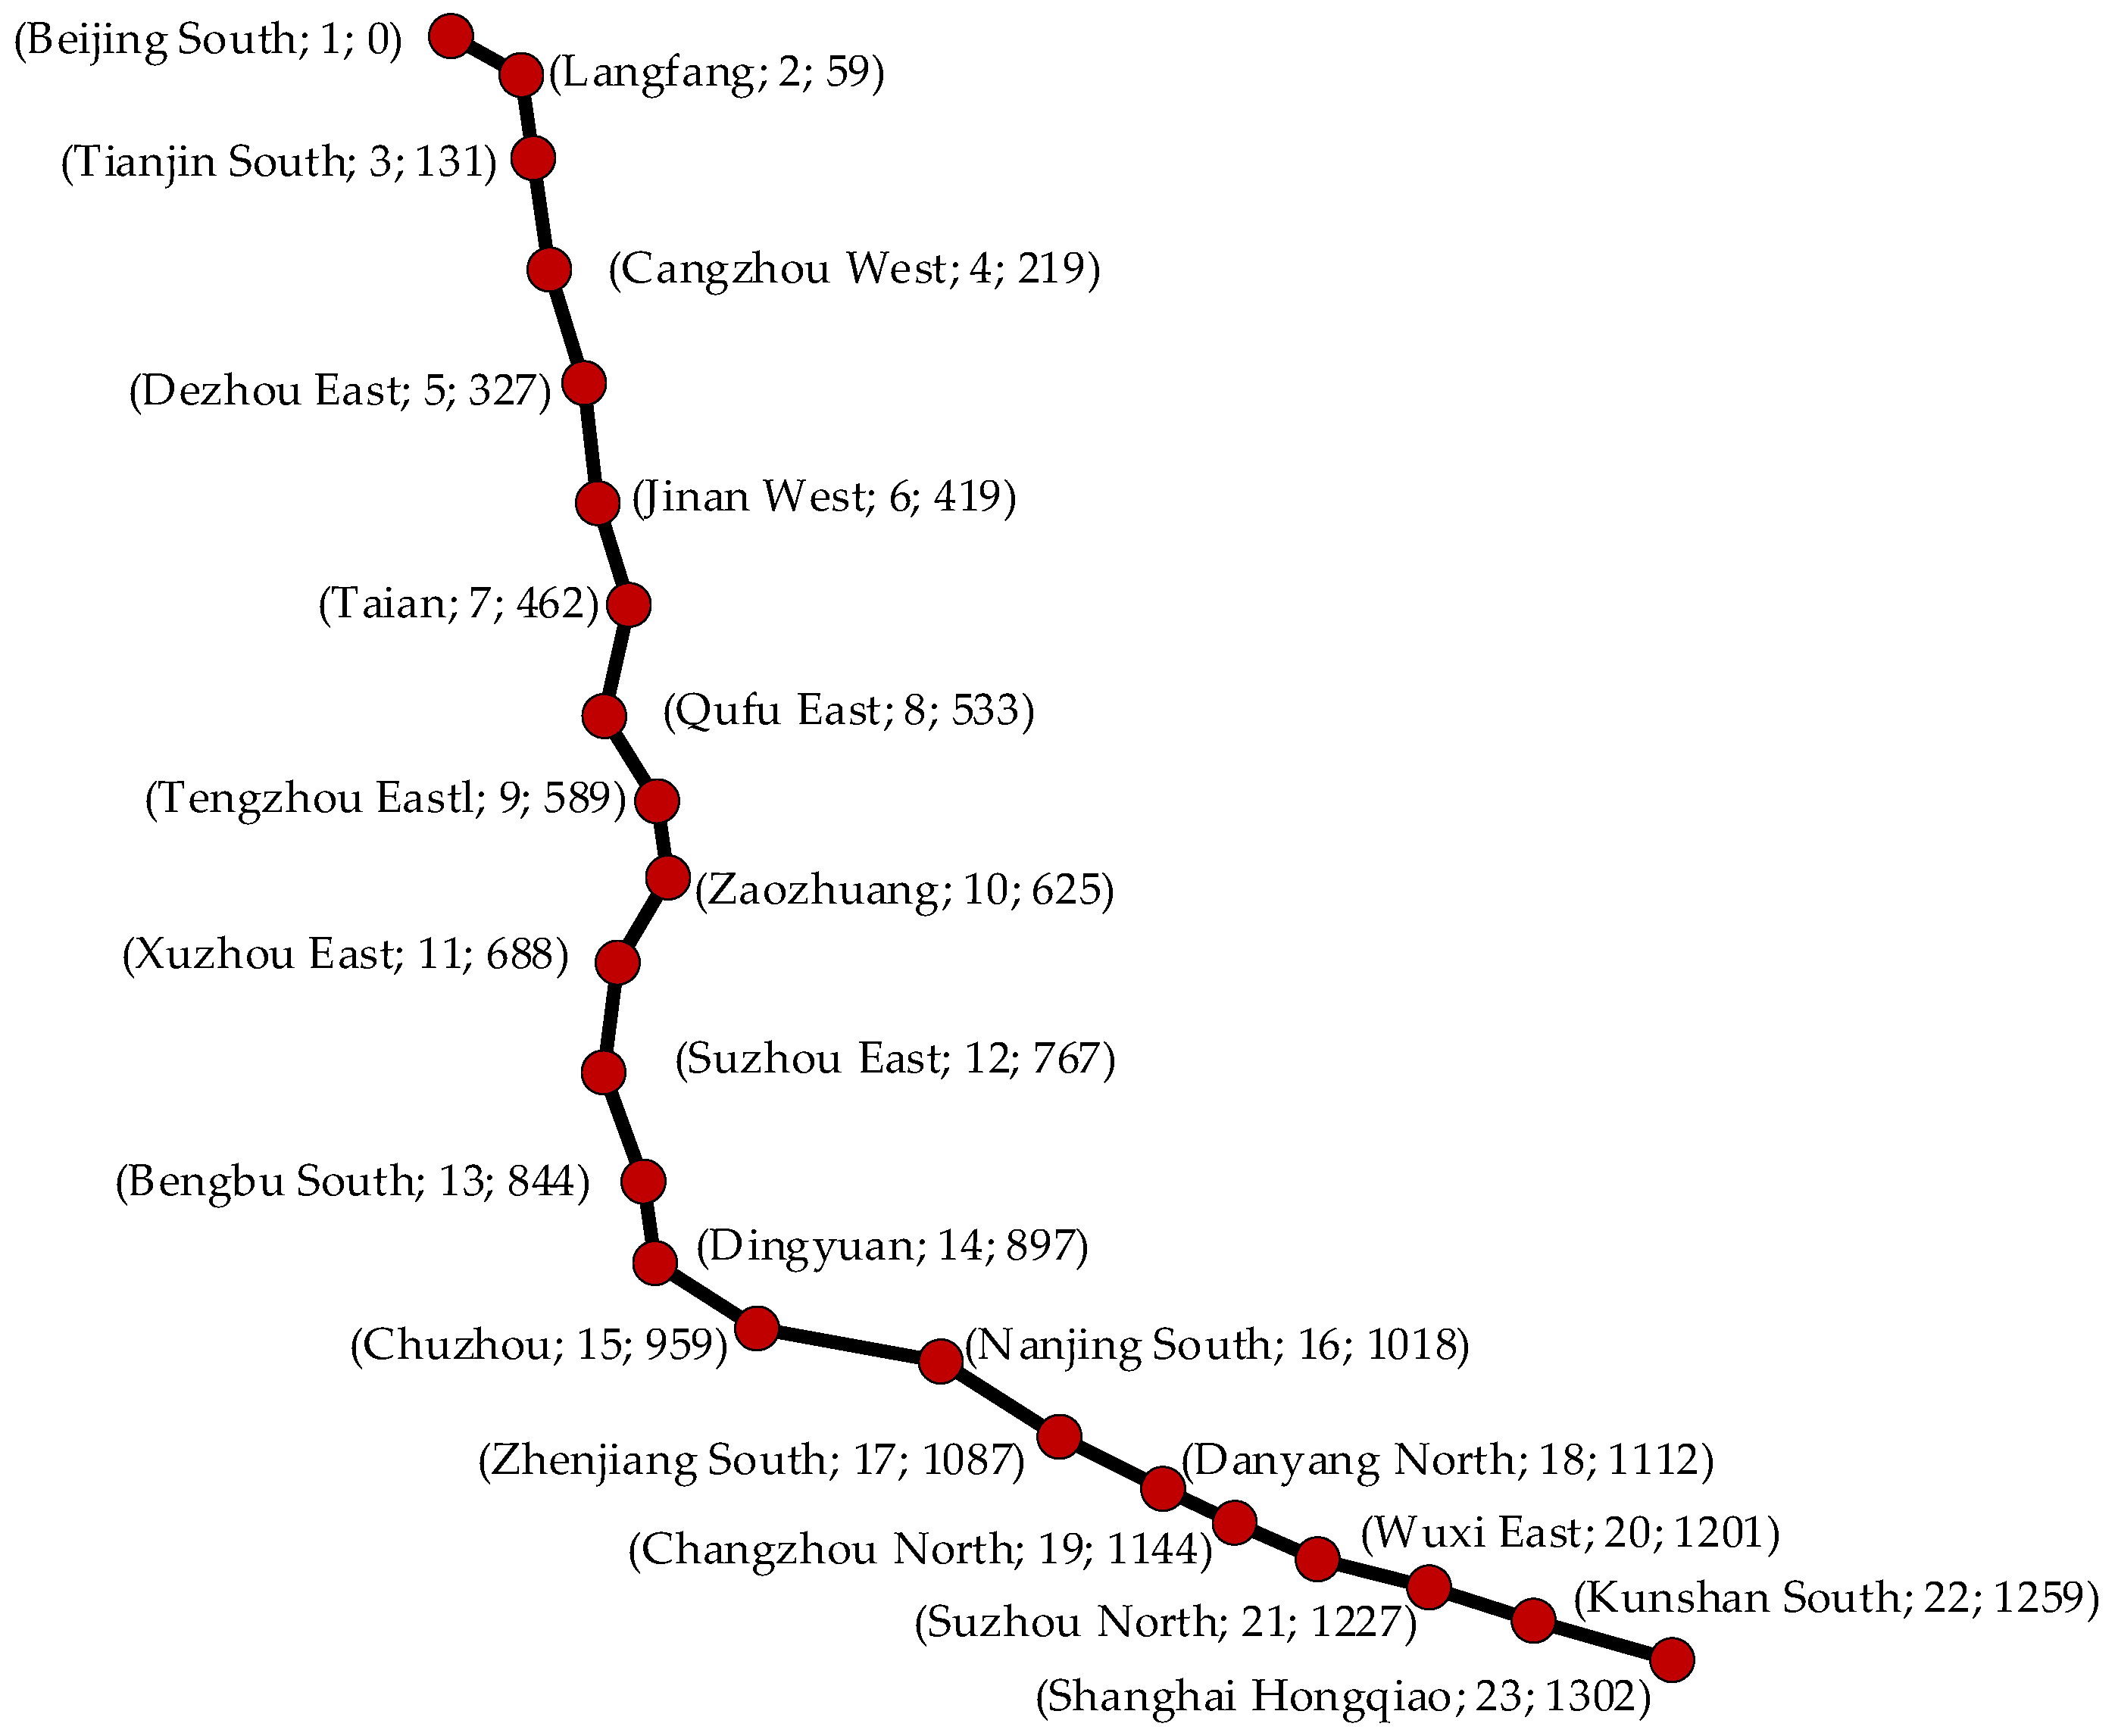
The algorithm in this paper consists of the following steps:
Step 1: Based on the proposed integrated scheduling approach, including selecting operating trains, adjusting the train stopping scheme, and adjusting the train operation sequence, the corresponding decision variables are encoded into chromosomes. Then, the initial solution is generated based on full-schedule timetable.
Step 2: Each individual in the population is decoded, consisting of four parts: generating a passenger train plan, generating a train operation sequence, calculating a train timetable, and generating a passenger assignment plan. The overtaking pattern and sequence pattern can both be utilized to generate the train operation sequence, and parallel computing can be used in the decoding process.
Step 3: Calculate the fitness functions.
Step 4: Judge whether the termination conditions are satisfied. If yes, output the results; otherwise, go to Step 5.
Step 5: Utilize genetic operators including selection, crossover, and mutation to generate a new population, and adjust all individuals to be feasible; go to Step 2.
Figure 9 shows the algorithm procedure.

5. Case Study

The operation data of Beijing–Shanghai HSR, which is one of the busiest and longest Chinese HSR lines with a considerable amount trains and passenger demands, are used to design real-world cases in this paper. The railway line includes 23 stations, and each station is numbered for a simpler expression, as shown in Figure 10. For example, Jinan West Station is called station 6 in this case. The last number represents the mileage of the current station to Beijing South Station. For example, the mileage between Jinan West Station and Beijing South Station is 419 km.
We regard the train timetable of the Beijing–Shanghai high-speed railway during the Spring Festival travel rush as the full-schedule timetable and the passenger ticket data on a certain day during the Spring Festival travel rush as the passenger demands of the timetable. Then, the number of each demand is multiplied by random proportions within the intervals of [0.5–0.7], [0.6–0.8], and [0.7–0.9], respectively, to generate three sets of passenger demands utilized in this case. The three sets of passenger demands are, respectively, referred to as demands [0.5–0.7], demands [0.6–0.8], and demands [0.7–0.9] for brevity.
The parameter values in this case are as shown in Table 5. All the computations in the case were accomplished on a personal computer with a CPU of i7-14650HX and a memory of 32 G.

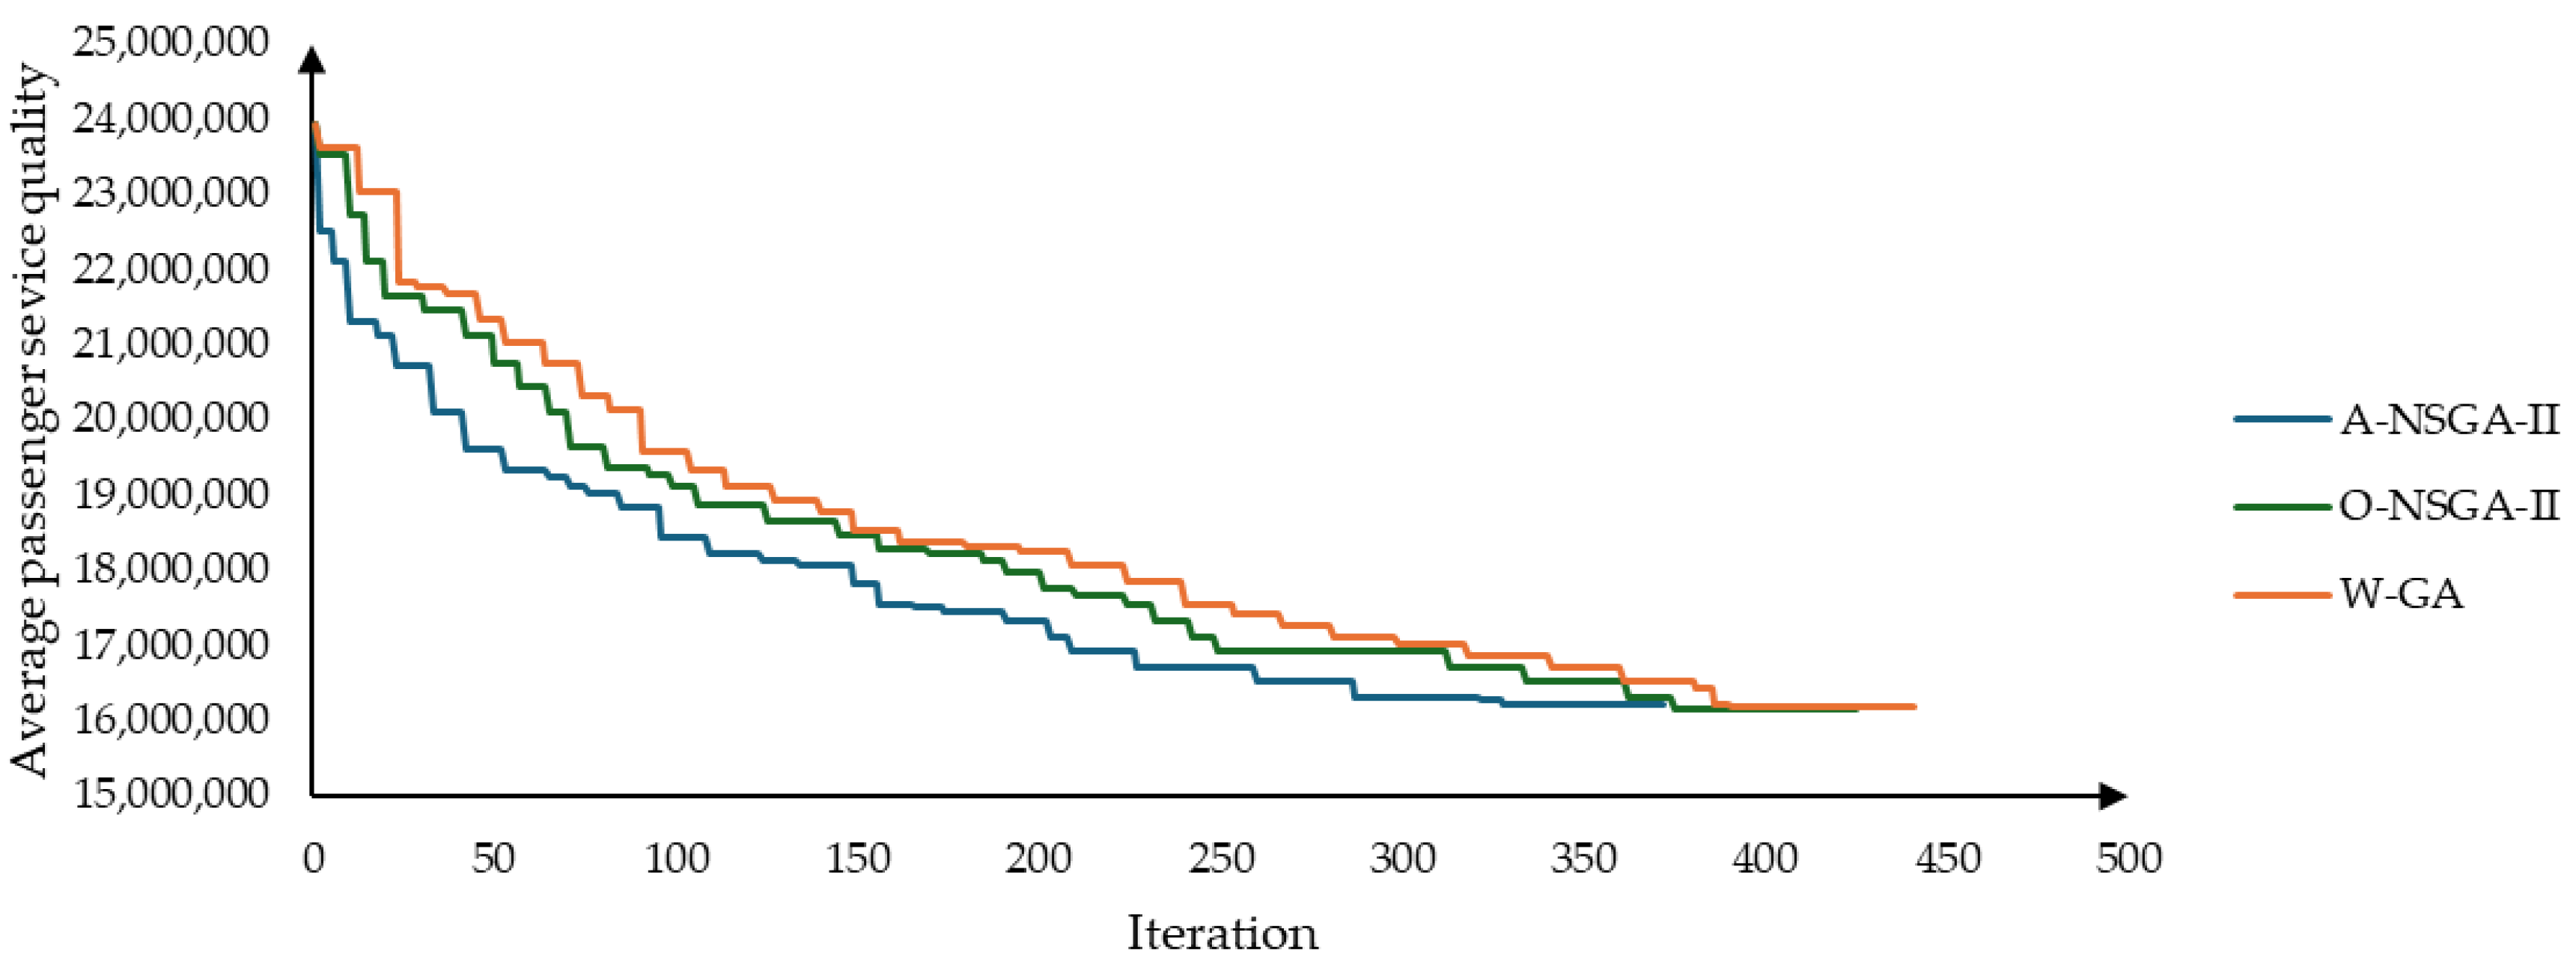
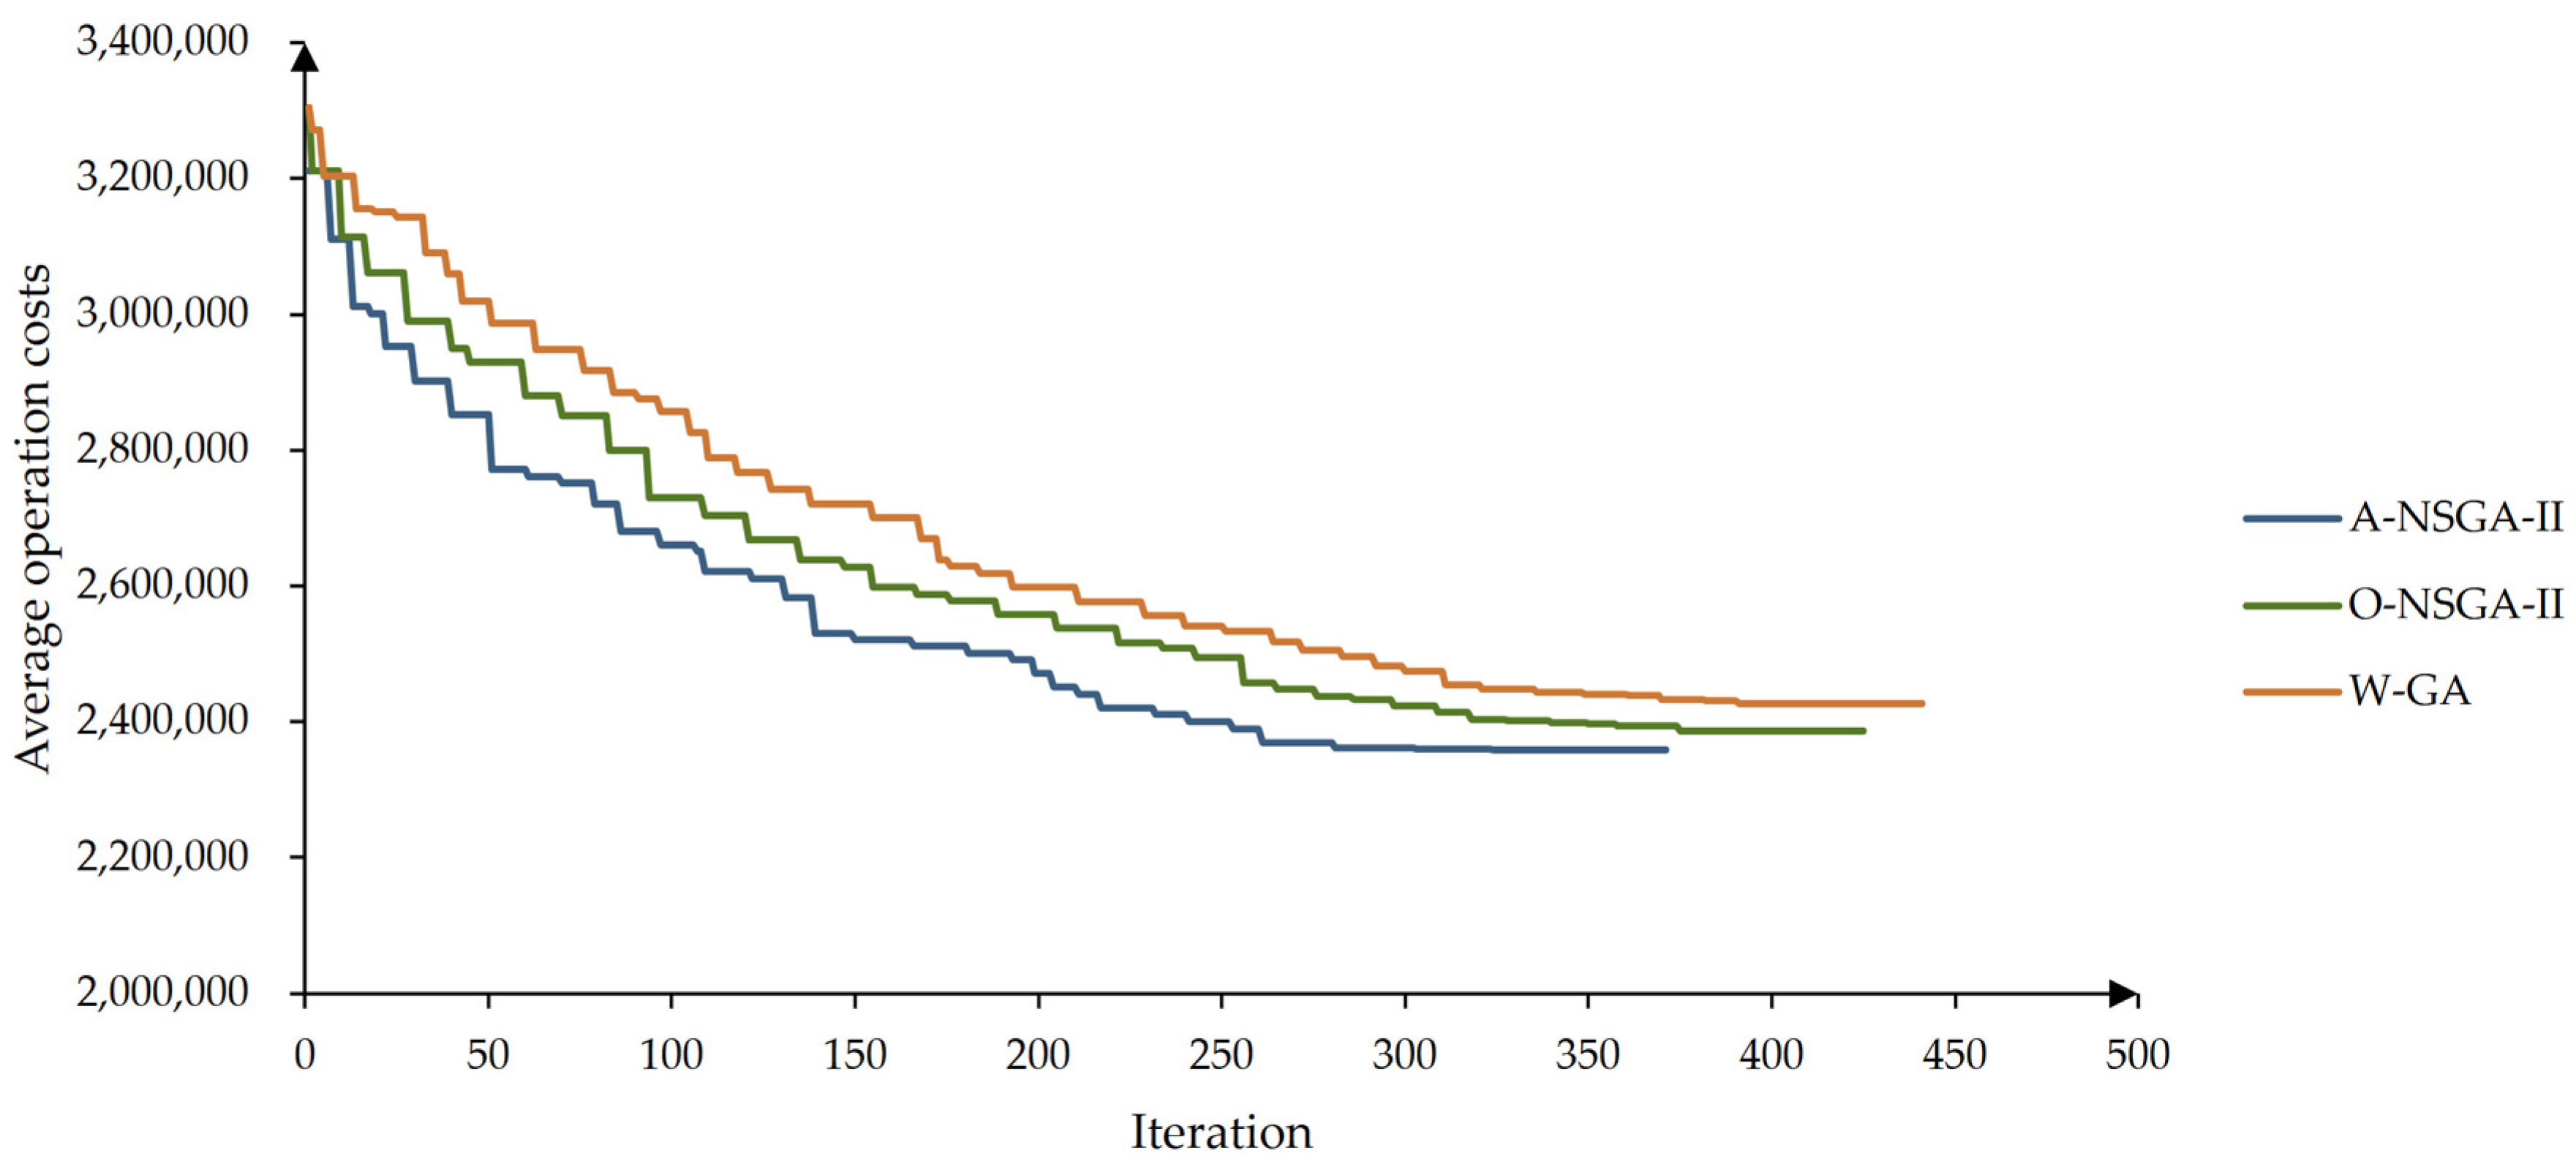
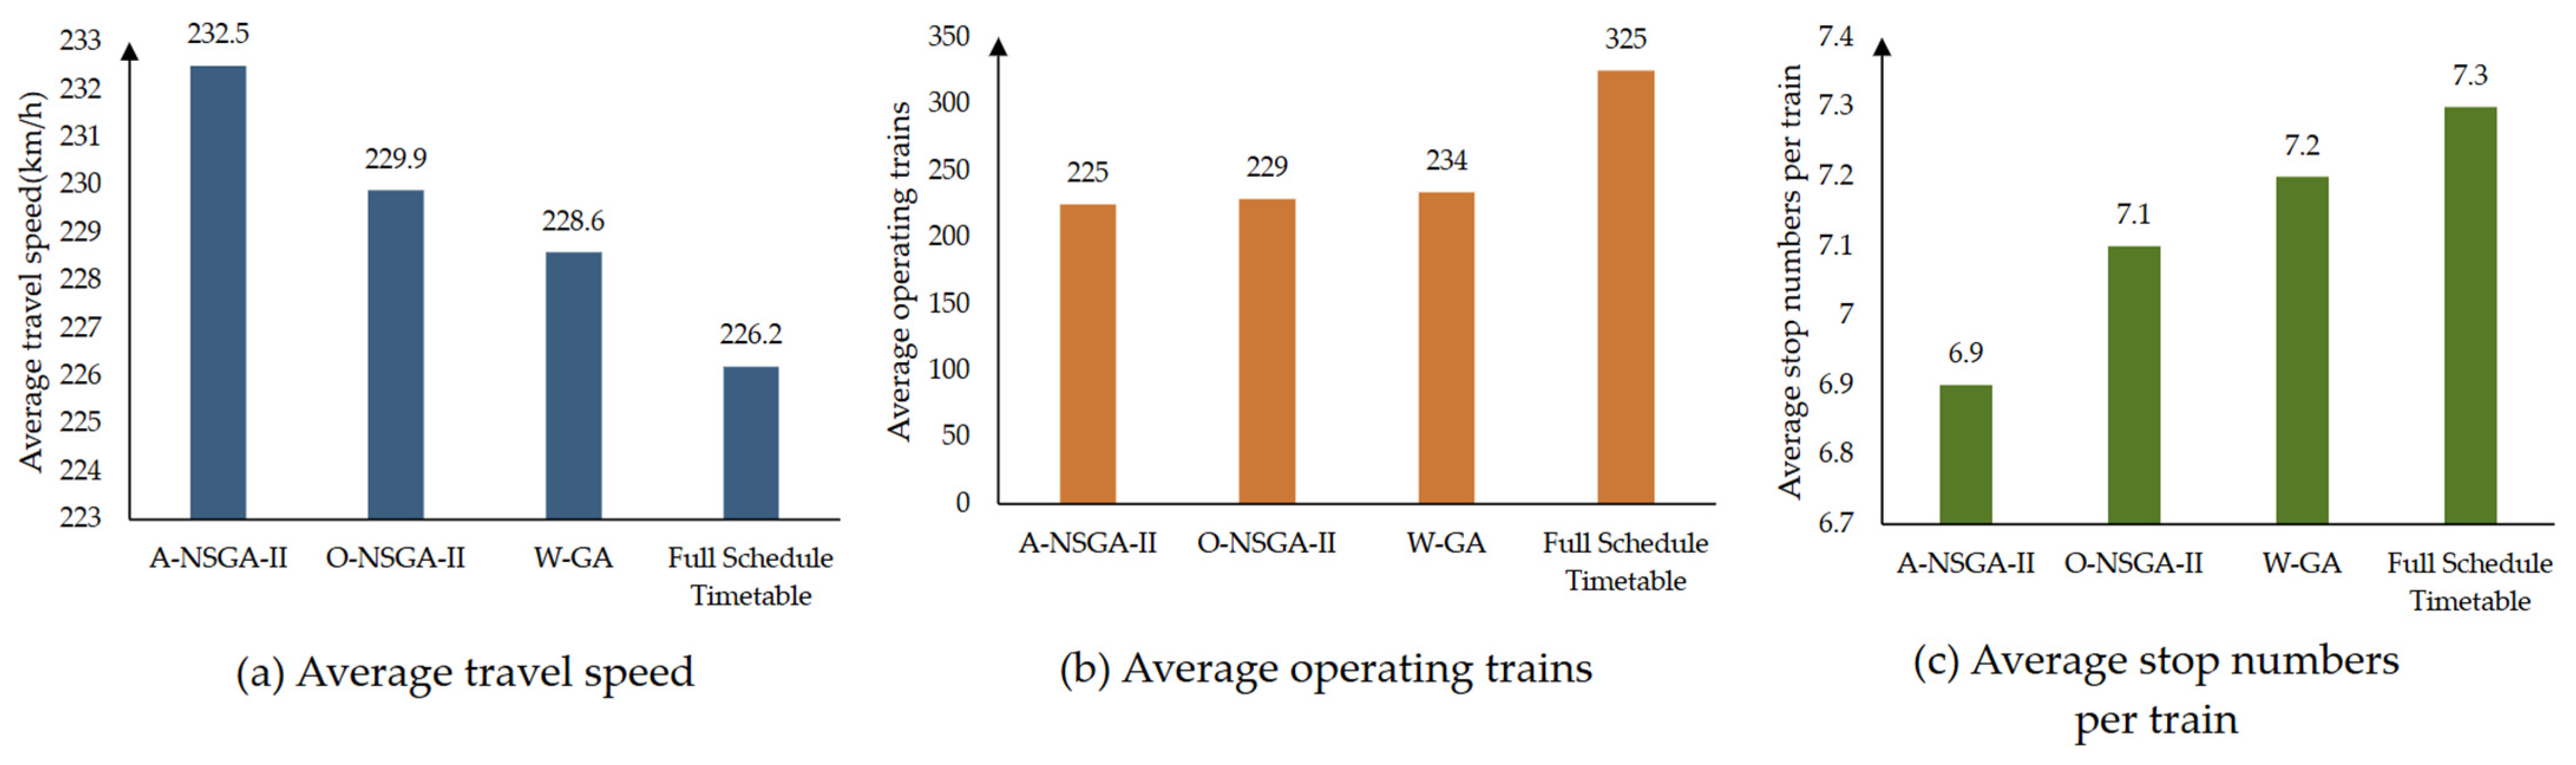
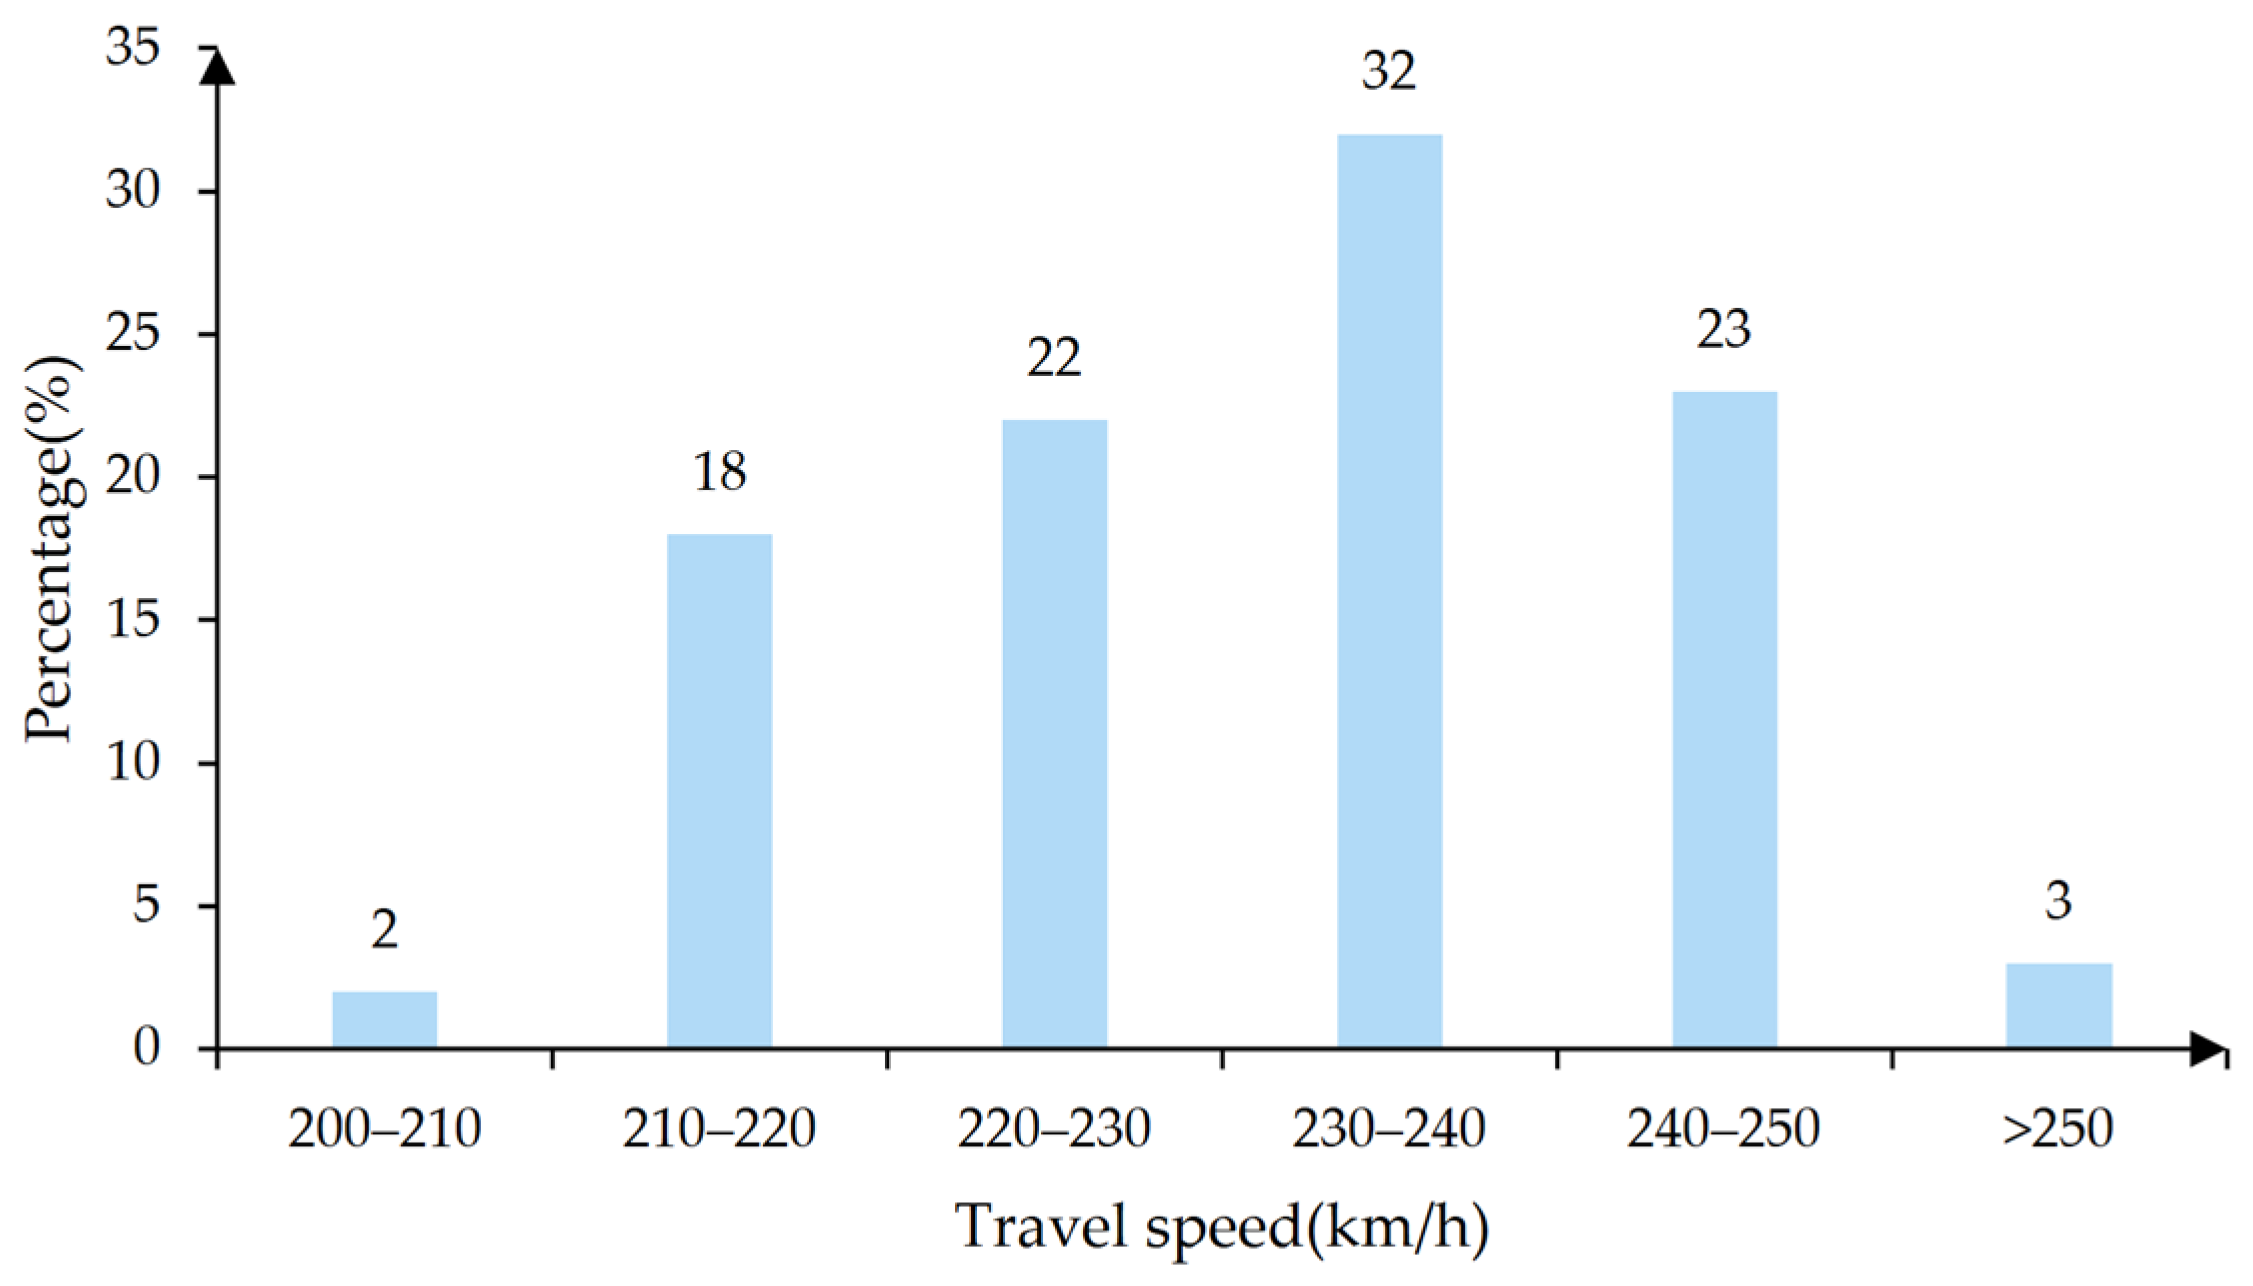
5.1. Results with Different Algorithms

In this paper, three algorithms are utilized to solve the integrated scheduling model with two objectives.
The first algorithm is the genetic algorithm based on weighting the two objectives, which is called W-GA in this Section. Multiple objectives are weighted by a normalization method, as illustrated in reference [13]. The multi-objective weighting method is described in Appendix A.4. Other iteration processes of W-GA are similar to the algorithm in Section 4.
The second algorithm is NSGA-II without acceleration techniques, as mentioned in reference [31], which is called O-NSGA-II in this Section. The algorithm procedure has been illustrated in Section 4.
The third algorithm is NSGA-II by utilizing the acceleration techniques of overtaking pattern and parallel computing, as illustrated in Section 4, which is called A-NSGA-II in this Section. The model in Section 3 is solved by W-GA, O-NSGA-II, and A-NSGA-II, respectively. The fundamental data include the full-schedule timetable with 325 trains. Population size is set to 50. The computation results by the three algorithms under the three passenger scenarios of demands [0.5–0.7], demands [0.6–0.8], and demands [0.7–0.9] are illustrated in Table 6.
It can be observed that compared to the full-schedule timetable, the results under the three passenger demands of demands [0.5–0.7], demands [0.6–0.8], and demands [0.7–0.9] show a significant reduction in train operation costs by 35.4%, 27.7%, and 15.7%, respectively, which demonstrates the effectiveness of the model. A-NSGA-II has a clear advantage over the O-NSGA-II and W-GA in terms of solving time. Under the three different passenger demands, compared to W-GA and O-NSGA-II, the average train operation costs of A-NSGA-II are reduced by 3.2% and 2.2%, respectively, and the solving time is decreased by 42.9% and 38.3%, respectively, which proves the effectiveness and efficiency of A-NSGA-II with acceleration techniques in optimizing the problem proposed in this paper.
Under the scenario of demands [0.6–0.8], the iterative convergence curves of the average operation costs and passenger service quality in the Pareto fronts of W-GA, O-NSGA-II, and A-NSGA-II are shown in Figure 11 and Figure 12, respectively.
We can see that the optimization with A-NSGA-II exhibits a faster convergence speed, particularly in the early stages of iteration. Compared to O-NSGA-II and W-GA, the Pareto front of A-NSGA-II expresses lower train operation costs and higher passenger service quality. The slowest convergence speed of the W-GA demonstrates that, compared to weighting multiple objectives, the non-dominated, sorting-based method is more suitable for handling the problem proposed in this paper.
Under demands [0.6–0.8], we have calculated the average travel speed, average number of operating trains, and average number of stops per train in the full-schedule timetable and timetables, solving them by using W-GA, O-NSGA-II and A-NSGA-II, as shown in Figure 13. Compared to W-GA, O-NSGA-II, and the full-schedule timetable, the timetable solved by A-NSGA-II has fewer operating trains, fewer stop numbers for one train, and faster travel speed, indicating that the timetable could serve passengers efficiently and economically.
For passengers, the shorter the travel time, the faster the travel speed and the higher the passenger service quality. We have calculated the travel speed for passengers in demands [0.6–0.8] with A-NSGA-II, and the proportion of passengers in different travel speed segments, as shown in Figure 14.
Compared to the travel speed of passengers in Figure 14 for A-NSGA-II and the other three timetables in Figure 13a, we can see that the travel speed of most of the passengers (over 58%) in the A-NSGA-II timetable exceeds the average speed in O-NSGA-II, W-GA, and the full-schedule timetable, indicating improved passenger service quality.

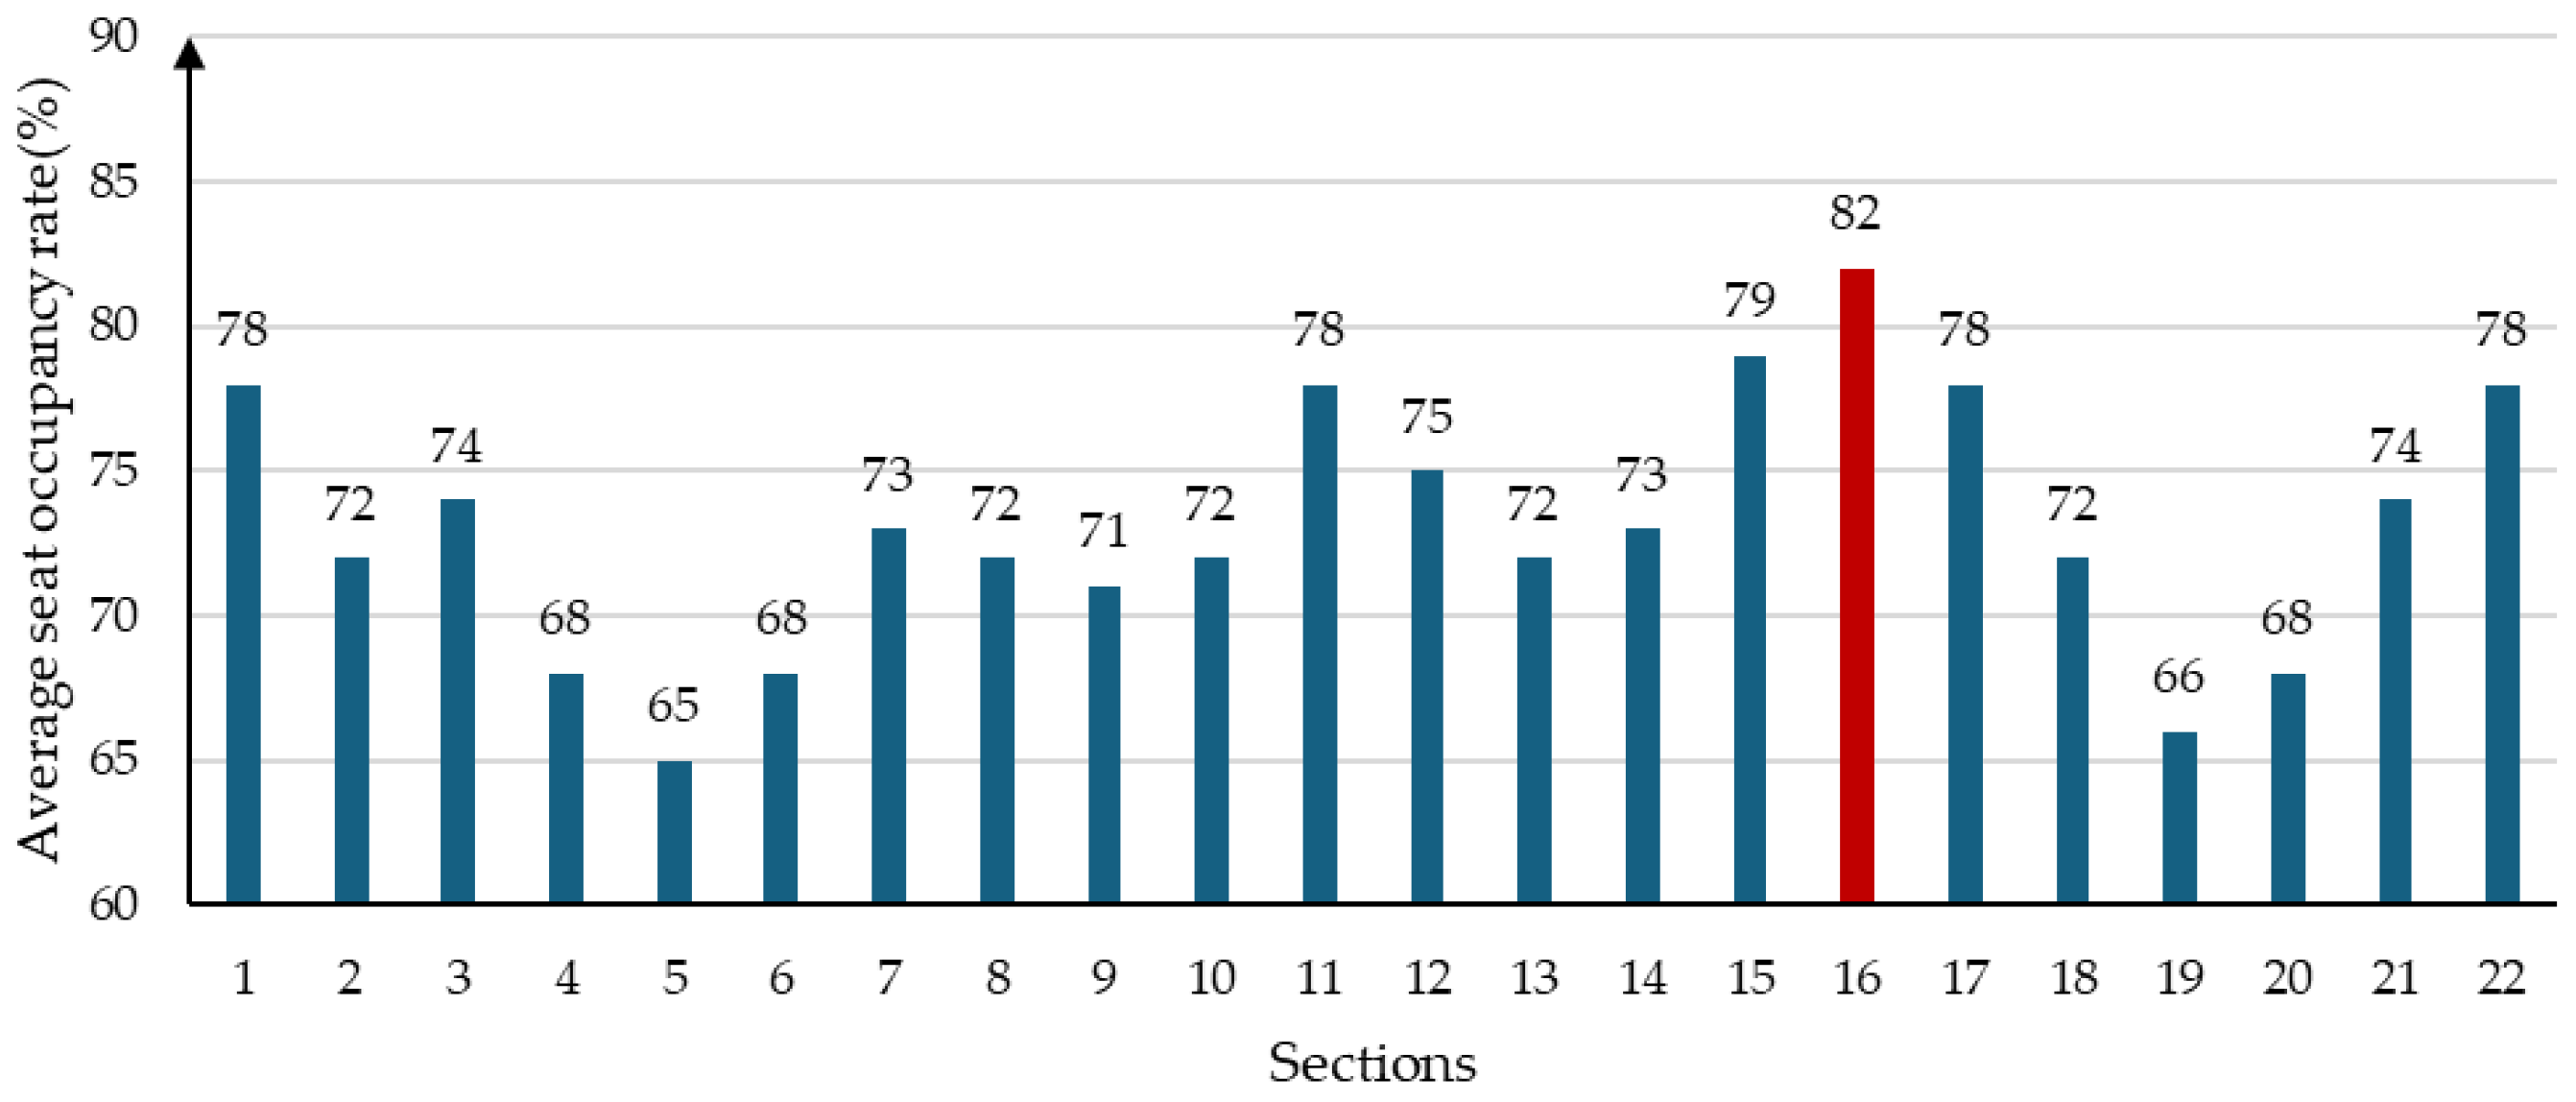
5.2. Results of Average Seat Occupancy Rates

We calculate the average seat occupancy rates in different sections under demands [0.6–0.8] with A-NSGA-II, as shown in Figure 15. It can be seen that the average seat occupancy rate in section 16 (station 16–17) is the largest, as shown by the red color in Figure 15, indicating that a higher passenger demand in this section, and the trains in section 16 are the most fully utilized. This section could be the critical section in the scheduling process of the railway line and should be paid more attention to.

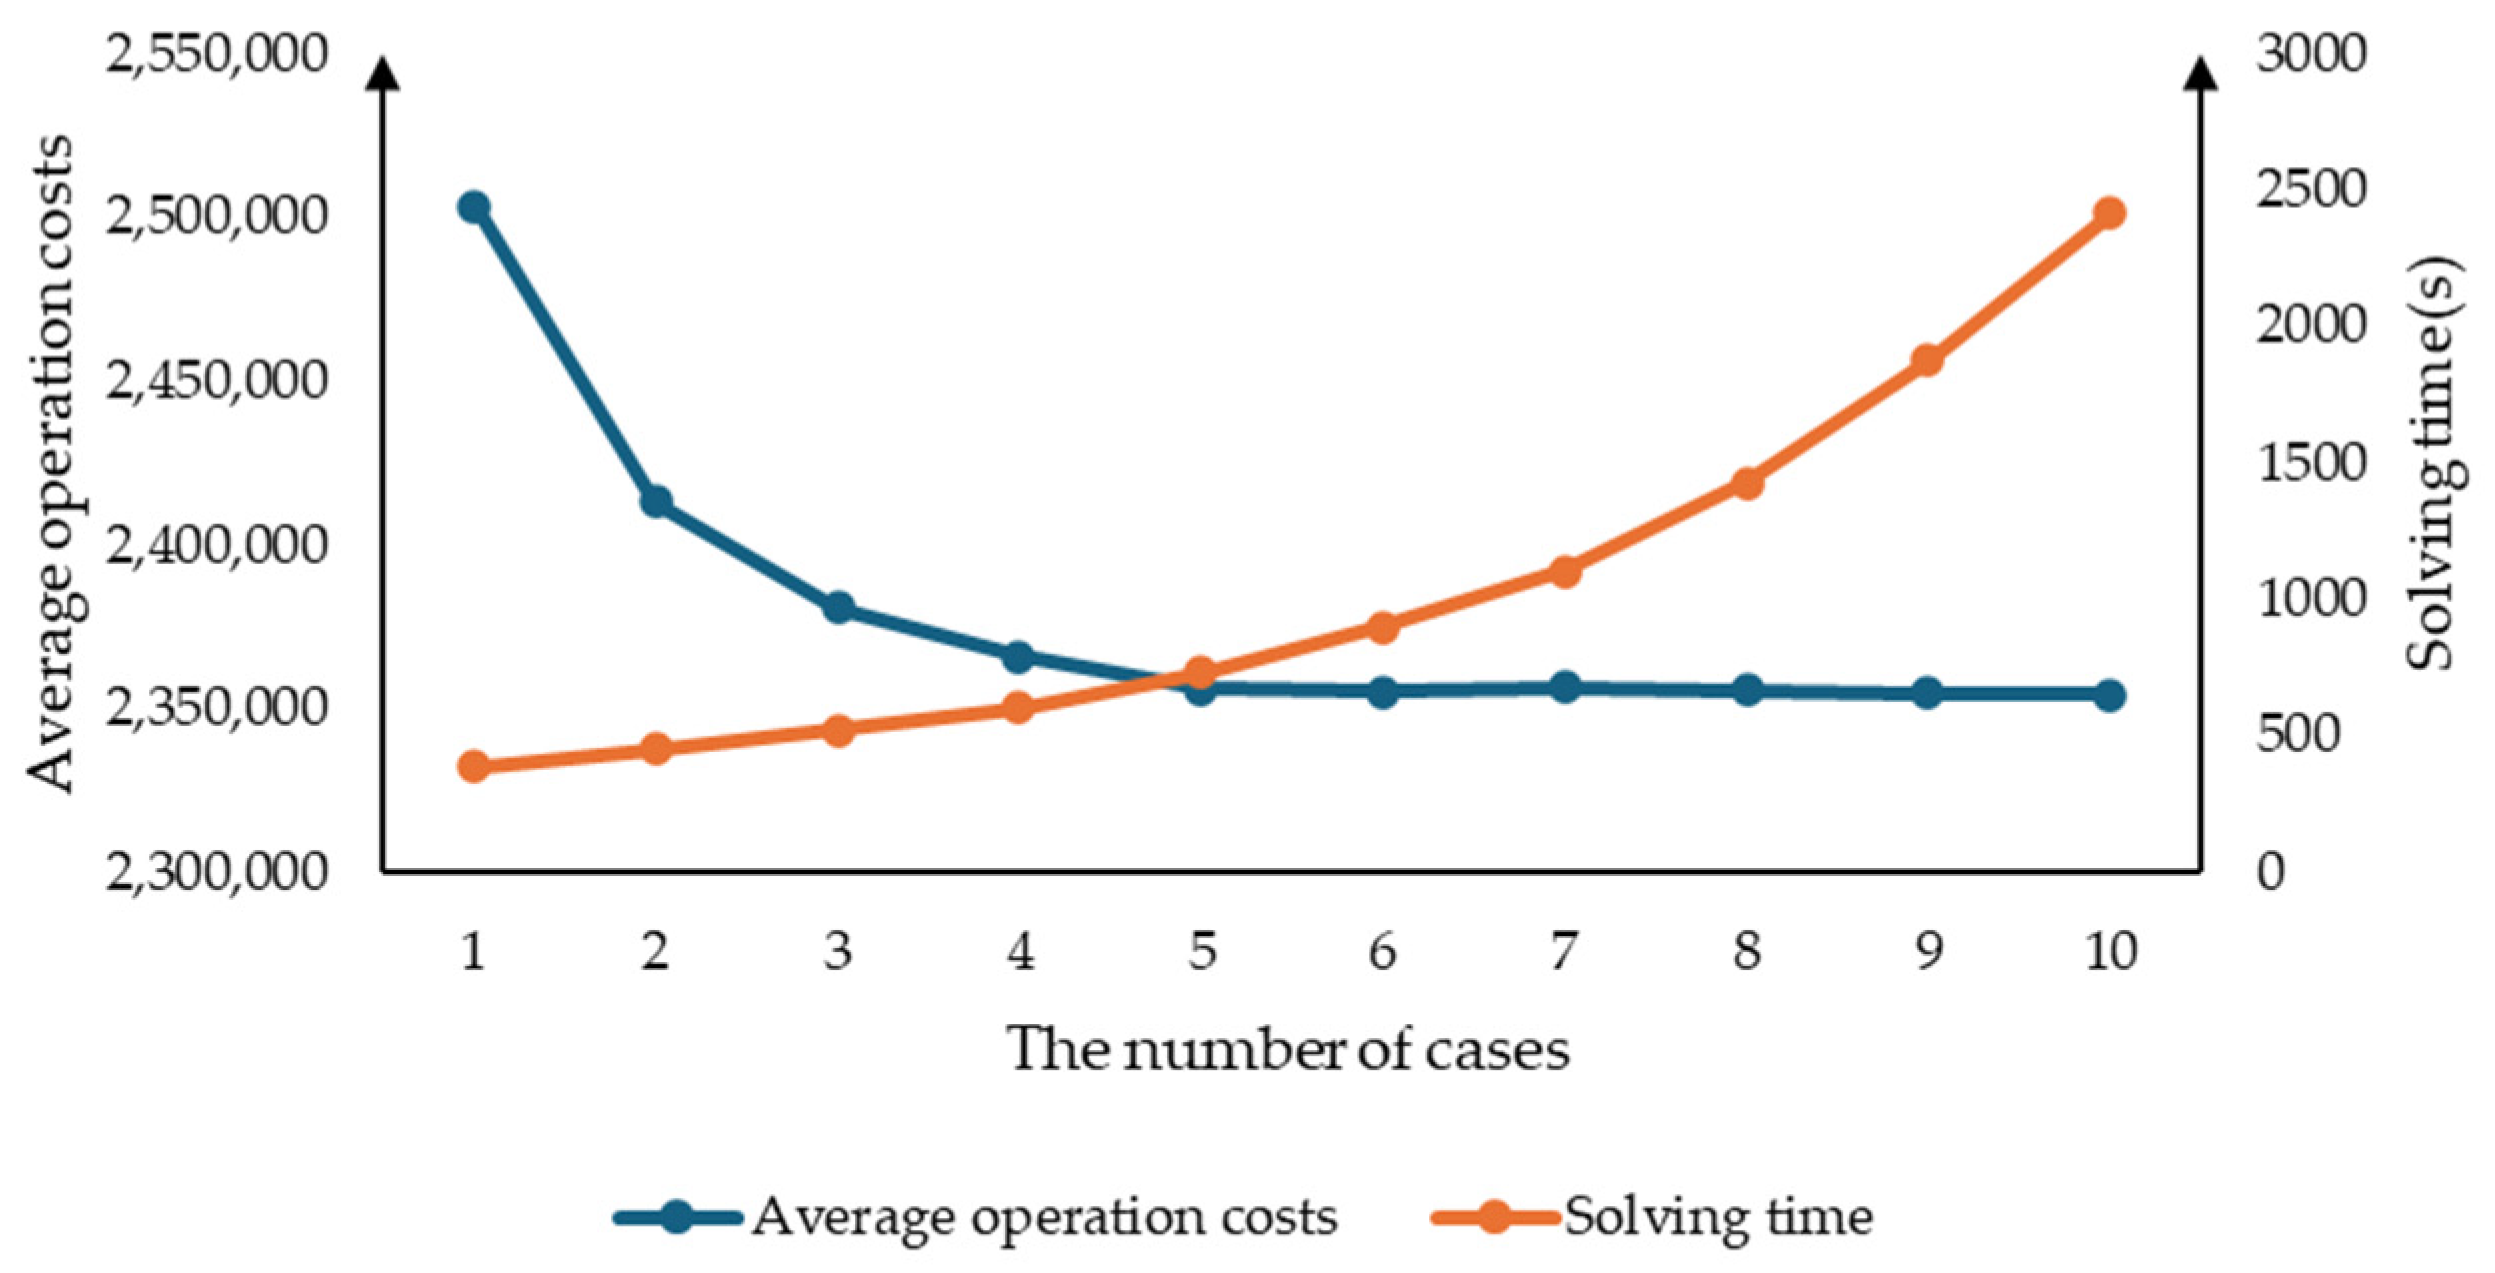
5.3. Results of Population Sizes

The NSGA-II algorithm exhibits nearly quadratic complexity in relation to population size, which significantly impairs solving efficiency. To address this issue, we designed multiple experimental scenarios to investigate the impact of varying population sizes on the solution quality. Table 7 shows the results with different algorithms and passenger demands, and Figure 16 shows the change in solving time and average operating costs with the change in population size.
Table 7 illustrates that as the population size increases, the computational time extends, and the train operation cost decreases. A further analysis of Figure 16 reveals that when the population size is small, increasing it can significantly reduce the train operation cost with a relatively minor increase in computational time, such as from 10 to 40. However, when the population size is large, increasing it does not markedly lower the train operation cost, but it does lead to a substantial increase in computational time, such as from 50 to 100. In the problem studied in this paper, a population size of 50 is deemed appropriate.

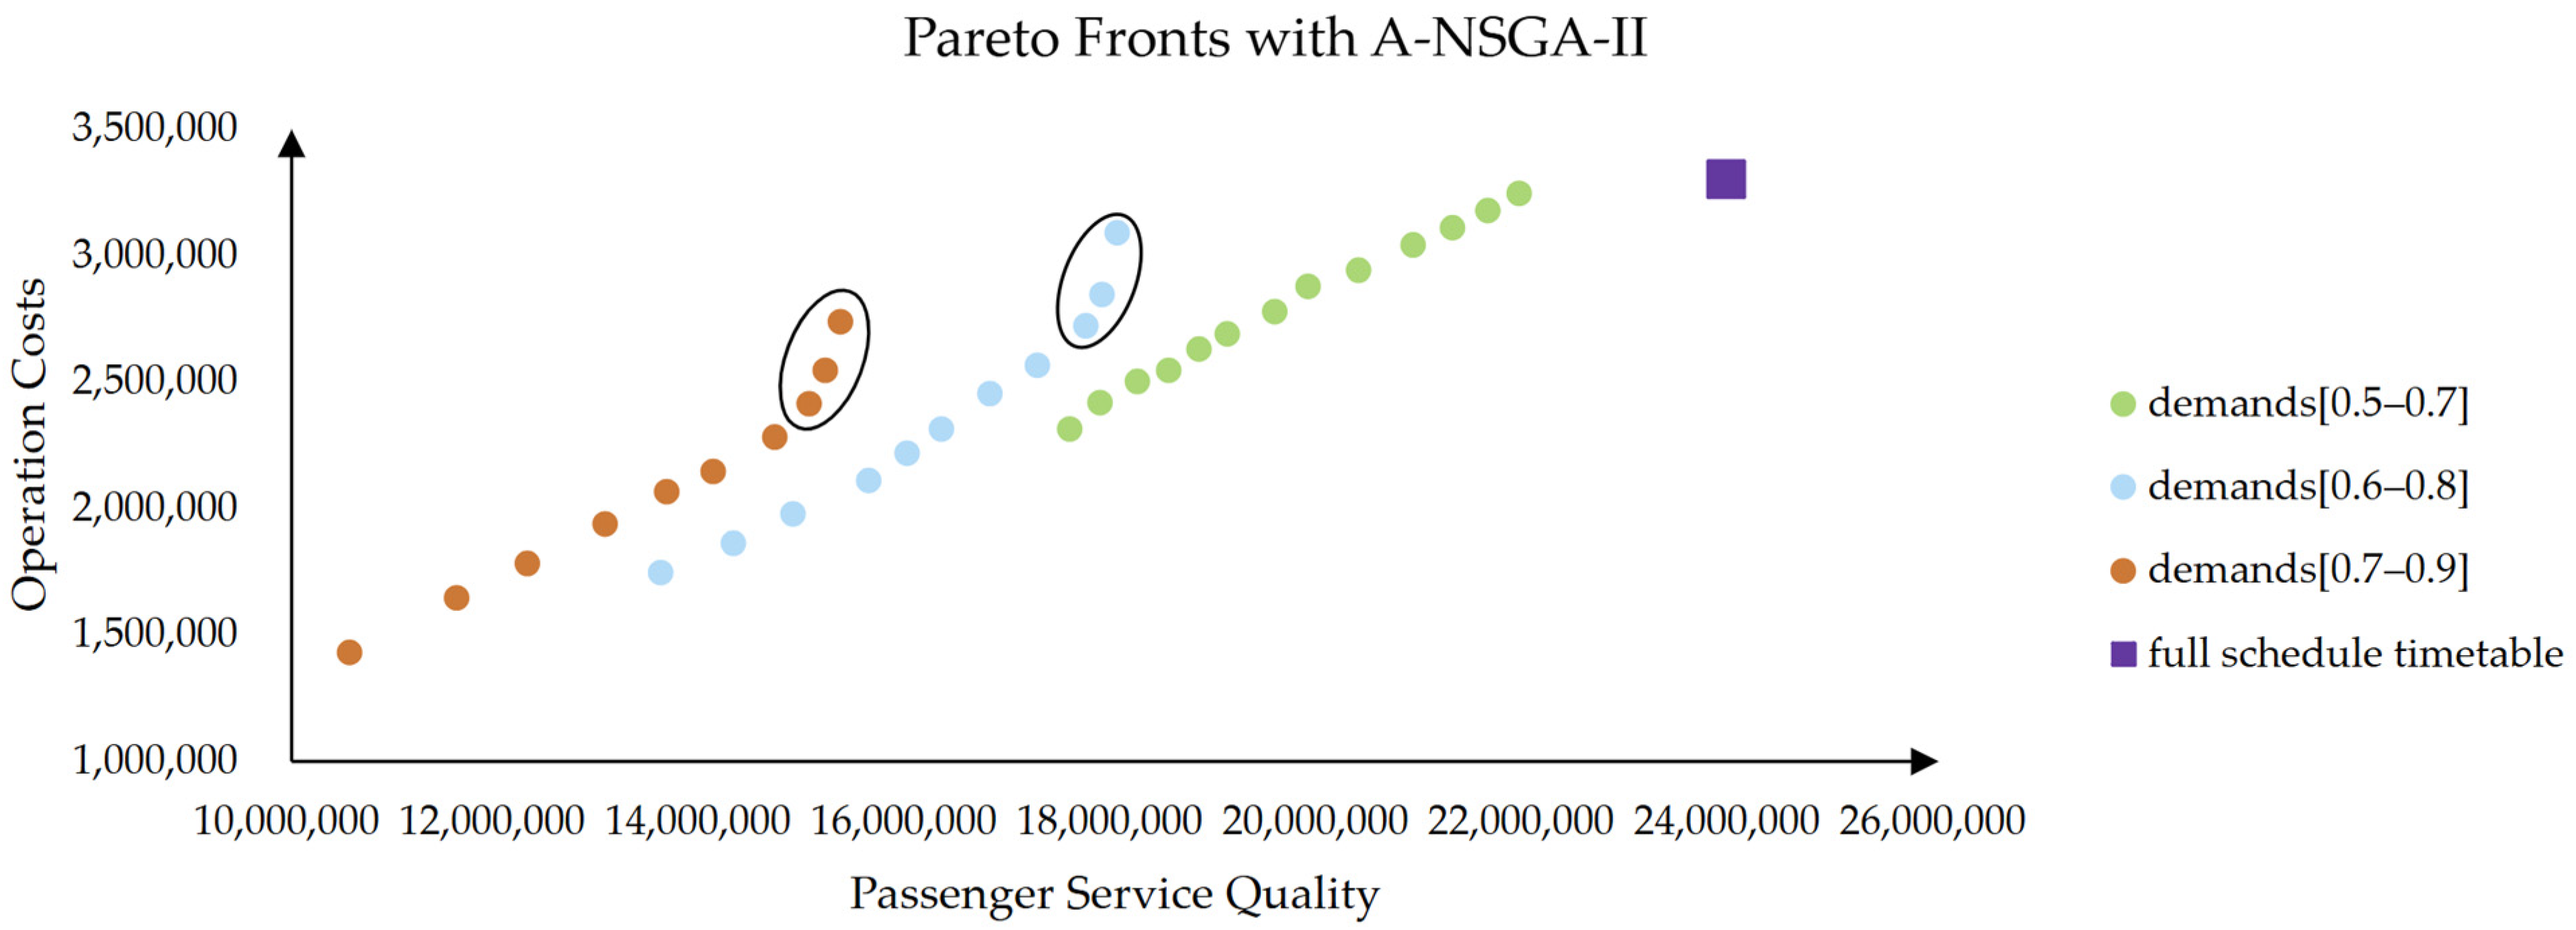
5.4. Results of Individuals in Pareto Fronts

The Pareto fronts of demands [0.5–0.7], [0.6–0.8], [0.7–0.9] with A-NSGA-II contain 10, 11, 13 individuals, respectively, and their objective values are shown in Table 8. We drew a scatter plot to analyze the three Pareto fronts, as shown in Figure 17.
By analyzing the individuals in Table 8 and Figure 17, we can find the following:
  • As the passenger demands grow, the Pareto front is distributed more rightward, suggesting that when the passenger demands increase, a greater number of trains need to be operated to offer a superior passenger service quality, thereby satisfying the passenger demand.
  • According to the individuals in the Pareto fronts of demands [0.5–0.7] and [0.6–0.8], we can see that when the operation cost is relatively high, with the increase in operation costs, the growth of passenger service quality slows down, as shown by the black circle in the two Pareto fronts. Since the passenger demands are relatively low and as the operation costs increase, most of the demands have already been satisfied by high-quality services (such as direct services without intermediate stops). Thus, further increasing operational costs can only provide a limited improvement in service quality. However, when the passenger demands are relatively high, the phenomena does not emerge at the Pareto front of demands [0.7–0.9]. We think it is restricted by the total number of trains in the full-schedule timetable. Although a substantial number of passengers need to be served, the passenger service quality that the full-schedule timetable can offer is limited, making it impossible for all passengers to choose high-quality travel patterns (such as direct services without intermediate stops), which reduces the maximum passenger service quality.
To sum up, through the above-mentioned results and analysis, it can be concluded that the model and algorithm can effectively optimize passenger train plan and train timetable under fluctuating passenger demands. In addition, the designed parallel computing and overtaking pattern can effectively accelerate the solving process.

6. Conclusions

In this research, the integrated scheduling of a passenger train plan and a train timetable based on the full-schedule timetable is studied in order to serve fluctuating passenger demands. An integrated approach including measures of a changing train operating scheme, train stopping scheme and trains operation sequence is adopted. Two objectives of minimizing operation costs, and maximizing passenger service quality are considered, to serve passengers with as low costs as possible, which reduces energy consumption and is conducive to sustainable development. Furthermore, a two-objective model is established.
Based on NSGA-II, an algorithm is established, containing two designed acceleration techniques that utilize overtaking pattern and parallel computing, and Pareto fronts are obtained. In comparison with weighing multiple objectives into one, Pareto fronts can represent the relationships between different objectives more intuitively and provide more operational choices for railway operators.
Based on the Beijing–Shanghai HSR line, some cases are designed to verify the validity and performance of the model and algorithm. Three sets of passenger demands are generated, and three algorithms are adopted to solve the model, which are W-GA, O-NSGA-II, and A-NSGA-II. It has been verified that by applying the model and algorithms offered in this research, the operation costs under these three sets of passenger demands have reduced by 35.4%, 27.7%, and 15.7%, respectively, which significantly reduce the energy consumption, indicating the validity and applicability of the model and algorithms for real-world instance. In addition, it is verified that compared to W-GA and O-NSGA-II, the algorithm of A-NSGA-II proposed in this paper with the two acceleration techniques of utilizing overtaking pattern and parallel computing can significantly accelerate the solution process, leading to an average reduction of 42.9% and 38.3% in calculation time, respectively. The timetable optimized by A-NSGA-II is with fewer trains and faster operation speed, indicating that offering higher passenger service quality with lower operation costs proves that the model and algorithm proposed in this paper could optimize the train operation economically and efficiently. Due to the complexity of non-dominated sorting, the relationship between population size and results is verified, indicating that adopting the population size of 50 can optimize the problem in a relatively short time to reduce the operation costs.
This research has several limitations, and some aspects will be investigated in the future. The rolling stock circulation plan and station operation plan are not considered in this paper, which will be further explored. In addition, this research did not consider the integrated optimization of train operation at the railway network level. Since there are many cross-line trains operating in more than one railway lines, the train operation scheduling for a single railway line will have an impact on other lines, existing many potential conflicts in railway network. Hence, the integrated optimization at the railway network level is highly meaningful, and we will undertake research on this in the future. In this paper, passenger demands are regarded as known quantities, and the impact of travel time caused by waiting, boarding, and alighting processes on passenger service quality is not considered. However, in the actual operation process, passenger demands are more complex and dynamic. Thus, in the future, we will refine the research on passenger demands and train timetable scheduling. The full-schedule timetable in this paper is known. However, scheduling the full-schedule timetable is very challenging work, and we need to determine a critical segment to condition the entire train schedule distribution framework. We will carry out research in this area in the future.

Author Contributions

Conceptualization, C.H. and L.Z.; methodology, C.H. and Z.B.; software, C.H., L.Z. and W.Z.; validation, C.H., W.Z. and L.Y.; formal analysis, C.H. and W.Z.; investigation, Z.B. and L.Y.; resources, Z.B. and L.Y.; data curation, C.H. and W.Z.; writing—original draft preparation, C.H.; writing—review and editing, L.Z. and Z.B.; visualization, C.H.; supervision, L.Z. and Z.B.; project administration, L.Z.; funding acquisition, L.Z. and Z.B. All authors have read and agreed to the published version of the manuscript.

Funding

This research was supported by Beijing Natural Science Foundation, grant number L231026, and R&D Program of Beijing Municipal Education Commission, grant number KM202410037001.

Institutional Review Board Statement

Not applicable.

Informed Consent Statement

Not applicable.

Data Availability Statement

Data are contained within the article.

Acknowledgments

The authors would like to express sincere gratitude to the editors and reviewers for their valuable and constructive comments.

Conflicts of Interest

Lu Yang was employed by Shudao Investment Group Co., Ltd. The remaining authors declare that the research was conducted in the absence of any commercial or financial relationships that could be construed as a potential conflict of interest.

Appendix A

Appendix A.1. Headway Determination Method

Due to the different stops for two trains, their headway differs as well.
For example, when a passing train and a stopping train depart from the station successively, the departure headway between them should satisfy the passing–stopping headway constraint, that is h p s d e p , which can be expressed as shown in (A1):
i f z k , s = 0 , z k , s = 1 , h d e p = h p s d e p
In the same way, the other departure headways can be expressed as Equations (A2)–(A4):
i f z k , s = 1 , z k , s = 1 , h d e p = h s s d e p
i f z k , s = 1 , z k , s = 0 , h d e p = h s p d e p
i f z k , s = 0 , z k , s = 0 , h d e p = h p p d e p
The arrival headways can be expressed as Equations (A5)–(A8).
i f z k , s = 0 , z k , s = 1 , h a r r = h p s a r r
i f z k , s = 1 , z k , s = 0 , h a r r = h s p a r r
i f z k , s = 1 , z k , s = 1 , h a r r = h s s a r r
i f z k , s = 0 , z k , s = 0 , h a r r = h p p a r r
In summary, the headways can be integrally expressed as Equations (A9) and (A10).
h d e p = z k , s z k , s h s s d e p + z k , s ( 1 z k , s ) h s p d e p + ( 1 z k , s ) z k , s h p s d e p + ( 1 z k , s ) ( 1 z k , s ) h p p d e p
h a r r = z k , s z k , s h s s a r r + z k , s ( 1 z k , s ) h s p a r r + ( 1 z k , s ) z k , s h p s a r r + ( 1 z k , s ) ( 1 z k , s ) h p p a r r

Appendix A.2. Crowding Distance

The calculation of crowding distance is conducted as Equation (A11).
c r o w d i = f 1 i 1 f 1 i + 1 f 1 max f 1 min + f 2 i 1 f 2 i + 1 f 2 max f 2 min
where f 1 i + 1 and f 1 i 1 express the first objective values for individuals i 1 and i + 1 . f 1 min , f 1 max express the minimum and maximum values of the first objective in the population.

Appendix A.3. Crossover Probability

With n non-dominated sorting ranks, P c r o s s is calculated as shown in (A12).
P cross = P n c N n
where P n c is the probability of selecting an n-rank individual. N n are the n-rank individuals’ quantities in the current population. The expression for P n c can be formulated as shown in (A13).
P n c = ( 1 0.6 ) n 1 × 0.6 , i f n i s n o t t h e l a s t e s t r a n k , P n c = ( 1 0.6 ) n 2 × 0.4 , f n i s t h e l a s t e s t r a n k ,
When only a single rank exists, the selection probability for each individual is uniformly distributed, as demonstrated in Equation (A14), where N is the population size.
P cross = 1 N

Appendix A.4. The Multi-Objective Weighting Method

In each iteration, the optimization of a single objective is considered, and the maximum and minimum values of the two objectives are obtained separately. Then, the two sets of objective values can be normalized. On this basis, by multiplying different weight coefficients, the problem can be transformed into solving multiple single-objective optimization problems, and a Pareto front composed of non-dominated individuals can be generated. In this paper, Z 1 i ¯ , Z 1 i ¯ is the maximum and minimum operation costs in iteration i , respectively, and Z 2 i ¯ , Z 2 i ¯ is the maximum and minimum passenger service quality in iteration i . For operation costs, Z 1 i , and passenger service quality Z 2 i , the normalized operation costs N Z 1 i and passenger service quality N Z 2 i can be expressed as Equations (A15) and (A16).
N Z 1 i = Z 1 i Z 1 i ¯ Z 1 i ¯ Z 1 i ¯
N Z 2 i = Z 2 i Z 2 i ¯ Z 2 i ¯ Z 2 i ¯
The weighted objective function can be expressed as Equation (A17).
N Z i = α 1 N Z 1 i + α 2 N Z 2 i , α 1 + α 2 = 1
In each iteration, the values of ( α 1 , α 2 ) are (1,0), (0.1,0.9), (0.2,0.8), …, (0.9,0.1), (1,0), respectively.

References

  1. Azzouz, L.; Jack, A. Benchmarking the sustainability reporting of high-speed railways (HSRs): Towards a state-of-the-art benchmarking and reporting framework for HSRs. J. Clean. Prod. 2019, 250, 119505. [Google Scholar] [CrossRef]
  2. Wang, Z.; Zhou, L.; Guo, B.; Chen, X.; Zhou, H. An Efficient Hybrid Approach for Scheduling the Train Timetable for the Longer Distance High-Speed Railway. Sustainability 2021, 13, 2538. [Google Scholar] [CrossRef]
  3. Yadav, V.; Kaswan, M.S.; Gahlot, P.; Duhan, R.K.; Garza-Reyes, J.A.; Rathi, R.; Chaudhary, R.; Yadav, G. Green Lean Six Sigma for sustainability improvement: A systematic review and future research agenda. Int. J. Lean Six Sigma 2023, 14, 759–790. [Google Scholar] [CrossRef]
  4. Yaser, A.H.; Komarudin. Integration of Lean Manufacturing and Industry 4.0: A Conceptual Framework. In Proceedings of the APCORISE 2020: 3rd Asia Pacific Conference on Research in Industrial and Systems Engineering 2020, Depok, Indonesia, 16–17 June 2020. [Google Scholar]
  5. Wu, S.C.; Tong, L. Research on Passenger Flow Distribution Based on High-Speed Railway Train Scheme. In Proceedings of the 23rd COTA International Conference of Transportation Professionals (CICTP)—Innovation-Empowered Technology for Sustainable, Intelligent, Decarbonized, and Connected Transportation, Beijing, China, 14–17 July 2023; pp. 2169–2178. [Google Scholar]
  6. Liu, P.; Han, B.M.; Zhang, Q. Optimization Model of Passenger Train Service Plan Based on the Degree of Passenger Satisfaction. In Proceedings of the 3rd International Conference on Civil Engineering and Transportation (ICCET 2013), Kunming, China, 14–15 December 2013; pp. 577–582. [Google Scholar]
  7. Nie, B.W.; Nie, L.; Fu, H.L.; Wu, X. Weekly line planning to improve the match between rail supply and passenger demand. Comput.-Aided Civ. Infrastruct. Eng. 2023, 38, 1810–1833. [Google Scholar] [CrossRef]
  8. Xia, Y.; Wang, H.X.; Xu, Y.; Zhou, Y.; Wei, Y.G. Integrated optimization of train stop planning and ticket pricing with equity concerns of passengers for high-speed railways. Meas. Control 2023, 56, 792–812. [Google Scholar] [CrossRef]
  9. Li, C.; Zhang, Q.; Fang, B.; Wei, Y.G. An optimisation and adjustment model of train line planning for EMU trains under multiple formation. Int. J. Syst. Sci.-Oper. Logist. 2024, 11, 2398568. [Google Scholar] [CrossRef]
  10. Qi, X.; Xiong, J. Optimization Method of Passenger Train Plan based on Stop Schedule Plan for Passenger Dedicated Line. In Proceedings of the 2nd International Conference on Uncertainty Reasoning and Knowledge Engineering (URKE), Jakarta, Indonesia, 14–15 August 2012; pp. 204–207. [Google Scholar]
  11. Zhi, L. A Common Model for Railway Train Timetable Optimization. In Proceedings of the 2019 11th International Conference on Measuring Technology and Mechatronics Automation (ICMTMA), Qiqihar, China, 28–29 April 2019; pp. 115–119. [Google Scholar]
  12. Higgins, A.; Kozan, E.; Ferreira, L. Optimal scheduling of trains on a single line track. Transp. Res. Part B Methodol. 1996, 30, 147–161. [Google Scholar] [CrossRef]
  13. Ghoseiri, K.; Szidarovszky, F.; Asgharpour, M.J. A multi-objective train scheduling model and solution. Transp. Res. Part B Methodol. 2004, 38, 927–952. [Google Scholar] [CrossRef]
  14. Zhou, X.; Zhong, M. Single-track train timetabling with guaranteed optimality: Branch-and-bound algorithms with enhanced lower bounds. Transp. Res. Part B Methodol. 2007, 41, 320–341. [Google Scholar] [CrossRef]
  15. Liao, Z.W.; Miao, J.R.; Meng, L.Y.; Li, H.Y. A resource-oriented decomposition approach for train timetabling problem with variant running time and minimum headway. Transp. Lett.-Int. J. Transp. Res. 2022, 14, 129–142. [Google Scholar] [CrossRef]
  16. Wu, Y.; Ying, Z.; Wang, H.; Wang, X. A stochastic multi-objective optimization method for railways for Mixed Passenger and Freight Railway Transportation under the Prohibiting Meeting Requirement in the Section. In Proceedings of the 2023 IEEE 26th International Conference on Intelligent Transportation Systems (ITSC), Bilbao, Spain, 24–28 September 2023; pp. 2200–2205. [Google Scholar]
  17. Li, W.; Ni, S. Train timetabling with the general learning environment and multi-agent deep reinforcement learning. Transp. Res. Part B Methodol. 2022, 157, 230–251. [Google Scholar] [CrossRef]
  18. Meng, X.; Jia, L.; Xiang, W. Complex network model for railway timetable stability optimisation. IET Intell. Transp. Syst. 2018, 12, 1369–1377. [Google Scholar] [CrossRef]
  19. Chen, D.; Ni, S.; Xu, C.a.; Jiang, X. Optimizing the draft passenger train timetable based on node importance in a railway network. Transp. Lett. 2017, 11, 20–32. [Google Scholar] [CrossRef]
  20. Qi, J.G.; Li, S.K.; Gao, Y.; Yang, K.; Liu, P. Joint optimization model for train scheduling and train stop planning with passengers distribution on railway corridors. J. Oper. Res. Soc. 2018, 69, 556–570. [Google Scholar] [CrossRef]
  21. Qi, J.G.; Yang, L.X.; Gao, Y.; Li, S.K. Robust Train Timetabling Problem with Optimized Train Stop Plan. In Proceedings of the 12th International Conference on Fuzzy Systems and Knowledge Discovery (FSKD), Zhangjiaiie, China, 15–17 August 2015; pp. 936–940. [Google Scholar]
  22. Odijk, M.A. A constraint generation algorithm for the construction of periodic railway timetables. Transp. Res. Part B Methodol. 1996, 30, 455–464. [Google Scholar] [CrossRef]
  23. Eaton, J.; Yang, S.; Mavrovouniotis, M. Ant colony optimization with immigrants schemes for the dynamic railway junction rescheduling problem with multiple delays. Soft Comput. 2015, 20, 2951–2966. [Google Scholar] [CrossRef]
  24. Ren, X.Y.; Huang, Y.N.; Zhang, M. Train Timetable Optimization Research Based on PSO Energy-Efficient Operation Strategy. In Proceedings of the 2014 International Conference on Informative and Cybernetics for Computational Social Systems (ICCSS), Qingdao, China, 9–10 October 2014; pp. 134–138. [Google Scholar]
  25. Wu, Q.; Cole, C.; McSweeney, T. Applications of particle swarm optimization in the railway domain. Int. J. Rail Transp. 2016, 4, 167–190. [Google Scholar] [CrossRef]
  26. Cacchiani, V.; Caprara, A.; Toth, P. A column generation approach to train timetabling on a corridor. 4OR-Q. J. Oper. Res. 2008, 6, 125–142. [Google Scholar] [CrossRef]
  27. Brännlund, U.; Lindberg, P.O.; Nõu, A.; Nilsson, J. Railway Timetabling using Lagrangian Relaxation. Transp. Sci. 1998, 32, 358–369. [Google Scholar] [CrossRef]
  28. Liu, X.; Zhou, M.; Dong, H.; Wu, X.; Li, Y.; Wang, F.-Y. ADMM-based joint rescheduling method for high-speed railway timetabling and platforming in case of uncertain perturbation. Transp. Res. Part C Emerg. Technol. 2023, 152, 104150. [Google Scholar] [CrossRef]
  29. Zhong, M.; Yue, Y.; Zhou, L.; Zhu, J. Parallel optimization method of train scheduling and shunting at complex high-speed railway stations. Comput.-Aided Civ. Inf. 2023, 39, 731–755. [Google Scholar] [CrossRef]
  30. Kokubo, T.; Fukuyama, Y. Practical Train Crew Scheduling Problems Using Parallel Tabu Search. In Proceedings of the 57th Annual Conference of the Society of Instrument and Control Engineers of Japan (SICE), Nara, Japan, 11–14 September 2018; pp. 1673–1678. [Google Scholar]
  31. Deb, K.; Pratap, A.; Agarwal, S.; Meyarivan, T. A fast and elitist multiobjective genetic algorithm: NSGA-II. IEEE Trans. Evol. Comput. 2002, 6, 182–197. [Google Scholar] [CrossRef]
  32. Martínez-Salazar, I.A.; Molina, J.; Ángel-Bello, F.; Gómez, T.; Caballero, R. Solving a bi-objective Transportation Location Routing Problem by metaheuristic algorithms. Eur. J. Oper. Res. 2014, 234, 25–36. [Google Scholar] [CrossRef]
  33. Seifpour, M.; Asghari, S.A.; Ghobaei-Arani, M. A stochastic multi-objective optimization method for railways scheduling: A NSGA-II-based hybrid approach. J. Supercomput. 2023, 80, 2128–2163. [Google Scholar] [CrossRef]
  34. Chen, X.; Li, K.; Zhang, L.; Tian, Z. Robust Optimization of Energy-Saving Train Trajectories Under Passenger Load Uncertainty Based on p-NSGA-II. IEEE Trans. Transp. Electrif. 2023, 9, 1826–1844. [Google Scholar] [CrossRef]
Figure 1. Illustration of passenger train plan and train timetable.
Sustainability 17 02703 g001
Figure 2. Schematic of passenger train plan and full-schedule timetable.
Sustainability 17 02703 g002
Figure 3. Schematic of passenger train plan and timetable of the two schemes.
Sustainability 17 02703 g003
Figure 4. Schematic of full-schedule timetable and scheduled timetable.
Sustainability 17 02703 g004
Figure 5. Non-dominated sorting and Pareto front.
Sustainability 17 02703 g005
Figure 6. Chromosomes.
Sustainability 17 02703 g006
Figure 7. Timetable based on chromosomes.
Sustainability 17 02703 g007
Figure 8. The process of selection.
Sustainability 17 02703 g008
Figure 9. Algorithm procedure.
Sustainability 17 02703 g009
Figure 10. Schematic of Beijing–Shanghai HSR line.
Sustainability 17 02703 g010
Figure 11. The iterative convergence curves of the passenger service quality.
Sustainability 17 02703 g011
Figure 12. Iterative convergence curves of the average operation costs.
Sustainability 17 02703 g012
Figure 13. Average operating trains, travel speed, and stop numbers with different algorithms.
Sustainability 17 02703 g013
Figure 14. Proportion of passengers in different travel speed segments.
Sustainability 17 02703 g014
Figure 15. Average seat occupancy rates in different sections.
Sustainability 17 02703 g015
Figure 16. The change curve of solving time and average operating costs.
Sustainability 17 02703 g016
Figure 17. The Pareto fronts of demands [0.5–0.7], [0.6–0.8], [0.7–0.9].
Sustainability 17 02703 g017
Table 1. Summary of the research scopes and objectives of references.
LiteratureResearch ScopeObjectiveMulti-Objective
Processing
Wu [5]Passenger train planMaximizing board seat rate-
Liu [6]Passenger train planMinimizing the total passenger train stop times and
minimizing extra passenger transportation costs
Weighting multiple objectives
Xia [8]Passenger train planMaximizing the total ticket revenue-
Qi [10]Passenger train planMaximizing the income of passenger transport and
minimizing stopping and running cost
Weighting multiple objectives
Ghoseiri [13]Train timetableMinimizing fuel consumption and travel timeWeighting multiple objectives in different ways
Zhou [14]Train timetableMinimizing train total travel time-
Wu [16]Train timetableMinimizing the average passenger expectation and
the total number of train operation cycles
Pareto front
Meng [18]Train timetableMaximizing train timetable stability-
Qi [20]Passenger train plan and train timetableMinimizing the travel time of all trains and passengers-
Qi [21]Passenger train plan and train timetableMinimizing the travel time and varianceWeighting multiple objectives
Table 2. Sets.
Table 2. Sets.
NotationsDefinition
K Set   of   trains   in   the   full - schedule   timetable ,   train   k K
K c Set   of   cross - line   trains   in   the   full - schedule   timetable ,   train   k K c
T Set   of   feasible   time   for   train   operation ,   time   t T
S Set   of   stations   in   train   timetable ,   station   s S
S k Set of operation stations of train k ,   station   s S k
G Set   of   operation   sec tions   in   train   timetable ,   sec tion   g G
G k Set of operation sections of train k ,   sec tion   g G k
P Set   of   passenger   demands ,   demand   p P
Table 3. Parameters.
NotationsDefinition
a f k , s The arrival time of train k at station s in the full-schedule timetable
d f k , s The departure time of train k at station s in the full-schedule timetable
s t o k , s If train k stops at station s in   the   full - schedule   timetable ,   s t o k , s = 1 ,   otherwise ,   s t o k , s = 0
o s k The origin station for train k
d s k The destination station for train k
o s g The origin station for section g
d s g The destination station for section g
o s p The origin station for demand p
d s p The destination station for demand p
c a p k The capacity of train k
q p The quantity of passengers of demand p
δ p , g Whether the range of demand p contains section g ;   if   yes ,   δ p , g = 1 ,   otherwise ,   δ p , g = 0
t k , g r u n Travel time for train k in section g
t a r r e x t r a Extra operation time for arrival
t d e p e x t r a Extra operation time for departure
m i n t k , s d e w The minimum dwelling time at station s for train k
m a x t k , s d e w The maximum dwelling at station s time for train k
h a r r The arrival headway between two trains
h p s a r r The minimum arrival headway between passing train and stopping train
h p p a r r The minimum arrival headway between two passing trains
h s s a r r The minimum arrival headway between two stopping trains
h s p a r r The minimum arrival headway between stopping train and passing train
h d e p The departure headway between two trains
h p s d e p The minimum departure headway between passing train and stopping train
h p p d e p The minimum departure headway between two passing trains
h s s d e p The minimum departure headway between two stopping trains
h s p d e p The minimum departure headway between stopping train and passing train
t k e a r The earliest departure time of train k at origin station
t k l a t The latest departure time of train k at origin station
n k o v e r The maximum times that train k is allowed to be overtaken
n k s t o p The maximum times that train k is allowed to stop
σ k , s Whether train k must stop at station s ;   if   yes ,   σ k , s = 1 ,   otherwise ,   σ k , s = 0
c k The operation costs of operating train k
c s The operation costs of adding a stop
Γ p , k The basic quality of train k serving one passenger from demand p
t p , k d i r The running time required for train k to serve demand p without extra stops
c p The loss of service quality for one passenger of demand p due to 1 min extra travel time
Δ t The maximum deviation of departure and arrival time compared to the time in full-schedule timetable
N The number of individuals in the population
M A large integer
Table 4. Decision variables.
NotationsDefinition
x k Binary   variable ,   if   x k = 1 , train k operates in optimized timetable
τ k , s a r r The arrival time of train k at station s
τ k , s d e p The departure time of train k at station s
z k , s Binary   variable ,   if   z k , s = 1 k stops at station s
w p , k The number of passengers from demand p allocated to train k
s e q k , k g Binary   variable ,   if   s e q k , k g = 1 , train k is the preceding train of train k in section g
Table 5. The values of parameters.
ParameterValue
The number of trains in full-schedule timetable325
Time window allowing for train operating[6:00–24:00]
Extra operation time for arrival3 min
Extra operation time for departure2 min
The minimum dwelling time at station s for train k 2 min
The maximum dwelling at station s time for train k 15 min
h p s a r r 4 min
h p p a r r 3 min
h s s a r r 4 min
h s p a r r 2 min
h p s d e p 6 min
h p p d e p 3 min
h s s d e p 3 min
h s p d e p 7 min
The maximum times for one train to be overtaken3
The maximum times for one train to stop13
Table 6. The results with different algorithms under different passenger demands.
NO.Passenger DemandsAlgorithmAverage
Passenger
Service Quality
Average
Operation Costs
Solving Time (s)Numberof Iterations
1demands [0.5–0.7]W-GA13,509,3322,163,3751177395
2demands [0.5–0.7]O-NSGA-II13,502,5822,143,8651109388
3demands [0.5–0.7]A-NSGA-II13,541,3452,099,696683341
4demands [0.6–0.8]W-GA16,161,0442,426,7581311441
5demands [0.6–0.8]O-NSGA-II16,159,0242,386,1101194425
6demands [0.6–0.8]A-NSGA-II16,201,0462,356,076732372
7demands [0.7–0.9]W-GA19,594,2352,896,3451405473
8demands [0.7–0.9]O-NSGA-II19,604,2342,878,4831300466
9demands [0.7–0.9]A-NSGA-II19,653,9522,791,541808407
10full-schedule timetable23,934,9213,304,947--
Table 7. The results with different algorithms and passenger demands.
NO.Population SizeNumber of
Individuals
in Pareto Front
Average
Passenger
Service Quality
Average
Operation Costs
Solving Time (s)Number
of Iterations
110815,888,2342,503,375385231
220915,919,4232,412,865452273
3301115,923,8232,380,696521314
4401216,061,0442,365,758602352
5501316,201,0462,356,076732372
6601416,211,0462,355,088900383
7701416,234,2352,356,3451101398
8801316,233,2342,355,4831426391
9901516,235,9522,354,5411877404
101001416,236,9212,354,1472414411
Table 8. Individuals in the three Pareto fronts.
Demands [0.5–0.7]Demands [0.6–0.8]Demands [0.7–0.9]
No.Passenger
Service Quality
Operation CostsNo.Passenger
Service Quality
Operation CostsNo.Passenger
Service Quality
Operation Costs
115,326,8312,738,265118,013,1253,092,910121,918,7313,247,053
215,176,3462,547,886217,869,7522,849,031221,616,7143,179,914
315,025,8492,413,496317,707,4152,721,178321,271,2663,110,030
414,685,7072,282,060417,240,4252,567,312420,894,3093,044,312
514,085,3042,145,387516,773,6212,456,574520,356,7952,944,076
613,641,6012,067,602616,306,8182,315,738619,872,7912,879,075
713,034,5981,939,432715,976,7652,217,473719,545,1602,779,322
812,284,0951,783,404815,595,4782,110,440819,083,8342,692,131
911,598,0661,648,248914,861,1251,978,573918,806,5742,630,000
1010,555,0541,431,1881014,287,2411,861,9181018,516,8092,548,421
1113,579,7451,745,6961118,213,8632,502,417
1217,852,2382,420,236
1317,552,2872,313,043
Average13,541,3452,099,696-16,201,0462,356,076-19,653,9522,791,541
Disclaimer/Publisher’s Note: The statements, opinions and data contained in all publications are solely those of the individual author(s) and contributor(s) and not of MDPI and/or the editor(s). MDPI and/or the editor(s) disclaim responsibility for any injury to people or property resulting from any ideas, methods, instructions or products referred to in the content.

