Abstract
The construction of urban rail transit plays a crucial role in improving traffic conditions in large cities, promoting green urban development, and reducing carbon dioxide emissions. Based on Chinese urban data, this paper employs a time-varying difference-in-difference model combined with the Heckman two-step method to control the sample selection problem. The objective of this methodology is to ascertain whether urban rail transit exerts a traffic creation effect or a traffic substitution effect. The following results were found: (1) Urban rail transit notably reduces the bus ridership per capita and the carbon dioxide emissions per capita in cities, a finding which passes a series of robustness tests, and the traffic substitution effect increases as the number of urban rail transit lines increases. (2) Heterogeneity analysis reveals that the traffic substitution effect in terms of carbon reduction in urban rail transit is greater in non-resource-based cities, cities with large carbon emissions, and cities with low fiscal pressure. (3) Urban rail transit reduces the carbon dioxide emissions per capita by improving the allocation efficiency of factor resources and further generating technological innovation and structural upgrading effects. (4) Spatial econometric analysis shows that urban rail transit has a significant spatial spillover effect on the reduction in carbon dioxide emissions per capita in neighboring cities. In short, urban rail transit can reduce the carbon dioxide emissions per capita by improving resource allocation and support the attainment of carbon peak and carbon neutrality goals. This effect is greater in large cities where urban rail transit networks have been established. Therefore, cities should actively promote the construction of metro and other rail transit within the scope of urban financial resources and make full use of the carbon reduction and efficiency enhancement functions of urban rail transit. In this way, urban rail transit can become an effective tool for the realization of sustainable development.
Keywords:
urban rail transit; urban carbon dioxide emission; traffic substitution effect; resource allocation efficiency; China JEL Classification:
O18; Q54; R41
1. Introduction
The construction of low-carbon transportation systems is an important method in China’s pursuit of achieving the carbon peak and carbon neutrality goals and facilitating sustainable development of economic and social aspects. In December 2023, the Opinions on Comprehensively Promoting the Construction of a Beautiful China issued by the Central Committee of the Communist Party and the State Council of China explicitly emphasized that, “Environmentally friendly travel should be encouraged and the strategy of giving priority to the development of public transportation in urban areas should be implemented. Through the construction of public transportation, road accessibility can be improved, the economical and intensive use of resources can be promoted, and energy conservation, emission reduction, and pollution prevention can be strengthened”. To promote the construction of urban transportation systems, cities should not only improve the external transportation systems, such as high-speed railroads and highways, but also optimize the internal transportation systems and develop urban transportation networks mainly based on subways and other rail transit, supplemented by buses and shared bicycles. Existing studies have mainly focused on the carbon emission reduction effects of high-speed rail [1], buses [2], bicycle-sharing [3,4], and low-carbon transportation systems [5,6,7]. Therefore, the present study seeks to explore the potential of urban rail transit to divert traffic, thereby affecting urban carbon emissions. This exploration is of particular importance, both in principle and in practice, given the extant research that demonstrates the efficacy of low-carbon transportation in reducing carbon emissions.
Urban rail transit (hereafter URT) [8], often referred to as the metro, is the most representative green public transport. Given the large geographical area and high population density of China’s cities, the development of urban rail transit has obvious advantages, not only improving urban traffic congestion [9] but also contributing to the more effective use of resources within the city. Since the 21st century, urban rail transit systems in more than 50 Chinese cities have successfully opened. By the end of 2024, a total of 58 cities were operating 362 lines covering 12,168.77 km. Among them, the mileage of large-capacity (subway) operation is 9281.37 km, accounting for 76.27%; the mileage of medium-capacity (light rail, urban express rail, cross-sitting monorail, magnetic levitation transportation) operation is 2063.63 km, accounting for 16.96% (source: created by the authors from the China Association of Metros). However, serious questions are being raised about the externalities of building and operating urban rail transit, which may be higher than the huge input costs to society [10].
Therefore, the existing literature examines the impacts generated by URT in terms of environmental and economic externalities. Firstly, URT can combat pollution and reduce carbon dioxide in terms of environmental externalities. URT reduces air pollution [11] and improves air quality [12] through traffic substitution effect [13]. Simultaneously, using data from individual cities such as Los Angeles [14,15], Mumbai [16], Delhi [17], Beijing [18], and Shenzhen [19], existing studies have shown that URT reduces carbon dioxide emissions from transportation, households, and the entire life cycle. Secondly, URT promotes the economic development of cities in terms of economic externalities [20]. URT can increase urban land prices and rents [21], corporate innovation capacity [22,23], and urban economic activity and promote the upgrading of the industrial structure of the city. In addition, URT generates both positive environmental externalities and economic externalities that can increase environmental efficiency [24] and green total factor productivity [25]. The environmental and economic externalities of URT also have a significant spatial spillover effect on neighboring cities.
In summary, previous research on the impact of URT on carbon emissions has mainly focused on the carbon emission reduction in URT itself, or on simulating the carbon emission reduction values of the lines of a single city. Existing studies have not yet answered the question of whether the active promotion of URT in China’s many large cities is consistent with the synergistic development goals of carbon reduction and efficiency enhancement from the perspective of the more than 50 cities in China that have opened a URT. To bridge the research gap mentioned above, the following issues need to be examined in depth: How does urban rail transit have a direct carbon reduction effect? Does it vary over time? Are there differences across cities? Is resource allocation efficiency an effective mechanism for indirect carbon reduction in urban rail transit? Is there spatial spillover from the carbon reduction effects of urban rail transit? Given the above, this research uses the unbalanced panel data of Chinese prefecture-level cities and municipalities, covering the period from 2002 to 2023. By conducting theoretical analysis, this paper establishes a time-varying difference-in-difference model and integrates Heckman’s two-step method for managing the sample selection bias, empirically examining the impact of URT on urban carbon dioxide emissions per capita. Subsequently, this study also carries out a series of robustness tests, analyzes the impact of the specific level of URT development, and discusses the heterogeneity of the impact in different types of cities as well as spatial spillover effects. Finally, this paper focuses on the impact mechanisms from a resource allocation perspective, covering the allocation effects of resources such as land, capital, and labor. The marginal contributions may be in the following areas: Firstly, establishing a theoretical connection between rail transit and carbon emissions of urban economic activities from the perspective of resource allocation has broadened the existing research perspective. Secondly, investigate the mechanism path of green public transport to reduce the urban carbon dioxide emissions per capita. The construction of URT improves intra-urban accessibility and promotes the formation of a unified market, which affects the allocation of capital, labor, and land. Therefore, this research innovatively analyzes how URT can reduce the urban carbon dioxide emissions per capita by improving the allocation efficiency of land, capital, and labor factors, as well as the green technology innovation and industrial structure upgrading further triggered by the improved resource allocation efficiency. Thirdly, investigate the spatial spillover effect of urban rail transit in China on the carbon dioxide emissions per capita of neighboring cities. Based on the analysis of the direct and indirect impacts of urban rail transit on the spatial spillover of urban carbon emissions, we explore the influence of urban rail transit on the per capita carbon emissions of surrounding cities.
The remainder of this paper is organized as follows. Section 2 analyzes the relevant theories presenting the research hypothesis. Section 3 carries out the research design. Section 4 reports the results regarding the effect of urban rail transit on the bus ridership per capita and carbon dioxide emissions per capita. Section 5 conducts a further discussion, including heterogeneity analysis, mechanism testing, and spatial spillover testing. Section 6 concludes the paper.
2. Theoretical Analysis and Research Hypotheses
Urban rail transit helps to achieve the goal of carbon peak and carbon neutrality by facilitating the construction of a low-carbon transportation system. This paper analyzes the theoretical relationship between urban rail transit, factor allocation effect, and urban carbon dioxide emissions from the following aspects, and the main mechanisms are shown in Figure 1.
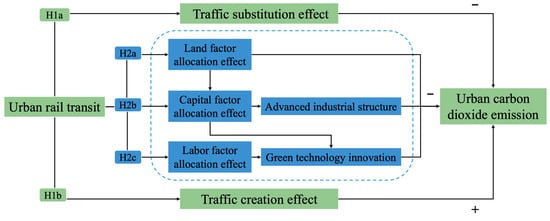
Figure 1.
Impacts of urban rail transit on urban carbon dioxide emission. Note: The minus sign “−” represents a “decrease” and the plus sign “+” represents an “increase”.
2.1. Creation or Substitution Effects of Urban Rail Transit
Urban rail transit may have two opposite environmental impacts: traffic creation effects [26] or substitution effects [27]. The traffic creation effect refers to the improvement of access conditions after the construction of URT attracts more people and traffic into the city, exacerbating congestion and increasing atmospheric emissions [28]. The traffic substitution effect, also known as the Moline effect [29] or the traffic diversion effect [12], refers to the opening of URT to replace other modes of transportation such as buses and cars, decongesting and reducing atmospheric emissions [30]. Some studies suggest that the traffic creation effect is greater than the traffic substitution effect, which in URT has a limited diversionary effect and may create new commuting demand and accelerate urban agglomeration. Specifically, the functional areas of the city are gradually separated in the process of urbanization and expansion driven by URT [31]. The construction of URT leads to the relocation of some of those living in the city center to the more cost-effective suburbs [27]. This would lead to an increased movement of people between industrial areas, residential areas, commercial areas, and major external transportation hubs, generating more new travel demand. However, the limited carrying capacity and coverage of URT cannot accommodate all travel behavior but rather will increase vehicle use and exacerbate regional congestion [32], so the effect of URT on the reduction in emissions is not obvious. In contrast to the traffic creation effect, the traffic substitution theory has gained more support. Given the large size and rapid expansion of China’s cities, the substitution effect of URT has obvious advantages from both the supply and demand sides. In Shenzhen, China, for example, the share of cars, buses, and urban rail transit in Shenzhen’s public transportation travel system was 46%, 40%, and 1%, respectively, in 2010. However, by 2023, the share of the three will reach 50%, 15%, and 27%, respectively. This suggests that from the demand side, URT, which is highly efficient, punctual, and reliable, can effectively substitute road travel modes such as buses. From the supply side, the carbon emission cost of URT is much smaller than that of motor vehicles. The government encourages residents to travel by URT, and the company operating URT will actively adopt means to attract passenger flow and take the initiative to bear the pressure of road traffic. The substitution effect effectively alleviates traffic congestion [33] and reduces environmental pressure [34], thus producing a carbon reduction effect. Based on the above theoretical analysis, URT improves traffic conditions, replaces other modes of access, eases urban traffic congestion, and promotes green travel for citizens. However, it may also create new traffic demand and increase overcrowding in URT stations and carriages, which reduces travel comfort, and it has limited sharing of surface traffic. Therefore, whether URT can reduce carbon emissions depends on which effect is dominant [35]. For this reason, this paper proposes the following two different research hypotheses:
H1a:
China’s urban rail transit creates the traffic substitution effect and can reduce the carbon dioxide emissions per capita.
H1b:
China’s urban rail transit creates the traffic creation effect and cannot reduce the carbon dioxide emissions per capita.
2.2. Urban Rail Transit, Resource Allocation Efficiency, and Carbon Dioxide Emissions
Urban rail transit has an important impact on the economic development of cities, which can increase the efficiency of the market, improve the accessibility of the city, and help to build a unified internal market. The formation of efficient markets helps to reduce the misallocation of resources and improves the efficiency of factor allocation [36], which improves energy efficiency and reduces urban carbon emissions. Therefore, the theory will be further analyzed as follows:
Firstly, urban rail transit stimulates land demand. URT helps cities to carry out the renovation of older areas and the development of newer areas oriented by public transportation [37], which enhances the efficiency of land factor allocation [38]. On one hand, local governments often opt to organically integrate the construction and development of URT with urban land use [39] and spatial planning [40]. This strategic approach is primarily aimed at facilitating the renewal and transformation of old urban areas and the intensive utilization of urban land, fostering the development of the building economy, constructing a Central Business District (CBD) commercial and trade core area, and enhancing both the efficiency and value of land use in the core area. On the other hand, local governments are also expanding the spatial scope of urban space and promoting the development of urban peripheries and suburbs through the construction of URT. Urban planning departments strategically select differentiated residential and industrial areas for development, taking into account the features of URT routes. This attracts more citizens to work and live along the network [41], effectively spurring the formation of new agglomeration effects. Consequently, local governments are more motivated to encourage people residing in the city center to relocate to more cost-effective suburbs via the development of URT, resulting in a decrease in population density in the central city and an increase in urban livability [10]. The efficient utilization of urban land resources and the decrease in population density in traditional city centers jointly facilitate a reduction in urban carbon emissions [42], promoting more sustainable development [43].
Secondly, urban rail transit generates capitalization effects. URT enhances the overall status, governance capacity, and allure of cities, accelerates the capitalization effect of transportation infrastructure, and improves the efficiency of allocation of capital factors. In the process of increasing the efficiency of allocation of land factors and optimizing the relative location of space, URT has the potential to give rise to a more substantial transit proximity premium for urban housing [44] and land prices [45]. This suggests that URT can be significantly capitalized into land and housing prices in cities, which will increase government revenues such as land grant income and tax income. Therefore, the capital allocation effect is reflected in the fact that URT brings land appreciationto cities. The increased financial strength of the government means that the government has a stronger ability to repay explicit and implicit debt, which improves the ability of local governments to issue and operate green funds and bonds. Carbon dioxide emissions are also more likely to be reduced through the development of green finance [46]. Strong financial strength, debt financing capability, and high urban capacity make the cities with URT into investment meccas and innovation hubs. On the one hand, in the process of using URT to make the city an investment mecca, the government has taken the initiative to improve the investment environment and increase its efforts to attract investment. The government’s policy is to promote the upgrading of the city’s industrial structure and a reduction in traditional energy consumption. Specifically, through the strategy of new and old kinetic energy conversion, it will phase out backward or sunset industries characterized by high energy consumption, low efficiency, and high carbon emissions. Simultaneously, the government will lay out and introduce several emerging strategic industries or modern service industries. These industries are expected to be equipped with advanced green technology and low carbon emissions and align with the requirements for the development of new quality productive forces. The government will also facilitate the low-carbon transformation of enterprises through subsidies or tax and fee reductions. Through these measures, enterprises will be encouraged to apply low-carbon equipment and produce and sell low-carbon products, gradually fostering low-carbon living habits among residents. On the other hand, by using URT to shape cities into innovation hubs, the government will continually update green innovation policies and increase support for green innovation. Talent is the backbone of urban innovation, and institutions are the carriers of urban innovation. The inflow of talent and institutions brings about a technology spillover effect, which will enhance the urban innovation capability. URT can enhance the attractiveness of cities to green innovation talents and institutions. Cities with URT can pay higher labor salaries and R&D inputs and subsidies for green innovation talent, platforms, and enterprises. This will further promote the aggregation of industry–university–research platforms, increase the attractiveness of green technology jobs for highly skilled labor, and attract high-quality green innovation talent to choose cities with URT as a place to work and live. In short, on the basis of the capital allocation effect brought about by URT such as land appreciation, the proactive government has taken the initiative to promote the low-carbon transformation of urban industries and the improvement of the level of green innovation, so as to realize the carbon peak and carbon neutrality goals.
Thirdly, urban rail transit activates the urban labor market. URT helps to reduce commuting costs, expand the boundaries of urban economic activities, and improve the efficiency of allocation of labor factors. URT can effectively improve the convenience [31] and efficiency [9] of intra-city commuting and effectively reduce the barriers to labor mobility brought about by the natural geographic factors of metropolitan cities. URT breaks down the segmentation of the labor market [47], which helps to expand the radius of matching between companies and workers [48]. As a result, young workers are able to choose to work in the center of the city and live in the suburbs. In addition, the innovation compensation effect suggests that innovation in green technology is the key to the realization of green development and an important mechanism for reducing carbon dioxide emissions. Developing URT can lead to the clustering of innovative enterprises [22] and the resulting labor exchange effect. Specifically, URT promotes the exchange of R&D personnel, facilitates the transfer of tacit low-carbon expertise, and accelerates the diffusion of green innovation knowledge flows and green technology spillovers [49]. This spillover effect increases the level of green innovation along the urban lines of URT.
Based on the above three theoretical analyses, URT improves the efficiency of allocating land, capital, and labor. The resulting factor allocation effect stimulates the innovation activities of cities and promotes the transformation and upgrading of urban industries. For these reasons, this paper further proposes the following research hypotheses:
H2a:
China’s urban rail transit reduces the per capita carbon emissions by improving the efficiency of land factor allocation and reducing population density in the core area.
H2b:
China’s urban rail transit reduces the per capita carbon emissions by improving the efficiency of capital factor allocation, promoting industrial structure upgrading and green innovation.
H2c:
China’s urban rail transit reduces the per capita carbon emissions by improving the efficiency of labor factor allocation and generating green technology spillover effects.
3. Research Design
3.1. Model Selection
3.1.1. Time-Varying Difference-in-Difference Model
To investigate the impact of urban rail transit on urban carbon emission, this paper takes whether or not subway services in Chinese cities as a natural experiment and establishes the Equation (1) as follows:
where i represents 289 cities in China, and t denotes the year from 2002 to 2023. Y represents the indicators of explained variables, including the bus ridership per capita (BR_pc) and per capita carbon dioxide emissions (CO2_pc), and they are entered into the model separately. URT represents whether the Chinese city provides the service of urban rail transit. If the Chinese city i operates an independent system with urban rail transit in year t, = 1. Otherwise, = 0. ControlVariables represents other control variables affecting BR_pc and CO2_pc. is the time fixed effect, denotes the city fixed effect, and represents the error term. The coefficient is the elasticity coefficient of URT, which is expected to be significantly negative.
3.1.2. Heckman Models
However, Equation (1) and the time-varying DID model have strong sample self-selectivity problems because the approval of the central government in China for the construction of the URT system is not a random event and the city needs to meet a series of economic and social indicators. To overcome the sample bias caused by the self-selection problem in the construction of a URT, the present study further chooses to combine the Heckman [50] two-stage regression model with the time-varying DID technique to alleviate the above endogeneity problem. The specific model is as follows:
First-stage regression:
Second-stage regression:
Variables denotes the set of observable factors in the selection equation that affect the construction of URT in a city. Lennox, et al. [51] pointed out that “exclusionary constraint” variables are required for the first-stage regression. Therefore, in addition to controlling for ControlVariables, this paper chooses the administrative level of a city (Level), and age of the municipal party secretary (lnAge) as the exclusionary variables and reports Variance Inflation Factors (VIFs) to determine whether the model suffers from the problem of multicollinearity. is the error term in the selection equation and obeys a standard normal distribution. is the probability coefficient that each variable in the selection equation affects the construction of URT in a city. IMR is the Inverse Mills Ration obtained from the first-stage estimation.
3.2. Variables and Data
To ensure data availability wherever possible, the present study employs an unbalanced panel dataset of 254 prefecture-level cities, 31 provincial capitals, and 4 municipalities in China over the period 2002–2023. Consistent with previous studies, the following variables are included in this paper.
3.2.1. Explained Variables: Bus Ridership per Capita and Carbon Dioxide Emissions per Capita
In Section 4: Results and Discussion, the present study takes into account the impact of the size of the urban population. On the one hand, referring to the study of Li, et al. [52], this paper uses the logarithm of bus passenger trips per unit of resident population (times/year/person) as the first explained variable. This explanatory variable is designed to test whether URT brings substitution or creation effects in terms of residential travel. The data primarily originated from the China City Statistical Yearbook. Figure 2 shows the change in the bus ridership per capita (BR_pc) in Chinese cities. Between 2010 and 2020, BR_pc decreased in Chinese cities that opened URT. This indicates that since 2010, URT has had a substitution effect on other road-based public transport in China.
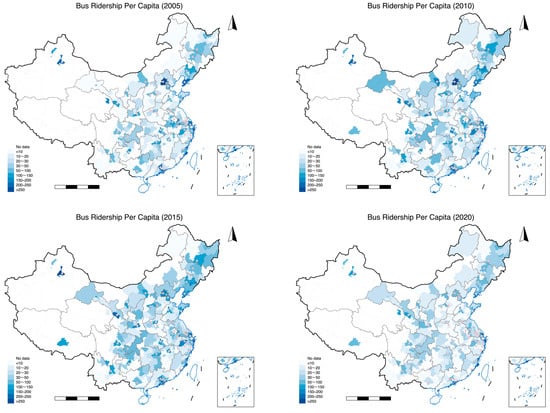
Figure 2.
Changes in the bus ridership per capita in China’s cities. Note: The pink dots indicate the city opened urban rail transit.
On the other hand, referring to the study of Dai, Wang and Tong [4], the present study uses the logarithm of the scale of apparent carbon emissions per unit of the resident population (tons/person) as the second explained variable, which aims to test whether URT brings substitution or creation effects in terms of urban greenhouse gases. The index of urban carbon dioxide emissions per capita can improve the comparability of carbon emissions reduction effects among cities of different sizes, and it reflects urban residents’ travel choices and low-carbon lifestyles. Moreover, the urban carbon dioxide emissions data are from the Emissions Database for Global Atmospheric Research [53], which provides 1 km × 1 km total CO2 emissions data. Based on the 1 km × 1 km data in China, it is possible to aggregate the CO2 emission panel data at the city level in China. The resident population data are from the China City Statistical Yearbook.
Figure 3 shows the change in carbon dioxide emissions per capita (CO2_pc) in Chinese cities with URT and those without URT by the end of 2023. CO2_pc in cities with URT peaked in 2013 and then began to fluctuate and decline. In contrast, CO2_pc in cities that have not yet opened URT has been on an upward trend. This tentatively suggests that urban rail transit may reduce the per capita carbon emissions in cities, creating a greenhouse gas transfer effect.
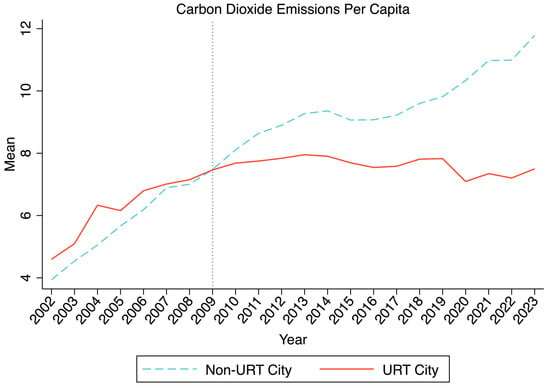
Figure 3.
Changes in the carbon dioxide emissions per capita in China’s cities. Source: The mean of urban carbon dioxide emissions per capita in two groups is calculated by the authors using the ratio of urban carbon dioxide emissions to the size of the resident population.
3.2.2. Explanatory Variable: Urban Rail Transit
Cities with urban rail transit in China are mainly municipalities and provincial administrative centers or economic centers, and most of them have far exceeded the construction standards. However, although some cities have not met the construction standards of rail transit, by virtue of their unique geographic location close to large cities, either in the name of the intercity railroad, urban rail transit in reality, or choosing a lower standard of light rail, they ultimately succeeded in becoming cities with urban rail transit. Therefore, the use of a broader concept of urban rail transit to analyze its economic effects also mitigates to some extent the endogeneity problem caused by sample selection. There are two methods defined for urban rail transit in this paper: the first is a dummy variable [13], URT, representing whether a city operates urban rail transit. The second method is defining five continuous variables that includes the count of lines (Line), the mileage (Mileage), the count of station (Station), the count of interchange (Interchange), and years of operation (Duration). Considering that only some cities in China have urban rail transit, this paper natural-logarithmizes these variables because the continuous variable may have severe right skewness. The raw data on urban rail transit come from the China Urban Construction Statistical Yearbook and the website https://www.urbanrail.net (accessed on 10 March 2025).
Figure 4 shows in detail when urban rail transit first opened in 42 cities. Between 2002 and 2009, 10 mainland Chinese cities opened metros, while 32 mainland Chinese cities opened metros between 2010 and 2023. This indicates an explosive growth in the number of cities opening urban rail transit after 2010.
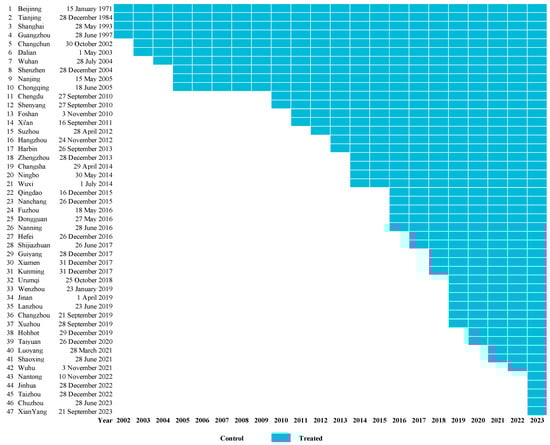
Figure 4.
The opening year of urban rail transit. Note: The order is based on the opening date of urban rail transit. If a city opened the urban rail transit from January to September, it is considered to have opened the urban rail transit in that year. Otherwise, if a city opened the urban rail transit from October to December, it is considered to have opened the urban rail transit in the following year.
3.2.3. Control Variables
In order to reduce the estimation bias of omitted variables, the present study also selects a number of variables as control factors, including the level of economic development (lnGDP_pc), resident population density (lnDesity), road network density (lnRoadDesity), urbanization level (Urbanization), government intervention intensity (GI), technological progress (R&D), level of foreign capital introduction (FDI), and industrialization level (IS). The socioeconomic data are from the China City Statistical Yearbook and the China Urban Construction Statistical Yearbook and local statistical yearbooks. Refer to Table 1 for specific indicator explanations.

Table 1.
Variable definition table.
The definitions of the variables involved in this paper are presented in Table 1, while Table 2 displays the descriptive statistical findings for the major variables. The mean of lnBR_pc is 3.034, and the standard deviation is 1.108. The mean of lnCO2_pc is 1.914, and the standard deviation is 0.739. These values indicate that there is a certain disparity between the level of bus ridership per capita and the level of carbon emissions per capita across cities, and that the difference in the former is greater than the difference in the latter. The mean of URT is 0.073, which shows that only 7.3% of the city-year sample was affected by urban rail transit. Descriptive statistics for the remaining variables are generally consistent with previous research findings.
Table 2.
Summary statistics for the variables.
4. Results and Discussion
4.1. Baseline Results
The results of the benchmark regressions are reported in Table 3. Columns (1) and (2) are the estimates from Equation (1) in Section 3. Sample selection issues have not been mitigated at this point. The estimated coefficient of URT is significantly negative at the 1% level, suggesting that the urban rail transit has significantly decreased the bus ridership per capita (lnBR_pc) by approximately 17.5% and reduced the carbon dioxide emissions per capita (lnCO2_per) by approximately 12.5% on average per year. Column (3) reports the first-stage regressions of the Heckman [49] test, that is, Equation (2). This suggests that cities with high levels of economic development, high population density, and advanced technology are more likely to be authorized to construct a system of urban rail transit. The exclusionary constraint variables Level and lnAge are significantly positive. This indicates that cities with a high administrative level and a long tenure of the municipal secretary are more likely to construct a system of urban rail transit. Columns (4) and (5) report the results of the second stage of the Heckman [49] test, that is, the regression results of Equation (3). The results show that URT reduces lnBR_pc by approximately 51.6% and lnCO2_pc by approximately 23.9%, which means the traffic substitution effect brought by URT increases significantly after controlling the self-selection bias. The effects of URT on lnBR_pc and lnCO2_pc are about 2.95-times (51.6%/17.5%) and 1.91-times (23.9%/12.5%) higher than those before mitigating the self-selection problem. In addition, the VIFs values of the URT and IMR indices in Equation (3) are 8.15 and 3.91, respectively, which are less than 10, and there is no multicollinearity problem. This indicates that the variables selected for the first stage of the self-selected model are appropriate. The IMR is significant, indicating that the interpretation of the regression results should be based on the regression considering the self-selection of the samples. The above results confirm H1a that the opening of URT will promote the optimization and adjustment of the public transportation system and generate the traffic substitution effect, thus reducing carbon emissions per capita.
Table 3.
Baseline results.
4.2. Robustness Checks
4.2.1. Parallel Trend Test
Satisfying the parallel trend assumption is an important prerequisite for the validity of the time-varying DID method. This assumption means that the explained variables in the treatment and control groups have the same time trend and were not significantly different in trend until an exogenous shock occurred. Therefore, furthermore, this paper uses the event study method [54] to conduct a parallel trend test as shown in Equation (4):
where is a series of dummy variables that is equal 1 if city i opens URT in year t − τ, and 0 otherwise. We choose to set the relative times M and N before and after the policy in terms of the time when city i opens URT, and generalize over the 11 years prior to implementation. Taking the 11 years before the opening of URT as the benchmark, this paper tests the parallel trend of the 10 years before (M) and 20 years after (N) the openness of URT. In accordance with the theory of parallel trend testing, the present study expected the dynamic effect coefficients to be around 0 before the opening of URT. Control variables were similar to Equation (3). Figure 5 depicts the parallel trend test plot obtained using Equation (4). Before the opening of URT, the confidence intervals of the effect of on the BR_pc and CO2_pc both contain 0 and are relatively stable. The results indicate that the treatment and control groups were not significantly different before the URT exogenous shock occurred, so the parallel trend test was passed.
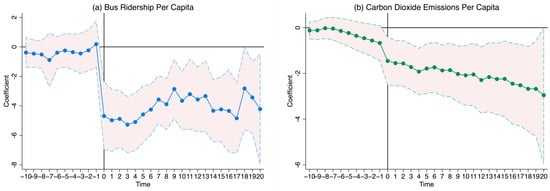
Figure 5.
Parallel trend test.
4.2.2. Placebo Test
This paper to verifies that the conclusion of the benchmark regression is not due to other unobservable factors or other events associated with URT. The basic idea of the placebo test comes from the permutation analysis proposed by Fisher, which utilizes the random arrangement of sample data to obtain the empirical distribution of statistics. If the true policy effects are significantly different from the randomized distribution of effects, then the conclusions of this paper are not due to random factors [5]. Since there are only 47 cities in the treatment group that opened a URT during the period 2002–2023, this paper randomly generated 47 of the sample cities as the fake treatment group and the rest of the cities as the fake control group in the database. Substituting them into Equation (3) for the regression, which is repeated 500 times to increase the confidence level. Figure 6 plots the p-values and kernel density distributions of these 500 coefficient estimates. It can be seen that the estimated coefficients of URT on lnBR_pc and lnCO2_pc fall around the value of 0 and follow a normal distribution, while the estimated coefficients of the benchmark regression are significantly different from 0 (orange line), so the placebo test was also passed.
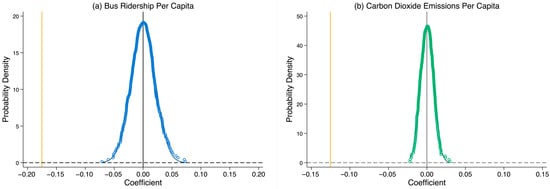
Figure 6.
Placebo test.
4.2.3. Goodman-Bacon Decomposition
Goodman-Bacon [55] suggest that time-varying DID regression estimates may be biased; researchers should use TWFE (two-way fixed effects) with caution. To illustrate the sources of variation in Equation (3), the present study adopts the Goodman-Bacon decomposition theorem. Table 4 shows the results. Summing the weights on timing terms shows how much of TWFE estimate coefficient comes from timing variation (90.62 percent). Although the estimated coefficients for the control group of always-group are positive, their weights are only 1.54%. Thus, the bias due to heterogeneous treatment effects is small in the setting of this research, demonstrating the reliability of the empirical results in Section 4.1.
Table 4.
Goodman-Bacon decomposition.
4.2.4. Heterogeneity Robust Estimators
In this paper, we also re-estimate using the stacked regression approach proposed by Cengiz, et al. [56] and the “weighted cluster-time ATT” method proposed by Callaway and Sant’Anna [57]. The stacked DID estimates are reported in Table 5, Columns (1) and (2). The Callaway and Sant’Anna estimates are reported in Columns (3) and (4) of Table 5. As can be seen, the results of both robustness estimation methods are significantly negative, indicating that the urban rail transit still significantly reduces the city’s carbon emissions when the more robust estimator is used.
Table 5.
Heterogeneity robust estimators and stacked regression approach.
4.2.5. Alternative Robustness Tests
(1) Replacing the explained variable.
To further validate the conclusions of this paper’s benchmark regression, this paper replaces the bus ridership per capita (BR_pc) with the volume of passengers transported by buses and trolleybuses (VPTB) and the ratio of the bus ridership to the total ridership for all modes of transportation (BusRate). Columns (1) and (2) of Table 6 show the regression results, respectively. This study also replaces the carbon dioxide emissions per capita (CO2_pc) with total urban carbon emissions (CO2) and carbon emission intensity (CEI) [58]. Columns (3) and (4) of Table 6 show the regression results, respectively. The above results all show that after accounting for sample selection issues, urban rail transit still generates a significant traffic substitution effect. Therefore, the baseline regressions in this paper are robust.
Table 6.
Replacing the explained variable and PSM-DID.
(2) PSM-DID.
The PSM-DID model combines the propensity score matching method and the DID model, effectively eliminating selection bias between the treatment and control groups and endogeneity issues. The present study uses the dummy variable, URT, to perform logit regression on the control variables and obtain the propensity to match score value by nearest neighbor matching. The cities with the closest propensity score values are the paired cities in the treatment group. This approach minimizes the systematic differences in scale that exist between cities and thus reduces bias in the DID estimation. Columns (5) and (6) of Table 6 report the regression results from the PSM-DID method, and the benchmark regression results are given in terms of credible causal effect estimates.
(3) Excluding the Interference from others policies.
According to Figure 4, a total of 10 cities opened URTs between 2002 and 2009, while 37 cities opened URTs between 2010 and 2023, which indicates an explosive growth in the number of cities opening URTs after 2010 in China. In addition, after 2010, China’s central government began to successively implement the low-carbon city pilot policy [52], the low-carbon transportation system pilot policy [5], and the ETS China’s carbon emission trading system [59] which are also aimed at reducing urban carbon emissions and encouraging residents to travel in a low-carbon manner. Therefore, to control for the effects of the three low-carbon policies mentioned above, the present study excludes the low-carbon pilot (LCCP) city samples and then re-empirical regression whose results are shown in Columns (1) and (2) of Table 7. Excluding the pilot city samples of the low-carbon transportation system construction policy (LCTS), the regression results are shown in Columns (3) and (4). This excludes the pilot city samples of the carbon emissions right trading system (CETS), and the regression results are shown in Columns (5) and (6). Thus, after controlling for other carbon reduction policies in the same period, the benchmark regression conclusions in Section 4.1 remain robust.
Table 7.
Excluding the interference from other policies.
4.3. Impact of the Development Level of Urban Rail Transit
The specific development level of URT affects the effectiveness of the traffic substitution. The count of lines and kilometers determines the coverage of URT, the number of opened stations and interchanges affects the reachability and accessibility of URT [60], and the number of years URT has been in operation affects the level of operation of the URT company and passenger ridership. Therefore, this paper examines the transportation substitution effect of URT’s development level from five dimensions. The specific model is as follows:
where represents one of the five indicators of the development level of urban rail transit, including the count of lines (lnLine), the route distance of the URT (lnMileage), the count of stations (lnStation) and interchanges (lnInterchange), and years since the opening of the URT (lnDuration). The other variables are the same as those in Equation (3).
Table 8 depicts the multivariate linear regression results obtained using Equation (5). Columns (1)–(5) examine the substitution effects of URT’s development level on lnBR_pc, and the explanatory variables are lnLine, lnMileage, lnStation, lnInterchange, and lnDuration, respectively. Columns (6)–(10) examine the effects of URT’s development level on lnCO2_pc, and the explanatory variable order is the same. The estimated coefficients are all significantly negative at the 1% level. According to the magnitudes of the coefficients, all five indicators have significant carbon emission reduction effects. Among them, the carbon emission reduction effect of the number of lines is the strongest, followed by the opening year, the number of interchange stations, the number of stations, and the kilometer mileage. This indicates that with the expansion of the URT coverage, the formation of the network, and improvements in the degree of access, the carbon reduction effect of the URT increases. The longer the opening time, the stronger the economic impact brought about by the URT, and the carbon reduction effect is also further deepened.
Table 8.
Impact of the development level of urban rail transit on lnBR_pc and lnCO2_pc.
5. Further Discussion
Compared with the traffic substitution effects in terms of residential travel, this paper focuses more on the traffic substitution effects in terms of urban CO2. Therefore, in the Further Discussion Section, the present study focuses on the heterogeneity of the impact of URT on the carbon dioxide emissions per capita in different types of cities, the analysis of the channels of the impact of URT on reducing the carbon dioxide emissions per capita, and whether URT has an impact on the per capita carbon emissions in neighboring cities.
5.1. Heterogeneity Analyses
5.1.1. Resource Endowments
Natural resources affect urban economic activity, according to the natural resource curse theory [61]. In China, URT in resource-based and non-resource-based cities may have different carbon reduction effects due to the different development paths and resource endowments. Therefore, this study divided the cities into two sample groups based on the divisions of the National Sustainable Development Plan for Resource Cities (2013–2020) [62]. Columns (1) and (2) of Table 9 present the results, which show that URT has a greater effect on non-resource-based cities. The possible explanation is that resource-based cities have lower innovation capacity. And the industrial structure of resource-based cities is mostly resource-consuming and polluting, with a large amount of capital, labor, and land, as well as energy, invested in high-carbon industries, so the carbon reduction effect of URT is relatively small.
Table 9.
Heterogeneity analysis.
5.1.2. Carbon Emission Scale
The environmental concerns of the government, society, and residents are affected by the level of carbon dioxide emissions. Cities with larger carbon emission scales may face greater carbon emission regulatory constraints. In this paper, the mean of the carbon emissions scale for all cities is used to divide the sample of cities into two categories: high-carbon-emission cities and low-carbon-emission cities. Subsequently, the present study further explores the differences in the carbon reduction effects of URT in cities with different carbon emission scales, and the results are shown in Columns (3) and (4) of Table 9. The results show that in cities with above-average carbon emissions, the impact of URT is more pronounced. This suggests that cities with large carbon emissions are under greater pressure to reduce carbon emissions. These cities are more inclined to implement a series of carbon reduction initiatives, and the cultivation of the concept of green and low-carbon travel and consumption awareness among residents is more important to local governments. Therefore, the carbon reduction effect of rail transportation is greater.
5.1.3. Fiscal Pressure
The construction and operation of URT require sustained financial investment by cities. Financial strength can affect the speed of construction, operational efficiency, and the choice of green technologies for URT. In China, the central government requires cities to have public budget revenues of CNY 30 billion per year to prevent financially vulnerable cities from falling into the “investment trap”. Therefore, the study explores the cost–benefit trade-offs of URT investments by using the ratio of city budget deficits to budget revenues as a measure of fiscal pressure, and by dividing cities into two groups of high and low fiscal pressure based on the mean value of their fiscal pressure.
Columns (5) and (6) of Table 9 show the results of the heterogeneity of the urban fiscal pressure of cities. According to the results, it can be seen that only in the sample of cities with low fiscal pressure, the effect of URT on lnCO2_pc is significantly negative at the 1% significance level. This suggests that the impact of URT is more significant in low-fiscal-pressure cities and that high-fiscal-pressure cities may not be able to balance the cost–benefit issue. The reason for this may be that the construction and subsequent operation of URT requires fiscal subsidies from the local government, and the construction of URT in high-fiscal-pressure cities diverts investment from low-carbon industries and green technologies, leading cities to reduce complementary green facilities. On the contrary, low-fiscal-pressure cities can build a high-density network of urban rail transit lines, which effectively creates a traffic substitution effect and thus mitigates excessive urban CO2 emissions.
5.2. Channels Analysis
Capital, labor, and land factors are important resources for urban economic development, and reducing factor misallocation can help to improve energy efficiency [36] and achieve low-carbon green development. Therefore, the present study focuses on how URT can reduce urban carbon dioxide emissions per capita by improving the efficiency of allocation of land, capital, and labor. Referring to the study of Bartelsman, et al. [63], this study use an Olley–Pakes covariance term to measure the efficiency of allocation of factors among firms within cities.
In the theoretical framework of Olley and Pakes [64], increasing the TFP of firms or reducing the degree of resource misallocation between firms can increase the output of the industry. In short, they note that the weighted average of firm-level productivity is defined as an index of productivity for an industry which can be decomposed as follows:
where is the industry productivity of the industry j in city i and in year t, is the total factor productivity of the firm c in year t, is the share of activity for the firm c in year t, and represents a series of input factors, including land, capital, and labor.
Existing studies have shown that the weighted average productivity of all firms in industry j over the same period, , can also be decomposed into two components [65]: a component that measures the arithmetic mean of the total factor productivity of all firms, , and a covariance term that measures the extent to which size (measured here by input factors) is correlated with total factor productivity. As Hyytinen, et al. [66] and Yang, et al. [67] show, the OP covariance term is a reliable measure of the efficiency of resource allocation of the industry.
where represents the average of the firm-level productivity of the industry j in city i and in year t, , and refers to the number of firms in industry j and in period t.
Further, this paper sets the efficiency of resource allocation, , quantitatively equal to the difference between the weighted average productivity and the arithmetic average productivity , and also equal to the covariance between the total factor productivity and the share of input factors. Its bigger value means that a higher factor share obtained by a firm with high productivity, indicating that the industry is efficient in allocating resources. On the contrary, a smaller value means that the industry is using resources inefficiently.
On this basis, the efficiency of resource allocation at the city-industry level can be summed up to the city level by taking the share of the input factor of each industry in the city as a weight, so as to obtain the resource allocation efficiency among manufacturing enterprises in each city:
where represents the weighted average of the resource allocation efficiency of all industries of the city i and in year t, is the share of the input factors Z for the industry j in year t, and refers to the number of industries in city i and in period t. As a result, when the input factors of enterprises are land, capital, and labor, respectively, three mechanism variables are obtained, namely, the allocation efficiency of the land factor (AllocateLand), the allocation efficiency of the capital factor (AllocateCapital), and the allocation efficiency of the labor factor (AllocateLabor).
5.2.1. Land Factor Allocation Effect
Above all, this study explores the land factor allocation effect. Columns (1) to (4) of Table 10 show the test results of the effect of URT on the urban land use scale. The results show that URT helps to increase the area of urban road surface (lnARS) and the area of urban built district (lnABD), promote the development of urban residential construction land (lnARCL), reduce the population density of the core area (lnPD), and improve the allocation efficiency of the land factor within the city (AllocateLand). This validates the conclusion that the TOD development model plays an important role in urban planning and developing urban areas [10]. Urban rail transit and high urban capacity complement each other, and together they promote the development of newer areas and the transformation of old ones, improving the spatial structure of the city and the living environment of its citizens. Urban rail transit allows more people to live in the suburbs, reversing the trend of further congestion in city centers and reducing overpopulation, which helps to reduce per capita carbon emissions in cities. The above empirical results support the research hypothesis H2a.
Table 10.
Impact of the urban rail transit on the allocation of the land factor.
5.2.2. Capital Factor Allocation Effect
Secondly, this study also analyzed the capital factor allocation effect. Under the influence of the land factor allocation effect, URT promotes the development of land finance in cities. Therefore, this paper examined the allocation effect of URT on capital factors, as shown in Table 11. Columns (1) to (4) show that URT significantly increases the land grant price of the urban (lnALP) and government fiscal deficit (lnDeficit) and promotes the issuance of public debt by the government and urban investment groups (lnBond), which enhances the capital scale and the efficiency of capital factor allocation (AllocateCapital) of the city opening a URT. Additionally, under the influence of the capital allocation effect, URT effectively promotes the optimization of industrial structure and green technology innovation. Specifically, Columns (5) to (7) show that URT increases the ratio of the number of high-tech firms to the number of manufacturing firms (PCHTE), reduces the number of companies with high levels of carbon emissions (NCHCE) in the manufacturing industry of the city with urban rail transit, and promotes the advanced urban industrial structure (RIS). Column (8), on the other hand, shows that the government increases the proportion of science and education, spending as a percentage of the government’s expenditure ratio (SciRate), which attracts innovative talents and platforms and promotes cities to improve green innovation. The above empirical results confirm the research hypothesis H2b, which states that URT improves the efficiency of allocation of the capital factor and promotes low-carbon upgrading of the urban industrial structure.
Table 11.
Impact of the urban rail transit on the allocation of the capital factor.
5.2.3. Labor Factor Allocation Effect
Finally, this study also considers the effect of URT on the allocation of the labor factor. The results are shown in Table 12, where Columns (1) and (2) indicate that URT can significantly increase the total labor force size (lnLabor) and the amount of innovative talent (lnTalents) in the city. This shows that urban rail transit can attract innovative talent and platforms to enhance green innovation in cities. Moreover, workers in various industries are more inclined to choose urban rail transit for their daily commute, thus improving the matching efficiency of the labor market and the efficiency of the allocation of labor factors within cities (AllocateLabor). Column (4) show that URT significantly promotes firms’ outsourcing of R&D and technology services generating green innovation technology spillovers. In addition, the present study further tests the impact of URT on innovation outcomes. The green innovation indicator is the number of patent applications for green inventions per 1000 people (GP). According to Column (5), it can be seen that URT effectively increases the number of green patent applications after accelerating the diffusion of green innovation knowledge flow. Therefore, the smooth opening and effective operation of URT improves the internal transportation of the city, contributes to the construction of an effective labor market, improves the allocation efficiency of labor factors, promotes the exchange of labor technology, and generates technological innovation effects. Therefore, the research hypothesis H2c is confirmed.
Table 12.
Impact of the urban rail transit on the allocation of the labor factor.
To further validate the mechanism proposed in Section 2.2, this paper tests whether URT can reduce urban carbon emissions through the indirect effects brought by the allocation of factors. This study chooses to add the indices of AllocateLand, AllocateCapital, and AllocateLabor to the benchmark regression model, Equation (3), and Columns (1) through (3) of Table 13 show the results. The allocation efficiency of factors has a significant negative correlation with lnCO2_per; they can reduce urban carbon dioxide emissions per capita. Therefore, the allocation efficiency improvement of land, capital, and labor is an effective mechanism.
Table 13.
Estimation of the channels through which URT affects lnCO2_per.
In addition, the upgrading of the industrial structure and the innovation of green technologies are conducive to a reduction in carbon dioxide emissions. Therefore, the present study also adds the advanced industrial structure (RIS), the proportion of high-tech enterprises (PCHTE), and green technology innovation (GP) to the benchmark regression model. According to Columns (4) to (6) of Table 13, it can be seen that RIS, PCHTE, and GP can reduce lnCO2_per, which suggests that the innovation of green technologies and industrial structure upgrading generated by resource allocation efficiency is an effective indirect mechanism for URT to reduce the carbon dioxide emissions per capita. Green technological progress and economic restructuring under the influence of URT can promote the development of a low-carbon transformation of China’s economy. The above empirical results again confirm the existence of the research hypothesis H2a, H2b, and H2c.
5.3. Spatial Effects Analyses
5.3.1. Spatial Econometric Model
To further investigate the geographical implications of urban rail transit on carbon dioxide emissions per capita, the present paper uses a spatial econometric model. The specific model is as follows:
5.3.2. Spatial Autocorrelation Test
The present paper applies the global Moran’s index to test the spatial correlation of carbon dioxide emissions per capita (lnCO2_pc) based on the inverse distance weight (IDW) matrix. The values of Moran’s index of lnCO2_pc during 2002–2023 in China are shown in Table 14. Column (1) reveals that the values are between 0 and 1, and remain in a fluctuating upward trend from 2002 to 2023. Column (5) reveals that all samples passed a 1% significance test. This finding implies that there is a significant positive spatial correlation of lnCO2_pc in China, which is stronger over time. Therefore, it is necessary to introduce the spatial econometric analysis.
Table 14.
Moran index of carbon dioxide emissions per capita.
5.3.3. Analysis of Spatial Econometric Results
Before conducting spatial econometric analysis, the choice of model needs to be tested (Table 15). The LM test and LR test results indicate that all statistics are significant at the 1% level. Therefore, employing spatial econometric methods for further empirical analysis of this study’s research question becomes essential, and the SDM model performs better than the SEM and SAR models.
Table 15.
Spatial measurement model selection tests.
To fully display the spatial measurement results and improve the robustness of the conclusions, this paper adopts the inverse distance weight (IDW) matrix and inverse distance squared weight (IDW2) matrix to verify the spatial effects of URT on lnCO2_pc as presented in Table 16. The regression coefficients of the spatial lag term () are all significantly positive, indicating that local carbon emissions are positively influenced by neighboring area emissions. The results all demonstrate that URT significantly suppresses local carbon emissions (main effect) and reduces carbon emissions in the surrounding cities (Wx effect), based on whether the IDW matrix or the IDW2 matrix is used. Furthermore, the SDM model can be decomposed into spatial effects using partial derivatives. The long-run direct effect involves the impact of URT in a city on its lnCO2_pc and the feedback effect of that city’s URT influencing lnCO2_pc in neighboring cities and, in turn, affecting its lnCO2_pc. The long-run indirect effect represents how the local URT influences lnCO2_pc in neighboring cities, reflecting the spillover effect of the local URT. The long-run total effect reflects the average influence of them. Table 16 shows that the direct, indirect, and total effects are all significantly negative, illustrating that the local URT not only significantly reduces lnCO2_pc within the region, but also significantly mitigates lnCO2_pc in neighboring cities. Meanwhile, the regression coefficients of indirect effect are more than the regression coefficients of direct effects. It suggests that, in the long run, the carbon abatement effects of URT come mainly from its spillover effects. In summary, URT can have significant spatial spillover effects, mitigating urban carbon dioxide emissions per capita in neighboring cities through atmospheric mobility. In China, central cities are trying to extend their urban rail line networks to neighboring smaller cities, such as Shanghai with Suzhou and Wuxi, Beijing with Langfang, Hangzhou with Shaoxing, Xi’an with Xianyang, Nanjing with Chuzhou, Ma’anshan, Yangzhou, and Zhenjiang, and Zhengzhou with Xuchang, which are gradually becoming connected. In addition, URT serves as a signaling mechanism to promote green technological innovation and low-carbon industrial transformation in the cities themselves, while also generating green technology spillover and low-carbon industry spillover and facilitating the flow of low-carbon enterprises and talent between regions.
Table 16.
Spatial effects of urban rail transit on urban carbon dioxide emissions per capita.
6. Conclusions and Policy Recommendations
6.1. Conclusions
Excessive greenhouse gas emissions are causing global warming and threatening human survival and sustainable development. The construction of urban rail transit improves intra-city transportation and affects resource allocation in cities, but is this an important way to reduce carbon emissions? Using unbalanced Chinese urban panel data, the present study combines the use of time-varying DID and Heckman’s two-stage econometric method to examine the impact of URT on the carbon dioxide emissions per capita from a resource allocation perspective and reaches the following conclusions:
(1) China’s urban rail transit can bring significant traffic substitution effects. In terms of residential travel, urban rail transit can significantly reduce the bus ridership per capita by 17.5%, and the coefficients rise to 51.6%, respectively, after mitigating the sample self-selection problem. This finding remains different from the research of Gonzalez-Navarro and Turner [10], which mainly covered cities in developed countries. At the same time, urban rail transit has a similar effect in terms of urban GHGs. Before and after mitigating the sample selection problem, the per capita reduction in carbon dioxide emissions from urban rail transit is 12.5% and 23.9%, respectively. These conclusions found in the benchmark regression results also pass several robustness tests. The positive findings that urban rail transit in China can generate environmental benefits such as reduced carbon impacts are consistent with practical experience in other countries [11] such as India [16,17] and the United States [14,15]. Furthermore, the present study also finds that as the development level of URT increases, the traffic substitution effects gradually increase.
(2) The carbon reduction effect of urban rail transit in China is highly heterogeneous, and there are spatial spillover effects. In cities with high carbon emissions, non-resource-based cities, and cities with low fiscal pressure, URT can have a more pronounced effect on reducing emissions. Non-resource-based cities have a better industrial structure and a higher level of green innovation, so the impact of URT is more obvious. Cities with large carbon emissions are under greater pressure to reduce carbon emissions, and the strict performance appraisals encourage local governments to actively utilize URT as the greenest form of public transportation. Cities with financial constraints in China divert investment from the development of low-carbon industries and green technologies. In contrast, low-fiscal-pressure cities can build a high-density network of urban rail transit, which thus effectively reduces the urban carbon dioxide emissions per capita. Moreover, spatial econometric analyses reveal that urban rail transit can not only reduce local carbon emissions but also generate radiation effects through spillover. In the long run, the carbon abatement effects of urban rail transit are mainly from its spillover effects. The urban rail transit network of China’s central cities is gradually being extended to smaller cities around them, thus building a rail-integrated metropolitan region. Within the metropolitan area, the effective flow of low-carbon technologies and the communication of low-carbon enterprises will enable urban rail transit to reduce not only the city’s carbon emissions but also those of the neighboring cities.
(3) Urban rail transit reduces the urban carbon dioxide emissions per capita by improving resource allocation, promoting industrial structure upgrading, and enabling green technology advancement. On the one hand, URT can significantly improve the efficiency of allocation of land, capital, and labor factors. URT is an effective tool for cities to promote the development of new areas and reduce congestion in urban areas, improve government finance and financing, and expand the labor matching radius. Urban rail transit can significantly capitalize on land prices, improve urban capacity, and attract talent and firms. Therefore, the allocation efficiency of resources is the basic mechanism for URT to reduce carbon dioxide emissions. On the other hand, under the influence of the capital allocation effect, URT promotes the realization of the advanced industrial structure by eliminating the backward production capacity in the cities. URT also raises the level of urban green innovation by making cities more attractive to innovative talent and institutions. On the basis of the labor allocation effect, URT accelerates green technology overflow and improves the green innovation levels of cities and enterprises. Therefore, industrial structure upgrading and green technology innovation are the specific mechanisms for urban rail transit to reduce carbon emissions.
6.2. Policy Recommendations
Based on the conclusion, the present study proposes three policy recommendations to the policymakers in developing countries that are similar to China.
The findings of this paper have the following practical and policy implications.
(1) The traffic substitution theory of urban rail transit has practical value in terms of urban public transportation and carbon dioxide emission reduction. The decarbonization of the transport sector is an important support for the realization of the carbon peaking and carbon neutrality goals, and travel in urban rail transit can become the most important low-carbon travel mode. Going forward, when planning and investing in urban rail infrastructure, it is important to clearly recognize not only the role of urban rail transit in reducing congestion but also its important role in reducing carbon dioxide emissions. Unlike large cities in developed countries, large cities in developing countries generally tend to have higher population densities but lower car ownership, and residents rely to a greater extent on public transportation to get around. Consequently, it is imperative for developing countries to prioritize the comprehensive benefits of urban rail transit in alleviating urban traffic congestion, promoting economic growth, and achieving goals related to combatting pollution and reducing carbon emissions.
(2) When designing and constructing urban rail systems, cities in developing countries should consider their own resource endowments, comparative advantages, and financial strength. On the one hand, it is the responsibility of the central government to exercise stringent oversight with regard to the criteria that are employed in order to approve construction projects. Moreover, it is incumbent upon the government to take effective measures to circumvent the “green investment trap” in cities where the construction of urban rail transit infrastructure is deemed to be inadvisable. The central government can promote the construction of a rail-integrated metropolitan region centered on an important city, strengthen industrial synergy and talent communication between the central city and surrounding small cities, and actively exert the spatial spillover effect of urban rail transit to reduce carbon emissions. On the other hand, the relevant urban planning departments should rationally plan the route, efficiently utilize the metro, light rail, urban express rail, and other rail transit, and actively exert the economic and environmental benefits, thereby compensating for the high construction and operation costs of urban rail transit. City management should make efficient use of URT and continue encouragement of low-carbon travel by the public, such as better connecting URT with shared bicycles and bus trams, and establishing carbon credit accounts for residents’ URT rides to encourage them to take the subway more frequently.
(3) Cities with urban rail transit need to take full advantage of the resource allocation effect to achieve the sustainable development goals. The redevelopment of underutilized land and the development of new areas in cities opening URTs, it is necessary to make full use of the advantages of the Transit-Oriented Development (TOD) model, activate the transportation meridian, and make efficient use of land in cities with URTs. Planning and constructing low-carbon cities, the positive role played by URT in improving market accessibility, reducing transportation costs, expanding the radius of matching between businesses and job seekers, reversing the over-concentration of urban areas, and reducing population density should be brought into play. In addition, in the context of the accelerated siphoning off of small cities by large cities, large cities in developing countries must seize the opportunity to capitalize on the role of transportation infrastructure in the process of upgrading the level of urban innovation and industrial structure. Generally speaking, large cities in developing countries can steadily promote the efficient construction and operation of URT systems under circumstances where the debt risks are manageable. Large cities must continue to utilize the allocation effects of capital, labor, and land factors to achieve green technological innovation and industrial structure upgrading, thereby reducing urban carbon emissions. This effective practical action helps cities in developing countries to become an important part of the dedication to mitigating issues such as global warming.
6.3. Research Shortcomings and Prospects
The present study explores whether urban rail transit in China brings substitution or creation effects in terms of public transportation and carbon emission reduction and analyzes the heterogeneity of the impacts of URT on the carbon dioxide emissions per capita in Chinese cities, and its spatial spillover and impact mechanism, providing comprehensive research results.
However, the present study also has certain limitations. For example, the spatial spillover mechanism of urban rail transit on carbon emissions in neighboring cities has not been deeply studied due to the length of the article. In addition, due to the limitations of data availability, this study fails to include Chinese cities that opened urban rail transit after 2023, and it also fails to conduct an in-depth comparative analysis using cross-national data to explore the differences among various countries.
Author Contributions
Conceptualization, S.X. and Y.C.; methodology, S.X. and Y.C.; software, Y.C.; validation, S.X.; formal analysis, Y.C.; investigation, M.L.; data curation, Y.C.; writing—original draft, Y.C.; writing—review & editing, S.X. and M.L.; visualization, Y.C.; supervision, S.X.; project administration, S.X.; funding acquisition, S.X. All authors have read and agreed to the published version of the manuscript.
Funding
This research is sponsored by the National Social Science Fund of China (22BJL052) and the Fundamental Research Funds for the Central Universities (B230207014).
Institutional Review Board Statement
Not applicable.
Informed Consent Statement
Not applicable.
Data Availability Statement
The data can be available upon request.
Conflicts of Interest
The authors have no relevant financial or non-financial interests to disclose.
References
- Lee, W.-S.; Tran, T.M.; Yu, L.B. Green infrastructure and air pollution: Evidence from highways connecting two megacities in China. J. Environ. Econ. Manag. 2023, 122, 102884. [Google Scholar] [CrossRef]
- Sun, C.; Zhang, W.; Fang, X.; Gao, X.; Xu, M. Urban public transport and air quality: Empirical study of China cities. Energy Policy 2019, 135, 110998. [Google Scholar] [CrossRef]
- Zhang, Y.; Mi, Z. Environmental benefits of bike sharing: A big data-based analysis. Appl. Energy 2018, 220, 296–301. [Google Scholar] [CrossRef]
- Dai, Y.; Wang, X.; Tong, X. From the Sharing Economy to the Low Carbon Economy: Evidence from the Entry of Bicycle Sharing Platforms. J. Quant. Technol. Econ. 2024, 41, 111–130. (In Chinese) [Google Scholar] [CrossRef]
- Si, L.; Cao, H.; Wang, J. The impact of a low-carbon transport system policy on total factor carbon emission performance: Evidence from 283 cities in China. Socio-Econ. Plan. Sci. 2024, 96, 102091. [Google Scholar] [CrossRef]
- Zhao, R.; Jiang, Y.; Wang, X.; Wei, X. Does green transportation affect carbon emission efficiency? Evidence from a quasi-experimental study in China. J. Environ. Manag. 2024, 370, 122815. [Google Scholar] [CrossRef]
- Sun, T.-t.; Zhao, B. Steering towards sustainability: How does low-carbon transportation policy impact urban carbon emissions in china? Environ. Dev. Sustain. 2024. [Google Scholar] [CrossRef]
- Classification of Urban Rail Transit <Standard No. GB/T 44413-2024>. Available online: https://openstd.samr.gov.cn/bzgk/gb/newGbInfo?hcno=5ACDACDEDD662B962D8A61E3530814F7 (accessed on 1 December 2024).
- Gu, Y.; Jiang, C.; Zhang, J.; Zou, B. Subways and Road Congestion. Am. Econ. J. Appl. Econ. 2021, 13, 83–115. [Google Scholar] [CrossRef]
- Gonzalez-Navarro, M.; Turner, M.A. Subways and urban growth: Evidence from earth. J. Urban Econ. 2018, 108, 85–106. [Google Scholar] [CrossRef]
- Gendron, C.N.; Gonzalez, N.M.; Polloni, S.; Turner, M.A. Subways and Urban Air Pollution. Am. Econ. J. Appl. Econ. 2022, 14, 164–196. [Google Scholar] [CrossRef]
- Chen, Y.; Whalley, A. Green Infrastructure: The Effects of Urban Rail Transit on Air Quality. Am. Econ. J. Econ. Policy 2012, 4, 58–97. [Google Scholar] [CrossRef]
- Xiao, D.; Li, B.X.; Cheng, S.X. The effect of subway development on air pollution: Evidence from China. J. Clean Prod. 2020, 275, 10. [Google Scholar] [CrossRef]
- Spears, S.; Boarnet, M.G.; Houston, D. Driving reduction after the introduction of light rail transit: Evidence from an experimental-control group evaluation of the Los Angeles Expo Line. Urban Stud. 2017, 54, 2780–2799. [Google Scholar] [CrossRef]
- Boarnet, M.G.; Wang, X.Z.; Houston, D. Can new light rail reduce personal vehicle carbon emissions? A before-after, Experimental-Control Evaluation in Los Angeles. J. Reg. Sci. 2017, 57, 523–539. [Google Scholar] [CrossRef]
- Shinde, A.M.; Dikshit, A.K.; Soni, A. Environmental life cycle assessment of underground metro rail: A case study in Mumbai Metropolitan Region, India. Environ. Impact Assess. Rev. 2024, 106, 107501. [Google Scholar] [CrossRef]
- Goel, D.; Gupta, S. The Effect of Metro Expansions on Air Pollution in Delhi. World Bank Econ. Rev. 2015, 31, 271–294. [Google Scholar] [CrossRef]
- Wang, Z.; Chen, F.; Fujiyama, T. Carbon emission from urban passenger transportation in Beijing. Transp. Res. D Transp. Environ. 2015, 41, 217–227. [Google Scholar] [CrossRef]
- Zhang, S.Y.; Zhao, J.M. Low-carbon futures for Shenzhen’s urban passenger transport: A human-based approach. Transp. Res. D Transp. Environ. 2018, 62, 236–255. [Google Scholar] [CrossRef]
- Duranton, G.; Turner, M.A. Urban Growth and Transportation. Rev. Econ. Stud. 2012, 79, 1407–1440. [Google Scholar] [CrossRef]
- Fan, Z.-Y.; Hang, Z.; Chen, J. The Spillover Effects and Siphon Effects of Public Transportation on Housing Market: A Case Study of Subway. China Ind. Econ. 2018, 35, 99–117. (In Chinese) [Google Scholar] [CrossRef]
- Liu, X.; Wang, Q.; Wu, J. Urban High-Speed Rail Transit Development and Corporate Innovation. J. World Econ. 2022, 45, 126–152. (In Chinese) [Google Scholar] [CrossRef]
- Wang, Y.; Yuan, W. Metro Opening, Knowledge Spillovers and Urban Innovation: Evidence from 289 Prefecture-level Cities in China. Econ. Sci. 2022, 2, 82–95. (In Chinese) [Google Scholar] [CrossRef]
- Xiao, T. The Impact of Metro Construction on Total Factor Productivity in China’s Cities: Role Mechanism and Quantitative Assessment. World Econ. Pap. 2021, 19, 100–117. Available online: http://sjjjwh.magtech.com.cn/CN/Y2021/V01/I01/100 (accessed on 1 January 2024). (In Chinese).
- Fu, M.; Cong, Z. Subway Opening and City’s Green Total Factor Productivity. Rev. Ind. Econ. 2023, 11, 167–182. (In Chinese) [Google Scholar] [CrossRef]
- Ou, Y.; Zheng, J.; Nam, K.-M. Impacts of Urban Rail Transit on On-Road Carbon Emissions: A Structural Equation Modeling Approach. Atmosphere 2022, 13, 1783. [Google Scholar] [CrossRef]
- Liang, R.; Xi, P. Heterogeneous Effects of Rail Transit on Air Pollution—An Empirical Study with RDID. China Ind. Econ. 2016, 33, 83–98. (In Chinese) [Google Scholar] [CrossRef]
- Vickrey, W. Congestion Theory and Transport Investment. Am. Econ. Rev. 1969, 59, 251–260. Available online: http://worldcat.org/isbn/1852781866 (accessed on 1 June 2024).
- Mohring, H. Optimization and Scale Economies in Urban Bus Transportation. Am. Econ. Rev. 1972, 62, 591–604. Available online: http://worldcat.org/issn/00028282 (accessed on 20 June 2024).
- Yu, M.C.; Yu, R.; Tang, Y.X.; Liu, Z. Empirical study on the impact of China’s metro services on urban transportation energy consumption. Res. Transp. Econ. 2020, 80, 9. [Google Scholar] [CrossRef]
- Heblich, S.; Redding, S.J.; Sturm, D.M. The Making of The Modern Metropolis: Evidence from London. Q. J. Econ. 2020, 135, 2059–2133. [Google Scholar] [CrossRef]
- Beaudoin, J.; Farzin, Y.H.; Lawell, C. Public transit investment and sustainable transportation: A review of studies of transit’s impact on traffic congestion and air quality. Res. Transp. Econ. 2015, 52, 15–22. [Google Scholar] [CrossRef]
- Yuan, M.; Song, Y.; Hong, S.; Huang, Y. Evaluating the effects of compact growth on air quality in already-high-density cities with an integrated land use-transport-emission model: A case study of Xiamen, China. Habitat. Int. 2017, 69, 37–47. [Google Scholar] [CrossRef]
- Yang, J.; Chen, S.; Qin, P.; Lu, F.W.; Liu, A.A. The effect of subway expansions on vehicle congestion: Evidence from Beijing. J. Environ. Econ. Manag. 2018, 88, 114–133. [Google Scholar] [CrossRef]
- Jiao, L.; Luo, F.; Wu, F.; Zhang, Y.; Huo, X.; Wu, Y. Exploring the Interactive Coercing Relationship between Urban Rail Transit and the Ecological Environment. Land 2022, 11, 836. [Google Scholar] [CrossRef]
- Hao, Y.; Gai, Z.; Wu, H. How do resource misallocation and government corruption affect green total factor energy efficiency? Evidence from China. Energy Policy 2020, 143, 111562. [Google Scholar] [CrossRef]
- Gu, P.; He, D.; Chen, Y.; Christopher Zegras, P.; Jiang, Y. Transit-oriented development and air quality in Chinese cities: A city-level examination. Transp. Res. D Transp. Environ. 2019, 68, 10–25. [Google Scholar] [CrossRef]
- Mei, Z.Y.; Gong, J.R.; Feng, C.; Kong, L.; Zhu, Z. Assessment of carbon emissions from TOD subway first/last mile trips based on level classification. Travel Behav. Soc. 2024, 36, 14. [Google Scholar] [CrossRef]
- Ding, C.; Song, Y.; Qiao, X.; Zhang, Y.; Yu, B.; Zhang, X. Integrating land use and greenway network for metro station area transit-oriented development. Transp. Res. D Transp. Environ. 2022, 113, 103539. [Google Scholar] [CrossRef]
- Pan, H.X.; Zhang, M. Rail Transit Impacts an Land Use: Evidence from Shanghai, China. Transp. Res. Rec. 2008, 2048, 16–25. [Google Scholar] [CrossRef]
- Liu, W.; Zhang, J.; Jin, L.; Dong, J.; Alfarraj, O.; Tolba, A.; Wang, Q.; He, Y. Sustainable Low-Carbon Layout of Land around Rail Transit Stations Based on Multi-Modal Spatial Data. Sustainability 2023, 15, 9589. [Google Scholar] [CrossRef]
- Han, F.; Huang, M. Land Misallocation and Carbon Emissions: Evidence from China. Land 2022, 11, 1189. [Google Scholar] [CrossRef]
- Zhou, D.; Huang, Q.; Chong, Z. Analysis on the effect and mechanism of land misallocation on carbon emissions efficiency: Evidence from China. Land Use Policy 2022, 121, 106336. [Google Scholar] [CrossRef]
- Li, J.; Huang, H. Effects of transit-oriented development (TOD) on housing prices: A case study in Wuhan, China. Res. Transp. Econ. 2020, 80, 100813. [Google Scholar] [CrossRef]
- Zhang, X.; Liu, X.; Hang, J.; Yao, D.; Shi, G. Do Urban Rail Transit Facilities Affect Housing Prices? Evidence from China. Sustainability 2016, 8, 380. [Google Scholar] [CrossRef]
- Su, X.; Qiao, R.; Xu, S. Impact of green finance on carbon emissions and spatial spillover effects: Empirical evidence from China. J. Clean. Prod. 2024, 457, 142362. [Google Scholar] [CrossRef]
- Pang, J. The Effect of Urban Transportation Systems on Employment Outcomes and Traffic Congestion. Ph.D. Thesis, Syracuse University, New York, NY, USA, 2018. [Google Scholar]
- Du, R.; Zheng, S.Q. Agglomeration, housing affordability, and new firm formation: The role of subway network. J. Hous. Econ. 2020, 48, 1051–1377. [Google Scholar] [CrossRef]
- Wang, Y.; Yuan, W. Metro Opening, Collaboration and Enterprise Innovation. Econ. Rev. 2023, 6, 140–158. (In Chinese) [Google Scholar] [CrossRef]
- Heckman, J. Sample Selection Bias as a Specification Error. Econometrica 1979, 47, 153–161. [Google Scholar] [CrossRef]
- Lennox, C.S.; Francis, J.R.; Wang, Z.T. Selection Models in Accounting Research. Account. Rev. 2012, 87, 589–616. [Google Scholar] [CrossRef]
- Li, J.; Tang, F.; Zhang, S.; Zhang, C. The effects of low-carbon city construction on bus trips. J. Public Transp. 2023, 25, 100057. [Google Scholar] [CrossRef]
- Crippa, M.; Guizzardi, D.; Pagani, F.; Banja, M.; Muntean, M.; Schaaf, E.; Becker, W.E.; Monforti-Ferrario, F.; Quadrelli, R.; Risquez Martin, A.; et al. GHG Emissions of All World Countries; European Commission, Publications Office of the European Union: Luxembourg, 2023; Available online: http://data.europa.eu/89h/b54d8149-2864-4fb9-96b9-5fd3a020c224 (accessed on 19 June 2024).
- Jacobson, L.S.; Lalonde, R.J.; Sullivan, D.G. Earnings Losses of Displaced Workers. Am. Econ. Rev. 1993, 83, 685–709. [Google Scholar] [CrossRef]
- Goodman-Bacon, A. Difference-in-differences with variation in treatment timing. J. Econom. 2021, 225, 254–277. [Google Scholar] [CrossRef]
- Cengiz, D.; Dube, A.; Lindner, A.; Zipperer, B. The Effect of Minimum Wages on Low-Wage Jobs. Q. J. Econ. 2019, 134, 1405–1454. [Google Scholar] [CrossRef]
- Callaway, B.; Sant’Anna, P.H.C. Difference-in-Differences with multiple time periods. J. Econom. 2021, 225, 200–230. [Google Scholar] [CrossRef]
- Wang, Q.; Wang, S. Why does China’s carbon intensity decline and India’s carbon intensity rise? a decomposition analysis on the sectors. J. Clean. Prod. 2020, 265, 121569. [Google Scholar] [CrossRef]
- Chen, S.; Shi, A.N.; Wang, X. Carbon emission curbing effects and influencing mechanisms of China’s Emission Trading Scheme: The mediating roles of technique effect, composition effect and allocation effect. J. Clean. Prod. 2020, 264, 1–15. [Google Scholar] [CrossRef]
- Zhang, H.; Zhan, B.; Ouyang, M. Enhancing accessibility through rail transit in congested urban areas: A cross-regional analysis. J. Transp. Geogr. 2024, 115, 103791. [Google Scholar] [CrossRef]
- Allcott, H.; Keniston, D. Dutch Disease or Agglomeration? The Local Economic Effects of Natural Resource Booms in Modern America. Rev. Econ. Stud. 2017, 85, 695–731. [Google Scholar] [CrossRef]
- Xu, S.; Liu, M.; Hua, P.; Chen, Y. How Has Land Restriction Policy Influenced Green Total Factor Productivity? Evidence from Chinese Cities. Land 2024, 13, 2249. [Google Scholar] [CrossRef]
- Bartelsman, E.; Haltiwanger, J.; Scarpetta, S. Cross-Country Differences in Productivity: The Role of Allocation and Selection. Am. Econ. Rev. 2013, 103, 305–334. [Google Scholar] [CrossRef]
- Olley, G.S.; Pakes, A. The dynamics of productivity in the telecommunications equipment industry. Econometrica 1996, 64, 1263–1297. [Google Scholar] [CrossRef]
- Chari, A.V.; Liu, E.M.; Wang, S.-Y.; Wang, Y. Property Rights, Land Misallocation, and Agricultural Efficiency in China. Rev. Econ. Stud. 2021, 88, 1831–1862. [Google Scholar] [CrossRef]
- Hyytinen, A.; Ilmakunnas, P.; Maliranta, M. Olley–Pakes Productivity Decomposition: Computation and Inference. J. R. Stat. Soc. Ser. A Stat. Soc. 2016, 179, 749–761. [Google Scholar] [CrossRef]
- Yang, M.; Hong, Y.; Yang, F. The effects of Mandatory Energy Efficiency Policy on resource allocation efficiency: Evidence from Chinese industrial sector. Econ. Anal. Policy 2022, 73, 513–524. [Google Scholar] [CrossRef]
Disclaimer/Publisher’s Note: The statements, opinions and data contained in all publications are solely those of the individual author(s) and contributor(s) and not of MDPI and/or the editor(s). MDPI and/or the editor(s) disclaim responsibility for any injury to people or property resulting from any ideas, methods, instructions or products referred to in the content. |
© 2025 by the authors. Licensee MDPI, Basel, Switzerland. This article is an open access article distributed under the terms and conditions of the Creative Commons Attribution (CC BY) license (https://creativecommons.org/licenses/by/4.0/).