Article

Optimization of Biogas and Biomethane Yield from Anaerobic Conversion of Pepper Waste Using Response Surface Methodology

1
Laboratoire de Recherche sur le Médicament et Développement Durable (ReMeDD), Faculty of Process Engineering, University of Constantine 3, Constantine 25000, Algeria
2
Laboratory of Environmental Process Engineering (LIPE), Department of Environmental Engineering, Faculty of Process Engineering, University Salah Boubnider-Constantine 3, Constantine 25000, Algeria
3
Laboratory of Process Engineering for Sustainable Development and Health Products (GPDDPS), Department of Process Engineering, Ecole Nationale Polytechnique de Constantine, Constantine 25000, Algeria
*
Author to whom correspondence should be addressed.
Sustainability 2025, 17(6), 2688; https://doi.org/10.3390/su17062688
Submission received: 22 January 2025 / Revised: 5 March 2025 / Accepted: 7 March 2025 / Published: 18 March 2025

Abstract

:
Anaerobic digestion is a critical method for producing bioenergy from organic waste; however, its efficiency is highly influenced by several factors. This study aimed to enhance the AD process using the removed solid phase generated by the canning plant Amor Benamor (CAB) during the production of harissa. This research sought to identify the optimum pH conditions and inoculum/substrate ratio (I/S) for achieving the maximum biogas production while ensuring a high methane yield, using response surface methodology (RSM) and numerical optimization. The batch anaerobic digestion of pepper waste as a substrate and sewage sludge as an inoculum was conducted. The 11 experimental runs generated by Design Expert Software were conducted in reactors with a capacity of 150 mL and a working volume of 90 mL, under thermophilic conditions. The effects of pH in the range of 7 to 8 and an I/S ratio in the range of 0.167 to 0.5, and their interaction in terms of biogas and methane yield (mL/g VS), were evaluated using a central composite design (CCD). The findings highlighted that a pH of around 7.5 and an I/S ratio of 0.48 could give the highest predicted yield of 884.35 mL/g VS for biogas and 422.828 mL/g VS for methane. These predicted values were confirmed with an experimental validation run which exhibited a deviation of less than 5%. These results offer new opportunities for enhanced biogas production from accumulated waste, contributing to the growth of sustainable energy alternatives.

Graphical Abstract

1. Introduction

As the world’s population continues to rise, the demand for agro-food products is steadily growing, leading to an increase in waste production from these sectors [1]. According to the Food and Agriculture Organization of the United Nations, 1.3 billion tons of food is wasted globally every year. The term “food waste” can refer to raw or cooked food, defined by the United States Environmental Protecting Agency (USEPA) as any substance that is discarded, whether intentionally or due to a mandate for disposal. These residues, characterized by high organic matter contents, are generated during the processing of raw ingredients into final food products [2]. Many European regulations classify these substances as “waste” because they are rejected from production as undesired components [3]. However, these wastes can be used and transformed into new products with economic value. Referred to by the scientific community as “food by-products”, this terminology highlights their potential as raw materials for creating new products [4].
One area of this industry is the agro-industrial processing of fruits and vegetables, which produces a high quantity of waste during production processes, including skins, peels, seeds, leaves, and other inedible parts, that are disposed of due to their low nutritional value and their contents of toxic compounds or possession of insufficient sensory characteristics [5]. These residues are discharged into landfills, leading to environmental issues such as greenhouse gas emissions, which are the main cause of global warming and climate change [6]. The generation of leachates, as hazardous liquids, poses significant risks to underground water sources and causes other serious environmental problems [7]. Usually, the by-products of this industry are used as a source for animal nutrition; for example, cucumber waste is used to feed Granadina goats [8], and broccoli stems and leaves are added to hens’ nutrition during laying to improve egg quality and produce more yolk pigmentation and less cholesterol [9]. Recently, the adoption of agro-food wastes has seen significant growth, and they have been used in a broader range of sectors and applications, like cosmetics, the pharmaceuticals industry, plant nutrition applications (fertilizer and biochar), and as a source for biogas production [10].
The application of agro-industrial by-products in biogas production is considered an appropriate approach to both waste management and the utilization of a sustainable energy source [11]. Moreover, the adoption of renewable energy generated through these by-products from local resources will increase national energy security and reduce dependency on fossil fuels [12]. Anaerobic digestion is a biological process in which microorganisms decompose organic material in agro-food products to simpler substances in the absence of oxygen, to produce biogas and digestate as final products [13]. The generated biogas is a mixture of gases, composed mainly of methane, carbon dioxide, and traces of other gases [14]. The produced methane is a biofuel employed in many applications, like heating and electricity generation, while the generated digestate can be used as fertilizer [15].
Harissa, which is a traditional North African chili paste made primarily from red chili peppers, is known as an essential condiment in the region’s cuisine, particularly in Tunisia, Algeria, and Morocco [16]. A large amount of organic waste is generated during the industrial production process, including debris, seeds, and pepper pulp. These wastes can be used as substrates for biogas production, since many studies have found that the co-digestion of pepper waste with manure significantly improves methane generation [17,18,19]. Anaerobic digestion is affected by several parameters, including temperature, pH, inoculum/substrate, hydraulic retention time, etc., and its optimization could significantly enhance the quality and quantity of the produced biogas [20].
The aims of this study were to optimize the pH and inoculum/substrate ratio, essential parameters for the anaerobic digestion process, and to develop a mathematical model for predicting biogas yield and methane yield using Design Expert 13 software. A central composite design was used to determine the optimal conditions for these parameters.

2. Materials and Methods

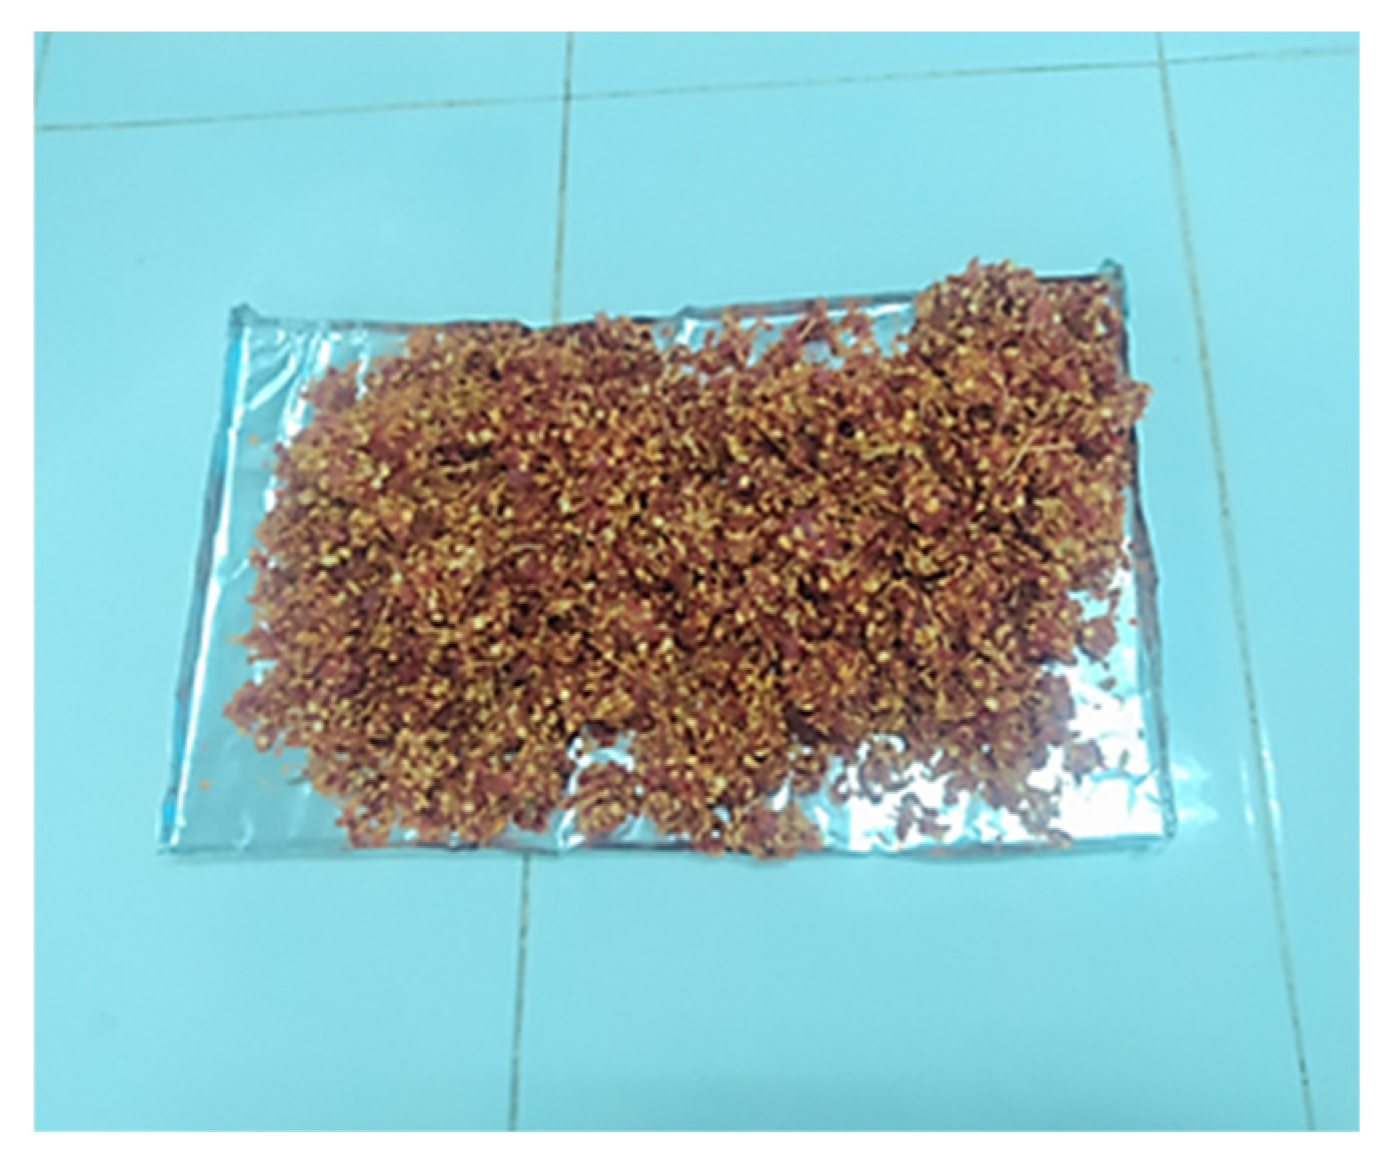
2.1. Inoculum and Substrate

The canning plant Amor Benamor (CAB), located in the east of Algeria, more specifically, in Guelma province, manufactures harissa using roasted red peppers as the main ingredient.
The substrate used in this study was the solid phase eliminated in the refining stage during the harissa production process, which contains debris, seeds, and pepper pulp.
The substrate was dried at an ambient temperature to facilitate preservation and prevent the degradation of waste (see Figure 1).
The inoculum was the sewage sludge (SS) obtained from the wastewater treatment plant (WWTP) of Oued El-Athmania, located in Mila (Algeria), which mainly treats domestic wastewaters. It was degassed at 55 °C in airtight batch reactors under anaerobic conditions. This process was essential for adapting the inoculum to anaerobic conditions and ensuring the complete degradation of residual organic matter in the sludge.
The chemical characteristics of both the substrate and inoculum are presented in Table 1.

2.2. Analytical Methods

The analyses of pH, total solids (TS), volatile solids (VS), and total chemical oxygen demand (tCOD) were carried out according to the Standard Methods for the Examination of Water and Wastewater Analysis [21]. The polyphenols were quantified using the Folin–Ciocalteu method [22].

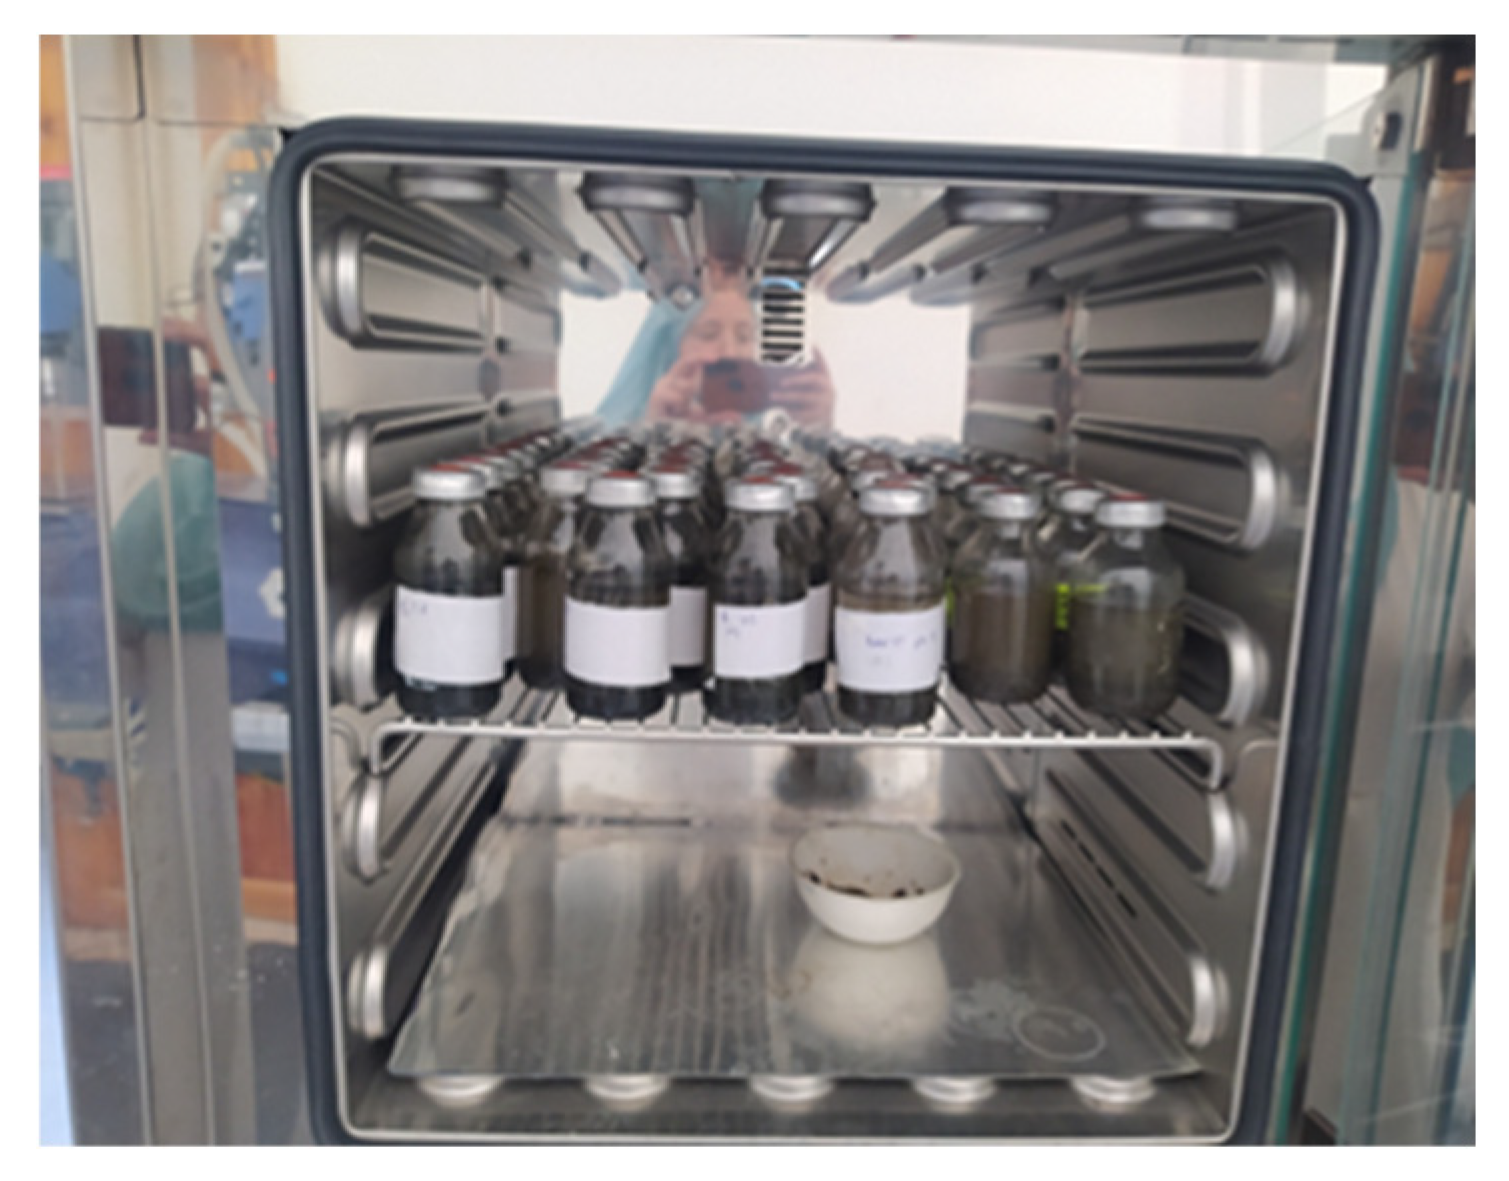
2.3. Operating Procedure

The experiment was conducted at the Laboratory of Environmental Analysis, Department of Process Engineering, National Polytechnic School of Constantine, Algeria.
The batch anaerobic digestion was performed using 150 mL glass serum bottles closed with a rubber septum, with a working volume of 90 mL. According to the experimental plan, the reactors were fed with a mixture of pepper waste (PW) and the sewage sludge (SS) at varied I/S ratios (0.16–0.5) based on the VS of the substrate and inoculum, 10 mL of nutrient solution, and tap water to make up the rest of volume. After the preparation of the mixture, the pH of reactors was adjusted in the range of 7–8 using a solution of NaOH (1 mol/L). Then, the reactors were closed hermetically and placed in the incubator under thermophilic conditions (55 °C). The biogas production setup is shown in Figure 2.
The volume of biogas was monitored every day using a hydraulic system, based on the liquid displacement method. The biogas in the headspace of the batch reactor entered into a graduated cylinder filled with acidified water (pH = 3) to prevent the solubilization of gases. The shifting level of the liquid in the cylinder indicated the volume of the produced biogas. The collected gas was subsequently injected with a syringe into a gas analyzer GEM5000 GEOTECH, Geotech Environmental Equipment, Inc., Denver, CO, USA, to determine its composition.

3. Experimental Design Through CCD-RSM

The optimization process was carried out using Design Expert 13 software, which applies response surface methodology (RSM) and central composite design (CCD). Analysis of variance (ANOVA table) was the tool used to validate the equation model and indicate the significant factors.
This study focuses on the inoculum/substrate ratio and pH as independent variables, based on their influence on two responses: biogas and methane yield.
To optimize the volume of biogas and methane (mL/g VS), a central composite design (CCD) with two level-two factors was opted (n = 2, ±α = 1) [23]. The design consisted of 11 runs: 4 factorials with 3 replicates for 1 of the factorial points, 4 axial points, and 1 center point. Table 2 shows the minimum and the maximum for each factor.
The experimental data obtained by CCD-RSM were applied to develop the best fit for a second-order polynomial regression equation in two variables, described as follows:
Y = β0 + β1X1 + β2X2 + β11X12 + β22X22 + β12X1X2
Y corresponds to the dependent response variable (biogas volume (mL/g VS) or methane volume (mL/g VS)); β0 is the constant; β1 and β2 are the linear coefficients; β11 and β22 are the quadratic coefficients; and β12 is the coefficient for the interaction between the independent variables X1 and X2.
The coded and actual (naturals) values of the experimental matrix used in this design are provided in Table 3.
This paragraph explains the statistical methods used in the results and discussion section.
The design expert software offers many statistical tests, including analysis of variance (ANOVA), which is applied to determine the significance of factors affecting the responses using a p-value < 0.05, while the lack of fit test checks the model adequacy in describing the experimental data. The coefficient of determination R2, adjusted R2, and predicted R2 serve as indicators to assess the model’s effectiveness in predicting the response. The numerical optimization identifies the best conditions for the target response.

4. Results and Discussion

Table 3 presents the experimental and predicted data of biogas and methane yield per gram of volatile solids (g VS) for the two variables obtained from the designed experiments based on CCD-RSM. Experimental data of biogas and methane yield were calculated through dividing the cumulative volumes over 124 days by the volatile solids content of the pepper waste in each batch reactor.

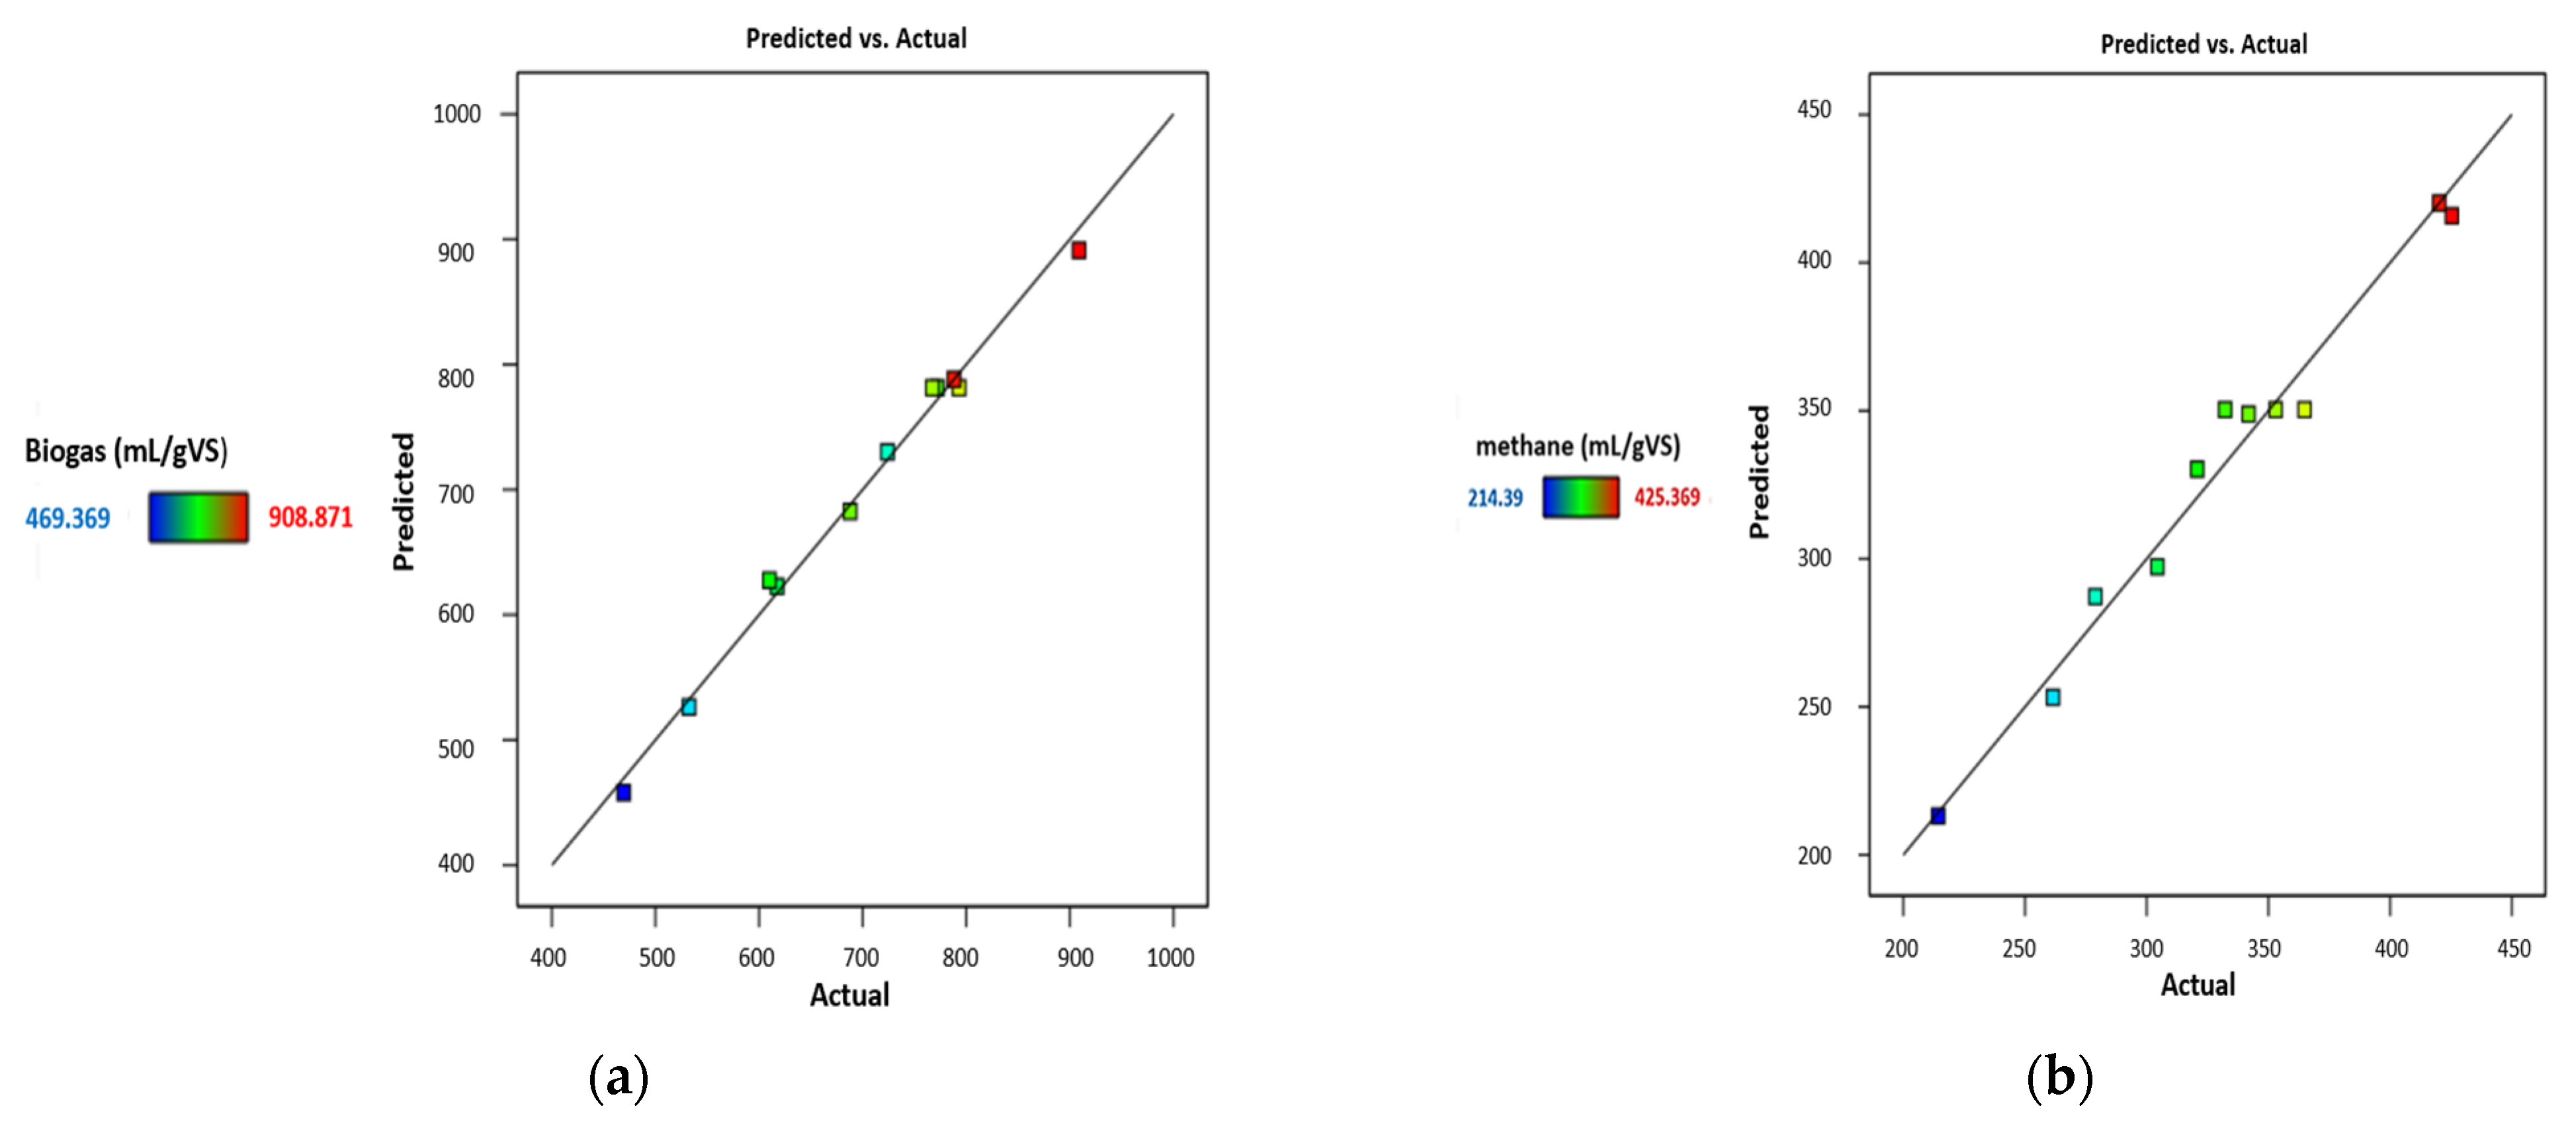
4.1. Statistical Analysis of Regression Model

The quadratic models associated with the responses expressed in terms of coded and actual variables are outlined as follows:
Y1 = 788.14 + 29.92 A + 131.82 B − 4.30 AB − 135.50 A2 − 28.71 B2
Biogas = −30,655.624 + 8207.0344pH + 1866.886 I/S − 51.596 pH × I/S − 541.999 pH2 − 1033.484 I/S2
Y2 = 420.18 + 25.81 A + 42.80 B + 5.78 AB − 97.06 A2 − 47.11 B2
Methane = −21905.475 + 5851.956pH + 866.787 I/S + 69.414 pH × I/S − 388.232 pH2 − 1695.866 I/S2
To evaluate the statistical significance of the model equations, an analysis of variance (ANOVA), using the P test was conducted, validating the significance of the regressions. Table 4 and Table 5 mention that the Prob < 5% (p < 0.05) value for the model Y1 is <0.0001 and 0.0005 for Y2, which confirms that the models are statistically significant, with a confidence of 99.99% and 99.95%, respectively. The high F-values of 126.71 for Y1 and 40.91 for Y2 confirm that there is only a 0.01% and 0.05% probability of observing such a large F-value due to noise.
Figure 3 shows the actual and the predicted values of biogas and methane. The actual values, also called natural values, represent the experimental response data for each run, while the predicted values were obtained by applying the model equations.
The graphs indicate the alignment of the data near the line of 45°, confirming the adequacy of the models in predicting the responses. The quality of the model fit was assessed using various statistical matrices, such as the coefficient of determination R2, adjusted R2, predicted R2, lack of fit, adequate precision, and other parameters, described in Table 6.
The high values of R2, adjusted R2, and predicted R2 (0.99, 0.98, and 0.94 for Y1; 0.97, 0.95, and 0.84 for Y2) confirm that the model equations have a strong explanatory and predictive capability to represent the system under this experimental domain. The adequate precision, a measure of the signal-to-noise ratio, is 36.3225 and 20.1590 for biogas yield and methane yield, respectively. Since both values are greater than 4, this indicates an adequate signal.
Also, the lack of fit F-value is not significant, because the p-values of 0.3996 and 0.7126 for biogas yield and methane yield are greater than 0.05, supporting the adequacy of the models in representing the response data.
The influence of each independent variable on the responses (dependent variable) was evaluated through the coefficients of the fitted models. The significance of each coefficient was determined using a p-value, where a p-value < 0.05 is recognized as static. According to the p-values of the model terms shown in the ANOVA tables (Table 4 and Table 5), the independent variables A (pH) and B (I/S), the quadratics variables A2 and B2, are significant terms in the two models, while the interaction of variables AB is taken as an insignificant term. The independent variable B (I/S) and the quadratic term of the variable A (pH), A2, are the variables with the greatest effect on biogas and methane yield (Y1 and Y2).

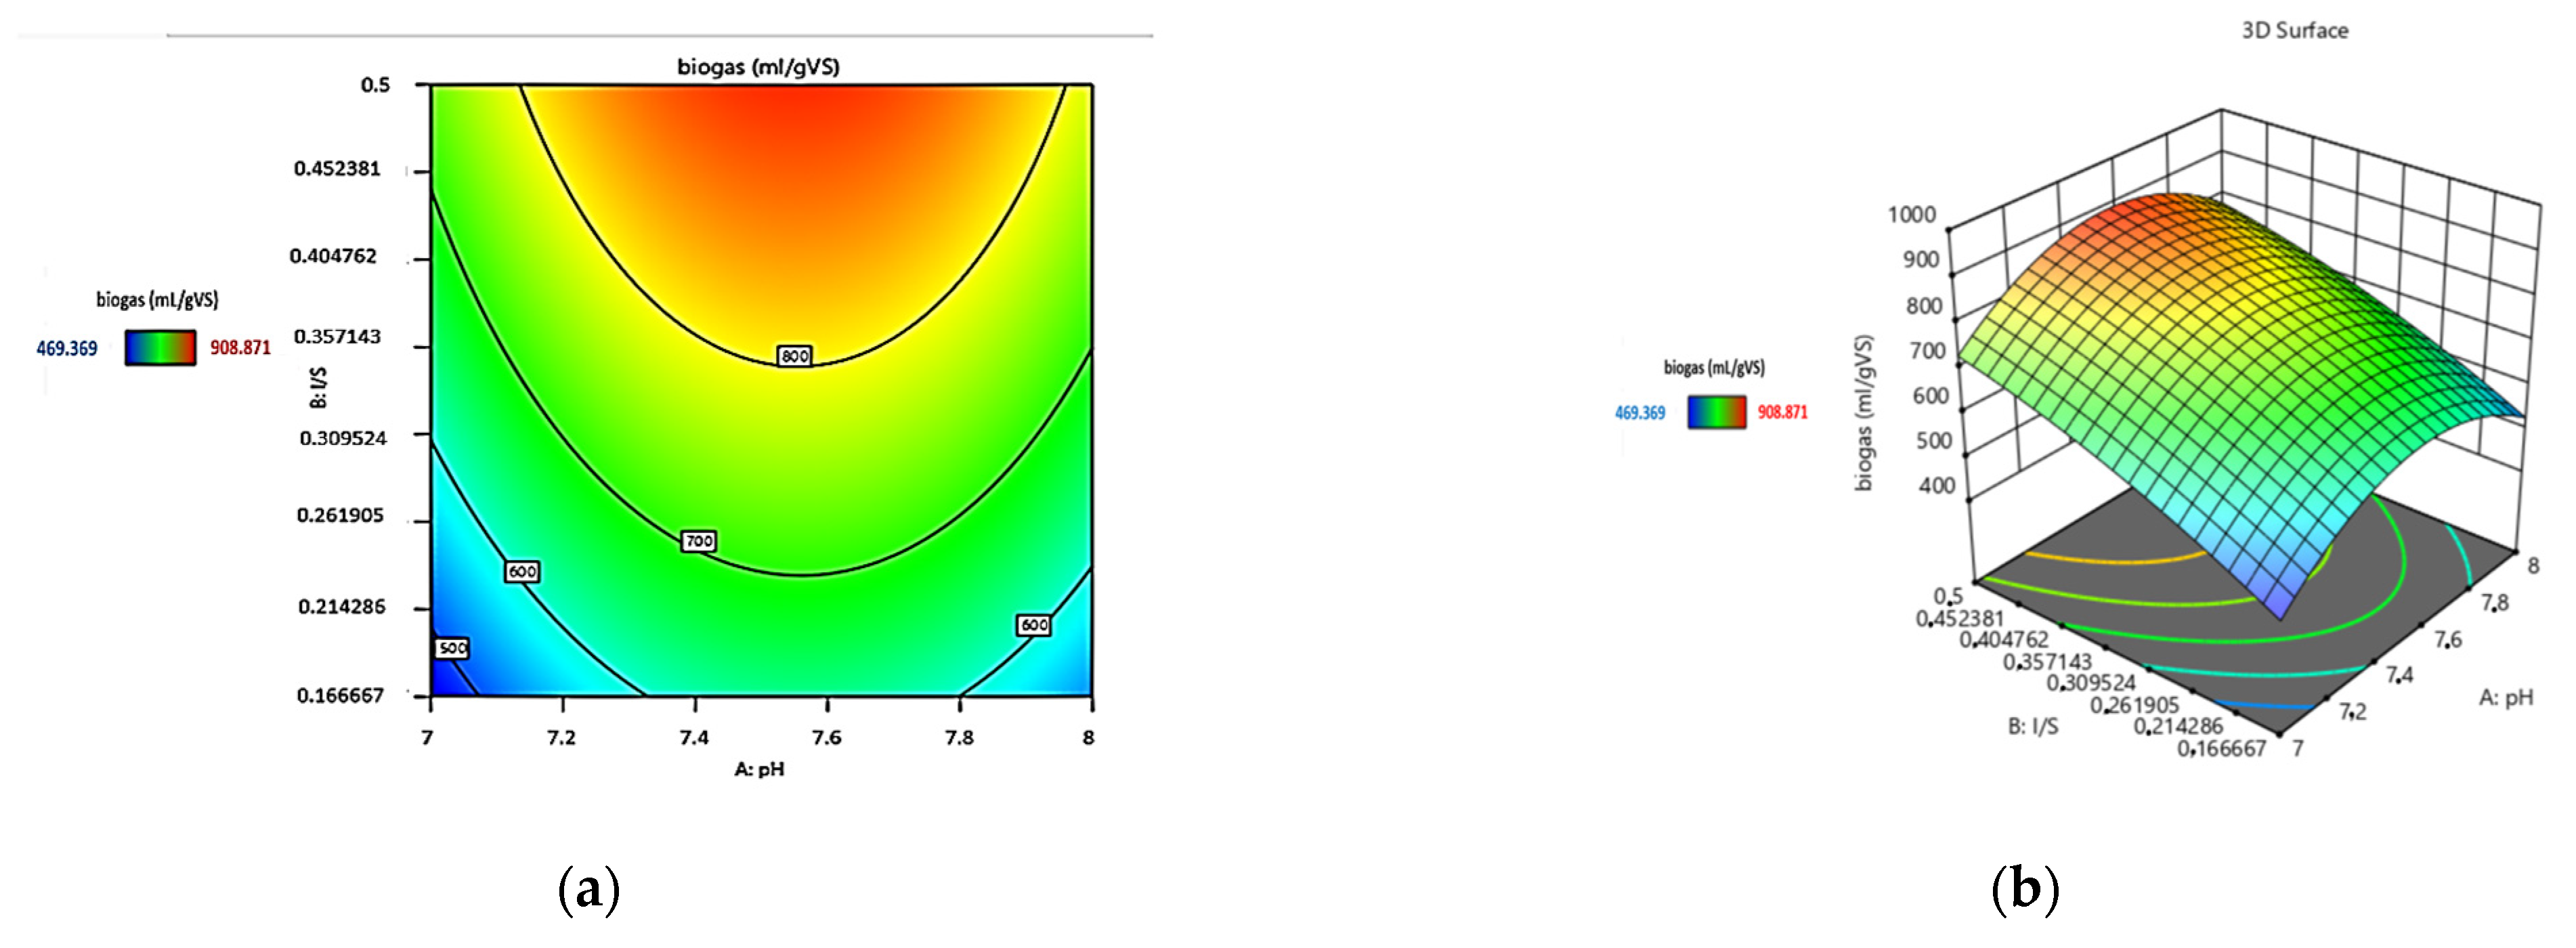
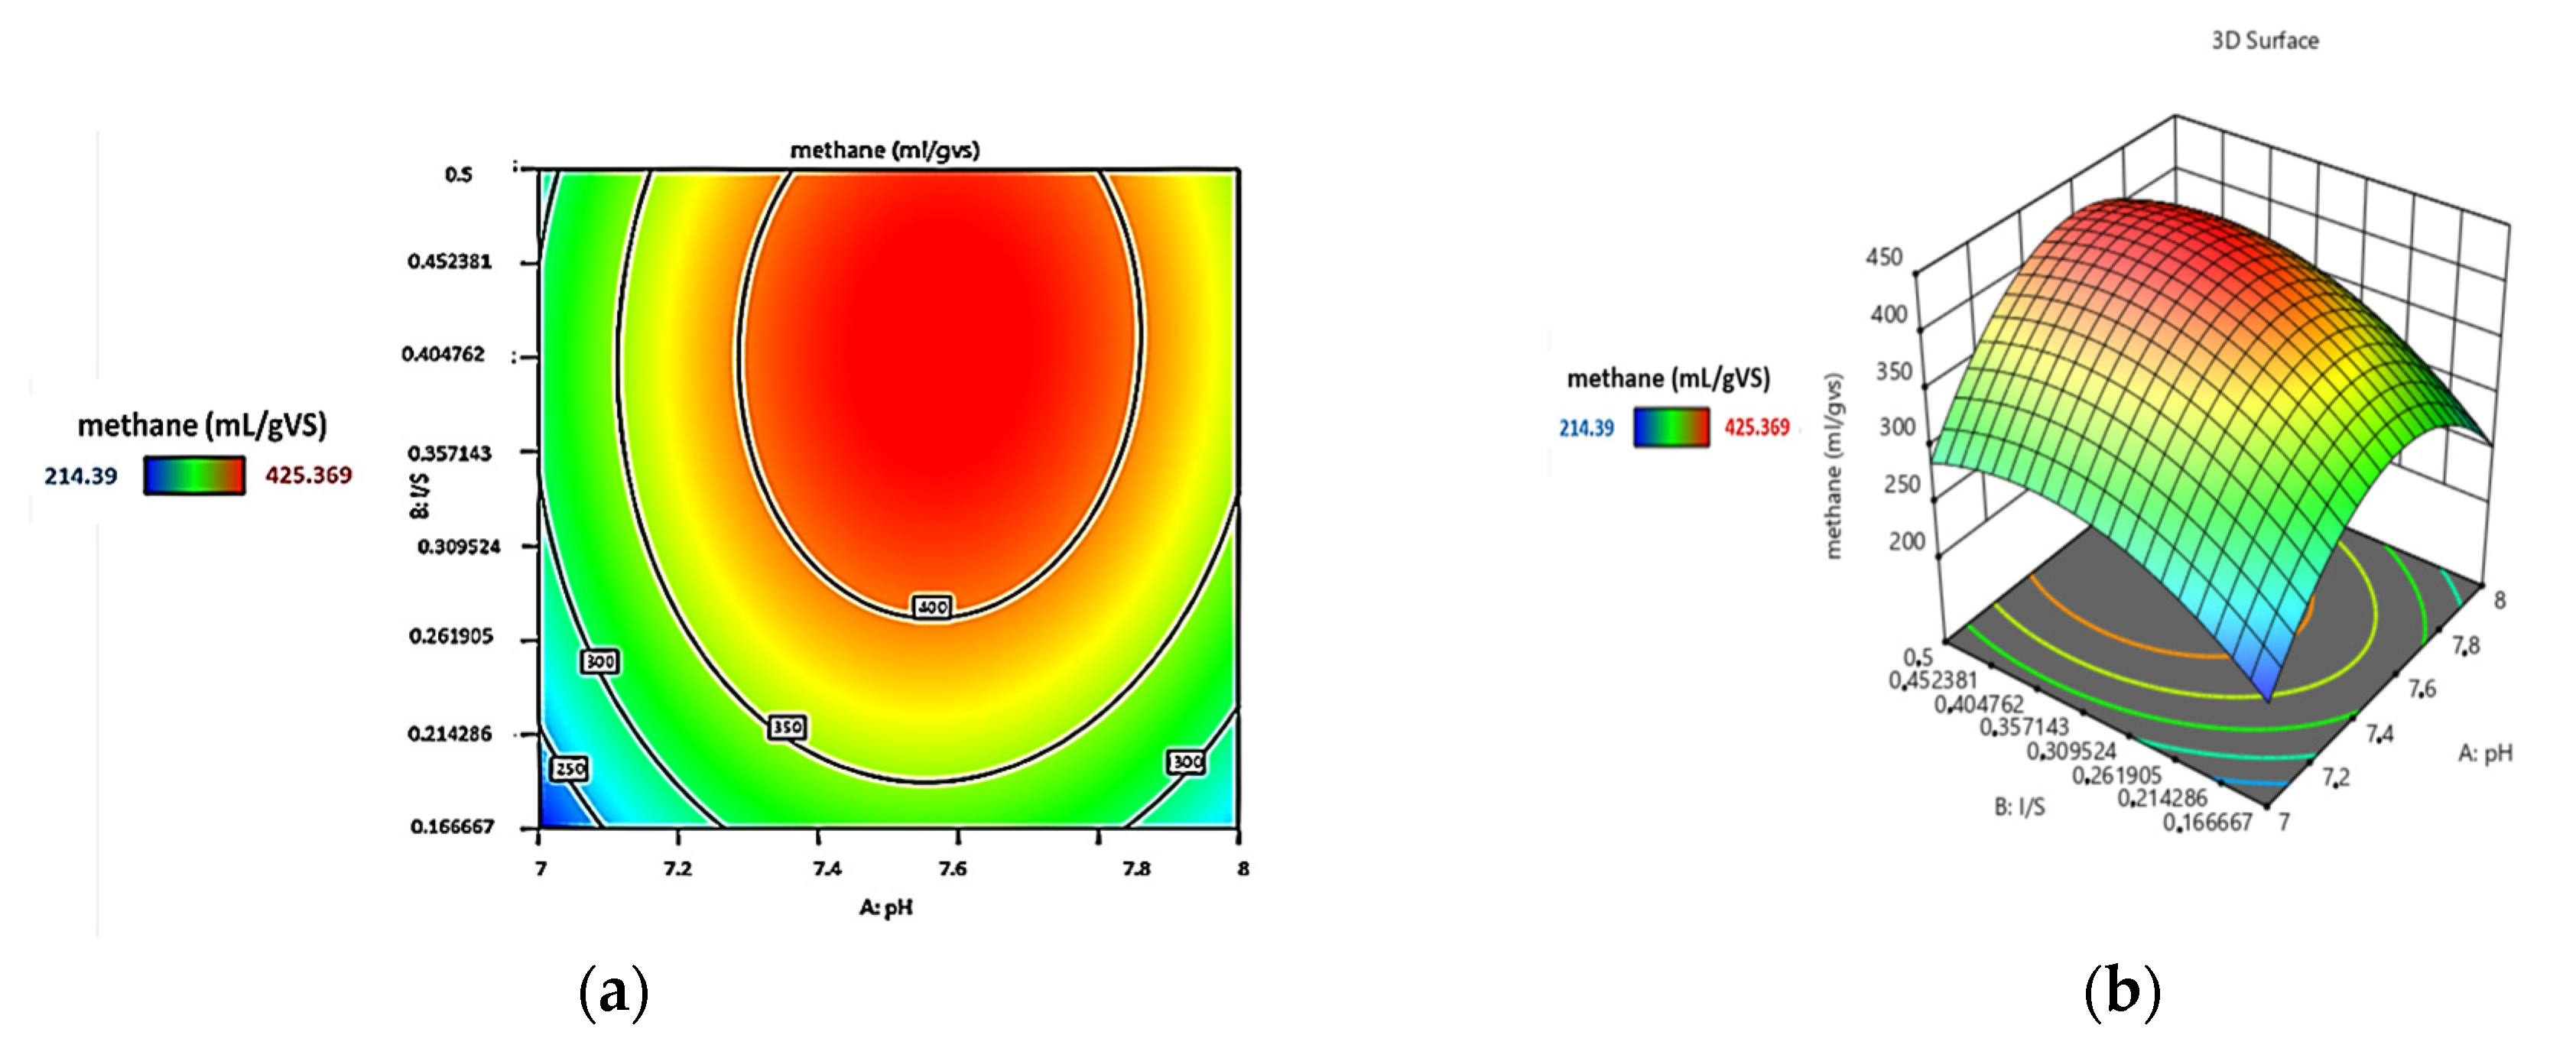
4.2. Analysis of Contour Plots and 3D Response Surfaces

The Design Expert software generated contour plots (a two-dimensional view, where points of equal response are connected to produce contour lines), and a 3D response surface plot (a three-dimensional view providing a clearer understanding of variables’ interaction effects). These plots are useful tools for identifying optimal conditions for the target responses.
Figure 4 and Figure 5 indicate the effect of the variable interaction on the biogas yield and methane yield. The contour plots show a uniform spacing between the lines, indicating a lack of interaction between the pH and I/S ratio, which confirms the ANOVA results (the p-value of the interaction AB > 0.05). However, both variables effect the biogas and methane yield independently. Although the variable interactions have an insignificant influence, the 3D response surfaces show curvature, which is attributed to the quadratic effect of pH ratio on the two responses, a finding confirmed by the perturbation graphs in Figure 6.
According to the contour plots and response surfaces in Figure 4 and Figure 5, the biogas yield and methane yield achieved the maximum values of 908.871 mL/g VS and 425.369 mL/g VS, respectively, at a pH of 7.5 and an I/S ratio of 0.5. These results are compatible with research conducted by Mahanta et al. [24], which found that bacteria, especially methanogenic bacteria, performed perfectly in a pH range from 6.3 to 7.5. Additionally, increasing the I/S ratio has been found to have a significant effect on biogas and methane production, since Zeng et al. found that the methane yield decreased from 140.48 to 94.42 mL/g VS, and the opposite is also true [25].

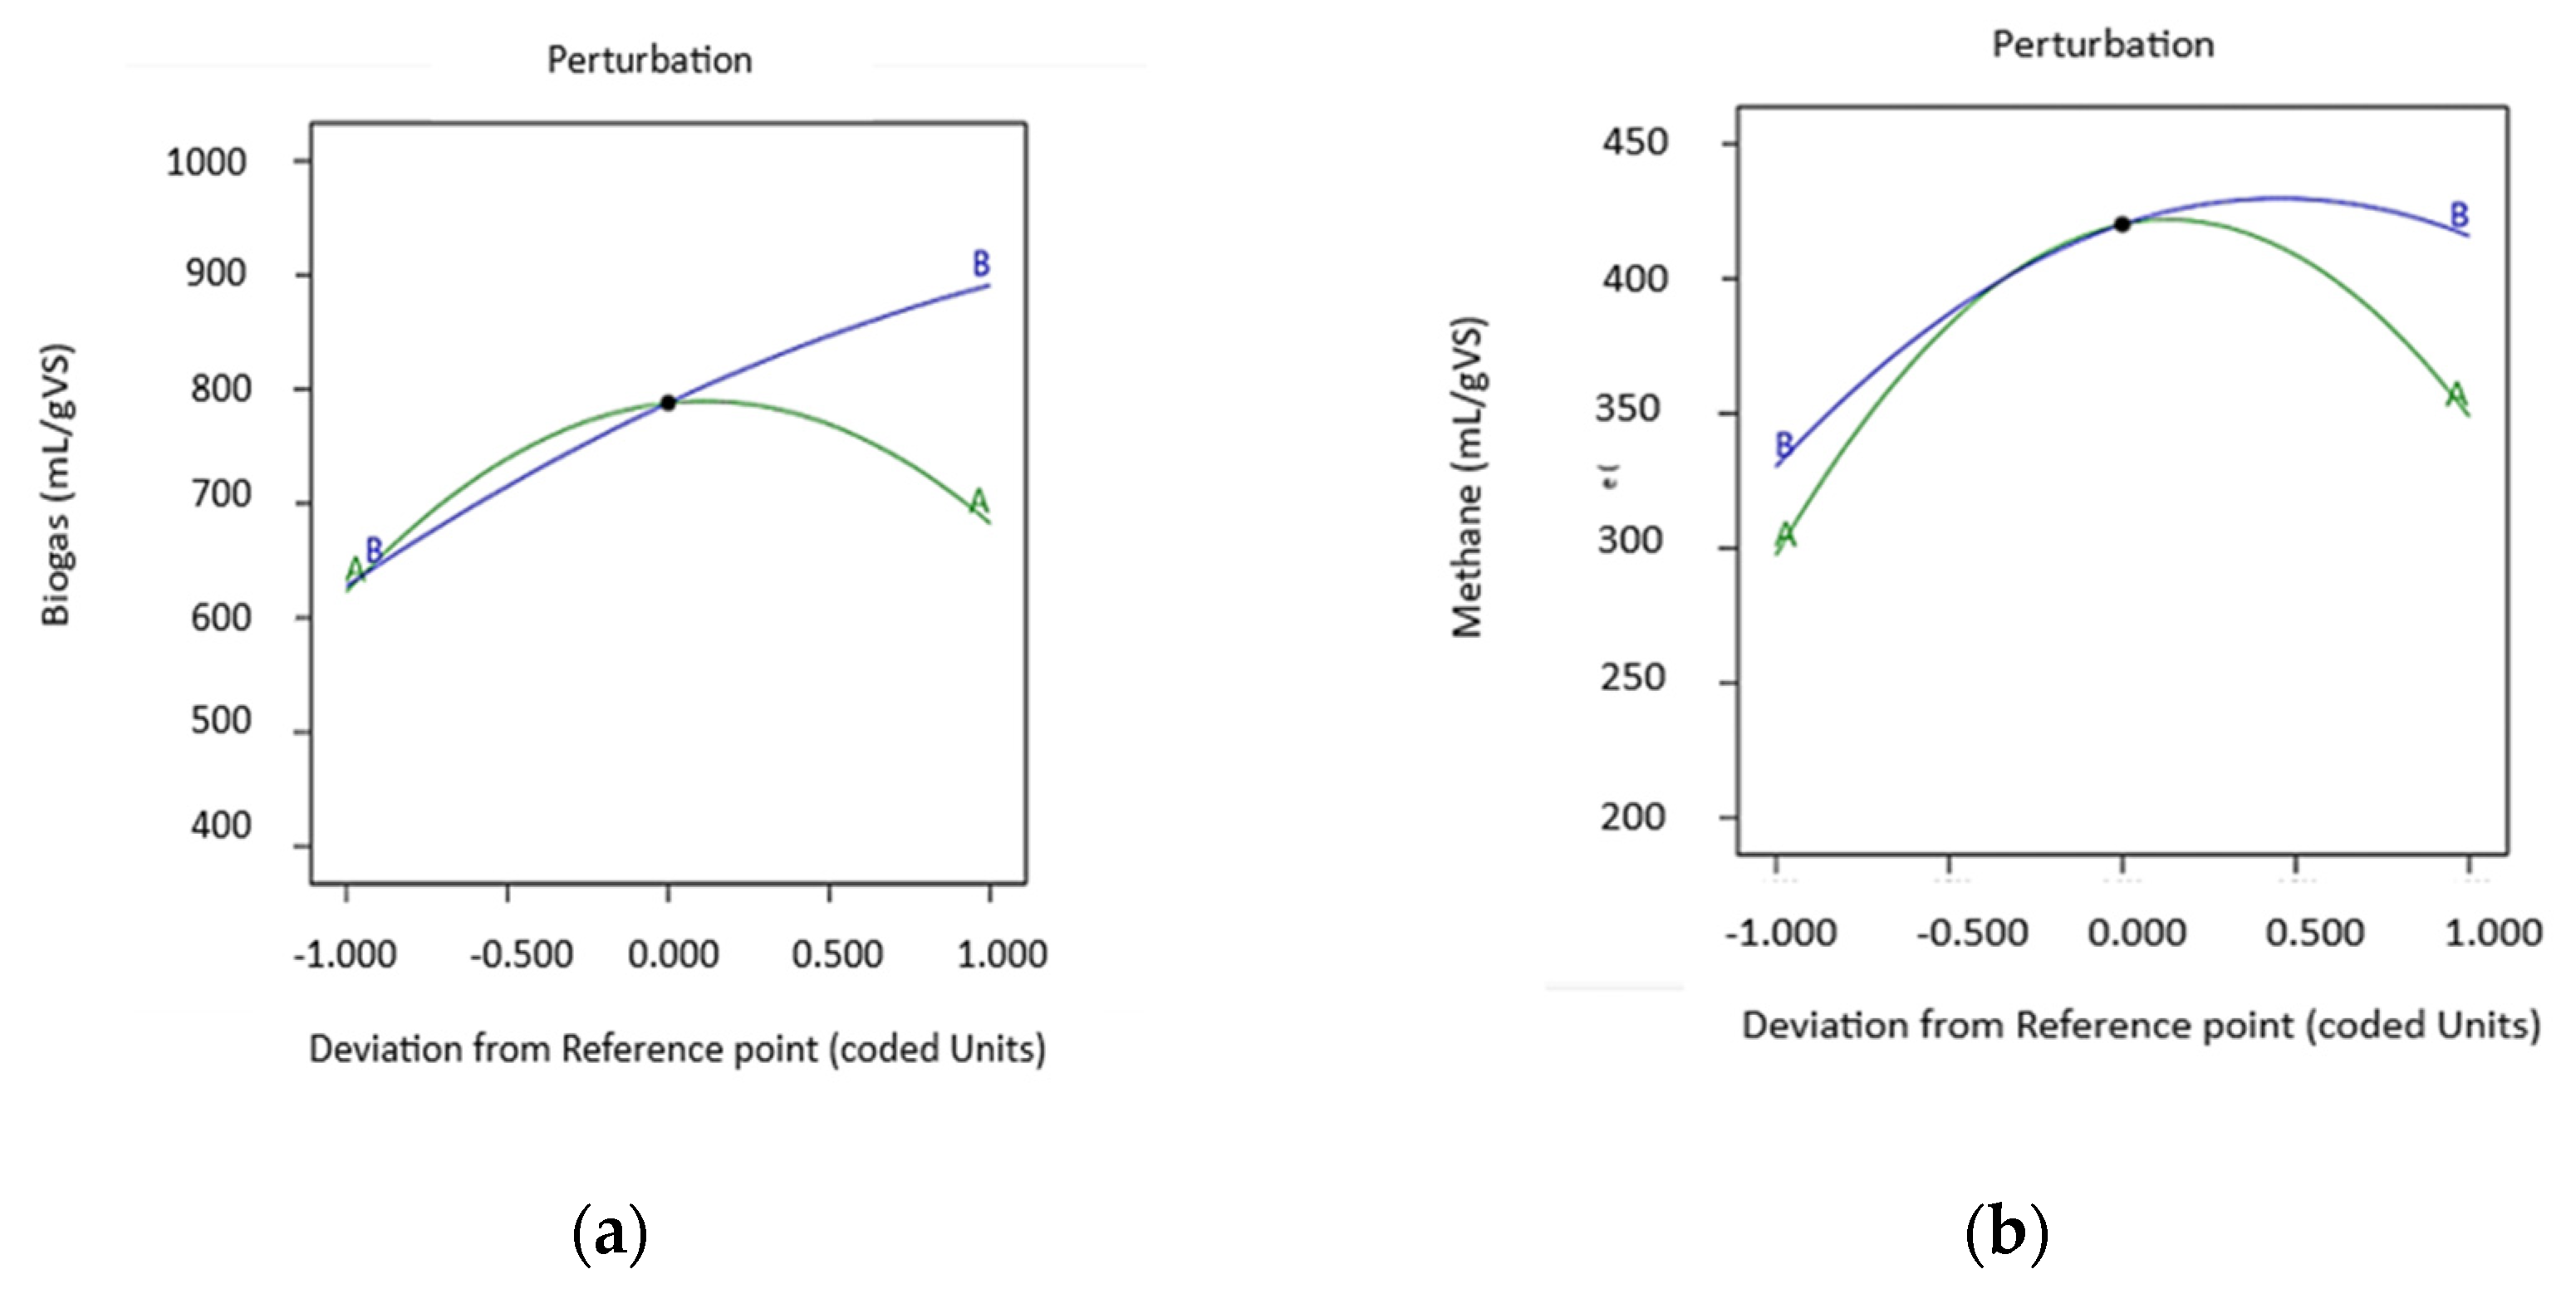
4.3. Evaluating the Effect of Independent Variables on Biogas and Methane Yield

In this section, the previously illustrated Figure 4, Figure 5 and Figure 6 are used to identify the independent effects of pH and I/S ratio on the biogas and methane yield.
  • The effect of pH on the responses:
Increasing the pH from 7 to 7.553 significantly affected the biogas and methane production, as shown in Figure 6. The yield of biogas and methane was elevated from 622.933 to 790.331 mL/g VS, and from 297.03 to 421.16 mL/g VS, respectively. These findings were obtained for an I/S ratio of 0.334. Beyond this, the augmentation of pH (pH > 7.553) affected the biogas and methane production negatively, achieving values of 682.806 and 348.605 for pH = 8. Many previous studies have confirmed that a pH range of 7 to 7.5 supports the activity of methanogenic bacteria. Conversely, a pH > 7.5 could promote the growth of non-methanogenic bacteria, leading to a decreasing in biogas and methane production [26].
The perturbation graphs in Figure 6 indicate the quadratic effect of pH with a steep slope, suggesting that this independent variable has a minor role in affecting the biogas and methane yield.
  • The effect of the I/S ratio on the biogas and methane yield:
The contour plots and the 3D response surfaces illustrate that an increase in the I/S ratio corresponds to greater production of biogas and methane. These findings are confirmed by the perturbation graph (Figure 6). Graph (a) shows that the I/S ratio has a steep upward line, indicating that this variable has a strongly significant linear effect on biogas production, as biogas production was enhanced from 627.827 mL/g VS at I/S ratio of 0.16 to 891.496 mL/g Vs at I/S ratio of 0.5. The ANOVA table of biogas validates these results, as the independent variable of I/S ratio exhibits a strongly significant effect with a p-value < 0.0001. While graph (b) outlines that an increase in the I/S ratio has a positive effect on methane production, this effect is less significant than its influence on biogas yield. While the methane yield was elevated from 330.249 mL/g VS at an I/S ratio of 0.16 to 423.301 mL/g VS at an I/S ratio of 0.482, the production shows a small decline. Some researchers have found that increasing the inoculum-to-substrate ratio effectively enhances biogas and methane production, but an I/S ratio > 0.5 can saturate the system by introducing too much inoculum, which decreases substrate availability and leads to an accumulation of volatile fatty acids, creating an acidic environment that is undesirable for the activity of methanogenic bacteria [27,28,29].

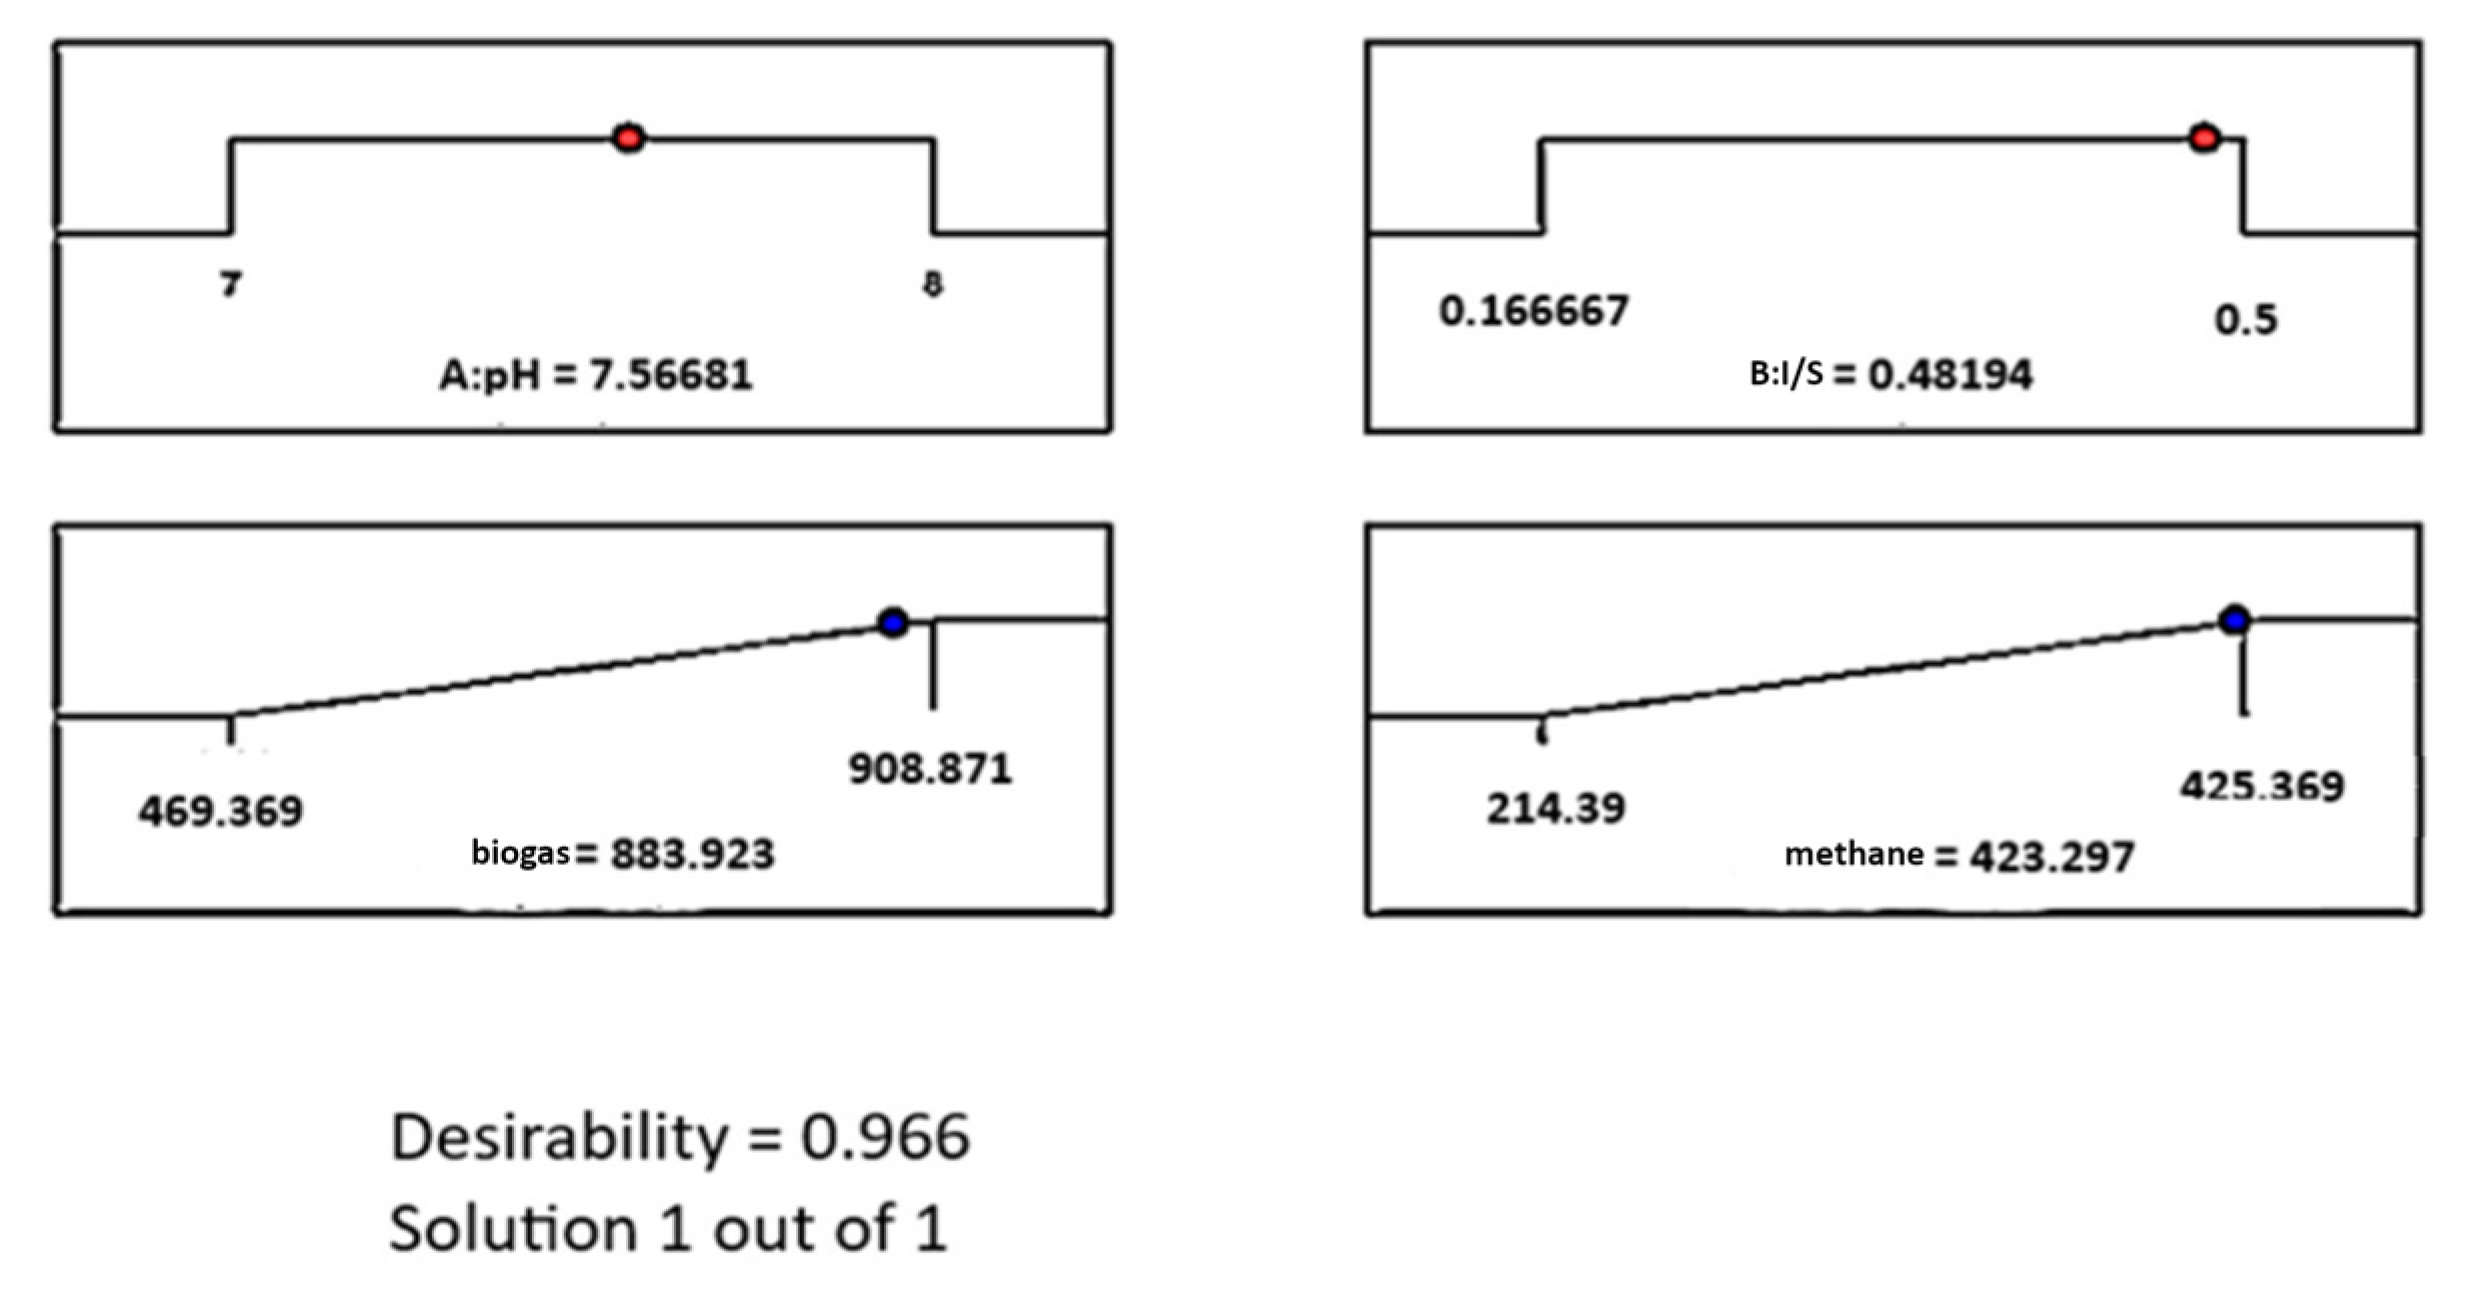
4.4. Process Optimization

The aim of this part was to identify the optimal levels of factors for maximizing biogas and methane production. To achieve this goal, numerical optimization of the RSM dataset was conducted using Design-Expert; the ramp plots shown in Figure 7 illustrate the optimization results.
During the numerical optimization, the independent variables varied within the experimental range of 7 to 8 for the pH and 0.16 to 0.5 for the I/S ratio, with an importance level of 3, while the two responses of biogas and methane yield were maximized, and each one assigned an importance level of 5. Each plot in the ramp (Figure 7) represents one variable or response, and the vertical marker in the horizontal axis indicates the target value at a pH of 7.566 and an I/S ratio of 0.482, with a calculated desirability of 0.966, confirming the capacity of these conditions to maximize both biogas and methane yield.
Table 7 summarizes the results of the numerical optimization. Under the obtained optimal condition, the biogas yield was predicted to be 884.350 mL/g VS, and the methane yield was predicted to be 422.828 mL/g VS.
Experimental validation was conducted to confirm the accuracy of this prediction (Table 8). Comparison of the results of the validation run with the predicted outcomes showed a deviation of less than 5%. These findings suggest a good accuracy of the model and the prediction method.

5. Conclusions

The optimization of the anaerobic digestion process through response surface methodology (RSM) and numerical optimization has led to the identification of the perfect level of process parameters for the improvement of biogas and methane yield. The results obtained in this study demonstrate that fixing factors like pH at around 7.5 and the I/S ratio at 0.48 could maximize biogas production and methane content; this was validated by an experimental run that showed high accuracy and minimal deviation (<5%). These results confirm the high potential of numerical optimization in predicting anaerobic digestion conditions, and its role as an effective tool to enhance the efficiency and sustainability of bioenergy production from organic waste.
However, serval limitations should be acknowledged:
  • The research was conducted in batch mode, which does not simulate real conditions.
  • The microbial composition involved in this study was not examined.
  • The long-term stability of the system was not confirmed.
To enhance the applicability of these results, future research should focus on the following:
  • Conducting a study in a semi-continuous or continuous reactor, to confirm the long-term stability of the system.
  • Integrating CCD–response surface methodology with an AI tool to enhance the prediction of biogas and methane yield.
  • Conducting research at the microscopic scale to understand the behavior of microorganisms during the degradation of the substrate.

Author Contributions

C.B.: Writing—original draft, Data Curation, Methodology, Conceptualization, Visualization, Formal analysis. B.K.: Supervision, Resources, Data, Curation, Writing—review & editing. A.K.: Conceptualization, Supervision, Writing—review & editing. M.O.B.: Conceptualization, Writing—review & editing. K.D.: Supervision, Resources, Data, Curation, Writing—review & editing. Z.A.: Conceptualization, Writing—review & editing. All authors have read and agreed to the published version of the manuscript.

Funding

This research received no external funding.

Institutional Review Board Statement

Not applicable.

Informed Consent Statement

Not applicable.

Data Availability Statement

The original contributions presented in this study are included in the article. Further inquiries can be directed to the corresponding author.

Conflicts of Interest

The authors declare no conflicts of interest.

References

  1. Rashwan, A.K.; Bai, H.; Osman, A.I.; Eltohamy, K.M.; Chen, Z.; Younis, H.A.; Al-Fatesh, A.; Rooney, D.W.; Yap, P.-S. Recycling Food and Agriculture By-Products to Mitigate Climate Change: A Review. Environ. Chem. Lett. 2023, 21, 3351–3375. [Google Scholar] [CrossRef]
  2. EPA. Food Waste Management in the United States, 2014; Environmental Protection Agency, Office of Resource Conservation and Recovery: Washington, DC, USA, 2016; pp. 2–18. [Google Scholar]
  3. Counsil Directive on Waste 442/1975/EEC. 1975. Available online: https://eur-lex.europa.eu/LexUriServ/LexUriServ.do?uri=CONSLEG:1975L0442:20031120:EN:PDF (accessed on 30 November 2024).
  4. Cederberg, C.; Sonesson, U. Global Food Losses and Food Waste: Extent, Causes and Prevention. In Proceedings of the International Congress Save Food! At Interpack 2011, Düsseldorf, Germany, 16–17 May 2011; Gustavsson, J., Ed.; Food and Agriculture Organization of the United Nations: Rome, Italy, 2011. ISBN 978-92-5-107205-9. [Google Scholar]
  5. Čolović, D.; Rakita, S.; Banjac, V.; Đuragić, O.; Čabarkapa, I. Plant Food By-Products as Feed: Characteristics, Possibilities, Environmental Benefits, and Negative Sides. Food Rev. Int. 2019, 35, 363–389. [Google Scholar] [CrossRef]
  6. Vulić, J.; Šeregelj, V.; Kalušević, A.; Lević, S.; Nedović, V.; Tumbas Šaponjac, V.; Čanadanović-Brunet, J.; Ćetković, G. Bioavailability and Bioactivity of Encapsulated Phenolics and Carotenoids Isolated from Red Pepper Waste. Molecules 2019, 24, 2837. [Google Scholar] [CrossRef]
  7. Naveen, B.P.; Sumalatha, J.; Malik, R.K. A Study on Contamination of Ground and Surface Water Bodies by Leachate Leakage from a Landfill in Bangalore, India. Int. J. Geo-Eng. 2018, 9, 27. [Google Scholar] [CrossRef]
  8. Romero-Huelva, M.; Ramírez-Fenosa, M.A.; Planelles-González, R.; García-Casado, P.; Molina-Alcaide, E. Can By-Products Replace Conventional Ingredients in Concentrate of Dairy Goat Diet? J. Dairy Sci. 2017, 100, 4500–4512. [Google Scholar] [CrossRef]
  9. Hu, C.H.; Zuo, A.Y.; Wang, D.G.; Pan, H.Y.; Zheng, W.B.; Qian, Z.C.; Zou, X.T. Effects of Broccoli Stems and Leaves Meal on Production Performance and Egg Quality of Laying Hens. Anim. Feed Sci. Technol. 2011, 170, 117–121. [Google Scholar] [CrossRef]
  10. Scano, E.A.; Grosso, M.; Pistis, A.; Carboni, G.; Cocco, D. An In-Depth Analysis of Biogas Production from Locally Agro-Industrial by-Products and Residues. An Italian Case. Renew. Energy 2021, 179, 308–318. [Google Scholar] [CrossRef]
  11. Valenti, F.; Porto, S.M.C. Net Electricity and Heat Generated by Reusing Mediterranean Agro-Industrial By-Products. Energies 2019, 12, 470. [Google Scholar] [CrossRef]
  12. Gürsan, C.; de Gooyert, V. The Systemic Impact of a Transition Fuel: Does Natural Gas Help or Hinder the Energy Transition? Renew. Sustain. Energy Rev. 2021, 138, 110552. [Google Scholar] [CrossRef]
  13. Ryckebosch, E.; Drouillon, M.; Vervaeren, H. Techniques for Transformation of Biogas to Biomethane. Biomass Bioenergy 2011, 35, 1633–1645. [Google Scholar] [CrossRef]
  14. Angelidaki, I.; Treu, L.; Tsapekos, P.; Luo, G.; Campanaro, S.; Wenzel, H.; Kougias, P.G. Biogas Upgrading and Utilization: Current Status and Perspectives. Biotechnol. Adv. 2018, 36, 452–466. [Google Scholar] [CrossRef] [PubMed]
  15. Jeppu, G.P.; Janardhan, J.; Kaup, S.; Janardhanan, A.; Mohammed, S.; Acharya, S. Effect of Feed Slurry Dilution and Total Solids on Specific Biogas Production by Anaerobic Digestion in Batch and Semi-Batch Reactors. J. Mater. Cycles Waste Manag. 2022, 24, 97–110. [Google Scholar] [CrossRef]
  16. Harissa: The Story Behind North Africa’s Favorite Hot Sauce: The Salt: NPR. Available online: https://www.npr.org/sections/thesalt/2012/06/04/154293245/harissa-the-story-behind-north-africas-favorite-hot-sauce (accessed on 25 December 2024).
  17. Akman, H.E.; Akman, E.; Ciggin, A.S.; Perendeci, N.A.; Yaldız, O. Effects of Mixture Ratio of Cow Manure and Greenhouse Wastes on Anaerobic Co-Digestion Process. Agric. Eng. Int. CIGR J. Spec. 2015, 2015, 160–167. [Google Scholar]
  18. Ferrer, P.; Cambra-López, M.; Cerisuelo, A.; Peñaranda, D.S.; Moset, V. The Use of Agricultural Substrates to Improve Methane Yield in Anaerobic Co-Digestion with Pig Slurry: Effect of Substrate Type and Inclusion Level. Waste Manag. 2014, 34, 196–203. [Google Scholar] [CrossRef]
  19. Riaño, B.; Molinuevo-Salces, B.; Parralejo, A.; Royano, L.; González-Cortés, J.; García-González, M.C. Techno-Economic Evaluation of Anaerobic Co-Digestion of Pepper Waste and Swine Manure. Biomass Convers. Biorefin. 2023, 13, 7763–7774. [Google Scholar] [CrossRef]
  20. Sidi Habib, S.; Torii, S.; S, K.M.; Charivuparampil Achuthan Nair, A. Optimization of the Factors Affecting Biogas Production Using the Taguchi Design of Experiment Method. Biomass 2024, 4, 687–703. [Google Scholar] [CrossRef]
  21. Walter, W.G. Standard Methods for the Examination of Water and Wastewater (11th Ed.). Am. J. Public Health Nations Health 1961, 51, 940. [Google Scholar] [CrossRef]
  22. Cicco, N.; Lanorte, M.T.; Paraggio, M.; Viggiano, M.; Lattanzio, V. A Reproducible, Rapid and Inexpensive Folin–Ciocalteu Micro-Method in Determining Phenolics of Plant Methanol Extracts. Microchem. J. 2009, 91, 107–110. [Google Scholar] [CrossRef]
  23. Ghaleb, A.A.S.; Kutty, S.R.M.; Ho, Y.-C.; Jagaba, A.H.; Noor, A.; Al-Sabaeei, A.M.; Almahbashi, N.M.Y. Response Surface Methodology to Optimize Methane Production from Mesophilic Anaerobic Co-Digestion of Oily-Biological Sludge and Sugarcane Bagasse. Sustainability 2020, 12, 2116. [Google Scholar] [CrossRef]
  24. Mahanta, P.; Saha, U.K.; Dewan, A.; Kalita, P.; Buragohain, B. Biogas Digester: A Discussion on Factors Affecting Biogas Production and Field Investigation of a Novel Duplex Digester. J. Sol. Energy Soc. India 2005, 15, 1–12. [Google Scholar]
  25. Zeng, S.; Yuan, X.; Shi, X.; Qiu, Y. Effect of Inoculum/Substrate Ratio on Methane Yield and Orthophosphate Release from Anaerobic Digestion of Microcystis spp. J. Hazard. Mater. 2010, 178, 89–93. [Google Scholar] [CrossRef] [PubMed]
  26. Mata-Alvarez, J.; Macé, S.; Llabrés, P. Anaerobic Digestion of Organic Solid Wastes. An Overview of Research Achievements and Perspectives. Bioresour. Technol. 2000, 74, 3–16. [Google Scholar] [CrossRef]
  27. Khadka, A.; Parajuli, A.; Dangol, S.; Thapa, B.; Sapkota, L.; Carmona-Martínez, A.A.; Ghimire, A. Effect of the Substrate to Inoculum Ratios on the Kinetics of Biogas Production during the Mesophilic Anaerobic Digestion of Food Waste. Energies 2022, 15, 834. [Google Scholar] [CrossRef]
  28. Sri Bala Kameswari, K.; Kalyanaraman, C.; Porselvam, S.; Thanasekaran, K. Optimization of Inoculum to Substrate Ratio for Bio-Energy Generation in Co-Digestion of Tannery Solid Wastes. Clean Technol. Environ. Policy 2012, 14, 241–250. [Google Scholar] [CrossRef]
  29. Song, X.; Kong, F.; Liu, B.-F.; Song, Q.; Ren, N.-Q.; Ren, H.-Y. Antioxidants alleviated low-temperature stress in microalgae by modulating reactive oxygen species to improve lipid production and antioxidant defense. Bioresour. Technol. 2024, 413, 131451. [Google Scholar] [CrossRef]
Figure 1. Pepper waste (PW).
Sustainability 17 02688 g001
Figure 2. Illustration of experimental setup.
Sustainability 17 02688 g002
Figure 3. Plots of predicted vs. actual (a) biogas yield (b) methane yield.
Sustainability 17 02688 g003
Figure 4. Contour plot (a) and response surface (b) for biogas yield.
Sustainability 17 02688 g004
Figure 5. Contour plot (a) and response surface (b) for methane yield.
Sustainability 17 02688 g005
Figure 6. Perturbation graphs of (a) biogas yield and (b) methane yield; “A”—pH, “B”—I/S ratio.
Sustainability 17 02688 g006
Figure 7. Ramps of numerical optimization.
Sustainability 17 02688 g007
Table 1. Characterization of the PW and the inoculum.
CharacteristicsPW SS
pH6.427.5
TS (g/Kg)948.468.73
TVS (g/Kg)919.830.85
Total COD 480 (mg/g)14,400 (mg/L)
Total carbon 74.05 (mg/g)1401 (mg/L)
Polyphenols 539.35 (mg/g)586.39 (mg/L)
Table 2. The levels of the factors applied in the design optimization for the produced volume of biogas and methane.
Independent VariableUnitVariable Level
−1 (Min)0+1 (Max)
I/S ratio (X1)g VS/g VS0.1670.3340.5
pH (X2)-77.58
Table 3. Design matrix for experimental and predicted biogas and methane yield.
Runs OrderReal ValuesCoded ValuesResponses
pHI/SX1X2Biogas
(mL/gVS)
(Y1)
Methane
(mL/gVS)
(Y2)
Experimental Biogas Yield
(mL/g VS)
Predicted Biogas Yield
(mL/g VS)
Experimental Methane Yield
(mL CH4/g VS)
Predicted Methane Yield (mL CH4/g VS
1 8.00.500+1+1793.145781.38364.846350.41
2 8.00.500+1+1767.339781.38352.975350.41
3 8.00.500+1+1772.177781.38332.201350.41
4 8.00.167+1−1532.477526.34261.526253.23
5 7.00.167−1−1469.369457.89214.39213.19
6 7.00.334−10617.384622.72304.407297.31
7 7.50.5000+1908.871891.26425.369415.87
8 7.50.1670−1610627.62320.774330.27
9 8.00.334+10687.903682.57341.835348.93
10 7.00.500−1+1723.994730.13278.932287.23
11 7.50.33400788.144788.14420.179420.18
Table 4. ANOVA for response surface quadratic model (biogas yield Y1).
SourceSum of SquaresDFMean SquareF-Valuep-Value
Model1.655 × 105533,103.51126.80<0.0001significant
A-pH6164.1916164.1923.610.0046
B-I/S1.195 × 10511.195 × 10 5 457.91<0.0001
AB90.57190.570.34690.5815
A238,532.60138,532.60147.60<0.0001
B21759.8811759.886.740.0485
Residual1305.325261.06
Lack of Fit928.983309.661.650.3996not significant
Pure Error376.342188.17
Cor Total1.668 × 10510
Table 5. ANOVA for response surface quadratic model (biogas methane Y2).
SourceSum of SquaresDFMean Square F-Valuep-Value
Model39,292.3857858.4840.620.0005significant
A-pH4573.8514573.8523.640.0046
B-I/S12,590.04112,590.0465.080.0005
AB163.921163.920.84740.3995
A219,504.91119,504.91100.830.0002
B24551.7414551.7423.530.0047
Residual967.265193.45
Lack of Fit421.203140.400.51420.7126not significant
Pure Error546.062273.03
Cor Total40,259.6410
Table 6. ANOVA statistical results for response surface models.
Statistical ResultY1Y2
Model F-Value126.7140.91
Model p-Value<0.00010.0005
Lack of Fit F-Value1.640.5132
Lack of Fit p-Value0.39970.7131
R-Squared0.99220.9761
Adj R-Squared0.98430.9523
Pred R-Squared0.94620.8499
Adeq Precision36.322520.1590
Table 7. Optimal values and predicted responses.
Independent Variables Optimal Level Target ResponsesTarget Predicted ValueDesirability
pH7.567In rangeBiogas yield (mL/g VS)
(Y1)
Maximize 884.3500.966
I/S ratio0.482In rangeMethane yield
(mL/g VS)
(Y2)
Maximize422.827
Table 8. Validation results.
Responses Predicted ValueExperimental Value % Deviation
Biogas yield 884.350908.8712.69
Methane yield 422.827425.3690.59
Disclaimer/Publisher’s Note: The statements, opinions and data contained in all publications are solely those of the individual author(s) and contributor(s) and not of MDPI and/or the editor(s). MDPI and/or the editor(s) disclaim responsibility for any injury to people or property resulting from any ideas, methods, instructions or products referred to in the content.

