Article

Global Warming Assessment of Dairy Farms: A Case Study of Organic and Conventional Fluid Milk in Thailand

by
Dussadee Rattanaphra
1,
Sittinun Tawkaew
2,
Wilasinee Kingkam
1,
Sasikarn Nuchdang
1,
Kittiwan Kitpakornsanti
3 and
Unchalee Suwanmanee
2,*
1
Nuclear Technology Research and Development Center, Thailand Institute of Nuclear Technology, Nakorn Nayok 26120, Thailand
2
Department of Chemical Engineering, Faculty of Engineering, Srinakharinwirot University, Nakorn Nayok 26120, Thailand
3
Climate Change and Environment Research Center, Department of Climate Change and Environment, Technopolis, Pathumthani 12120, Thailand
*
Author to whom correspondence should be addressed.
Sustainability 2025, 17(6), 2687; https://doi.org/10.3390/su17062687
Submission received: 24 January 2025 / Revised: 3 March 2025 / Accepted: 14 March 2025 / Published: 18 March 2025
(This article belongs to the Section Sustainable Agriculture)

Abstract

:
The international trade in organic food has obviously increased potential in the past decade. The present study was conducted to assess and compare the first global warming impact of fluid milk production in Thailand associated to two systems, namely organic and conventional farms, by applying LCA for a case study approach. The assessment was based on a cradle-to-farm gate, with 1 kg of fat- and protein-corrected milk (FPCM) as a functional unit (FU). The environmental impact was evaluated according to International Dairy Federation or biological allocation. The results showed that the global warming values of organic farms (2.366–2.783 kg CO2 equivalent/kg FPCM) were 47% moderately higher than those of conventional farms (1.253–1.474 kg CO2 equivalent/kg FPCM). The main contributors to the global warming impact were feed consumption and CH4 emission, accounting for 33.41% and 33.19%, respectively. The highest global warming impact was found in the stages of lactating cow. Another interesting finding was lack of local organic feed with a relatively high impact on transportation stage. Based on biological allocation, the global warming impact was increased over 12.652–13.107% by the mass allocation method, whereas economic allocation exhibited no effect on the global warming impact. A sensitivity analysis result indicated that the organic farm was economically feasible as an alternative to conventional farm. The substitution of conventional farming with organic farming of 10–50% led to an annual global warming impact in Thailand of 8–30% higher than that of conventional farms.

1. Introduction

Since 2023, the population of the world has been over 8.0 billion and the United Nations (UN) estimates it to reach 9.8 billion in 2050 and to surpass 11.2 billion in 2100 [1]. In 2023, the total greenhouse gases (GHGs) emitted from every sector of the economy was 58.3 × 10⁹ ton CO2 equivalent. In total, the agricultural sector is responsible for 20.7% (12 × 109 ton CO2 equivalent) of global GHG emissions. The land use change was the largest source of net GHG emissions (5.5 × 10⁹ ton CO2 equivalent), followed by livestock (3.7 × 10⁹ ton CO2 equivalent), and crop (2.9 × 10⁹ ton CO2 equivalent) [2,3]. Meat and dairy products are responsible for a large proportion of the environmental impacts arising because of a result of increasing per capita food consumption and the growth of the global population [4,5].
Life cycle assessments (LCAs) are potentially used as a valuable tool for evaluating and improving the sustainability of supply chains to support decision making in production. A number of LCA studies in various locations and with different scopes have been conducted in the past twenty years on the global warming of milk production [6]. Using a global LCA approach, the dairy cattle sector was estimated to have emitted a primary source of anthropogenic GHG emissions of 1711.8 million ton CO₂ equivalent in 2015. Despite this, methane has the most GHG emissions (24.5 percent of all emissions from dairy cattle sector) followed by nitrous oxide emissions (24.5 percent), and carbon dioxide emissions (12.3 percent) [7]. Globally, GHG estimates for milk at farm gates of the United States (US) range from 1971 to 2020 of 0.99–1.70 kg CO2 equivalent/kg fat- and protein-corrected milk (FPCM) [8], 1.68–2.05 kg CO2 equivalent/kg FPCM in Asia and 2.37 kg CO2 equivalent/kg FPCM in Africa [9], driven mainly by differences in production practices.
In 2024, the size of the global organic food market achieved USD 253.9 billion. The market is expected to grow annually by USD 643.6 billion or 60.6% in 2033 [10]. Compared to conventional farming, organic farming has a better quality and low variability for environmental sustainability because of an absence of chemicals or synthetic insecticides [11,12,13]. The environmental impacts of milk production are affected by differences in farming system parameters, e.g., farm sizes (small, middle, and large), feed intakes, crop yield, and manure management [14,15,16]. The dairy farms are generally classified into three types, namely, conventional dairy farming (including confine and pasture-based), confine dairy farming, and organic dairy farming [9]. The average global warming impact from cradle-to-farm gate based on the number of farms for 180 conventional systems, 27 confined systems, and 41 organic systems is 1.26 kg CO2 equivalent/kg PFCM, 1.30 kg CO2 equivalent/kg PFCM, and 1.21 kg CO2 equivalent/kg PFCM, respectively [9].
There are numerous studies on the environmental performance of conventional and organic milk LCA which have been published. The most common functional units (FU) of previous LCA studies are derived from quantity, including mass—kg and volume—L, of milk produced. Additionally, two nutrient-based functional units (FUs) are widely used in dairy farm assessments: 1 kg of FPCM and energy-corrected milk (ECM) [17]. Nijdam et al. (2012) [18] found that the range of global warming impact from the twelve dairy milk systems for Northern European countries and Canada was 1–2 kg CO2 equivalent/kg milk. The emission of methane accounts for the most amount of GHG emissions while the processing of the milk to dairy products is of less importance. Salou et al. (2016) [19] investigated effects of feed intake for one organic milks and six conventional milks in France, finding global warming impacts in the range of 0.91–1.17 kg CO2 equivalent/kg PFCM. The study concluded that organic milk had the lowest global warming impact compared to conventional systems. Knudsen et al. (2019) [20] analyzed the global warming potential of three organic milk European dairy systems (low land mixed, grassland, and mountain) in the range of 0.74–1.01 kg CO2 equivalent/kg PFCM. The findings reported that organic milk had a similar or slightly lower impact than conventional milk.
Baldini et al. (2018) [21] assessed the global warming of small and medium sizes for Italian conditions in the range of 1.11–1.69 kg CO2 equivalent/kg PFCM. The emission of methane had the most GHG emissions (50%), followed by CO2 (37%) and N2O (18%). Poore and Nemecek (2018) [22] estimated the global variation in GHG emissions for cow milk to be 1.7–4.8 kg CO2 equivalent/L with an average of 3.2 kg CO2 equivalent/L. Romano et al. (2021) [12] investigated the global warming impact of 1.25–1.32 kg CO2 equivalent/kg PFCM, considering three dairy farm systems in Italy (conventional, organic, and high quality). The findings indicated that the organic milk had a slightly lower impact than conventional milk by 0.05 kg CO2 equivalent/kg PFCM (approximately 4%).
The global organic food market has continued to increase, rising from 18 billion U.S. dollars in 2000 to 181.5 billion U.S. dollars in 2022. It is projected that global market will reach 446.2 billion U.S. dollars by 2030 [23,24]. Organic food continues to perform a crucial role in promoting sustainable and healthy food systems but also increasing opportunities for producers. In 2021, the value of organic products in Thailand was 25.5 million U.S. dollars, representing 0.04% of the global market value [25]. For the period from 2010 to 2021, Thailand’s organic food sector had a significant growth of 7–8% of its total food market and is expected to grow 8.8% by 2026 [25]. The country produces a wide range of organic products, including fruits, vegetables, dairy, meat, and packaged foods (6Wresearch New Delhi India, 2024) [26]. Thailand has had a policy on organic agriculture since 2008 [27]. This research fills a gap in the environmental perspective on conventional protein sources (e.g., meat and milk) with a particular focus on organic milk from animals. This is due to organic agriculture being considered as a possible alternative to conventional food production in a developing country, for a case study approach in Thailand. Additionally, this study is the first exclusive analysis of the global warming impact of organic and conventional fluid milk in Thailand. The findings will provide the first reference for the sector based on global warming impact and extend for a number of different farms with the relative significance of environmental aspects in the near future of LCA analyses in Thailand.
Thus, this study aimed to assess and compare the global warming impact of organic and conventional dairy farms in Thailand through the production on sustainable products based on an LCA and development of circular economy models [28,29]. The evaluation focuses on resource use and emissions associated with milk production. The importance effects were the incorporation of activities data including feed, utilities, chemicals, pharmaceuticals, detergents, waste treatment, transportation, and livestock emissions when assessing the environmental impact from GHG emissions. In addition, the results can provide the recommendation for future improvement in practices for conventional food sources of protein, especially for a scientific basis in the whole fluid milk production chain.

2. Materials and Methods

LCA is the method in compliance with the International Organization for Standardization (ISO) [30] which is widely used to evaluate and compare the environmental performances of products during their supply chain. LCA is a highly acknowledged and comprehensive approach in considering the global crisis to assess GHG emissions across dairy production, especially in the processing of fluid milk. Enteric fermentation and manure management emissions are estimated using equations by the Intergovernmental Panel on Climate Change (2006) [31] in the study of GHG emissions. The methodology references for emissions calculations for fluid milk production, including farm operations and housing emissions, are reported in Table 1. The International Dairy Federation or IDF methodology [32] was applied as a standard in considering the allocation and functional unit within a specific dairy LCA study for consistency.

2.1. LCA Goal and Scope

The goal of this study is to assess and compare the global warming impact of fluid milk production obtained from organic and conventional farms. The system boundaries for milk production from cradle-to-farm gate for organic and conventional fluid milk considered in this study are shown in Figure 1 and Figure 2, respectively. All direct operation on farm activities, including animal feed (total mixed ration, pasture, and mineral), utilities (electricity, fuels, and water), chemicals, pharmaceuticals, livestock emissions (enteric fermentation and manure management), waste management, and transportation emissions, were considered. The analysis also included indirect emissions from the production of synthetic-chemical fertilizers and pesticides, as well as the processing of feed growing and purchasing. Synthetic-chemical fertilizers and pesticides were avoided for organic farms (Figure 1; Supplementary File S1, Tables S1.1–S1.8) but employed in conventional farms (Figure 2). For milking hygiene, chlorine solution was performed for teat disinfectants pre-milking in organic farms, while lukewarm water was used in conventional farms.

2.2. Functional Unit

The functional unit of 1 kg of fluid milk refers to fat and protein of the corrected milk (FPCM), with 4.00% fat and 3.30% protein for both organic and conventional fluid milk [33,34]. The LCA at the stage from cradle-to-farm gate was used for assessing environmental impact assessment, particularly the global warming impact, of organic and convention farms at periods of 103 month and 70 months, respectively.

2.3. Data Sources and Assumptions
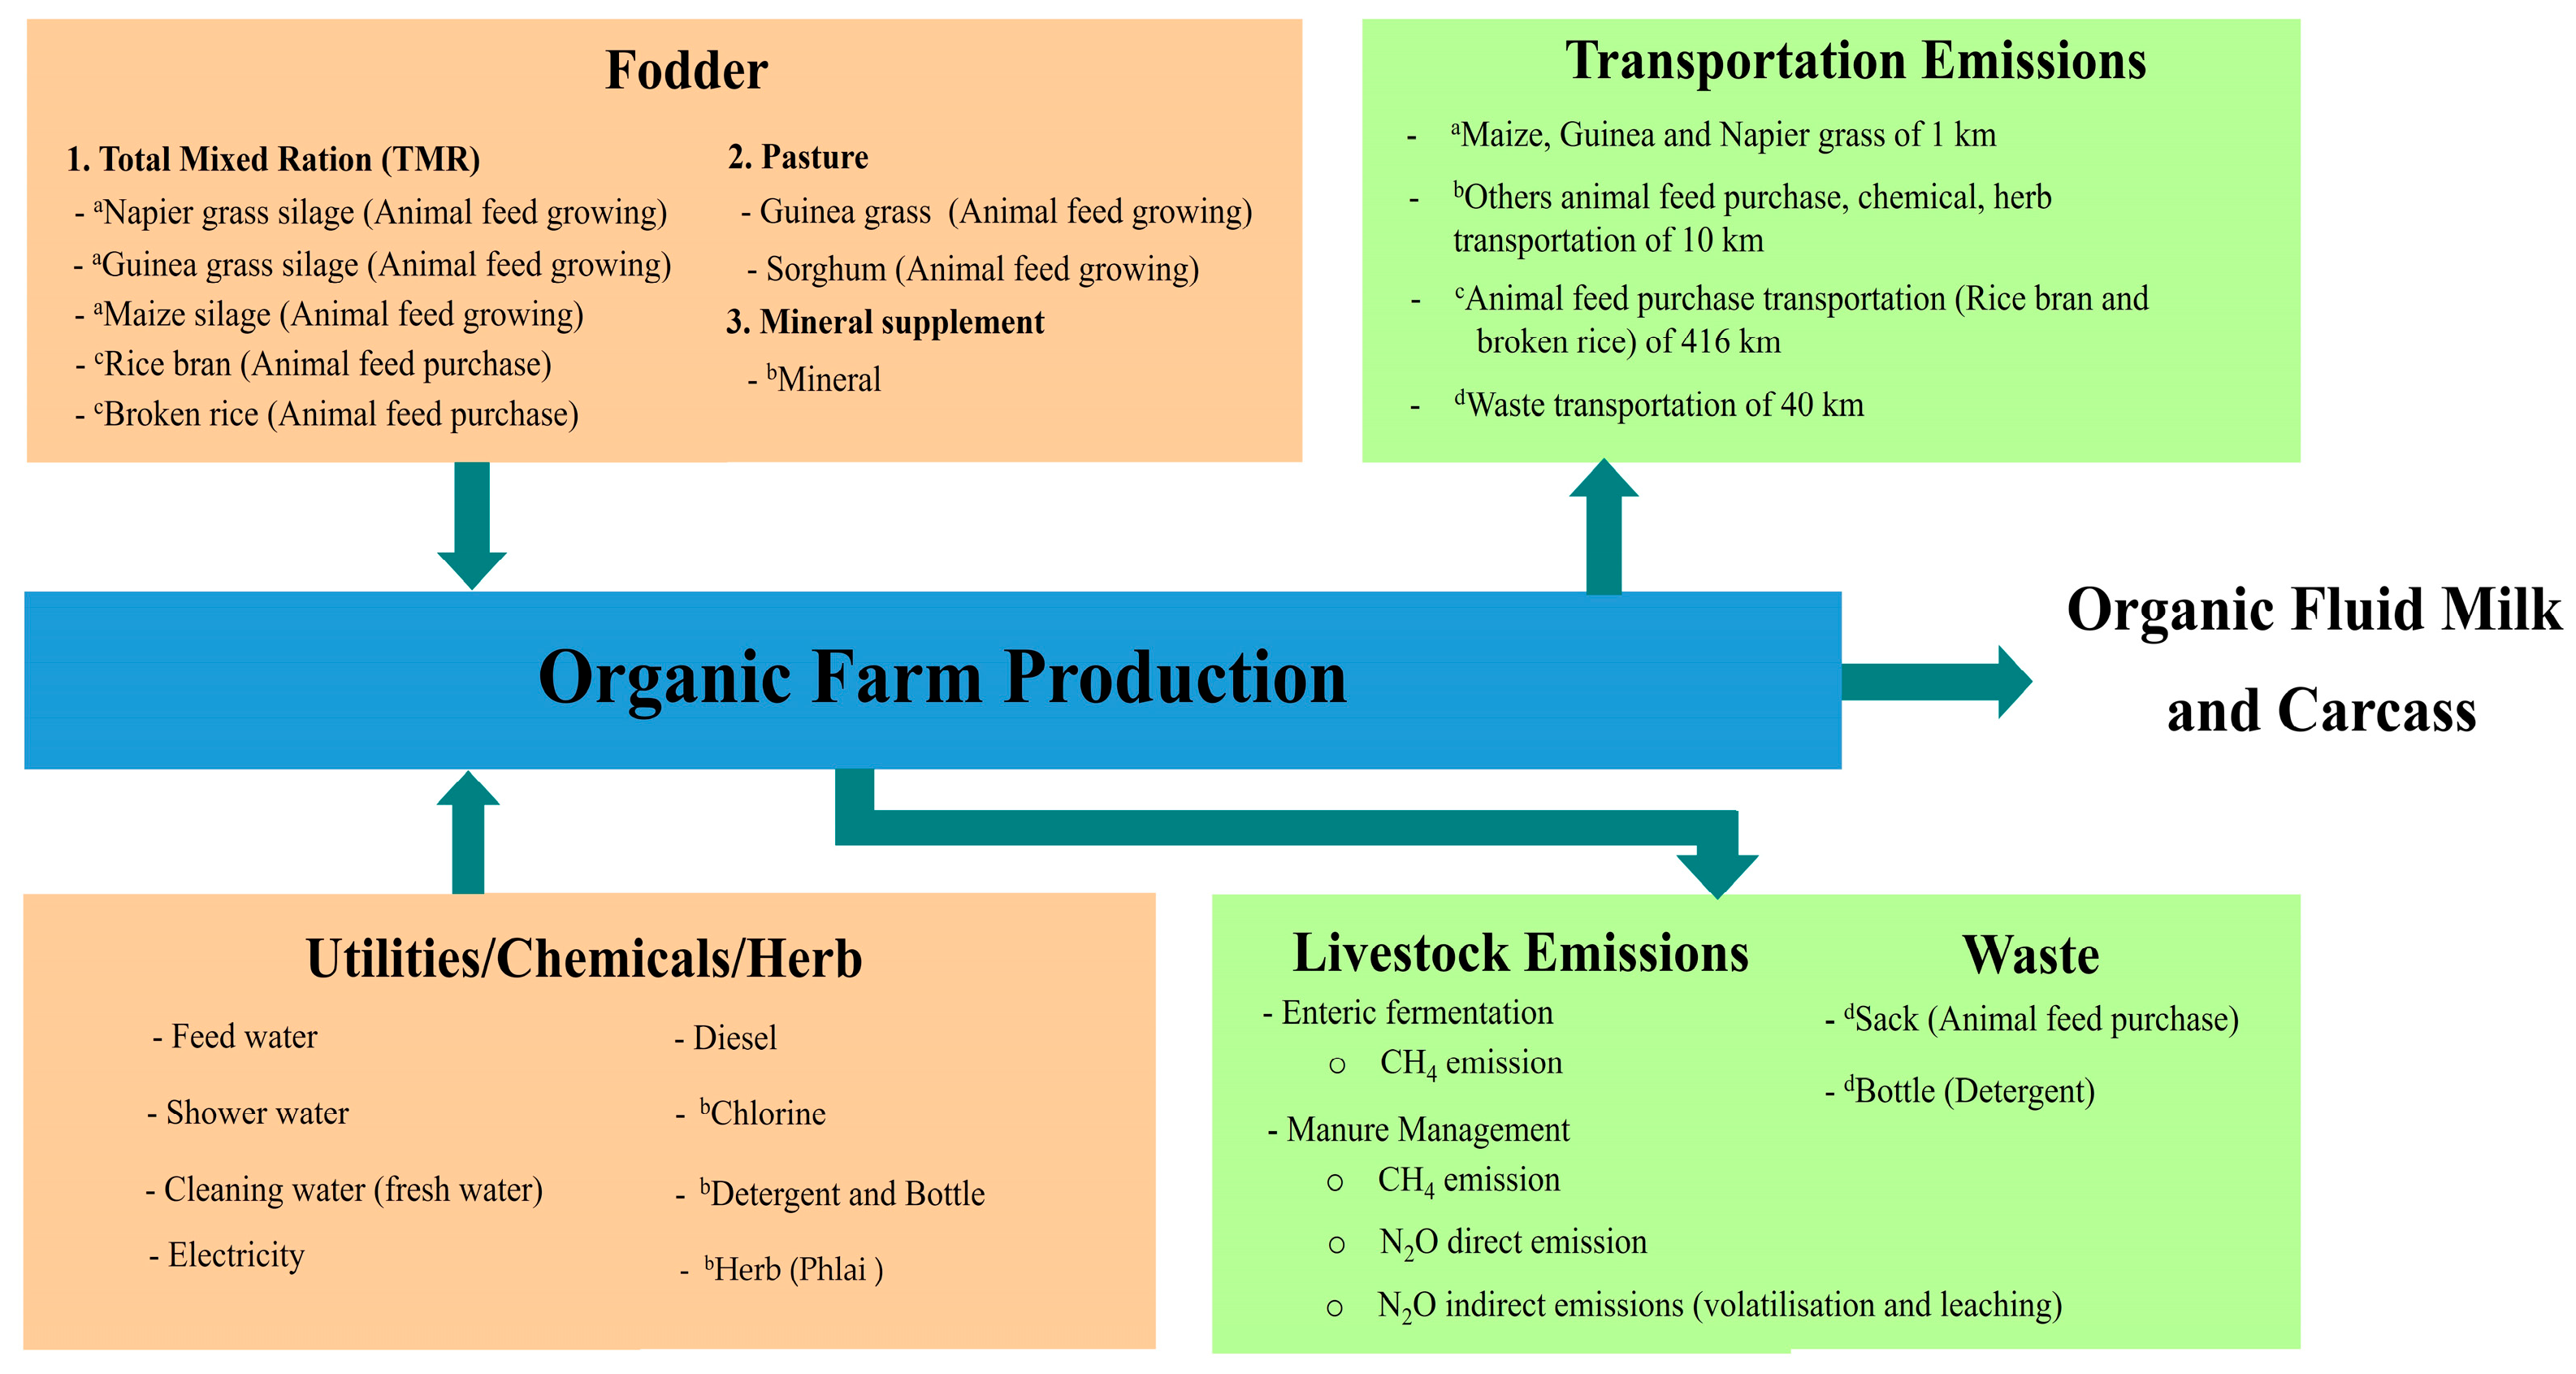
The study was carried out with secondary data on Thailand dairy cattle of two farm productions. Data on milk farming and the life cycle information for both organic and conventional farming were collected from Saraburi and Nakhon Ratchasima provinces in the upper central region of Thailand for the years 2019–2021 [35,36]. The limitations of this study are the shortcomings that arise from relying on these two farms. This is due to the selected organic farm which complied fully with controlled and certified organic standard milk in Thailand. Moreover, the quality of raw milk from the conventional farm is specifically in line with the accepted standard. The main data sources for this study are reported in Table 2. The life cycle inventory (LCI) data of the milk production systems, based on 1 kg and 1 kg FPCM from both organic and conventional farms, are reported in Table 3 [33,34,35,36].

2.3.1. Organic Farm

The organic farm is located in Saraburi province (14°31 N’; 100°54′ E), 108–420 m above sea level [45]. It can be considered a large size for Thailand conditions [46]. All the animals were Holstein Friesian (140 cows). In total, the herd included 25 lactating cows. Details of feeds, liveweights of cows, and fluid milk products of the organic farm are presented in Figure 1. The data for the organic farms were collected using the LCA tool for a period of 103 months [35,36].
Feed for organic cows consisted of unconfinement and confinement feeding of 0.7% and 99.3% (see Supplementary File S1, Tables S1.1–S1.7), respectively. The data of organic feeds were guinea grass (with and without human control), napier grass, maize, and sorghum. The data of total mixed ratio (TMR) processing are reported in Supplementary File S1, Table S1.10. The organic TMR was obtained from the mixing 60% ensile roughages (i.e., napier grass and maize fermentation and guinea grass) with 40% concentrate (i.e., rice bran and broken rice) feeds of 40%, respectively. The organic TMR feed composed of napier grass fermentation (25%), maize fermentation (25%), guinea grass (10%), rice bran (20%), and broken rice (20%). Due to lack of previous LCI study on organic sugarcane and molasses in Thailand, this study assumes that the productions of sugarcane and molasses would be a conventional process and reported in Supplementary File S1, Tables S1.8 and S1.9. However, the amount of conventional molasses was performed (0.625% of organic TMR feed) under the level of organic livestock based on the Thai Agricultural Commodity and Food Standard for Organic Agriculture [46] which should provide the amount of organic feed least 90%.
The amounts of resource requirements (i.e., feeds, water, electricity, diesel, chlorine, detergents, herb, and waste) for organic milk operations are reported in Supplementary File S1, Table S1.18. To minimize residues or bacterial levels in milk and keep them raised without antibiotics for organic farms, chlorine solution and detergent was used for pre-milking and cleaning raw milk equipment. This study considered all water operations including drinking water, washing of cows, and cleaning water. Note that a previous LCA study assessed only drinking water [47]. The average organic fluid milk production was in the amount of 21,489 kg per head and the liveweight entire life cycle (0–103 months) of the organic cows was reported in Supplementary File S3, Table S3.1. The first cycle started from newborn calves (0–3 months), calves (4–12 M), heifer cows (13–15 months), pregnant cows (non-lactating 16–24 months), and non-pregnant cows (lactating 25–26 months). The second cycle included and started from pregnant cows (lactating 27–33 months), pregnant cows (non-lactating 34–35 months), non-pregnant cows (lactating 36–37 months), …, and the final cycle (at eight cycle) presented the pregnant cows (lactating 93–99 months), pregnant cows (non-lactating 100–101 months), and non-pregnant cows (lactating 102–103 months).
Feeds, detergent, herbs, and waste involved in fluid milk production were transported by 4-wheel trucks and 10-wheel trucks [43]. This study presumed that the plantation area of organic feeds (guinea grass, napier grass, and sorghum) are sufficiently located close to the location of dairy cow housing and assumed to be transported by 4-wheel trucks through a round-trip distance of 2 km. Detergents, herbs, and other feeds (organic maize) from a domestic source for fluid milk production were transported through a round-trip distance of 20 km. The main sources of organic rice bran and broken rice from the organic rice farmers’ group management of the Khaw Khunkha Chawna Khunatham Ban Non Sai Ngam Community Enterprise in Yasotho province were assumed to be transportation by 10-wheel trucks through round-trip distance of 832 km. Wastes (sacks and bottles) collected from farm were transported to the disposal site for further treatment by 6-wheel trucks through a round-trip distance of 80 km [44]. The combination of waste management for plastic were considered in terms of 87% recycling and 13% landfilling [44].

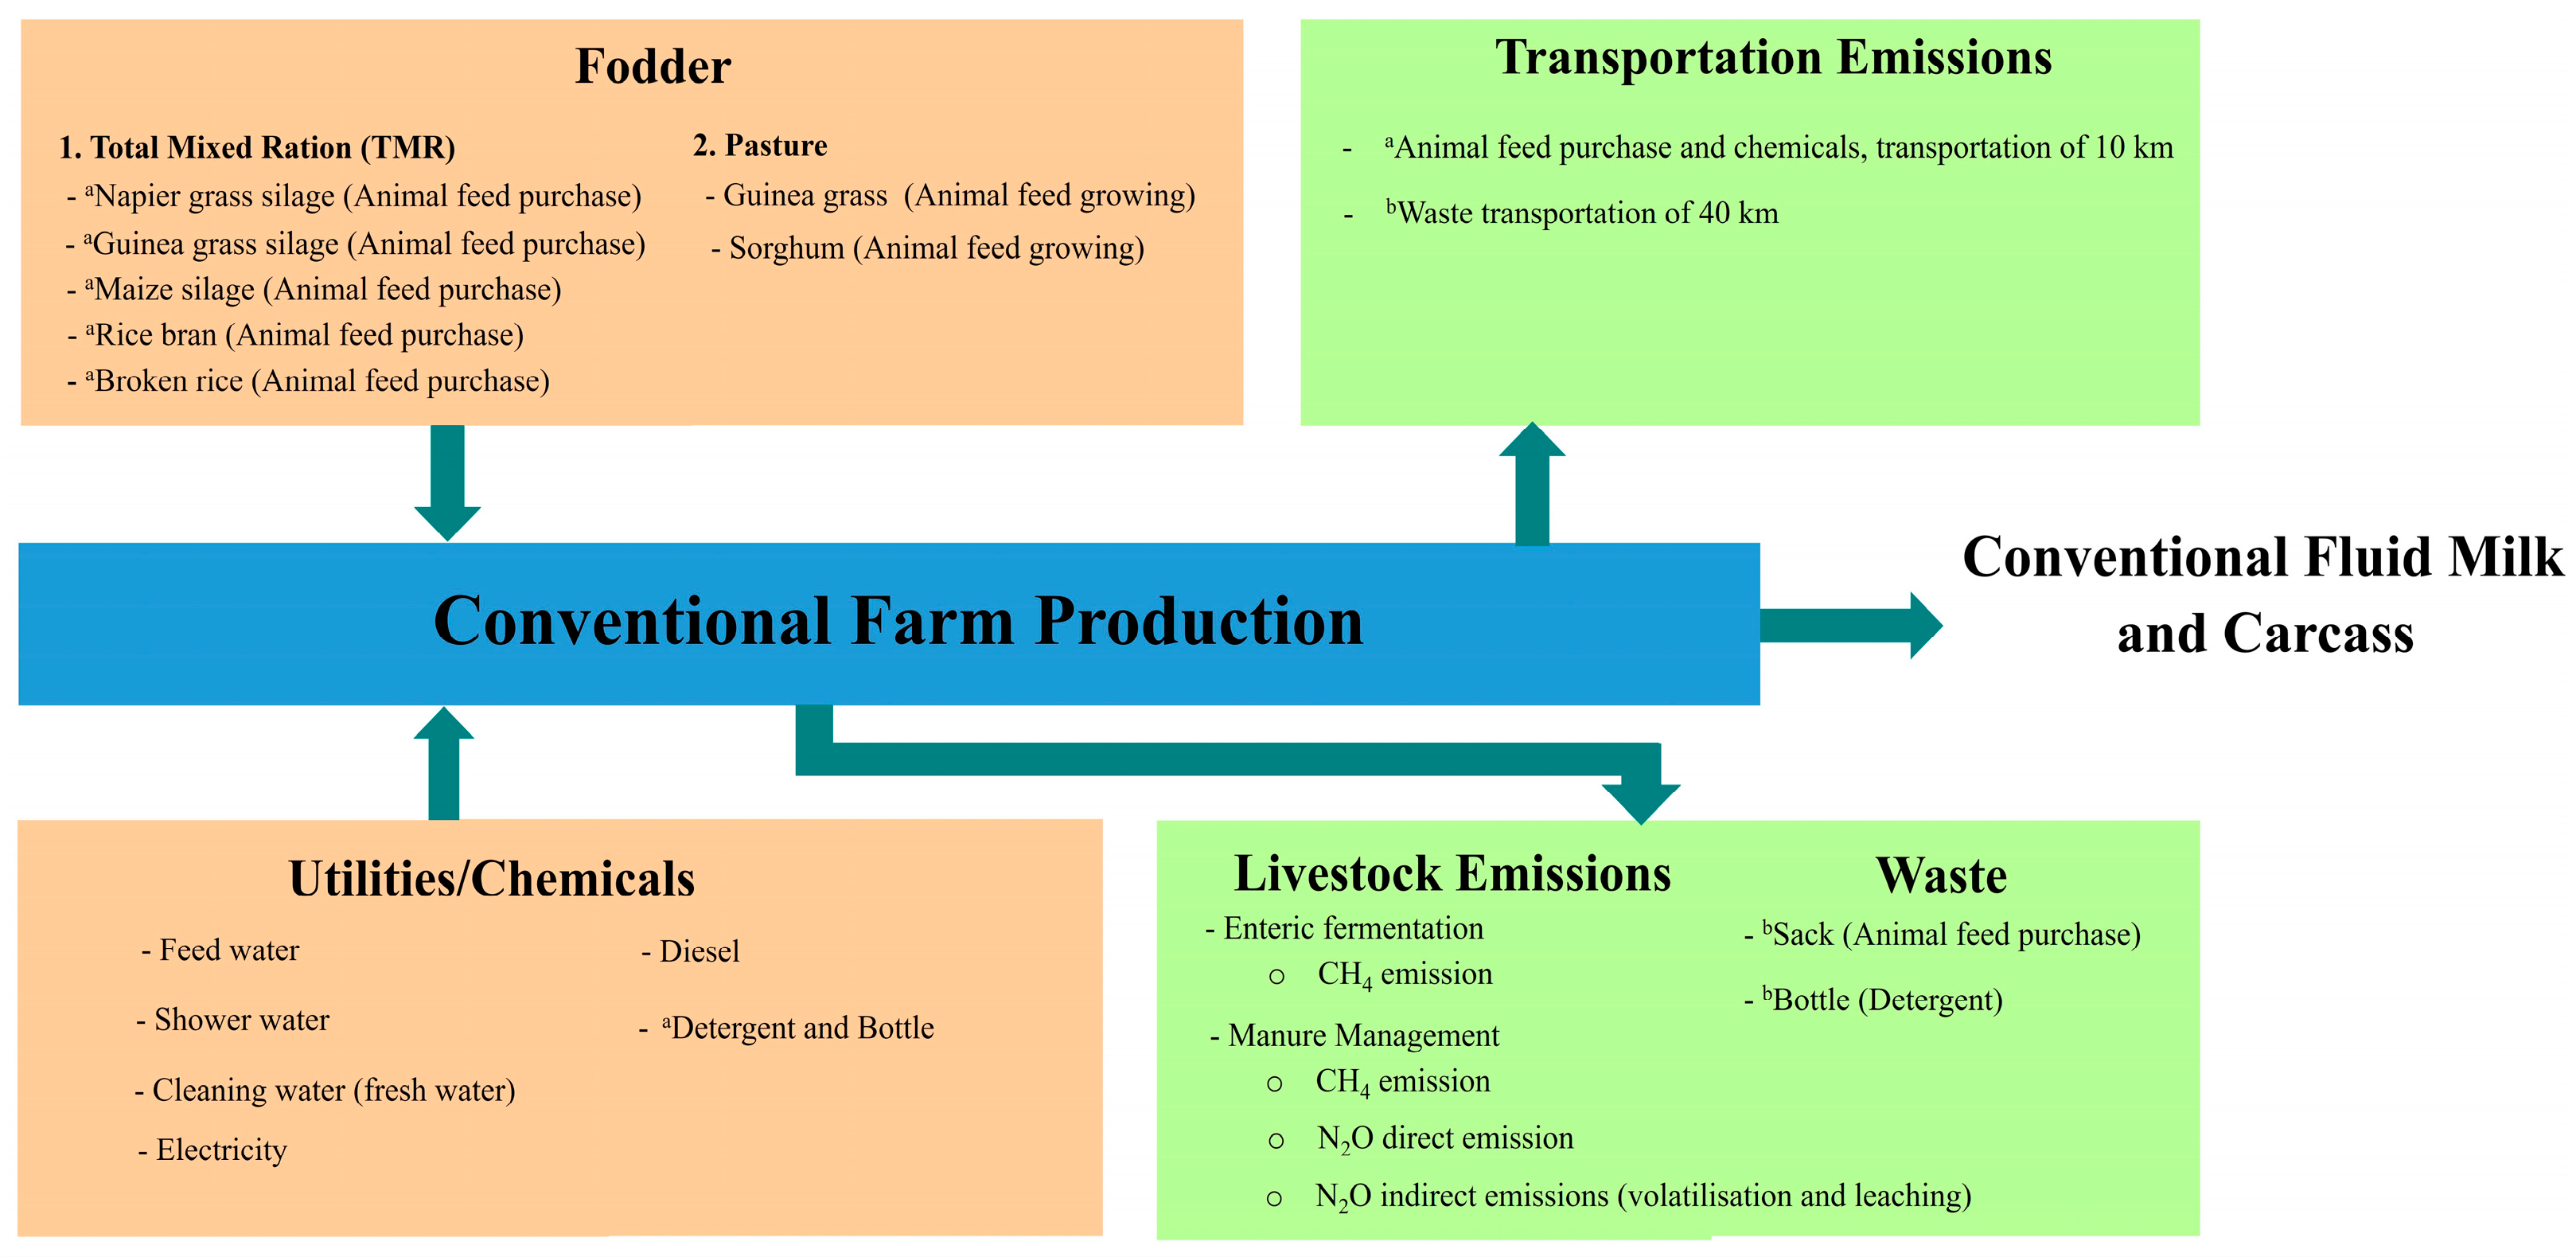
2.3.2. Conventional Farm

The conventional farm is located in Nakhon Ratchasima province (14°24′ N; 101°25′ E), 187 m above sea level [48,49]. The conventional farm can be considered of medium size for Thailand conditions [46]. The farm bred 51 Holstein Friesian cows. The number of lactating cows was 28 on the total herd. Information on the conventional farm (see Figure 2), including feed, liveweight of cow, and fluid milk product, is presented as follows. The analysis using the LCA tool for site-specific data of conventional farm should be evaluated carefully at 70 months. Similarly, the diet consisted of unconfinement and confinement of 98.7% and 1.3% (see in Supplementary File S1, Tables S1.11–S1.17), respectively. The compositions of organic and conventional TMR feeds were identical. The information of conventional feeds i.e., guinea grass, napier grass, sorghum, and maize were collected from secondary data relative to a plantation area in Thailand [36,39,40]. The resource requirements for the conventional farm were similar to those for the organic farm, except for herb. Pre-milking was performed with water and the milking equipment was carried out with detergent. The LCI data were reported in Supplementary File S1, Table S1.18. The average milk yield and liveweight (0–70 months) of conventional cows were 22,392.91 and 420 kg per head, respectively, as reported in Supplementary File S3, Table S3.2. All purchases of detergent and feeds were assumed to be transported by 10-wheel trucks through a round-trip distance of 20 km. The information regarding waste transportation and waste treatment for the conventional farm were definitely similar to the organic farm.

2.3.3. Assumptions

The assumptions for the life cycle impact assessment (LCIA) in this study are summarized as follows:
Buildings, machinery, and medicine were not included [50].
Change in soil carbon was not included [51].
The study used the environmental impact according to IDF [33], specifically the amount of energy used for meat production and milk productions. The allocation factor of milk obtained from this approach was 0.85.
The environmental impact of vaccine, particularly conventional farm, was not included because of lack of specific emission factor.
The CO2 emissions from livestock respiration and manure were avoided because the net CO2 emissions are assumed to be zero [31,52].
The calves and heifers were assumed to be from 0 to 12 months and from 13 to 24 months, respectively.
For both organic and conventional farms, the portion of manure was managed in conditions of 50% daily speed and 50% solid storage [35,36]. The feeding situation was unconfinement and confinement [35,36].

2.4. Global Warming Impact

Towards an LCIA step, the global warming impact was selected in this study of midpoint impact to evaluate and identify the environmental performance of two types of fluid milk from their LCI data. Furthermore, the enteric fermentation and manure emissions were evaluated from the production system during the housing stage and involving parameters [24]. The global warming potential (GWP) impact of fluid milk was accounted for according to the IPCC Fifth Assessment Report (AR5), using characterization values of a 100-year time horizon. This approach has the relative values of 1 for CO2, 265 for N2O, 30 for fossil CH4, 28 for CH4, and 23,500 for SF6 [53]. To achieve the goal and scope of this study, the summation of global warming impact of each fluid milk was evaluated from all resources used on farm and housing emissions by using Equation (1). The GWP of farm operations, i.e., feeds, utilities/chemicals, transportations of raw materials and waste, and waste treatment, were calculated using Equation (2). The GWP from housing, including enteric fermentation (methane emission) and manure management (methane and nitrous oxide emissions) from cattle, can be examined by using Equation (3).
GWPFuid milk_i = GWPFarm operation_i + GWPHousing_i
GWPFarm operation_i = GWPFodder_i + GWPUtilities_i/Chemicals_i + GWPTransportation_i + GWPWaste treatment_i
GWPHousing_i = GWPEnteric fermentation_i + GWPManure management_i
where GWPFuid milk_i is the total global warming impact of fluid milk from each farming system (organic and conventional) in terms of kg CO2 equivalent/kg PFCM, i is the types of farming, GWPFarm operation_i is the total global warming impact from each farm operation, GWPHousing_i is the total GHG emissions from enteric fermentation and manure management, GWPFodder_i the total global warming impact of the productions of agriculture, ensile roughages, and TMR from each farming system, GWPUtilities_i/Chemicals_i is the total global warming impact from the use of electricity, water, and chemicals, GWPTransportation_i is the total global warming impact from transportations of animal feed purchase, chemicals, and waste disposal, GWPWaste treatment_i is the total global warming impact from waste packaging treatment, GWPEnteric fermentation_i is the total global warming impact of methane emissions from enteric fermentation according to digestive process of ruminants, GWPManure management_i is the total global warming impact of methane (CH4) and nitrous oxide (N2O) emissions from manure management, including direct N2O emissions released into the atmosphere, indirect N2O emissions to atmosphere due to volatilization of N, and indirect N2O emissions from N leaching.

3. Results and Discussion

3.1. Global Warming Impact Assessment

The global warming impact of farm operations and housing emissions of organic and conventional farms, considering with and without IDF allocation, are shown in Figure 3. As can be seen from Figure 3, the global warming impacts of fluid milk production obtained from the conventional farm were 1.253–1.474 kg CO2 equivalent/kg FPCM, which was 1.89 times lower than the organic farm (2.366–2.783 kg CO2 equivalent/kg FPCM). Considering the organic farm, feed production was the leading source of global warming impact, contributing 33.41% of the total impact. CH4 emissions, including enteric fermentation and manure management, were the second largest source, contributing 33.19% of the total impact. The following were the use of utilities (electricity, water, detergents) in housing and N2O emission, contributing 23.85% and 8.63% of the total impact, respectively. Similarly, the most important contribution to the total global warming impact of the conventional farm was CH4 emissions (54.35%), followed by feed production (29.07%), N2O emissions (8.89%), and housing (7.38%), respectively. The transportation stage had the smallest share of global warming impact (0.305–0.922%) for both organic and conventional farms. The global warming findings of our study were in line with findings by Berton et al. (2021) and Famigilietti et al. (2019) [54,55] who reported that about 45% and 55–68% of the total global warming impact were from enteric fermentation, respectively.
Comparing the global warming impact of feed production, the organic feed showed higher global warming values (0.79–0.930 kg CO2 equivalent/kg FPCM) than the global warming of conventional feed (0.364–0.429 kg CO2 equivalent/kg FPCM). This difference was primarily due to the global warming impact of organic feed obtained in this study (0.210 kg CO2 equivalent/kg feed), which was higher than the global warming impact of conventional feed (0.117 kg CO2 equivalent/kg feed). Moreover, the average feed input to produce 1 kg of FPCM in the production of the organic farm was 4.2356 kg (dry weight), whereas a kg of FPCM in the production of the conventional farm was 3.7393 kg (see Table 3). These findings are in line with the results studied by Daneshi et al. (2014) [56], who highlighted that the plantation stage was the importance effect for the higher global warming impact from milk production.
The global warming impacts obtained from the operation stage of the organic farm (0.564–0.664 kg CO2 equivalent/kg FPCM) were 83.60%, which was greater than that of the conventional farm (0.093–0.109 kg CO2 equivalent/kg FPCM). This difference is primarily due to the higher consumption of chlorine and detergent in organic farming, which is required for cleaning raw milk equipment while avoiding livestock vaccination [57]. In this study, the amount of chlorine and detergent used in the organic farm was 0.492 kg/kg FPCM, moderately higher than that in the conventional farm (3.243 × 10⁻⁴ kg/kg FPCM). Furthermore, chlorine usage contributed the most to GHG emissions in the operation stage of organic farming (0.5041−0.5930 kg CO2 equivalent/kg FPCM), accounting for 89.5% of the total global warming impact. This was followed by energy consumption (electricity and diesel) at 10.04%, water use at 0.44%, and waste treatment at 0.02%. For the conventional farm, the highest global warming for the operation stage corresponded to energy used (electricity and diesel) with the values of 0.0646−0.0760 kg CO2 equivalent/kg FPCM or contributing 69.49% to the total global warming impact, followed by water used (28.00%), waste treatment (2.21%), and detergents used (0.30%).
The global warming impacts obtained from the housing stage of the organic farm (0.989–1.164 kg CO2 equivalent/kg FPCM) were 19.90% higher than that of the conventional farm (0.793–0.932 kg CO2 equivalent). The high growth rate, liveweight, and number of cycles (Supplementary File S3, Tables S3.1 and S3.2) on the basis of FPCM output was 1 kg. From Equation (3) and Figure 3 and Figure 4, enteric fermentation (CH4 emission) and manure management (CH4 and N2O emissions) were responsible for 61.81% and 38.19% in the conventional farms, while in the organic farms were 64.14% and 35.86%, respectively. The results are provided to improve manure management practices to reduce CH4 (Supplementary File S2, Equation S2.3) and N2O (Supplementary File S2, Equations S2.5−S2.7) by managing manure from conditions of daily speed and solid storage in driers and reducing storage time. However, methane emissions from enteric fermentation (Supplementary File S2, Equation S2.1–S2.7) increased as the default EF in the guideline and feeding situation (unconfinement and confinement).
Considering the transportation stage, the GHG emissions of organic farms were 0.0218−0.0257 kg CO2 equivalent/kg FPCM, whereas for the conventional farm, they were 0.0038−0.0045 kg CO2 equivalent/kg FPCM. The 10-truck transportation of rice bran and broken rice (0.7178 kg/kg FPCM) of organic feed were the main cause of impact which accounted for 94.628% of the total impact during the transportation stage for the organic farm. The long distance of over 400 km for the organic feed transportation also resulted in increasing GHG emissions. This result was crucial to acknowledge and address the relationship between feed transportation and sources for organic farm practices that become a promising system with the ability to reduce global warming impact.
In conclusion, farm activities which mainly affect global warming impact were feed production and CH4 emission. In the organic farm, where the amount of required feed was higher (4.487 kg/kg FPCM), the CH4 emissions accounted for 33.19%. Otherwise, in the conventional farm, the biggest contribution was associated CH4 emissions (54.35%) while feed production accounted for 29.07%. These findings emphasize the need for targeted mitigation strategies to reduce emissions in both farming systems.

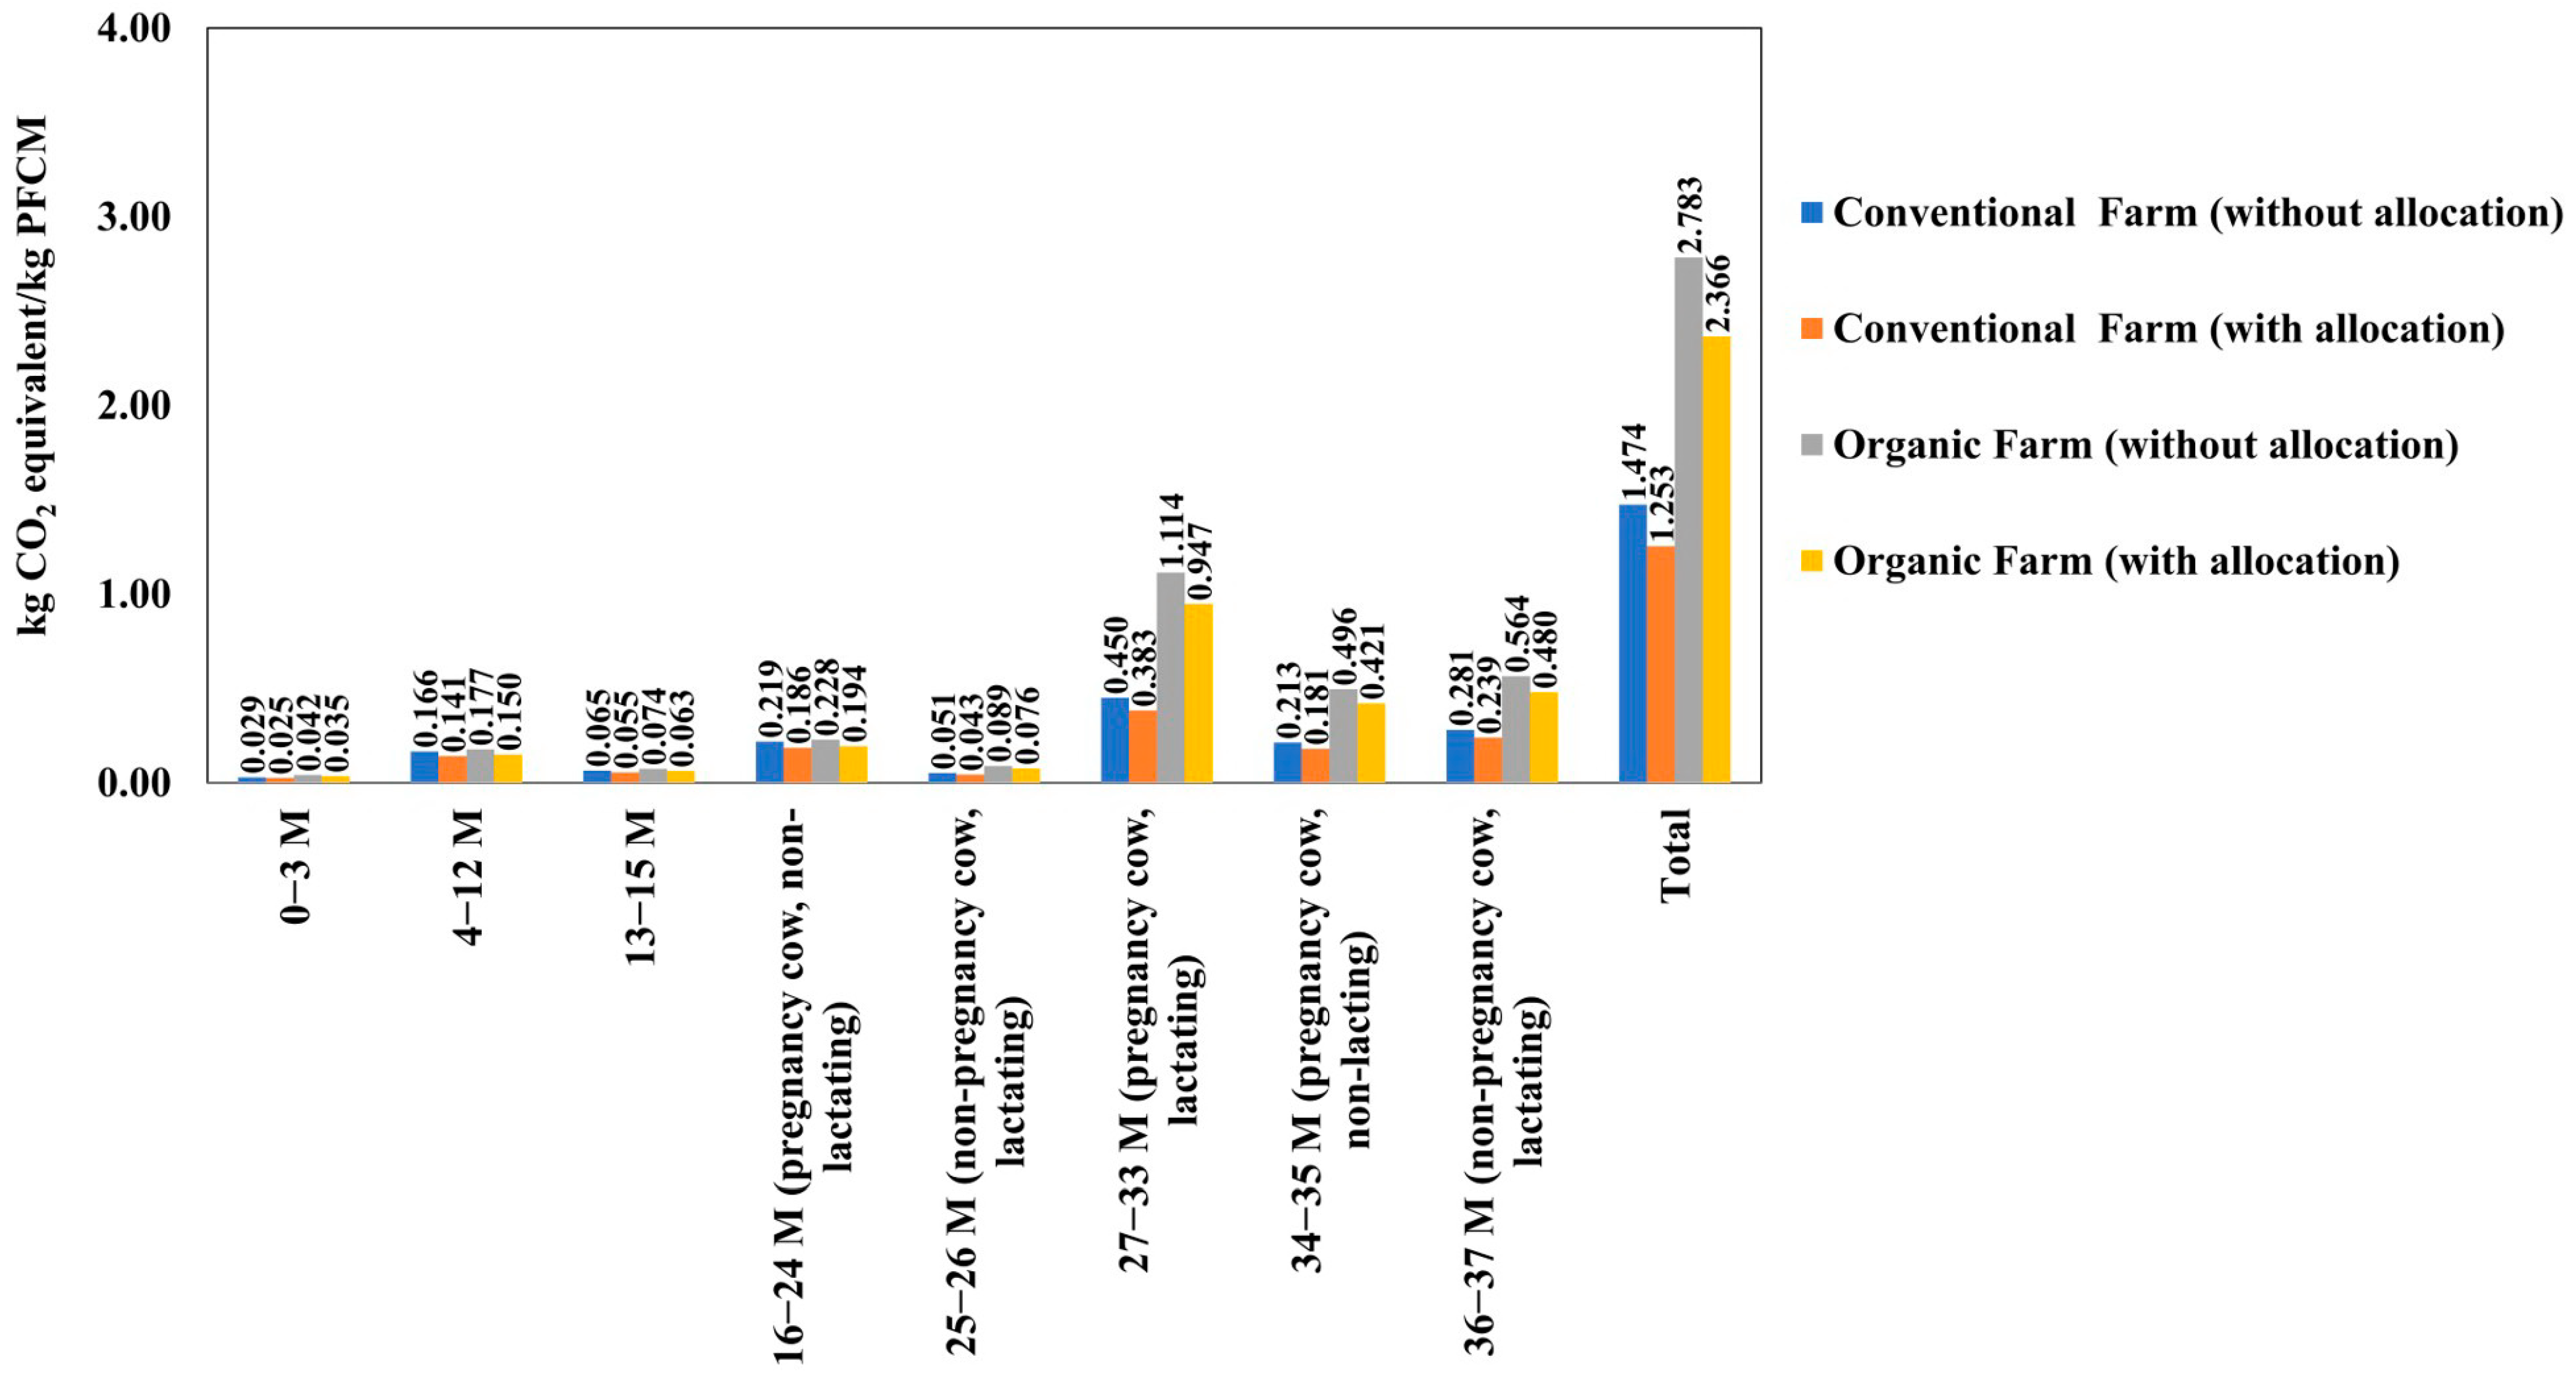
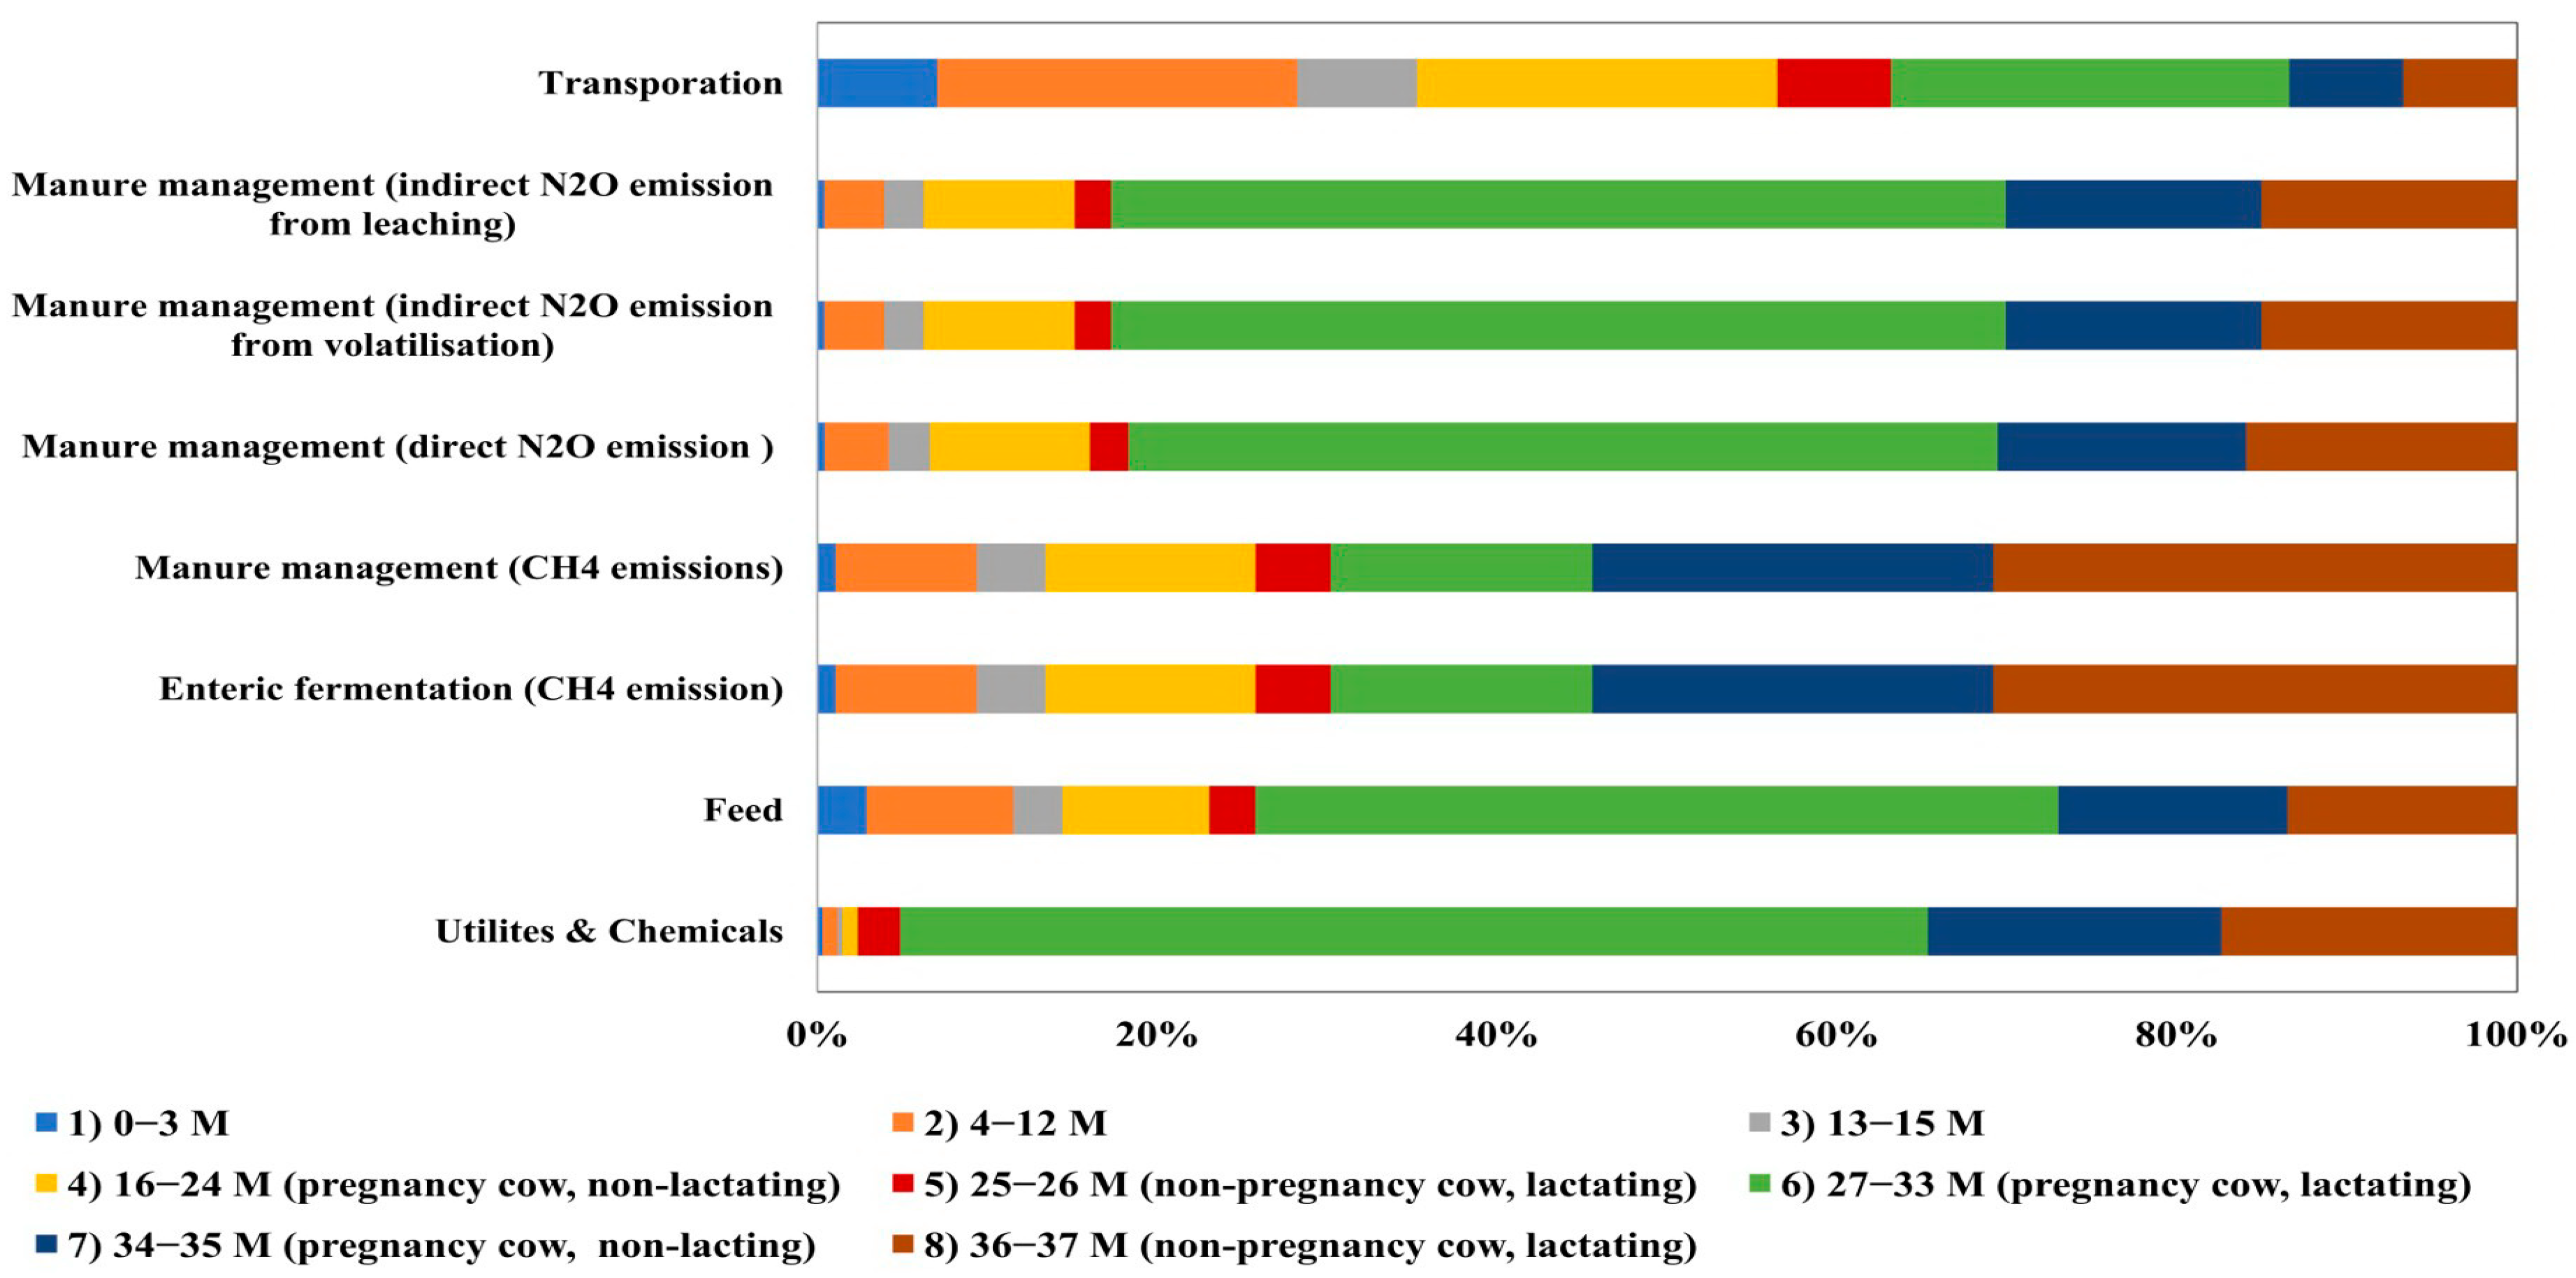
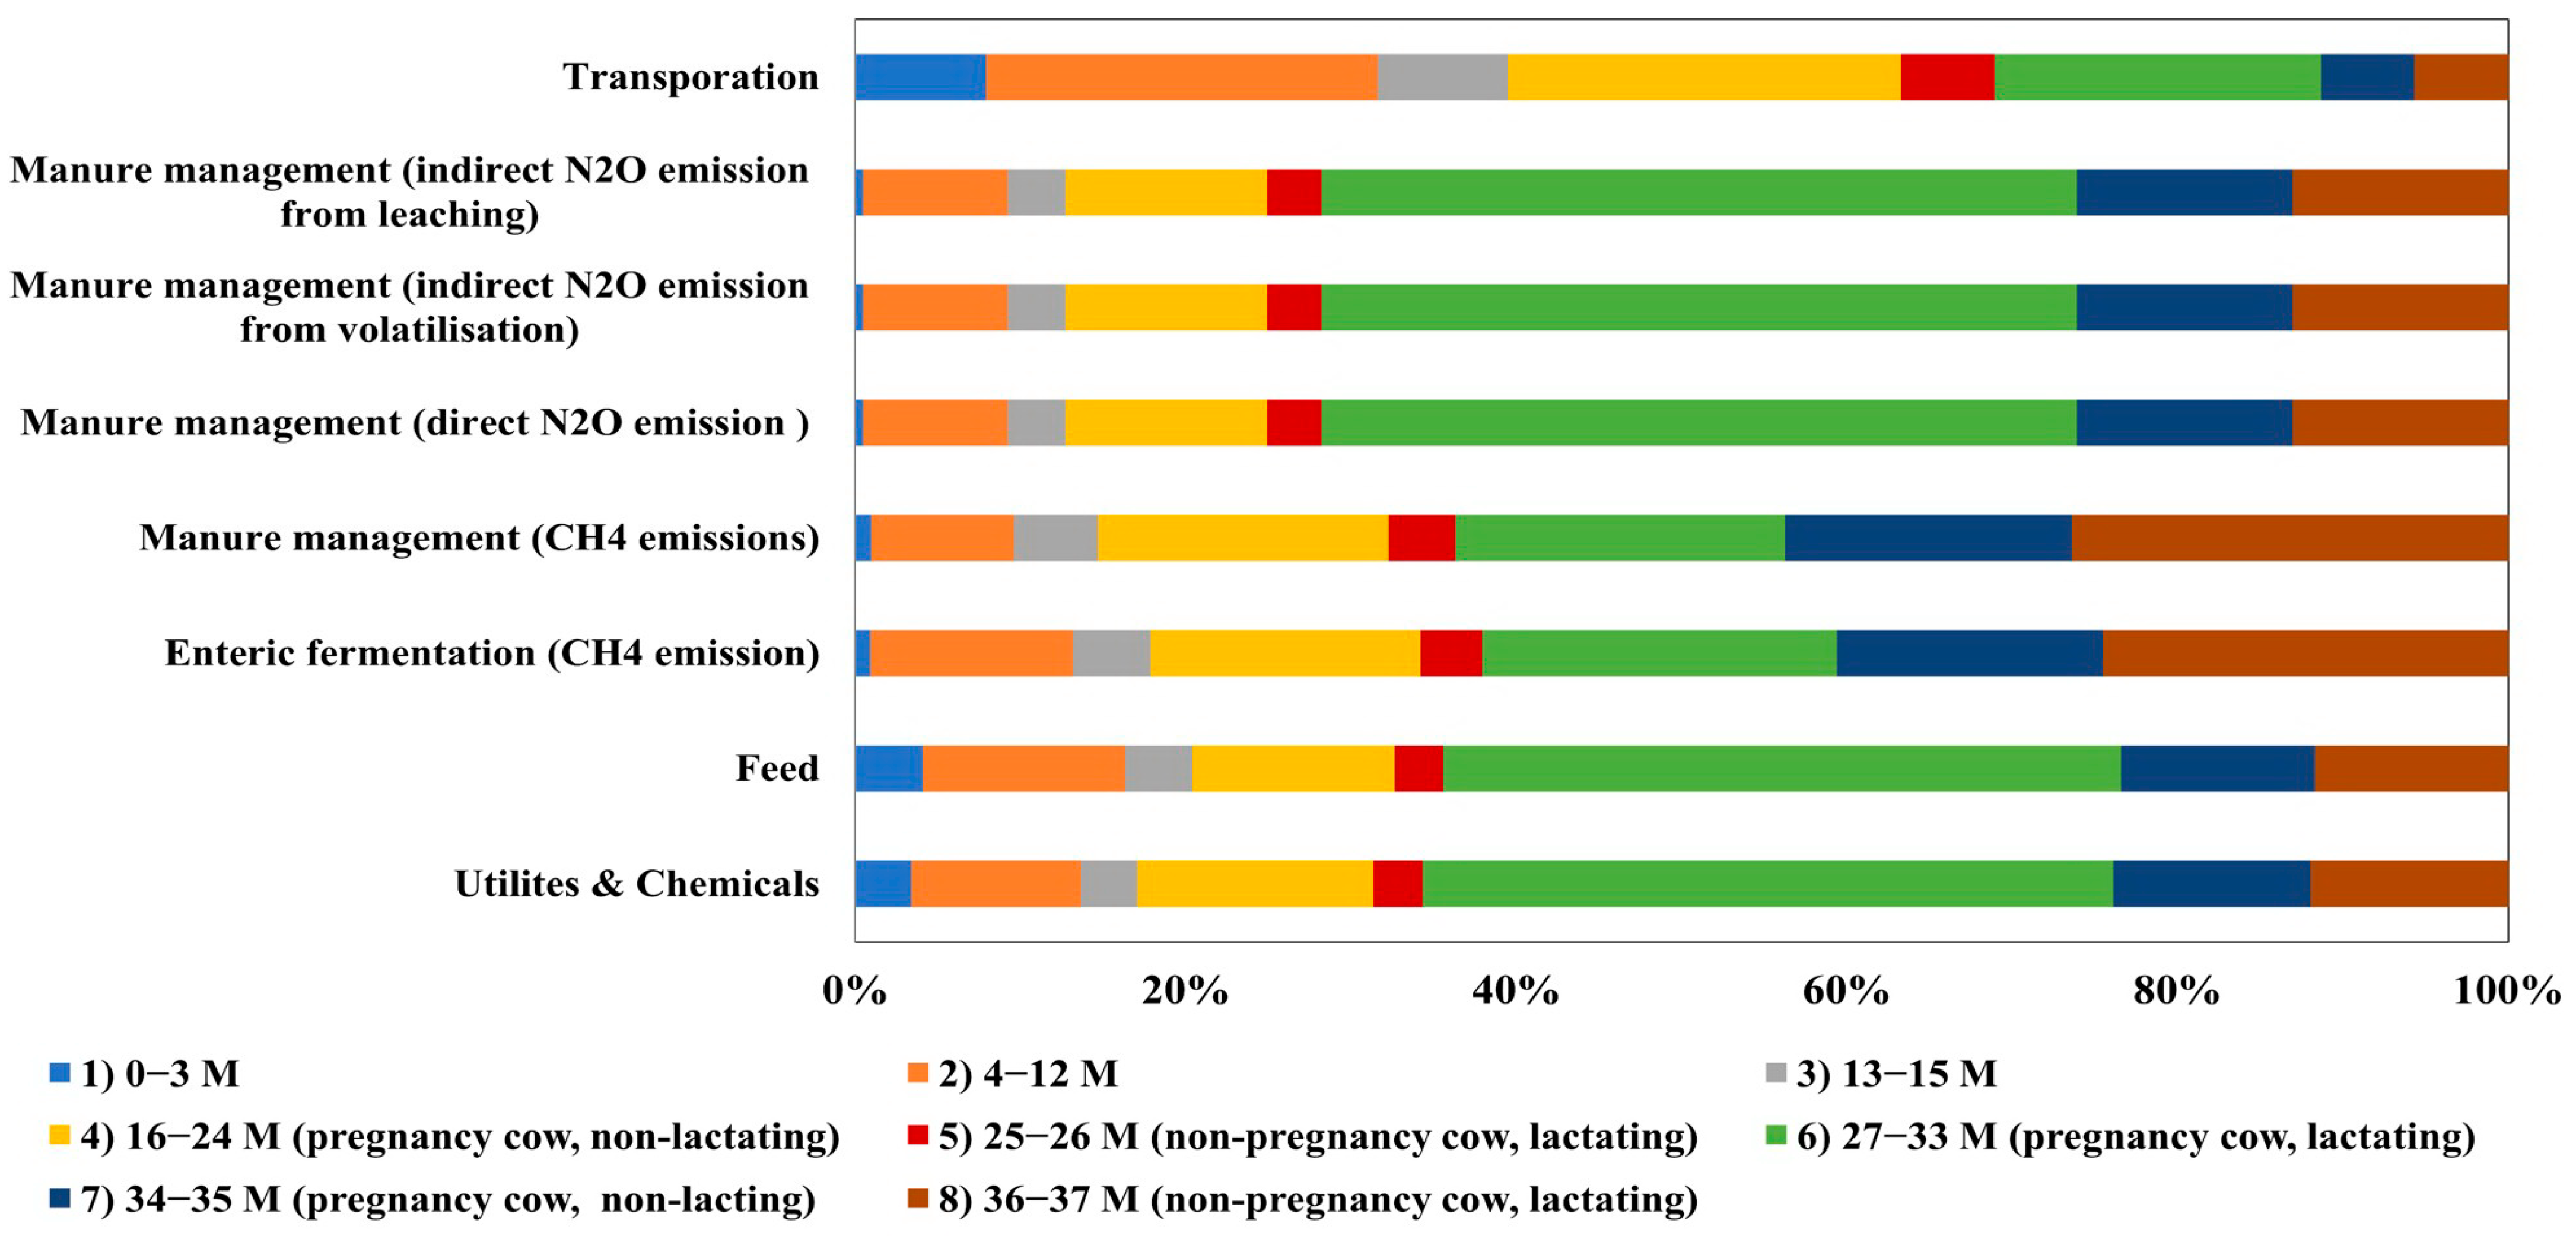
3.1.1. Contribution of Different Animal Categories

The global warming of milk products can be divided into different animal categories in their lifetimes. The basis of kg FPCM output was 1 kg, the analysis of global warming of milk products for different stages of organic farm considering with and without IDF allocation is shown in Figure 4. Figure 5 and Figure 6 show the contribution analysis results of different animal categories, farm operations, and housing emissions of organic and conventional farms.
For organic farming, lactating cows for both pregnant and non-pregnant cows (see Supplementary File S3, Table S3.1) mainly contributed to the GHG emissions of 1.502–1.768 kg CO2 equivalent/kg FPCM (with and without IDF allocation) or about 63.506% of the total global warming impact (see Figure 5). This value was mainly according to the high amount of feed consumption of 33.380%, followed by farm operation (30.172%), CH4 emissions (26.451%), N2O emissions (9.462%), and transportation (0.535%). Pregnant cows or non-lactating cows were responsible to the second high share of global warming impact by 25.991% (0.6149–0.7234 kg CO2 equivalent/kg FPCM with and without IDF allocation). Meanwhile, the largest contribution was from CH4 emissions at 45.916% of the total global warming impact, and the smallest contribution was from transportation at 0.989%. For other categories, calves and heifers contributed 10.503% to the total global warming impact (0.2485–0.2923 kg CO2 equivalent/kg FPCM with and without IDF allocation), with the highest values found in feed consumption (45.853%) and CH4 emissions (42.408%).
In conventional farming, the highest global warming impact corresponded to lactating cows for both pregnant and non-pregnant cows (see Supplementary File S3, Table S3.2) with the GHG emissions of 0.665–1.768 kg CO2 eq/kg FPCM (with and without allocation) or contributing 53.092% to the total global warming impact. This was primarily due to CH4 emissions by 33.380% and feed consumption by 30.481% contributing to the total global warming impact (see Figure 6). The global warming impact of conventional farming for pregnant cows or non-lactating cows (0.3667–0.4314 kg CO2 equivalent/kg FPCM with and without IDF allocation) was relatively low (40.371%) compared with that of organic farming. The main global warming impact assessment of conventional farming for pregnant cows was from CH4 emissions (61.579%) and feed consumption (23.801%). The similar results were observed during the calves and heifers period because of a small lower amount the global warming impact for conventional farming than organic farming by 0.0273–0.0321 kg CO2 equivalent/kg FPCM. The highest GHG emissions were caused by CH4 emissions (52.219%) and feed consumption (33.579%).
The results of our study for both organic and conventional farms agree with the findings of Baldini et al. (2018) [58], who explained that 58–83% of the global warming impact was from the stages of lactating cows. The highest was found in a large amount feed consumption.

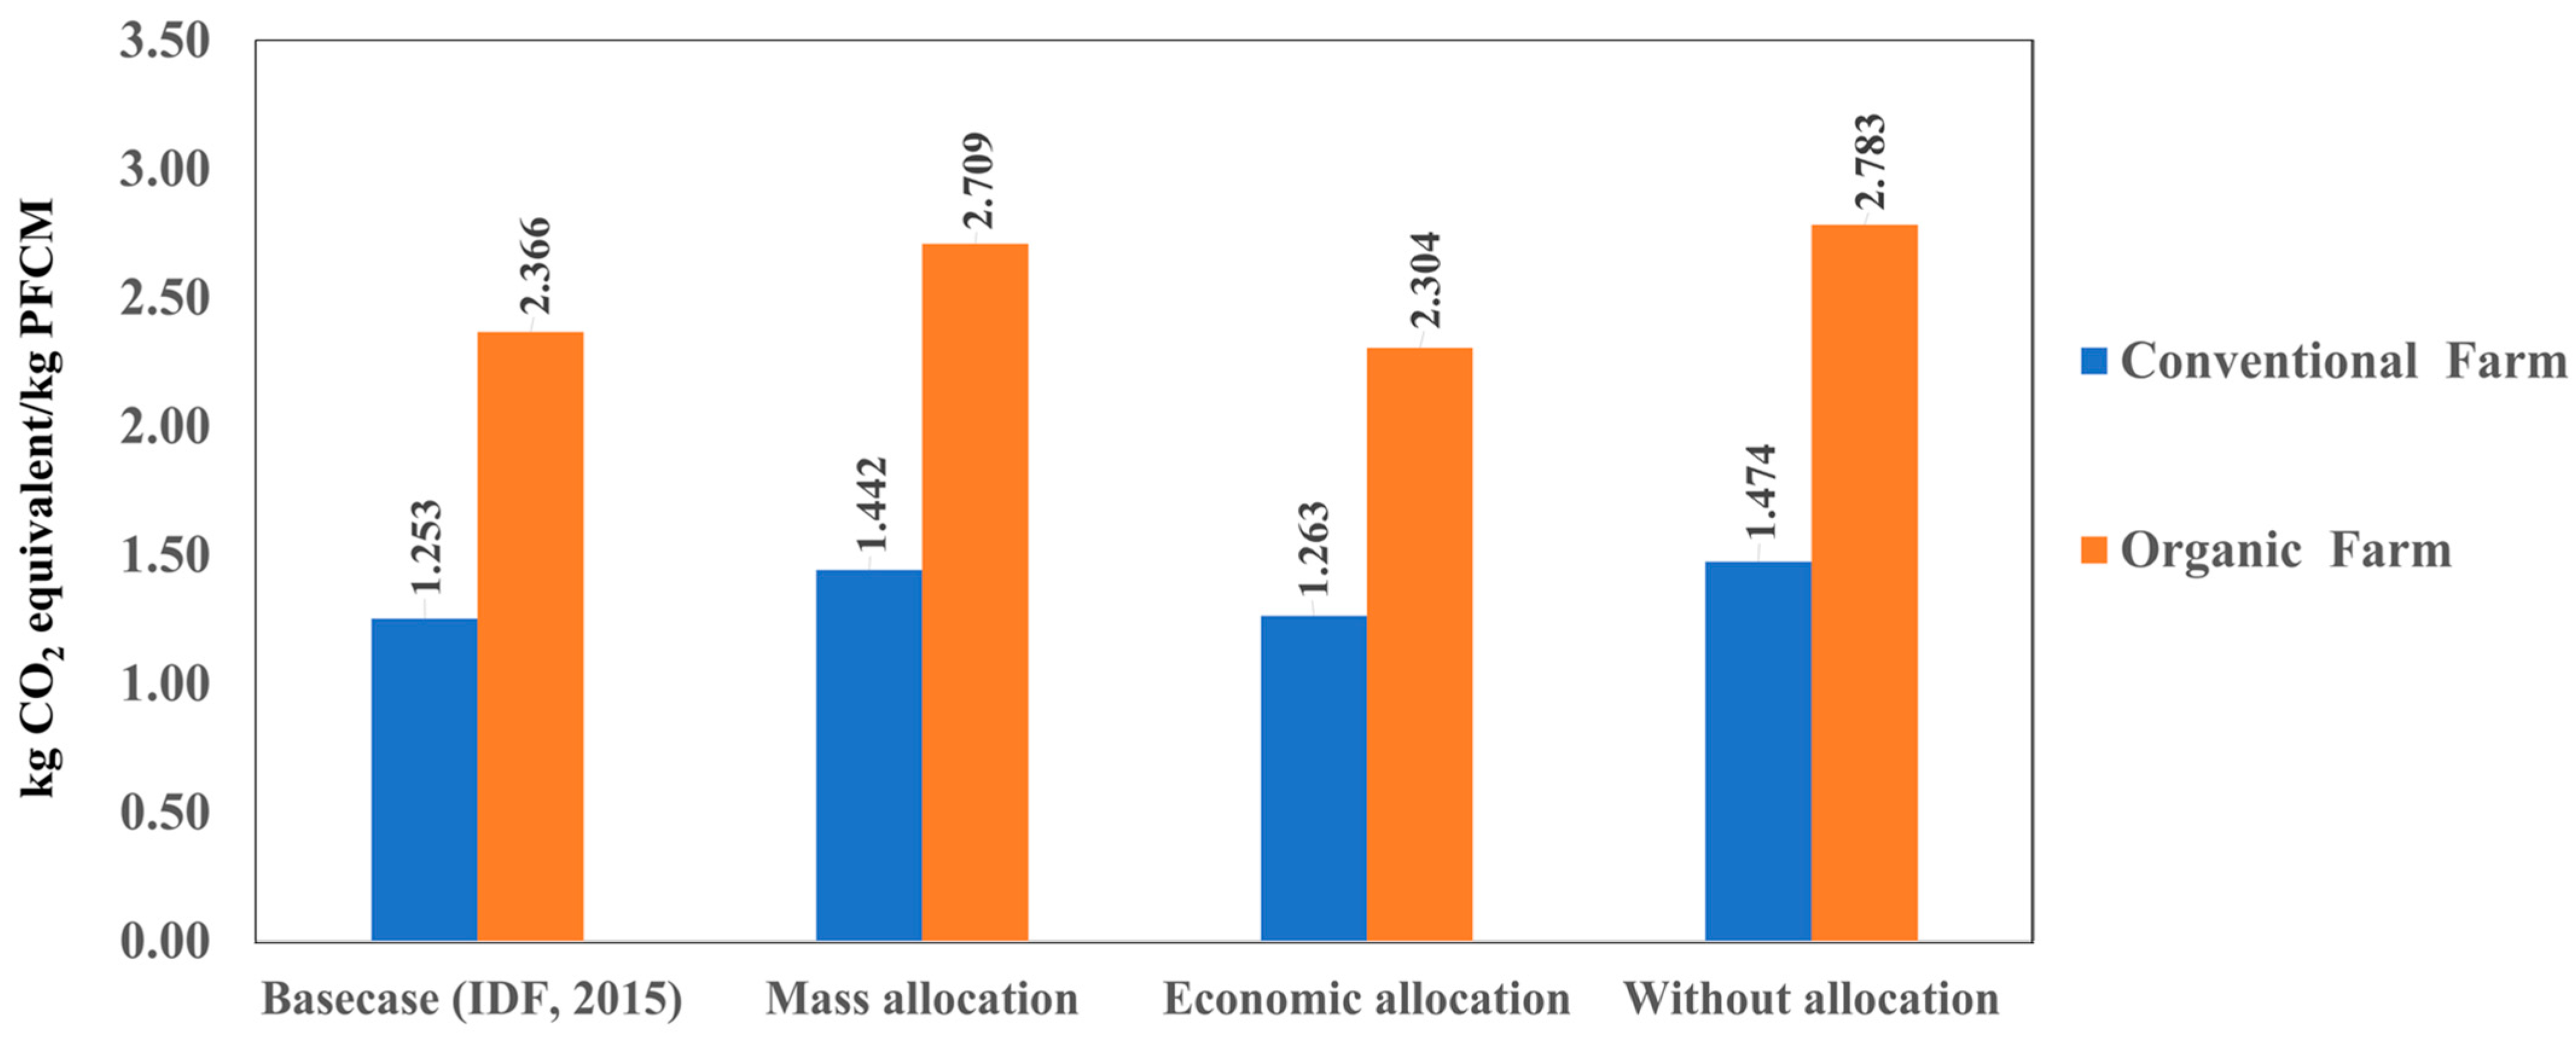
3.1.2. Scenarios Analysis

The prices and allocation results of fluid milk and carcass are reported in Table 4. The main output products were fluid milk (17,638.17 kg FPCM for organic farm and 18,380.10 kg FPCM for conventional farm) and carcass (487.20 kg for organic farm and 409.25 kg for conventional farm). The variation of allocation factors, which allocated the global warming impact of the product and co-products based on their biological [33], mass, market, and no-allocation values at milk production, is presented in Figure 7 [32].
The final results were significantly affected by the consequence allocation method. This implied an increase in global warming impact based on mass, market, and no-allocation values at milk production by 0.762–15.00%, compared with that of the basecase. The mass allocation method had moderate effect on the results due to the high quantity of carcass (see Table 4). The global warming impact of organic and conventional farms in the case mass allocation was 2.709 and 1.442 kg CO2 equivalent/kg FPCM which were 12.652% and 13.107% higher than that of the basecase (IDF, 2015) [33], respectively. The economic allocation factor showed an insignificant effect on the global warming impact because of the prices of carcass and fluid milk in Thailand [59,60]. The interesting finding in this analysis showed the choice of allocation method and the distribution of the environmental result in LCA of milk production, particularly the case study in Thailand.

3.1.3. Sensitivity Analysis

The purchasing power and demand for organic product commodities in Thailand has been steadily increasing [26,61], because consumers have become aware of health and the environment [61]. As organic farming is economically feasible as an alternative to conventional farming, a sensitivity analysis was considered in terms of the combination of organic and conventional fluid milk production in Thailand in 2015–2021. Therefore, substituting traditional farming with organic farming, ranging from 10% to 50%, was evaluated. The scenario studies are proposed and presented in Table 5. The sensitivity analysis was carried out as presented in Figure 8. The findings indicated that the 10–50% annual change from conventional farm production to organic farm production in Thailand increased the global warming in fluid milk production by about 8–30%. This was due to the common challenges organic farms were confronted with, including lower yields, high amounts of feed consumption, and efficiency of manure management practices. Considering the diet and health benefits, the information obtained in this work provides a reference for the sector on global warming impact in order to identify opportunities for improvement towards a sustainable future for organic milk production in Thailand.

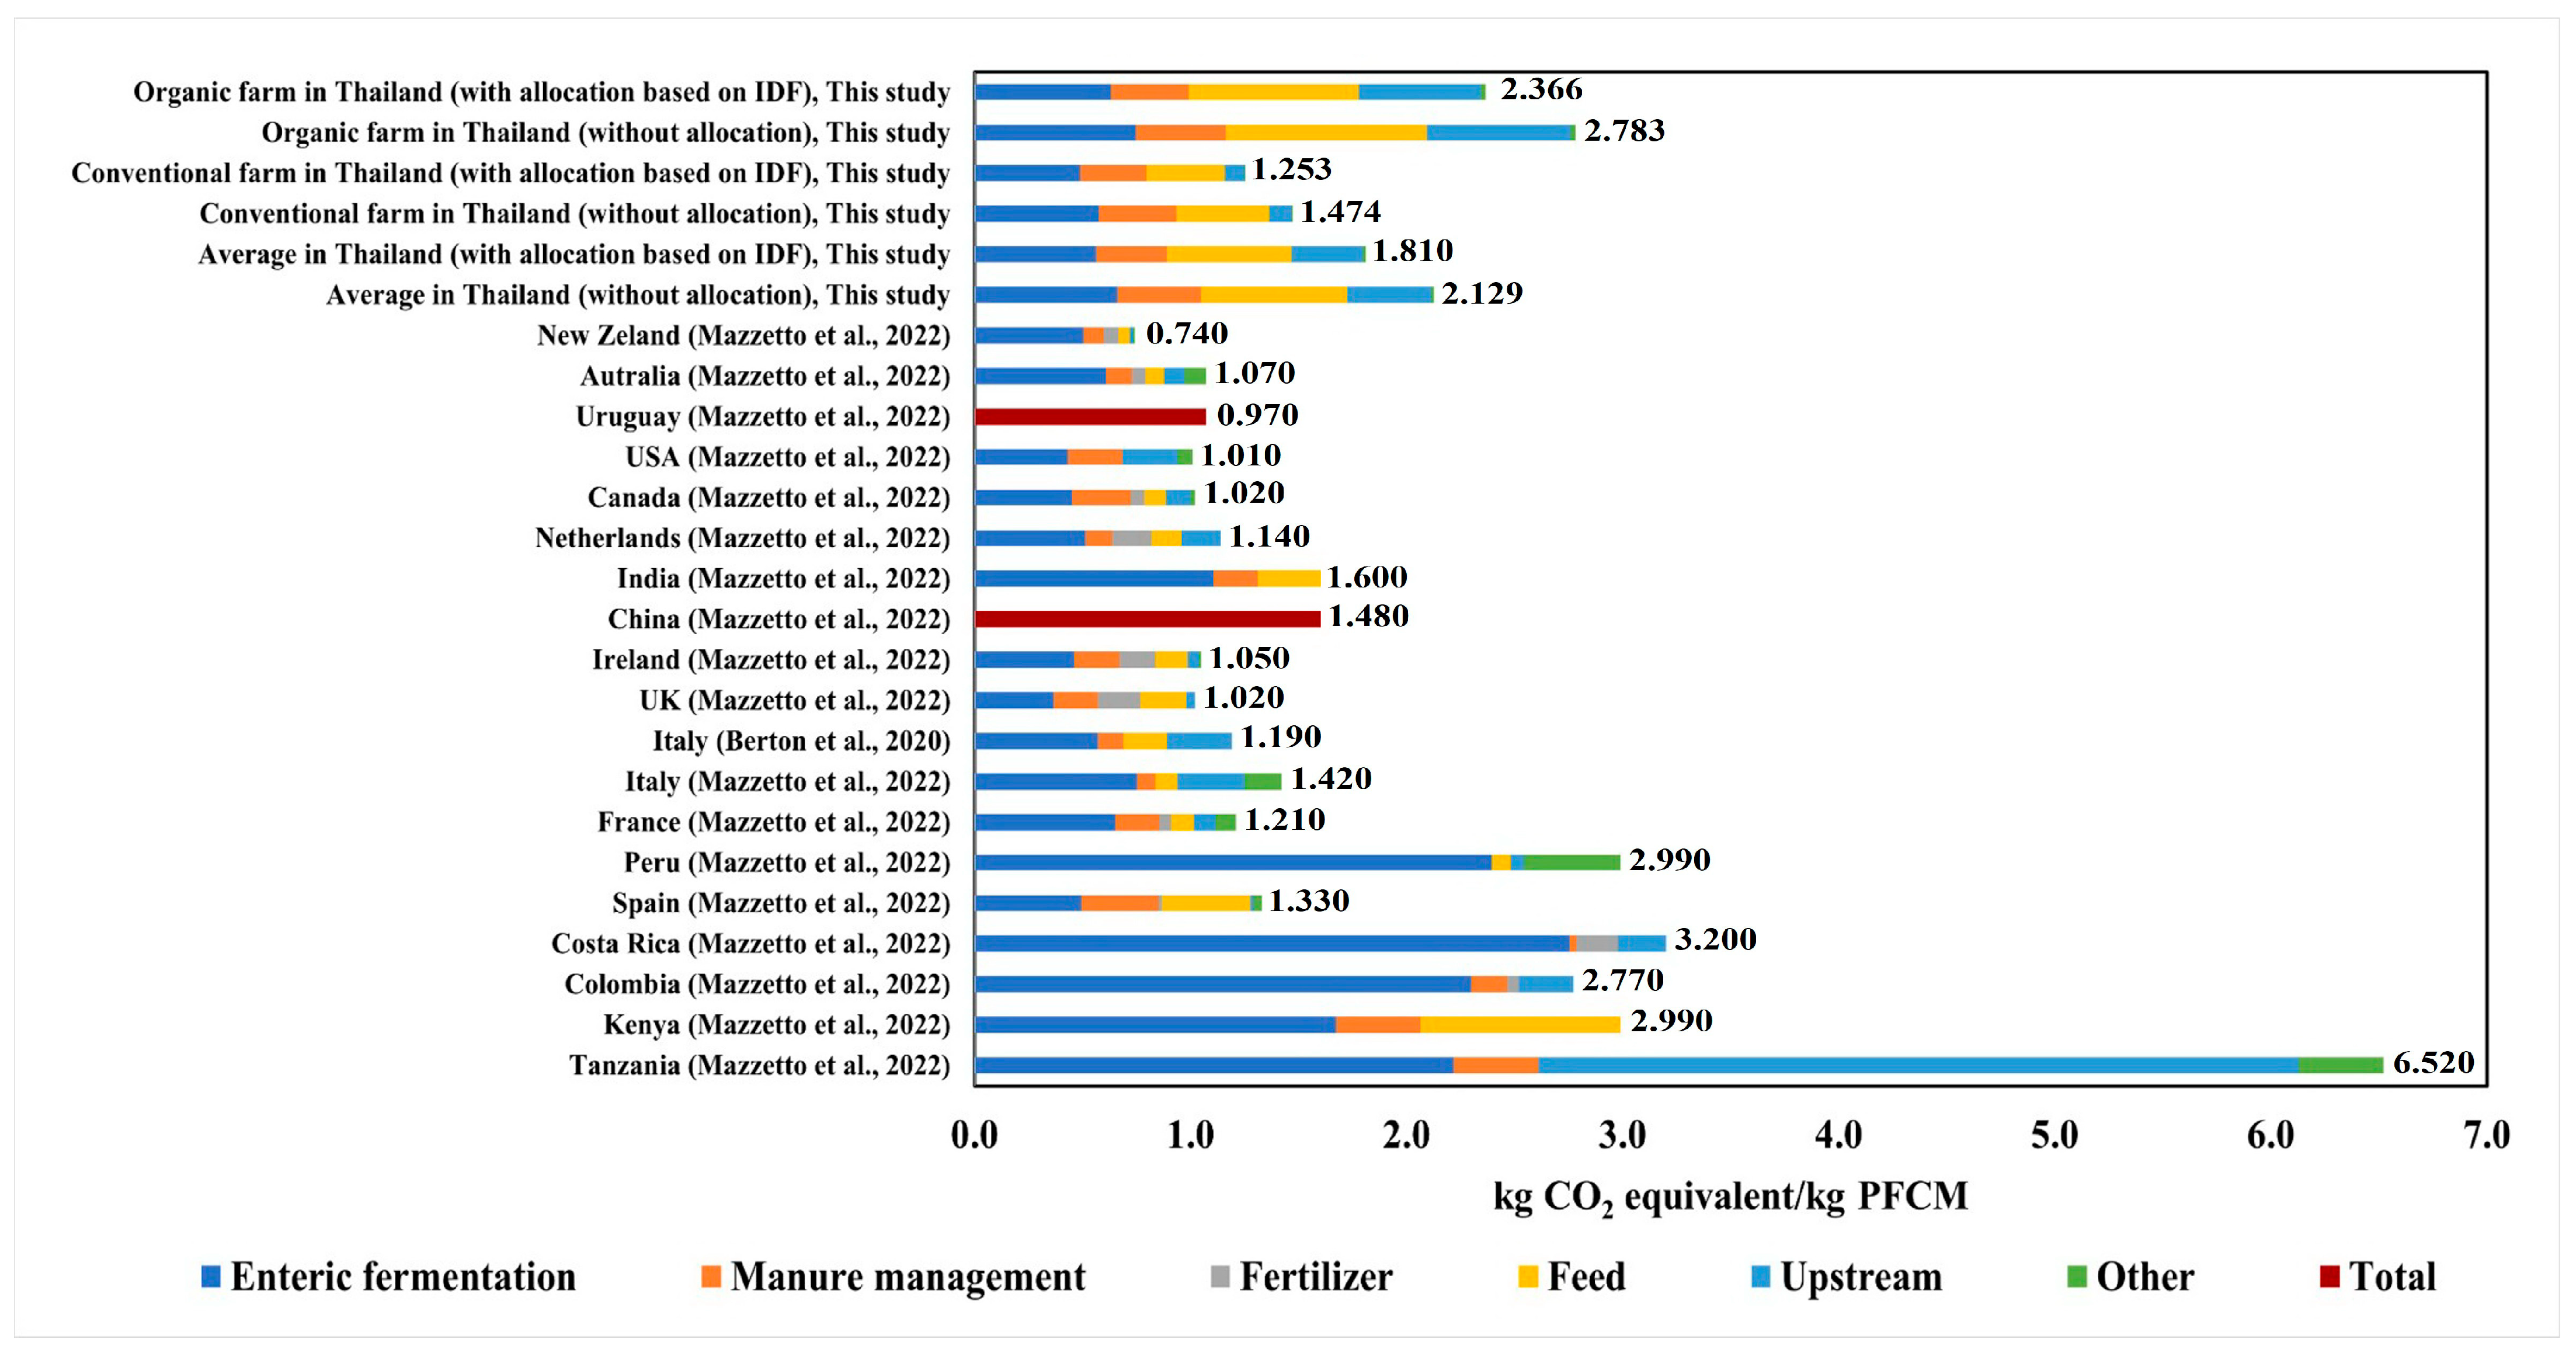
3.1.4. Comparison with Other Countries

The comparisons of previous LCA studies relating to dairy/livestock productions were difference in system boundaries, allocation methods, variations in livestock emissions calculation, other technical distinctions, the management and structure of the farms, climate, and physiography which had a considerable influence on the final results. The results of this study have been compared with similar recent LCA studies of milk production in 18 countries and are presented in Figure 9 [54,62]. The average global warming impact of organic and conventional fluid milk in Thailand was found to be 1.801 kg CO2 equivalent/kg FPCM. This result is similar to those reported by FAO (2010) [50] and Mazzeto et al. (2022) [62], who showed an average global warming impact of 1.839 kg CO2 equivalent/kg FPCM (see Figure 8) and 2.40 kg CO2 equivalent/kg FPCM, respectively. It was found that GHG emissions contributed 54.3% of the total global warming impact of conventional farming, mainly due to methane generation from enteric fermentation and manure management. Similarly, methane was the most important contributor to the total GHG emissions from milk production, which contributed up to 50% of the total GHG emissions from both developing and developed countries (see Figure 8). This result was similar to that reported by the FAO (2010) [50].
The global warming impact in this study (1.801 kg CO2 equivalent/kg FPCM) was higher than that found in developed countries (0.74–1.42 kg CO2 equivalent/kg FPCM), such as the Netherlands (1.40 kg CO2 equivalent/kg FPCM), Italy (1.19–1.42 kg CO2 equivalent/kg FPCM), and the United Kingdom (UK) (1.02 kg CO2 equivalent/kg FPCM). This was due to the viability of managing cows in semi-confined and pasture-based systems in Thailand resulting in a lower milk production per cow than that of the confined system in developed countries [62]. This different farm operation provided the suggestions for reducing the environmental impact for milk production in Thailand.
The average milk yield of conventional farms was 4478 kg/cow/year (3676 kg FPCM/cow/year). This result was similar to that reported by the Department of Livestock Development in Thailand, who reported that the average milk yield in Thailand was in the range from 3244 to 4698 kg [63]. Whereas the average milk yield value of organic farm was 2686 kg/cow/year (2204 kg FPCM/cow/year), which was moderately lower than that of the average country by 17–43%. With regard to milk yield, the amount of milk yield in Thailand (2204–3676 kg FPCM/cow/year) with similar values (less than 3000 kg of FPCM) [58] was found in three countries, namely, Colombia (2.770 kg CO2 equivalent/kg FPCM), Kenya (2.990 kg CO2 equivalent/kg FPCM), and India (1.600 kg CO2 equivalent/kg FPCM). The results suggested that a relatively low range of milk yield significantly affected the high values of global warming impact. Mazzeto et al. (2022) [62] reported that countries with a lower milk yield per cow generally had a large relative contribution to global warming impact due to semi-confined and pasture-based cow management systems. It can be concluded that the high efficiency of manure and feed management could reduce the global warming impact.

4. Conclusions

The important indicators should provide the connection between the characteristic of the farm, i.e., milk yield, feed ratio (concentrates proportion in the diet), the management and structure of the farms with global warming impact. The study focused only on global warming impact as crucial first in LCA evaluating and giving direction for organic and conventional farms on the environmental aspect of fluid milk production in Thailand.
In the first part, the global warming impact from cradle-to-farm gate of conventional farming was moderately lower than that of organic farming by 47%. The main global warming impact of organic farming was due to a high amount of feed consumption and CH4 emissions at the stage of the lactating cow. In the second part, the scenario analysis of this LCA presented that the global warming impact was slightly affected by the economic allocation result due to the market prices of carcass and fluid milk for specific country. Sensitivity analysis was conducted to assess the impact of substituting traditional farming with organic farming, the global warming impact of fluid milk moderately increased, compared to that of conventional farming.
The findings of this study provide a starting point for supporting the development of future sustainable environmental practices for fluid milk production and identifying opportunities for improvement in Thailand. The policy guidance focused on localizing feed supply and improving manure management practices, especially by switching to regular removal to reduce accumulation, managing manure in driers, and treating near-aerobic conditions. In this study, only two farm systems were carried out, representing a small sample. However, for further study, a number of different farms will be assessed to provide more precision impact values on farm decision making and the relative significance of environmental aspects (e.g., acidification, eutrophication, energy consumption, and water footprint) of LCA. Moreover, the combined assessment comparing alternative future protein sources, e.g., plant-based proteins and edible crickets, will be assessed.

Supplementary Materials

The following supporting information can be downloaded at https://www.mdpi.com/article/10.3390/su17062687/s1, File S1: LCI of feed for organic and conventional farms; File S2: Enteric fermentation and manure management; File S3: Liveweight and fluid milk product of organic and conventional cows.

Author Contributions

Conceptualization, D.R. and U.S.; methodology, U.S.; software, U.S.; validation, D.R. and U.S.; formal analysis, U.S.; investigation, U.S.; resources, D.R. and U.S.; data curation, S.T., W.K., S.N. and K.K.; writing—original draft preparation, D.R. and U.S.; writing—review and editing, D.R. and U.S.; visualization, D.R. and U.S.; supervision, D.R. and U.S.; project administration, D.R., S.T., W.K., S.N., K.K. and U.S.; funding acquisition, D.R. and U.S. All authors have read and agreed to the published version of the manuscript.

Funding

This research was funded by Thailand Institute of Nuclear Technology (Public Organization) and the Srinnakharinwirot University.

Institutional Review Board Statement

Not applicable.

Informed Consent Statement

Not applicable.

Data Availability Statement

Not applicable.

Conflicts of Interest

The authors declare no conflicts of interest.

Abbreviations

The following abbreviations are used in this manuscript:
LCALife cycle assessment
FPCMFat- and protein-corrected milk
FUFunctional unit
GHGsGreenhouse gases
ECMEnergy-corrected milk
IPCCIntergovernmental panel on climate change
TGOThailand Greenhouse Gas Management Organization Public Organization
IDFThe international dairy federation
LCILife cycle inventory
TMRTotal mixed ratio
LCIALife cycle impact assessment
GWPGlobal warming potential

References

  1. United Nations (UN). Global Issue Population. 2023. Available online: https://www.un.org/en/global-issues/population (accessed on 28 March 2024).
  2. Rhodium Group. Global Greenhouse Gas Emissions: 1990–2021 and Preliminary 2022 Estimates. 2023. Available online: https://rhg.com/research/global-greenhouse-gas-emissions-2022/ (accessed on 28 March 2024).
  3. World Emissions Clock 2023. Projected Tons of GHG Emissions in 2023. Available online: https://worldemissions.io/ (accessed on 28 March 2024).
  4. Djekic, I.; Tomasevic, I. Environmental impacts of the meat chain—Current status and future perspectives. Trends Food Sci. Technol. 2016, 54, 94–102. [Google Scholar] [CrossRef]
  5. Ritchie, S.J.; Cox, S.R.; Shen, X.; Lombardo, M.V.; Reus, L.M.; Alloza, C.; Harris, M.A.; Alderson, H.L.; Hunter, S.; Neilson, E.; et al. Sex differences in the adult human brain: Evidence from 5216 UK Biobank Participants, Cerebral. Cortex 2018, 28, 2959–2975. [Google Scholar] [CrossRef] [PubMed]
  6. State-level trends in the greenhouse gas emission intensity of US milk production. J. Dairy Sci. 2023, 106, 5474–5484. [CrossRef]
  7. Food and Agriculture Organization (FAO). Climate Change and the Global Dairy Cattle Sector, the Role of Dairy Sector in a Low-Carbon Future. 2019. Available online: https://www.fao.org/3/CA2929EN/ca2929en.pdf (accessed on 28 March 2024).
  8. Rotz, C.A.; Beegle, D.; Bernard, J.K.; Leytem, A.; Feyereisen, G.; Hagevoort, R.; Harrison, J.; Aksland, G.; Thoma, G. Fifty years of environmental progress for United States dairy farms. J. Dairy Sci. 2024, 107, 3651–3668. [Google Scholar] [CrossRef] [PubMed]
  9. Mazzatto, A.; Falconer, S.; Ledgard, S. Updating the Carbon Footprint for Selected New Zealand Agricultural Products: An Update for Milk. 2021. Available online: https://www.mpi.govt.nz/dmsdocument/51076/direct (accessed on 28 March 2024).
  10. Custommarketinsights. Global Organic Food and Beverages Market 2024–2033. 2024. Available online: https://www.custommarketinsights.com/report/organic-food-and-beverages-market/ (accessed on 28 March 2024).
  11. Robertson, H.J.W. Does the Carbon Footprint of Organic Milk Production Negate Its Environmental Benefits? 2007. Available online: https://www.brookes.ac.uk/getmedia/fe0d4d6f-22b3-40c9-b248-5756cd8fc8d6/OrganicFarming-Geoverse.pdf (accessed on 28 March 2024).
  12. Romano, E.; Roma, R.; Tidona, R.F.; Giraffa, G.; Bragaglio, A. Dairy farm and life cycle assessment (LCA): The allocation criterion useful to estimate undesirable products. Sustainability 2021, 13, 4354. [Google Scholar] [CrossRef]
  13. Giri, D.; Pokhrel, S. Organic farming for sustainable agriculture: A review. RJOAS Russ. J. Agric. Socio-Econ. Sci. 2022, 10. [Google Scholar] [CrossRef]
  14. Eide, M.H. Life cycle assessment (LCA) of industrial milk production. Int. J. LCA 2002, 7, 115–126. [Google Scholar] [CrossRef]
  15. Hambly, J. Environmental-ecological impact of daily sector. Int. J. Dairy Technol. 2011, 64, 145–146. [Google Scholar] [CrossRef]
  16. Houssard, C.; Maxime, D.; Benoit, S.; Pouliot, Y.; Margni, M. Comparative life cycle assessment of five Greek yogurt production systems: A perspective beyond the plant boundaries. Sustainability 2020, 12, 9141. [Google Scholar] [CrossRef]
  17. Rice, P.; Brien, D.; Shalloo, L.; Holden, N.M. Defining a functional unit for dairy production LCA that reflects. Int. J. Life Cycle Assess. 2019, 24, 642–653. [Google Scholar] [CrossRef]
  18. Nijdam, D.; Rood, T.; Westhoek, H. The price of protein: Review of land use and carbon footprints from life cycle assessments of animal food products and their substitutes. Food Policy 2012, 37, 760–770. [Google Scholar] [CrossRef]
  19. Salou, T.; Mouel, C.L.; Van Der Werf, H.M.G. Environmental impacts of dairy system intensification: The functional unit matter! J. Cleaner Prod. 2016, 140, 445–454. [Google Scholar] [CrossRef]
  20. Knudsen, M.T.; Dorca-Preda, T.; Djomo, S.N.; Penna, N.; Padel, S.; Smith, L.G.; Zolitsch, W.; Hortenhuber, S.; Hermansen, J.E. The importance of including soil carbon changes, ecotoxicity and biodiversity impacts in environmental life cycle assessments of organic and conventional milk in Western Europe. J. Cleaner Prod. 2019, 215, 433–443. [Google Scholar] [CrossRef]
  21. Baldini, C.; Bava, L.; Zucali, M.; Guarino, M. Milk production life cycle assessment: A comparison between estimated and measured emission inventory for manure handling. Sci. Total Environ. 2018, 625, 209–219. [Google Scholar] [CrossRef]
  22. Poore, J.; Nemecek, T. Reducing food’s environmental impacts through producers and consumers. Science 2018, 360, 987–992. [Google Scholar] [CrossRef]
  23. Worldwide Sales of Organic Food from 1999 to 2022. 2024. Available online: https://www.statista.com/statistics/273090/worldwide-sales-of-organic-foods-since-1999/ (accessed on 28 March 2024).
  24. Vantage Market Research. Organic Foods Market: Growth Trends, 2022–2030 Forecasts. 2023. Available online: https://www.vantagemarketresearch.com/industry-report/organic-foods-market-2311 (accessed on 28 March 2024).
  25. Organic Trade Association. Organic Thailand. 2024. Available online: https://globalorganictrade.com/country/thailand (accessed on 28 March 2024).
  26. 6Wresearch. Thailand Organic Food Market 2024–2030. Available online: https://www.6wresearch.com/industry-report/thailand-organic-food-market-outlook (accessed on 28 March 2024).
  27. Chinvarasopak, P. Key factors affecting the success of organic agriculture in Thai communities: Three case studies in Ubon ratchathani and Srisaket provinces. J. Public Adm. Public Aff. Manag. 2024, 13, 105–130. Available online: https://so05.tci-thaijo.org/index.php/pajournal/article/download/45827/37901/0 (accessed on 28 March 2024).
  28. Castagnoli, A.; Salem, A.M.; Desideri, U.; Isabella, P. Environmental assessment of gasification and green hydrogen potential role in waste management decarbonization. J. Cleaner Prod. 2024, 482, 144174. [Google Scholar] [CrossRef]
  29. Gianico, A.; Gallipoli, A.; Gazzola, G.; Pastore, C.; Tonanzi, B.; Braguglia, C.M. A novel cascade biorefinery approach to transform food waste into valuable chemicals and biogas through thermal pretreatment integration. Bioresour. Technol. 2021, 482, 125517. [Google Scholar] [CrossRef]
  30. ISO 14040:2021/14044:2021; Environmental Management—Life Cycle Assessment—Principles and Framework and Requirements and Guidelines. International Organization for Standardization: Geneva, Switzerland, 2021.
  31. Intergovernmental Panel on Climate Change (IPCC). IPCC Guidelines for National Greenhouse Gas Inventories: Agriculture, Forestry and Other Land Use; Institute for Global Environmental Strategies (IGES): Hayama, Japan, 2006. [Google Scholar]
  32. International Diabetes Federation (IDF). IDF Diabetes Atlas. 2015. Available online: https://diabetesatlas.org/idfawp/resource-files/2012/07/IDF_diabetes_atlas_seventh_edition_en.pdf (accessed on 28 March 2024).
  33. Thailand Greenhouse Gas Management Organization Public Organization (TGO). Emission Factor for Carbon Footprint of Organization. 2023. Available online: https://thaicarbonlabel.tgo.or.th/admin/uploadfiles/emission/ts_578cd2cb78.pdf (accessed on 1 July 2024).
  34. Pattarajinda, W. TMR Premium Dairy Cows. 2022. Available online: https://nutrition.dld.go.th/nutrition/images/pdf/IDP/use_264.pdf (accessed on 28 March 2024).
  35. Trakulthaveesuk, N.; Raksasiri, T.; Angamnuaysiri, S. Environmental life Cycle Assessment of Organic and Conventional Milk Production. Bachelor’s Thesis, Faculty of Engineering, Srinnakharinwirot University, Nakorn Nayok, Thailand, 2019. Unpublished. [Google Scholar]
  36. Saothao, Y.; Chankhruea, T.; Chaiyaporn, A. Nitrogen and Phosphorus Footprints: Beef and Milk Consumption in Thailand. Bachelor’s Thesis, Faculty of Engineering, Srinnakharinwirot University, Nakorn Nayok, Thailand, 2020. Unpublished. [Google Scholar]
  37. Department of Agricultural Extension. Zingiber montanum (Phlai). 2021. Available online: https://www.aopdt04.doae.go.th/ (accessed on 28 March 2024).
  38. Phettharawadee, S. The evalution of energy and carbon balance for maize production. 2019. Available online: http://202.28.38.45/dspace/bitstream/123456789/216/1/5815401028.pdf (accessed on 28 March 2024).
  39. Paengkoum, P.; Paengkoum, S. The utilization of byproduct cassava raw material from local area for ruminant animal feed; Lertsilp Printing: Nakhon Ratchasima, Thailand, 2017; Unpublished. [Google Scholar]
  40. Rongrit, S.; Dejbhimon, K.; Jaisil, P. Effects of planting dates on stalk yield and agronomic characters of sweet sorghum Sorghum bicolor (L.) Moench. Khon Kaen Agr. J. 2011, 39, 131–136. [Google Scholar]
  41. Pongpat, P.; Gheewala, S.H.; Silalertruksa, T. An assessment of harvesting practices of sugarcane in the central region of Thailand. J. Clean. Prod. 2017, 142, 1138–1147. [Google Scholar] [CrossRef]
  42. Suwanmanee, U.; Cheroennet, N.; Saibuatrong, W. Life cycle assessment focusing on the waste management of conventional and bio-based garbage bags. J. Clean. Prod. 2017, 158, 319–334. [Google Scholar]
  43. Thailand Greenhouse Gas Management Organization Public Organization (TGO). Emission Factor for Carbon Footprint of Product. 2023. Available online: https://thaicarbonlabel.tgo.or.th/admin/uploadfiles/emission/ts_b934985782.pdf (accessed on 1 July 2022).
  44. TGO. Greenhouse Gases—Carbon Footprint of Products—Guidelines. 2021. Available online: https://thaicarbonlabel.tgo.or.th/tools/files.php?mod=Y0hKdlpIVmpkSE5mWkc5M2JteHZZV1E9&type=WDBaSlRFVlQ&files=TVRFPQ (accessed on 28 March 2024).
  45. National Statistical Office. Saraburi Province Statistic Report. 2023. Available online: https://saraburi.nso.go.th/images/saraburi-2566.pdf (accessed on 28 March 2024).
  46. The Livestock Office of Region 1. Dairy Farm Standard. 2016. Available online: https://region1.dld.go.th/webnew/images/stories/standard_farm/tranning_standard2016/dairy_farm_standard.pdf (accessed on 28 March 2024).
  47. Noya, I.; Gonzalez-Garcia, S.; Berzosa, J.; Baucells, F.; Feijoo, G.; Morera, M. Environmental and water sustainability of milk production in Northeast Spain. Sci. Total Environ. 2018, 616, 1317–1329. [Google Scholar] [CrossRef]
  48. Office of the Royal Society. Pak Chong. 2024. Available online: https://gazetteer.orst.go.th/app/search_word?id=600d35d8436cfe0e9878c0e2 (accessed on 28 March 2024).
  49. Office of the Permanent Secretary for Ministry of Agriculture and Cooperatives. Nakhon Ratchasima Province. 2019. Available online: https://www.opsmoac.go.th/nakhonratchasima-dwl-files-421091791863 (accessed on 28 March 2024).
  50. Gerber, P.; Vellinga, T.; Opio, C.; Henderson, B.; Steinfeld, H. Greenhouse Gas Emission from Dairy sector—A Life Cycle Assessment. 2010. Available online: https://www.fao.org/4/k7930e/k7930e00.pdf (accessed on 28 March 2024).
  51. Soussana, J.F.; Tallec, T.; Blanfort, V. Mitigating the greenhouse gas balance of ruminant production system through carbon sequestration in grasslands. Animal 2010, 4, 987–992. [Google Scholar] [CrossRef]
  52. Holly, M.A.; Larson, R.A.; Powell, J.M.; Ruark, M.D.; Aguirre-Villegas, H. Greenhouse gas and ammonia emissions from digested and separated dairy manure during storage and after land application. Agric. Ecosyst. Environ. 2017, 239, 410–419. [Google Scholar] [CrossRef]
  53. Intergovernmental Panel on Climate Change (IPCC). AR5 Climate Change 2014: Mitigation of Climate Change. 2014. Available online: https://www.ipcc.ch/report/ar5/wg3/ (accessed on 11 November 2022).
  54. Berton, M.; Bittante, G.; Zendri, F.; Ramanzin, M.; Schiavon, S.; Sturaro, E. Environmental impact and efficiency of use of resources of different mountain dairy farming systems. Agric. Syst. 2020, 181, 102806. [Google Scholar] [CrossRef]
  55. Famigliett, J.; Guerci, M.; Proserpio, C.; Ravaglia, P.; Motta, M. Development and testing of the product environmental footprint milk tool: A comprehensive LCA tool for dairy products. Sci. Total Environ. 2019, 648, 1614–1626. [Google Scholar] [CrossRef]
  56. Daneshi, A.; Esmaili-sari, A.; Daneshi, M.; Baumann, H. Greenhouse gas emissions of packaged fluid milk production in Tehran. J. Cleaner Prod. 2016, 80, 150–158. [Google Scholar] [CrossRef]
  57. Ministry of Agriculture and Cooperatives Thai Agricultural Standard. Organic Agriculture Part 2: Organic Livestock. 2018. Available online: https://breeding.dld.go.th/webnew/images/2567/Report/Manual/Manual_organic_67.pdf (accessed on 28 March 2024).
  58. Baldini, M.; Maso, L.D.; Liberatore, G.; Mazzi, F.; Terzani, S. Role of Country- and firm-level determinants in environmental, social, and governance disclosure. J. Bus. Ethics. 2018, 150, 79–98. [Google Scholar] [CrossRef]
  59. Lukkananukool, A.; Mitchaothai, J.; Polyorach, S.; Chaosap, C.; Sitthigripong, R. Influence of production year and slaughtering weight on carcass quality and price of fattening Charolais and Wagyu cross-bred beef steers. Khon Kaen Agriculture J. Suppl. 2021, 2, 851–861. [Google Scholar]
  60. Ministry of Commerce. Fluid Milk Price. 2024. Available online: https://samutprakan.moc.go.th/th/content/category/detail/id/161/iid/35003/ (accessed on 28 March 2024).
  61. Pracharuengwit, P.; Chiaravutthi, Y. Consumer Willingness to Pay for Organic Food in Thailand: Evidence from the Random n th-Price Auction Experiment. 2015. Available online: https://www.jba.tbs.tu.ac.th/files/Jba146/Article/JBA146PeeYing.pdf (accessed on 28 March 2024).
  62. Mazzetto, A.M.; Falconer, S.; Ledgard, S. Mapping the carbon footprint of milk production from cattle: A systematic review. J. Dairy Sci. 2022, 105, 9713–9725. [Google Scholar] [CrossRef]
  63. Buaban, S.; Prempree, S.; Lengnudum, K.; Lengnudum, J.; Dumrongpong, K.; Julwong, T.; Poonkam, P. DLD dairy sire summary 2018. 2018. Available online: https://biotech.dld.go.th/webnew/images/Sire_Summary/2561/Sire_Summary2561.pdf (accessed on 28 March 2024).
Figure 1. System boundaries including detailed process and parameters for organic fluid milk life cycle [33,34,35,36]. a Feed growing transportation, b Feed purchase and chemicals transportation, c Mineral transportation, d Waste transportation.
Sustainability 17 02687 g001
Figure 2. System boundaries including detailed process and parameters for conventional fluid milk life cycle [33,34,35,36]. a Feed growing, purchase, and chemicals transportation, b Waste transportation.
Sustainability 17 02687 g002
Figure 3. The global warming impact of farm operations and housing emissions of organic and conventional farms: with and without IDF allocation [31].
Sustainability 17 02687 g003
Figure 4. The global warming impact of different stages of organic and conventional farms: with and without IDF allocation [31].
Sustainability 17 02687 g004
Figure 5. The contribution analysis results of organic farming.
Sustainability 17 02687 g005
Figure 6. The contribution analysis results of conventional farming.
Sustainability 17 02687 g006
Figure 7. The variation of global warming impact for 1 kg PFCM considering different allocation methods.
Sustainability 17 02687 g007
Figure 8. Sensitivity analysis: the global warming impact for PFCM in Thailand considering different scenarios.
Sustainability 17 02687 g008
Figure 9. Comparison with other countries.
Sustainability 17 02687 g009
Table 1. On farm emissions estimated and methodology references for fluid milk production.
EmissionsReferences
Housingdata
a CH4 emissions (enteric fermentation)Tier 1–2 (IPCC, 2006) [31]
a CH4 emissions (manure management)Tier 1–2 (IPCC, 2006) [31]
a Direct N2O emissions (manure management)Tier 1–2 (IPCC, 2006) [31]
a Indirect N2O emissions from volatilization (manure management)Tier 1–2 (IPCC, 2006) [31]
a Indirect N2O emissions from leaching (manure management)Tier 1–2 (IPCC, 2006) [31]
Farm operation
b Diesel for manure treatment in housingSpecific data from TGO (2023a) [33]
a Teir 1–2 approach for emissions estimated including default and site-specific data (see Supplementary File S2); b Data obtained from TGO (2023a) [33] based on mobile combustion for agriculture (off road).
Table 2. The five steps of the life cycle and their data sources.
Life Cycle StepSubsystemData Sources
Agricultural process-Cultivation of organic maize, sorghum, guinea and napier grass-Trakulthaveesuk et al. (2019) [35]; Saothao et al. (2020) [36]
-Cultivation of Zingiber montanum (Phlai)-Department of Agricultural Extension (2021) [37]
-Cultivation of conventional maize-Phettharawadee (2019) [38]
-Cultivation of conventional guinea and napier grass-Paengkoum and Paengkoum (2017) [39]
-Cultivation of conventional sorghum-Rongrit et al. (2011) [40]
-Production of ensile roughages feed (maize, guinea and napier grass)-Trakulthaveesuk et al. (2019) [35]; Saothao et al. (2020) [36]; Pongpat et al. (2017) [41]; Suwanmanee et al. (2017) [42]
-Production of total mixed ration (TMR) at farm-Trakulthaveesuk et al. (2019) [35]; Saothao et al. (2020) [36]
Agricultural industry process-Electricity-TGO (2023b) [43]
-Production of diesel
-Production of fertilizer
-production of pesticide
Farm operation-Water (feed water, washing, and cleaning of equipment)-TGO (2023b) [43]
-Electricity (lighting and pump)
-Production of diesel (tractor)
-Production of chlorine
Transportation-Transport of fodder-TGO (2023b) [43]
-Waste transportation-TGO (2023b) [43]; TGO (2021) [44]
Waste treatment of packaging-landfilling-TGO (2023b) [43]; TGO (2021) [44]
-recycling
Table 3. LCI of the milk production systems considered: organic and conventional farms [33,34,35,36].
ParametersUnitOrganic FarmConventional Farm
a 1 kg fluid milka,b 1 kg PFCMa 1 kg fluid milka,b 1 kg PFCM
1. Feed
1.1 TMRkg3.47654.23563.06923.7392
 1.1.1 Ensile roughages
 -napier grass silagekg0.86911.05890.76730.9348
 -guinea grass silagekg0.34770.42360.30690.3739
 -maize silagekg0.86911.05890.76730.9348
 1.1.2 Concentrate
 -Rice brankg0.69530.84710.61380.7478
 -Broken ricekg0.69530.84710.61380.7478
1.2 Pasture (guinea grass/Sorghum)kg0.05810.07070.06880.0838
1.3 Mineral supplementkg0.00570.0060--
2. Water
2.1 Feed water kg4.87655.94632.24332.7331
2.2 Washing kg10.099412.304310.406612.6787
2.3 Cleaning of equipmentkg0.07090.08640.45840.5585
3. Utilities
3.1 Electricity (lighting and pump)kWh0.05820.07090.01430.0174
3.2 Diesel (tractor)L0.00310.00380.01610.0196
4. Chemicals
4.1 Chlorinekg0.38630.4706--
4.2 Detergent (washing)kg0.00130.00150.00110.0014
5. Herb
5.1 Phlai (breast massage)kg0.00140.0017--
6. Waste
6.1 Sackkg0.00010.00010.00600.0074
6.2 Bottle kg0.00030.00030.00080.0009
7. Transportation
7.1 Fodder transportation (rice bran and broken rice)km416.0416.010.010.0
7.2 Napier and guinea grass, kmkm1.01.010.010.0
7.3 Others animal feed purchase/chemicalskm10.010.010.010.0
7.4 Waste transportation, kmkm40.040.040.040.0
a Data obtained from Trakulthaveesuk et al. (2019) [35] and Saothao et al. (2020) [36]; b Data obtained from calculation, IDF (2019) [33], and Pattarajinda (2020) [34].
Table 4. Scenarios analysis: distribution (%) of environmental burden to fluid milk with different ways of handling co-product allocation.
ParametersOrganic FarmConventional Farm
MilkCarcassMilkCarcass
a Weight (kg of carcass)-500.00-420.00
b Loss weight (kg, based on 2.56%)-12.80-10.75
c Net weight (kg of carcass)-487.20-409.25
d Weight (kg PFCM)17,638.17-18,380.10-
e Price/carcass (THB/kg carcass)-162.69-162.69
f Price/milk (THB/kg FPCM)21.63-21.63
Weight allocation, (%)97.312.6997.822.18
Economics allocation, (%)82.7917.2185.6514.35
a Data obtained from Trakulthaveesuk et al. (2019) [35], and Saothao et al. (2020) [36]. b Data adapted from calculation and Lukkananukool et al. (2021) [59]. c Data adapted from calculation. d Data adapted from calculation, Trakulthaveesuk et al. (2019) [35], and Saothao et al. (2020) [36]. e Data adapted from average carcass and body weight price in Thailand of 162.69 THB/kg (Lukkananukool et al., 2021) [59]. f Data adapted from fluid milk price in Thailand of 21.63 THB/kg (Ministry of Commerce, 2024) [60].
Table 5. Sensitivity analysis.
Sensitivity AnalysisExplanations
Base case conventional farm100% conventional farm
Base case organic farm100% organic farm
Scenario 190% conventional farm and 10% organic farm
Scenario 280% conventional farm and 20% organic farm
Scenario 370% conventional farm and 30% organic farm
Scenario 460% conventional farm and 40% organic farm
Scenario 550% conventional farm and 50% organic farm
Disclaimer/Publisher’s Note: The statements, opinions and data contained in all publications are solely those of the individual author(s) and contributor(s) and not of MDPI and/or the editor(s). MDPI and/or the editor(s) disclaim responsibility for any injury to people or property resulting from any ideas, methods, instructions or products referred to in the content.

