
Decomposition of Carbon Emission Drivers and Carbon Peak Forecast for Three Major Urban Agglomerations in the Yangtze River Economic Belt


Abstract
1. Introduction
2. Methods and Data
2.1. Variable Selection
2.2. Grey Relational Analysis
- Establishment of reference and comparison sequence.
- 2.
- Dimensionless processing of raw data series.
- 3.
- Creating difference sequences.
- 4.
- Determination of the resolution factor ρ.
- 5.
- Correlation size calculation.
2.3. LMDI Decomposition Method
2.4. Expanded STIRPAT Model
2.5. Data Sources
3. Variable Screening and Impact Analysis
3.1. Grey Relational Analysis Results
3.2. LMDI Decomposition Results
3.3. STIRPAT Model Construction
4. Results and Discussion
4.1. Carbon Emission Scenario Setting
4.2. Scenario Forecasting Results and Analysis
4.3. Additional Analysis
5. Conclusions and Policy Implications
5.1. Conclusions and Discussion
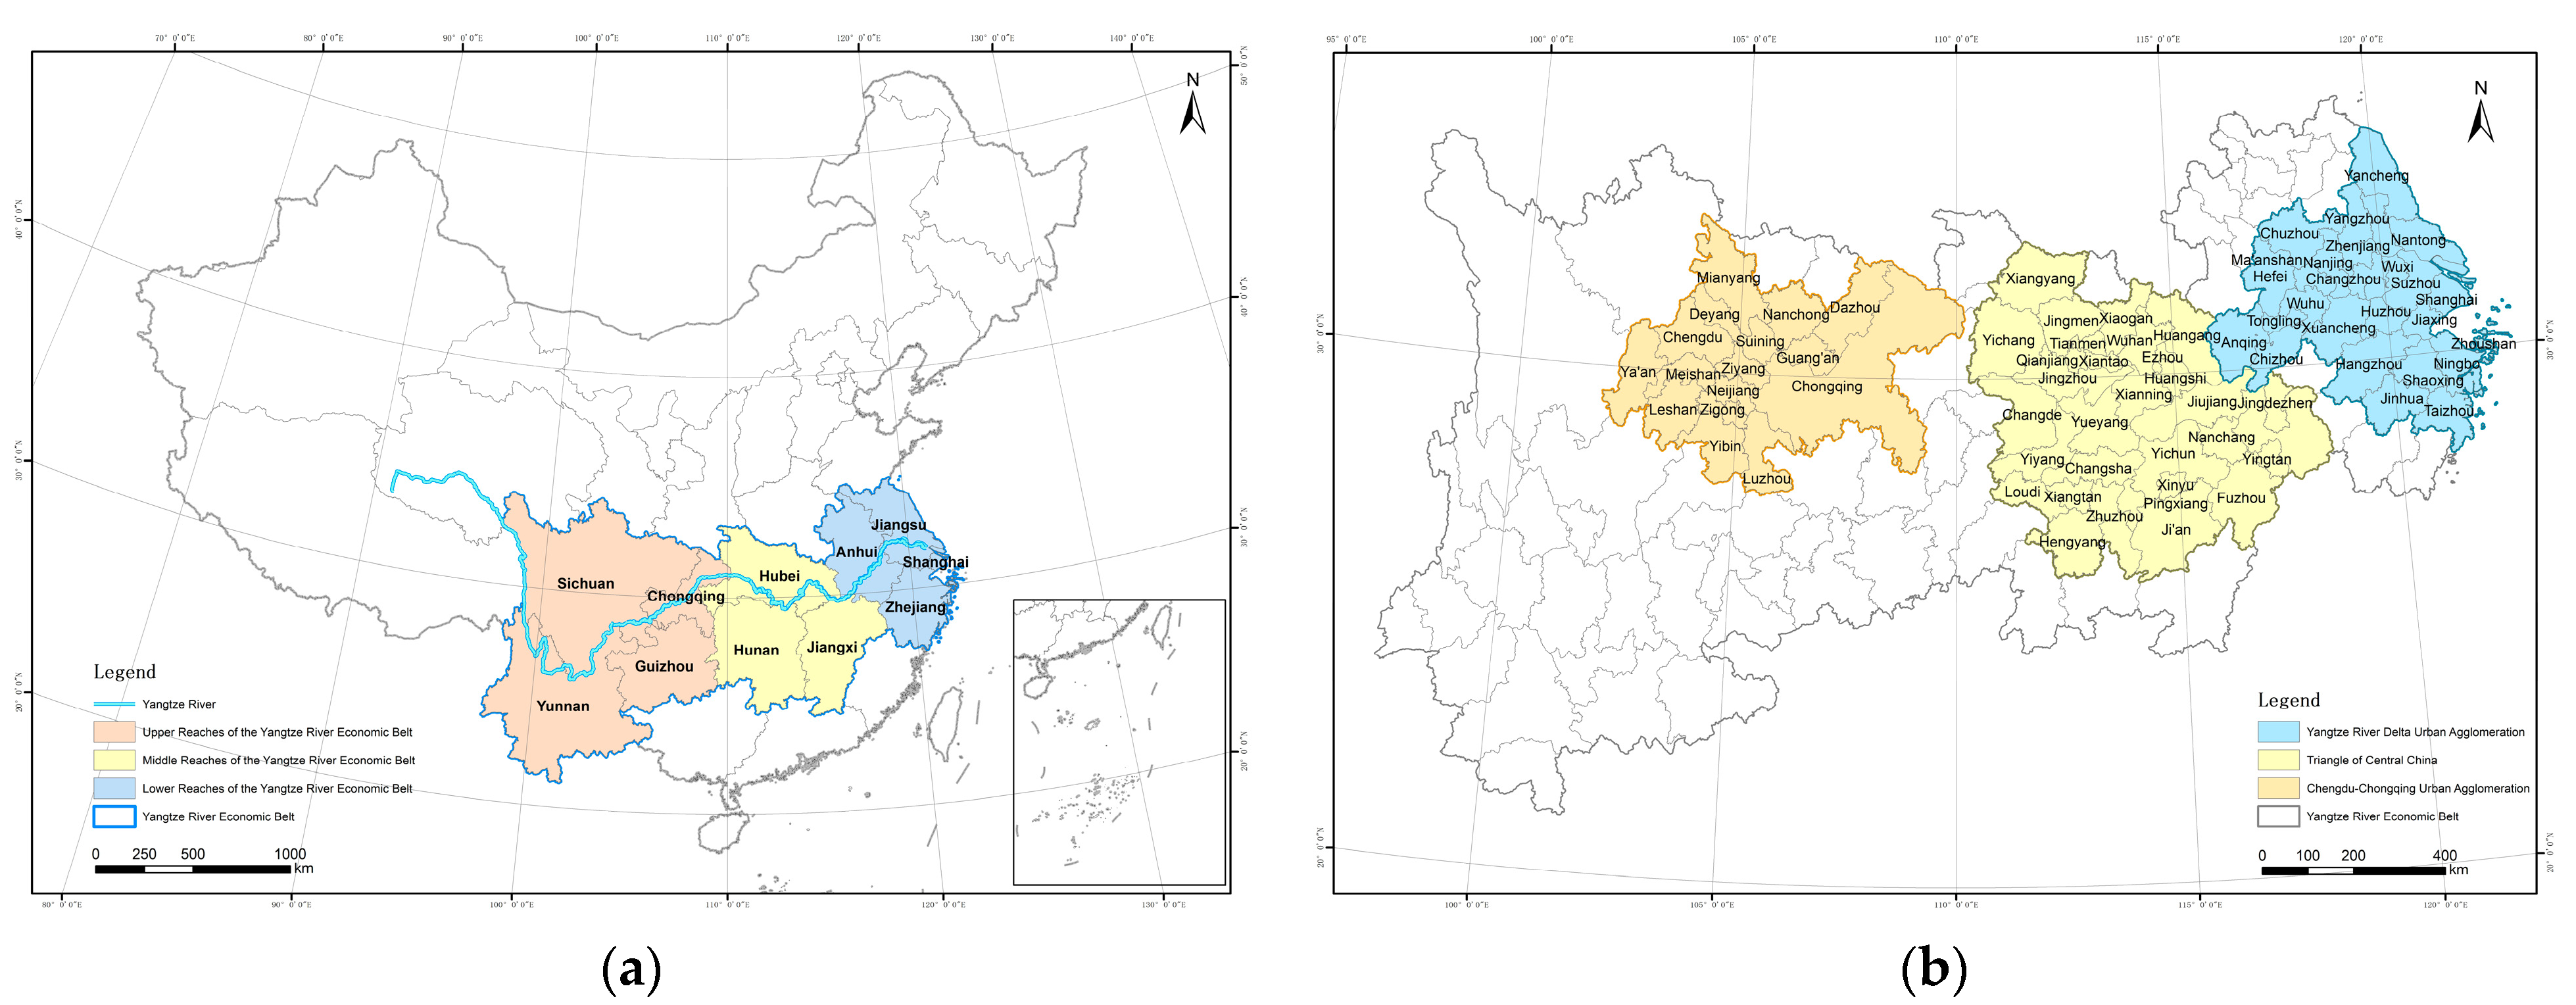
- Significant disparities in total carbon emissions are observed across various urban agglomerations, with the YRD consistently exhibiting the highest emission levels, followed by the TCC. This pattern is consistent with the relative scale of these urban agglomerations. In terms of emission growth rates, the YRD, TCC, and CCA demonstrated comparable average annual growth rates from 2005 to 2021, at 4.00%, 4.19%, and 3.75%, respectively. Moreover, from the 11th to the 13th Five-Year Plan periods, the average annual growth rates of carbon emissions in these regions exhibited a consistent downward trend. This decline demonstrates the sustained effectiveness of China’s integrated policy framework for climate change mitigation and adaptation, marking a strategic transition in climate governance from reactive response to proactive regulation [25].
- This study employed an integrated analytical framework combining grey relational analysis and LMDI decomposition to identify critical drivers of carbon emissions among 11 variables spanning five distinct categories. The methodology innovatively incorporates social factors (e.g., government intervention and openness level) beyond conventional economic, energy, and industrial determinants [6,7,30]. The grey relational analysis revealed substantial spatial heterogeneity in factor–emission correlations across geographically distinct urban agglomerations. Notably, social factors such as openness level may surpass conventional determinants in impact magnitude, as evidenced by the highest correlation (FS = 0.8138) observed in the CCA. The LMDI decomposition results indicate that DUP, UR, and POP exerted positive driving effects on carbon emissions across all three urban agglomerations during 2005–2021, with contribution rates ranked as DUP > UR > POP. Conversely, ES and EG suppressed emission growth, showing EG > ES in contribution magnitude. While this aligns with the consensus that economic factors dominate emissions growth and energy-related measures serve as primary mitigators in China [6,43], our comparative analysis reveals distinct spatial heterogeneity among the YRD, TCC, and CCA. POP contributed significantly more to carbon emissions in the YRD than in the TCC and CCA, with the TCC exhibiting the lowest population-driven effects. ES demonstrated lower emission suppression efficiency in the YRD compared to the other two urban agglomerations, whereas urbanization rate emerged as the most significant driver of carbon emissions in the CCA.
- Based on the established predictive model, our findings reveal no inverted U-shaped relationship between DUP and carbon emissions in the three urban agglomerations during the observation period, indicating that carbon emission growth rates have not yet significantly slowed in their industrialization and urbanization processes, with no clear inflection point observed. Collectively, these findings suggest that current development patterns in these city clusters sustain a positive correlation between economic activities and carbon output, failing to achieve the decoupling effect expected in advanced urban systems. Meanwhile, the regression analysis of the YRD’s carbon emission forecast model reveals a negative coefficient for the RT, indicating that increasing the proportion of tertiary industries effectively suppresses emission growth. This finding highlights industrial structure optimization as a viable pathway for achieving total carbon emission control in the YRD [8].
- In this study, while we isolated the individual contributions of various factors, a more nuanced discussion is warranted regarding both the direct and indirect impacts of each driving factor, considering potential interactions among them. Energy consumption constitutes the primary source of carbon emissions, with China’s fossil fuel-dominated energy structure creating a direct correlation between energy demand growth and emission escalation. However, such energy-driven emission growth has been effectively mitigated through clean energy deployment and energy efficiency improvements. Overall, ES and EG are projected to exhibit gradual declines, demonstrating accelerated reduction rates under strong low-carbon scenarios. Economic growth, typically driven by energy consumption and large-scale production factor inputs, directly accelerates carbon emission increases. Simultaneously, it indirectly stimulates social dynamics such as rural–urban migration and improvements in living standards, which collectively amplify energy demand. The disparities in DUP growth rates are explicitly incorporated into the scenario design through high-development and low-development frameworks in this study. Population scale operates as a dual emission driver, directly amplifying energy demand and indirectly stimulating production scaling. Industrial restructuring mediates emissions through energy patterns, technological trajectories, and policy instruments, with accelerated tertiary sector growth characterizing strong low-carbon scenarios. Urbanization manifests dual effects: while lifestyle transitions and land-use modifications intensify emissions through elevated energy demands, concentrated urban settlements enhance resource utilization efficiency via shared infrastructure and public services. The sustained growth of national economies, coupled with rising living standards and transportation accessibility, has escalated transport-related energy consumption, driving progressive intensification of environmental burdens across high-development and low-development scenarios. FDI exhibits dual effects: the pollution haven effect through industrial relocation versus the pollution halo effect via technology diffusion. Government intervention reveals phase-dependent efficacy, transitioning from growth-oriented fiscal policies during early industrialization—exacerbating fossil energy dependence—to green fiscal mechanisms prioritizing ecological civilization construction during advanced development stages.
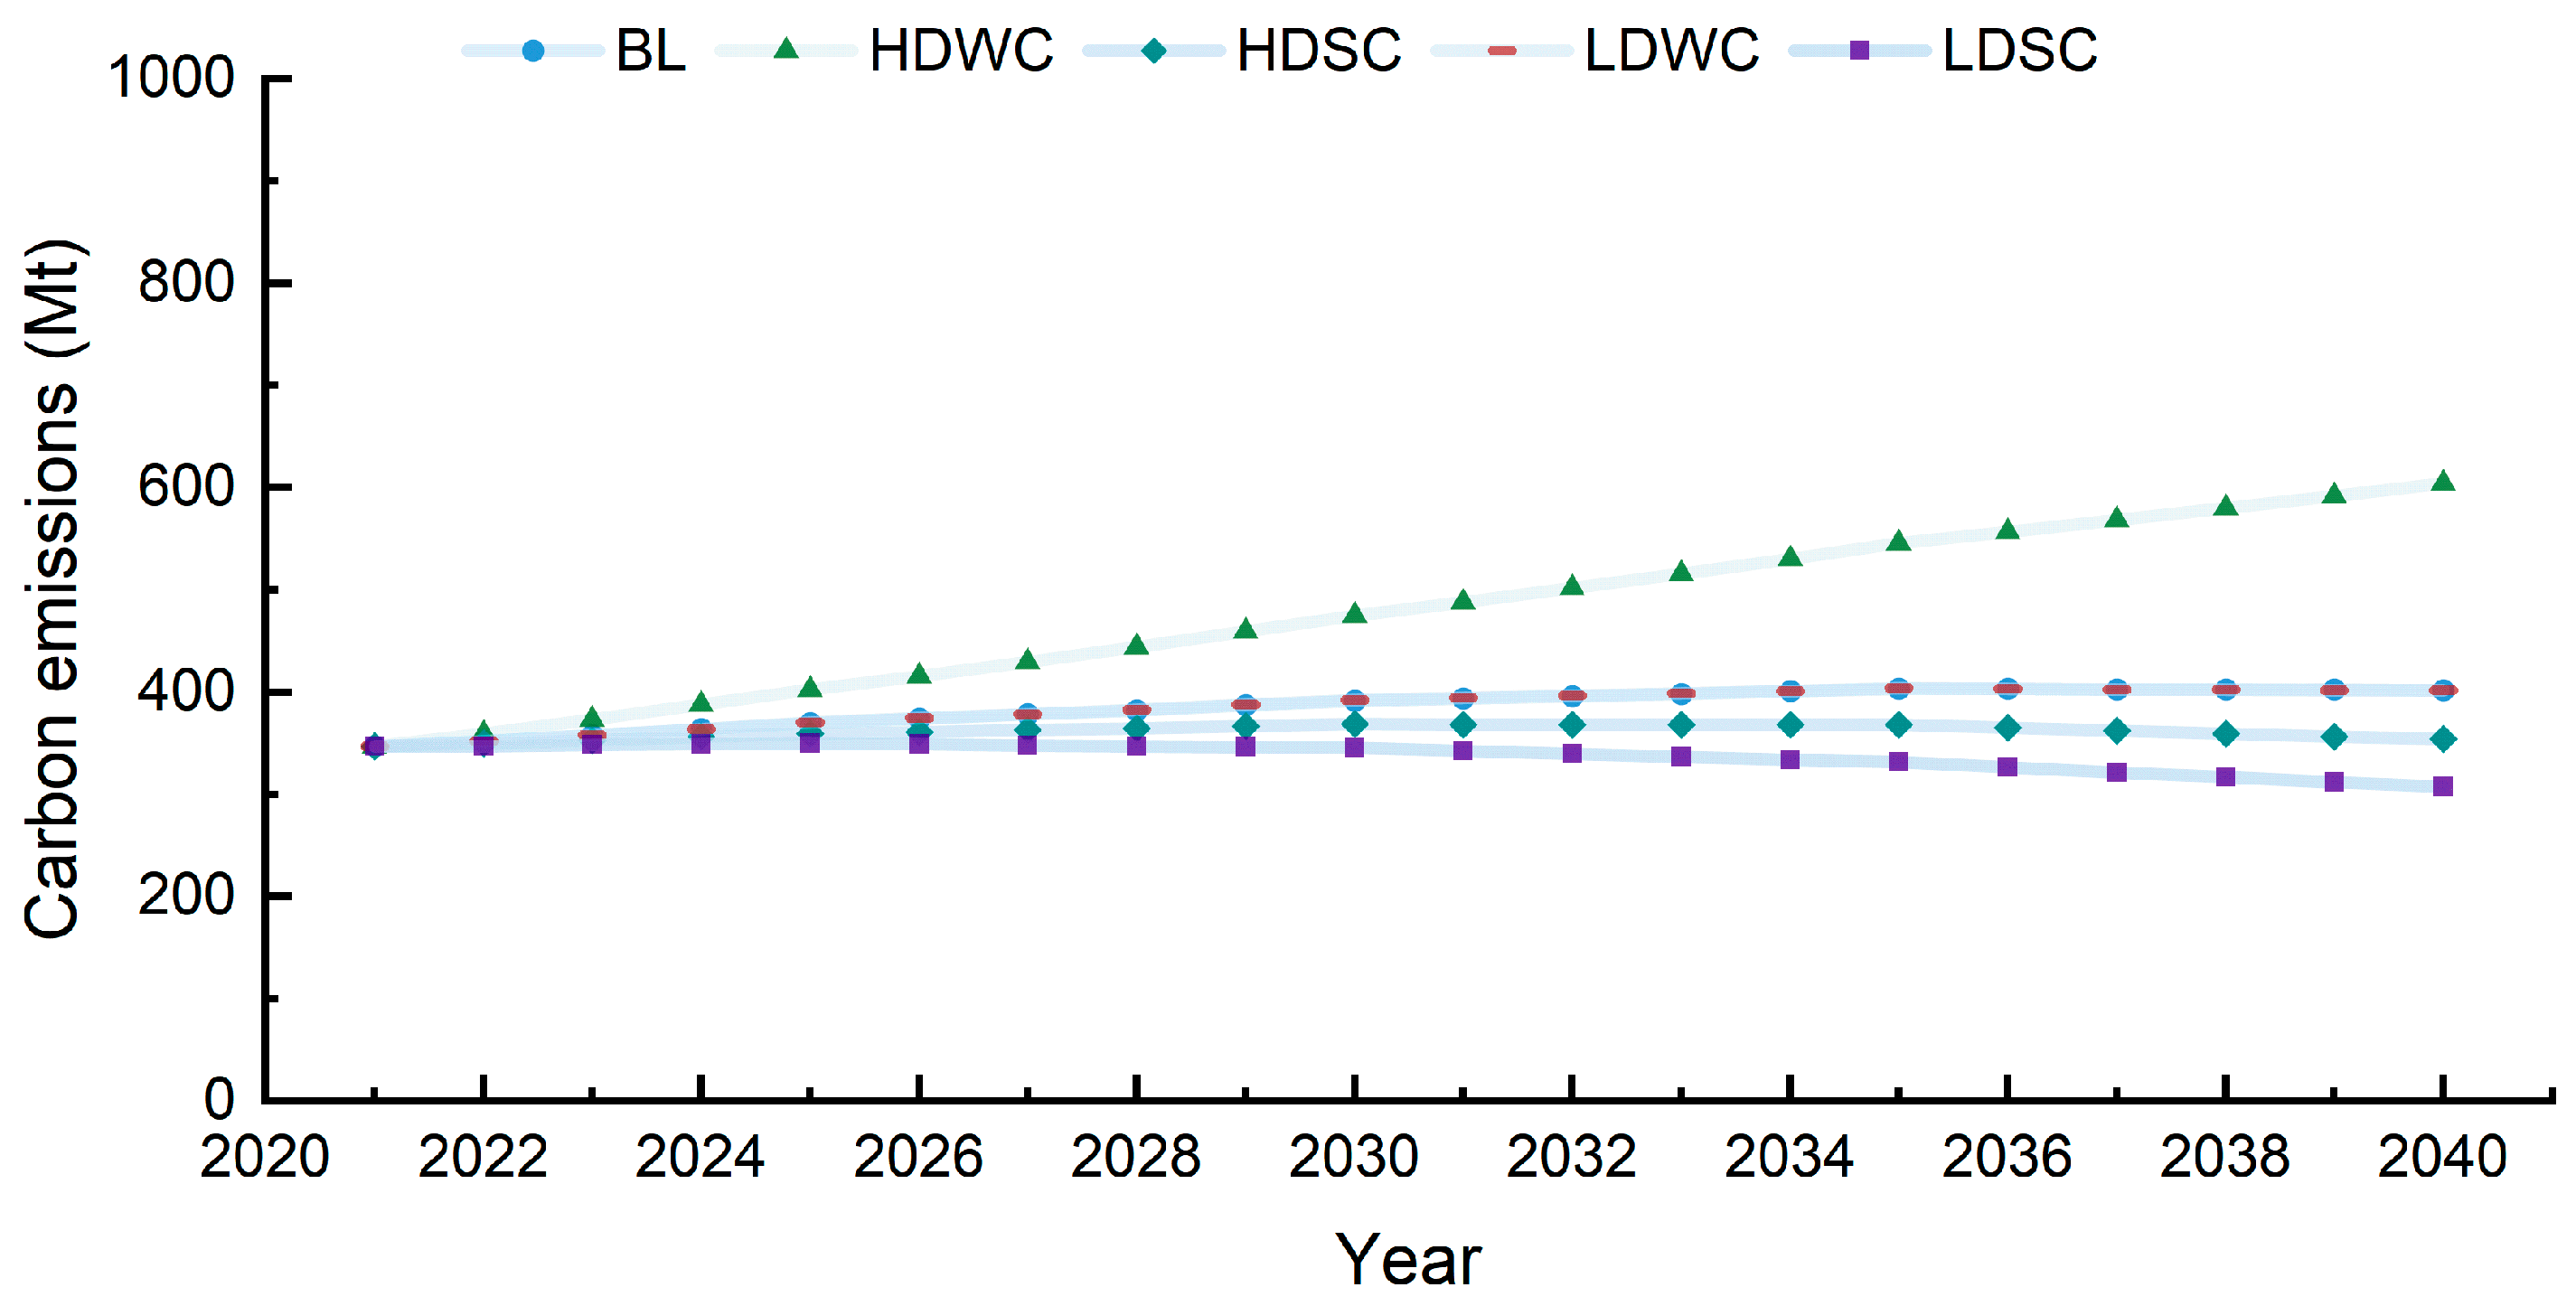
- This study establishes five carbon emission scenarios based on the current developmental status and policy frameworks of respective urban agglomerations, projecting future carbon emission trajectories for the YRD, TCC, and CCA under these scenarios. The findings reveal that under the HDSC and LDSC scenarios, the three urban agglomerations can achieve carbon peaking by 2030 with relatively low peak carbon levels, confirming that stringent low-carbon policies effectively facilitate peak carbon targets. Conversely, HDWC strategies present a primary barrier to regional emission reduction [44], either failing to meet the peaking timeline or inducing significantly higher peak levels.
5.2. Policy Implications
- The findings reveal significant heterogeneity among the YRD, TCC, and CCA in both total carbon emissions and key contributing factors. Our emission forecasts further indicate that achieving carbon peaking targets optimally requires implementing strong low-carbon scenarios across these metropolitan clusters, with region-specific strategies prioritizing dominant emission drivers. The following evidence-based policy recommendations integrate these strategic dimensions to operationalize effective climate governance frameworks. Steadily advancing energy transformation and establishing a clean energy-dominated supply system are critical. Each urban agglomeration should prioritize exploitation of indigenous clean and low-carbon energy resources following the proximity principle. For instance, the YRD can leverage coastal wind resources to advance offshore wind farm development [45], with strategic focus on establishing coastal wind power bases in Yancheng and Nantong, while enhancing the Zhoushan Archipelago offshore wind power operations and maintenance hub. To address current challenges of elevated capital intensity in offshore wind projects, implementation of domestic substitution strategies for critical components and operation systems, coupled with innovative financing mechanisms such as output-contingent financing and negative list approval protocols, merits consideration. The TCC and CCA could capitalize on abundant hydropower potential through cascade hydropower station deployment, thereby displacing incumbent fossil fuel-based energy infrastructure via clean energy capacity expansion. Concurrently, grid modernization initiatives must be accelerated to improve renewable energy accommodation capacity, with particular emphasis on mitigating wind curtailment and hydropower spillage through enhanced transmission infrastructure and smart grid technologies. In synergistic green transportation development, the YRD and CCA have made significant progress in promoting new energy vehicles (NEVs) and building green transportation infrastructure. The TCC, with its well-established automotive industry, can further enhance the development pace and scale of NEVs by capitalizing on its industrial advantages. Regional policymakers must implement dynamic NEV production-tax incentive linkage mechanisms. Through tiered fiscal schemes, these policy instruments can effectively counteract central subsidy reductions, thereby ensuring orderly industrial transitions while sustaining regional market growth trajectories.
- Factor decomposition analysis identifies economic development as the persistent primary driver of carbon emissions across all urban agglomerations. China’s ongoing economic restructuring, characterized by simultaneous optimization of existing industries and strategic development of emerging sectors, underscores the potential to amplify energy-saving effects through targeted industrial structure refinement. The YRD can leverage its robust manufacturing foundation to foster the deep integration of advanced manufacturing with modern service industries. The TCC can leverage its geographical advantages to foster complementary development among cities, rational industrial specialization, and establish comprehensive industrial and supply chains. This strategic positioning enables effective absorption of industrial relocation from advanced regions like the Yangtze River Delta and Greater Bay Area. However, caution is warranted against potential pollution transfer and cost constraints associated with green transition initiatives. The CCA could accelerate industrial upgrading through cluster-oriented transformation of traditional industries, particularly in achieving high-end manufacturing and intelligent production systems. Nonetheless, comparative analysis reveals relatively weaker comprehensive competitiveness in industrial development and the current challenges of significant industrial planning overlap within the region necessitate institutional innovations to establish cross-regional industrial coordination mechanisms, which should be prioritized for synergistic development.
- Research has demonstrated that population size is a significant driver of carbon emission growth in the YRD [43]. Although an increase in population size can stimulate industrial development, scientific and technological innovation, urbanization, and improvements in infrastructure within the YRD, it also generates negative consequences, including increased carbon emissions, heightened pressure on resource scarcity, and environmental pollution. Consequently, the YRD must implement science-based policy frameworks to refine population structure and elevate human capital quality. Critical priorities include leveraging technological innovation, fostering cross-sector industrial coordination, and establishing institutional mechanisms to steer labor redistribution toward low-carbon sectors, thereby aligning decarbonization objectives with sustained economic growth.
- It is imperative to promote urbanization in a systematic and orderly manner while ensuring the scientific planning and development of urban agglomerations. In 2021, the average urbanization rates of the TCC and CCA were 64.65% and 63.42%, respectively, indicating that both regions are at a pivotal stage in their urbanization processes. Both urban agglomerations still possess urbanization potential, but future development should prioritize structural optimization. Establishing a “core cities-sub-nodes-specialized towns” hierarchical system could enhance complementary advantages and coordinated growth. This tiered system enables functional complementarity and coordinated development, achieving synergistic benefits via functional specialization, enhanced resource allocation efficiency, and cross-regional coordination mechanisms.
- Current fiscal allocations in local governments exhibit structural imbalance, prioritizing capital expenditures for economic growth over environmental improvement investments. This expenditure bias constitutes a primary driver of the observed positive correlation between fiscal expansion and carbon emission growth. Environmental projects’ extended payback periods often exceed typical political cycles, creating temporal misalignment that dampens governmental prioritization of ecological investments. To reconcile this, establishing legally mandated environmental expenditure ratios and promoting green bond issuance (as exemplified by Guangdong Province’s pioneering “carbon-neutral” bond issuance in 2021) could mobilize private capital for long-term sustainability projects while alleviating fiscal burdens. Metropolitan clusters should leverage geographic synergies through shared environmental infrastructure (e.g., integrated water management networks in the YRD’s Qingpu-Wujiang-Jiashan demonstration zone) and joint funding mechanisms for cross-jurisdictional environmental governance, particularly targeting transboundary river remediation and regional air quality management systems.
5.3. Future Directions
- While nighttime light data offer valuable insights for estimating energy consumption and carbon emissions, several inherent limitations should be acknowledged. First, sensor-specific discrepancies may introduce biases, particularly in highly urbanized areas with overglow or pixel saturation [38]. Second, the linear regression models commonly employed to link nighttime light intensity to energy consumption oversimplify complex nonlinear relationships, potentially neglecting regional heterogeneity in energy structures, industrial activities, and energy efficiency [46]. Third, the reliance on provincial-level energy statistics to downscale estimates to city-level scales may amplify errors due to intra-provincial spatial heterogeneity, such as uneven distribution of energy-intensive industries or consumption patterns across cities within the same province [46]. Future studies could mitigate these issues by integrating multi-source data (e.g., thermal infrared, mobility patterns) and adopting hybrid models that account for spatial autocorrelation and energy transition dynamics.
- This study employs the STIRPAT framework to elucidate the direct contributions of individual drivers to carbon emissions, utilizing a partial equilibrium approach that presumes independence among socioeconomic and technological factors. While this methodological design aligns with our primary objective of isolating direct effects for differentiated policy interventions, it does not account for potential synergistic or antagonistic interactions between drivers. Specifically, urbanization trajectories may simultaneously drive energy demand growth and accelerate renewable technology adoption via agglomeration effects, producing non-linear feedback mechanisms that our analytical framework cannot resolve. Furthermore, rebound effects linking energy efficiency gains to consumption expansion remain unquantified. Future research could explore alternative models, such as machine learning or dynamic systems modeling, and could offer more flexibility in capturing complex and non-linear patterns in emissions data.
- Existing studies on carbon emission drivers predominantly focus on conventional determinants (economic scale, energy structure, industrial transitions, population density), yet lack systematic analysis of non-linear impacts stemming from evolving household behavioral patterns. For instance, while sharing economy initiatives (e.g., ride-sharing platforms) and waste classification policies have significantly altered residential carbon footprints, behavioral elasticity coefficients remain absent from mainstream emission forecasting models. Future research should integrate interdisciplinary methodologies to decode multi-agent interactions (households–enterprises–governments), complemented by causal inference techniques (e.g., difference-in-differences, synthetic controls) to quantify net emission reductions from emerging behavioral interventions.
Author Contributions
Funding
Institutional Review Board Statement
Informed Consent Statement
Data Availability Statement
Conflicts of Interest
Appendix A

| Impact Factor | Time Interval | BL | HDWC | HDSC | LDWC | LDSC |
|---|---|---|---|---|---|---|
| ES | 2021–2025 | 0.64% | 1.14% | 0.14% | 0.84% | 0.44% |
| 2026–2030 | −0.36% | 0.14% | −0.86% | −0.16% | −0.56% | |
| 2031–2035 | −1.36% | −0.86% | −1.86% | −1.16% | −1.56% | |
| 2036–2040 | −2.36% | −1.86% | −2.86% | −2.16% | −2.56% | |
| EG | 2021–2025 | −8.18% | −7.18% | −9.18% | −7.68% | −8.68% |
| 2026–2030 | −7.18% | −6.18% | −8.18% | −6.68% | −7.68% | |
| 2031–2035 | −6.18% | −5.18% | −7.18% | −5.68% | −6.68% | |
| 2036–2040 | −5.18% | −4.18% | −6.18% | −4.68% | −5.68% | |
| DUP | 2021–2025 | 5.33% | 5.83% | 5.83% | 4.83% | 4.83% |
| 2026–2030 | 4.33% | 4.83% | 4.83% | 3.83% | 3.83% | |
| 2031–2035 | 3.33% | 3.83% | 3.83% | 2.83% | 2.83% | |
| 2036–2040 | 2.33% | 2.83% | 2.83% | 1.83% | 1.83% | |
| UR | 2021–2025 | 1.58% | 1.78% | 1.78% | 1.38% | 1.38% |
| 2026–2030 | 1.28% | 1.48% | 1.48% | 1.08% | 1.08% | |
| 2031–2035 | 0.98% | 1.18% | 1.18% | 0.78% | 0.78% | |
| 2036–2040 | 0.68% | 0.88% | 0.88% | 0.48% | 0.48% | |
| POP | 2021–2025 | 1.36% | 1.56% | 1.56% | 0.96% | 0.96% |
| 2026–2030 | 0.96% | 1.16% | 1.16% | 0.56% | 0.56% | |
| 2031–2035 | 0.56% | 0.76% | 0.76% | 0.16% | 0.16% | |
| 2036–2040 | 0.16% | 0.36% | 0.36% | −0.24% | −0.24% | |
| RT | 2021–2025 | 2.23% | 1.73% | 2.73% | 1.73% | 2.73% |
| 2026–2030 | 1.73% | 1.23% | 2.23% | 1.23% | 2.23% | |
| 2031–2035 | 1.23% | 0.73% | 1.73% | 0.73% | 1.73% | |
| 2036–2040 | 0.73% | 0.23% | 1.23% | 0.23% | 1.23% | |
| TCO | 2021–2025 | 9.22% | 10.22% | 10.22% | 8.22% | 8.22% |
| 2026–2030 | 7.22% | 8.22% | 8.22% | 6.22% | 6.22% | |
| 2031–2035 | 5.22% | 6.22% | 6.22% | 4.22% | 4.22% | |
| 2036–2040 | 3.22% | 4.22% | 4.22% | 2.22% | 2.22% | |
| FDI | 2021–2025 | 3.03% | 3.53% | 3.53% | 2.53% | 2.53% |
| 2026–2030 | 2.53% | 3.03% | 3.03% | 2.03% | 2.03% | |
| 2031–2035 | 2.03% | 2.53% | 2.53% | 1.53% | 1.53% | |
| 2036–2040 | 1.53% | 2.03% | 2.03% | 1.03% | 1.03% | |
| FS | 2021–2025 | 5.92% | 6.42% | 6.42% | 5.42% | 5.42% |
| 2026–2030 | 4.92% | 5.42% | 5.42% | 4.42% | 4.42% | |
| 2031–2035 | 3.92% | 4.42% | 4.42% | 3.42% | 3.42% | |
| 2036–2040 | 2.92% | 3.42% | 3.42% | 2.42% | 2.42% |
Appendix B
| Impact Factor | Time Interval | BL | HDWC | HDSC | LDWC | LDSC |
|---|---|---|---|---|---|---|
| ES | 2021–2025 | −2.59% | −2.09% | −3.09% | −2.39% | −2.79% |
| 2026–2030 | −3.59% | −3.09% | −4.09% | −3.39% | −3.79% | |
| 2031–2035 | −4.59% | −4.09% | −5.09% | −4.39% | −4.79% | |
| 2036–2040 | −5.59% | −5.09% | −6.09% | −5.39% | −5.79% | |
| EG | 2021–2025 | −3.56% | −2.56% | −4.56% | −3.06% | −4.06% |
| 2026–2030 | −4.06% | −3.06% | −5.06% | −3.56% | −4.56% | |
| 2031–2035 | −4.56% | −3.56% | −5.56% | −4.06% | −5.06% | |
| 2036–2040 | −5.06% | −4.06% | −6.06% | −4.56% | −5.56% | |
| DUP | 2021–2025 | 6.50% | 7.00% | 7.00% | 6.00% | 6.00% |
| 2026–2030 | 5.50% | 6.00% | 6.00% | 5.00% | 5.00% | |
| 2031–2035 | 4.50% | 5.00% | 5.00% | 4.00% | 4.00% | |
| 2036–2040 | 3.50% | 4.00% | 4.00% | 3.00% | 3.00% | |
| UR | 2021–2025 | 2.23% | 2.43% | 2.43% | 2.03% | 2.03% |
| 2026–2030 | 1.93% | 2.13% | 2.13% | 1.73% | 1.73% | |
| 2031–2035 | 1.63% | 1.83% | 1.83% | 1.43% | 1.43% | |
| 2036–2040 | 1.33% | 1.53% | 1.53% | 1.13% | 1.13% | |
| POP | 2021–2025 | −0.14% | 0.06% | 0.06% | −0.34% | −0.34% |
| 2026–2030 | −0.34% | −0.14% | −0.14% | −0.54% | −0.54% | |
| 2031–2035 | −0.54% | −0.34% | −0.34% | −0.74% | −0.74% | |
| 2036–2040 | −0.74% | −0.54% | −0.54% | −0.94% | −0.94% | |
| TCO | 2021–2025 | 12.05% | 13.05% | 13.05% | 11.05% | 11.05% |
| 2026–2030 | 11.05% | 12.05% | 12.05% | 10.05% | 10.05% | |
| 2031–2035 | 10.05% | 11.05% | 11.05% | 9.05% | 9.05% | |
| 2036–2040 | 9.05% | 10.05% | 10.05% | 8.05% | 8.05% | |
| FDI | 2021–2025 | 9.74% | 11.74% | 11.74% | 7.74% | 7.74% |
| 2026–2030 | 7.74% | 9.74% | 9.74% | 5.74% | 5.74% | |
| 2031–2035 | 5.74% | 7.74% | 7.74% | 3.74% | 3.74% | |
| 2036–2040 | 3.74% | 5.74% | 5.74% | 1.74% | 1.74% | |
| FS | 2021–2025 | 6.52% | 7.02% | 7.02% | 6.02% | 6.02% |
| 2026–2030 | 5.52% | 6.02% | 6.02% | 5.02% | 5.02% | |
| 2031–2035 | 4.52% | 5.02% | 5.02% | 4.02% | 4.02% | |
| 2036–2040 | 3.52% | 4.02% | 4.02% | 3.02% | 3.02% |
Appendix C
| Impact Factor | Time Interval | BL | HDWC | HDSC | LDWC | LDSC |
|---|---|---|---|---|---|---|
| ES | 2021–2025 | −4.55% | −3.55% | −5.55% | −4.05% | −5.05% |
| 2026–2030 | −3.55% | −2.55% | −4.55% | −3.05% | −4.05% | |
| 2031–2035 | −2.55% | −1.55% | −3.55% | −2.05% | −3.05% | |
| 2036–2040 | −1.55% | −0.55% | −2.55% | −1.05% | −2.05% | |
| EG | 2021–2025 | −4.66% | −3.66% | −5.66% | −4.16% | −5.16% |
| 2026–2030 | −5.66% | −4.66% | −6.66% | −5.16% | −6.16% | |
| 2031–2035 | −6.66% | −5.66% | −7.66% | −6.16% | −7.16% | |
| 2036–2040 | −7.66% | −6.66% | −8.66% | −7.16% | −8.16% | |
| DUP | 2021–2025 | 6.28% | 6.78% | 6.78% | 5.78% | 5.78% |
| 2026–2030 | 5.28% | 5.78% | 5.78% | 4.78% | 4.78% | |
| 2031–2035 | 4.28% | 4.78% | 4.78% | 3.78% | 3.78% | |
| 2036–2040 | 3.28% | 3.78% | 3.78% | 2.78% | 2.78% | |
| UR | 2021–2025 | 2.97% | 3.17% | 3.17% | 2.77% | 2.77% |
| 2026–2030 | 2.67% | 2.87% | 2.87% | 2.47% | 2.47% | |
| 2031–2035 | 2.37% | 2.57% | 2.57% | 2.17% | 2.17% | |
| 2036–2040 | 2.07% | 2.27% | 2.27% | 1.87% | 1.87% | |
| POP | 2021–2025 | 0.68% | 0.88% | 0.88% | 0.48% | 0.48% |
| 2026–2030 | 0.48% | 0.68% | 0.68% | 0.28% | 0.28% | |
| 2031–2035 | 0.28% | 0.48% | 0.48% | 0.08% | 0.08% | |
| 2036–2040 | 0.08% | 0.08% | 0.08% | −0.12% | −0.12% | |
| TCO | 2021–2025 | 9.50% | 10.50% | 10.50% | 9.00% | 9.00% |
| 2026–2030 | 8.50% | 9.50% | 9.50% | 8.00% | 8.00% | |
| 2031–2035 | 7.50% | 8.50% | 8.50% | 7.00% | 7.00% | |
| 2036–2040 | 6.50% | 7.50% | 7.50% | 6.00% | 6.00% | |
| FDI | 2021–2025 | 7.82% | 8.82% | 8.82% | 6.82% | 6.82% |
| 2026–2030 | 6.82% | 7.82% | 7.82% | 5.82% | 5.82% | |
| 2031–2035 | 5.82% | 6.82% | 6.82% | 4.82% | 4.82% | |
| 2036–2040 | 4.82% | 5.82% | 5.82% | 3.82% | 3.82% | |
| FS | 2021–2025 | 13.32% | 14.32% | 14.32% | 12.32% | 12.32% |
| 2026–2030 | 12.32% | 13.32% | 13.32% | 11.32% | 11.32% | |
| 2031–2035 | 11.32% | 12.32% | 12.32% | 10.32% | 10.32% | |
| 2036–2040 | 10.32% | 11.32% | 11.32% | 9.32% | 9.32% |
Appendix D
| Impact Factor | Scenario | Low-Rate Peak | Low-Rate Time to Peak | Medium-Rate Peak | Medium-Rate Time to Peak | High-Rate Peak | High-Rate Time to Peak |
|---|---|---|---|---|---|---|---|
| ES | BL | 19.05 | 2035 | 18.77 | 2030 | 18.41 | 2030 |
| HDWC | 22.14 | 2035 | 21.70 | 2035 | 21.05 | 2035 | |
| HDSC | 19.35 | 2035 | 18.96 | 2035 | 18.58 | 2030 | |
| LDWC | 18.43 | 2030 | 18.19 | 2030 | 17.84 | 2030 | |
| LDSC | 17.42 | 2030 | 17.19 | 2030 | 16.91 | 2025 | |
| EG | BL | 19.56 | 2035 | 18.77 | 2030 | 18.21 | 2030 |
| HDWC | 22.14 | 2035 | 21.12 | 2035 | 20.14 | 2035 | |
| HDSC | 20.21 | 2035 | 19.29 | 2035 | 18.58 | 2030 | |
| LDWC | 18.43 | 2030 | 18.15 | 2030 | 17.60 | 2030 | |
| LDSC | 17.65 | 2030 | 17.12 | 2030 | 16.80 | 2025 | |
| DUP | BL | 18.52 | 2030 | 18.77 | 2030 | 19.07 | 2035 |
| HDWC | 21.20 | 2035 | 21.66 | 2035 | 22.14 | 2035 | |
| HDSC | 18.09 | 2030 | 18.34 | 2030 | 18.58 | 2030 | |
| LDWC | 18.43 | 2030 | 18.67 | 2030 | 18.93 | 2030 | |
| LDSC | 16.91 | 2025 | 17.09 | 2030 | 17.32 | 2030 | |
| UR | BL | 18.58 | 2030 | 18.77 | 2030 | 18.97 | 2035 |
| HDWC | 21.42 | 2035 | 21.78 | 2035 | 22.14 | 2035 | |
| HDSC | 18.19 | 2030 | 18.39 | 2030 | 18.58 | 2030 | |
| LDWC | 18.43 | 2030 | 18.62 | 2030 | 18.82 | 2030 | |
| LDSC | 16.91 | 2025 | 17.04 | 2030 | 17.22 | 2030 | |
| POP | BL | 18.52 | 2030 | 18.77 | 2030 | 18.90 | 2030 |
| HDWC | 21.45 | 2035 | 21.91 | 2035 | 22.14 | 2035 | |
| HDSC | 18.21 | 2030 | 18.46 | 2030 | 18.58 | 2030 | |
| LDWC | 18.43 | 2030 | 18.68 | 2030 | 18.80 | 2030 | |
| LDSC | 16.91 | 2025 | 17.09 | 2030 | 17.21 | 2030 | |
| RT | BL | 19.05 | 2035 | 18.77 | 2030 | 18.53 | 2030 |
| HDWC | 22.14 | 2035 | 21.69 | 2035 | 21.26 | 2035 | |
| HDSC | 19.15 | 2035 | 18.82 | 2030 | 18.58 | 2030 | |
| LDWC | 18.43 | 2030 | 18.19 | 2030 | 17.95 | 2030 | |
| LDSC | 17.30 | 2030 | 17.08 | 2030 | 16.91 | 2025 | |
| TCO | BL | 18.57 | 2030 | 18.77 | 2030 | 18.99 | 2035 |
| HDWC | 21.39 | 2035 | 21.76 | 2035 | 22.14 | 2035 | |
| HDSC | 18.18 | 2030 | 18.38 | 2030 | 18.58 | 2030 | |
| LDWC | 18.43 | 2030 | 18.63 | 2030 | 18.83 | 2030 | |
| LDSC | 16.91 | 2025 | 17.05 | 2030 | 17.23 | 2030 | |
| FDI | BL | 18.65 | 2030 | 18.77 | 2030 | 18.90 | 2030 |
| HDWC | 21.69 | 2035 | 21.91 | 2035 | 22.14 | 2035 | |
| HDSC | 18.34 | 2030 | 18.46 | 2030 | 18.58 | 2030 | |
| LDWC | 18.43 | 2030 | 18.55 | 2030 | 18.67 | 2030 | |
| LDSC | 16.91 | 2025 | 16.97 | 2030 | 17.08 | 2030 | |
| FS | BL | 18.68 | 2030 | 18.77 | 2030 | 18.86 | 2030 |
| HDWC | 21.81 | 2035 | 21.97 | 2035 | 22.14 | 2035 | |
| HDSC | 18.41 | 2030 | 18.49 | 2030 | 18.58 | 2030 | |
| LDWC | 18.43 | 2030 | 18.51 | 2030 | 18.60 | 2030 | |
| LDSC | 16.91 | 2025 | 16.95 | 2025 | 17.02 | 2030 |
Appendix E
| Impact Factor | Scenario | Low-Rate Peak | Low-Rate Time to Peak | Medium-Rate Peak | Medium-Rate Time to Peak | High-Rate Peak | High-Rate Time to Peak |
|---|---|---|---|---|---|---|---|
| ES | BL | 10.35 | 2030 | 10.01 | 2030 | 9.67 | 2030 |
| HDWC | 12.07 | 2035 | 11.44 | 2035 | 10.84 | 2035 | |
| HDSC | 10.54 | 2030 | 10.18 | 2030 | 9.84 | 2030 | |
| LDWC | 9.94 | 2030 | 9.61 | 2030 | 9.28 | 2030 | |
| LDSC | 9.50 | 2030 | 9.18 | 2030 | 8.93 | 2025 | |
| EG | BL | 10.46 | 2030 | 10.01 | 2030 | 9.56 | 2030 |
| HDWC | 12.07 | 2035 | 11.25 | 2035 | 10.54 | 2030 | |
| HDSC | 10.84 | 2035 | 10.30 | 2030 | 9.84 | 2030 | |
| LDWC | 9.96 | 2030 | 9.52 | 2030 | 9.10 | 2030 | |
| LDSC | 9.69 | 2030 | 9.27 | 2030 | 8.92 | 2025 | |
| DUP | BL | 9.74 | 2030 | 10.01 | 2030 | 10.28 | 2030 |
| HDWC | 11.04 | 2035 | 11.54 | 2035 | 12.07 | 2035 | |
| HDSC | 9.32 | 2030 | 9.58 | 2030 | 9.84 | 2030 | |
| LDWC | 9.74 | 2030 | 10.01 | 2030 | 10.28 | 2030 | |
| LDSC | 9.06 | 2030 | 9.31 | 2030 | 9.56 | 2030 | |
| UR | BL | 9.92 | 2030 | 10.01 | 2030 | 10.09 | 2030 |
| HDWC | 11.75 | 2035 | 11.91 | 2035 | 12.07 | 2035 | |
| HDSC | 9.67 | 2030 | 9.75 | 2030 | 9.84 | 2030 | |
| LDWC | 9.74 | 2030 | 9.82 | 2030 | 9.91 | 2030 | |
| LDSC | 9.06 | 2030 | 9.14 | 2030 | 9.22 | 2030 | |
| POP | BL | 10.08 | 2030 | 10.01 | 2030 | 9.93 | 2030 |
| HDWC | 12.07 | 2035 | 11.92 | 2035 | 11.78 | 2035 | |
| HDSC | 9.84 | 2030 | 9.76 | 2030 | 9.69 | 2030 | |
| LDWC | 9.89 | 2030 | 9.82 | 2030 | 9.74 | 2030 | |
| LDSC | 9.20 | 2030 | 9.13 | 2030 | 9.06 | 2030 | |
| TCO | BL | 9.93 | 2030 | 10.01 | 2030 | 10.08 | 2030 |
| HDWC | 11.80 | 2035 | 11.94 | 2035 | 12.07 | 2035 | |
| HDSC | 9.70 | 2030 | 9.77 | 2030 | 9.84 | 2030 | |
| LDWC | 9.74 | 2030 | 9.81 | 2030 | 9.88 | 2030 | |
| LDSC | 9.06 | 2030 | 9.12 | 2030 | 9.19 | 2030 | |
| FDI | BL | 9.92 | 2030 | 10.01 | 2030 | 10.09 | 2030 |
| HDWC | 11.76 | 2035 | 11.91 | 2035 | 12.07 | 2035 | |
| HDSC | 9.68 | 2030 | 9.76 | 2030 | 9.84 | 2030 | |
| LDWC | 9.74 | 2030 | 9.82 | 2030 | 9.90 | 2030 | |
| LDSC | 9.06 | 2030 | 9.13 | 2030 | 9.21 | 2030 | |
| FS | BL | 9.96 | 2030 | 10.01 | 2030 | 10.05 | 2030 |
| HDWC | 11.91 | 2035 | 11.99 | 2035 | 12.07 | 2035 | |
| HDSC | 9.76 | 2030 | 9.80 | 2030 | 9.84 | 2030 | |
| LDWC | 9.74 | 2030 | 9.78 | 2030 | 9.82 | 2030 | |
| LDSC | 9.06 | 2030 | 9.10 | 2030 | 9.13 | 2030 |
Appendix F
| Impact Factor | Scenario | Low-Rate Peak | Low-Rate Time to Peak | Medium-Rate Peak | Medium-Rate Time to Peak | High-Rate Peak | High-Rate Time to Peak |
|---|---|---|---|---|---|---|---|
| ES | BL | 4.74 | 2040 | 4.04 | 2035 | 3.62 | 2035 |
| HDWC | 6.04 | 2040 | 5.13 | 2040 | 4.34 | 2040 | |
| HDSC | 4.93 | 2040 | 4.18 | 2040 | 3.69 | 2035 | |
| LDWC | 4.36 | 2040 | 3.80 | 2035 | 3.51 | 2030 | |
| LDSC | 3.98 | 2035 | 3.60 | 2030 | 3.46 | 2025 | |
| EG | BL | 4.45 | 2040 | 4.04 | 2035 | 3.74 | 2035 |
| HDWC | 6.04 | 2040 | 5.46 | 2040 | 4.93 | 2040 | |
| HDSC | 4.34 | 2040 | 3.97 | 2035 | 3.69 | 2030 | |
| LDWC | 4.23 | 2040 | 3.89 | 2035 | 3.65 | 2030 | |
| LDSC | 3.71 | 2030 | 3.54 | 2030 | 3.47 | 2025 | |
| DUP | BL | 3.90 | 2035 | 4.04 | 2035 | 4.22 | 2040 |
| HDWC | 5.50 | 2040 | 5.76 | 2040 | 6.04 | 2040 | |
| HDSC | 3.54 | 2030 | 3.61 | 2030 | 3.69 | 2030 | |
| LDWC | 4.04 | 2035 | 4.21 | 2040 | 4.42 | 2040 | |
| LDSC | 3.50 | 2025 | 3.53 | 2025 | 3.60 | 2030 | |
| UR | BL | 3.99 | 2035 | 4.04 | 2035 | 4.09 | 2040 |
| HDWC | 5.86 | 2040 | 5.95 | 2040 | 6.04 | 2040 | |
| HDSC | 3.64 | 2030 | 3.66 | 2030 | 3.69 | 2030 | |
| LDWC | 4.04 | 2035 | 4.09 | 2035 | 4.15 | 2040 | |
| LDSC | 3.50 | 2025 | 3.51 | 2025 | 3.53 | 2025 | |
| POP | BL | 3.98 | 2035 | 4.04 | 2035 | 4.10 | 2035 |
| HDWC | 5.87 | 2040 | 5.96 | 2040 | 6.04 | 2040 | |
| HDSC | 3.62 | 2030 | 3.65 | 2030 | 3.69 | 2030 | |
| LDWC | 4.04 | 2035 | 4.10 | 2035 | 4.16 | 2035 | |
| LDSC | 3.50 | 2025 | 3.52 | 2025 | 3.53 | 2025 | |
| TCO | BL | 4.00 | 2035 | 4.04 | 2035 | 4.12 | 2040 |
| HDWC | 5.83 | 2040 | 5.90 | 2040 | 6.04 | 2040 | |
| HDSC | 3.63 | 2030 | 3.65 | 2030 | 3.69 | 2030 | |
| LDWC | 4.04 | 2035 | 4.08 | 2035 | 4.17 | 2040 | |
| LDSC | 3.50 | 2025 | 3.51 | 2025 | 3.53 | 2025 | |
| FDI | BL | 4.00 | 2035 | 4.04 | 2035 | 4.08 | 2040 |
| HDWC | 5.88 | 2040 | 5.96 | 2040 | 6.04 | 2040 | |
| HDSC | 3.64 | 2030 | 3.67 | 2030 | 3.69 | 2030 | |
| LDWC | 4.04 | 2035 | 4.08 | 2035 | 4.13 | 2040 | |
| LDSC | 3.50 | 2025 | 3.51 | 2025 | 3.52 | 2025 | |
| FS | BL | 3.96 | 2035 | 4.04 | 2035 | 4.13 | 2040 |
| HDWC | 5.74 | 2040 | 5.89 | 2040 | 6.04 | 2040 | |
| HDSC | 3.60 | 2030 | 3.64 | 2030 | 3.69 | 2030 | |
| LDWC | 4.04 | 2035 | 4.12 | 2040 | 4.23 | 2040 | |
| LDSC | 3.50 | 2025 | 3.52 | 2025 | 3.54 | 2030 |
References
- Liu, Y.; He, S.; Jiang, Y.; Luo, X.; Yuan, J. Spatial-temporal decomposition of carbon emission in China’s four major urban agglomerations. Clim. Change Res. 2024, 20, 231–241. [Google Scholar]
- Du, K.; Xie, C.; Ouyang, X. A Comparison of Carbon Dioxide (CO2) Emission Trends among Provinces in China. Renew. Sustain. Energy Rev. 2017, 73, 19–25. [Google Scholar] [CrossRef]
- Yang, P.; Liang, X.; Drohan, P.J. Using Kaya and LMDI Models to Analyze Carbon Emissions from the Energy Consumption in China. Environ. Sci. Pollut. Res. Int. 2020, 27, 26495–26501. [Google Scholar] [CrossRef] [PubMed]
- Du, W.; Liu, X.; Liu, Y.; Xie, J. Digital Economy and Carbon Emission Efficiency in Three Major Urban Agglomerations of China: A U-Shaped Journey towards Green Development. J. Environ. Manag. 2025, 373, 123571. [Google Scholar] [CrossRef]
- Kaya, Y. Impact of Carbon Dioxide Emission Control on GNP Growth: Interpretation of Proposed Scenarios; IPCC Energy and Industry Subgroup, Response Strategies Working Group: Paris, France, 1990; Available online: https://www.researchgate.net/publication/312468754 (accessed on 13 March 2025).
- Li, S.; Yao, L.; Zhang, Y.; Zhao, Y.; Sun, L. China’s Provincial Carbon Emission Driving Factors Analysis and Scenario Forecasting. Environ. Sustain. Indic. 2024, 22, 100390. [Google Scholar] [CrossRef]
- Jiang, J.; Ye, B.; Xie, D.; Tang, J. Provincial-Level Carbon Emission Drivers and Emission Reduction Strategies in China: Combining Multi-Layer LMDI Decomposition with Hierarchical Clustering. J. Clean. Prod. 2017, 169, 178–190. [Google Scholar] [CrossRef]
- Chen, C.; Luo, Y.; Zou, H.; Huang, J. Understanding the Driving Factors and Finding the Pathway to Mitigating Carbon Emissions in China’s Yangtze River Delta Region. Energy 2023, 278, 127897. [Google Scholar] [CrossRef]
- Yu, Y.; Dai, Y.; Xu, L.; Zheng, H.; Wu, W.; Chen, L. A Multi-Level Characteristic Analysis of Urban Agglomeration Energy-Related Carbon Emission: A Case Study of the Pearl River Delta. Energy 2023, 263, 125651. [Google Scholar] [CrossRef]
- Tarazkar, M.H.; Dehbidi, N.K.; Ozturk, I.; Al-Mulali, U. The Impact of Age Structure on Carbon Emission in the Middle East: The Panel Autoregressive Distributed Lag Approach. Environ. Sci. Pollut. Res. 2021, 28, 33722–33734. [Google Scholar] [CrossRef]
- Du, Y.; Huang, T. Impact of Demographic Factors on Carbon Emission in Jiangsu Province. Resour. Environ. Yangtze Basin 2013, 22, 399–404. [Google Scholar]
- Du, M.; Antunes, J.; Wanke, P.; Chen, Z. Ecological Efficiency Assessment under the Construction of Low-Carbon City: A Perspective of Green Technology Innovation. J. Environ. Plan. Manag. 2022, 65, 1727–1752. [Google Scholar] [CrossRef]
- Zhang, J.; Fu, M.; Wang, L.; Liang, Y.; Tang, F.; Li, S.; Wu, C. Impact of Urban Shrinkage on Pollution Reduction and Carbon Mitigation Synergy: Spatial Heterogeneity and Interaction Effects in Chinese Cities. Land 2025, 14, 537. [Google Scholar] [CrossRef]
- Liu, H.; Liu, W.; Tang, Z. The Origin Source and Elasticity Analysis of the CO2 Emission Induced by Fossil Fuel Using Industrial Activities in China. Prog. Geogr. 2010, 29, 670–676. [Google Scholar]
- Wu, Z.; Xie, X.; Wang, S. The Influence of Economic Development and Industrial Structure to Carbon Emission Based on China’s Provincial Panel Data. Chin. J. Manag. Sci. 2012, 20, 161–166. [Google Scholar]
- Dong, B.; Xu, Y.; Fan, X. How to Achieve a Win-Win Situation between Economic Growth and Carbon Emission Reduction: Empirical Evidence from the Perspective of Industrial Structure Upgrading. Environ. Sci. Pollut. Res. 2020, 27, 43829–43844. [Google Scholar] [CrossRef] [PubMed]
- Wang, S.; Zhao, Y.; Zhang, W.; Liu, Y. Analysis on Influencing Factors of Carbon Emission and Scenario Forecast of Carbon Peak in Beijing-Tianjin-Hebei—A Perspective of Supply-side Reform. J. Beijing Inst. Technol. (Soc. Sci. Ed.) 2022, 24, 54–66. [Google Scholar]
- Zang, H.; Yang, W.; Zhang, J.; Wu, P.; Cao, L.; Xu, Y. Research on Carbon Dioxide Emissions Peaking in Beijing-Tianjin-Hebei City Agglomeration. Environ. Eng. 2020, 38, 19–24, 77. [Google Scholar]
- Liu, B.; Tian, C.; Li, Y.; Song, H.; Zhanxin, M. Research on the Effects of Urbanization on Carbon Emissions Efficiency of Urban Agglomerations in China. J. Clean. Prod. 2018, 197, 1374–1381. [Google Scholar] [CrossRef]
- Cai, A.; Wang, L.; Zhang, Y.; Wu, H.; Zhang, H.; Guo, R.; Wu, J. Uncovering the Multiple Socio-Economic Driving Factors of Carbon Emissions in Nine Urban Agglomerations of China Based on Machine Learning. Energy 2025, 319, 134859. [Google Scholar] [CrossRef]
- Miao, A.; Yuan, Y.; Wu, H.; Ma, X.; Shao, C. Pathway and Policy for China’s Provincial Carbon Emission Peak. Environ. Sci. 2023, 44, 4623–4636. [Google Scholar]
- Cong, Y.; Cheng, S.; Feng, W. Study on Energy Demand an Carbon Peaking Time Prediction in Jilin Province Based on the LEAP Model. Mod. Chem. Res. 2023, 20, 182–184. [Google Scholar]
- Wang, Y.; Ma, L. Analysis and Forecast of Related Factors of Energy Consumption Carbon Emission in Jilin Province: Baswd on Grey Relational Analysis and GM(1,1) Model. Ecol. Econ. 2016, 32, 65–70. [Google Scholar]
- Li, X.; Su, S.; Zhang, Y.; Zhu, X. Carbon Emission Prediction and Carbon Peak Path Analysis in Fujian Province. Resour. Dev. Mark. 2023, 39, 139–147. [Google Scholar]
- Xie, P.; Liao, J.; Pan, X.; Sun, F. Will China’s Carbon Intensity Achieve Its Policy Goals by 2030? Dynamic Scenario Analysis Based on STIRPAT-PLS Framework. Sci. Total Environ. 2022, 832, 155060. [Google Scholar] [CrossRef]
- Chen, T.; Li, X.; Chen, B. Decomposition of influencing factors and peak prediction of carbon emissions in China. J. Saf. Environ. 2024, 24, 396–406. [Google Scholar]
- Zou, Y.; Huang, M. Carbon Emissions in Urban Agglomerations: Feature Mining, Formation Mechanism and Peak Intervention. J. Beijing Inst. Technol. (Soc. Sci. Ed.) 2023, 25, 56–67. [Google Scholar]
- Han, M.; Xiong, J.; Wang, S.; Yang, Y. Chinese Photovoltaic Poverty Alleviation: Geographic Distribution, Economic Benefits and Emission Mitigation. Energy Policy 2020, 144, 111685. [Google Scholar] [CrossRef]
- Liang, X.; Fan, M.; Huang, X.; Cai, C.; Zhou, L.; Wang, Y. Spatial Distributed Characteristics of Carbon Dioxide Emissions Based on Fossil Energy Consumption and Their Driving Factors at Provincial Scale in China. Energy 2024, 309, 133062. [Google Scholar] [CrossRef]
- Qin, H.; Huang, Q.; Zhang, Z.; Lu, Y.; Li, M.; Xu, L.; Chen, Z. Carbon Dioxide Emission Driving Factors Analysis and Policy Implications of Chinese Cities: Combining Geographically Weighted Regression with Two-Step Cluster. Sci. Total Environ. 2019, 684, 413–424. [Google Scholar] [CrossRef]
- Guo, Y.; Guo, W. Determination of Discriminating Coefficient in Grey Correlation Analysis. Arid Environ. Monit. 1994, 8, 132–135, 190. [Google Scholar]
- Xing, S.M.; Feng, X.X.; Shui, Z.X. Determination of Discrimination Coefficient in Grey Incidence Analysis. J. Air Force Eng. Univ. (Nat. Sci. Ed.) 2003, 4, 68–70. [Google Scholar]
- Ang, B.W.; Liu, N. Handling Zero Values in the Logarithmic Mean Divisia Index Decomposition Approach. Energy Policy 2007, 35, 238–246. [Google Scholar] [CrossRef]
- Ortega-Ruiz, G.; Mena-Nieto, A.; García-Ramos, J.E. Is India on the Right Pathway to Reduce CO2 Emissions? Decomposing an Enlarged Kaya Identity Using the LMDI Method for the Period 1990–2016. Sci. Total Environ. 2020, 737, 139638. [Google Scholar] [CrossRef]
- Yang, J.; Cai, W.; Ma, M.; Li, L.; Liu, C.; Ma, X.; Li, L.; Chen, X. Driving Forces of China’s CO2 Emissions from Energy Consumption Based on Kaya-LMDI Methods. Sci. Total Environ. 2020, 711, 134569. [Google Scholar] [CrossRef]
- Li, J.; Li, H. Analysis of Carbon Emission Factors Decomposition and Emission Reduction Potetial of Beijing-Tianjin-Hebei Regional Petrochemical Industry from the Perspective of Industrial Transfer. Res. Environ. Sci. 2020, 33, 324–332. [Google Scholar]
- Huang, Y.; Wang, Y.; Peng, J.; Li, F.; Zhu, L.; Zhao, H.; Shi, R. Can China Achieve Its 2030 and 2060 CO2 Commitments? Scenario Analysis Based on the Integration of LEAP Model with LMDI Decomposition. Sci. Total Environ. 2023, 888, 164151. [Google Scholar] [CrossRef] [PubMed]
- Jiansheng, W.U.; Yan, N.; Jian, P.; Zheng, W.; Xiulan, H. Research on Energy Consumption Dynamic among Prefecture-Level Cities in China Based on DMSP/OLS Nighttime Light. Geogr. Res. 2014, 33, 625–634. [Google Scholar]
- Li, C.; Zhou, W. Can Digital Economy Development Contribute to Urban Carbon Emission Reduction?—Empirical Evidence from China. J. Environ. Manag. 2024, 357, 120680. [Google Scholar] [CrossRef]
- Zhao, F.; Wang, Y.; Wu, G.L. Chinese Provincial Energy Consumption Intensity Prediction by the CGM (1,1). Energy 2024, 292, 130626. [Google Scholar] [CrossRef]
- Korkmaz, Z. Do Environment-Related Technologies, Urbanization, Trade Openness, and Income Impact Energy Consumption and Intensity? Energy Effic. 2024, 17, 93. [Google Scholar] [CrossRef]
- Liu, D.; Xiao, B. Can China Achieve Its Carbon Emission Peaking? A Scenario Analysis Based on STIRPAT and System Dynamics Model. Ecol. Indic. 2018, 93, 647–657. [Google Scholar] [CrossRef]
- Xiong–tian, S.H.I.; Feng–qing, W.U.; Yang, C.; Li-li, D.A.I. Analysis of Factors Influencing Carbon Emissions in the Yangtze River Delta Region and Projections of Carbon Peak Scenarios. Ecol. Econ. 2024, 20, 2–24. [Google Scholar]
- Chen, P.; Wang, X.; Yang, Z.; Shi, C. Research on Spatial Heterogeneity, Impact Mechanism, and Carbon Peak Prediction of Carbon Emissions in the Yangtze River Delta Urban Agglomeration. Energies 2024, 17, 5899. [Google Scholar] [CrossRef]
- Dong, S.; Gong, Y.; Wang, Z.; Incecik, A. Wind and Wave Energy Resources Assessment around the Yangtze River Delta. Ocean Eng. 2019, 182, 75–89. [Google Scholar] [CrossRef]
- Gao, S.; Zhang, X.; Chen, M. Spatiotemporal Dynamics and Driving Forces of City-Level CO2 Emissions in China from 2000 to 2019. J. Clean. Prod. 2022, 377, 134358. [Google Scholar] [CrossRef]


| Factor Type | Initial Screening of Impact Factor | Connotation | Symbol | Unit of Measure |
|---|---|---|---|---|
| Energy factor | Energy structure | Carbon emissions/Total energy consumption | ES | T/Tce |
| Energy intensity | Total energy consumption/GDP | EG | tce/10,000 yuan | |
| Economic factor | Economic development | Per capita urban GDP | DUP | 10,000 yuan/p |
| Population factor | Size of population | Permanent population | POP | 10,000 people |
| Industrial factor | Industrial structure | Share of secondary industry | RS | % |
| Share of tertiary sector | RT | % | ||
| Social factor | Urbanization level | Urbanization rate | UR | % |
| Degree of openness to the outside world | Total exports and imports | TEV | Billion yuan | |
| Foreign direct investment | FDI | Billion yuan | ||
| Transportation | Civilian vehicle ownership | TCO | 10,000 vehicles | |
| Governmental intervention | Public financial expenditure | FS | Billion yuan |
| Impact Factor | Correlation of the YRD | Correlation of the TCC | Correlation of the CCA |
|---|---|---|---|
| ES | 0.6767 | 0.7448 | 0.5872 |
| EG | 0.5493 | 0.6747 | 0.4200 |
| DUP | 0.5610 | 0.5051 | 0.4029 |
| POP | 0.6969 | 0.6389 | 0.8017 |
| RS | 0.3579 | 0.3274 | 0.3244 |
| RT | 0.5919 | 0.3770 | 0.4594 |
| UR | 0.4125 | 0.5127 | 0.3860 |
| TEV | 0.6869 | 0.6797 | 0.7674 |
| FDI | 0.7443 | 0.6712 | 0.7506 |
| TCO | 0.7042 | 0.6976 | 0.7778 |
| FS | 0.6947 | 0.7237 | 0.8138 |
| Impact Factor | Cumulative Effect in the YRD (Mt) | Cumulative Effect in the TCC (Mt) | Cumulative Effect in the CCA (Mt) |
|---|---|---|---|
| ES | −32.87 | −266.32 | −104.49 |
| EG | −1043.90 | −436.39 | −231.10 |
| DUP | 1125.07 | 789.85 | 322.40 |
| UR | 381.30 | 343.52 | 159.72 |
| POP | 305.05 | 26.85 | 24.75 |
| Urban Agglomeration | lnES | lnEG | lnDUP | lnUR | lnPOP | lnRT | lnTCO | lnFDI | lnFS | (lnDUP)2 | Mean VIF |
|---|---|---|---|---|---|---|---|---|---|---|---|
| YRD | 1.82 | 5.14 | 65.15 | 6.28 | 13.58 | 4.72 | 13.22 | 5.41 | 15.63 | 54.87 | 18.58 |
| TCC | 1.52 | 2.20 | 29.16 | 4.07 | 5.86 | 16.33 | 1.96 | 13.90 | 25.20 | 11.13 | |
| CCA | 1.86 | 2.17 | 76.41 | 8.27 | 16.58 | 39.60 | 5.16 | 14.79 | 62.56 | 25.27 |
| Variant | YRD | TCC | CCA |
| lnES | 0.718 *** | 0.738 *** | 0.843 *** |
| lnEG | 0.313 *** | 0.482 *** | 0.503 *** |
| lnDUP | 0.131 *** | 0.263 *** | 0.179 *** |
| lnUR | 0.595 *** | 0.493 *** | 0.419 *** |
| lnPOP | 0.379 *** | 0.432 *** | 0.534 *** |
| lnRT | −0.294 *** | — | — |
| lnTCO | 0.131 *** | 0.088 *** | 0.137 *** |
| lnFDI | 0.149 *** | 0.05 *** | 0.075 *** |
| lnFS | 0.112 *** | 0.098 *** | 0.151 *** |
| (lnDUP)2 | 0.03 *** | 0.07 *** | 0.059 *** |
| Constant | 1.925 *** | 0.913 *** | 0.07 |
| k | 0.141 | 0.2 | 0.143 |
| R2 | 0.963 | 0.906 | 0.978 |
| Adj-R2 | 0.962 | 0.905 | 0.977 |
| Scenario | ES | EG | DUP | UR | POP | RT | TCO | FDI | FS |
|---|---|---|---|---|---|---|---|---|---|
| BL | M | M | M | M | M | M | M | M | M |
| HDWC | H | H | H | H | H | L | H | H | H |
| HDSC | L | L | H | H | H | H | H | H | H |
| LDWC | H | H | L | L | L | L | L | L | L |
| LDSC | L | L | L | L | L | H | L | L | L |
Disclaimer/Publisher’s Note: The statements, opinions and data contained in all publications are solely those of the individual author(s) and contributor(s) and not of MDPI and/or the editor(s). MDPI and/or the editor(s) disclaim responsibility for any injury to people or property resulting from any ideas, methods, instructions or products referred to in the content. |
© 2025 by the authors. Licensee MDPI, Basel, Switzerland. This article is an open access article distributed under the terms and conditions of the Creative Commons Attribution (CC BY) license (https://creativecommons.org/licenses/by/4.0/).
Share and Cite
Zhou, Z.; Jiang, P.; Chen, S. Decomposition of Carbon Emission Drivers and Carbon Peak Forecast for Three Major Urban Agglomerations in the Yangtze River Economic Belt. Sustainability 2025, 17, 2689. https://doi.org/10.3390/su17062689
Zhou Z, Jiang P, Chen S. Decomposition of Carbon Emission Drivers and Carbon Peak Forecast for Three Major Urban Agglomerations in the Yangtze River Economic Belt. Sustainability. 2025; 17(6):2689. https://doi.org/10.3390/su17062689
Chicago/Turabian StyleZhou, Ziqian, Ping Jiang, and Shun Chen. 2025. "Decomposition of Carbon Emission Drivers and Carbon Peak Forecast for Three Major Urban Agglomerations in the Yangtze River Economic Belt" Sustainability 17, no. 6: 2689. https://doi.org/10.3390/su17062689
APA StyleZhou, Z., Jiang, P., & Chen, S. (2025). Decomposition of Carbon Emission Drivers and Carbon Peak Forecast for Three Major Urban Agglomerations in the Yangtze River Economic Belt. Sustainability, 17(6), 2689. https://doi.org/10.3390/su17062689