Article

Study of the Safety–Economy–Environmental Protection Coordination of Beijing’s Natural Gas Industry Based on a Coupling Coordination Degree Model

1
School of Economics and Management, Southwest Petroleum University, Chengdu 610500, China
2
School of Civil Engineering and Geomatics, Southwest Petroleum University, Chengdu 610500, China
*
Author to whom correspondence should be addressed.
Sustainability 2025, 17(6), 2686; https://doi.org/10.3390/su17062686
Submission received: 17 January 2025 / Revised: 9 March 2025 / Accepted: 13 March 2025 / Published: 18 March 2025

Abstract

:
Under the guidance of high-quality development goals, the energy industry should not only pay attention to the development level but also to the coordination effect among multiple elements. In the process of low-carbon development, natural gas plays an important transitional role as a clean fossil energy. In this study, by introducing the theoretical perspective of energy trilemma, a comprehensive measurement system of the three-dimensional development level of the regional natural gas industry was constructed. Then, in order to overcome the limitation that the coordination effect is weakened due to the concentration of function values, an improved coupling coordination model was established based on the redefined coupling degree distribution function. Next, based on actual data from Beijing from 2006 to 2022, the safety–economy–environmental protection development level of the natural gas industry was empirically analyzed, and the coupling coordination degree of multi-dimensional factors was deeply investigated. The empirical results reveal the following: (1) Beijing is one of the largest natural gas consumption markets in China, so the economy level of its natural gas industry was relatively high. However, the safety level and environmental protection level needed to be improved. This is mainly due to the scarce resource endowment, and the dependence of economic growth on fossil energy. (2) The coupling coordination degree showed a fluctuating upward trend. The coordination degree of safety and environmental protection was the best, mainly because they coexisted and promoted each other at the policy level. The coordination degree of safety and economy was also relatively high, mainly because supply security could provide resource support for market expansion and stabilize price levels. Meanwhile, a prosperous market would stimulate energy exploration and infrastructure extension. This study will help to provide a high-quality development plan for the natural gas industry for solving the regional energy trilemma.

1. Introduction

The history of energy development is a transformative history of human social progress. The energy revolution is accompanied by a huge leap in productivity and significant progress in human civilization [1]. Since the industrial revolution, human beings have endlessly exploited and utilized fossil energy on a large scale. This causes the world’s energy development to face difficulties such as resource shortage, environmental pollution, and climate change, and poses a serious threat to human survival and development. Since 2020, under the influence of the global outbreak of the COVID-19 epidemic, the intensification of big power games, and the promotion of low-carbon transformation, the global energy market has entered a period of rapid turmoil and change. In particular, the Russia–Ukraine conflict that broke out at the beginning of 2022 triggered a sharp change in the geopolitical situation [2]. It has led to the most serious risks and challenges faced by the global energy market in over 50 years. As a global economic power, China is also an important energy producer, energy consumer, and energy importer. The great changes in the global energy market have had a profound impact on China’s economy and society [3]. Therefore, it is necessary to plan ahead and properly handle the relationship between energy supply security, economic feasibility, and low-carbon transformation.
Under the new development pattern, the energy trilemma (accessibility, cheapness, and cleanliness) is a fundamental problem that must be solved in global energy management. It will take several years or decades to realize the possible triangle balance of energy industry development. In the process of energy transition from high carbon to low carbon or even zero carbon, natural gas is an indispensable clean fossil energy source. Specifically, natural gas is stable, non-toxic, lighter in density than air, and less prone to explosion. Referring to the “2006 IPCC Guidelines for National Greenhouse Gas Inventories”, the CO2 emission factor per unit calorific value of natural gas is only 56,100 kg/TJ and 1 kg/TJ. This is significantly lower than the average emission level of 90,000 kg/TJ for coal products and 70,000 kg/TJ for oil products. In this regard, the clean characteristics of natural gas determine its transformation advantage of replacing high-carbon fossil energy. Meanwhile, the flexible and easy-to-store characteristics determine its development advantage in integrating with new energy. Therefore, natural gas is a transitional energy source to ensure national energy supply security and achieve the goals of carbon peaking and carbon neutrality. However, although natural gas is regarded as clean fossil energy, its continuous popularization and utilization will still cause the scale effect of greenhouse gas emissions. In addition, China’s external dependence on natural gas consumption exceeds 40%, and the contradiction between energy supply and demand is increasingly prominent [4]. In this context, it is particularly important to carry out a coordination analysis of the safety, economy, and environmental protection of the natural gas industry. This will help to solve the energy trilemma of the natural gas industry, and then promote the high-quality development of China’s overall energy industry.
As the capital of China, Beijing is one of the largest natural gas consumption cities in the country, with a total supply of 20.61 billion m3 in 2023 [5]. Meanwhile, with technical progress and policy support, natural gas exploration and production in Beijing have been vigorously promoted in recent years. The construction of gas transmission and distribution pipelines has also been continuously improved. As clean fossil energy, natural gas plays a key role in Beijing’s air pollution control and energy transformation. In addition, Beijing belongs to the major regional development strategy of the Beijing–Tianjin–Hebei city clusters. Therefore, it plays an important role in accelerating the construction of a new pattern of regional coordinated development.
The major contributions of this study are as follows: (1) The theoretical perspective of energy trilemma is introduced into the study of high-quality development in the regional natural gas industry. Meanwhile, it is pointed out that high-quality development needs to pay attention not only to the development level but also to the coordination degree of multiple elements. (2) By redefining the redundancy of entropy values, an improved entropy weight calculation model is established. It is helpful to avoid the defect that the small difference between entropy values may cause the entropy weights of different indicators to change exponentially. (3) Based on the redefined coupling degree distribution function, an improved coupling coordination model is established. This is helpful to overcome the limitation that the coordination effect is weakened due to the concentration of function values. In this regard, the scientificity and accuracy of coupling coordination degree evaluation can be enhanced.
The rest of this article is structured as follows: The literature review is presented in Section 2. The model and data are presented in Section 3. The empirical analysis is presented in Section 4. The main conclusions and policy implications are presented in Section 5.

2. Literature Review

The impossible triangle theory first appeared in the financial field. That is, open macroeconomics holds that a country cannot simultaneously achieve free capital flow, independent monetary policy, and exchange rate stability in the financial field. In 2011, the World Energy Council (WEC) proposed the term “energy trilemma” [6]. It is believed that after the establishment of the modern energy economic system, there will be no Pareto improvement space between the three major development directions of security supply, low price, and clean utilization. The optimization of any target direction will correspondingly cause the deterioration of other directions [7]. For the triangle game in the energy field, safety and reliability are the basic requirements for the energy system. Meanwhile, only an economically feasible energy system can be accepted by society. In addition, environmental protection is the general goal of energy transformation. The new energy system must gradually realize the balanced development of these three-dimensional goals in order to finally enter the stage of high-quality development. For the energy trilemma analysis, the existing research mainly focuses on the following aspects: Firstly, the development level measurement of energy safety, economy, and environmental protection. This is mainly to establish a comprehensive evaluation indicator system. Then, the development level of energy security, economy, and environmental protection is measured by using mathematical methods such as grey analysis, entropy weight, and principal component analysis [8]. Marti et al. [9] evaluated the performance of energy systems in 128 countries based on the world energy triad index (energy security, energy equity, and environmental sustainability) issued by the WEC. However, this study did not include a specific quantitative model for measuring the system development level. Zhao et al. [10] established a comprehensive index system for measuring the energy trilemma based on the three dimensions of safety, economy, and sustainability. Then, by using the entropy weight method, the regional heterogeneity of 30 provinces in China was investigated based on panel data from 2000 to 2019. The results showed that the energy trilemma in Northeast China was severe, which may be related to its industrial development history. Yap et al. [11] extended the energy trilemma proposed by the WEC into four dimensions: self-sufficiency, price, supply, and carbon emissions. Then, the analytic hierarchy process model was selected to obtain the indicator weights. However, it is worth noting that self-sufficiency and supply essentially have similarities in connotation. Khan et al. [12,13] selected the top 10 countries in the world with the highest sustainable development target indexes as the research object. Then, the principal component analysis method was used to combine energy security, energy affordability, and energy sustainability into a comprehensive score. The score could measure the dilemma of energy balance and its impact on economic growth and environmental sustainability. Secondly, the evaluation research on the coordination relationship of energy safety, economy, and environmental protection. Heffron et al. [14] took the measurement results of the three-dimensional development level as the basic data. Then, by comparing with the ideal equilibrium point, the ternary diagram was selected to investigate the coordination level among safety, economy, and environmental protection. Stempien et al. [15] proposed a new quantitative tool for solving the energy trilemma based on the modified Markowitz mean-variance model. However, the model was mainly applicable to the optimization selection analysis of power generation technology combinations. Therefore, its consideration of social and institutional factors was not comprehensive enough. Lowitzsch et al. [16] described the optimal evolution path of three-dimensional coupling of security, economy, and sustainability from the perspective of the energy community. Behera et al. [17] evaluated the balance degree of energy trilemma with scores ranging from 0 to 100. They proposed that when the score was small, it was difficult for the energy system to achieve coordination balance and needed to be improved. Heffronv et al. [18] established a comprehensive simulation model of an integrated power system and systematically evaluated the coordination evolution of energy trilemma in Indonesia under different electricity price systems. Shah et al. [19] evaluated the causal relationship between the three elements of energy trilemma based on the fuzzy decision-making laboratory analysis method. However, the study lacked the coordination effect analysis. Shankar et al. [20] selected the building system in the tropical savanna climate as the research object and evaluated the coordination level of energy trilemma based on the multi-objective optimal size method.
On the whole, the existing research has provided some theoretical guidance for solving the energy trilemma, but it needs to be further improved in the following aspects: Firstly, the existing research mainly integrates multiple indicators into a comprehensive index and quantitatively measures the overall development level of the energy trilemma. In this regard, it lacks the targeted analysis of various dimensions of safety, economy, or environmental protection [21,22,23]. Meanwhile, for the analysis of coordination relationships, the existing research mainly focuses on exploring the optimal balance point. In this regard, it ignores the evaluation of the coupling coordination degree between two dimensions and three dimensions. This is not conducive to investigating the status quo of coordination and clarifying the key points for optimization [24,25]. Secondly, the ongoing third energy transformation is in its infancy, and the development and utilization of clean fossil energy is an important part [26]. In this regard, due to the advantages of low-carbon and high efficiency, natural gas will gradually replace coal and oil as the main energy source during the transition period [27]. However, the existing research is mainly based on the analysis perspective of the overall energy system, lacking targeted analysis focusing on the key energy industries, such as natural gas [28,29,30]. The high-quality development of the natural gas industry will lay a solid foundation for the realization of three-dimensional coordinated development in the energy field of China or even the whole world. On the basis of measuring the development level of the regional natural gas industry, this study systematically investigates the coupling coordination degree among safety, economy, and environmental protection. This is helpful to grasp the future development orientation on the basis of clarifying the historical evolution law, thus making up for the shortcomings of the existing research.

3. Model and Data

3.1. Establishment of Indicator System

Based on the connotation of energy trilemma [31,32,33,34], establishing a reasonable development level measurement system is the logical starting point to accurately evaluate the coupling coordination degree of the safety, economy, and environmental protection of the natural gas industry. The safety dimension focuses on the security and stability level of natural gas supply from the perspective of industrial macro-development. The elements specifically include output elasticity, per capita supply level, self-sufficiency rate, resource endowment, transportation capacity, etc. The economy dimension focuses on the factors that affect the economic feasibility of natural gas. The elements specifically include popularization level, market size, per capita demand, price index, etc. The dimension of environmental protection focuses on the impact of the natural gas industry on the ecological environment and its governance level. The elements specifically include CO2 and pollutant emissions, governance investment, and the environmental contribution of natural gas replacing high-carbon fossil energy. Considering the principles of scientificity, comprehensiveness, and the data availability of the indicators, a comprehensive measurement system of the three-dimensional development level of the natural gas industry is constructed, as shown in Table 1. The development level of each dimension is equal to the integration of multiple indicators. In order to ensure logical rationality, all the indicators are treated as positive indicators. For example, the low-carbon indicator is represented by the reduction in carbon emissions compared with the previous year.
The research period was chosen as 2006 to 2022. The basic data on safety, economy, and environmental protection indicators came from the China Statistical Yearbook, the China Energy Statistical Yearbook, the China Environmental Statistical Yearbook, the National Statistical Table of Mineral Resources Reserves, and the Beijing Statistical Yearbook from 2007 to 2023 [35], as well as relevant data published by the database of China National Bureau of Statistics (https://data.stats.gov.cn/, and the access date is 1 December 2024). The calculation of carbon emissions from fuel combustion and system spillage in the natural gas industry referred to the recommended methods in the “2006 IPCC Guidelines for National Greenhouse Gas Inventories” issued by the Intergovernmental Panel on Climate Change (IPCC), as well as the national greenhouse gas emission factor database (https://data.ncsc.org.cn/factoryes/index, and the access date is 12 January 2025). In order to avoid the impact of price fluctuation on data analysis accuracy, the data on economic indicators were converted into constant 2006 prices [36].

3.2. Development Level Measurement Model

3.2.1. Entropy Weight Method

In information theory, entropy is a measure of the disordered state of a system. Entropy weight can reflect the amount of useful information provided by each indicator to decision-makers [37]. The entropy weight method is used to determine the weight of each evaluation indicator in decision analysis. The method relies on the information content of objective data to allocate weights, so it can avoid the influence of human factors [38]. In addition, the entropy weight method reflects the discrete degree and information quantity of data through information entropy. Therefore, it can better reveal the internal structure and changing law of data, and thus allocate more reasonable weights. Based on the variation degree of different indicators, the information utility values of m evaluation indicators can be investigated according to the idea of entropy [39].
Firstly, the data of different indicators in multiple years form a panel dataset. Then, m evaluation indicators are used to investigate the safety, economy, and environmental development level of the natural gas industry in a specific year. The decision eigenvalue matrix X for n decision-making units (DMUs) and m evaluation indicators is shown in Formula (1).
X = x i j
In this formula, xij is the value of the i-th evaluation indicator for the j-th DMU, i = 1, 2, 3, …, m, j = 1, 2, 3, …, n.
In the actual decision-making process, multiple evaluation indicators are usually divided into two categories. The first category is that the larger the value, the better the indicator. The other category is the opposite. In this regard, the calculation formulas of relative membership degree are shown in Formulas (2) and (3). On this basis, the normalized relative membership degree matrix R can be further obtained.
r i j = x i j x i , min / x i , max x i , min
r i j = x i , max x i j / x i , max x i , min
In the formulas, xi,max represents the maximum eigenvalue of the i-th evaluation indicator; and xi,min represents the minimum eigenvalue.
Then, the entropy value Hi of the i-th evaluation indicator can be determined, as shown in Formulas (4) and (5).
H i = 1 ln n j = 1 n f i j ln f i j
f i j = r i j i = 1 n r i j
In the formulas, 0 ≤ Hi ≤ 1. In addition, in order to make lnfij meaningful, it is assumed that when fij is 0, fijlnfij is 0.
Next, the redundancy Gi of the entropy value Hi is calculated, as shown in Formula (6). The larger the value of Gi, the more effective information the i-th indicator contains.
G i = 1 H i
Finally, the entropy value is calculated to represent the entropy weight of the i-th evaluation indicator, as shown in Formula (7).
w i = G i G i = 1 H i m k = 1 m H k

3.2.2. Improvement of Entropy Weight Method

It is worth noting that for Formula (6), when the entropy values of multiple evaluation indicators are all close to 1, the small differences between them may cause the entropy weights to vary by multiples [40]. According to the principle of entropy weight, if the entropy values of different indicators are not much different, it means that the useful information provided is basically the same [41]. In this regard, the corresponding entropy weights should also be basically the same. However, the analysis results based on the traditional calculation model do not follow this feature. Therefore, it is necessary to improve the calculation model. Specifically, the redundancy of the entropy value Hi is redefined, as shown in Formula (8). On this basis, the improved entropy weight model is shown in Formula (9).
G i = k = 1 m H k + 1 2 H i
w i = k = 1 m H k + 1 2 H i l = 1 m k = 1 m H k + 1 2 H l
For Formula (9), if a series of entropy values Hi (i = 1, 2, …, m) are known, their corresponding k = 1 m H k and l = 1 m k = 1 m H k + 1 2 H l are fixed values, and Hi ≥ 0, considering that Hi ∈ [0, 1], wi′ will decrease with the increase in Hi. This is consistent with the fact that the greater the entropy value, the smaller the entropy weight. For indicator a and indicator b, the corresponding entropy weights wa′ and wb′, and entropy values Ha and Hb, have the following relations:
w a w b = k = 1 m H k + 1 2 H a k = 1 m H k + 1 2 H b
Assuming that the difference between Ha and Hb is a small variable ε, then Formula (10) can be transformed into the following:
w a w b = 1 2 ε k = 1 m H k + 1 2 H b
Because the difference between the two entropy values is small, the following processing can be carried out:
k = 1 m H k + 1 2 H b 1 + m 2 H b 1 , m 1
Because ε is a small variable, 2 ε k = 1 m H k + 1 2 H b is the same or even smaller than ε. Therefore, the change in w a w b is also very small. It can be seen that when the entropy value Hi changes slightly, the corresponding entropy weight will not change by multiple. This proves the effectiveness of the improved entropy weight calculation model.
Next, three examples are used to discuss the differences in entropy weights calculated before and after the model improvement. When the entropy Hi is close to 1 in different degrees, three entropy vectors are selected as (0.9, 0,8, 0.7), (0.999, 0.998, 0.997), and (0.9999, 0.9998, 0.9997), respectively. The corresponding entropy weight values are shown in Table 2.
For the three examples, the difference between two adjacent entropy values is 0.1, 0.001, and 0.0001, respectively. However, the entropy weight calculation results of the three groups are consistent based on the traditional model. Entropy is a measure of the amount of information carried. The information gap between entropy values “0.9999 and 0.9998” and “0.9 and 0.8” is significantly different. In this regard, the entropy weight distribution of the traditional model is unreasonable. In addition, for the entropy value vector of the second and third groups, the differences in entropy values are small, but the corresponding entropy weights vary by multiples. Obviously, it is not conducive to transmitting accurate information through entropy. The improved calculation model can overcome this deficiency, and the difference in entropy weights is consistent with that of entropy values, as shown in Table 2.

3.3. Coupling Coordination Evaluation Model

The coupling coordination degree model is an important system analysis method. It is widely used to evaluate the interaction relationships between multiple systems at different scales. Specifically, it investigates the operational status and evolutionary trends of the system by quantifying the overall effectiveness and synergistic effects among multiple subsystems [42]. The core idea of the coupling coordination degree model is to regard the system as an organic whole composed of multiple interrelated and interacting elements. The multi-elements affect and restrict each other, and finally jointly determine the overall behavior. Through coupling coordination evaluation, it is helpful to identify the potential risks and provide a scientific basis for decision optimization [43]. Specifically, the coupling coordination degree is mainly used to evaluate whether the development of multiple subsystems is coordinated, and the specific degree of coordination.
The commonly used basic model first investigates the mutual influence level between factors based on coupling degree, and then determines the collaborative development level between factors based on coordination degree [44]. Overall, it has the advantages of simple operation and intuitive results [45]. As the practical problems of research become increasingly complex, it is necessary to carry out model optimization in order to overcome the limitations of analysis. It is worth noting that the basic model does not use the average distribution function between [0, 1] to describe the coupling degree C. Because the function is mainly convex, the C values are mostly concentrated on the “1” side. In this regard, it has the disadvantage of low discrimination [46]. Meanwhile, the coupling coordination degree D is integrated by the coupling degree C and the comprehensive evaluation index T. When the differentiation of C values is small, the D values mainly depend on the T values. In this regard, the development level of system elements dominates, while the role of coordination degree is weakened. It is not conducive to fully utilizing the value of coupling coordination evaluation [47]. Therefore, in this study, the distribution function of C values is redefined to make them as dispersed as possible within the range of [0, 1]. This is helpful to improve the discrimination and explanatory validity of the calculation results. The concrete optimization idea is as follows: the coupling degree C can be simplified as a function of the ratio between subsystems through reduction. Therefore, the boundary of coupling degree C can be calculated by using the ratio of each subsystem, without being affected by the subsystem values themselves. This modification scheme can increase the discrimination of C values and improve the validity of calculation results. The modifications to the model are as follows:
C = 1 i > j , j = 1 n U i U j 2 m = 1 n 1 m i = 1 n U i max U i 1 n 1
T = i = 1 n α i U i , i = 1 n α i = 1
In the formulas, Ui is the standardized value of the i-th subsystem; and αi is the weight of the i-th subsystem. In addition, Ui ∈ [0, 1], Ci ∈ [0, 1]. That is, the more discrete the subsystem is, the smaller the C value. On the contrary, the larger the C value, the less discrete the subsystem is.
The energy trilemma corresponds to the coordination of safety, economy, and environmental protection. When n = 3, it is assumed that maxUi is U3. On this basis, the specific calculation models are shown in Formula (15) to Formula (17); the classification standard is shown in Table 3.
C = 1 s 3 j s 2 j + s 3 j s 1 j + s 2 j s 1 j 3 × s 1 j s 3 j × s 2 j s 3 j
T = α s 1 j β s 1 j γ s 3 j
D = C T
In the formulas, s1j, s2j, and s3j are the development level of the safety, economy, and environmental protection subsystems of the natural gas industry, respectively; α, β, and γ are contribution coefficients. From the perspective of energy trilemma, it is considered that the three-dimensional subsystems are equally important for industrial development, so the coefficients are all taken as 1/3.

4. Empirical Analysis

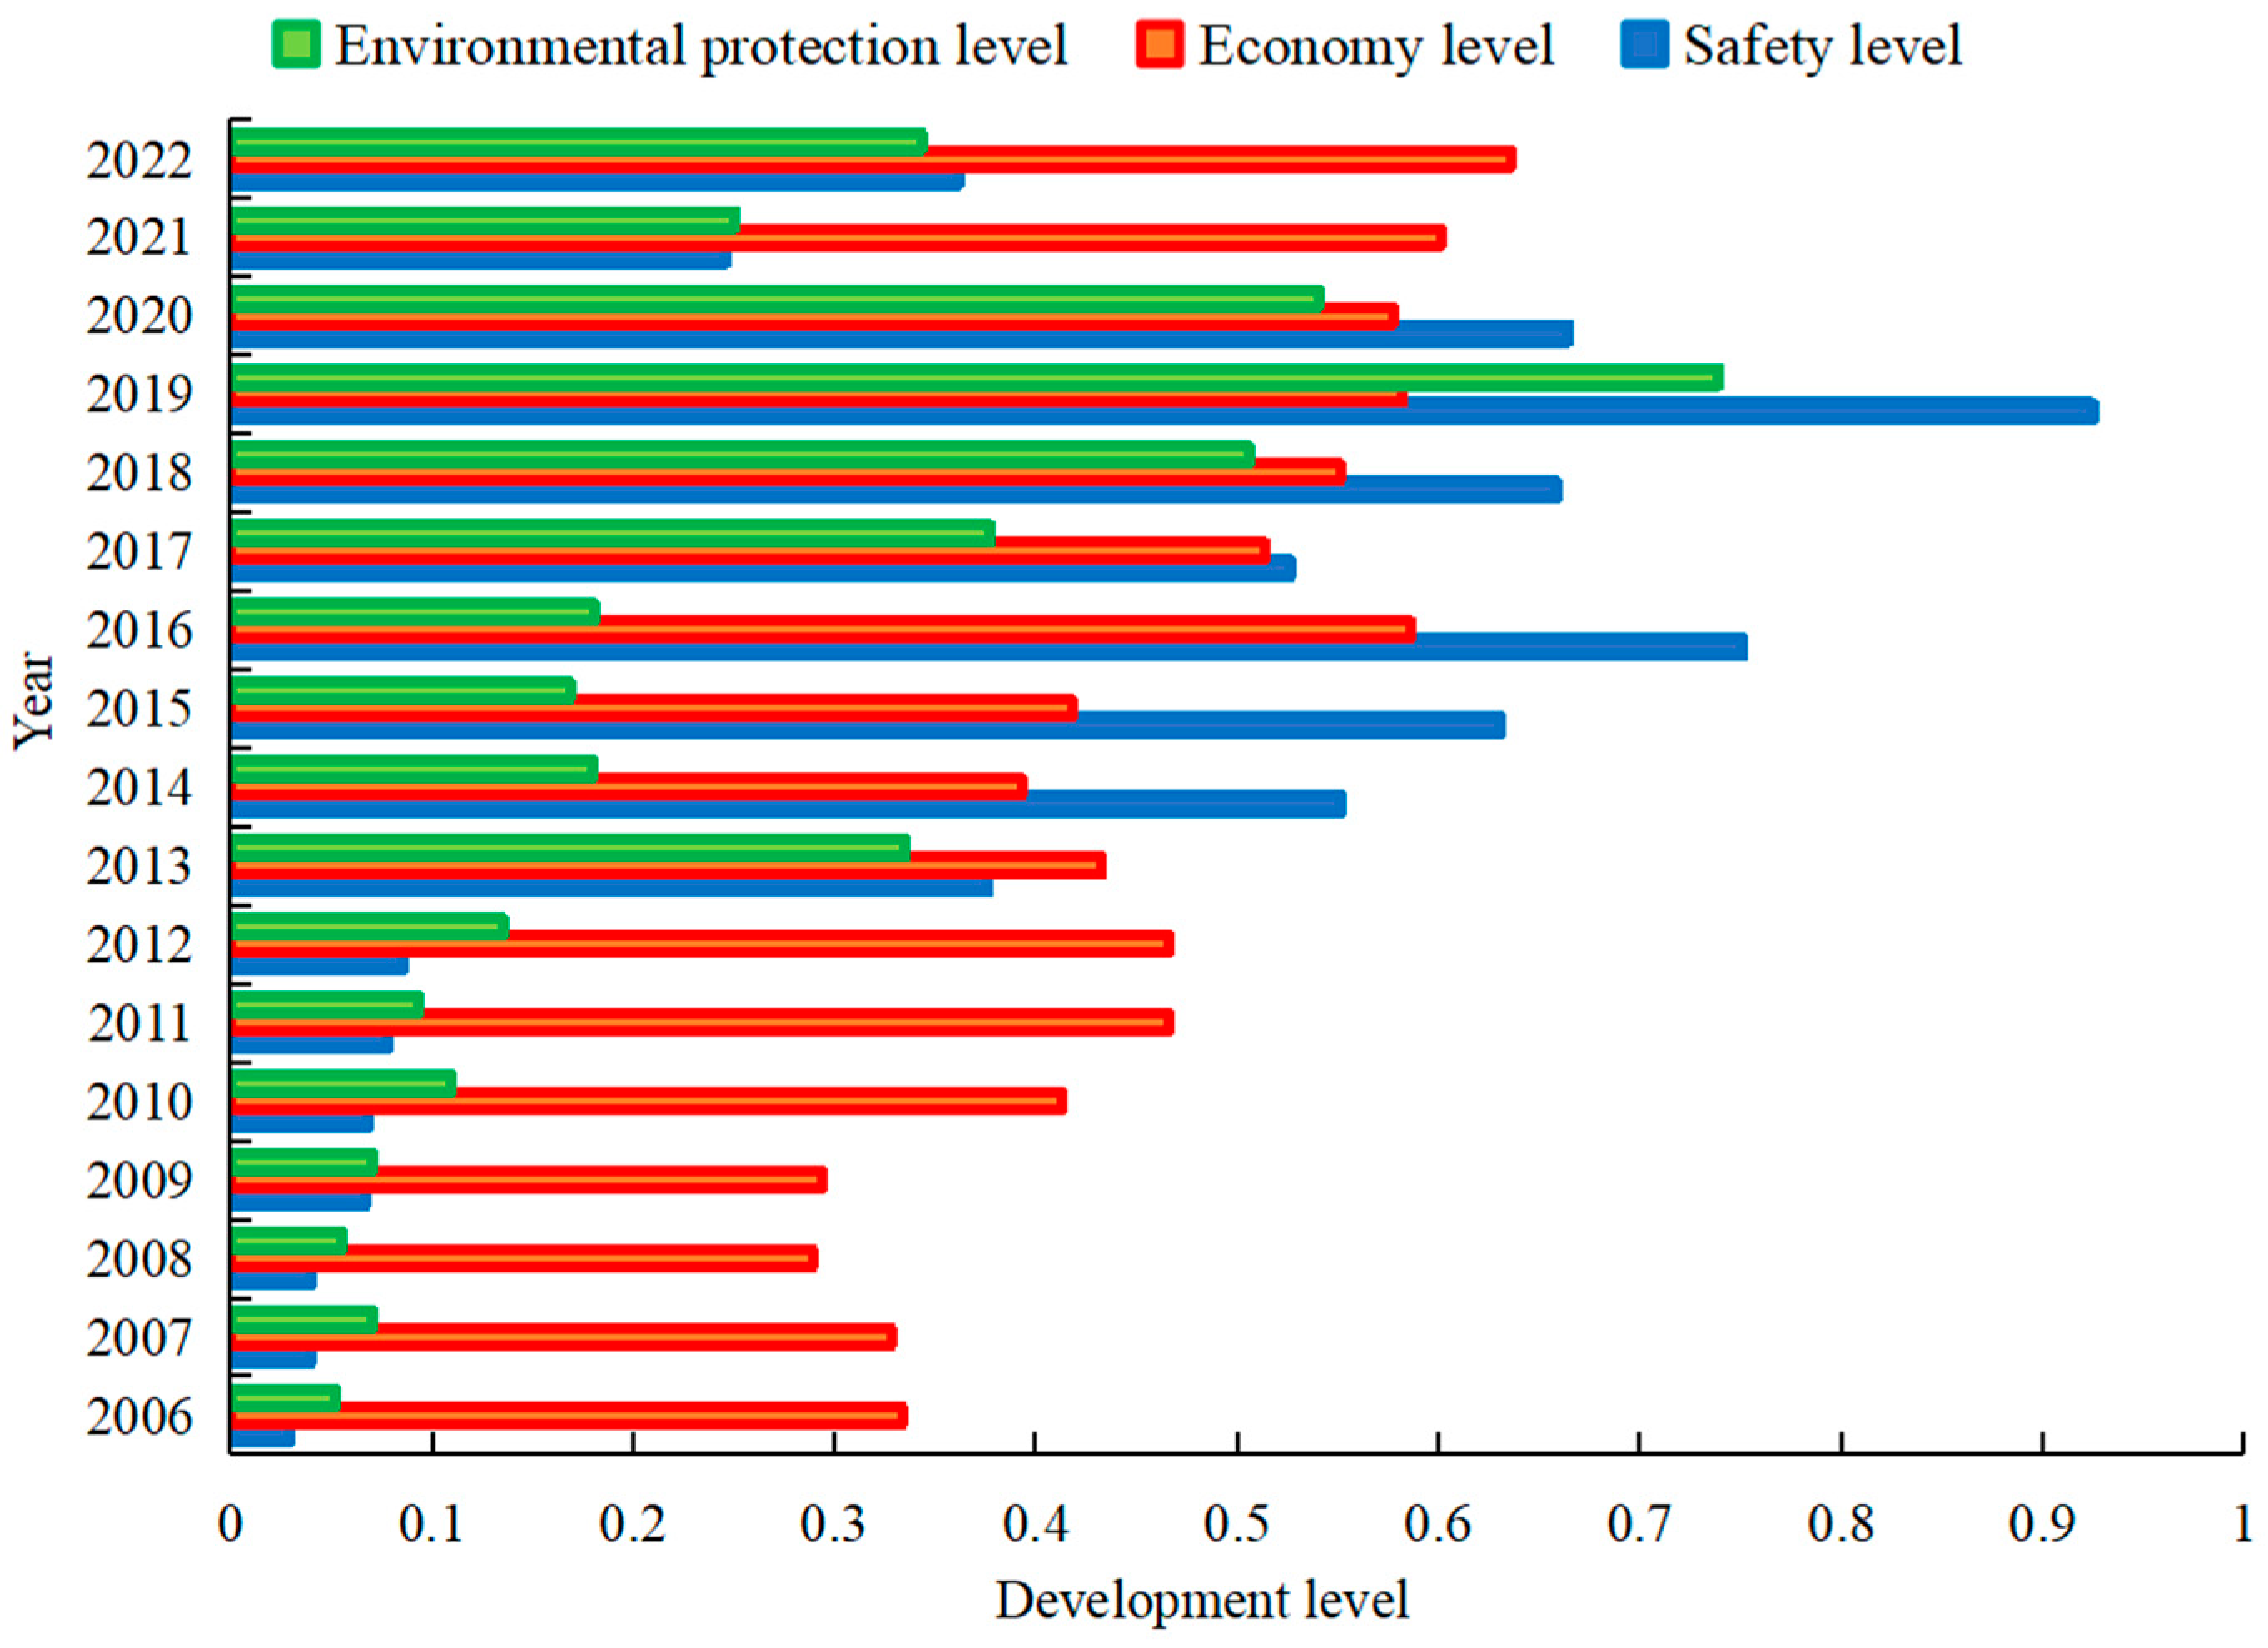
4.1. Three-Dimensional Development Level of Natural Gas Industry

The development level of the safety, economy, and environmental protection of Beijing’s natural gas industry from 2006 to 2022 is shown in Figure 1.
As shown in Figure 1, from 2006 to 2022, the overall development level of the safety, economy, and environmental protection of Beijing’s natural gas industry showed a fluctuating upward trend. In 2020, affected by the COVID-19 epidemic, the development level of safety and environmental protection showed a downward trend. This is similar to the findings of Seif et al. [48] on Iran. In 2022, with the economic and social recovery in the post-epidemic era, the development level of safety and environmental protection resumed an upward trend. However, it is worth noting that the recovery trend was relatively flat, which is different from the significant recovery trend obtained by Norouzi’s research on the United States [49]. This is mainly due to the fact that China’s epidemic blockade control policy lasted for a longer time. In addition, the economy level of the regional natural gas industry maintained a steady upward trend during the research period, which is different from the result of Zighed et al. [50] on Algeria. This is mainly because Beijing, as one of the four municipalities directly under the Central Government, had a huge population base. Therefore, it became one of the largest natural gas consumption markets in China. Meanwhile, the proportion of the total urban natural gas consumption population to the total year-end resident population reached 67.44% in 2022, far higher than the national average of 32.40%. In this regard, the regional natural gas penetration rate was high and the per capita consumption capacity was strong. In addition, although the ex-factory price index of the natural gas industry showed an upward trend during the COVID-19 epidemic, the stable market demand advantage ensured a continuous increase at the industrial economy level. On the whole, Beijing’s natural gas resource endowment was relatively scarce and its self-sufficiency level was low. Therefore, the regional natural gas resource consumption mainly depended on external supply. The huge market demand still made Beijing face the realistic problem of long-term supply–demand imbalance. Meanwhile, Beijing was still in the middle stage of rapid economic growth and industrialization. In this regard, its economic and social development could not be decoupled from large-scale fossil energy consumption in the short term. Therefore, the safety and environmental protection levels of Beijing’s natural gas industry need to be improved. This agrees with the findings of Dong et al. [51].
Specifically, the economy level of Beijing’s natural gas industry was relatively high. It showed a steady upward trend, which is consistent with the findings of Zhang et al. [52] based on the national perspective. On the one hand, with the rapid development of the regional economy and the continuous improvement of residents’ living standards, the proportion of natural gas consumption continued to increase under the new path of high-quality development. In 2022, the regional natural gas market expanded rapidly. The total urban natural gas supply reached 19.91 billion m3, ranking first in China. Meanwhile, natural gas had a price competitiveness compared to coal and oil in terms of unit calorific value. This is helpful to further stimulate the subjective initiative of natural gas utilization in production activities and residents’ daily lives through pricing tools. In addition, Beijing simultaneously promoted the construction of smart gas systems and pipe networks in the early stage of the 14th Five-Year Plan. Specifically, intelligent and efficient transformation greatly reduced the cost of industrial operation and management. It was helpful to significantly improve economic benefits, which agrees with the findings of Li et al. [53] based on the urban perspective. It is worth noting that the economy level of Beijing’s natural gas industry showed a significant upward trend in 2010. This is mainly due to the completion of the Shaanxi–Beijing Second Gas Pipeline Expansion Project and the annual gas transmission capacity increase from 8 billion m3 to 17 billion m3. The project greatly alleviated the tight supply of natural gas in North China and helped to reduce the ex-factory price of products. This is similar to the findings of Kim et al. [54] on South Korea. Meanwhile, in response to the “Notice on Accelerating the Implementation of the Natural Gas Price Adjustment Plan” issued in 2010, Beijing promptly released a hearing plan for residential gas price adjustment to meet the need for price mechanism reform. On the one hand, it further clarified the price relationship between natural gas and its alternative energy sources and guided the rational allocation of price resources. On the other hand, it strengthened the economic guarantee for the healthy development of the natural gas industry. In 2014, the economy level of the regional natural gas industry showed a significant downward trend. This was mainly due to the soaring market demand for natural gas in Beijing, and the total urban gas supply reached 11.37 billion m3. The increase was 1.47 billion m3, which was 2.26 times that of the previous year. The contradiction between energy supply and demand intensified rapidly, and the ratio of the consumer price index to the ex-factory price index of the natural gas industry reached the lowest in history. This is similar to the findings of Barbosa et al. [55] on the Amazonas, a state in Brazil. In 2016, the economy level turned into a sharp increase trend. This was mainly due to the fact that at the beginning of 2016, Beijing established a linkage mechanism between upstream and downstream prices. Under policy incentives, the transparency of government pricing gradually increased. On the one hand, this was helpful to timely reflect the changes in natural gas market prices, and guide the market to develop in a standardized and healthy manner. On the other hand, this strengthened the cost control and operational efficiency of gas enterprises. In addition, the “Measures for the Fair and Open Supervision of Oil and Gas Pipeline Network Facilities” and the “Measures for the Administration of Natural Gas Pipeline Transportation Prices (Trial)” were successively released in 2016. This helped clarify the pricing cost basis for pipeline transportation and streamline the pricing mechanism. Meanwhile, the policies incentivized diversified investment in the natural gas industry. It is worth noting that the economy level of the regional natural gas industry maintained an upward trend in 2020, and there was no sudden change under the impact of the COVID-19 epidemic. This is mainly because about one-third of Beijing’s natural gas terminal consumption was concentrated in residents’ daily lives. In this regard, the control policy of the COVID-19 epidemic had little impact on basic human needs such as cooking and heating. This is similar to the findings of Zhao et al. on Baoding and Langfang [56]. In addition, the home office mode may even increase the gas consumption demand to a certain extent. Therefore, the economic benefits of the regional natural gas industry had not been significantly affected. In 2020, the Chinese government further clarified its goals of carbon peaking and carbon neutrality. In order to reduce the utilization cost of natural gas, Beijing accelerated the implementation of tax incentives, subsidies, and other promotion and support policies in the field of clean fossil energy. In addition, it actively promoted the construction of smart gas to reduce the technical cost of energy production and transportation, thus accumulating a strong and solid industrial development foundation. Under the comprehensive influence of the above factors, the industrial economic benefits maintained a significant growth trend from 2020 to 2022.
The safety level of Beijing’s natural gas industry changed smoothly before 2012, and the overall value was low. This was mainly due to the shortages of oil and gas exploration and a production system dominated by state-owned enterprises. This laid the practical demand foundation for the reform direction of “opening up both sides and controlling the middle” in China’s oil and gas system, which is consistent with the findings of Chai et al. [57] based on the national perspective. After 2013, a significant fluctuation trend was seen. This was mainly because Beijing was not a gas-producing area and its self-sufficiency level was weak. During the research period, the energy demand increased significantly, and the average annual growth rate of energy consumption reached 10.53%. Faced with huge market demand, the supply–demand imbalance remained prominent and severe, which agrees with the findings of Gao [58]. In addition, the peak-valley difference in natural gas demand in Beijing was large, which created high requirements for resource supply. Under the comprehensive influence of the above factors, the supply guarantee of natural gas in Beijing still needed to be strengthened. It is worth noting that from 2013 to 2016, the safety level showed a significant upward trend. This was mainly due to the fact that in 2013, the local natural gas production in Beijing first appeared in the statistical caliber. In this context, the energy consumption guarantee capacity was gradually enhanced. The self-sufficiency rate of regional natural gas continued to increase from 7.59% in 2013 to 13.36% in 2016, thereby driving the synchronous improvement of industrial safety levels. Meanwhile, the 12th Five-Year Plan period was a period of rapid transition of Beijing’s energy structure. During this period, regional development increasingly focused on the construction of natural gas supply infrastructure, such as transmission pipelines and storage facilities, and achieved full pipeline coverage by the end of 2016. In this regard, it effectively ensured the stable supply of resources. Since the 13th Five-Year Plan, with the rapid development of China’s economy, the safety level of Beijing’s natural gas industry fluctuated significantly. In 2017, the safety level showed a steep decline trend. This was mainly due to the fact that from the perspective of resource production, China suffered from a large-scale gas shortage in that year. The extremely cold weather in winter caused the regional natural gas consumption to increase rapidly and generally exceed the supply plan. In addition, Beijing’s local natural gas production was only 1.54 billion m3 in 2017, which was about 28.92% lower than the previous year’s production. From the perspective of resource consumption, in order to win the “blue sky defense war”, Beijing vigorously carried out the replacement of coal with natural gas in the field of energy utilization. This caused a sharp increase in gas demand, far exceeding the level of the previous heating season. Therefore, energy supply safety faced unprecedented risks and pressures, which is consistent with the findings of Jiang et al. [59]. In 2019, the industrial safety level reached its peak. This was mainly due to the rapid increase in domestic gas reserves and production and resulted in a decrease in China’s dependence on foreign natural gas. Similarly, the self-sufficiency level of natural gas in Beijing reached a historical high value of 15.70% in 2019.
From 2006 to 2013, the changing trend in the environmental protection level of Beijing’s natural gas industry was similar to that of the safety level and began to fluctuate after 2014. Overall, the environmental protection level needed to be improved. Beijing was the main area of air pollution prevention and control in China, with an urgent demand for clean fossil energy. In recent decades, energy utilization has been in an important stage of transformation from “carbon-containing” to “net zero carbon-containing” or even “zero carbon-containing”. Natural gas is an indispensable and important transitional energy source under the new low-carbon development pattern. As the development center of the Beijing–Tianjin–Hebei region, during the research period, Beijing vigorously promoted a reduction in coal burning. Moreover, it achieved new breakthroughs in energy structure adjustment and basically established a multi-source, multi-directional, clean, and efficient modern energy system. However, at the same time, the regional economic and social development drove the continuous rigid growth of total energy consumption. Therefore, the total carbon emissions were in a high platform stage, which is similar to the findings of Hussain et al. on South Asia [60]. The proportion of high-carbon energy sources, such as coal and oil, in the total fossil energy consumption exceeded 60%. In this context, there was still a gap between the regional natural gas utilization level and the international first-class level. The environmental protection level of Beijing’s natural gas industry showed a significant upward trend in 2013. This was due to the release of “Beijing’s Key Work Plan for Energy Conservation and Climate Change in 2013” by local government departments. Meanwhile, the annual investment in environmental protection infrastructure construction in the natural gas industry reached the highest value of CNY 6.84 billion. This effectively promoted energy-saving and carbon-reducing work in the natural gas industry and helped improve the atmospheric environment in Beijing. From 2014 to 2016, the environmental protection level remained in a low-value state. On the one hand, with the continuous implementation of the “coal-to-gas” project in Beijing, the gas demand in the fields of industry, heating, refrigeration, and power generation increased significantly. However, it is worth noting that natural gas still belongs to fossil energy. Driven by the scale effect, the carbon emissions of the natural gas industry increased simultaneously. In this regard, industrial development was prone to falling into the inherent limitation of single energy utilization, which is similar to the findings of Zhang et al. [61]. Therefore, the focus of high-quality development was the effective integration of natural gas and new energy, which agrees with the findings of Han et al. [62]. In the future, regional development can focus on the five business chains of “natural gas + wind energy + photovoltaic energy + water energy”, residual pressure power generation, associated resources, hydrogen energy, and CCS/CCUS. It is helpful to fully promote the deep integration of gas, electricity, heat, and hydrogen, and break through the barriers of further industrial upgrading. On the other hand, since 2014, investment in environmental protection infrastructure construction has continued to decline, resulting in insufficient capital investment in the environmental protection field. In 2017, the environmental protection level increased significantly. This was mainly because Beijing started the largest “coal-to-gas” project in history. The number of engineering projects exceeded 350, which was more than five times that of the past few years. In this context, in 2017, the proportion of coal consumption within the total energy consumption was only 5.06%, and the decline rate reached 45.12% compared with the previous year. This is similar to the findings of Li et al. [63] based on the national perspective. In 2019, the environmental protection level reached its peak. This was mainly due to Beijing’s emphasis on playing a leading role as a political and economic center, and deepening energy cooperation with surrounding areas such as Tianjin and Hebei Province. Meanwhile, the construction of the Beijing–Tianjin–Hebei integrated modern energy system was accelerated to guide the rational allocation of natural gas resources, which agrees with the findings of Ivanova et al. [64]. In 2019, the regional natural gas export volume reached a historical high value of 2.97 billion m3. The annual increase in industrial carbon emissions was 0.34 million tons, which was only 6.54% of the previous year’s increase of 5.20 million tons. From 2020 to 2021, the environmental protection level showed a significant downward trend. On the one hand, this was due to the negative impact of the COVID-19 epidemic. On the other hand, under the limitations of the technological level, the further promotion of low-carbon energy transformation in key sectors such as industry and transportation faced certain barriers, which is similar to the findings of Karamaneas et al. on Greece [65].

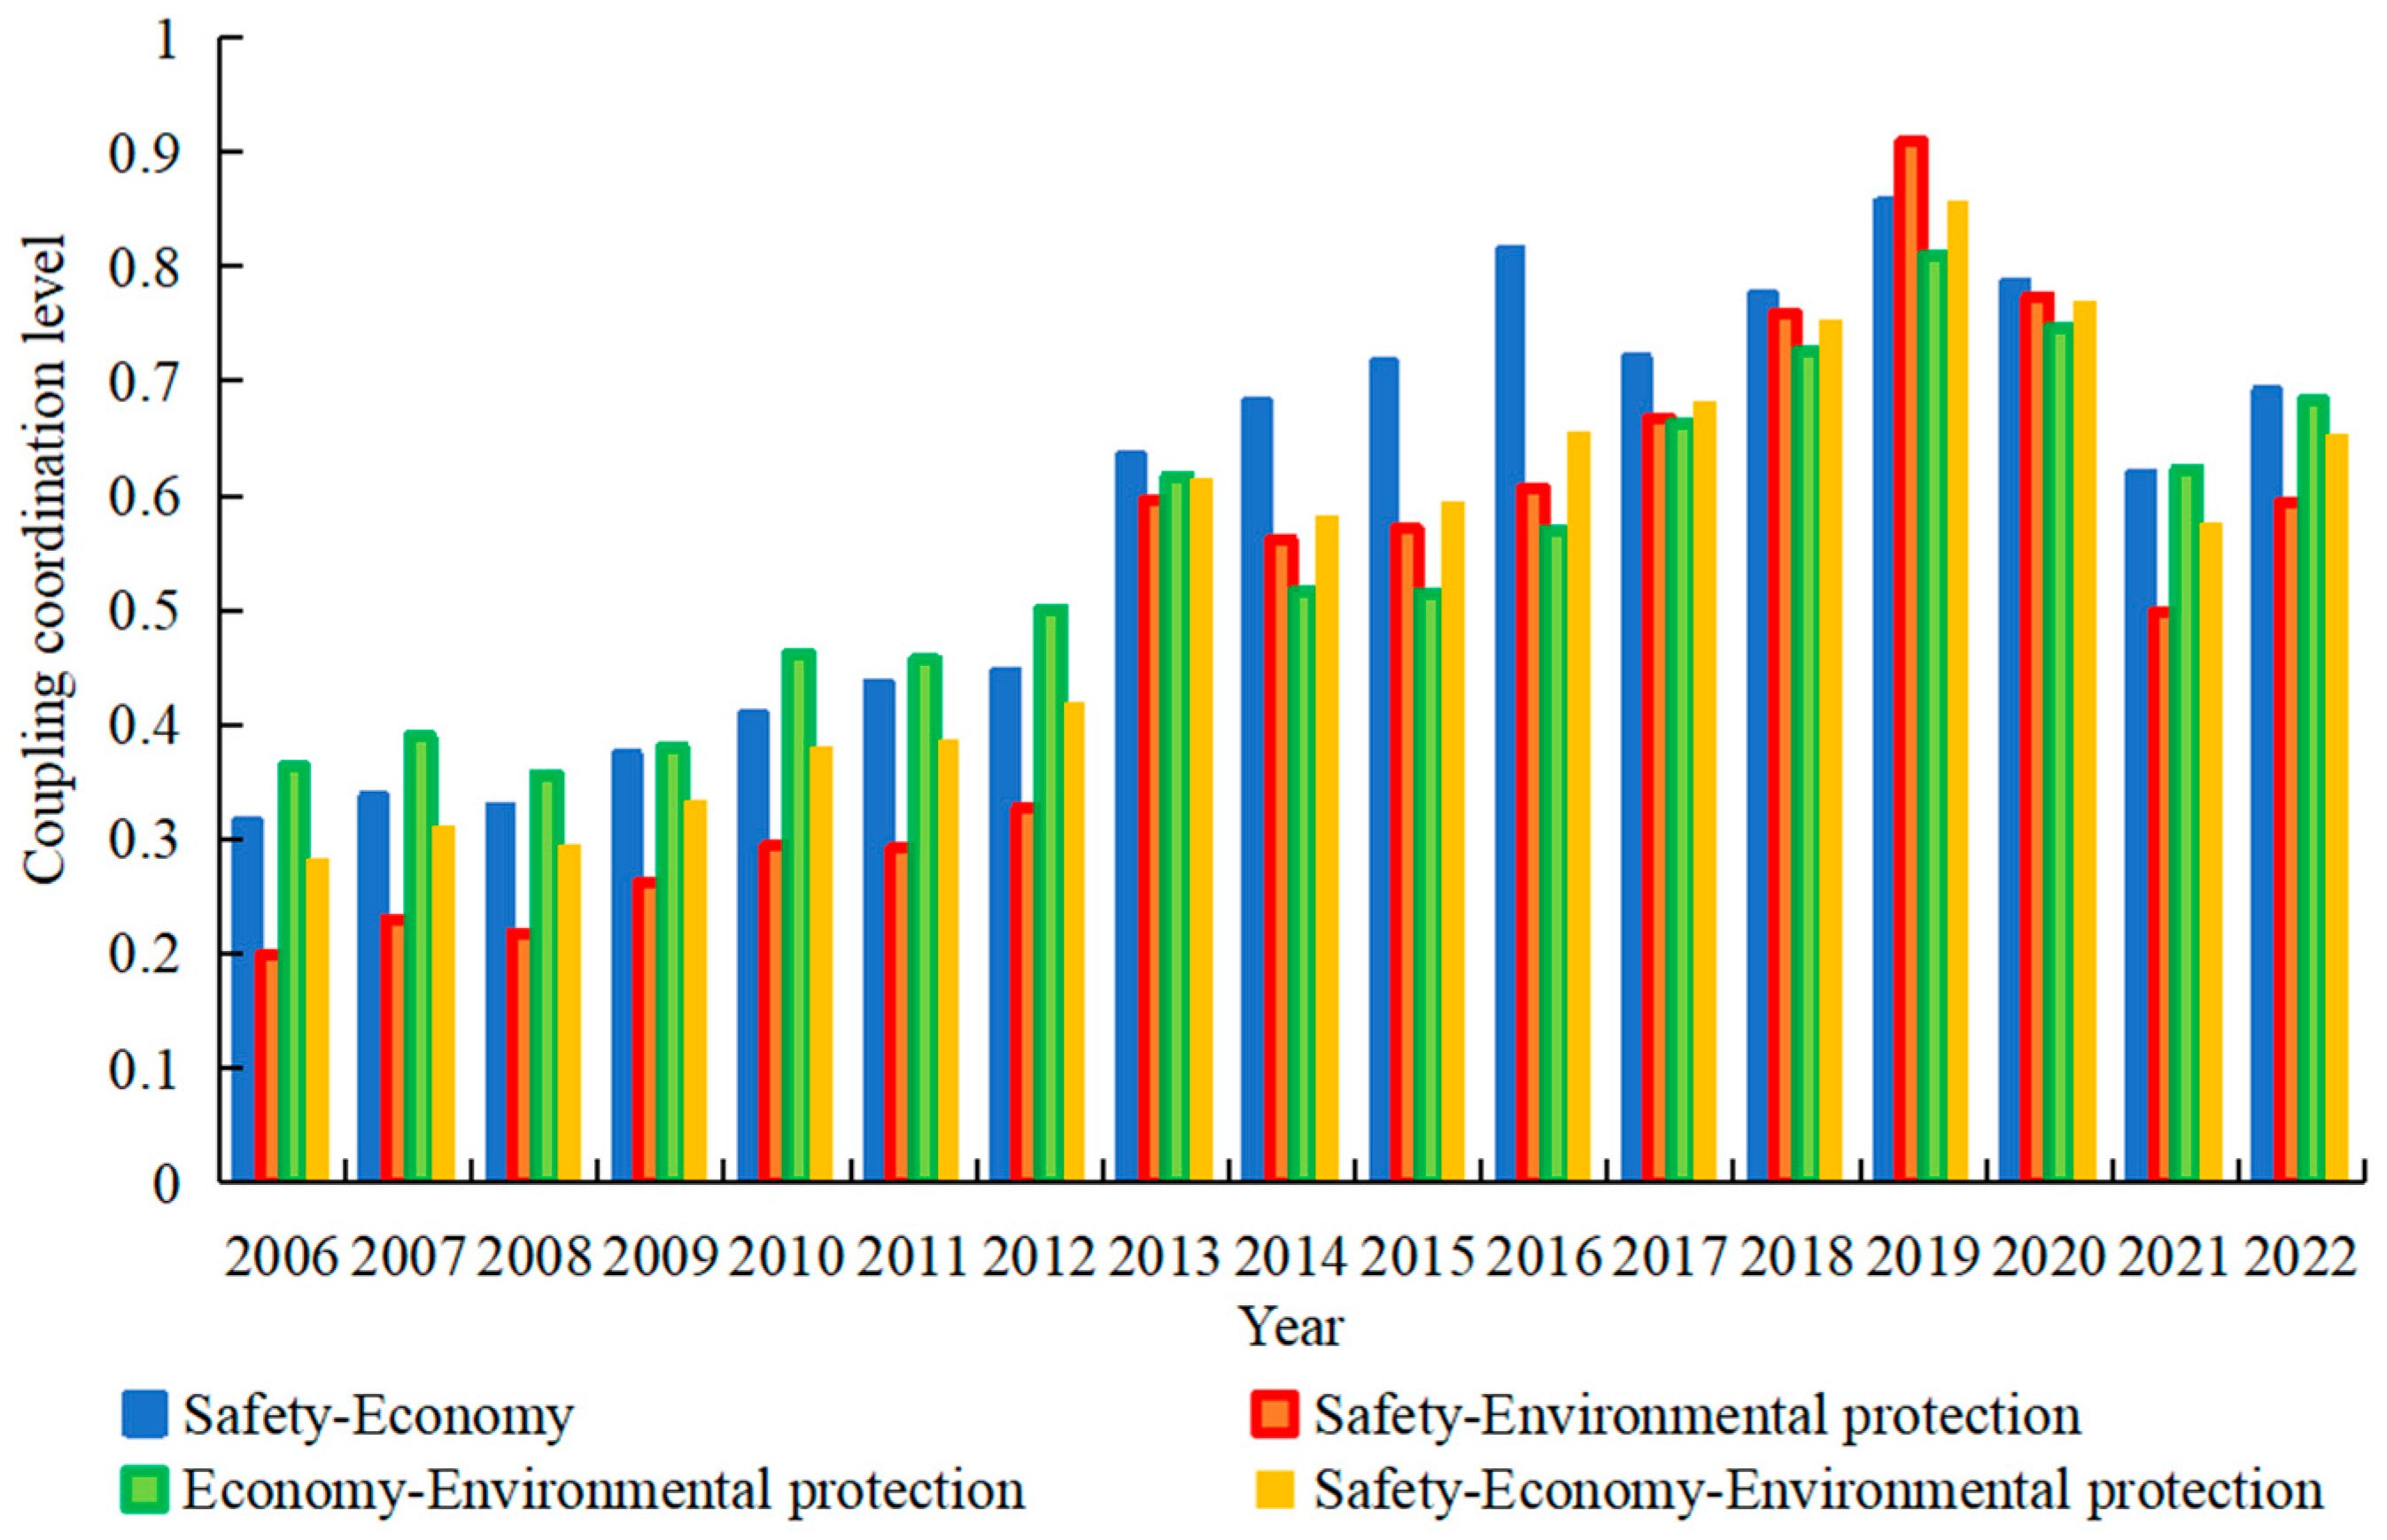
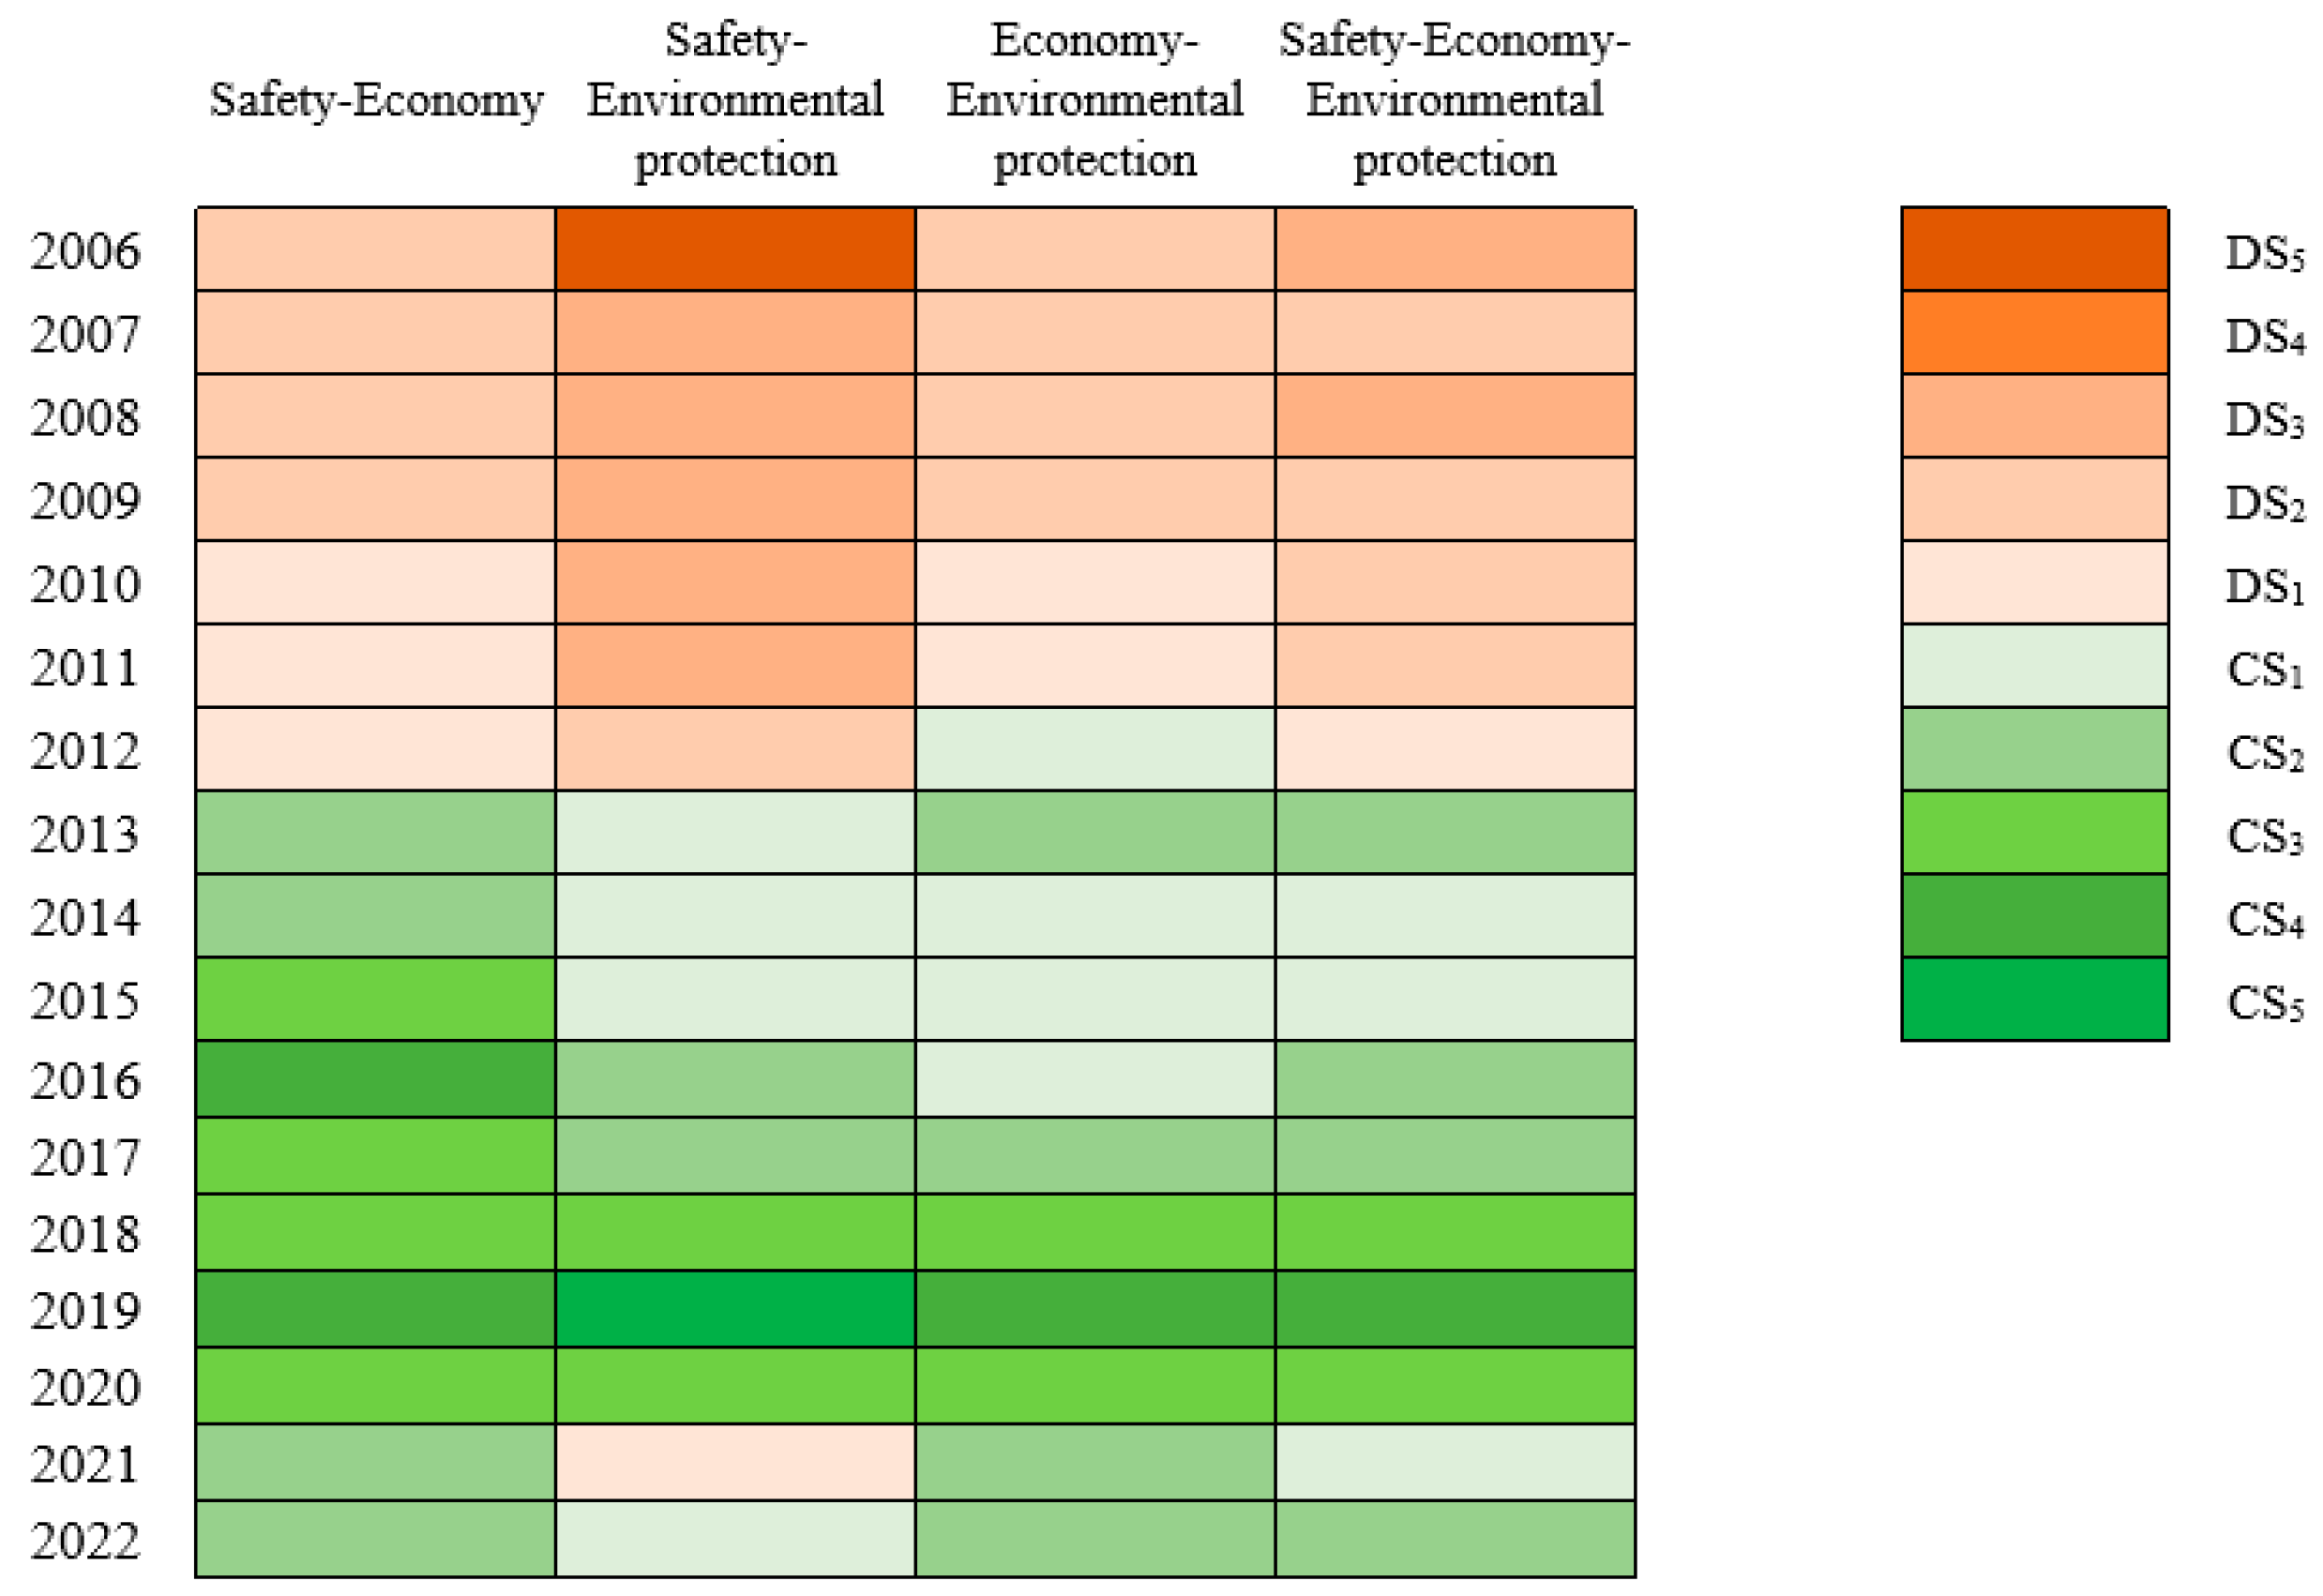
4.2. Three-Dimensional Coupling Coordination Degree of the Natural Gas Industry

The coupling coordination degree of the safety, economy, and environmental protection of Beijing’s natural gas industry from 2006 to 2022 is shown in Figure 2, and its coordination levels are shown in Figure 3.
As shown in Figure 2 and Figure 3, the coupling coordination degree of safety, economy, and environmental protection of Beijing’s natural gas industry showed a fluctuating upward trend during the research period. It increased from 0.2839 in 2006 to 0.6550 in 2022, and the coordination level was adjusted from the moderate disorder state (DS3) to the primary coordination state (CS2). Specifically, from 2006 to 2012, the three-dimensional coupling coordination degree of Beijing’s natural gas industry slowly increased, but it remained in the disorder state. This indicated that there were difficulties in achieving the coordination of short-term safety and stability, medium-term economic feasibility, and long-term green and low-carbon of Beijing’s natural gas industry during the 11th Five-Year Plan period. The development of the regional natural gas industry faced the problem of energy trilemma, mainly due to low energy utilization efficiency and insufficient technology maturity. This agrees with the findings of Chi et al. [66]. During the period of the 12th Five-Year Plan and the 13th Five-Year Plan, Beijing’s natural gas industry entered a stage of rapid and healthy development. The three-dimensional coupling coordination degree continued to increase and maintained a stable coordination state. This was mainly because Beijing attached great importance to the safety management of the energy industry. Regional planning actively promoted the construction of natural gas infrastructure and accelerated the comprehensive regional coverage of gas pipelines and storage equipment. Meanwhile, during this period, safety supervision and hidden danger investigation and management in the energy field were strengthened, which is similar to the findings of Zhong et al. on Sichuan [67]. In this regard, the high-quality development of Beijing’s natural gas industry could provide a reference model for the collaborative development of safety, economy, and environmental protection. This became an important breakthrough in solving the regional energy trilemma and assisted in avoiding potential obstacles. In 2013, the three-dimensional coupling coordination degree showed a significant upward trend and reached the primary coordination state (CS2) for the first time. This was because the progress of domestic natural gas exploration promoted the rapid increase in proven reserves and production, thus providing sufficient energy supply for Beijing. Meanwhile, Beijing introduced natural gas from overseas by importing pipeline gas and LNG. It stabilized the supply source by adjusting the supply structure. Under the stable supply market environment, the price of natural gas showed a downward trend, and the price comparison advantage was remarkable. This agrees with the findings of Chen et al. [68]. In this regard, the natural gas market in Beijing was in a golden stage of development driven by both supply and price. In this context, this led to a significant increase in the popularity of natural gas and investment in industrial environmental pollution control. Specifically, in 2013, the investment in environmental protection infrastructure construction reached a high value of CNY 836 million. The investment was widely used in energy applications such as residential heating, gas-fired power plants, industrial cleaner production, and hydrogen production from natural gas. This is consistent with the findings of Li et al. [69]. Under the comprehensive influence of the above factors, the three-dimensional coupling coordination degree showed a sharp upward trend synchronously. From 2020 to 2022, the coupling coordination degree showed a downward trend. Specifically, it changed from a good coordination state (2019) to a moderate coordination state (2020), to a barely coordination state (2021), and then a primary coordination state (2022). This was mainly because the epidemic prevention and control policies resulted in a large number of transportation and utilization links being restricted, and affected the safe operation of natural gas pipelines and facilities. Due to personnel and logistics restrictions, natural gas transportation, distribution, and utilization enterprises generally faced problems such as insufficient employee attendance, as well as difficulties in timely inspection, maintenance, and repair of industrial infrastructure. Meanwhile, the significant reduction or even stagnation in economic activity led to a decrease in natural gas demand and an increase in operating costs. In this context, the natural gas market continued to shrink, which is similar to the findings of Chung et al. on Vietnam [70]. The interruption of the supply chain caused some gas pipelines and facilities to operate at a low load. This led to the accelerated aging and failure of facilities and caused great pressure on the safe operation of infrastructure. In addition, the alternative choice of high-pollution energy by enterprises also greatly increases the risk of environmental pollution. In 2020, the total natural gas supply in Beijing was only 18.54 billion m3, a decrease of 3.65% compared to 2019. This was because in order to cope with the energy shortage, enterprises preferred to choose low-cost alternative energy sources such as coal and heavy oil. This led to increased environmental pressure. Under the comprehensive influence of the above factors, the coupling coordination degree of safety, economy, and environmental protection showed a downward trend synchronously.
Safety was an important prerequisite and effective support for the economy. Only with stable supply capacity could sufficient resource support be provided for the expansion of the natural gas market. Then, by ensuring the supply–demand balance and stabilizing market price levels, high-level per capita consumption of natural gas was ultimately achieved. This is similar to the findings of Rawat et al. on a developing country [71]. Meanwhile, the increase in demand driven by the prosperous market would drive the exploration and development of natural gas, and promote the extension of infrastructure construction such as pipeline networks. In this regard, the coupling coordination degree of safety and economy had a high level. Specifically, it showed a downward trend in 2008 and was in the mild disorder state (DS2). This was mainly due to Beijing becoming one of the largest natural gas markets in the country in that year. In 2008, the regional urban gas pipeline network developed to more than 10,000 km, with more than 4.81 million gas users. In addition, the three gas-fired power plants, namely Sun Palace, Zhengchangzhuang, and Jingfeng, supplied heat to Beijing’s urban heating network for the first time in the winter of that year. This further promoted the growth of natural gas demand and aggravated the problem of short supply. In this context, the coordinated development of industrial safety and economy was negatively affected. This is different from the results of Freeman et al. [72] on gas fuel defects at U.S. power plants, mainly because Beijing was the capital of China, and its special political position could guarantee energy supply. In 2014 and 2015, the changing trend in safety–economy coordination was different from that of other two-dimensional types and showed an upward trend. The coordination level developed from the primary coordination state (CS2) to the moderate coordination state (CS3). This was mainly because, during this period, Beijing implemented a diversified gas source supply strategy to ensure a stable natural gas supply. This is consistent with the findings of Shaikh et al. [73] based on the national perspective. The gas source came directly from domestic gas fields such as Changqing and Tarim, as well as pipeline imported gas and LNG from Central and West Asia. Meanwhile, Beijing continued to strengthen the construction and renovation of gas-receiving gate stations. This was conducive to improving the overall design capacity of urban gas gate stations, and actively promoting the construction of storage facilities to meet the gas demand during peak hours. In addition, in 2015, Beijing implemented a tiered pricing system. It vigorously promoted the conservation and rational utilization of natural gas resources, and guided residents to use gas rationally and economically. Ultimately, the stability of the natural gas market and prices was ensured, and the coordination development of safety and economy was promoted. This agrees with the findings of Che et al. [74]. In 2016, the degree showed a further increasing trend and entered the good coordination state (CS4). This was because the newly-built length of natural gas pipelines in Beijing reached 1757 km in 2016, which was 1.90 times and 1.41 times the newly-built length of 924 km and 1244 km in 2014 and 2015, respectively. Beijing formed a branched pipe network system extending from the city center to the outer suburbs such as Daxing, Tongzhou, Fangshan, Shunyi, Changping, and Mentougou. In this regard, this was conducive to improving energy supply levels while increasing the number of end users. The proportion of natural gas consumption in Beijing reached more than 30%, exceeding the world average level. In this context, the industry flourished and its economic benefits improved simultaneously. Finally, the development level of industrial safety and economy reached a good state of coordination. In 2017, the degree showed a trend of transition from increasing to decreasing and returned to the moderate coordination state (CS3). This was because in order to guide the rational use and conservation of natural gas, Beijing actively responded to the “Notice on Reducing the Benchmark Gate Station Price for Non-resident Natural Gas” issued by the National Development and Reform Commission. The non-resident sales price of pipeline natural gas was lowered by CNY 0.1/m3. This was beneficial to improving the economy of natural gas utilization. However, the price reduction was prone to driving a higher level of gas demand and reducing the industrial safety level, which agrees with the findings of He et al. [75]. In addition, 2017 was an important year for the completion of the coal-to-gas conversion work in Beijing. A large number of rural coal-to-gas, boiler coal-to-gas, and town-to-town natural gas pipeline construction projects were accelerated. This led to a significant expansion in gas consumption. Meanwhile, in the winter of 2017, North China suffered from extreme weather and a sudden drop in temperature. This also led to a serious shortage of gas supply in Beijing and caused a significant reduction in the safety level of the regional natural gas industry. Under the comprehensive influence of the above factors, the safety level and economy level showed the opposite changing trend, which eventually led to the decline of their coordination level.
China regarded both development and security as the premise of achieving the goals of carbon peaking and carbon neutrality. That is, the green and low-carbon energy transformation measures needed to be carried out on the basis of ensuring the safety and stability of the energy supply. They coexisted and promoted each other at the policy level, which agrees with the findings of Li et al. [76]. Meanwhile, the improvement in the natural gas self-sufficiency level, resource endowment level, and energy transportation capacity in the safety dimension would spontaneously lead to an increase in the proportion of low-carbon fossil energy consumption in the environmental dimension. This was conducive to controlling carbon emissions in the process of natural gas exploitation, treatment, processing, and transportation. In this regard, this was helpful in forming a new pattern of sustainable development in the country while ensuring the safety of the energy supply, which is consistent with the findings of Qian et al. [77]. Therefore, the two dimensions of industrial safety and environmental protection had the same core and showed a synchronous change trend. Specifically, the coupling coordination degree increased sharply in 2013 and entered the barely coordination state (CS1) for the first time. This was due to Beijing’s continuous promotion of intelligent gas pipeline network construction, thus improving the safe and efficient operation of network facilities. In addition, according to the principle of “ensuring civil use, heating and rigid growth”, Beijing postponed the commissioning time of thermal power plants to reduce gas consumption. Meanwhile, local energy management departments formulated emergency plan systems such as the “Winter Natural Gas Control and Supply Plan” to improve their ability to respond to emergencies. The above measures effectively reduced the impact on the ecological environment while ensuring energy supply security, which agrees with the findings of Yang et al. [78] based on PM2.5 concentration. Meanwhile, the government successively released the “2013 Key Work Plan for Energy Conservation, Consumption Reduction, and Climate Change Response in Beijing”, “Clean Production Management Measures in Beijing”, and “Opinions on Further Promoting Contract Energy Management to Promote the Development of Energy Conservation Service Industry” in 2013. In addition, it successfully organized activities such as the 2013 Beijing Energy Conservation Week and National Low Carbon Day, and formed the energy conservation and low-carbon industry alliance in the Beijing–Tianjin–Hebei region. This sparked a wave of national action for sustainable development, which is similar to the findings of Zhang et al. on the Yangtze River Delta [79]. In this regard, the safety level and environmental protection level showed the same changing trend, which eventually led to an increase in their coupling coordination degree. During the 13th Five-Year Plan period, the degree steadily increased. It developed from the primary coordination state (CS2) to the moderate coordination state (CS3) and even reached the high coordination state (CS5). This was mainly because with the completion of the gas pipeline construction in the last areas without gas access, such as Yanqing District, Beijing achieved full coverage of pipeline gas at the end of 2016. In addition, the mid-term of the 13th Five-Year Plan (2017) was the final year of the “Beijing Clean Air Action Plan from 2013 to 2017”. During this period, Beijing vigorously promoted the utilization of low-carbon fossil fuels and contributed significantly to improving air quality. This is consistent with the findings of Wen et al. [80]. Meanwhile, Beijing focused on promoting priority gas projects such as natural gas vehicles. Specifically, the local government issued the development and layout planning of natural gas vehicle filling stations, and continuously promoted the construction of public transportation refueling stations and social refueling stations. In this regard, it promoted the positive role of natural gas in the construction of new energy systems while enhancing the supply capacity of domestic gas. Therefore, the safety and environmental protection levels of the regional natural gas industry were in a coordinated development state. During the early period of the 14th Five-Year Plan, the changing trend in the coupling coordination degree of safety–environmental protection was significantly lower than that of other two-dimensional types. The coordination level was in the imminent disorder state (DS1) in 2021 and then turned into the barely coordination state (CS1) in 2022. This was mainly due to the tightening of the global natural gas market, and the fact that the growth rate of natural gas production lagged behind the growth rate of demand. In addition, the rising price further led to the tendency of key energy-using departments such as industry and transportation to use high-carbon fossil energy with the characteristics of low cost and sufficient supply. This is similar to the findings of Mirza et al. [81] on the “Inflation Reduction Act” issued by the U.S. government. The continuous increase in natural gas consumption inevitably led to the synchronous increase in carbon emissions from the natural gas industry, which eventually caused a significant reduction in the level of environmental protection. Therefore, the safety level and environmental protection level were in the imminent disorder state.
The economy and environmental protection of the natural gas industry were two contradictory subjects to some extent. On the one hand, energy activities ran through all aspects of economic and social development. The lower the energy price and the easier it was to obtain, the greater the energy demand level. Even though the carbon content of natural gas was low, it still belonged to fossil energy. In the process of terminal consumption, CO2 was rapidly discharged into the atmosphere through intentional oxidation. Meanwhile, considerable water resources were consumed in the process of gas well fracture arrangement and underground water injection. The produced wastewater contained high concentrations of pollutants such as methane, phenol, and volatile organic, which caused serious pollution to the water ecological environment. This agrees with the findings of Theodori et al. [82]. Therefore, the economy level of Beijing’s natural gas industry would affect the environmental protection level through a scale effect. On the other hand, in order to meet the requirements of pollution reduction and carbon reduction under regional environmental regulations, the investment in pollution control of the natural gas industry increased accordingly. This part of the investment was regarded as an increase in cost and drove the ex-factory price to increase simultaneously. This was then eventually distributed to downstream consumers, thus affecting the economic feasibility of regional natural gas utilization. This is different from the result of Cordano et al. [83] on Latin America, mainly due to the lack of a market-oriented pricing mechanism for natural gas in China. But at the same time, from the perspective of a comprehensive energy system, the popularization of natural gas driven by economic advantages would certainly promote the overall low-carbon consumption level of fossil energy in Beijing. In this regard, the incentive and obstacle effects between safety and environmental protection coexisted and offset each other. Specifically, the coupling coordination degree continued to increase from 2008 to 2010, which developed from the mild disorder state (DS2) to the imminent disorder state (DS1). The main reasons for this phenomenon were as follows: Firstly, sustainable development was the relentless pursuit of the Olympic Movement. Under the guidance of the Green Olympics concept, clean fossil energy such as natural gas was rapidly popularized in Beijing in 2008. It is mainly used for coal-fired boiler replacement, coal gas replacement, power generation, and public transportation gasification. This is similar to the findings of Yep et al. on the Beijing Winter Olympics 2022 [84]. Under the encouragement of policies, green transportation solutions were continuously promoted. This provided a strong endogenous power for the market-oriented development of Beijing’s natural gas industry and further promoted the depth and breadth of natural gas application in green industries. Meanwhile, with the improvement of industrial economic benefits, there would be greater incremental space for environmental protection investment. This promoted the continuous upgrading and transformation of infrastructure in Beijing’s natural gas industry. Secondly, in 2009, Tongzhou Gate Station, as a new lifeline project for Beijing’s winter gas supply, was officially launched before the peak of winter heating. It laid a good material foundation for the replacement of clean fossil energy. In addition, in 2010, the National Development and Reform Commission uniformly raised the ex-factory benchmark price of natural gas and proposed to streamline downstream natural gas sales prices as soon as possible. The price tool further improved the gas supply enthusiasm and operation efficiency of enterprises. Meanwhile, it increased the economic benefits of the natural gas industry while accelerating the energy consumption transformation, which is similar to the findings of Dastan [85] on Turkey. Under the comprehensive influence of the above factors, the coupling coordination degree of economy and environmental protection continued to rise. In 2014, the degree showed a trend of transition from increasing to decreasing. The coordination level changed from the primary coordination state (CS2) to the barely coordination state (CS1). It was mainly due to the release of “Guiding Opinions on Establishing and Improving the Ladder Price System for Residents’ Domestic Gas”. Under the premise of ensuring the basic gas demand of residents, the regulating role of the ladder price system could guide residents to use gas reasonably and promote energy conservation and environmental protection. This agrees with the findings of Li et al. [86]. However, it is worth noting that the prices of various gas levels were implemented with excessive progressive markup. This inevitably reduced the economic efficiency of natural gas utilization and lowered the overall industrial profit by controlling the scale of gas consumption. Therefore, the coupling coordination degree showed a downward trend. During 2016–2019, the degree increased steadily and developed from the barely coordination state (CS1) to the moderate coordination state (CS3). The reasons for this phenomenon were as follows: Firstly, Beijing paid close attention to the changing trend of natural gas prices and the market. In order to cope with the comprehensive factors such as the upstream price changes and the adjustment of the national tax increase rate, Beijing implemented several adjustments to the natural gas price mechanism in 2016, 2018, and 2019 respectively. This helped to realize the dynamic balance of the natural gas market and reduced the economic burden of gas consumption by residents and enterprises. Meanwhile, the market-oriented operation of the natural gas industry was further promoted. Secondly, in 2018, the regional government issued the “Three-year Action Plan for Beijing to Win the Blue Sky Defence War”. It proposed that the coal-to-gas conversion work should adhere to the price-based reform to control the high-cost problem of environmental protection. This agrees with the findings of Rui et al. [87]. The above factors promoted the healthy and stable development of Beijing’s natural gas industry and helped achieve a win–win situation of economy and environmental protection.

5. Conclusions and Policy Implications

Coordination development is an endogenous characteristic and an important measure of high-quality industrial development. In this regard, high-quality development needs to pay attention not only to the level of development but also to the degree of coupling coordination. On this basis, the high-level coordination development of short-term security and stability, medium-term economic feasibility, and long-term low-carbon environmental protection can be ultimately realized. The high-quality development of the natural gas industry has become the key to solving the energy trilemma in China. This is helpful to avoid the unreasonable leap forward and one-size-fits-all approach under the new pattern of low-carbon development through industrial demonstration. In this context, the contradiction between high-level industrial development and high-level ecological environment protection can be adjusted.
Natural gas has the characteristics of stability, non-toxicity, low carbon, and high efficiency. On the whole, the three-dimensional development level of safety, economy, and environmental protection of the natural gas industry in Beijing showed a fluctuating upward trend from 2006 to 2022. As one of the four municipalities directly under the Central Government, Beijing had a huge population base and was one of the largest natural gas markets in China. In addition, in recent years, through intelligent and efficient transformation, Beijing has greatly reduced the cost of industrial operation and management. This eventually led to a relatively high economy level of the natural gas industry. However, Beijing’s natural gas resource endowment was scarce and had a low level of energy self-sufficiency. Its special political position as the capital could guarantee its energy supply to a certain extent, but the huge market demand still made Beijing face the realistic problem of a long-term supply–demand imbalance. Meanwhile, Beijing was in the middle stage of rapid economic growth and industrialization. Regional economic and social development could not be decoupled from large-scale fossil energy consumption in the short term. Therefore, the safety level and environmental protection level of Beijing’s natural gas industry need to be improved. The coupling coordination degree of the safety, economy, and environmental protection of the natural gas industry showed a fluctuating upward trend in Beijing. During the research period, the coordination level was adjusted from the moderate disorder state (DS3) to the primary coordination state (CS2). This was mainly due to the low energy utilization efficiency and insufficient technology maturity during the 11th Five-Year Plan. This led to industrial development facing a certain level of energy trilemma. During the 12th and 13th Five-Year Plans, the development of the natural gas industry gradually achieved three major changes in quality, efficiency, and motivation. In this regard, the three bottlenecks of price, supply, and monopoly were gradually broken. In the early stage of the 14th Five-Year Plan, the three-dimensional coupling coordination degree fluctuated under the impact of the COVID-19 epidemic. This was mainly because Beijing’s natural gas industry was concentrated in midstream storage and transportation, and downstream terminal utilization. Therefore, it was easily affected by epidemic prevention measures such as personnel flow restrictions and logistics restrictions. The coupling coordination degree of safety and environmental protection was the best as a whole. Under the strategic premise of giving consideration to development and security, clean and low-carbon energy transformation measures needed to be carried out on the basis of ensuring the stability of the energy supply. Therefore, at the policy level, safety and environmental protection coexisted and promoted each other. For Beijing, the coordination level of the safety and economy of the natural gas industry was relatively high. Only with stable natural gas supply capacity could sufficient resource support be provided for market expansion. The supply–demand balance was then promoted and the market price levels were stabilized. The coordination level of the economy and environmental protection of Beijing’s natural gas industry was relatively high. This was mainly because, from a systematic perspective, the popularization of natural gas driven by cost advantages could promote the overall low-carbon consumption level of fossil energy. In addition, Beijing promoted the win–win situation of economy and environmental protection to a certain extent by increasing investment in environmental protection infrastructure construction in the natural gas industry.
Based on the research findings, the following policy implications are proposed: Beijing should actively promote the integrated development of the natural gas industry with equipment manufacturing, the service industry, etc. Meanwhile, the supporting role of the natural gas industry for regional economic and social development should be enhanced. It is necessary to focus on the stability of the capital’s natural gas supply. Specifically, the construction of the natural gas pipeline network system and gate stations should be actively promoted to form a multi-source and multi-directional gas supply pattern. In addition, under the new pattern of low-carbon development, Beijing can widely popularize the utilization of natural gas by continuously implementing measures such as coal-burning substitution, clean energy heating, and the integration of natural gas and new energy. This is expected to effectively promote sustainable urban development and ecological civilization construction.
This study has carried out some innovative explorations, but there are inevitably some limitations to be further investigated. Firstly, by introducing the theoretical perspective of energy trilemma, we constructed a comprehensive measurement system of the development level of the regional natural gas industry. This can objectively reflect the three-dimensional development characteristics of the natural gas industry. However, under the limitations of data availability, the indicator comprehensiveness can be further improved. In addition, future research can consider combining spatial regression models to further analyze the regional differences in coupling coordination degree.

Author Contributions

Formal analysis, Q.L. and P.Z.; Investigation, Q.L.; Methodology, Q.L. and P.Z.; Resources, P.Z.; Software, Q.L. and P.Z.; Validation, Q.L.; Visualization, Q.L.; Writing—original draft, Q.L.; Writing—review and editing, Q.L. and P.Z. All authors have read and agreed to the published version of the manuscript.

Funding

This research was funded by the National Social Science Fund of China (Grants No. 22&ZD105).

Institutional Review Board Statement

Not applicable.

Informed Consent Statement

Not applicable.

Data Availability Statement

The data presented in this study are available on request from the corresponding author.

Conflicts of Interest

The authors declare no conflicts of interest.

References

  1. Cigdem, E. From diesel to renewables: Driving the energy revolution. Ventur. Cap. 2024, 64, 1611–1710. [Google Scholar]
  2. Maneejuk, P.; Kaewtathip, N.; Yamaka, W. The influence of the Ukraine-Russia conflict on renewable and fossil energy price cycles. Energy Econ. 2024, 129, 107218. [Google Scholar] [CrossRef]
  3. Li, Q.C.; Chen, J.H.; Zhang, P. Study oncarbon emission characteristics and its influencing factors of energy consumption in Sichuan Province, China. Front. Environ. Sci. 2024, 12, 1414730. [Google Scholar] [CrossRef]
  4. Li, S.L.; Gong, K.; Song, N.N.; Zeng, B. Forecasting China’s natural gas external dependence under the “Dual Carbon” goals by a new grey model. Sci. Progress 2023, 106, 368504231157707. [Google Scholar] [CrossRef]
  5. Guo, X.P.; Cao, J.B.; Ren, D.F. Multi-objective decision making of natural gas distribution optimization considering clean heating—Evidence from Beijing. Energy Sources Part A Recover. Util. Environ. Eff. 2023, 45, 2253–2266. [Google Scholar] [CrossRef]
  6. Song, M.J.; Latif, M.I.; Zhang, J.J.; Omran, M. Examining the energy trilemma index and the prospects for clean energy development. Gondwana Res. 2023, 122, 11–22. [Google Scholar] [CrossRef]
  7. Thaler, P.; Hofmann, B. The impossible energy trinity: Energy security, sustainability, and sovereignty in cross-border electricity systems. Political Geogr. 2022, 94, 102579. [Google Scholar] [CrossRef]
  8. Zhao, C.Y.; Dong, K.Y.; Liu, Z.G.; Ma, X.Y. Is digital economy an answer to energy trilemma eradication? The case of China. J. Environ. Manag. 2024, 349, 119369. [Google Scholar] [CrossRef]
  9. Marti, L.; Puertas, R. Sustainable energy development analysis: Energy Trilemma. Sustain. Technol. Entrep. 2022, 1, 100007. [Google Scholar] [CrossRef]
  10. Zhao, C.Y.; Dong, K.Y.; Wang, K.; Dong, X.C. How does energy trilemma eradication reduce carbon emissions? The role of dual environmental regulation for China. Energy Econ. 2022, 116, 106418. [Google Scholar] [CrossRef]
  11. Yap, J.T.; Gabriola, A.J.P.; Herrera, C.F. Managing the energy trilemma in the Philippines. Energy Sustain. Soc. 2021, 11, 34. [Google Scholar] [CrossRef]
  12. Khan, I.; Zakari, A.; Dagar, V.; Singh, S. World energy trilemma and transformative energy developments as determinants of economic growth amid environmental sustainability. Energ. Econ. 2022, 108, 105884. [Google Scholar] [CrossRef]
  13. Khan, I.; Zakari, A.; Zhang, J.J.; Dagar, V.; Singh, S. A study of trilemma energy balance, clean energy transitions, and economic expansion in the midst of environmental sustainability: New insights from three trilemma leadership. Energy 2022, 248, 123619. [Google Scholar] [CrossRef]
  14. Heffron, R.J.; Darren, M.C.; Zarazua, D.R.G. Balancing the energy trilemma through the energy justice metric. Appl. Energ. 2018, 229, 1191–1201. [Google Scholar] [CrossRef]
  15. Stempien, J.P.; Chan, S.H. Addressing energy trilemma via the modified Markowitz Mean-Variance Portfolio Optimization theory. Appl. Energy 2017, 202, 228–237. [Google Scholar] [CrossRef]
  16. Lowitzsch, J.; Croonenbroeck, C.; Novo, R. Feeding bees according to desired honey type: Tailoring support for European Energy Communities to their function to escape the energy trilemma. Energy Res. Soc. Sci. 2024, 114, 103579. [Google Scholar] [CrossRef]
  17. Behera, P.; Sethi, L.; Sethi, N. Balancing India’s energy trilemma: Assessing the role of renewable energy and green technology innovation for sustainable development. Energy 2024, 308, 132842. [Google Scholar] [CrossRef]
  18. Heffron, R.J.; Körner, M.F.; Sumarno, T.; Wagner, J.; Weibelzahl, M.; Fridgen, G. How different electricity pricing systems affect the energy trilemma: Assessing Indonesia’s electricity market transition. Energy Econ. 2022, 107, 105663. [Google Scholar] [CrossRef]
  19. Shah, S.A.A.; Cheng, L.S.; Solangi, Y.A.; Ahmed, M.; Ali, S. Energy trilemma based prioritization of waste-to-energy technologies: Implications for post-COVID-19 green economic recovery in Pakistan. J. Clean. Prod. 2021, 284, 124729. [Google Scholar] [CrossRef]
  20. Shankar, A.; Vijayakumar, K.; Babu, B.C.; Kaur, R. Energy trilemma index-based multiobjective optimal sizing of PV-battery system for a building in tropical savanna climate. IEEE Syst. J. 2022, 16, 5630–5638. [Google Scholar] [CrossRef]
  21. World Energy Council. World Energy Trilemma 2024: Evolving with Resilience and Justice. 2024. Available online: https://www.worldenergy.org/publications/entry/world-energy-trilemma-report-2024 (accessed on 25 December 2024).
  22. Li, Q.C.; Lin, Y.F. Systematic structural analysis of buried urban gas pipeline disaster in karst area. Welded Pipe Tube 2024, 47, 30–35. [Google Scholar] [CrossRef]
  23. Al Asbahi, A.A.M.H.; Gang, F.Z.; Iqbal, W.; Abass, Q.; Mohsin, M.; Iram, R. Novel approach of principal component analysis method to assess the national energy performance via Energy Trilemma Index. Energy Rep. 2019, 5, 704–713. [Google Scholar] [CrossRef]
  24. Gunningham, N. Managing the energy trilemma: The case of Indonesia. Energy Policy 2013, 54, 184–193. [Google Scholar] [CrossRef]
  25. Heffron, R.J.; McCauley, D.; Sovacool, B.K. Resolving society’s energy trilemma through the Energy Justice Metric. Energy Policy 2015, 87, 168–176. [Google Scholar] [CrossRef]
  26. Oliver, J.; Sovacool, B. The energy trilemma and the smart grid: Implications beyond the United States. Asia Pac. Policy Stud. 2017, 4, 70–84. [Google Scholar] [CrossRef]
  27. Alola, A.A.; Olanipekun, I.O.; Shah, M.I. Examining the drivers of alternative energy in leading energy sustainable economies: The trilemma of energy efficiency, energy intensity and renewables expenses. Renew. Energy 2023, 202, 1190–1197. [Google Scholar] [CrossRef]
  28. Grigoryev, L.M.; Medzhidova, D.D. Global energy trilemma. Russ. J. Econ. 2020, 6, 437–462. [Google Scholar] [CrossRef]
  29. Fu, F.Y.; Alharthi, M.; Bhatti, Z.; Sun, L.; Rasul, F.; Hanif, I.; Iqbal, W. The dynamic role of energy security, energy equity and environmental sustainability in the dilemma of emission reduction and economic growth. J. Environ. Manag. 2021, 280, 111828. [Google Scholar] [CrossRef]
  30. Joița, D.; Panait, M.; Dobrotă, C.E.; Diniță, A.; Neacșa, A.; Naghi, L.E. The European dilemma—Energy security or green transition. Energies 2023, 16, 3849. [Google Scholar] [CrossRef]
  31. Weiss, O.; Pareschi, G.; Georges, G.; Boulouchos, K. The Swiss energy transition: Policies to address the Energy Trilemma. Energy Policy 2021, 148, 111926. [Google Scholar] [CrossRef]
  32. Shirazi, M. Assessing energy trilemma-related policies: The world’s large energy user evidence. Energy Policy 2022, 167, 113082. [Google Scholar] [CrossRef]
  33. Fu, Y.L.; Lu, Y.H.; Yu, C.; Lai, K.K. Inter-country comparisons of energy system performance with the energy trilemma index: An ensemble ranking methodology based on the half-quadratic theory. Energy 2022, 261, 125048. [Google Scholar] [CrossRef]
  34. Khan, I.; Hou, F.; Irfan, M.; Zakari, A.; Le, H.P. Does energy trilemma a driver of economic growth? The roles of energy use, population growth, and financial development. Renew. Sustain. Energy Rev. 2021, 146, 111157. [Google Scholar] [CrossRef]
  35. Li, Q.C.; Zhang, P. Temporal–Spatial Characteristics of Carbon Emissions and Low-Carbon Efficiency in Sichuan Province, China. Sustainability 2024, 16, 7985. [Google Scholar] [CrossRef]
  36. Maki, A. The statistical price index as an approximation of the constant-utility price index: An empirical analysis using Japanese data sets. J. Jpn. Int. Econ. 2005, 19, 37–50. [Google Scholar] [CrossRef]
  37. Banadkouki, M.R.Z. Selection of strategies to improve energy efficiency in industry: A hybrid approach using entropy weight method and fuzzy TOPSIS. Energy 2023, 279, 128070. [Google Scholar] [CrossRef]
  38. Le Roux, D.; Olivès, R.; Neveu, P. Combining entropy weight and TOPSIS method for selection of tank geometry and filler material of a packed-bed thermal energy storage system. J. Clean. Prod. 2023, 414, 137588. [Google Scholar] [CrossRef]
  39. Jameel, T.; Riaz, M.; Aslam, M.; Pamucar, D. Sustainable renewable energy systems with entropy based step-wise weight assessment ratio analysis and combined compromise solution. Renew. Energy 2024, 235, 121310. [Google Scholar] [CrossRef]
  40. Sitorus, F.; Brito-Parada, P.R. A multiple criteria decision making method to weight the sustainability criteria of renewable energy technologies under uncertainty. Renew. Sustain. Energy Rev. 2020, 127, 109891. [Google Scholar] [CrossRef]
  41. Korga, S.; Dirik, C. Sustainability performance measurement in manufacturing sector with improved entropy-based TOPSIS method and an indicator set proposal. J. Bus. Res. 2023, 15, 561–577. [Google Scholar]
  42. Yuan, Y.N.; Wei, S.P.; Wan, D.Q.; Liu, D.W. A study of land-economy-society-ecology coordination in the Yangtze River Delta based on coupled coordination degree model. Int. Rev. Econ. Financ. 2024, 95, 103474. [Google Scholar] [CrossRef]
  43. Nawaz, A.; Wang, H.T.; Yang, H.T.; Armghan, H.; Gao, J.C. Risk-constrained probabilistic coordination in coupled transmission and distribution system. Electr. Pow. Syst. Res. 2024, 228, 110005. [Google Scholar] [CrossRef]
  44. Huang, W.; Gao, S.H.; Hu, P.Q.; Han, Y.; Ding, S.Y. Is the coupling and coordination of economic, social and environmental development crucial to the governance of relative poverty? PLoS ONE 2024, 19, e0306641. [Google Scholar] [CrossRef] [PubMed]
  45. Zhang, Q.; Ye, B.; Shen, X.X.; Zhu, Y.; Su, B.; Yin, Q.Q.; Zhou, S.L. Coupling coordination evaluation of ecology and economy and development optimization at town-scale. J. Clean. Prod. 2024, 447, 141581. [Google Scholar] [CrossRef]
  46. Wu, Q.; Hong, S.; Yang, L.; Mu, H.; Huang, C.Q.; Niu, X.X.; Zhong, Y.M.; Yi, J.H.; He, C. Coupling coordination relationships between air pollutant concentrations and emissions in China. Atmos. Pollut. Res. 2023, 14, 101678. [Google Scholar] [CrossRef]
  47. Shen, L.Y.; Huang, Y.L.; Huang, Z.H.; Lou, Y.L.; Ye, G.; Wong, S.W. Improved coupling analysis on the coordination between socio-economy and carbon emission. Ecol. Indic. 2018, 94, 357–366. [Google Scholar] [CrossRef]
  48. Seif, M.; Yaghoubi, S.; Khodoomi, M.R. Optimization of food-energy-water-waste nexus in a sustainable food supply chain under the COVID-19 pandemic: A case study in Iran. Environ. Dev. Sustain. 2024, 26, 7163–7197. [Google Scholar] [CrossRef]
  49. Norouzi, N. Post-COVID-19 and globalization of oil and natural gas trade: Challenges, opportunities, lessons, regulations, and strategies. Int. J. Energ. Res. 2021, 45, 14338–14356. [Google Scholar] [CrossRef]
  50. Zighed, M.; Benotmane, B. The impact of Covid-19 on energy consumption in Algeria-study and outlook. Desalin. Water Treat. 2021, 238, 49–52. [Google Scholar] [CrossRef]
  51. Dong, K.Y.; Sun, R.J.; Dong, C.; Li, H.; Zeng, X.G.; Ni, G.H. Environmental Kuznets curve for PM2.5 emissions in Beijing, China: What role can natural gas consumption play? Ecol. Indic. 2018, 93, 591–601. [Google Scholar] [CrossRef]
  52. Zhang, B.; Zhang, H.R.; Long, Y.; Fang, K.; Xu, N.; Li, Z.B.; Liang, Y.T. Economic and environmental co-benefit of natural gas supply chain considering the risk attitude of designers. J. Clean. Prod. 2020, 272, 122681. [Google Scholar] [CrossRef]
  53. Li, J.C.; Li, M.G.; Gao, L.N.; Li, J.J. Empowering more balanced energy futures: The role of the digital economy in alleviating China’s energy trilemma at the city-level. Energy 2024, 303, 131938. [Google Scholar] [CrossRef]
  54. Kim, H.J.; Han, S.M.; Yoo, S.H. Measuring the economic benefits of industrial natural gas use in South Korea. Sustainability 2018, 10, 2239. [Google Scholar] [CrossRef]
  55. Barbosa, M.O.; Peyerl, D.; Mendes, A.B. The economic and environmental benefits of adopting natural gas in isolated systems of Amazonas state, Brazil. Environ. Dev. 2023, 47, 100889. [Google Scholar] [CrossRef]
  56. Zhao, N.; Li, B.W.; Li, H.; Ahmad, R.; Peng, K.; Chen, D.Y.; Yu, X.; Zhou, Y.G.; Dong, R.J.; Wang, H.; et al. Field-based measurements of natural gas burning in domestic wall-mounted gas stove and estimates of climate, health and economic benefits in rural Baoding and Langfang regions of Northern China. Atmos. Environ. 2020, 229, 117454. [Google Scholar] [CrossRef]
  57. Chai, J.; Zhang, X.K.; Lu, Q.Y.; Zhang, X.J.; Wang, Y.B. Research on Imbalance between Supply and Demand in China’s Natural Gas Market under the Double-Track Price System. Energy Policy 2021, 155, 112380. [Google Scholar] [CrossRef]
  58. Gao, N.N. Research on Beijing Safety Guarantee System for Natural Gas Supply. Adv. Mater. Res. 2014, 1008–1009, 1429–1432. [Google Scholar] [CrossRef]
  59. Jiang, B.B.; Chen, W.Y.; Yu, Y.F.; Zeng, L.M.; Victor, D. The future of natural gas consumption in Beijing, Guangdong and Shanghai: An assessment utilizing MARKAL. Energ. Policy 2008, 36, 3286–3299. [Google Scholar] [CrossRef]
  60. Hussain, A.; Memon, J.A.; Murshed, M.; Alam, M.S.; Mehmood, U.; Alam, M.N.; Rahman, M.; Hayat, U. A time series forecasting analysis of overall and sector-based natural gas demand: A developing South Asian economy case. Environ. Sci. Pollut. Res. 2022, 29, 71676–71687. [Google Scholar] [CrossRef]
  61. Zhang, G.D.; Wang, J.L.; Liu, Y. ‘’Carbon’‘ suppresses ‘’energy’‘–How does carbon emission right trading policy alleviate the energy trilemma? Energy 2024, 307, 132790. [Google Scholar] [CrossRef]
  62. Han, J.P.; Du, E.S.; Lv, X.Y.; Hou, J.M. Low-carbon optimal configuration of integrated electricity and natural gas energy system with life-cycle carbon emission. Processes 2024, 12, 845. [Google Scholar] [CrossRef]
  63. Li, J.J.; Tian, Y.J.; Yan, X.H.; Yang, J.D.; Wang, Y.G.; Xu, W.Q.; Xie, K.C. Approach and potential of replacing oil and natural gas with coal in China. Front. Energy 2020, 14, 419–431. [Google Scholar] [CrossRef]
  64. Ivanova, A.; Zia, A.; Ahmad, P.; Bastos-Lima, M. Climate mitigation policies and actions: Access and allocation issues. Int. Environ. Agreem. Politics Law Econ. 2020, 20, 287–301. [Google Scholar] [CrossRef]
  65. Karamaneas, A.; Koasidis, K.; Frilingou, N.; Xexakis, G.; Nikas, A.; Doukas, H. A stakeholder-informed modelling study of Greece’s energy transition amidst an energy crisis: The role of natural gas and climate ambition. Renew. Sustain. Energy Transit. 2023, 3, 100049. [Google Scholar] [CrossRef]
  66. Chi, Y.Y.; Esily, R.R.; Ibrahiem, D.M.; Houssam, N.; Chen, Y.H.; Jia, X.J.; Zhang, X.F. Is North Africa region on track to energy trilemma for enhancing economic progress? The role of population growth and energy usage. Energy Strateg. Rev. 2023, 50, 101245. [Google Scholar] [CrossRef]
  67. Zhong, H.; He, S.; Sun, Q. A system dynamic model for natural gas safety supply and demand balance mechanism. Energy Sci. Eng. 2023, 11, 3768–3779. [Google Scholar]
  68. Chen, L.; Pan, L.Y.; Zhang, K.G. The dynamic cointegration relationship between international crude oil, natural gas, and coal price. Energies 2024, 17, 3126. [Google Scholar] [CrossRef]
  69. Rioux, B.; Galkin, P.; Murphy, F.; Feijoo, F.; Pierru, A.; Malov, A.; Li, Y.; Wu, K. The economic impact of price controls on China’s natural gas supply chain. Energy Econ. 2019, 80, 394–410. [Google Scholar] [CrossRef]
  70. Chung, V.N. Transmission paths of COVID-19 impact on energy supply and production chain in Vietnam. Int. J. Supply Oper. Manag. 2022, 9, 473–482. [Google Scholar]
  71. Rawat, A.; Garg, C.P. Assessment of the barriers of natural gas market development and implementation: A case of developing country. Energy Policy 2021, 152, 112195. [Google Scholar] [CrossRef]
  72. Freeman, G.M.; Apt, J.; Moura, J. What causes natural gas fuel shortages at U.S. power plants? Energy Policy 2020, 147, 111805. [Google Scholar] [CrossRef]
  73. Shaikh, F.; Ji, Q.; Fan, Y. Evaluating China’s natural gas supply security based on ecological network analysis. J. Clean. Prod. 2016, 139, 1196–1206. [Google Scholar] [CrossRef]
  74. Che, C.; Geng, X.; Zheng, H.X.; Chen, Y.; Zhang, X.G. The pricing mechanism analysis of china’s natural gas supply chain under the “Dual Carbon” target based on the perspective of game theory. Sustainability 2022, 14, 9510. [Google Scholar] [CrossRef]
  75. He, Y.X.; Xia, T.; Liu, Y.Y.; Zhou, L.F.; Zhou, B. Residential natural gas price affordability analysis-A case study of Beijing. Renew. Sustain. Energy Rev. 2013, 28, 392–399. [Google Scholar] [CrossRef]
  76. Li, J.F.; Jiang, S.Y. Energy security in the era of transition. Glob. Energy Interconnect. 2019, 2, 376–378. [Google Scholar] [CrossRef]
  77. Qian, J.R.; Han, X.Z.; Ye, M.; Lv, Y.X.; Che, J. Environmental benefits of the West-East Natural Gas Transmission Project: Cross-regional energy optimization and transformation for sustainable development. Energies 2024, 17, 3820. [Google Scholar] [CrossRef]
  78. Yang, X.H.; Xiao, D.P.; Bai, H.Z.; Tang, J.Z.; Wang, W. Spatiotemporal distributions of PM2.5 concentrations in the Beijing–Tianjin–Hebei region from 2013 to 2020. Front. Environ. Sci. 2022, 10, 842237. [Google Scholar] [CrossRef]
  79. Zhang, Z.H.; Zhang, Y.J.; Zhong, S.; Fang, J.; Bai, B.R.; Huang, C.; Ge, X.L. Anthropogenic-driven changes in concentrations and sources of winter volatile organic compounds in an urban environment in the Yangtze River Delta of China between 2013 and 2021. Sci. Total Environ. 2024, 942, 173713. [Google Scholar] [CrossRef]
  80. Wen, Z.; Wang, C.J.; Li, Q.; Xu, W.; Lu, L.; Li, X.J.; Tang, A.H.; Collett, J.L.; Liu, X.J. Winter air quality improvement in Beijing by clean air actions from 2014 to 2018. Atmos. Res. 2021, 259, 105674. [Google Scholar] [CrossRef]
  81. Mirza, N.; Naqvi, B.; Rizvi, S.K.A.; Umar, M. Fiscal or monetary? Efficacy of regulatory regimes and energy trilemma of the inflation reduction act (IRA). Int. Rev. Financ. Anal. 2023, 90, 102821. [Google Scholar] [CrossRef]
  82. Theodori, G.L.; Wynveen, B.J.; Measham, T.; Evensen, D. A systematic quantitative review of the perceived environmental and natural resource-related impacts of unconventional oil and gas development. Extr. Ind. Soc. 2022, 12, 101176. [Google Scholar] [CrossRef]
  83. Cordano, A.L.V.; Zellou, A.M. Super cycles in natural gas prices and their impact on Latin American energy and environmental policies. Resour. Policy 2020, 65, 101513. [Google Scholar] [CrossRef]
  84. Yep, E.; Liang, A.C. China’s green Winter Olympics 2022 to boost natural gas demand. Platts Coal Trader Int. 2021, 21, 5–6. [Google Scholar]
  85. Dastan, S.A. The predicaments of the Turkish natural gas market between supply shortages and price hikes. Resour. Policy 2023, 82, 103566. [Google Scholar] [CrossRef]
  86. Li, L.L.; Luo, X.; Zhou, K.L.; Xu, T.T. Evaluation of increasing block pricing for households’ natural gas: A case study of Beijing, China. Energy 2018, 157, 162–172. [Google Scholar] [CrossRef]
  87. Rui, X.T.; Feng, L.Y.; Feng, J.X. A gas-on-gas competition trading mechanism based on cooperative game models in China’s gas market. Energy Rep. 2020, 6, 365–377. [Google Scholar] [CrossRef]
Figure 1. The development level of the safety, economy, and environmental protection of Beijing’s natural gas industry from 2006 to 2022.
Sustainability 17 02686 g001
Figure 2. The evolution trend of the coupling coordination degree of safety, economy, and environmental protection of Beijing’s natural gas industry.
Sustainability 17 02686 g002
Figure 3. The coordination level of the safety, economy, and environmental protection of Beijing’s natural gas industry.
Sustainability 17 02686 g003
Table 1. A comprehensive measurement system of the development level of the natural gas industry.
First-Level IndicatorSecond-Level IndicatorIndicator MeaningUnit
SafetyElastic coefficient of natural gas productionThe ratio of the annual growth rate of gross regional product to the annual growth rate of total natural gas production-
Per capita natural gas production levelThe ratio of total natural gas production to total year-end resident populationm3/person
Natural gas storage capacityThe maximum capacity of regional gas storage facilitym3
Natural gas self-sufficiency levelThe ratio of total natural gas production to total natural gas consumption-
External dependence on natural gasThe import volume of external natural gasm3
Level of resource endowmentThe total proven reserves of natural gasm3
Fixed assets investmentThe fixed assets investment in natural gas industryCNY
Energy transportation capacityThe length of natural gas pipelineskm
EconomyNatural gas consumption intensityThe ratio of gross regional product to total natural gas consumptionCNY/m3
Natural gas popularization levelThe ratio of total urban natural gas consumption population to total year-end resident population-
Market demand levelThe total supply of natural gasm3
Per capita consumption powerThe ratio of total natural gas consumption to total year-end resident populationm3/person
Industrial economic benefitThe total profit of natural gas industryCNY
Gas price levelThe ratio of consumer price index to the producer price index of natural gas industry-
Employment absorptionThe employment in natural gas industryperson
Environmental protectionCarbon emission control level of natural gas industryThe annual reduction in carbon emissions from fuel combustion and system spillage compared with the previous yearTon
Natural gas processing and conversion efficiencyThe ratio of output to input in the process of natural gas processing and conversion-
Low-carbon level of fossil energy consumptionThe ratio of total natural gas consumption to total fossil energy consumption-
Natural gas export levelThe export volume of local natural gasm3
Environmental pollution control levelThe annual emission reduction in chemical oxygen demand in regional industrial wastewater compared with the previous yearTon
Atmospheric environmental qualityThe number of days with excellent air quality in the regionday
Investment level in environmental pollution controlThe investment in environmental protection infrastructure construction in natural gas industryCNY
Table 2. The entropy weight values, calculated based on the models before and after improvement.
Entropy ValuesEntropy Weights Calculated Before ImprovementEntropy Weights Calculated After Improvement
10.90.16670.2963
0.80.33330.3333
0.70.50000.3704
20.9990.16670.3330
0.9980.33330.3333
0.9970.50000.3337
30.99990.16670.3333
0.99980.33330.3333
0.99970.50000.3334
Table 3. The classification standard of coupling coordination degree.
Coupling Coordination DegreeLevelCoupling Coordination DegreeLevel
[0.0000, 0.0999]Extremely disorder state (DS5)(0.4999, 0.5999]Barely coordination state (CS1)
(0.0999, 0.1999]Severe disorder state (DS4)(0.5999, 0.6999]Primary coordination state (CS2)
(0.1999, 0.2999]Moderate disorder state (DS3)(0.6999, 0.7999]Moderate coordination state (CS3)
(0.2999, 0.3999]Mild disorder state (DS2)(0.7999, 0.8999]Good coordination state (CS4)
(0.3999, 0.4999]Imminent disorder state (DS1)(0.8999, 1.0000]High coordination state (CS5)
Disclaimer/Publisher’s Note: The statements, opinions and data contained in all publications are solely those of the individual author(s) and contributor(s) and not of MDPI and/or the editor(s). MDPI and/or the editor(s) disclaim responsibility for any injury to people or property resulting from any ideas, methods, instructions or products referred to in the content.

