


Impact of Climate Change on Water Quality and Sustainability in Baluchistan: Pakistan’s Challenges in Meeting United Nations Sustainable Development Goal (UNSDG) Number 6


Abstract
1. Introduction
- ➢
- “6.1 By 2030, achieve universal and equitable access to safe and affordable drinking water for all
- ➢
- 6.2 By 2030, achieve access to adequate and equitable sanitation and hygiene for all and end open defecation, paying special attention to the needs of women and girls and those in vulnerable situations
- ➢
- 6.3 By 2030, improve water quality by reducing pollution, eliminating dumping and minimizing release of hazardous chemicals and materials, halving the proportion of untreated wastewater and substantially increasing recycling and safe reuse globally
- ➢
- 6.4 By 2030, substantially increase water-use efficiency across all sectors and ensure sustainable withdrawals and supply of freshwater to address water scarcity and substantially reduce the number of people suffering from water scarcity
- ➢
- 6.5 By 2030, implement integrated water resources management at all levels, including through transboundary cooperation as appropriate”
- ➢
- To examine the status of water in Pakistan in general and Baluchistan in particular.
- ➢
- To investigate the quality of water for drinking purposes in Baluchistan.
- ➢
- To analyze water conservation, distribution to different sectors, and recycling of wastewater for use in agriculture and washing purposes.
- ➢
- To recommend measures as policy feedback to relevant ministries and organizations for ensuring water security and achieving UNSDG number 6 by 2030
- ➢
- What are the water security challenges in Baluchistan?
- ➢
- How does contaminated water quality impact the inhabitants of Baluchistan?
- ➢
- How can the rational distribution of water to different sectors be made to ensure water security on a sustainable basis?
- ➢
- How can conservative measures help Baluchistan’s long-term water security?
Literature Review
2. Materials and Methods
2.1. Systematic Literature Review (SLR)
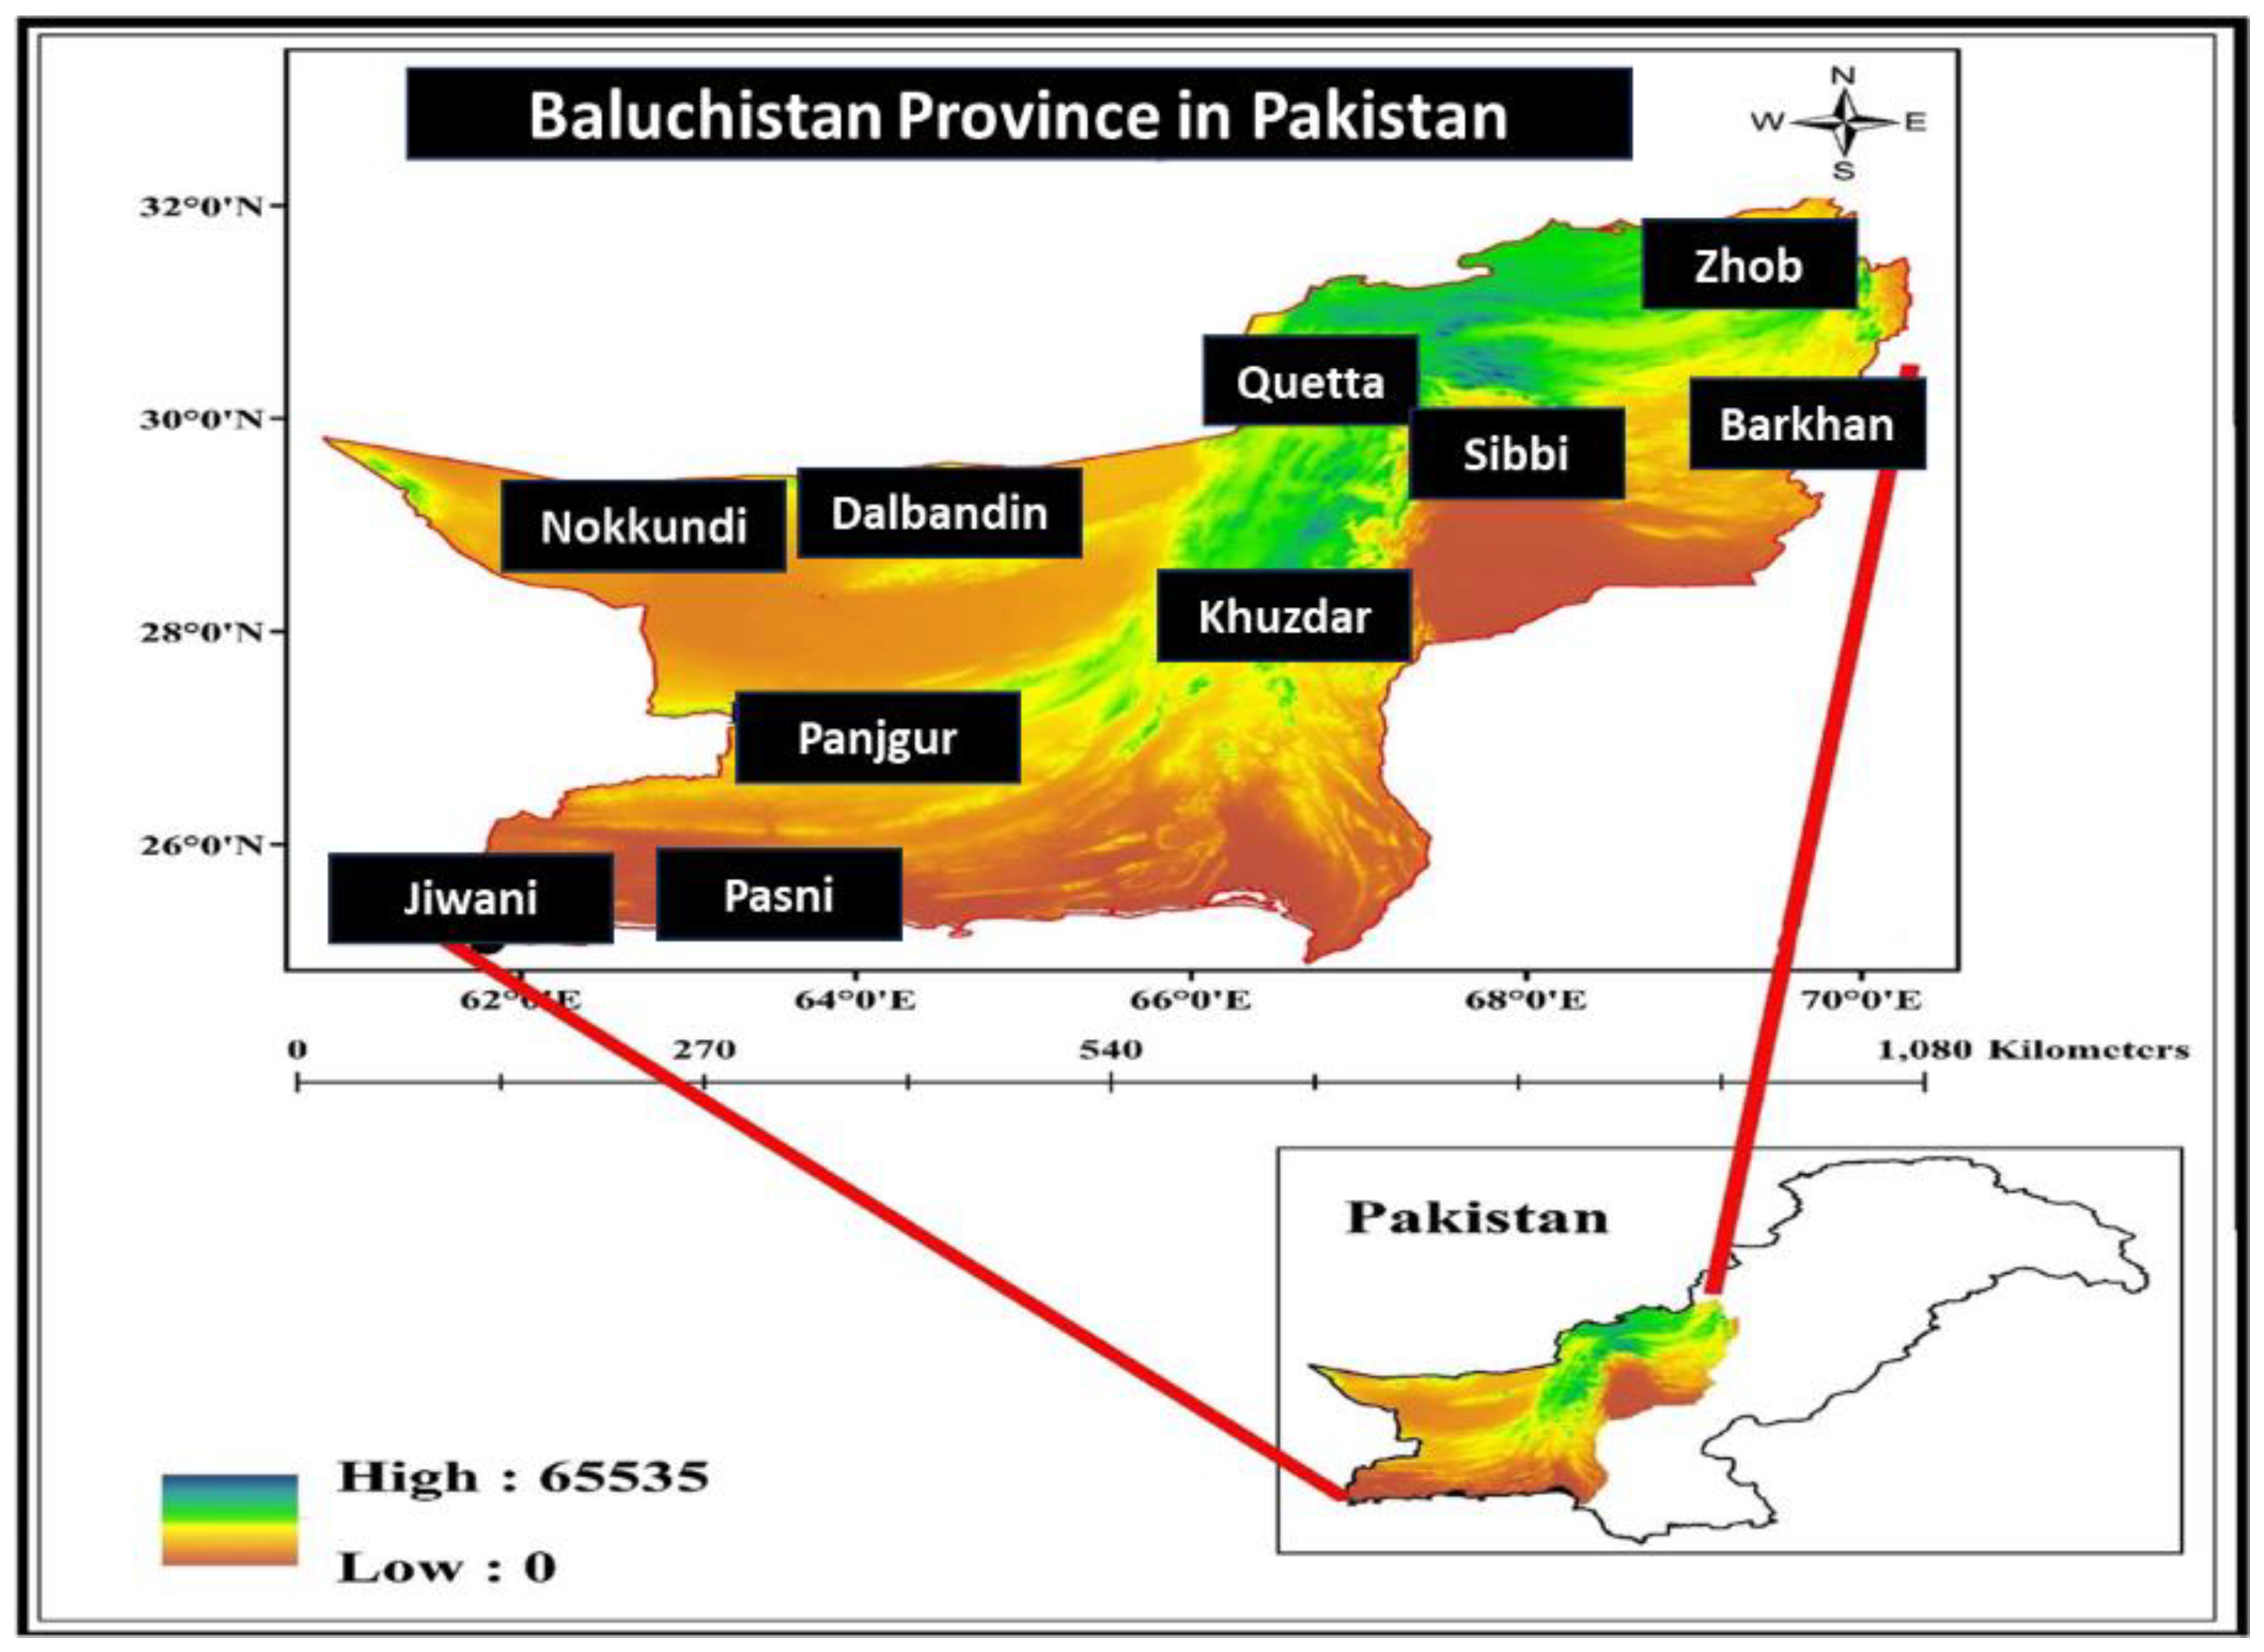
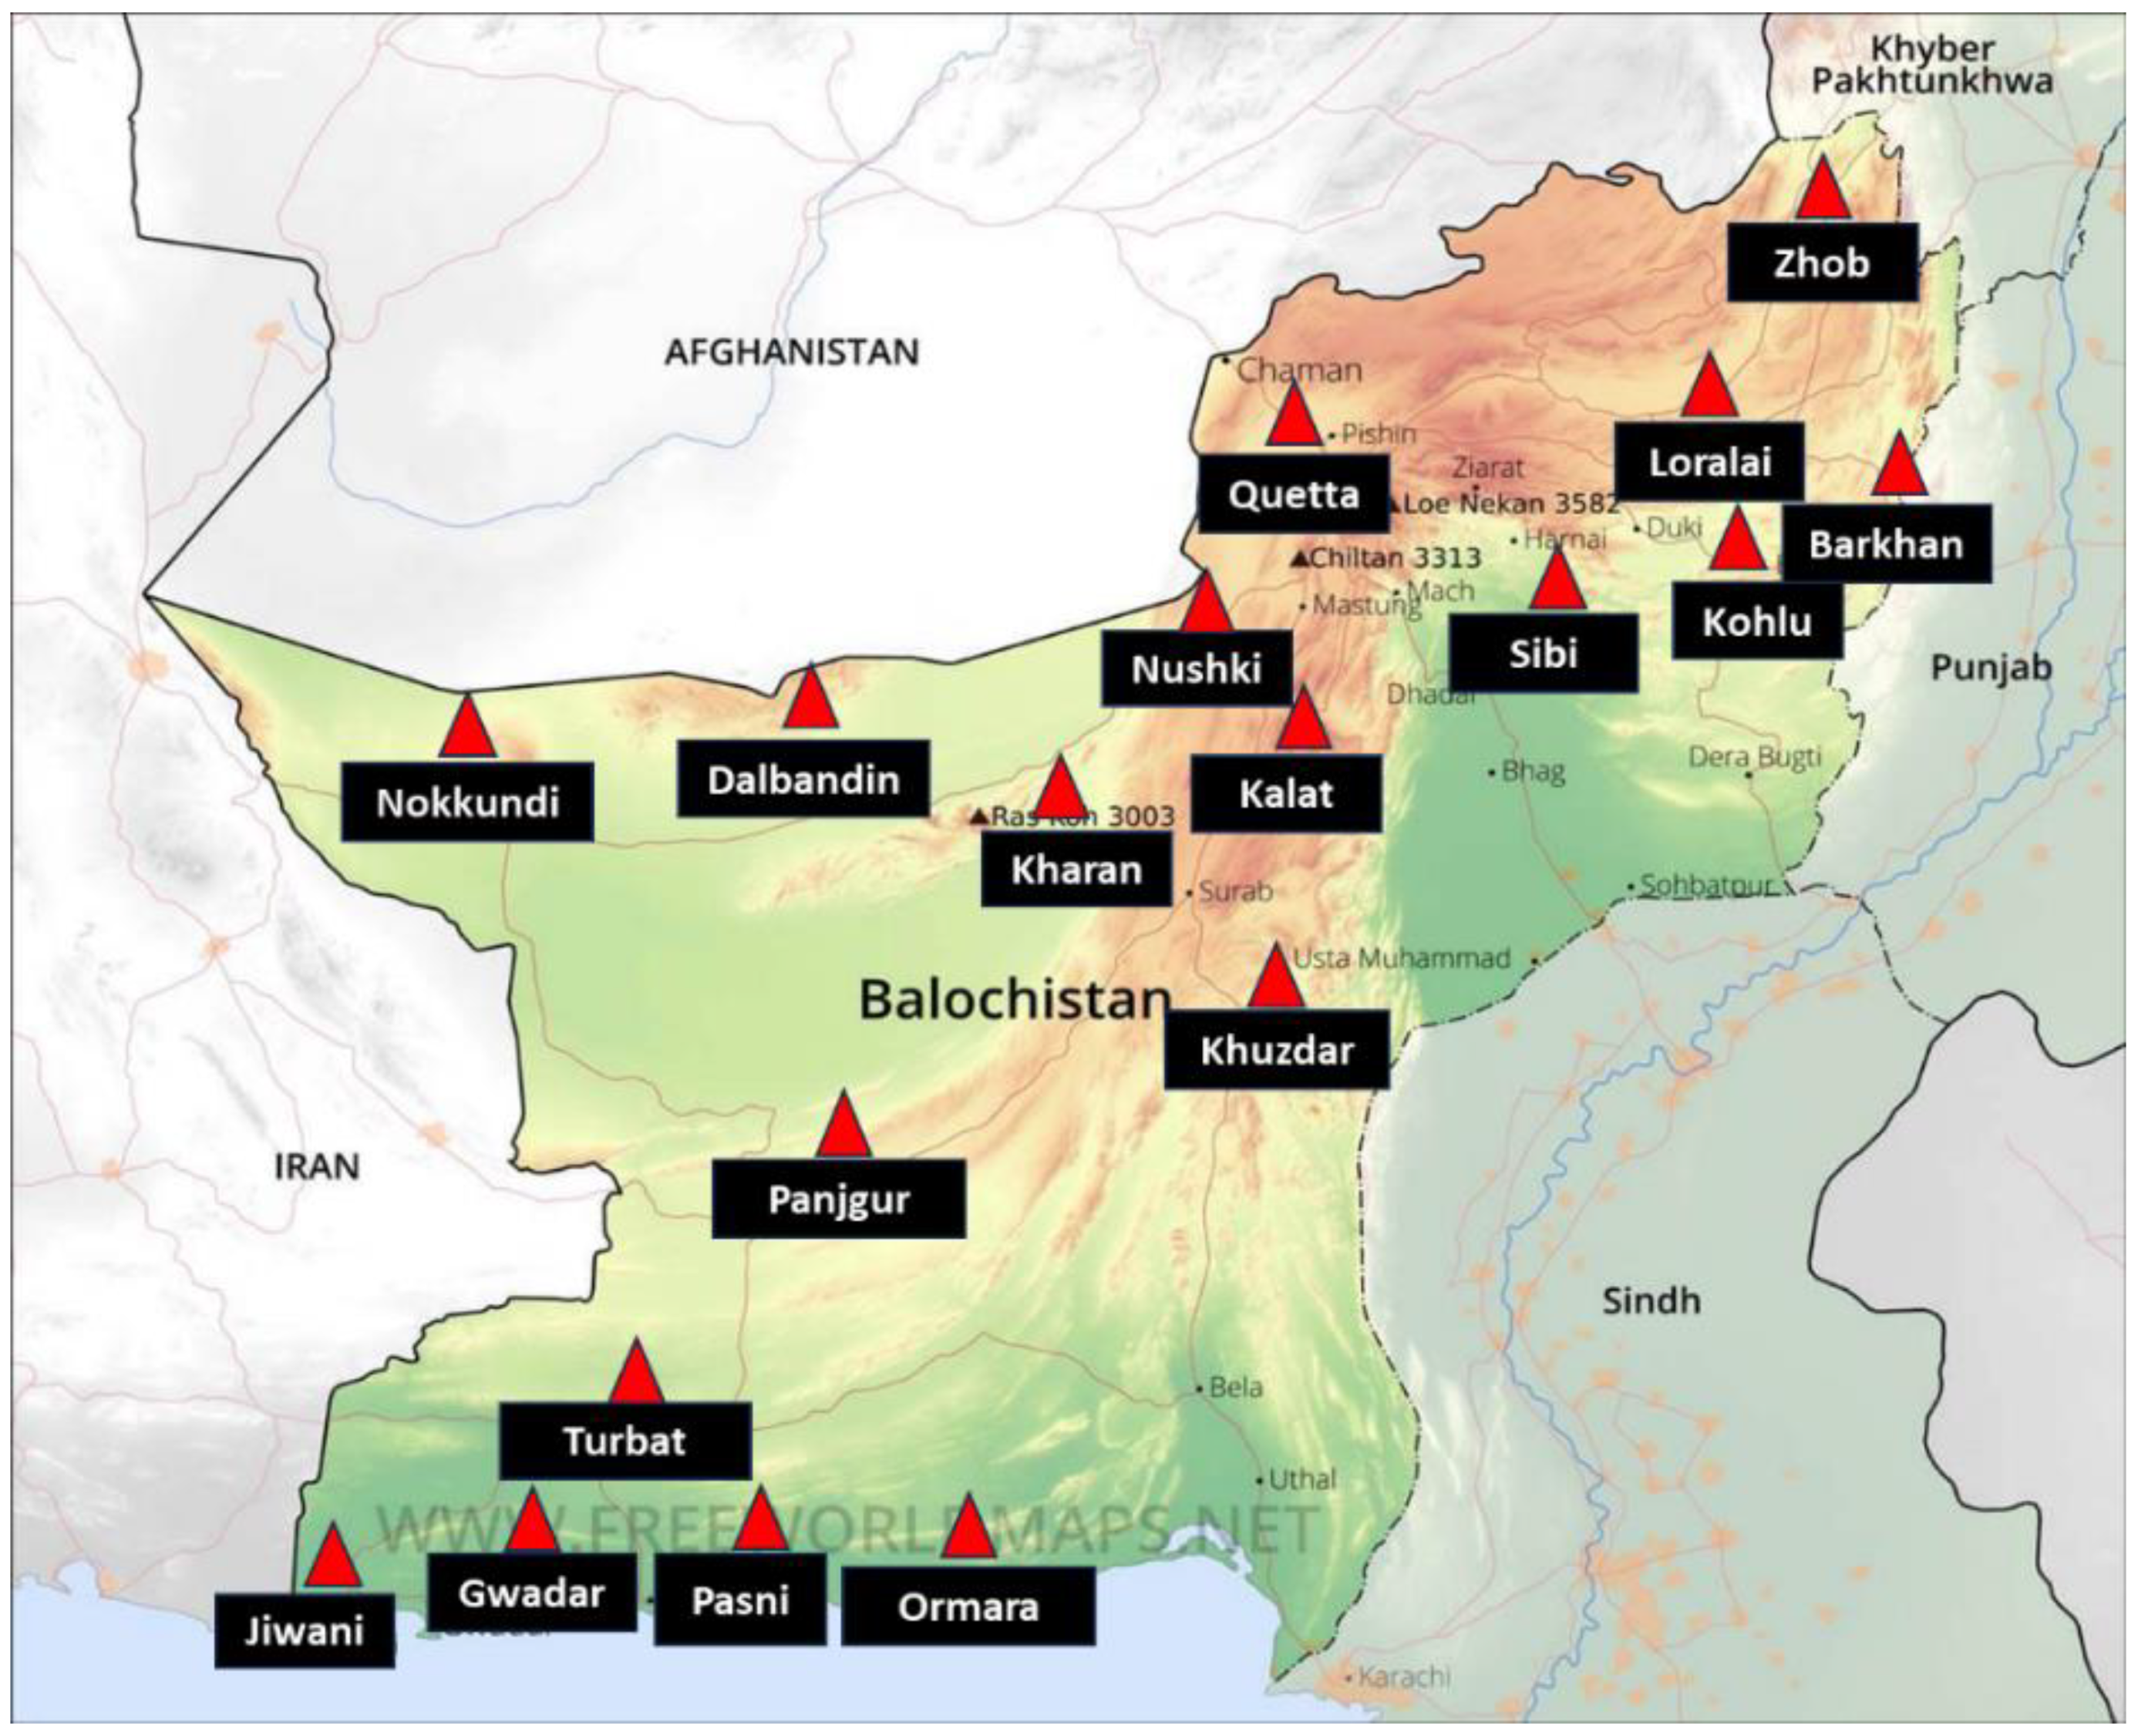
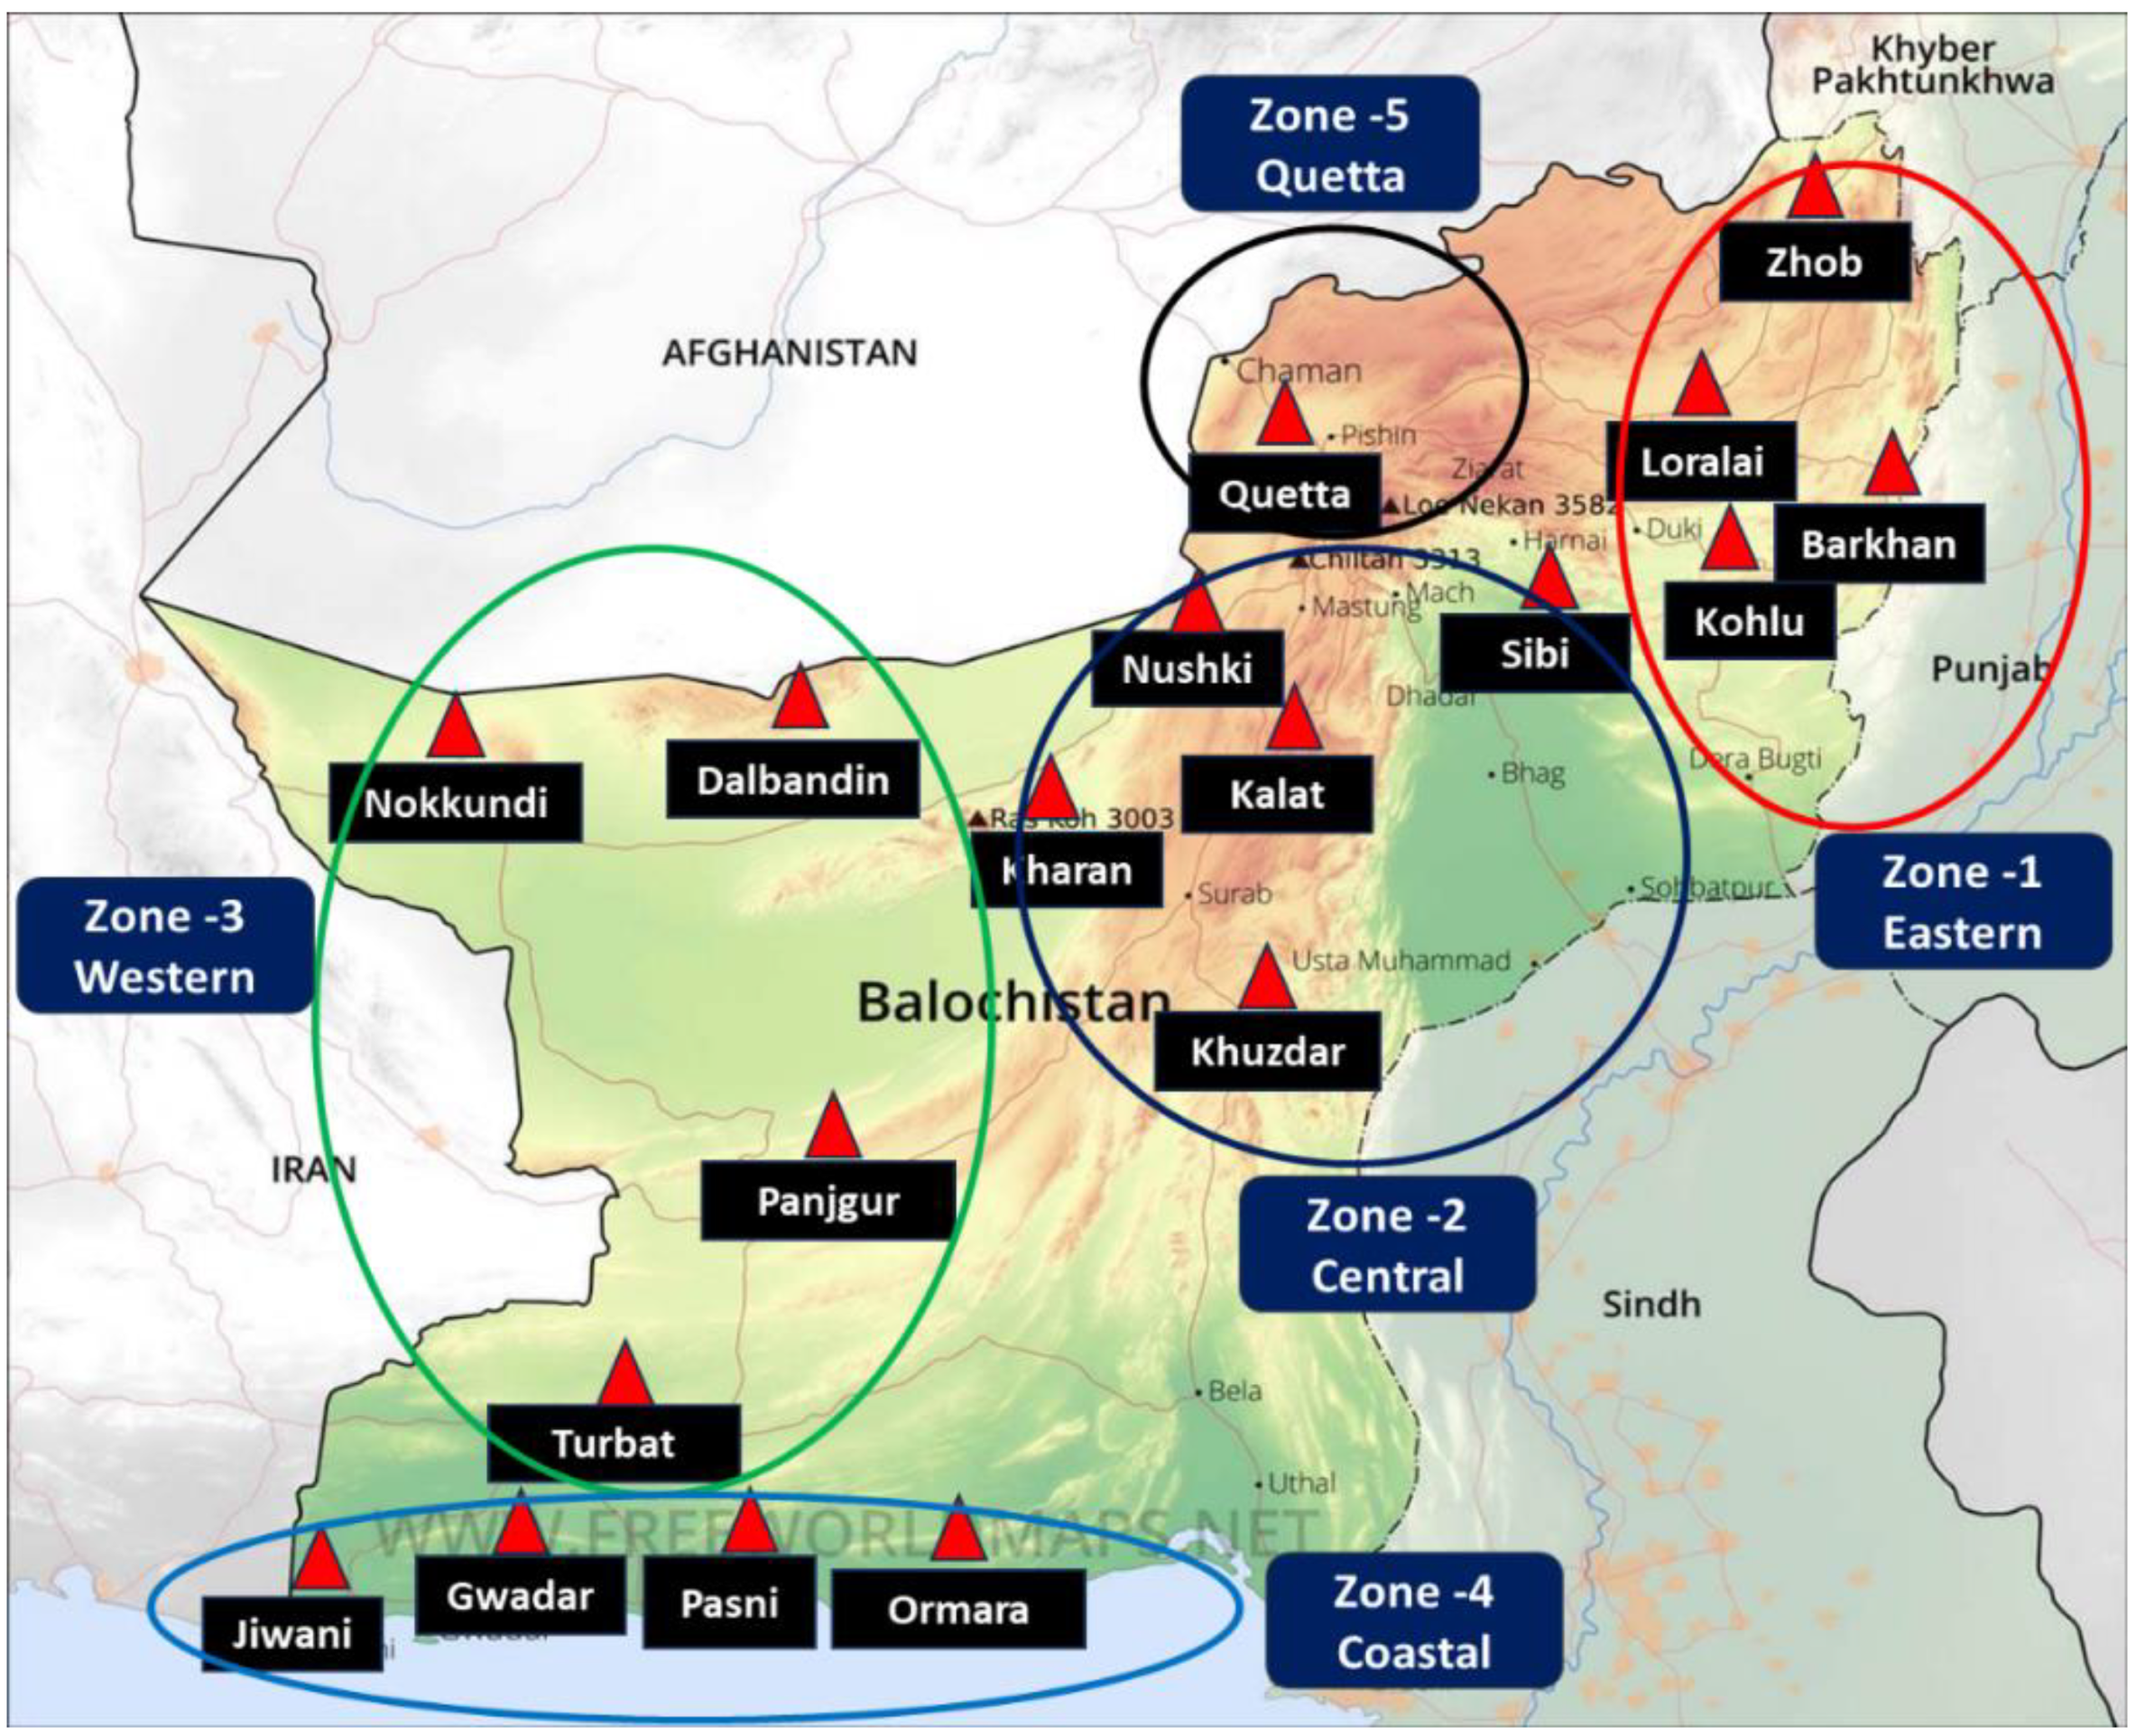
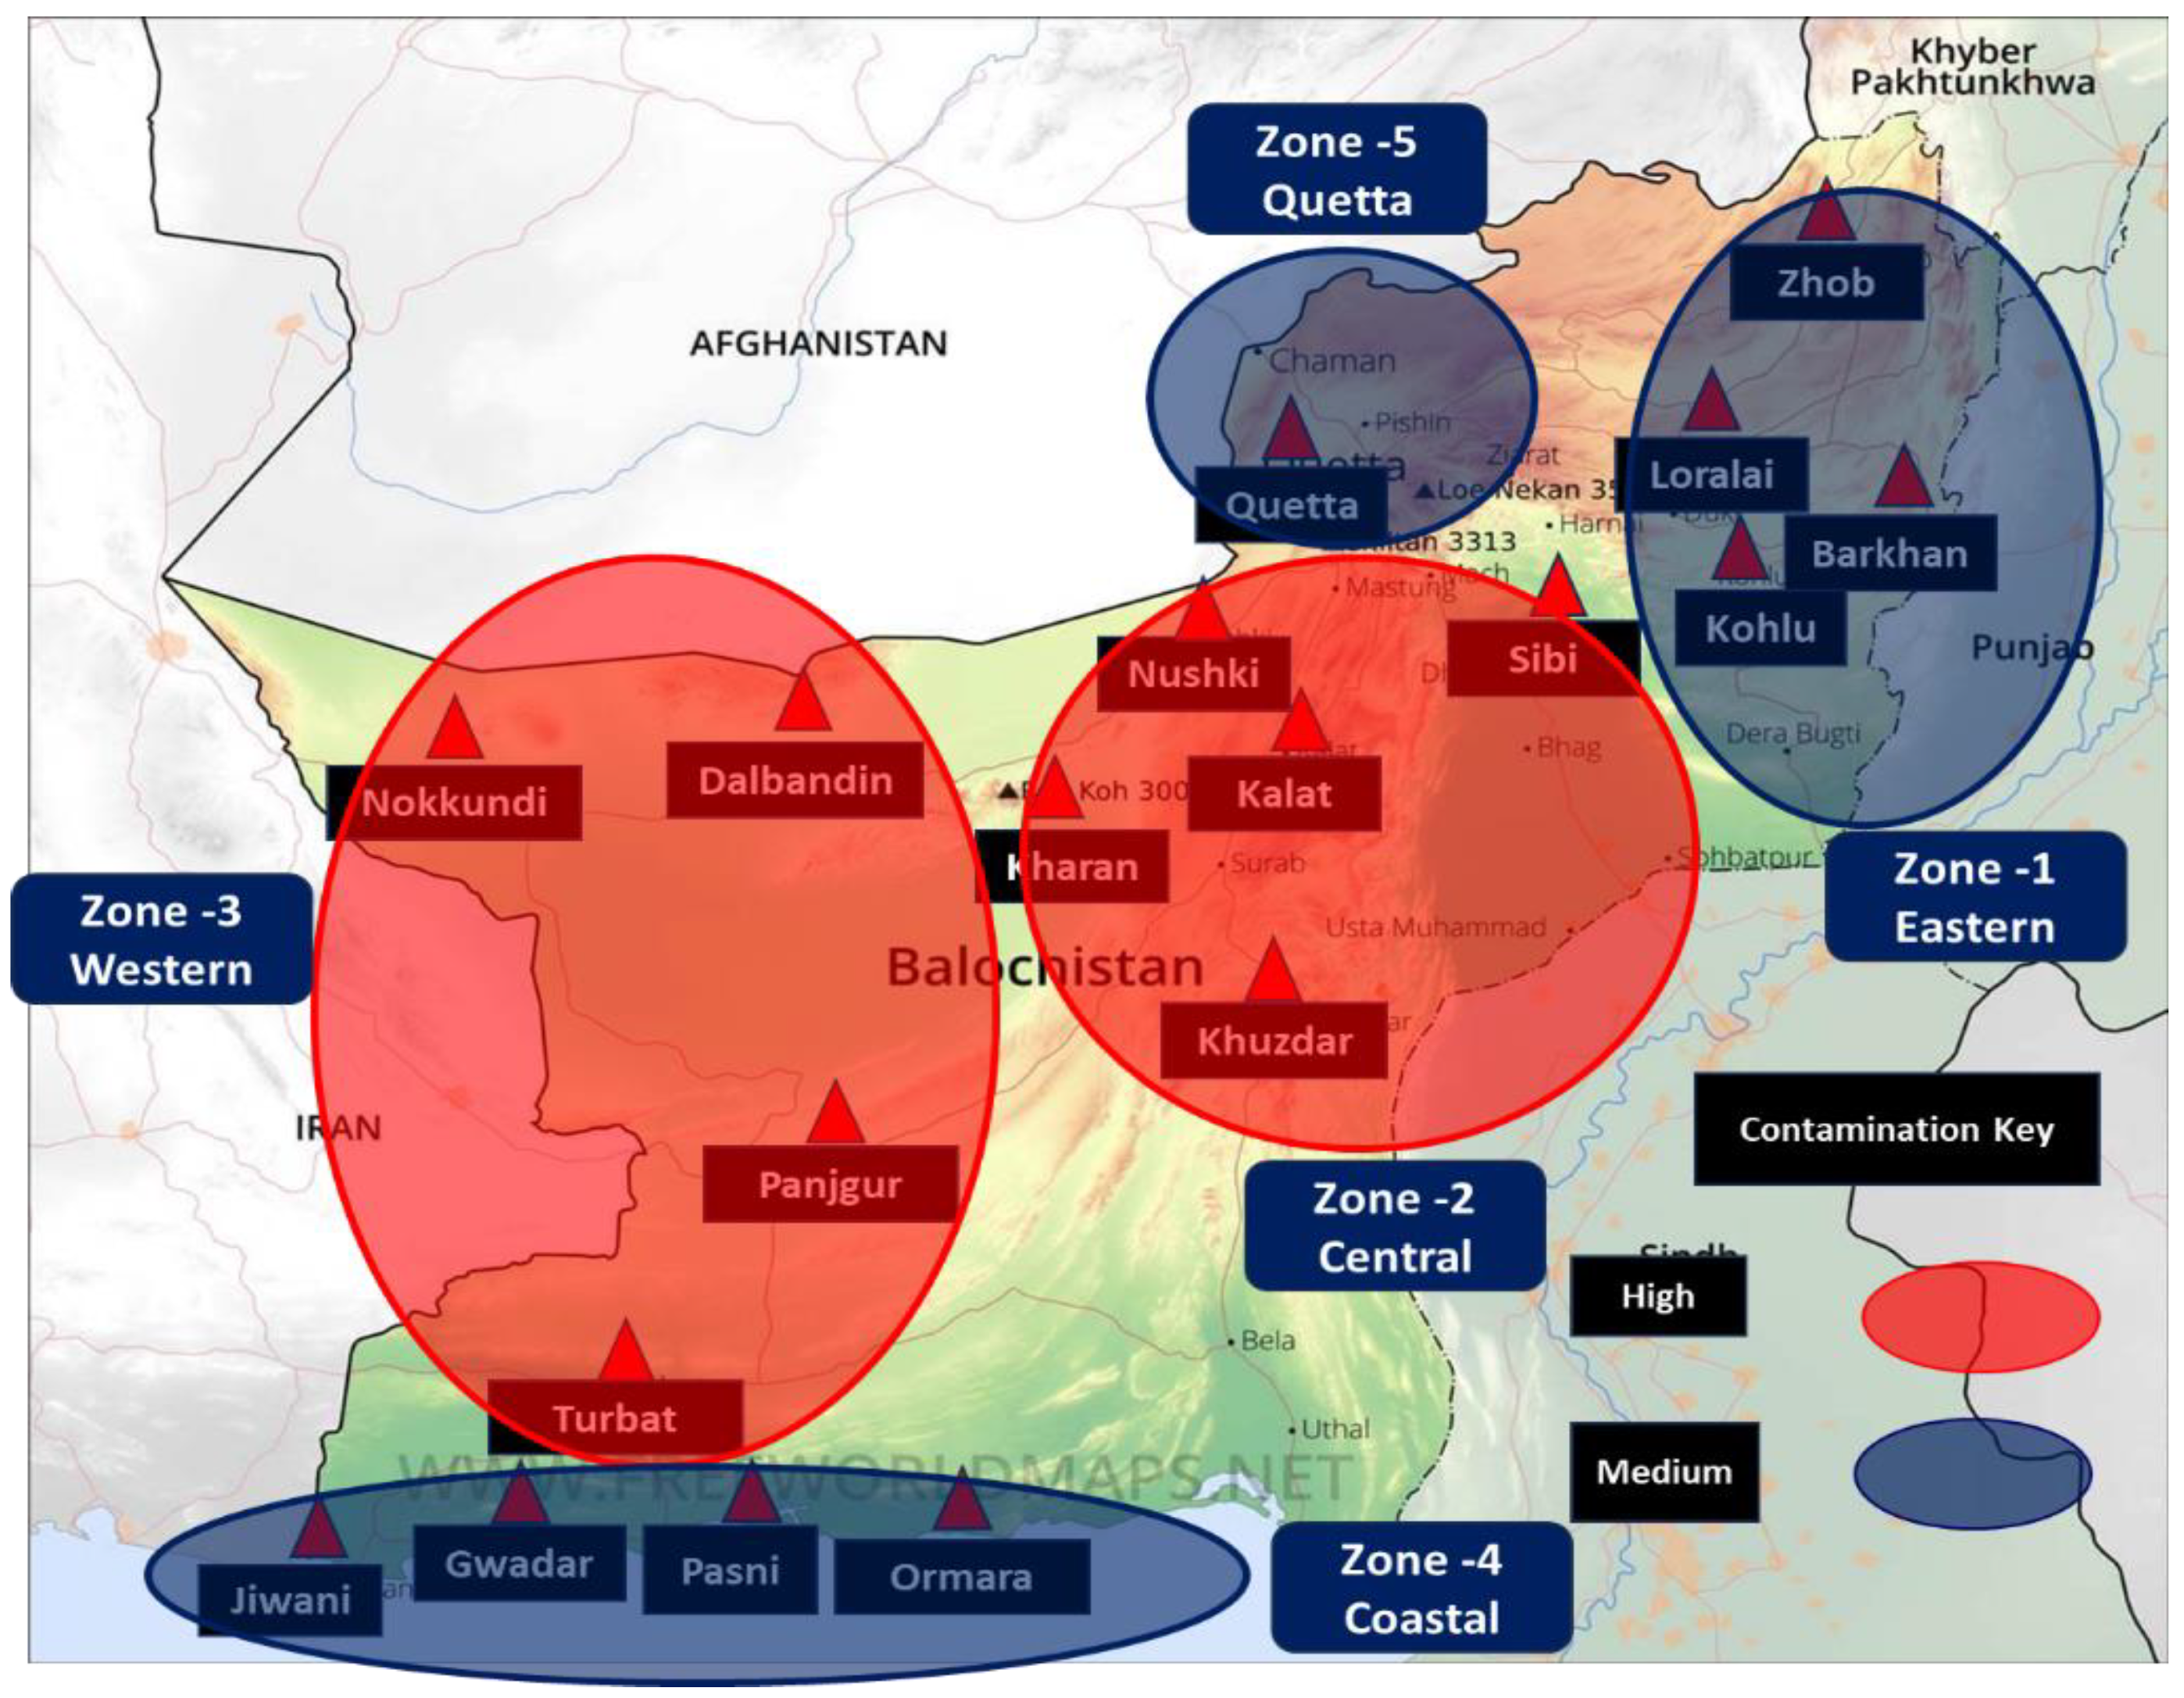
2.2. Study Area
2.3. Water Sampling Sites Selection Process
- Source water: Rivers, lakes, reservoirs, or groundwater wells before treatment.
- Treatment facilities: Before and after major treatment stages (e.g., filtration, chlorination).
- Distribution system: Dead-end pipes, low-pressure zones, and storage tanks.
- Points of use: Household taps, industrial discharge points, or irrigation channels.
- Water flow and mixing conditions: Samples collection was conducted where water was well-mixed to ensure consistency. Stagnant zones were avoided unless local contamination risks were assessed. Flow velocity and turbulence were considered to prevent the settling of particulates before sampling.
- Potential contamination sources: In urban areas, these included proximity to sewage discharge, industrial effluents, or stormwater drains. In agricultural zones, fertilizers, pesticides, and livestock waste were included. In industrial areas and groundwater wells, heavy metals, organic pollutants, and chemical discharges were included, considering depth, casing integrity, and pumping conditions to prevent cross-contamination.
- Special considerations for other contaminants: To detect heavy metals and pesticides, samples from areas with suspected contamination (e.g., industrial zones and agricultural lands) were taken. To determine the presence of microbiological contaminants (E. coli, Coliforms), samples from drinking water sources, storage tanks, and distribution endpoints were taken. For turbidity and sediments, the samples were collected from surface water bodies with varying depths to assess sediment distribution.
2.4. Sampling Considerations and Methods
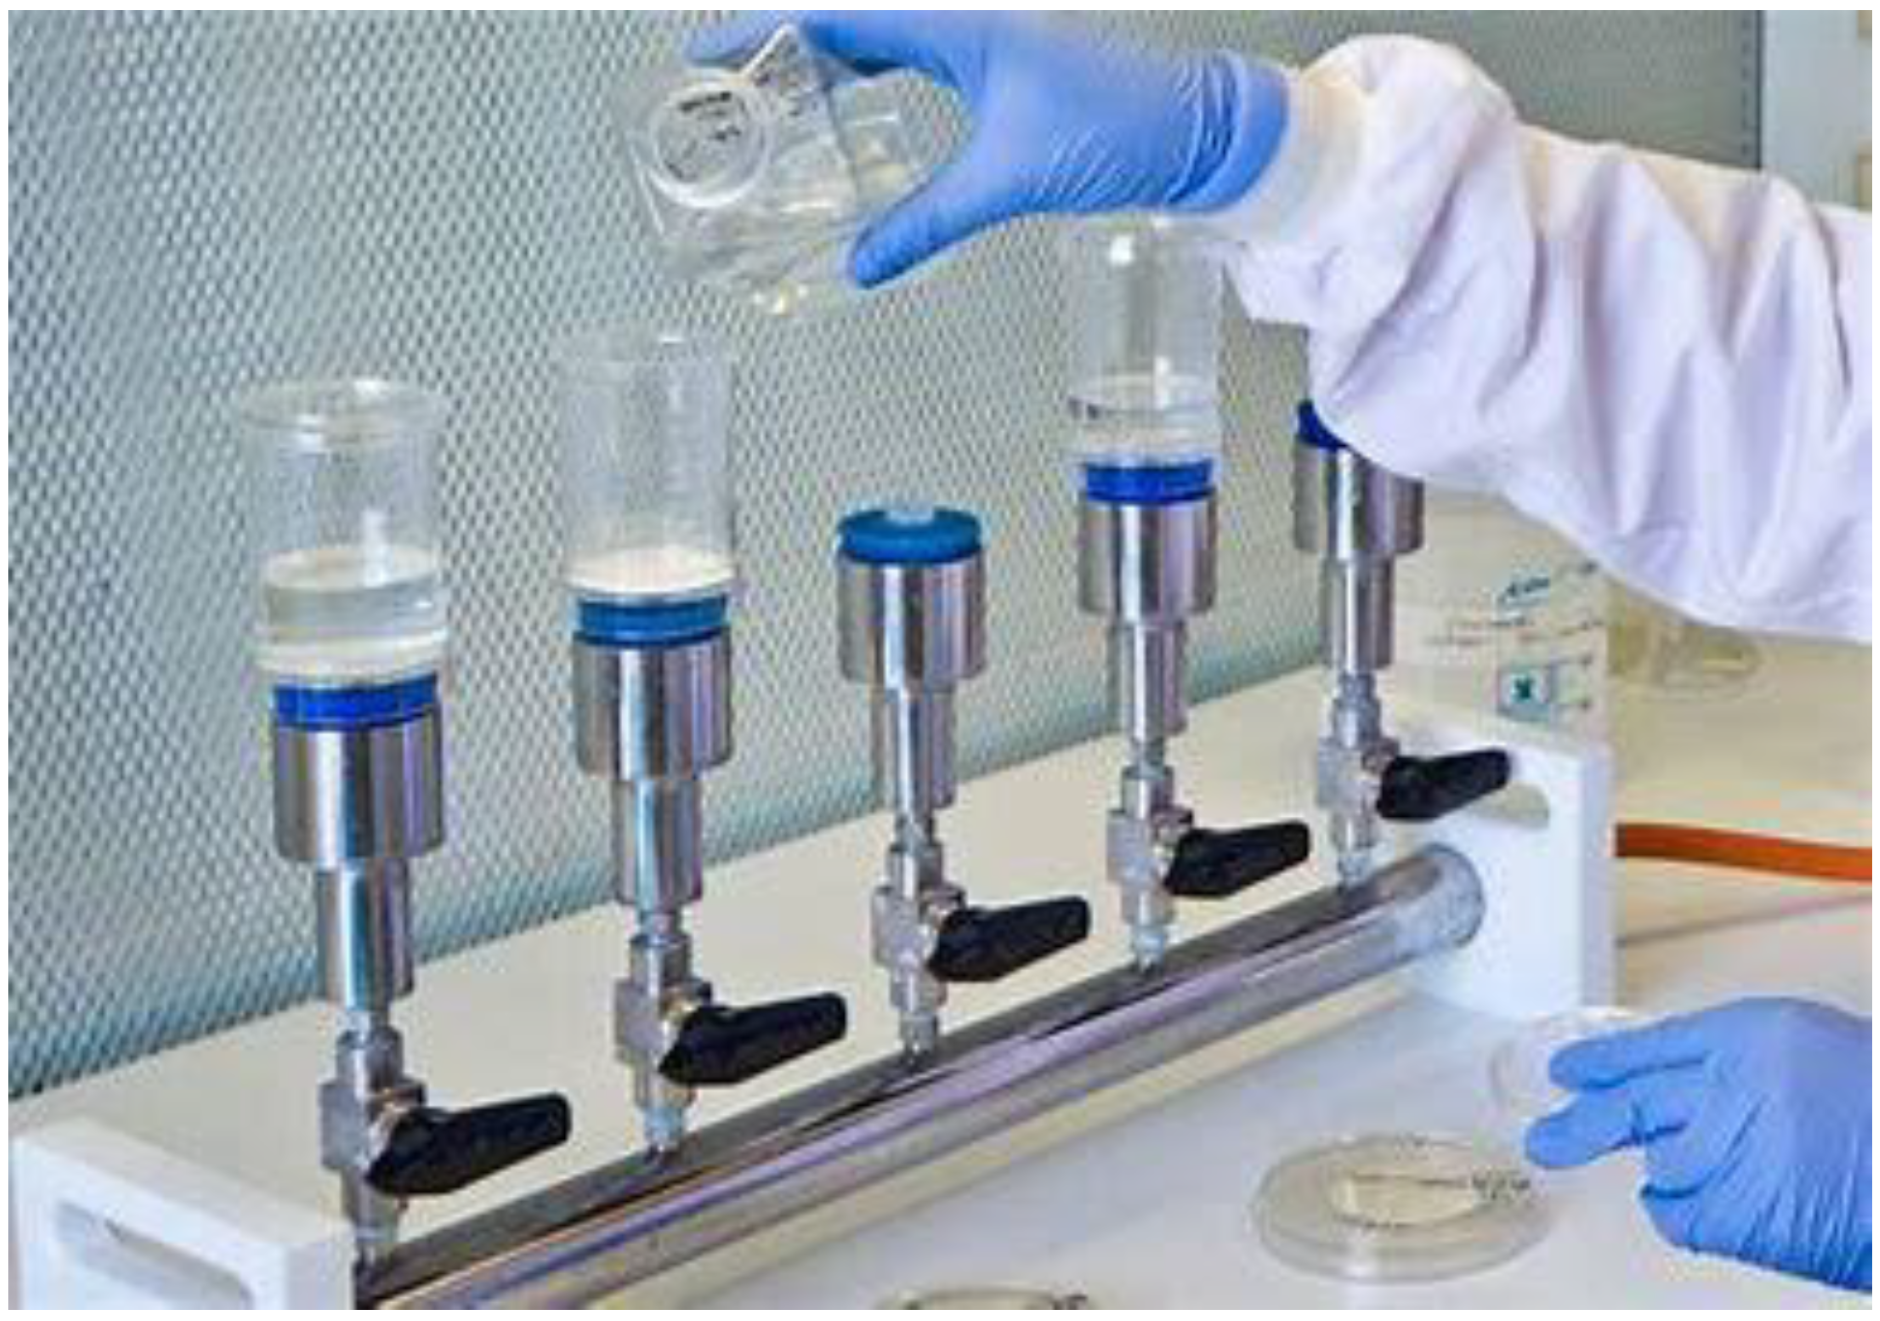
2.5. Ensuring Reliability of Laboratory Testing Equipment for Water Quality Analysis
2.6. Laboratory Examination and Water Quality Analysis
2.7. Physical Examination
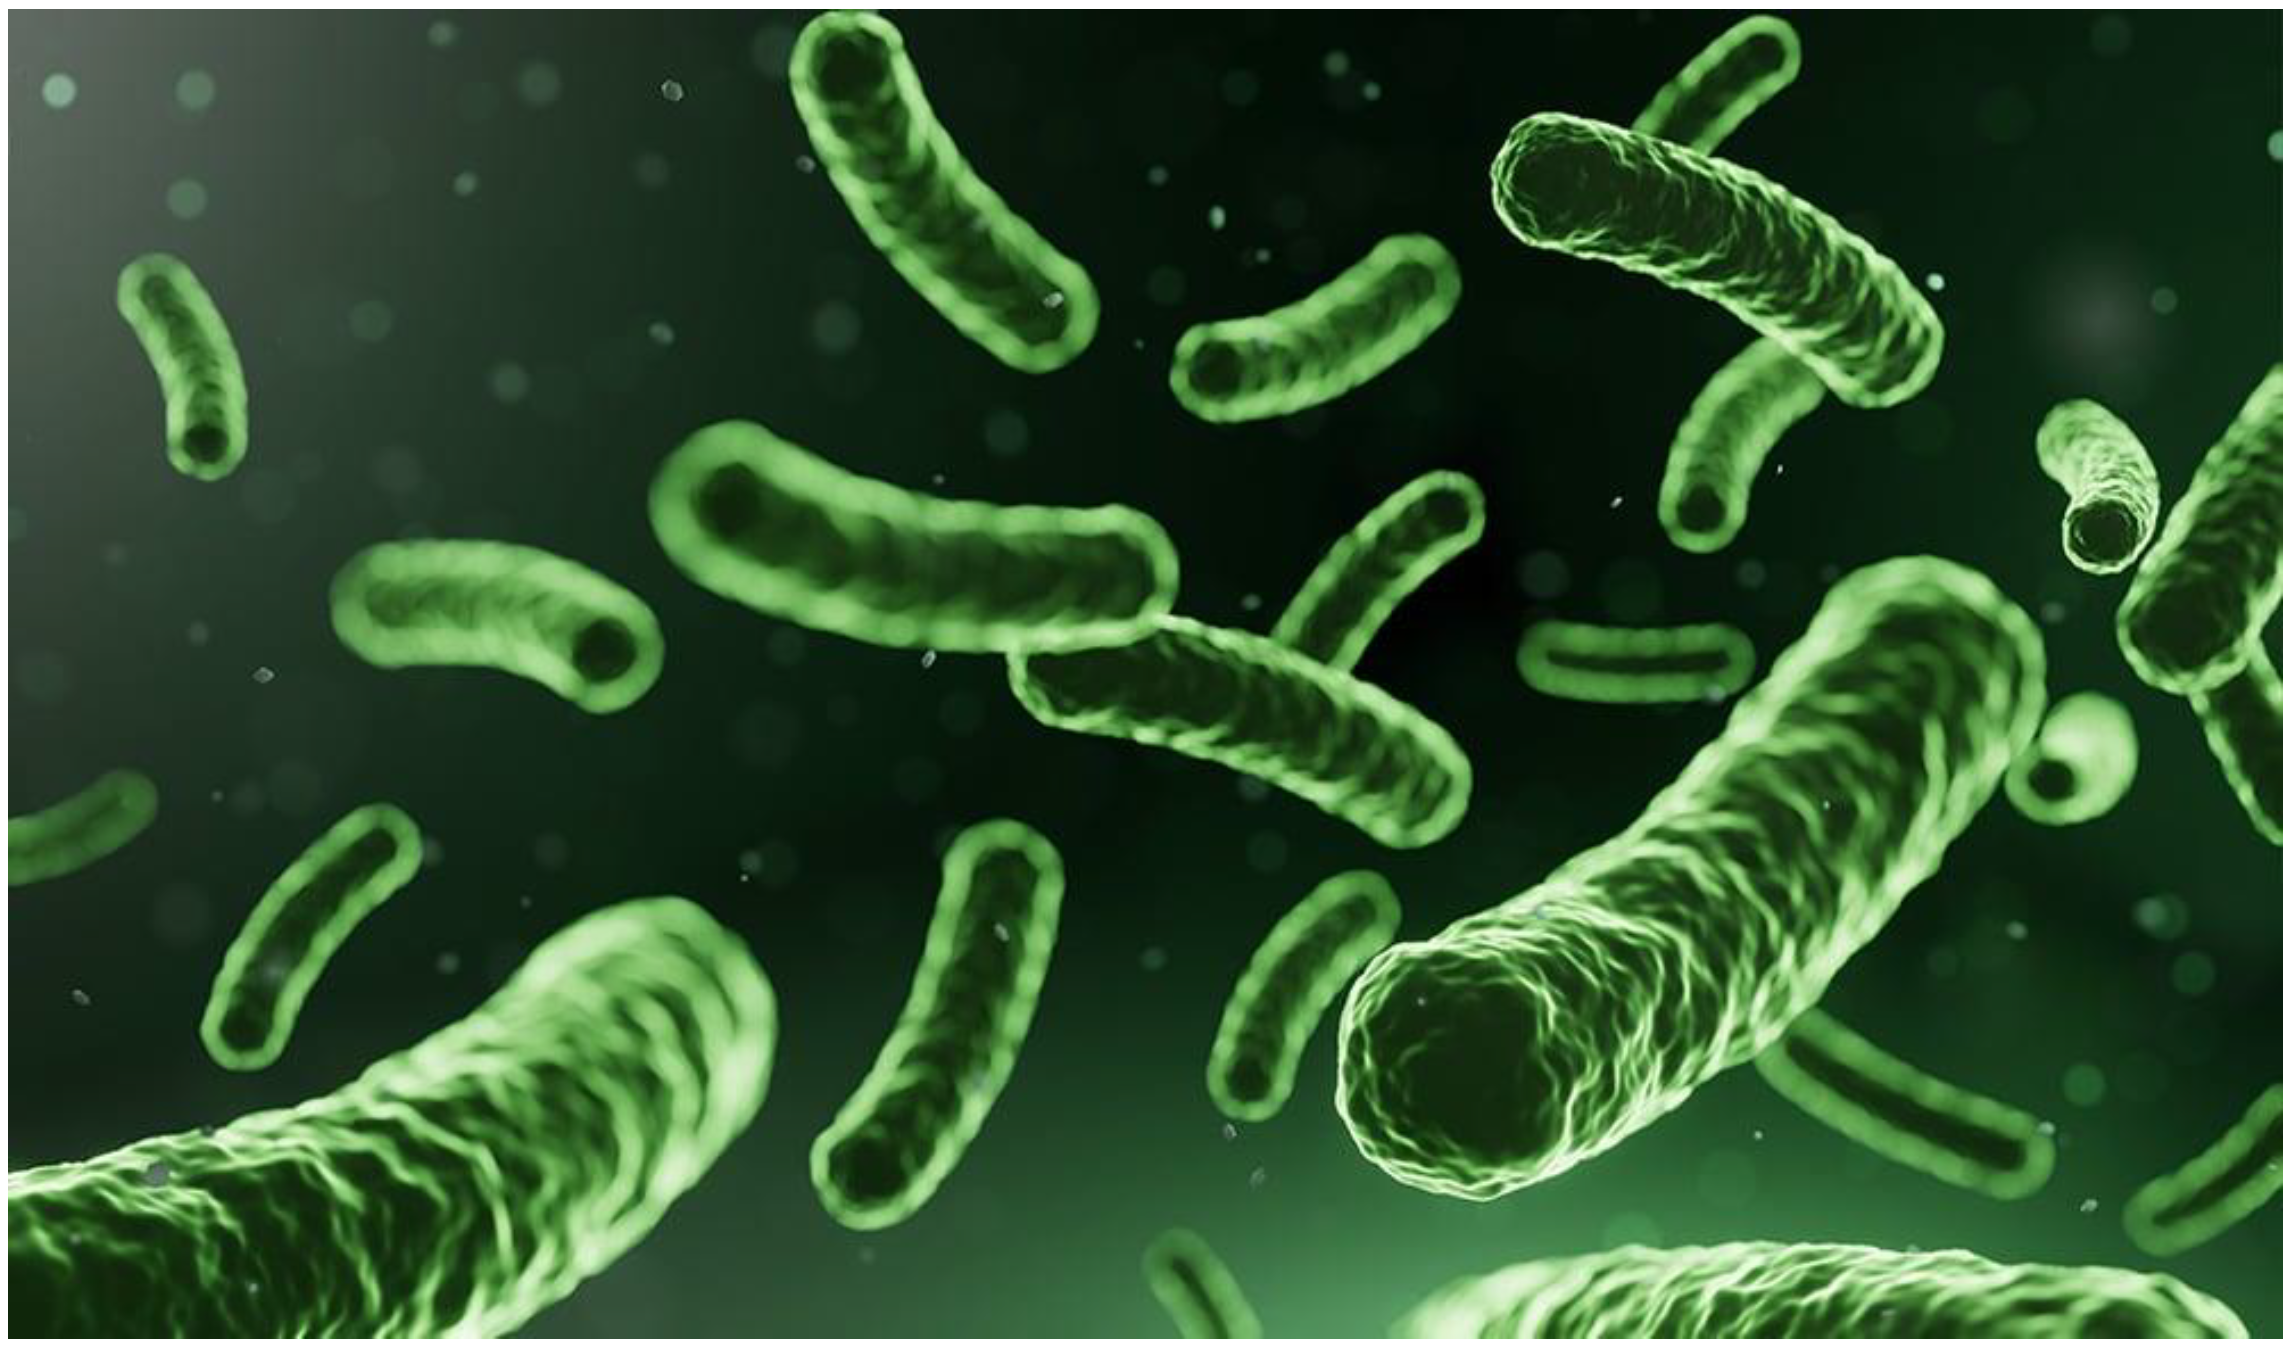
2.8. Microbiological Examination
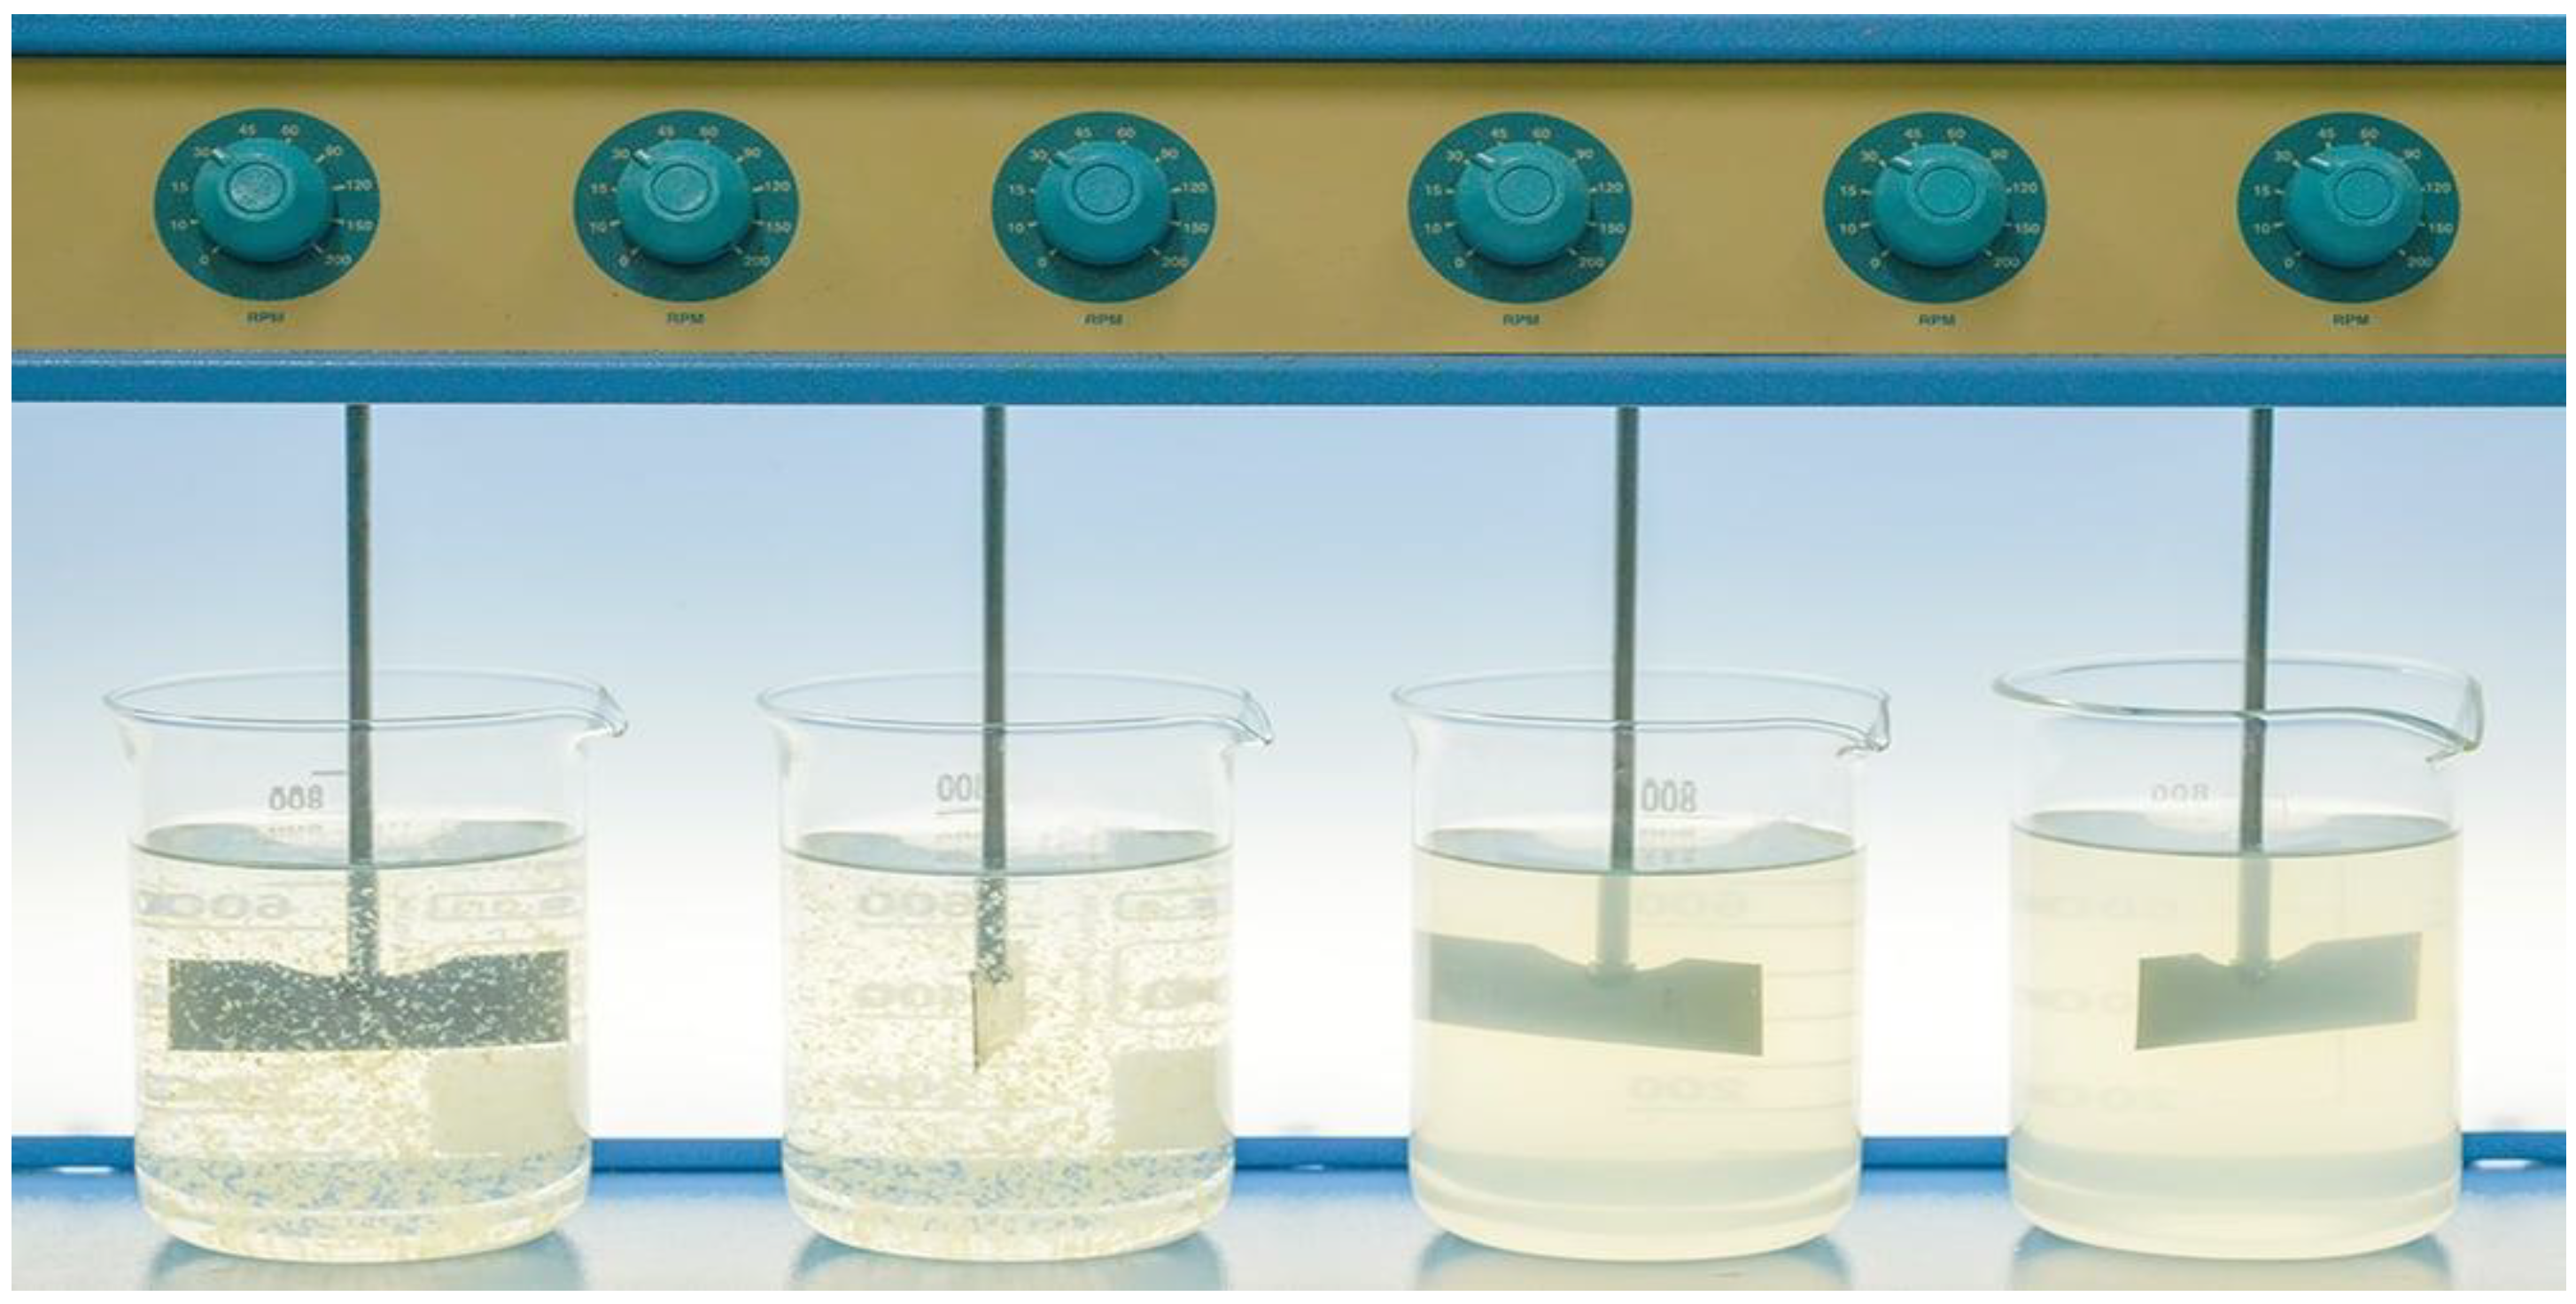
2.9. Chemical Examination
2.10. Supplementary Factors Considered During Investigation
3. Results and Discussion
3.1. Zone 1 (Eastern Zone)
3.2. Zone 2 (Central)
3.3. Zone 3 (Western)
3.4. Zone 4 (Coastal)
3.5. Zone 5 (Quetta)
3.6. Sources of Water Contamination in Baluchistan
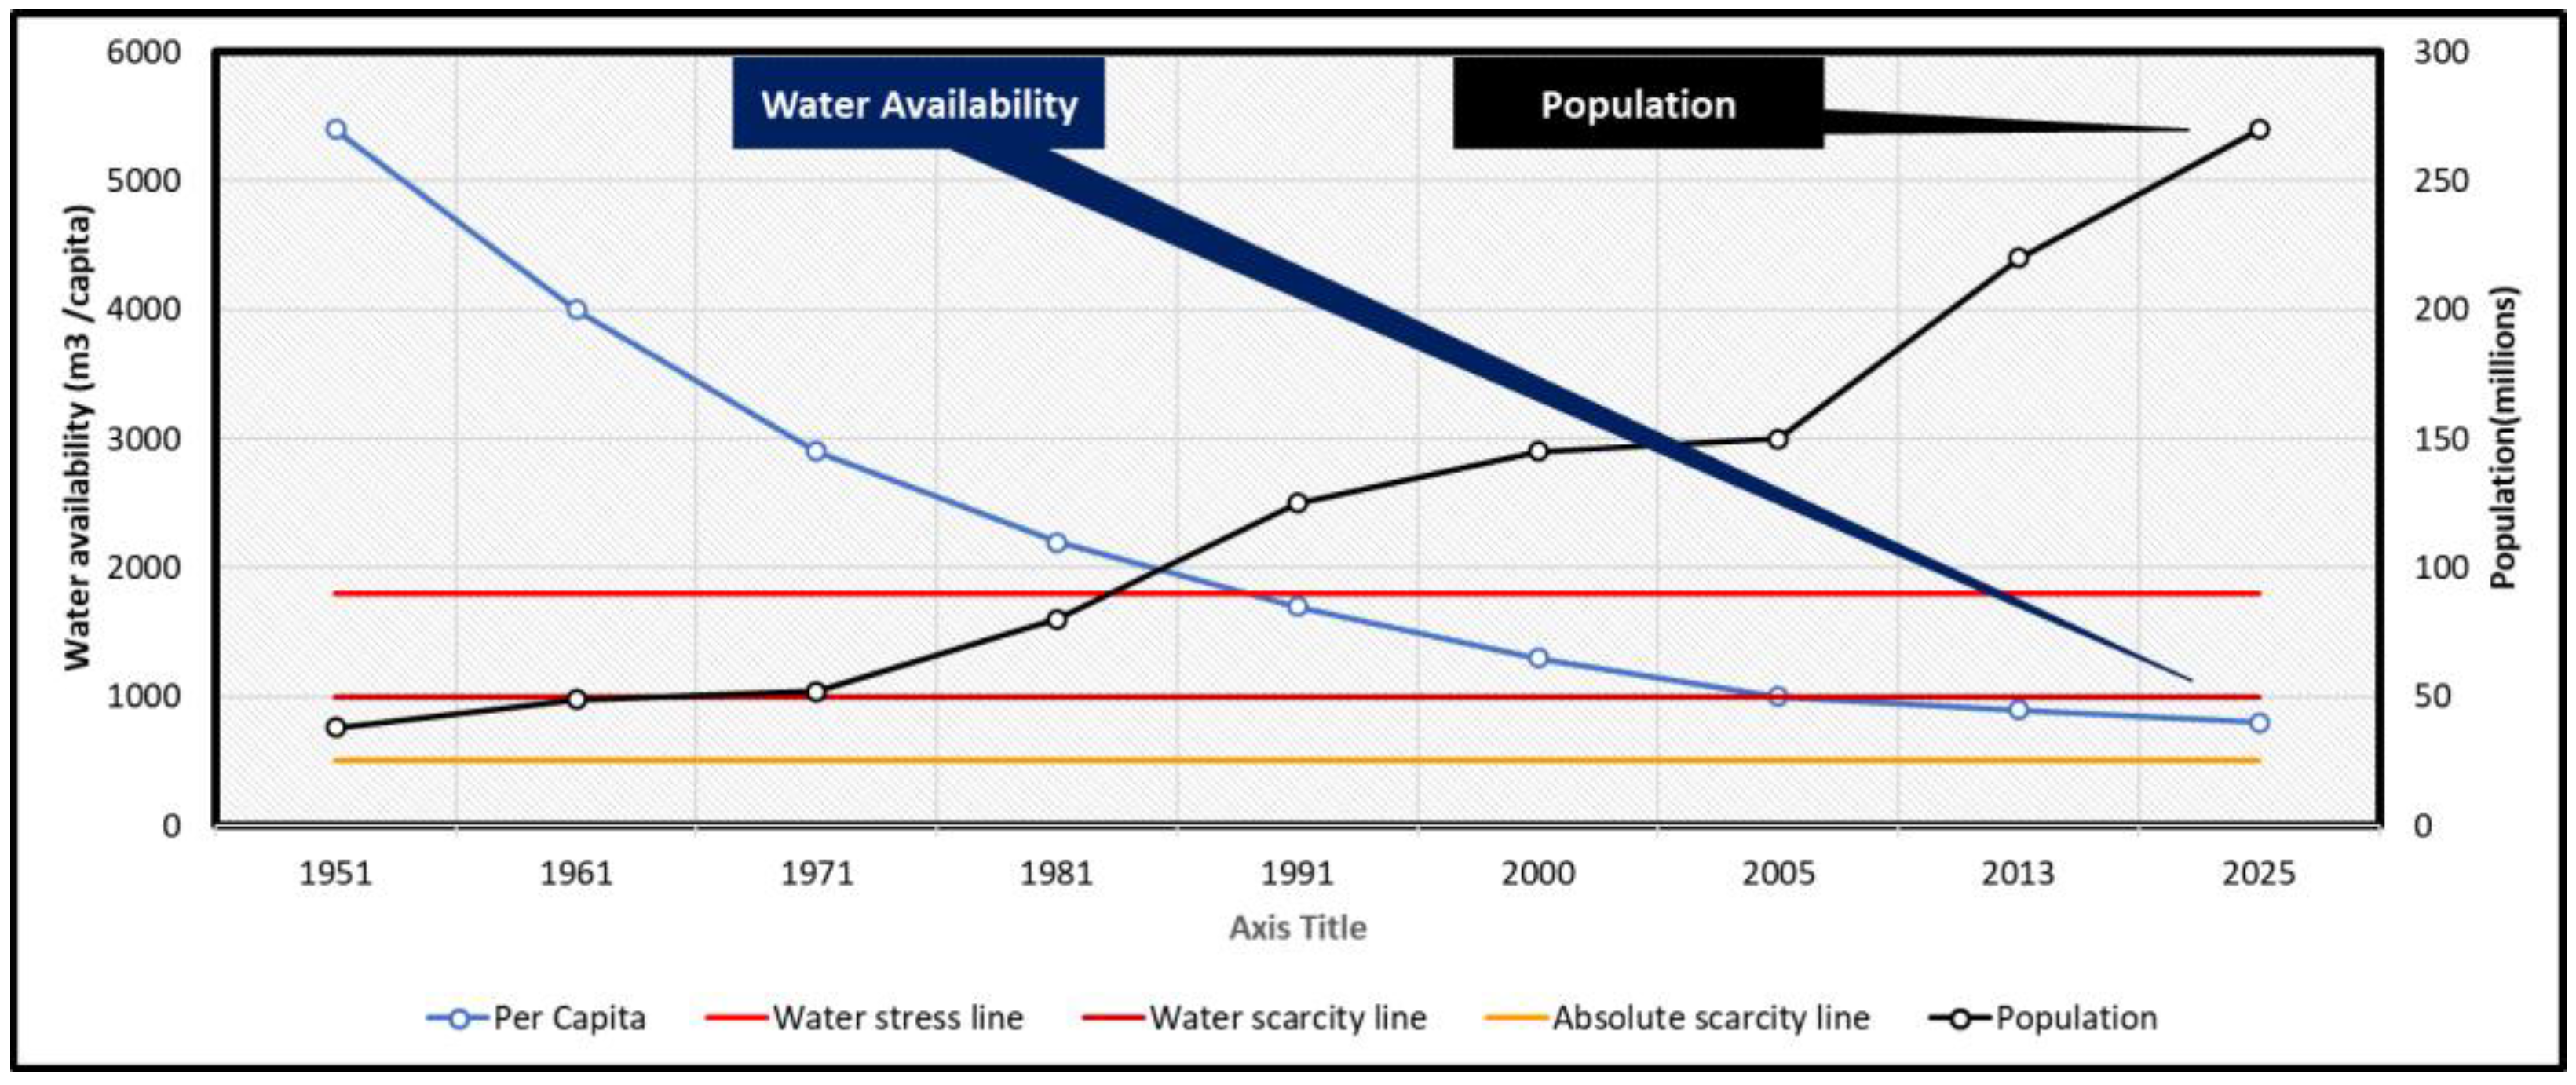
3.7. Water Scarcity in Baluchistan
3.8. Water Quality Monitoring and Testing Mechanism in Pakistan and Baluchistan
4. Recommendations for Ensuring Water Security in Baluchistan
4.1. Water Management, Conservation and Distribution
4.2. Water Quality Monitoring Mechanism
4.3. Recycling of Wastewater
4.4. Continuous Research and Development (R&D)
5. Conclusions
Author Contributions
Funding
Institutional Review Board Statement
Informed Consent Statement
Data Availability Statement
Conflicts of Interest
References
- Sustainable Development Goals (SDG 6) United Nations Western Europe. Available online: https://unric.org/en/sdg-6/ (accessed on 18 February 2025).
- World Bank. The World Bank Data; World Bank: Washington, DC, USA, 2019; Available online: https://data.worldbank.org/ (accessed on 24 January 2018).
- UN Habitat. Pakistan Country Report. 2023. UN-Habitat. Available online: https://unhabitat.org/sites/default/files/2023/06/4._pakistan_country_report_2023_b5_final_compressed.pdf (accessed on 31 December 2023).
- Daud, M.K.; Nafees, M.; Ali, S.; Rizwan, M.; Bajwa, R.A.; Shakoor, M.B.; Arshad, M.U.; Chatha, S.A.S.; Deeba, F.; Murad, W.; et al. Drinking Water Quality Status and Contamination in Pakistan. BioMed Res. Int. 2017, 1, 7908183. [Google Scholar] [CrossRef] [PubMed]
- Azizullah, A.; Khattak, M.N.K.; Richter, P.; Häder, D.-P. Water pollution in Pakistan and its impact on public health—A review. Environ. Int. 2011, 37, 479–497. [Google Scholar] [CrossRef] [PubMed]
- Raza, M.; Hussain, F.; Lee, J.-Y.; Shakoor, M.B.; Kwon, K.D. Groundwater status in Pakistan: A review of contamination, health risks, and potential needs. Crit. Rev. Environ. Sci. Technol. 2017, 47, 1713–1762. [Google Scholar] [CrossRef]
- Ishaque, W.; Tanvir, R.; Mukhtar, M. Climate Change and Water Crises in Pakistan: Implications on Water Quality and Health Risks. J. Environ. Public Health 2022, 2022, 5484561. [Google Scholar] [CrossRef] [PubMed]
- Ishaque, W.; Mukhtar, M.; Tanvir, R. Pakistan’s water resource management: Ensuring water security for sustainable development. Front. Environ. Sci. 2023, 11, 1096747. [Google Scholar] [CrossRef]
- Ishaque, W.; Sultan, K.; Rehman, Z.U. Water management and sustainable development in Pakistan: Environmental and health impacts of water quality on achieving the UNSDGs by 2030. Front. Water 2024, 6, 1267164. [Google Scholar] [CrossRef]
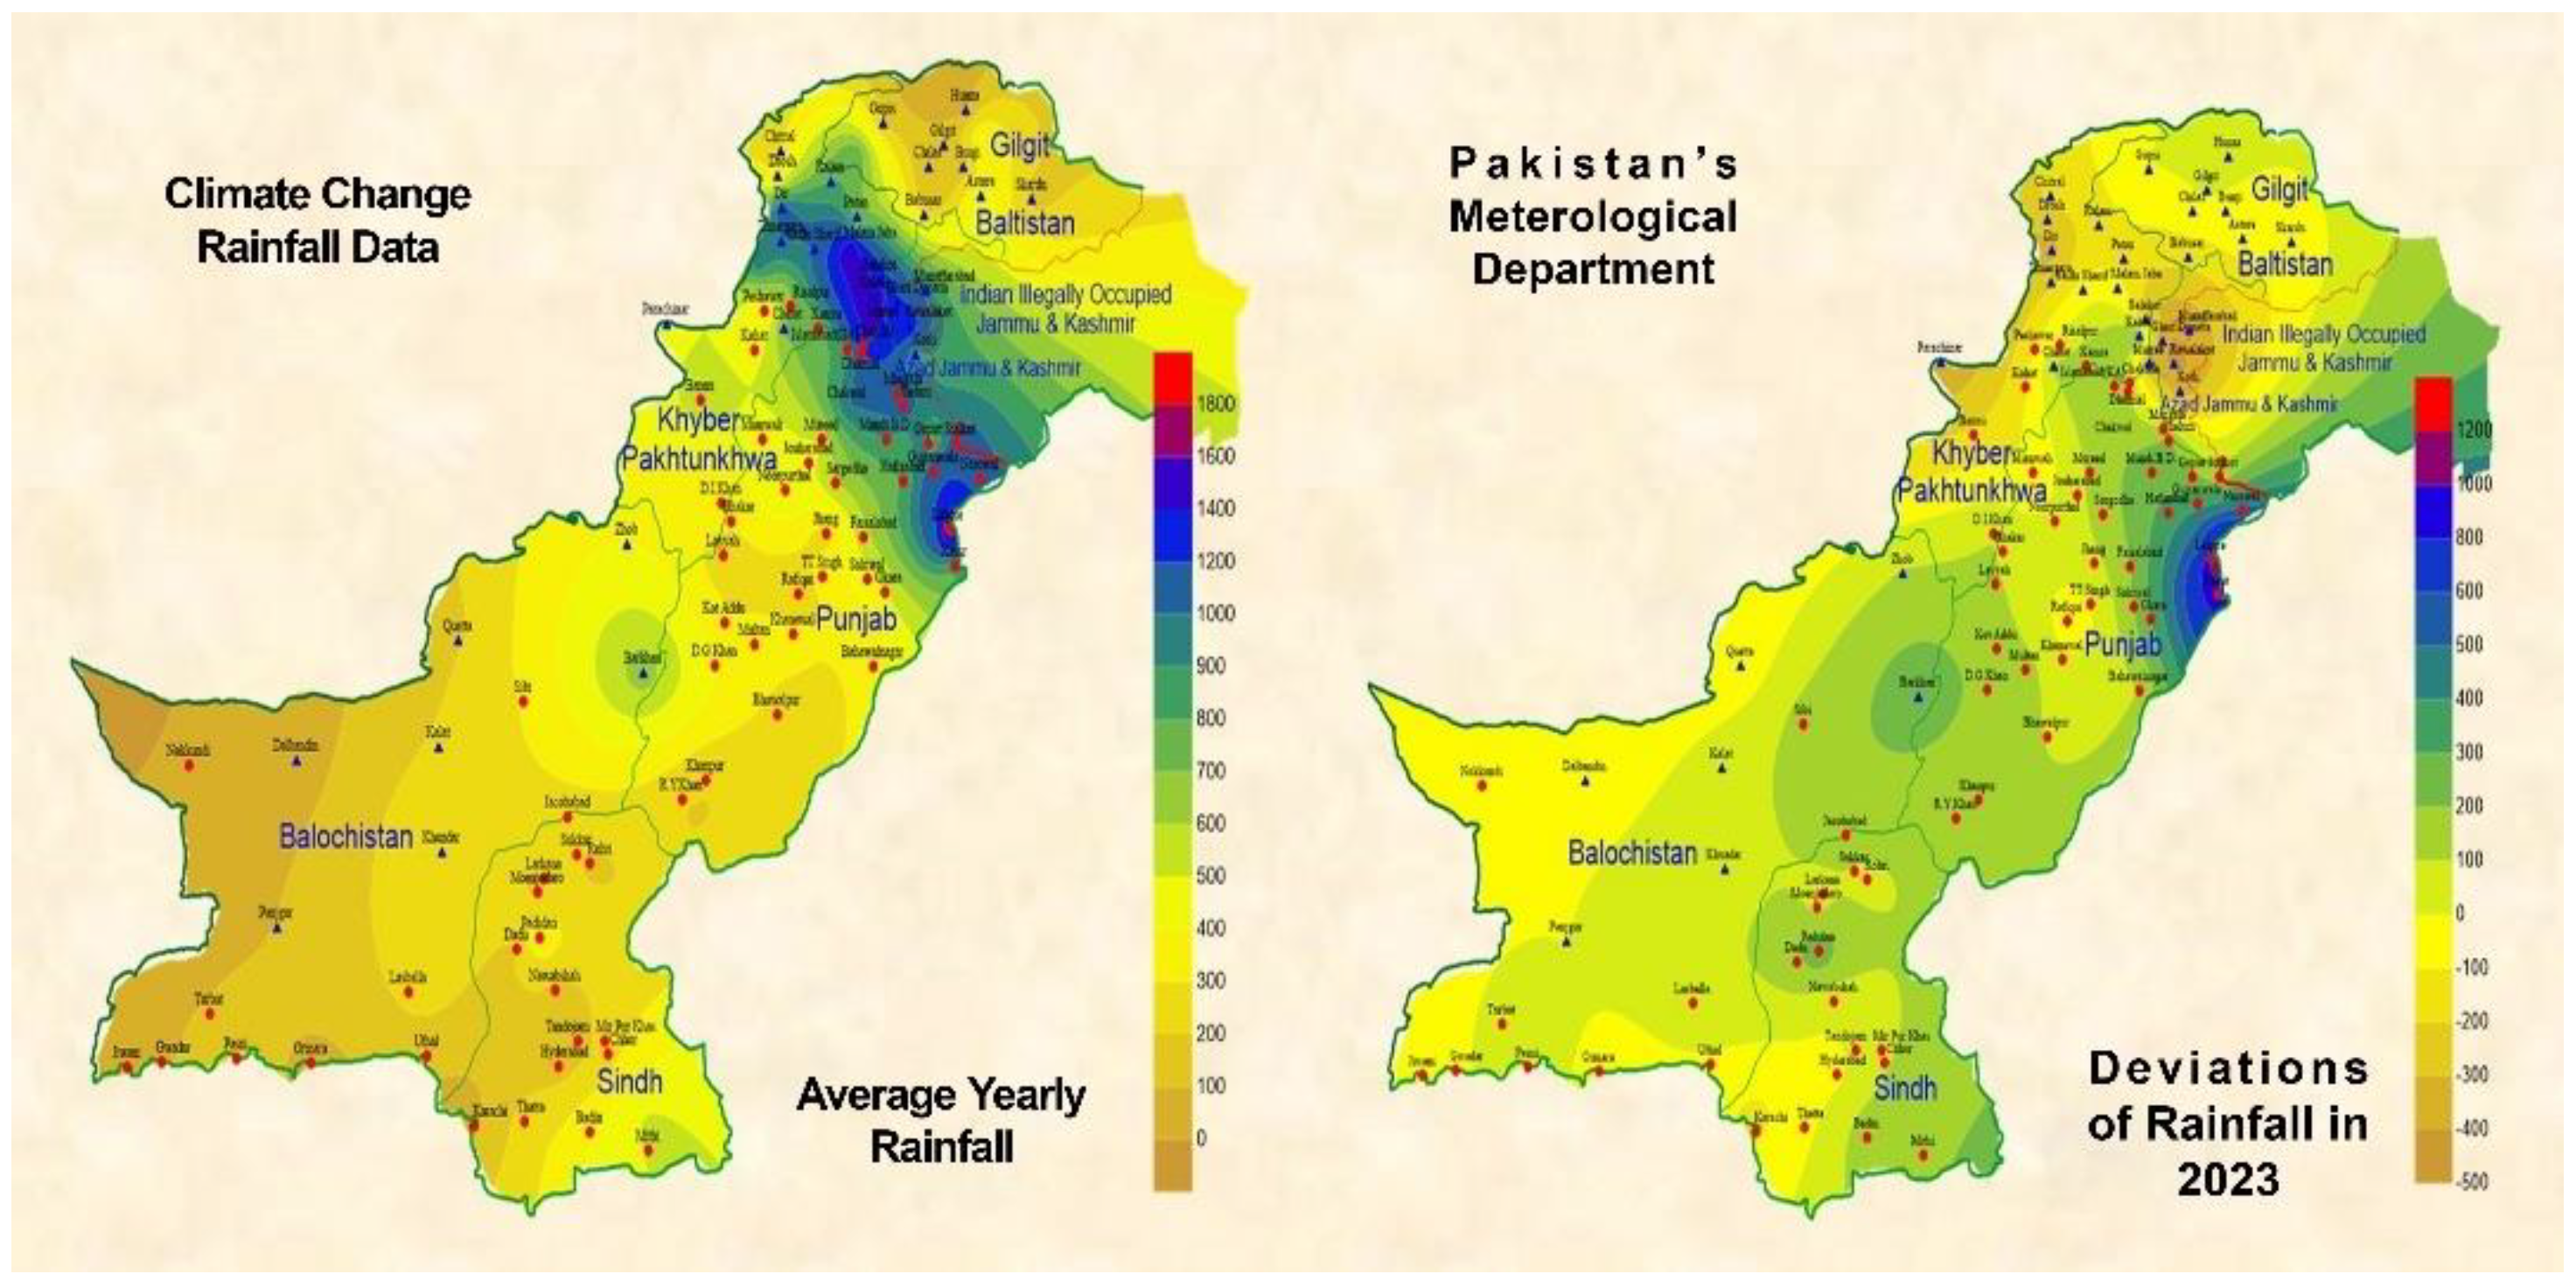
- Climate Data Processing Centre, PMD, Pakistan. Available online: https://cdpc.pmd.gov.pk/ (accessed on 18 February 2025).
- Oksana, T.; Dmytro, G. Earth’s Water Distribution. In Clean Water and Sanitation; Springer: Berlin/Heidelberg, Germany, 2021; pp. 1–14. [Google Scholar]
- Mishra, R.K. Fresh Water Availability and Its Global Challenge. Br. J. Multidiscip. Adv. Stud. 2023, 4, 1–78. [Google Scholar] [CrossRef]
- Bashir, S.; Aslam, Z.; Niazi, N.K.; Khan, M.I.; Chen, Z. Impacts of Water Quality on Human Health in Pakistan. In Water Resources of Pakistan: Issues and Impacts; Watto, M.A., Mitchell, M., Bashir, S., Eds.; Springer International Publishing: Berlin/Heidelberg, Germany, 2021; pp. 225–247. [Google Scholar] [CrossRef]
- Fida, M.; Li, P.; Wang, Y.; Alam, S.M.K.; Nsabimana, A. Water Contamination and Human Health Risks in Pakistan: A Review. Expo. Health 2023, 15, 619–639. [Google Scholar] [CrossRef]
- Watto, M.A.; Mitchell, M.; Akhtar, T. Pakistan’s Water Resources: Overview and Challenges. In Water Resources of Pakistan: Issues and Impacts; Springer International Publishing: Berlin/Heidelberg, Germany, 2021; pp. 1–12. [Google Scholar]
- Pakistan Environmental Protection Agency. Available online: https://environment.gov.pk/Detail/MDUzMDI1OGItYWYzZC00NzQ0LTlhZWItZjYzY2RkOTkyZGVh (accessed on 18 February 2025).
- Guidelines for Drinking-Water Quality, 4th Edition, Incorporating the 1st Addendum. Available online: https://www.who.int/publications/i/item/9789241549950 (accessed on 18 February 2025).
- Ishaque, W.; Ahmed, S.M.; Hussain, I.S. Influence of Climate Change on Pakistan’s National Security. Grassroots 2015, 49, 65. [Google Scholar]
- Hussain, M.; Butt, A.R.; Uzma, F.; Ahmed, R.; Irshad, S.; Rehman, A.; Yousaf, B. A comprehensive review of climate change impacts, adaptation, and mitigation on environmental and natural calamities in Pakistan. Environ. Monit. Assess. 2019, 192, 48. [Google Scholar] [CrossRef] [PubMed]
- Fahad, S.; Wang, J. Climate change, vulnerability, and its impacts in rural Pakistan: A review. Environ. Sci. Pollut. Res. 2019, 27, 1334–1338. [Google Scholar] [CrossRef] [PubMed]
- Khan, M.A.; Khan, J.A.; Ali, Z.; Ahmad, I.; Ahmad, M.N. The challenge of climate change and policy response in Pakistan. Environ. Earth Sci. 2016, 75, 412. [Google Scholar] [CrossRef]
- Ali, S.; Liu, Y.; Ishaq, M.; Shah, T.; Abdullah, S.; Ilyas, A.; Din, I.U. Climate Change and Its Impact on the Yield of Major Food Crops: Evidence from Pakistan. Foods 2017, 6, 39. [Google Scholar] [CrossRef] [PubMed]
- Malik, S.M.; Awan, H.; Khan, N. Mapping vulnerability to climate change and its repercussions on human health in Pakistan. Glob. Health 2012, 8, 31. [Google Scholar] [CrossRef] [PubMed]
- Ahmed, T.; Scholz, M.; Al-Faraj, F.; Niaz, W. Water-Related Impacts of Climate Change on Agriculture and Subsequently on Public Health: A Review for Generalists with Particular Reference to Pakistan. Int. J. Environ. Res. Public Health 2016, 13, 1051. [Google Scholar] [CrossRef] [PubMed]
- Khan, M.A.; Tahir, A.; Khurshid, N.; Husnain, M.I.U.; Ahmed, M.; Boughanmi, H. Economic Effects of Climate Change-Induced Loss of Agricultural Production by 2050: A Case Study of Pakistan. Sustainability 2020, 12, 1216. [Google Scholar] [CrossRef]
- Saeed, A.; Ali, S.; Khan, F.; Muhammad, S.; Reboita, M.S.; Khan, A.W.; Goheer, M.A.; Khan, M.A.; Kumar, R.; Ikram, A.; et al. Modelling the impact of climate change on dengue outbreaks and future spatiotemporal shift in Pakistan. Environ. Geochem. Health 2022, 45, 3489–3505. [Google Scholar] [CrossRef] [PubMed]
- Aslam, M.N.; Ashraf, S.; Shrestha, S.; Ali, M.; Hanh, N.C. Climate change impact on water scarcity in the Hub River Basin, Pakistan. Groundw. Sustain. Dev. 2024, 27, 101339. [Google Scholar] [CrossRef]
- Baocheng, H.; Jamil, A.; Bellaoulah, M.; Mukhtar, A.; Clauvis, N.K. Impact of climate change on water scarcity in Pakistan. Implications for water management and policy. J. Water Clim. Change 2024, 15, 3602–3623. [Google Scholar] [CrossRef]
- Khan, K.A. Water Scarcity and Its Impact on the Agricultural Sector of Balochistan. J. Public Policy Pract. 2022, 1, 1–66. [Google Scholar] [CrossRef]
- Hogan, R. Proficiency Testing and Interlaboratory Comparisons: The Ultimate Guide, Isobudgets, 11 January 2019. Available online: https://www.isobudgets.com/proficiency-testing-and-interlaboratory-comparisons/ (accessed on 18 February 2025).
- OW US EPA, Certification of Laboratories That Analyze Drinking Water Samples to Ensure Compliance with Regulations Collections and Lists, 3 August 2015. Available online: https://www.epa.gov/dwlabcert (accessed on 18 February 2025).
- A Complete Guide to Water Analysis Methods in Industries, Atlas Scientific, 3 November 2023. Available online: https://atlas-scientific.com/blog/water-analysis-methods/ (accessed on 18 February 2025).
- Dil, A.S.; Qzai, I.A.; Baig, M.A.; Khan, E.A.; Tahir, A. National Standards forDrinking Water Quality (NSDWG). (Islamabad: Ministry of Environmental Protection Government of Pakistan, 30 June 2008). Available online: https://www.mocc.gov.pk/SiteImage/Misc/files/Drinking%20Water%20Quality%20Standares%20MAY%202007.pdf (accessed on 18 February 2025).
- Pakistan Council for Research in Water Resources (PCWR). 19 2025. Available online: https://www.pcrwr.gov.pk/water-quality/ (accessed on 25 December 2024).
- Islam, S. Water Availability Has Dropped 500% Since 1947. The Express Tribune. Islamabad, Pakistan. 20 June 2011. Available online: https://tribune.com.pk/story/193120/water-availability-has-dropped-500-since-194 (accessed on 1 January 2025).


| Types of Samples | Sample Sites | Container Types | Objectives | Preservatives Details |
|---|---|---|---|---|
| Type- 1 | All | Bottles over 150 mL sterilized | Assessment of microbiological constituents | Pre-sterilized |
| Type- 2 | “ | Polystyrene bottle of 0.5 L | Establishing trace elements | Nitric acid 1.5 to 2 milliliters per liter of sample (HNO3) |
| Type- 3 | “ | Polystyrene bottle of 0.5 L | Discovering nitrate presence | 1 mL of boric acid in a 100 mL sample |
| Type- 4 | “ | Polystyrene bottle of 1 L | Presence of other chemicals | Without any additives |
| Serial | Place | Code | Grid Size km2 | Points for Sampling | Remarks |
|---|---|---|---|---|---|
| Zone 1 (Loralai) | |||||
| 1 | Zhob | ZHB | 4 | 24 | |
| 2 | Loralai | LLI | 4 | 24 | |
| 3 | Barkhan | BKN | 2 | 16 | |
| 4 | Kohlu | KHL | 3 | 20 | |
| Zone 2 (Sibi) | |||||
| 5 | Sibi | SBI | 4 | 24 | |
| 6 | Nushki | NKI | 3 | 20 | |
| 7 | Kalat | KLT | 3 | 20 | |
| 8 | Kharan | KHN | 3 | 20 | |
| 9 | Khuzdar | KZR | 4 | 24 | |
| Zone 3 (Turbat) | |||||
| 10 | Dalbandin | DBN | 3 | 20 | |
| 11 | Nokkundi | NKD | 3 | 20 | |
| 12 | Panjgur | PJR | 3 | 20 | |
| 13 | Turbat | TRT | 3 | 20 | |
| Zone 4 (Coastal) | |||||
| 14 | Jiwani | JWN | 3 | 20 | |
| 15 | Gwadar | GDR | 3 | 20 | |
| 16 | Pasni | PNI | 3 | 20 | |
| 17 | Ormara | OMR | 3 | 20 | |
| Zone 5 (Quetta) | |||||
| 18 | Quetta | QTA | 6 | 34 | |
| Serial | Places | Supervised Sources | Number of Sample Sites |
|---|---|---|---|
| 1 | Zone 1 | Filtration Plants (10), Tube Wells (21), Tabs (27), Hand Pumps (35), Water Supply (10), Streams (18) | 121 |
| 2 | Zone 2 | Filtration Plants (8), Tube Wells (27), Tabs (8), Hand Pumps (30), Streams (13) | 86 |
| 3 | Zone 3 | Filtration Plants (5), Tube Wells (30), Tabs (8), Hand Pumps (27), Water Supply (13) | 83 |
| 4 | Zone 4 | Filtration Plants (10), Tube Wells (35), Tabs (10), Hand Pumps (33), Water Supply (15) | 103 |
| 5 | Zone 5 | Filtration Plants (47), Tube Wells (23), Tabs (59), Hand Pumps (29), Water Supply (33), Streams (15) | 206 |
| Serial | Standard Parameters | Method of Analysis |
|---|---|---|
| 1 | Phosphate (mg/L) | 8190 and 8048 Colorimeters (HACH) |
| 2 | Alkalinity (mg/L as CaCO3) | 2320, Standard method 2017 |
| 3 | Fluoride (mg/L) | 4500-FC.ion-Selective Electrode Method Standard 2017 |
| 4 | Chloride (mg/L) | Titration (Silver Nitrate), Standard Method 2017 |
| 5 | Nitrate as Nitrogen (mg/L) | Cd. Reduction (Hach-8171) by Spectrophotometer |
| 6 | Potassium (mg/L) | Flame photometer PFP7, UK |
| 7 | Total Coliforms | 9221-B, C&D, Standard Methods 2017 APHA |
| 8 | Turbidity (NTU) | Turbidity Meter, Lamotte, Model 2008, USA |
| 9 | Calcium (mg/L) | 3500-Ca-D, Standard Method 2017 |
| 10 | TDS (mg/L) | 2540C, Standard method 2017 |
| 11 | E. coli | 9221-B, C&D, Standard Methods 2017 APHA |
| 12 | Hardness (mg/L) | EDTA Titration, Standard Method 2017 |
| 13 | Magnesium (mg/L) | 2340-C, Standard Method 2017 |
| 14 | pH | pH Meter, Hanna Instrument, Model 8519, Italy |
| 15 | Bicarbonate (mg/L) | 2320, Standard method 2017 |
| 16 | Carbonate (mg/L) | 2320, Standard method 2017 |
| 17 | Sodium (mg/L) | Flame photometer PFP7, UK |
| 18 | Arsenic (ppb) | AAS Vario 6, Analytik Jena AG (3111B APHA) 2017, Germany |
| 19 | Conductivity (μS/cm) | E.C meter, Hach-44600-00, USA |
| 20 | Sulphate (mg/L) | SulfaVer4 (Hach-8051) by Spectrophotometer, USA |
| Serial | Parameters | Units | Limits |
|---|---|---|---|
| 1 | Sodium | mg/L | NGVS |
| 2 | TDS | mg/L | 1000 |
| 3 | Calcium | mg/L | NGVS |
| 4 | E. coli | CFU/100 mL | 0 |
| 5 | Magnesium | mg/L | NGVS |
| 6 | Sulphate | mg/L | NGVS |
| 7 | Potassium | mg/L | NGVS |
| 8 | Bicarbonate | mg/L | NGVS |
| 9 | Chloride | mg/L | 250 |
| 10 | pH | - | 6.51–8.51 |
| 11 | Arsenic | µg/L | 51 |
| 12 | Nitrate-N | mg/L | 10.05 |
| 13 | Fluoride | mg/L | 1.53 |
| 14 | Alkalinity | mg/L | NGVS |
| 15 | Hardness | mg/L | 500 |
| 16 | Carbonate | mg/L | NGVS |
| 17 | Turbidity | NTU | <5 |
| 18 | Conductivity | µS/cm | NGVS |
| 19 | Total coliforms | CFU/100 mL | 0 |
| 20 | Color | TCU | Colorless |
| 21 | Iron | mg/L | 0.31 |
| Serial | Score | Risk Assessment | Type of Contamination |
|---|---|---|---|
| 1 | 0 | Slightly Safe | Dissolved solids, coliforms, fluoride, and nitrate levels are within permissible limits. |
| 2 | 1 | Low | Exclusively bacterial contamination (total coliforms and faecal coliforms) |
| 3 | 2 | Low | Only dissolved solids |
| 4 | 4 | Medium | Contamination of single microbiological and chemical content |
| 5 | 3 | Medium | Single chemical contamination |
| 6 | 5 | High | Double chemical contamination |
| 7 | 6 | High | Numerous chemicals and microbial contamination |
| Ser | Risk Type | Range |
|---|---|---|
| 1 | Low | 1–2 |
| 2 | Medium | 3–4 |
| 3 | High | 5–6 |
| Serial | Parameter for Water Quality | Measurement Unit | Tested Samples | Samples Found Contaminated | Percentage of Contamination |
|---|---|---|---|---|---|
| 1 | Arsenic (As) | µg/L | 121 | 46 | 38% |
| 2 | Coliform | MPN/100 mL | 121 | 49 | 40% |
| 3 | TDS | mg/L | 121 | 48 | 39% |
| 4 | E. coli | MPN/100 mL | 121 | 52 | 42% |
| 5 | Iron (Fe) | mg/L | 121 | 49 | 40% |
| 6 | Overall contamination percentage | 40% | |||
| Serial | Parameter for Water Quality | Measurement Unit | Tested Samples | Samples Found Contaminated | Percentage of Contamination |
|---|---|---|---|---|---|
| 1 | Arsenic (As) | µg/L | 86 | 48 | 55% |
| 2 | Coliform | MPN/100 mL | 86 | 51 | 59% |
| 3 | TDS | mg/L | 86 | 46 | 53% |
| 4 | E. coli | MPN/100 mL | 86 | 52 | 60% |
| 5 | Iron (Fe) | mg/L | 86 | 54 | 62% |
| 6 | Overall contamination percentage | 58% | |||
| Serial | Parameter for Water Quality | Measurement Unit | Tested Samples | Samples Found Contaminated | Percentage of Contamination |
|---|---|---|---|---|---|
| 1 | Arsenic (As) | µg/L | 83 | 51 | 61% |
| 2 | Coliform | MPN/100 mL | 83 | 49 | 59% |
| 3 | TDS | mg/L | 83 | 55 | 66% |
| 4 | E. coli | MPN/100 mL | 83 | 48 | 57% |
| 5 | Iron (Fe) | mg/L | 83 | 51 | 61% |
| 6 | Overall contamination percentage | 61% | |||
| Serial | Parameter for Water Quality | Measurement Unit | Tested Samples | Samples Found Contaminated | Percentage of Contamination |
|---|---|---|---|---|---|
| 1 | Arsenic (As) | µg/L | 103 | 52 | 50% |
| 2 | Coliform | MPN/100 mL | 103 | 54 | 52% |
| 3 | TDS | mg/L | 103 | 45 | 43% |
| 4 | E. coli | MPN/100 mL | 103 | 53 | 51% |
| 5 | Iron (Fe) | mg/L | 103 | 55 | 53% |
| 6 | Turbidity | NTU | 103 | 49 | 48% |
| 7 | Overall contamination percentage | 50% | |||
| Serial | Parameter for Water Quality | Measurement Unit | Tested Samples | Samples Found Contaminated | Percentage of Contamination |
|---|---|---|---|---|---|
| 1 | Arsenic (As) | µg/L | 206 | 81 | 39% |
| 2 | Coliform | MPN/100 mL | 206 | 87 | 42% |
| 3 | TDS | mg/L | 206 | 93 | 45% |
| 4 | E. coli | MPN/100 mL | 206 | 91 | 44% |
| 5 | Iron (Fe) | mg/L | 206 | 93 | 45% |
| 6 | Hardness | mg/L | 206 | 23 | 13% |
| 7 | Fluoride (F) | mg/L | 206 | 88 | 42% |
| 8 | Overall contamination percentage | 43% | |||
Disclaimer/Publisher’s Note: The statements, opinions and data contained in all publications are solely those of the individual author(s) and contributor(s) and not of MDPI and/or the editor(s). MDPI and/or the editor(s) disclaim responsibility for any injury to people or property resulting from any ideas, methods, instructions or products referred to in the content. |
© 2025 by the authors. Licensee MDPI, Basel, Switzerland. This article is an open access article distributed under the terms and conditions of the Creative Commons Attribution (CC BY) license (https://creativecommons.org/licenses/by/4.0/).
Share and Cite
Ishaque, W.; Zia ur Rehman, M. Impact of Climate Change on Water Quality and Sustainability in Baluchistan: Pakistan’s Challenges in Meeting United Nations Sustainable Development Goal (UNSDG) Number 6. Sustainability 2025, 17, 2553. https://doi.org/10.3390/su17062553
Ishaque W, Zia ur Rehman M. Impact of Climate Change on Water Quality and Sustainability in Baluchistan: Pakistan’s Challenges in Meeting United Nations Sustainable Development Goal (UNSDG) Number 6. Sustainability. 2025; 17(6):2553. https://doi.org/10.3390/su17062553
Chicago/Turabian StyleIshaque, Waseem, and Muhammad Zia ur Rehman. 2025. "Impact of Climate Change on Water Quality and Sustainability in Baluchistan: Pakistan’s Challenges in Meeting United Nations Sustainable Development Goal (UNSDG) Number 6" Sustainability 17, no. 6: 2553. https://doi.org/10.3390/su17062553
APA StyleIshaque, W., & Zia ur Rehman, M. (2025). Impact of Climate Change on Water Quality and Sustainability in Baluchistan: Pakistan’s Challenges in Meeting United Nations Sustainable Development Goal (UNSDG) Number 6. Sustainability, 17(6), 2553. https://doi.org/10.3390/su17062553