
A Long-Term Perspective of Seasonal Shifts in Nutrient Dynamics and Eutrophication in the Romanian Black Sea Coast


 , ,
, ,  and
and 
Abstract
1. Introduction
2. Materials and Methods
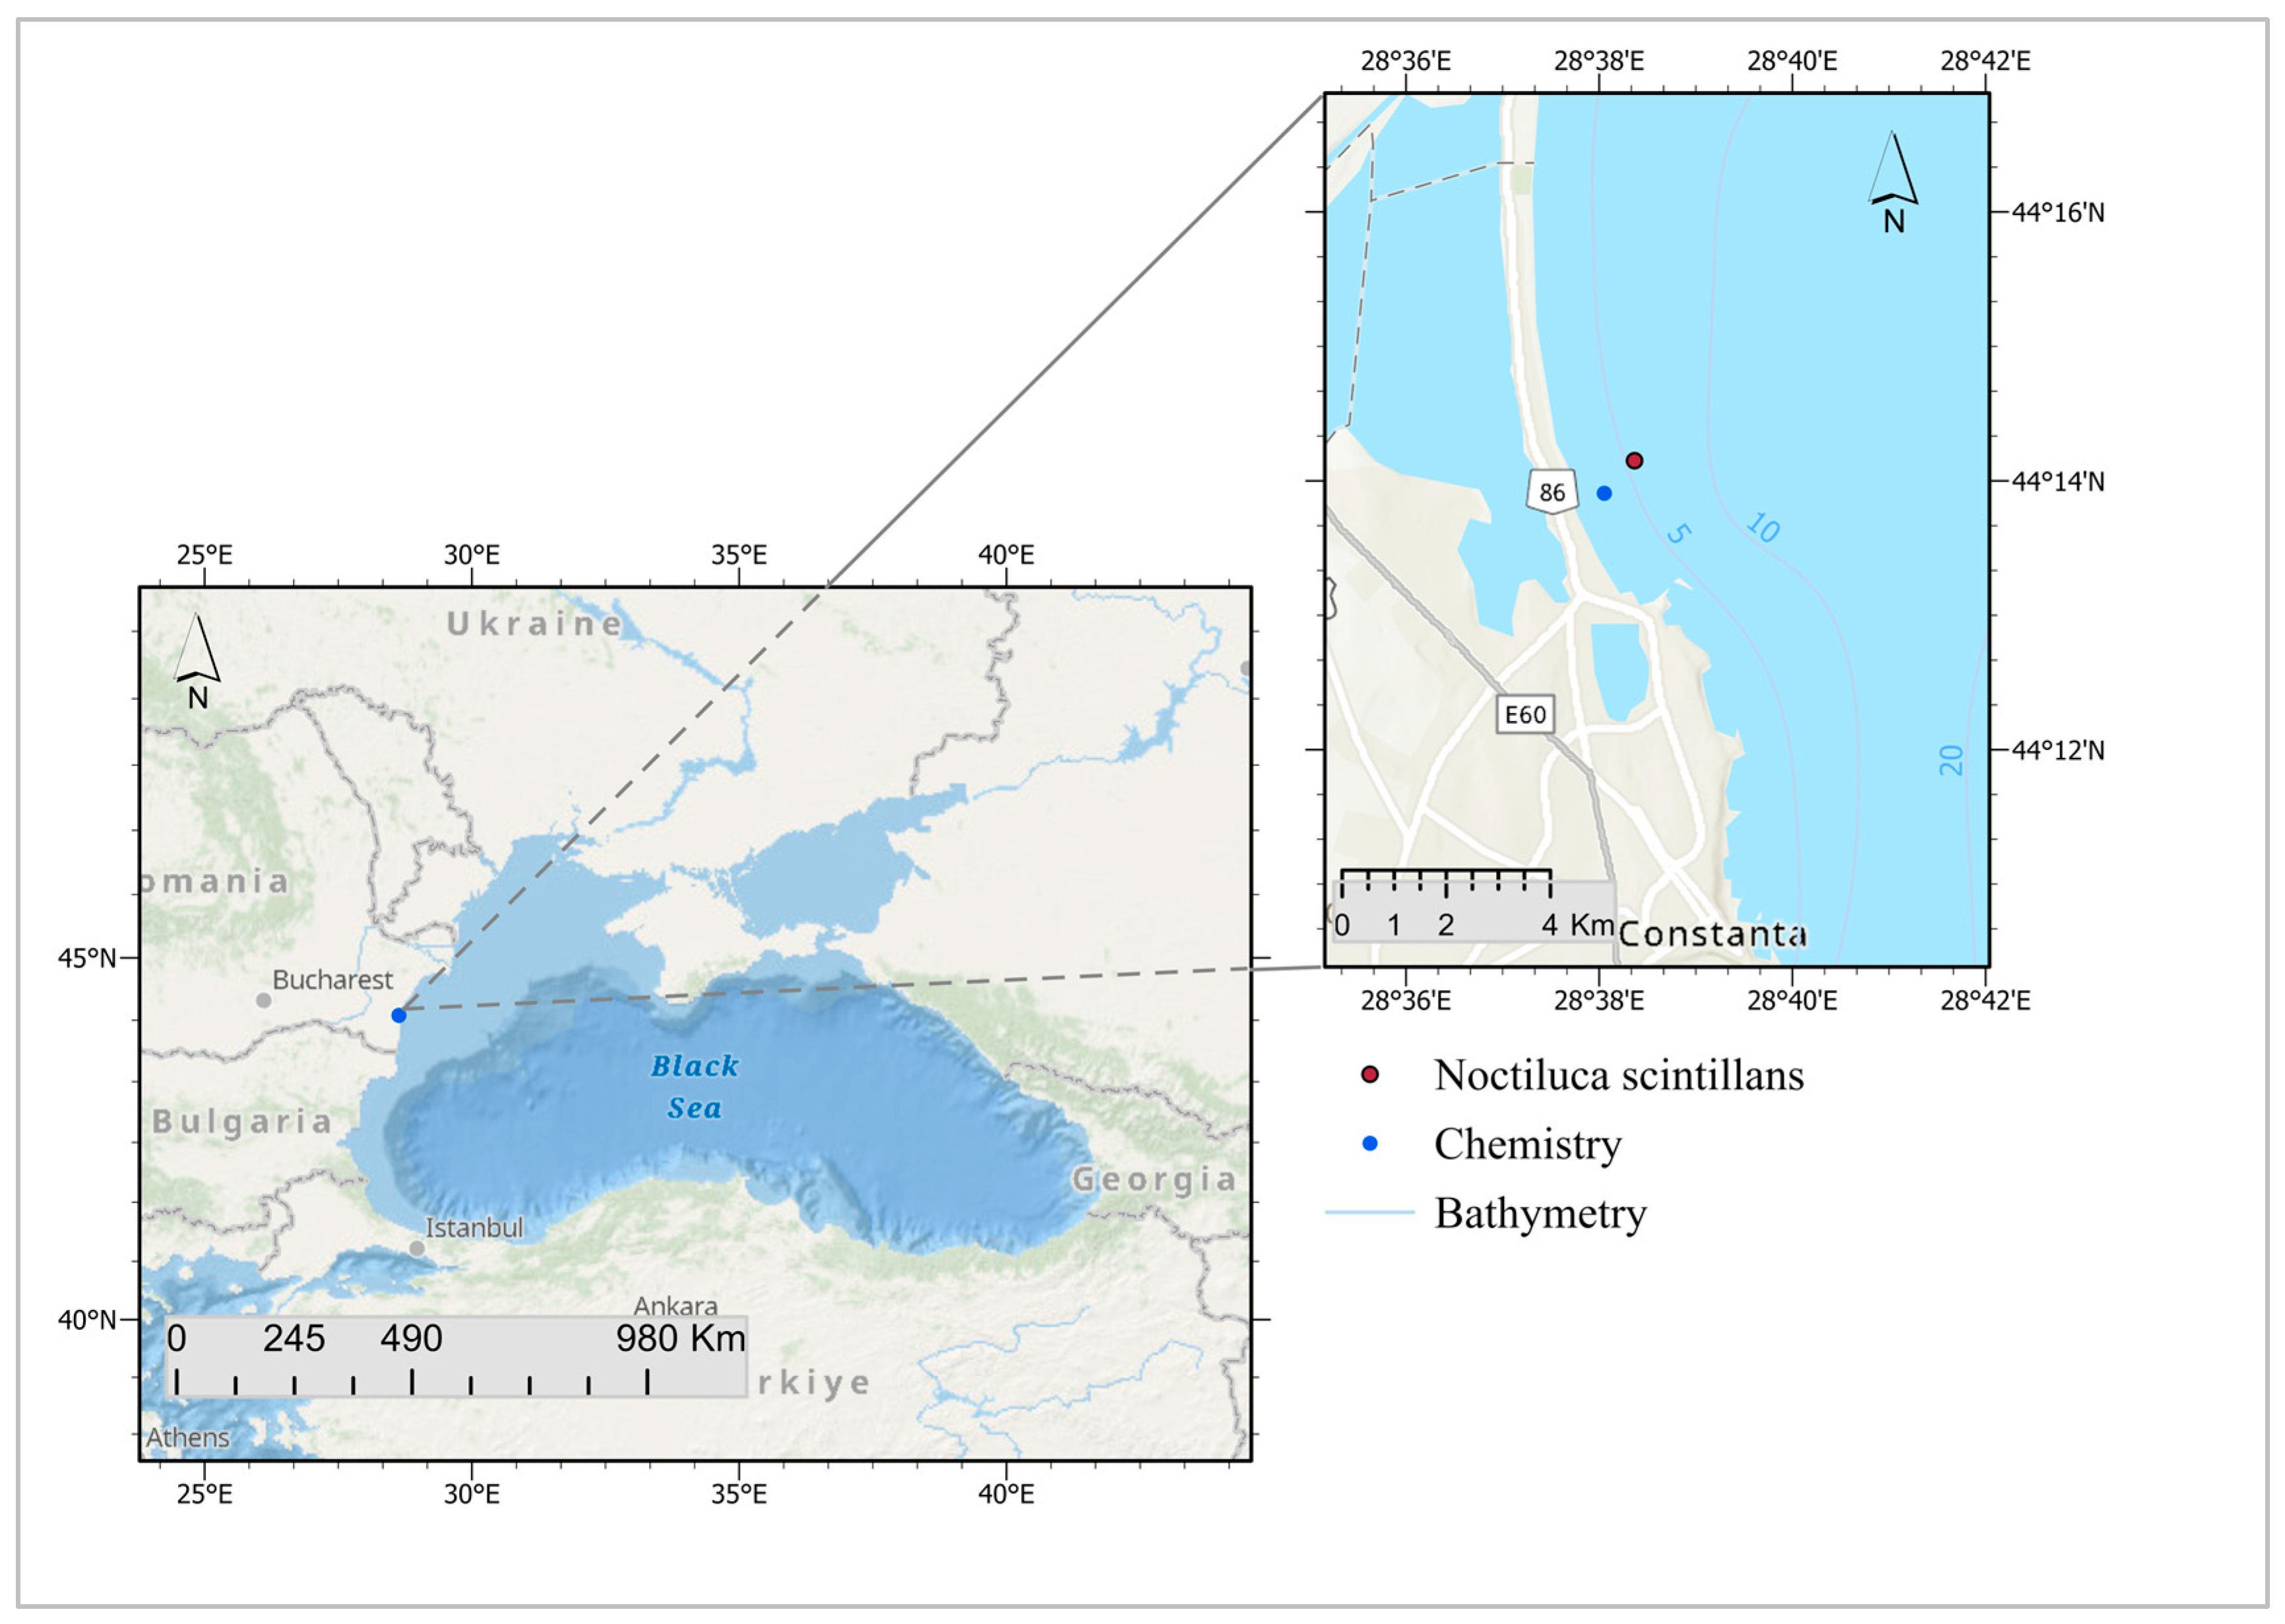
2.1. Study Area and Data Acquisition
2.2. Statistical and Time-Series Analysis
2.2.1. Trend Analysis
2.2.2. Correlation Analysis
2.2.3. Visualization and Interpretation
3. Results
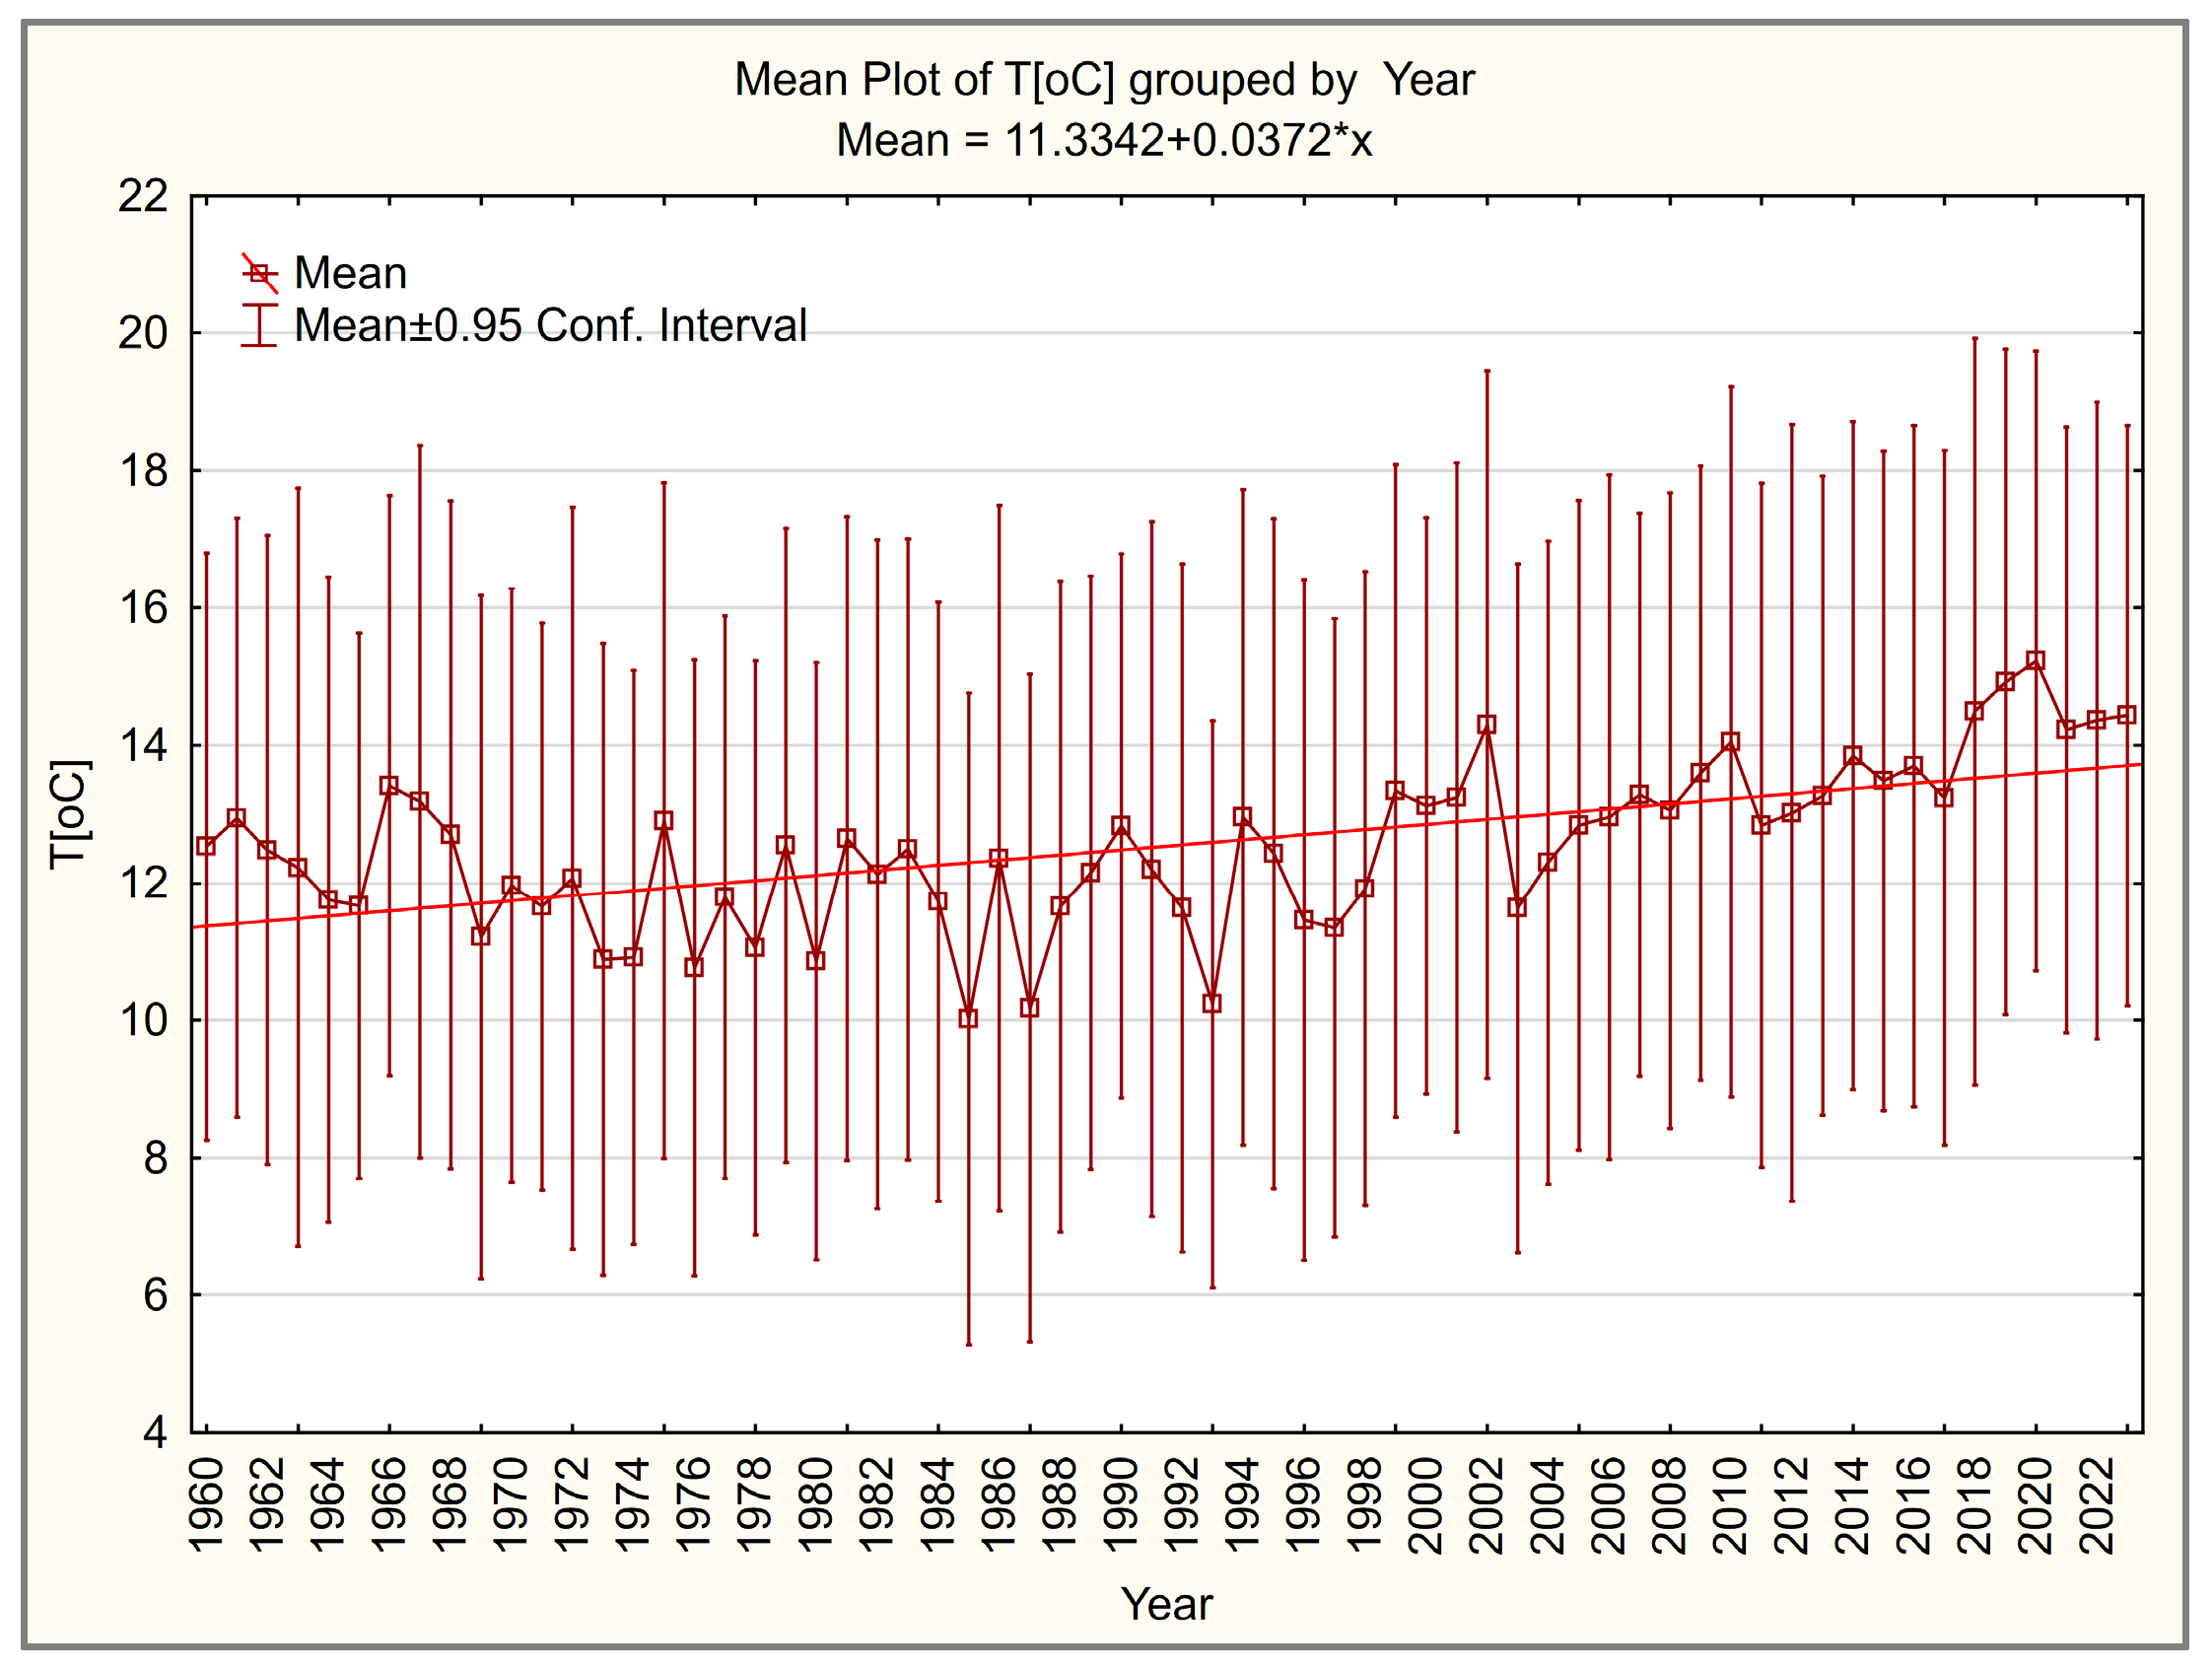
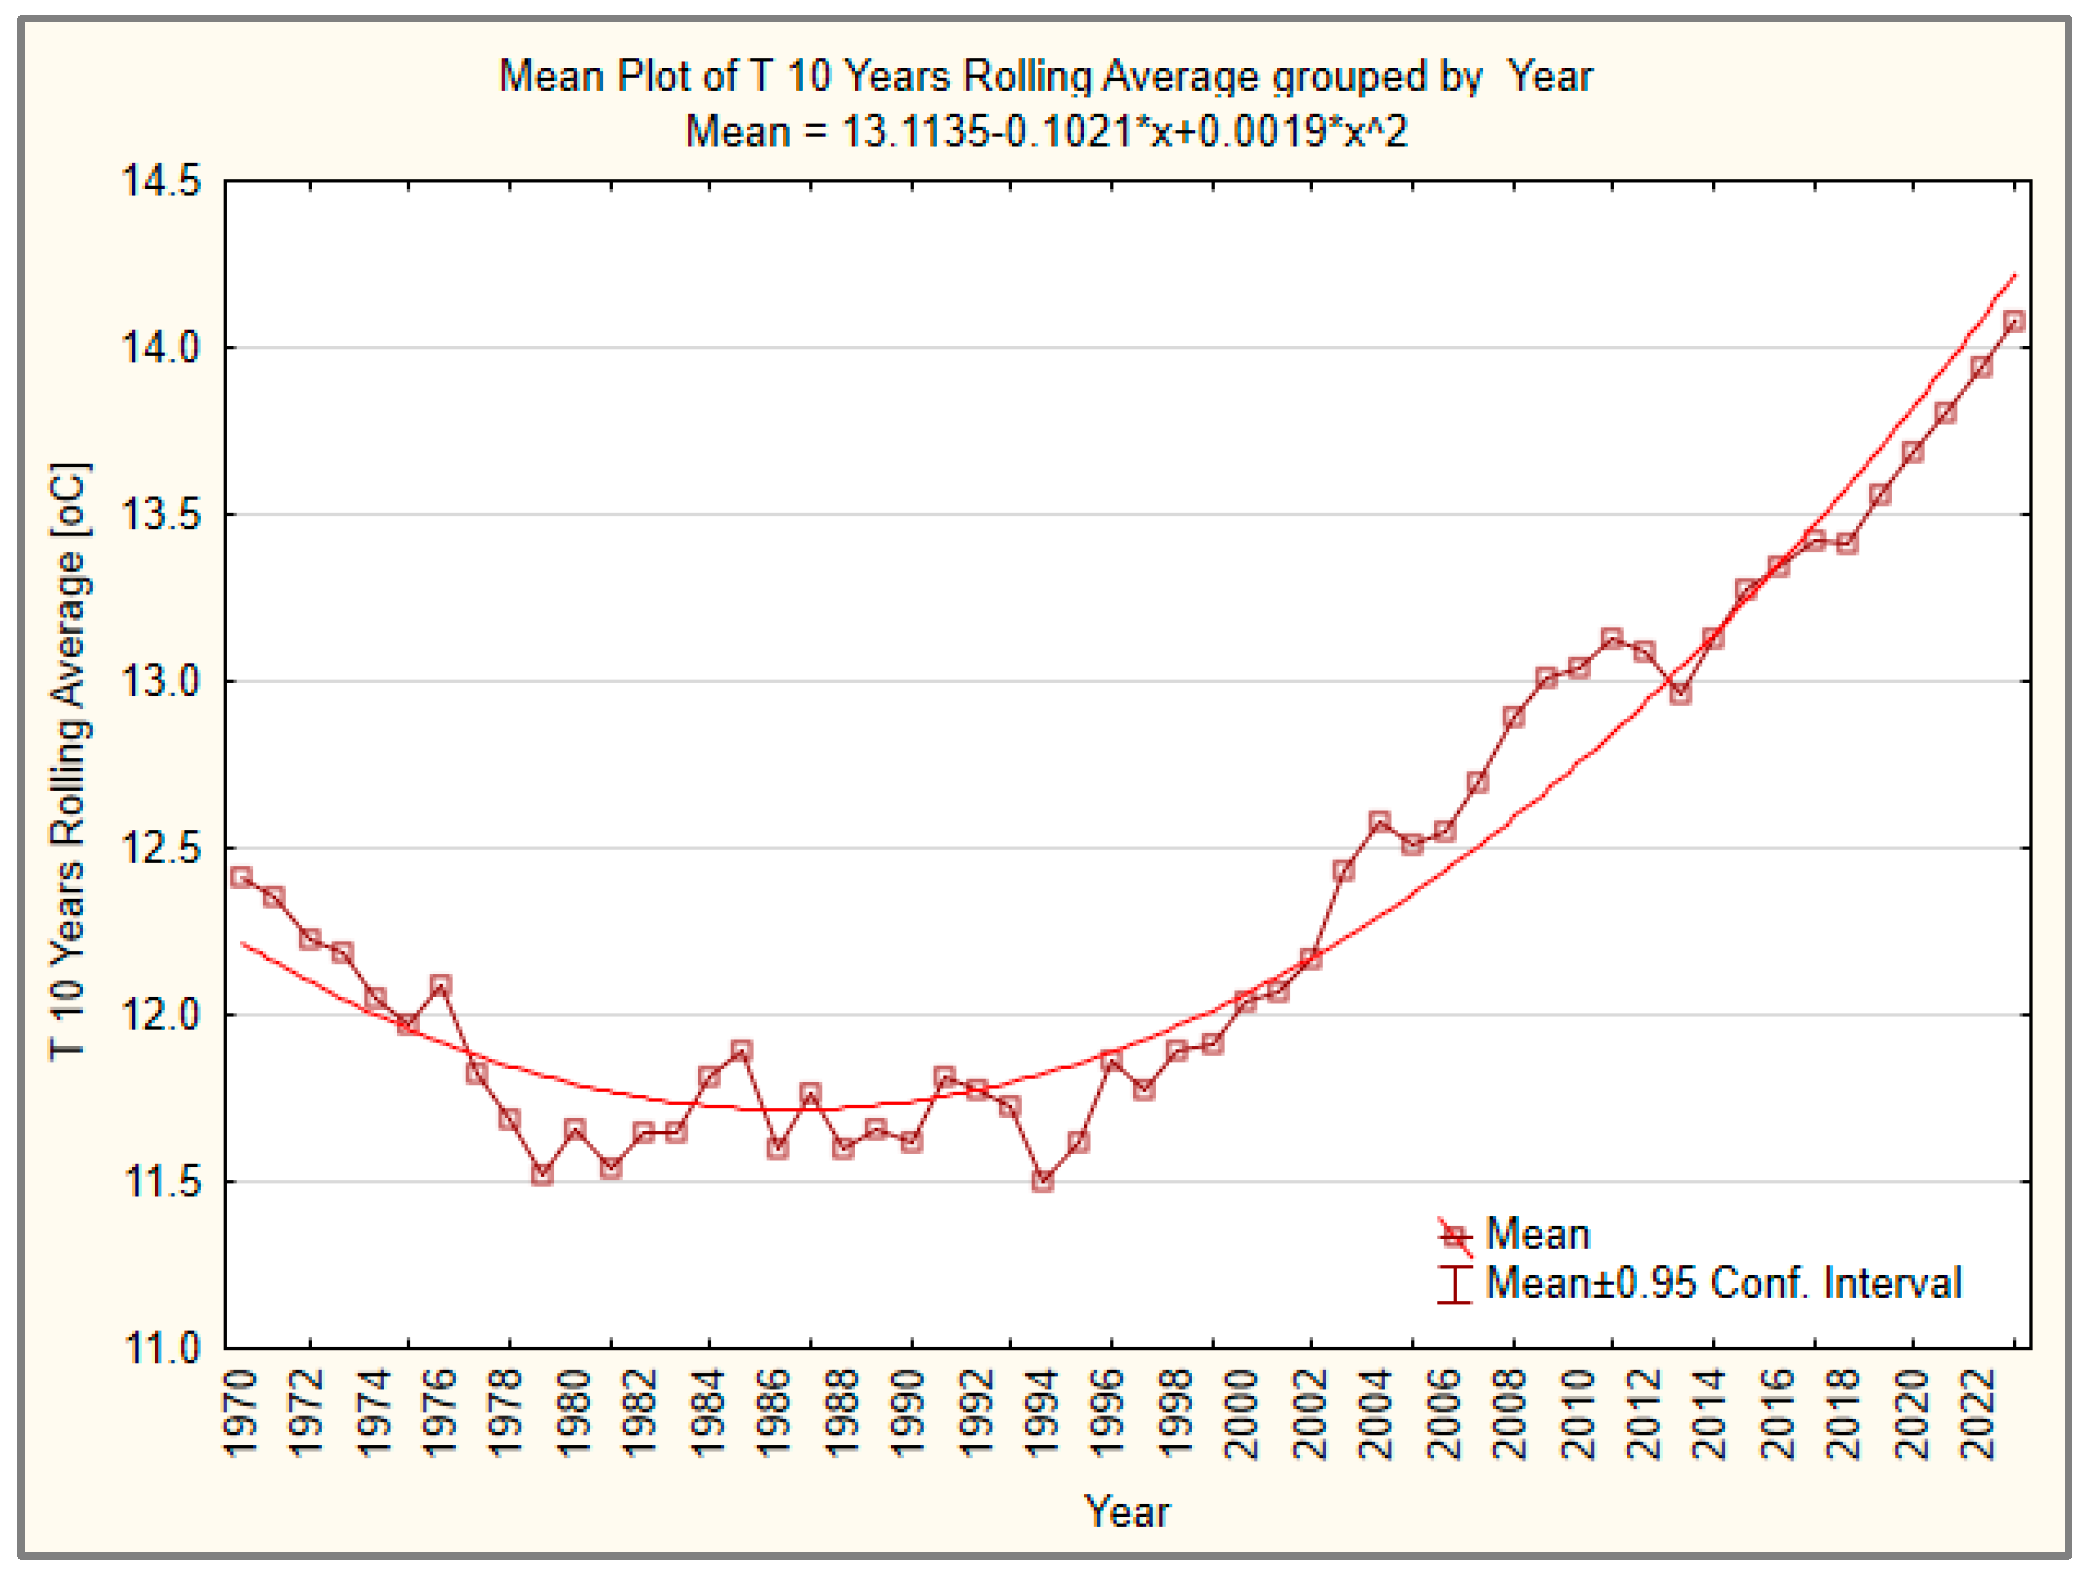
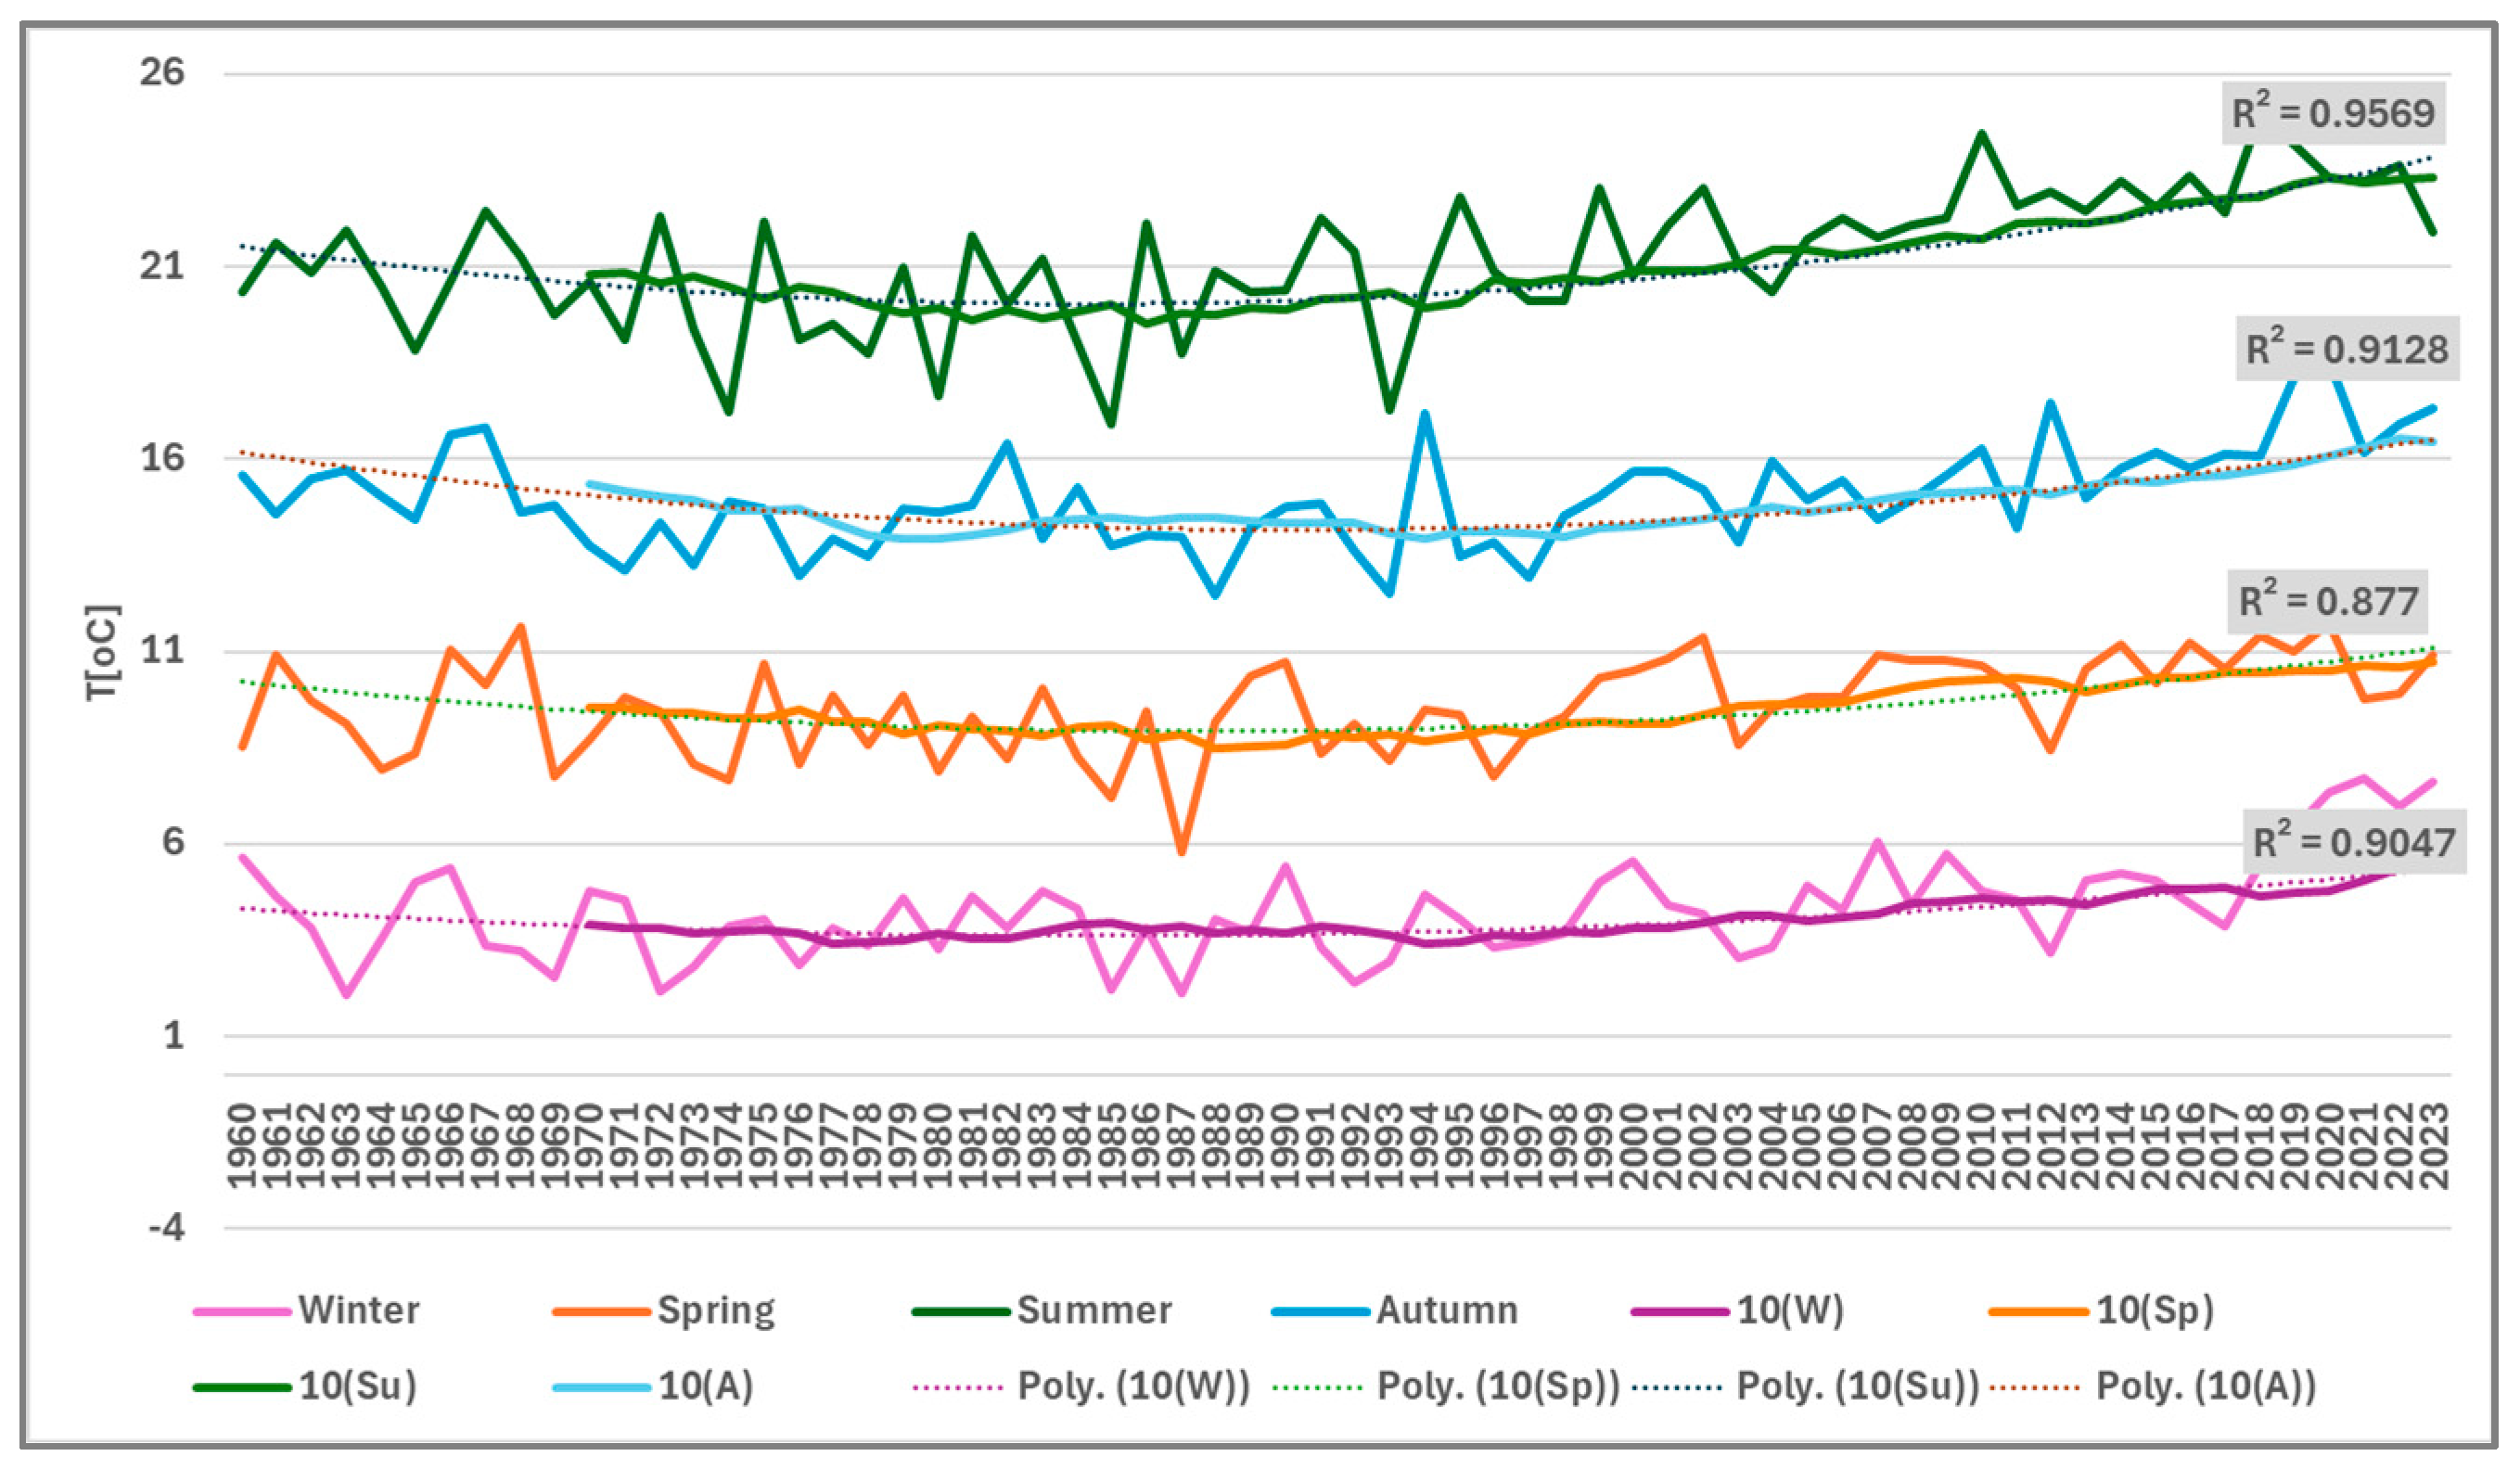
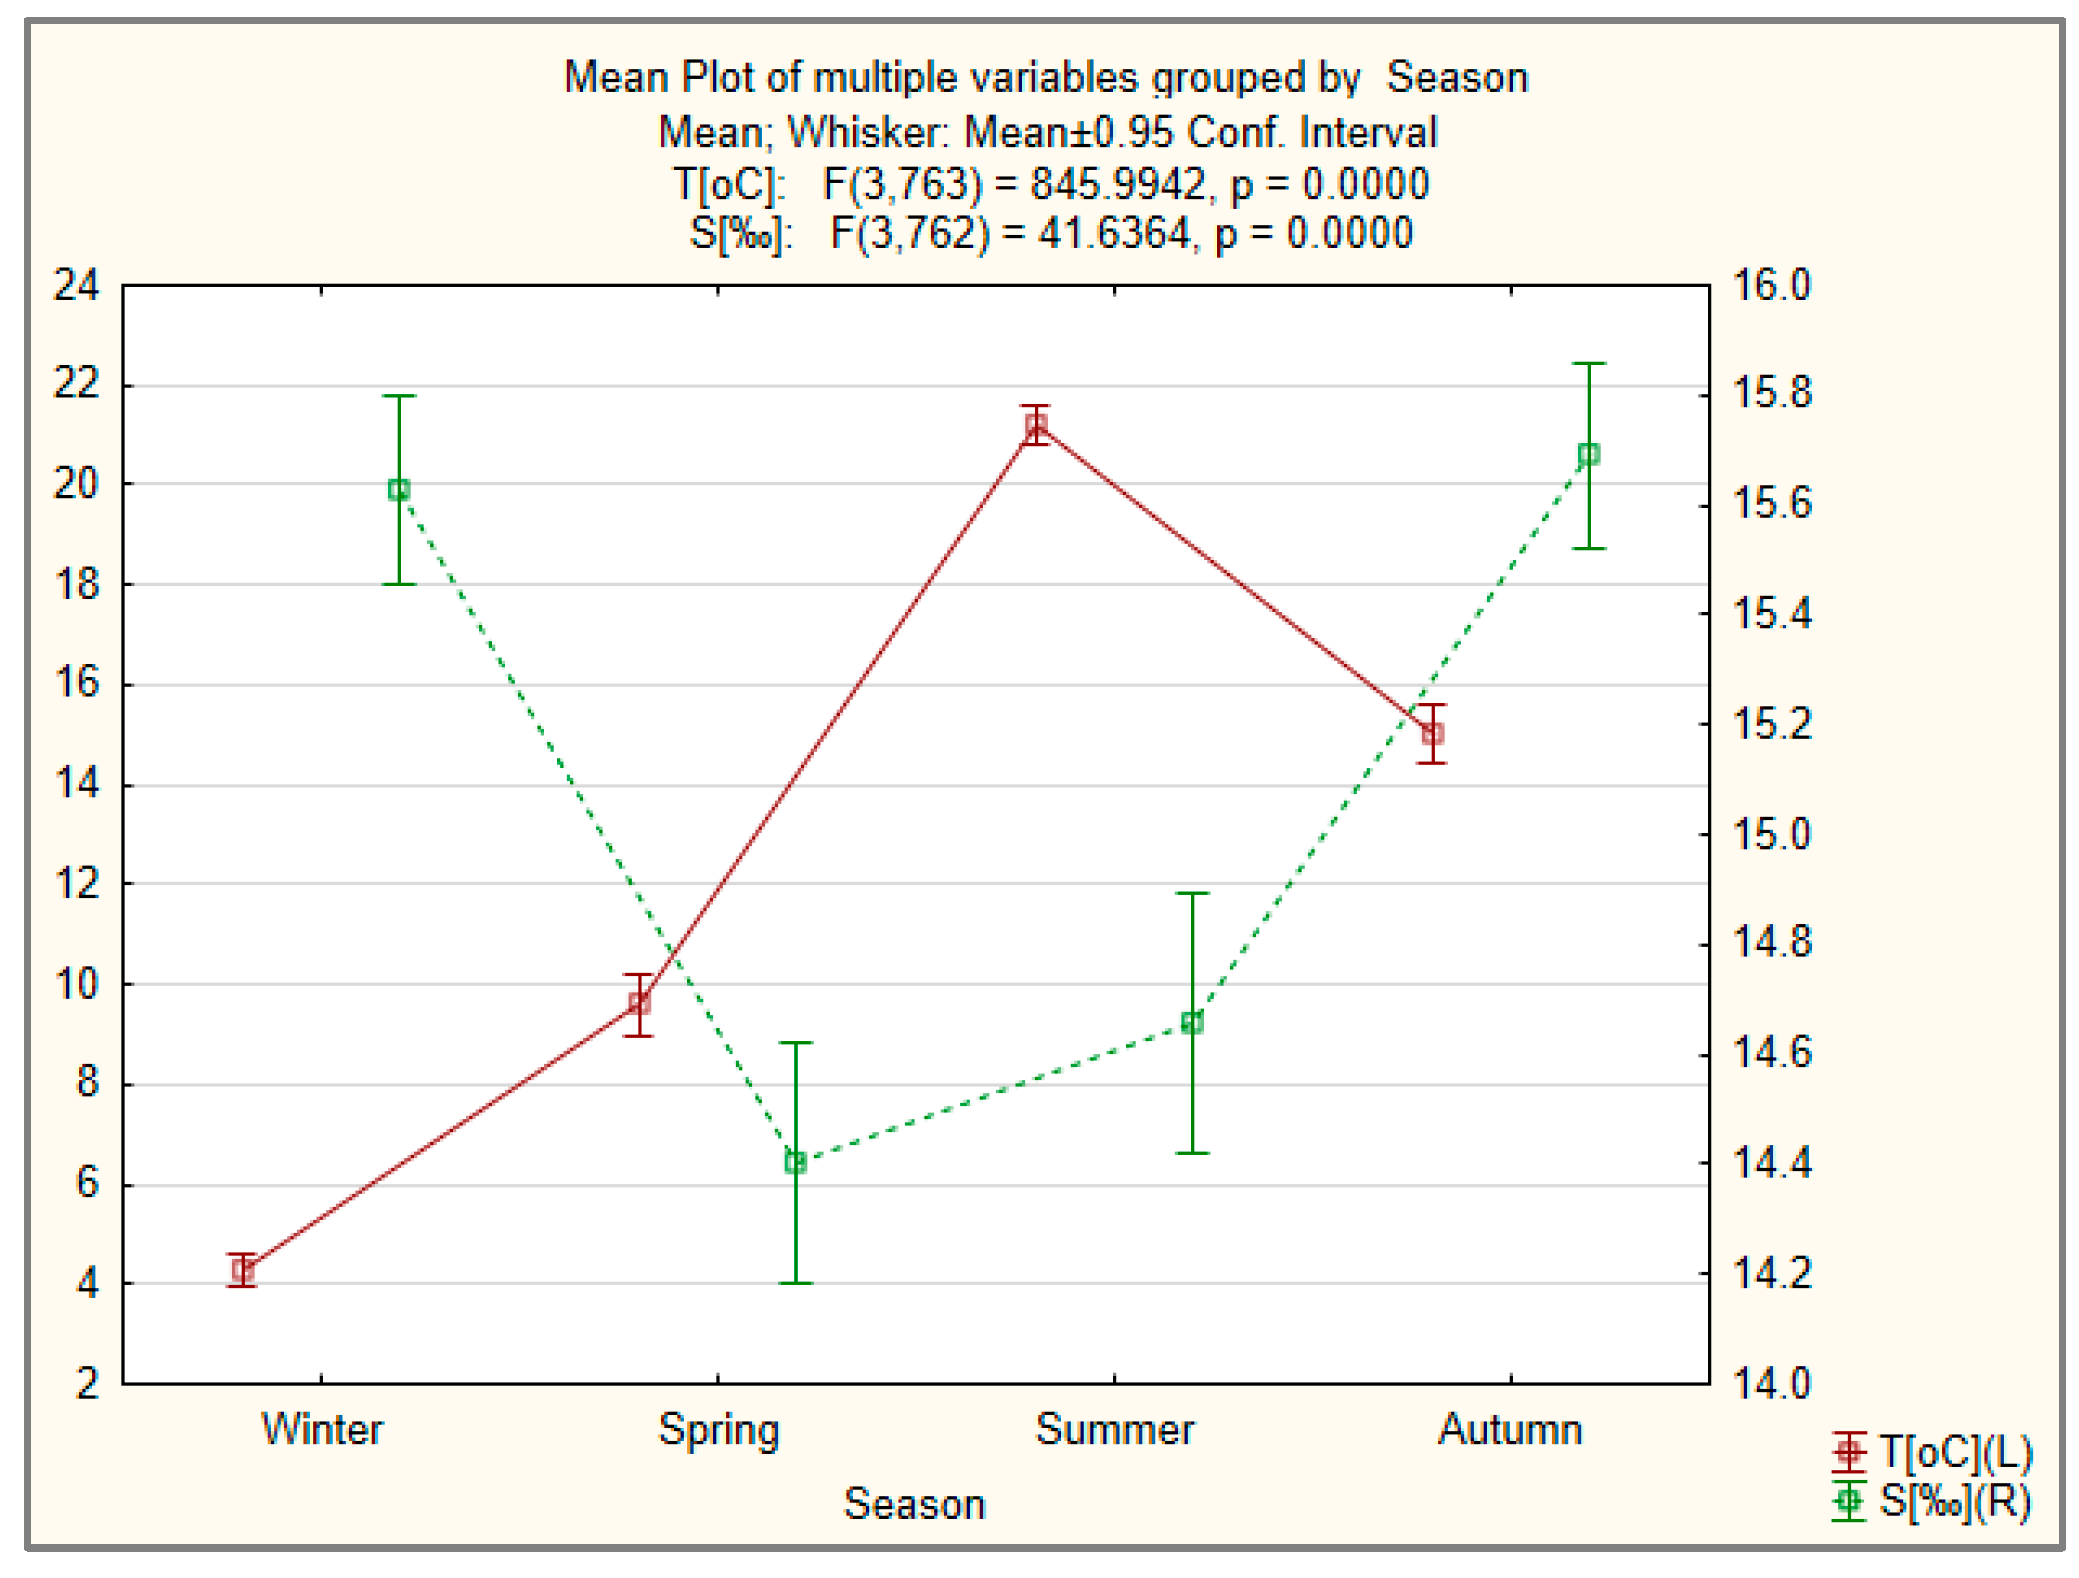
3.1. Temperature
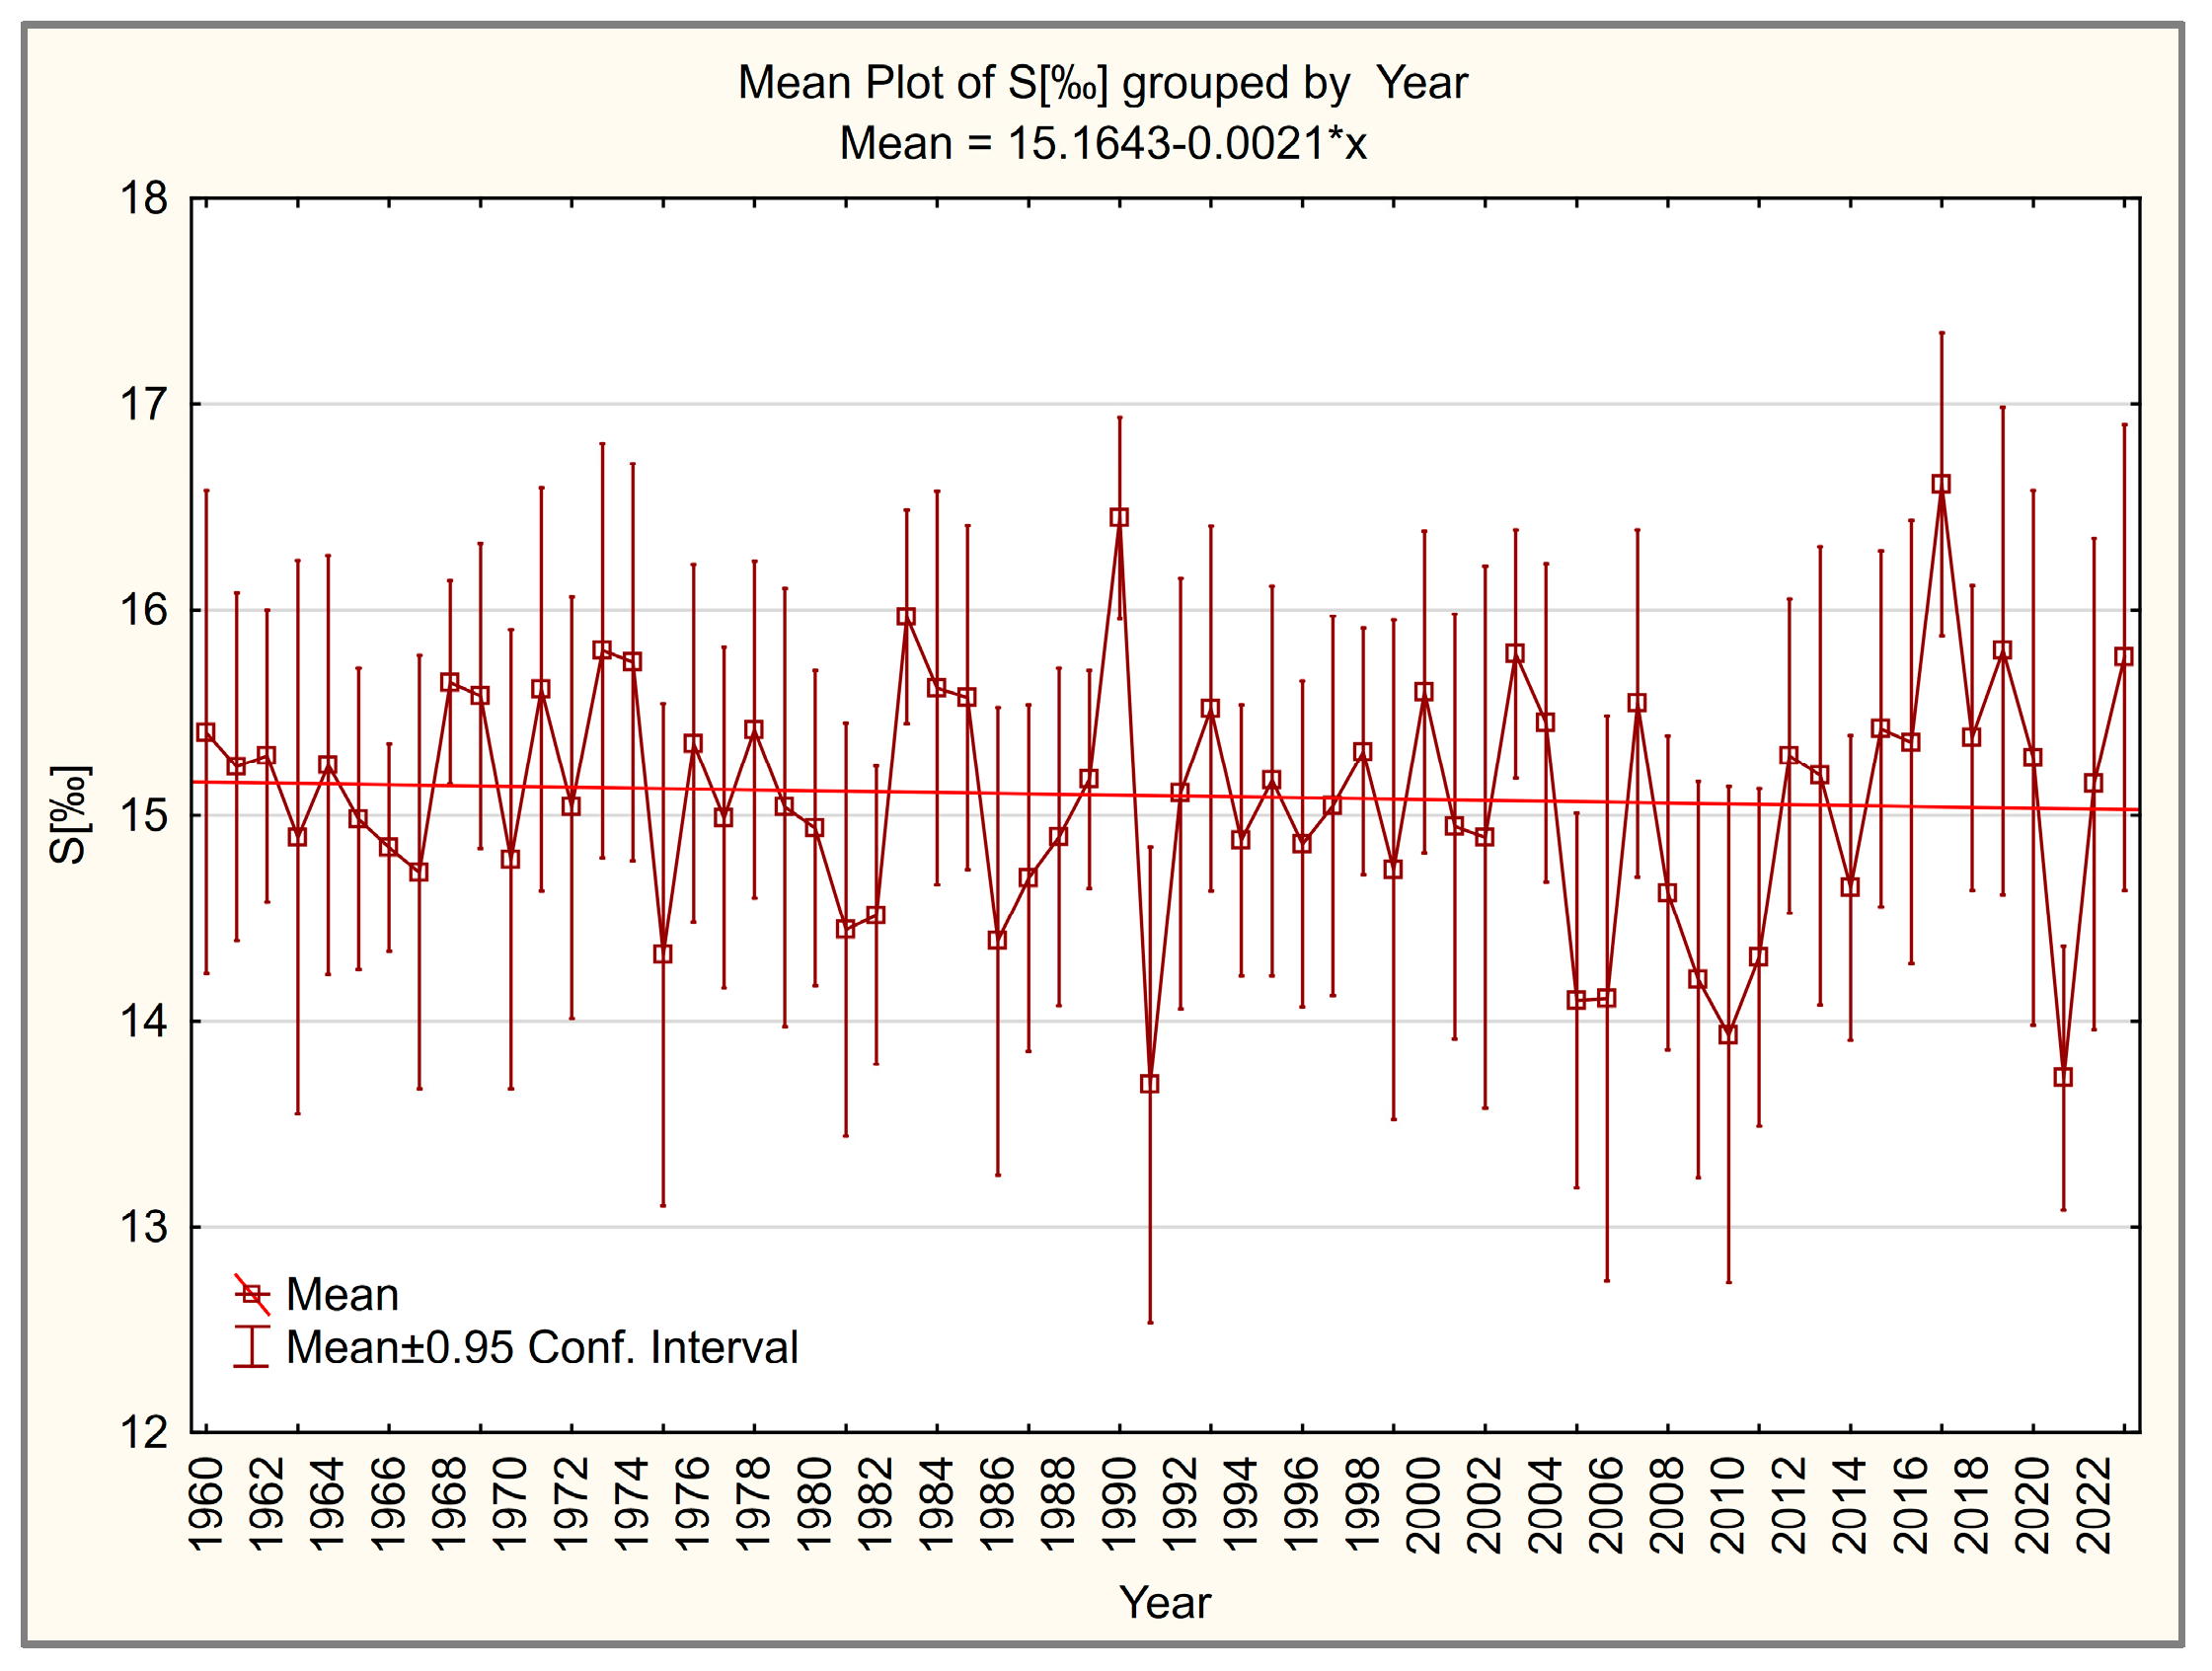
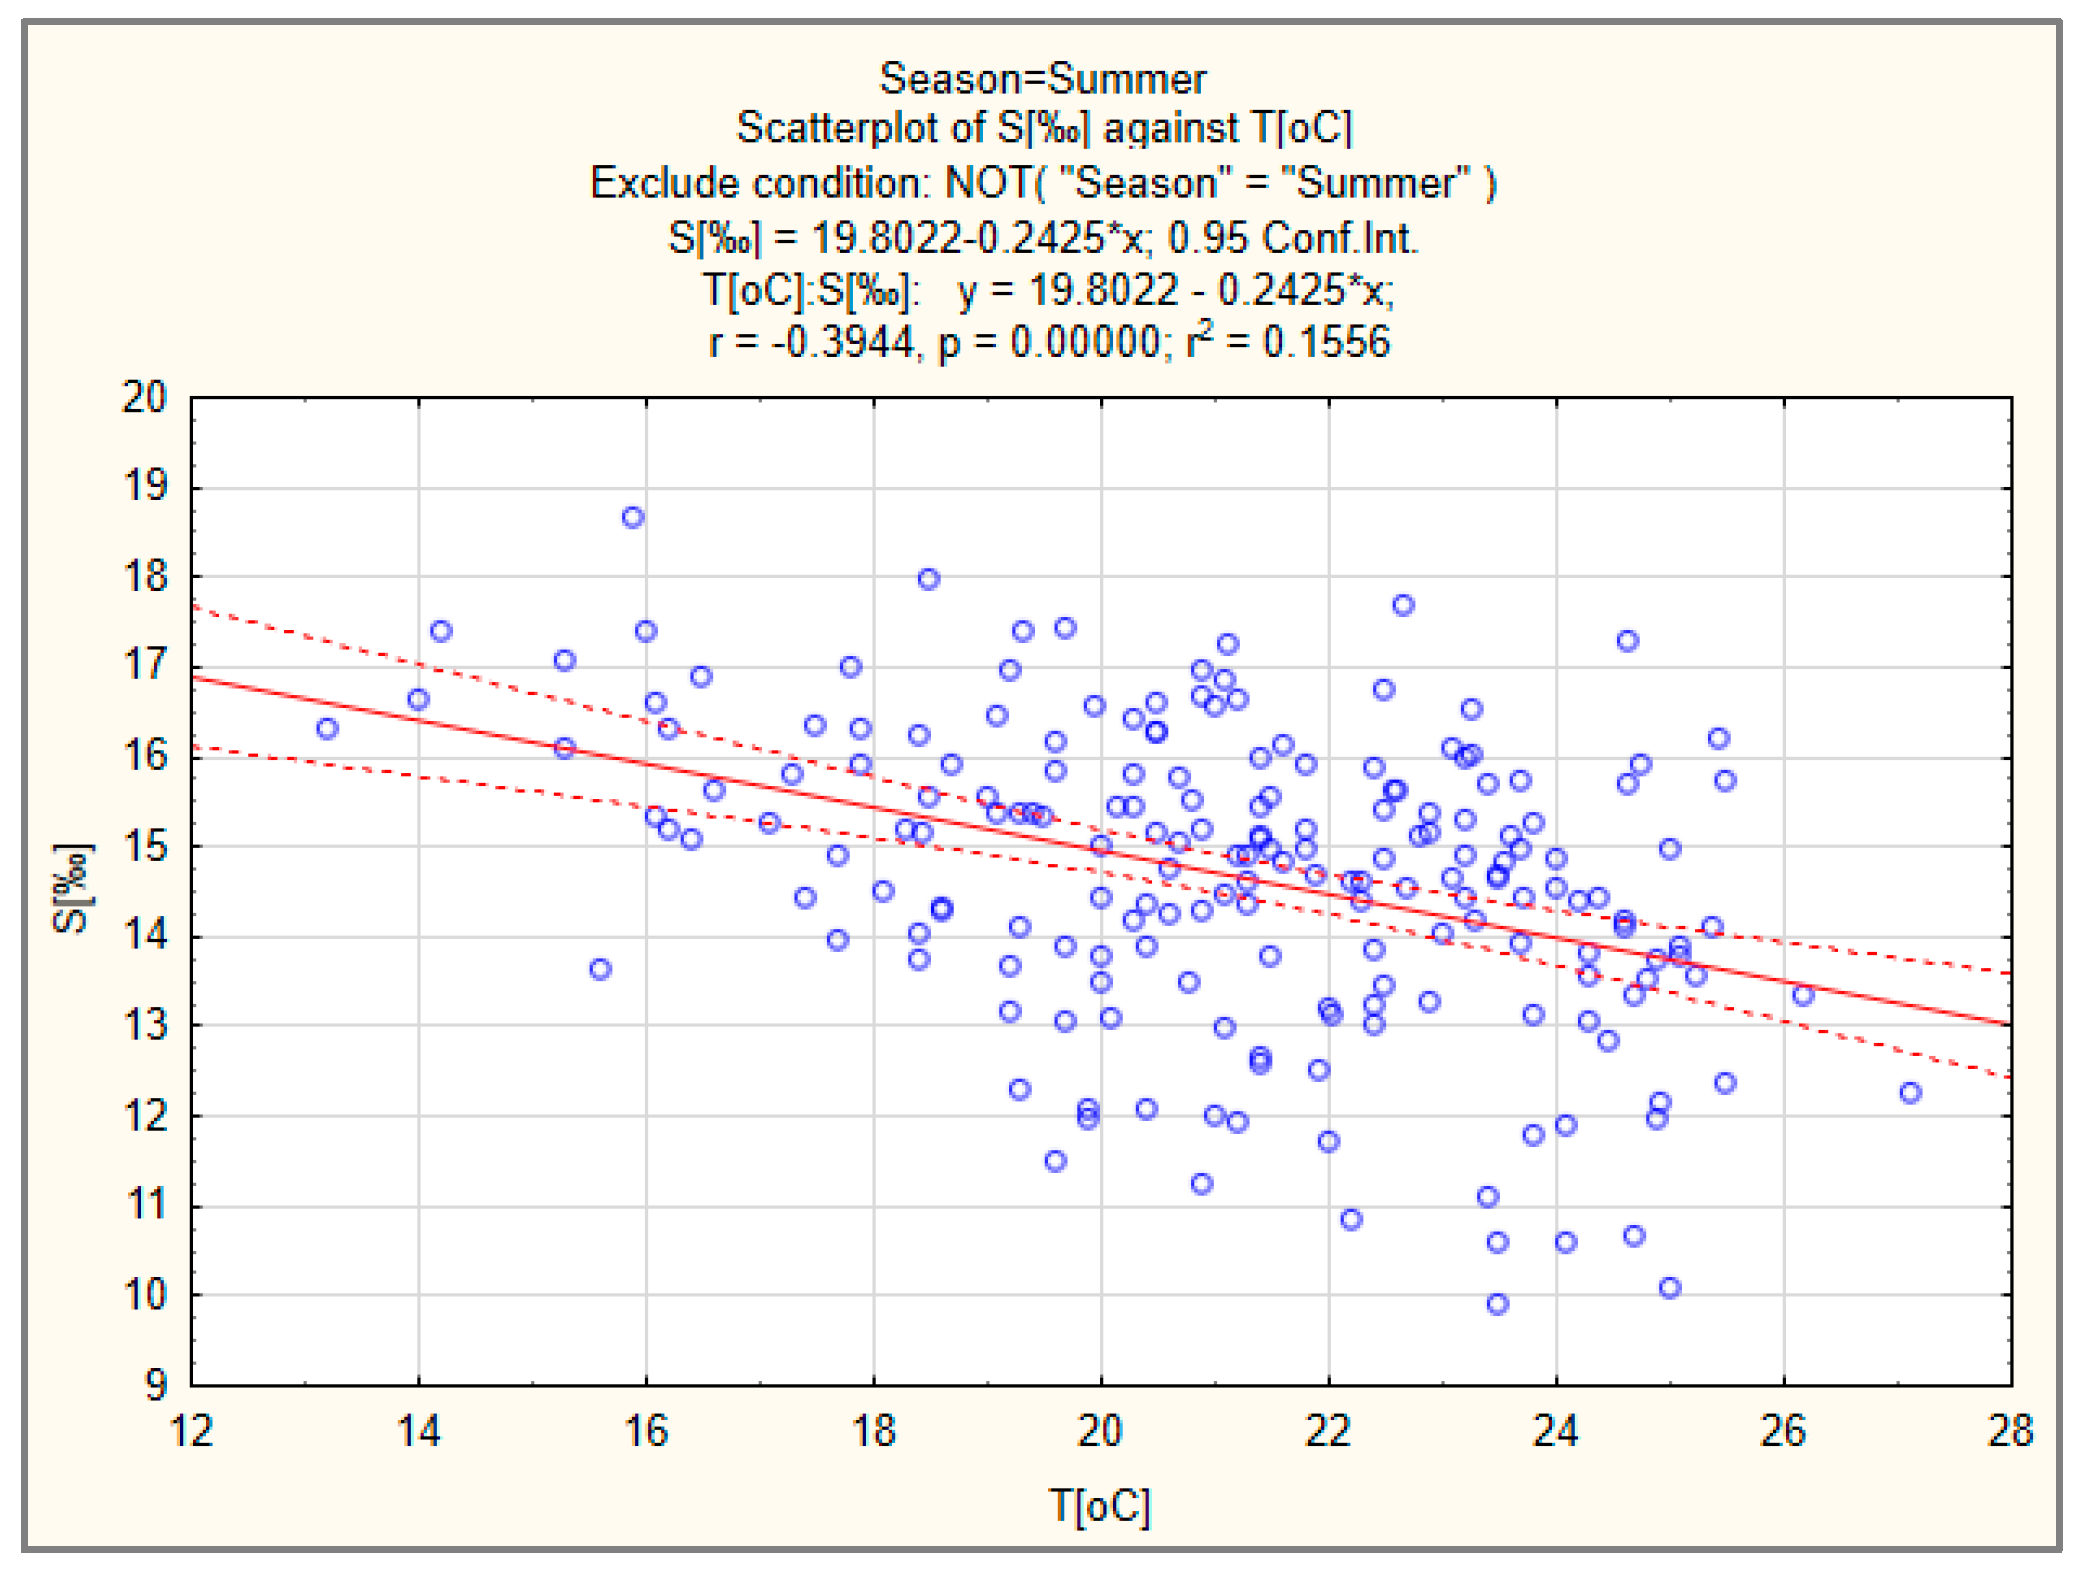
3.2. Salinity
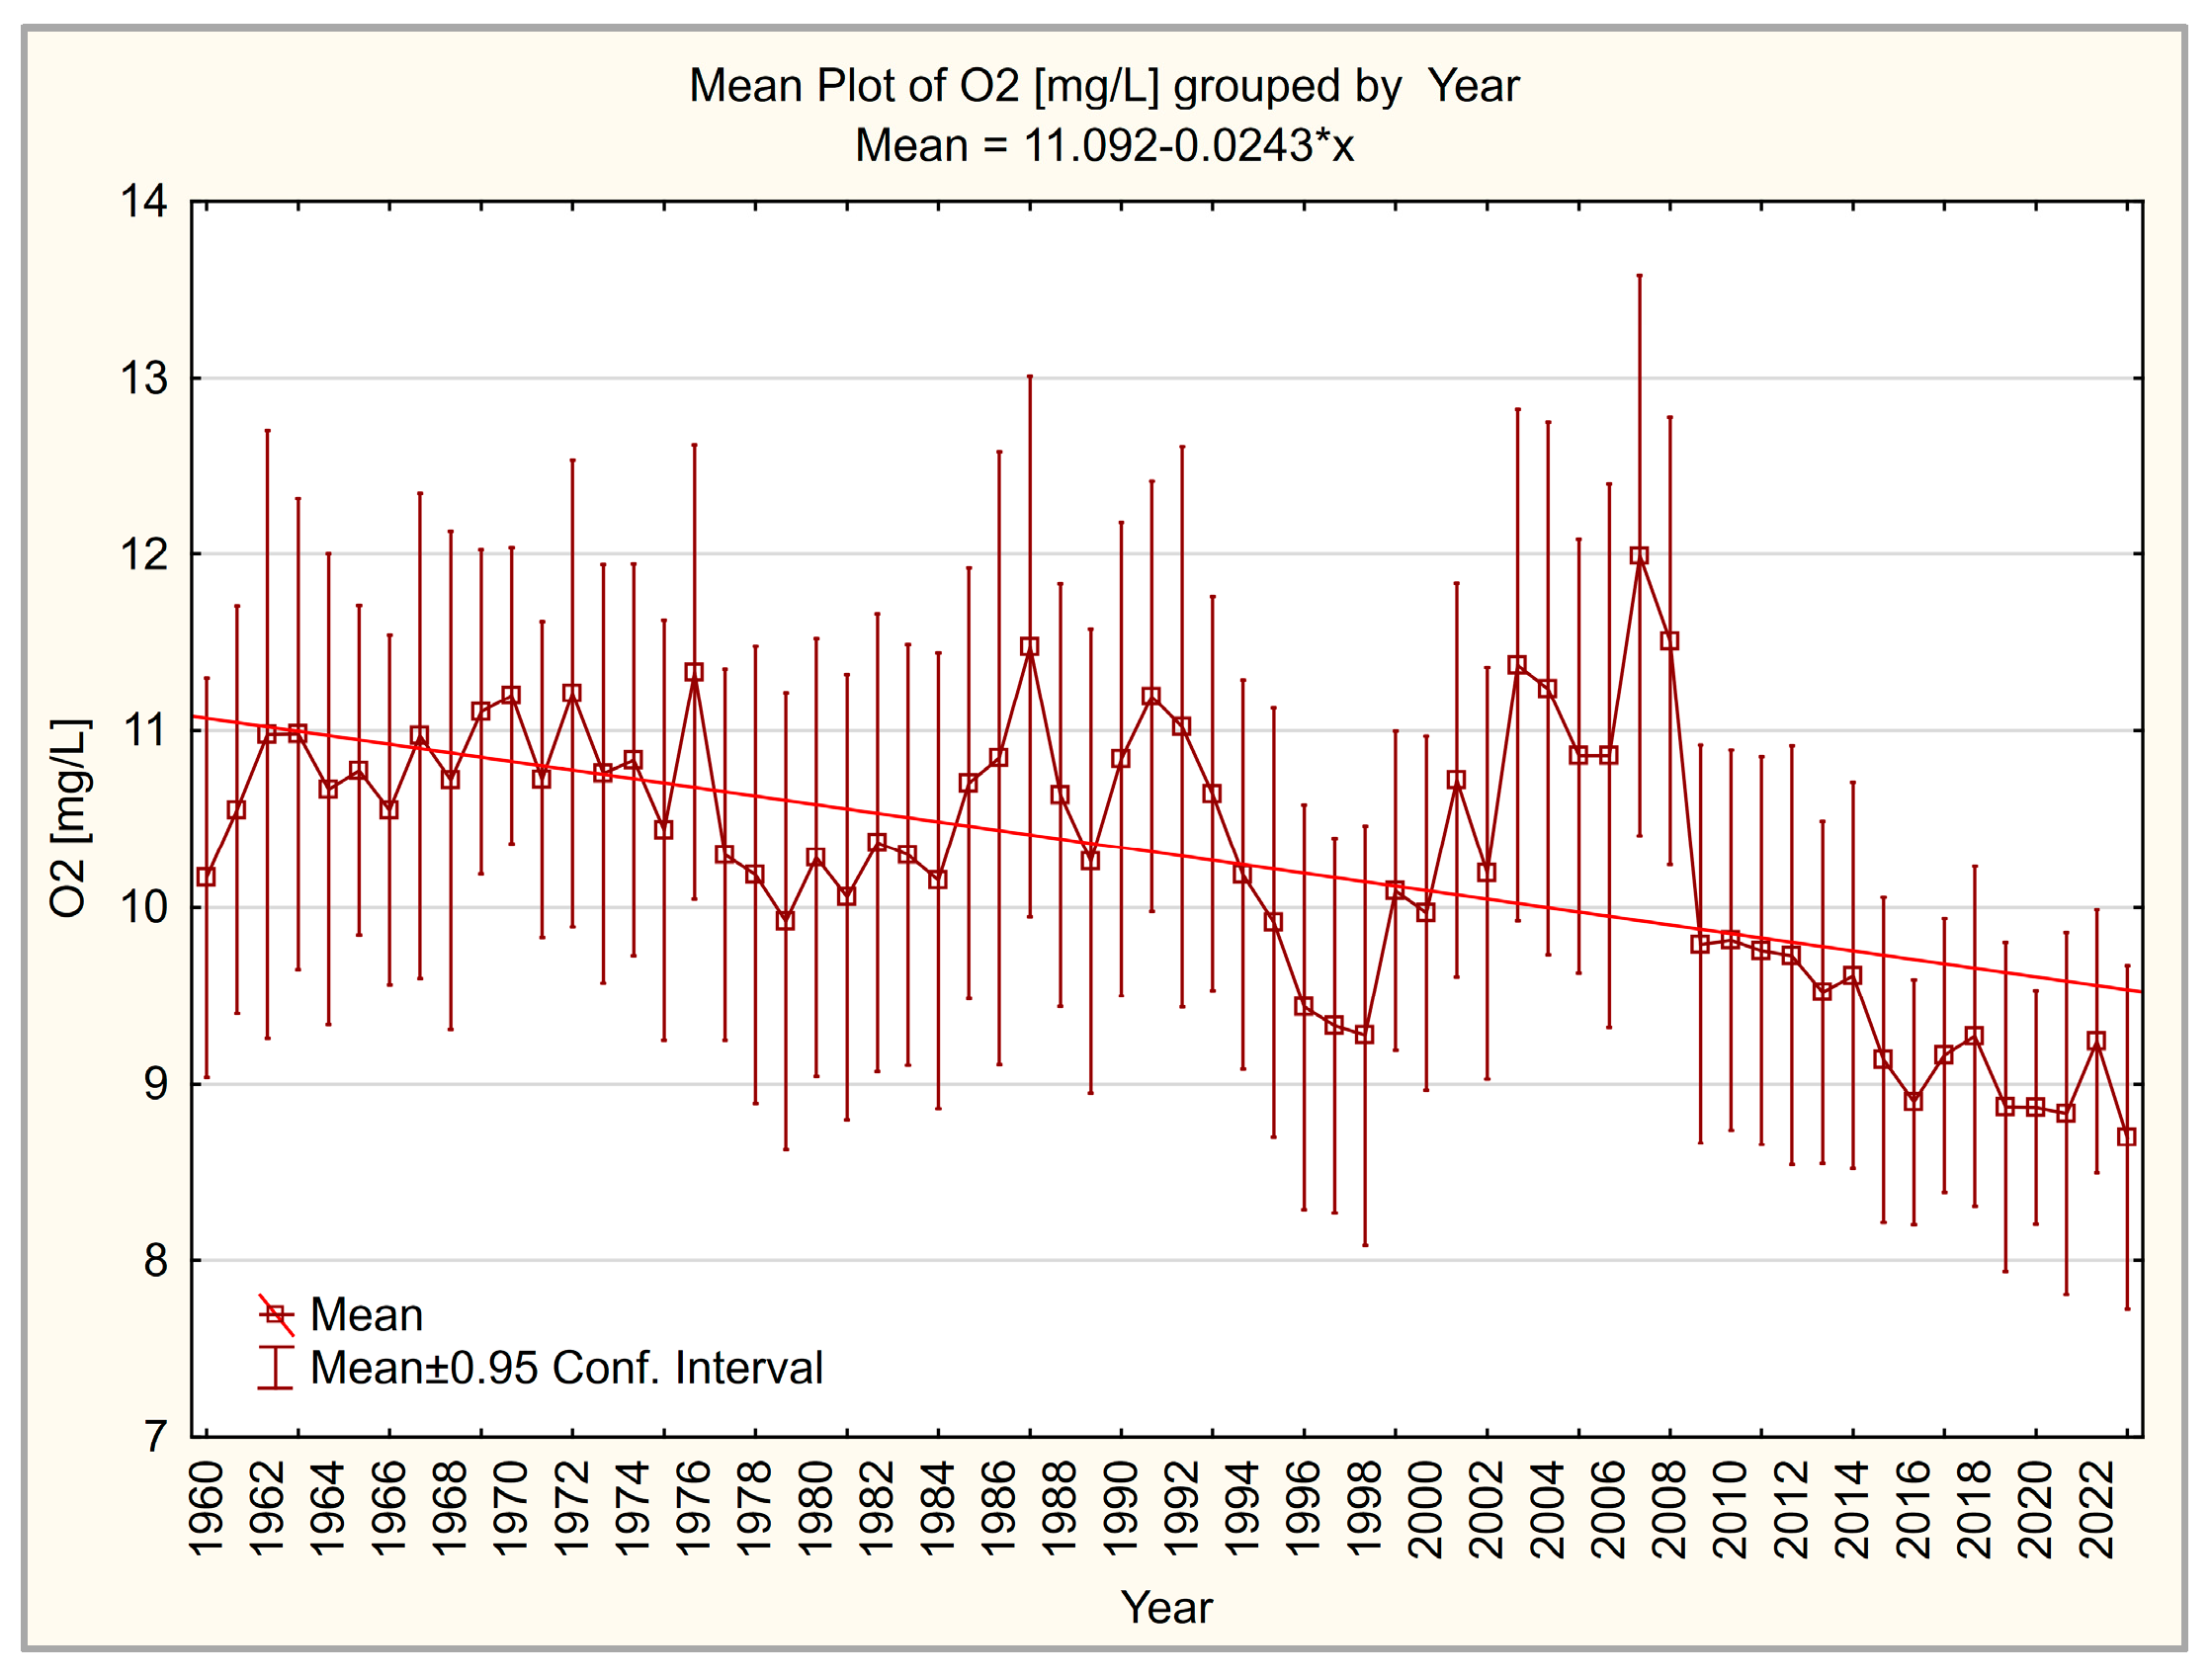
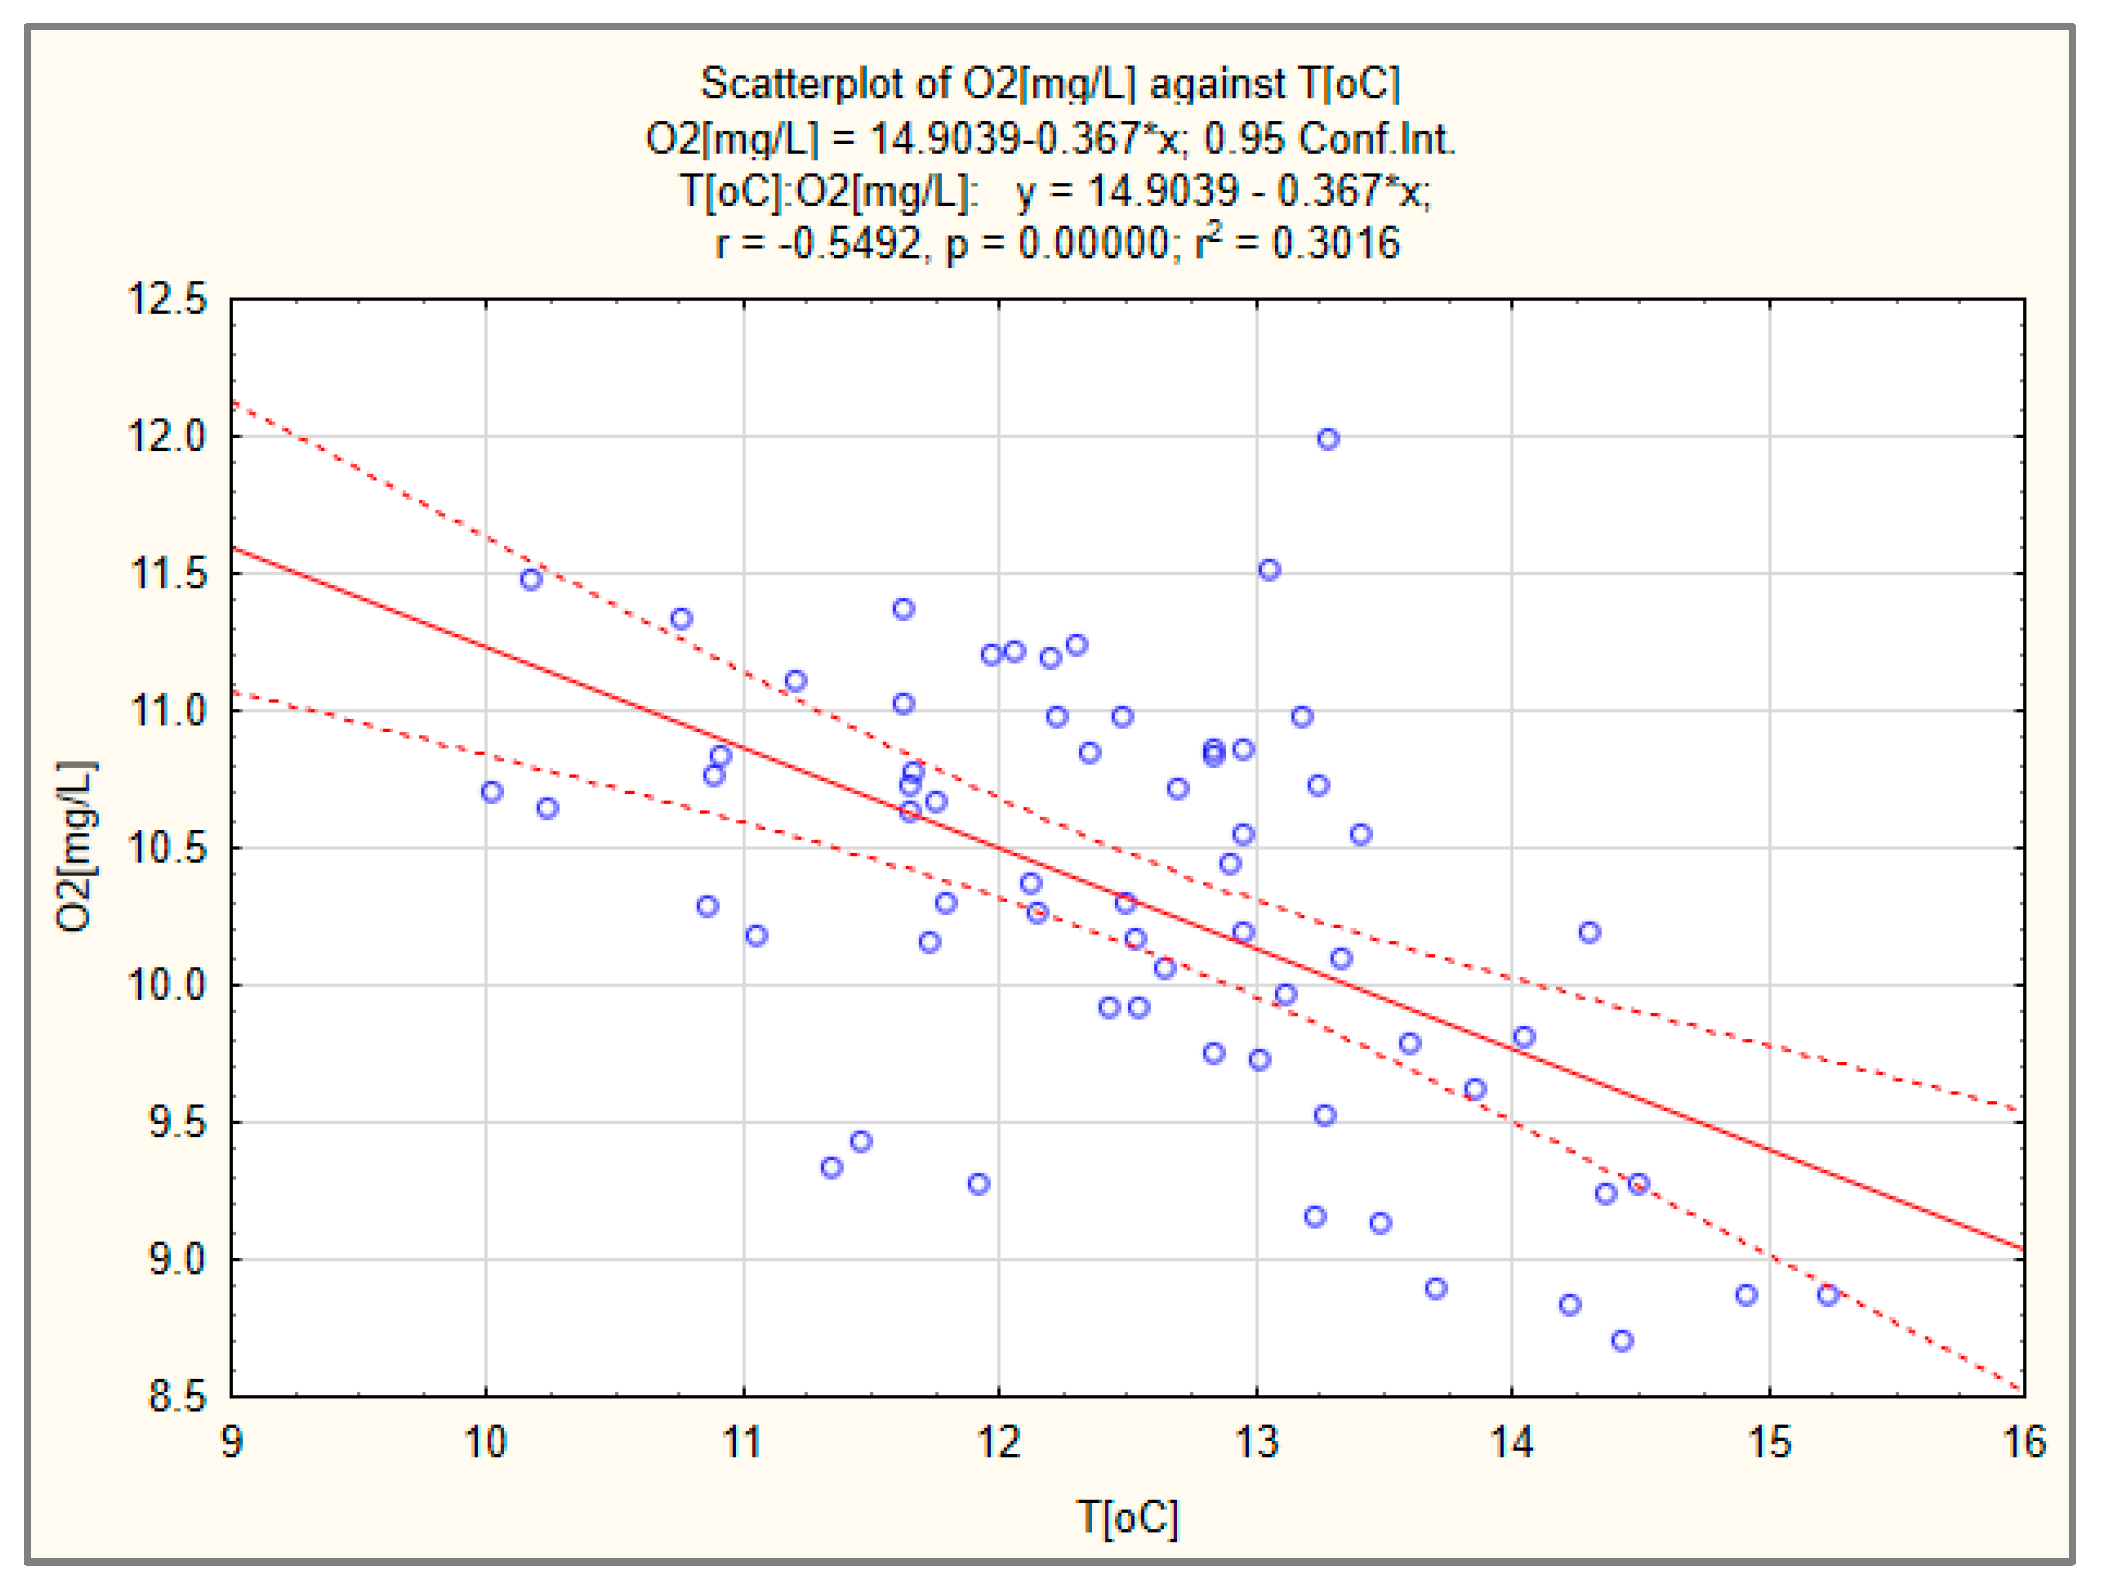
3.3. Dissolved Oxygen
3.4. Nutrients
3.4.1. Long-Term Variability
3.4.2. Seasonal Variation
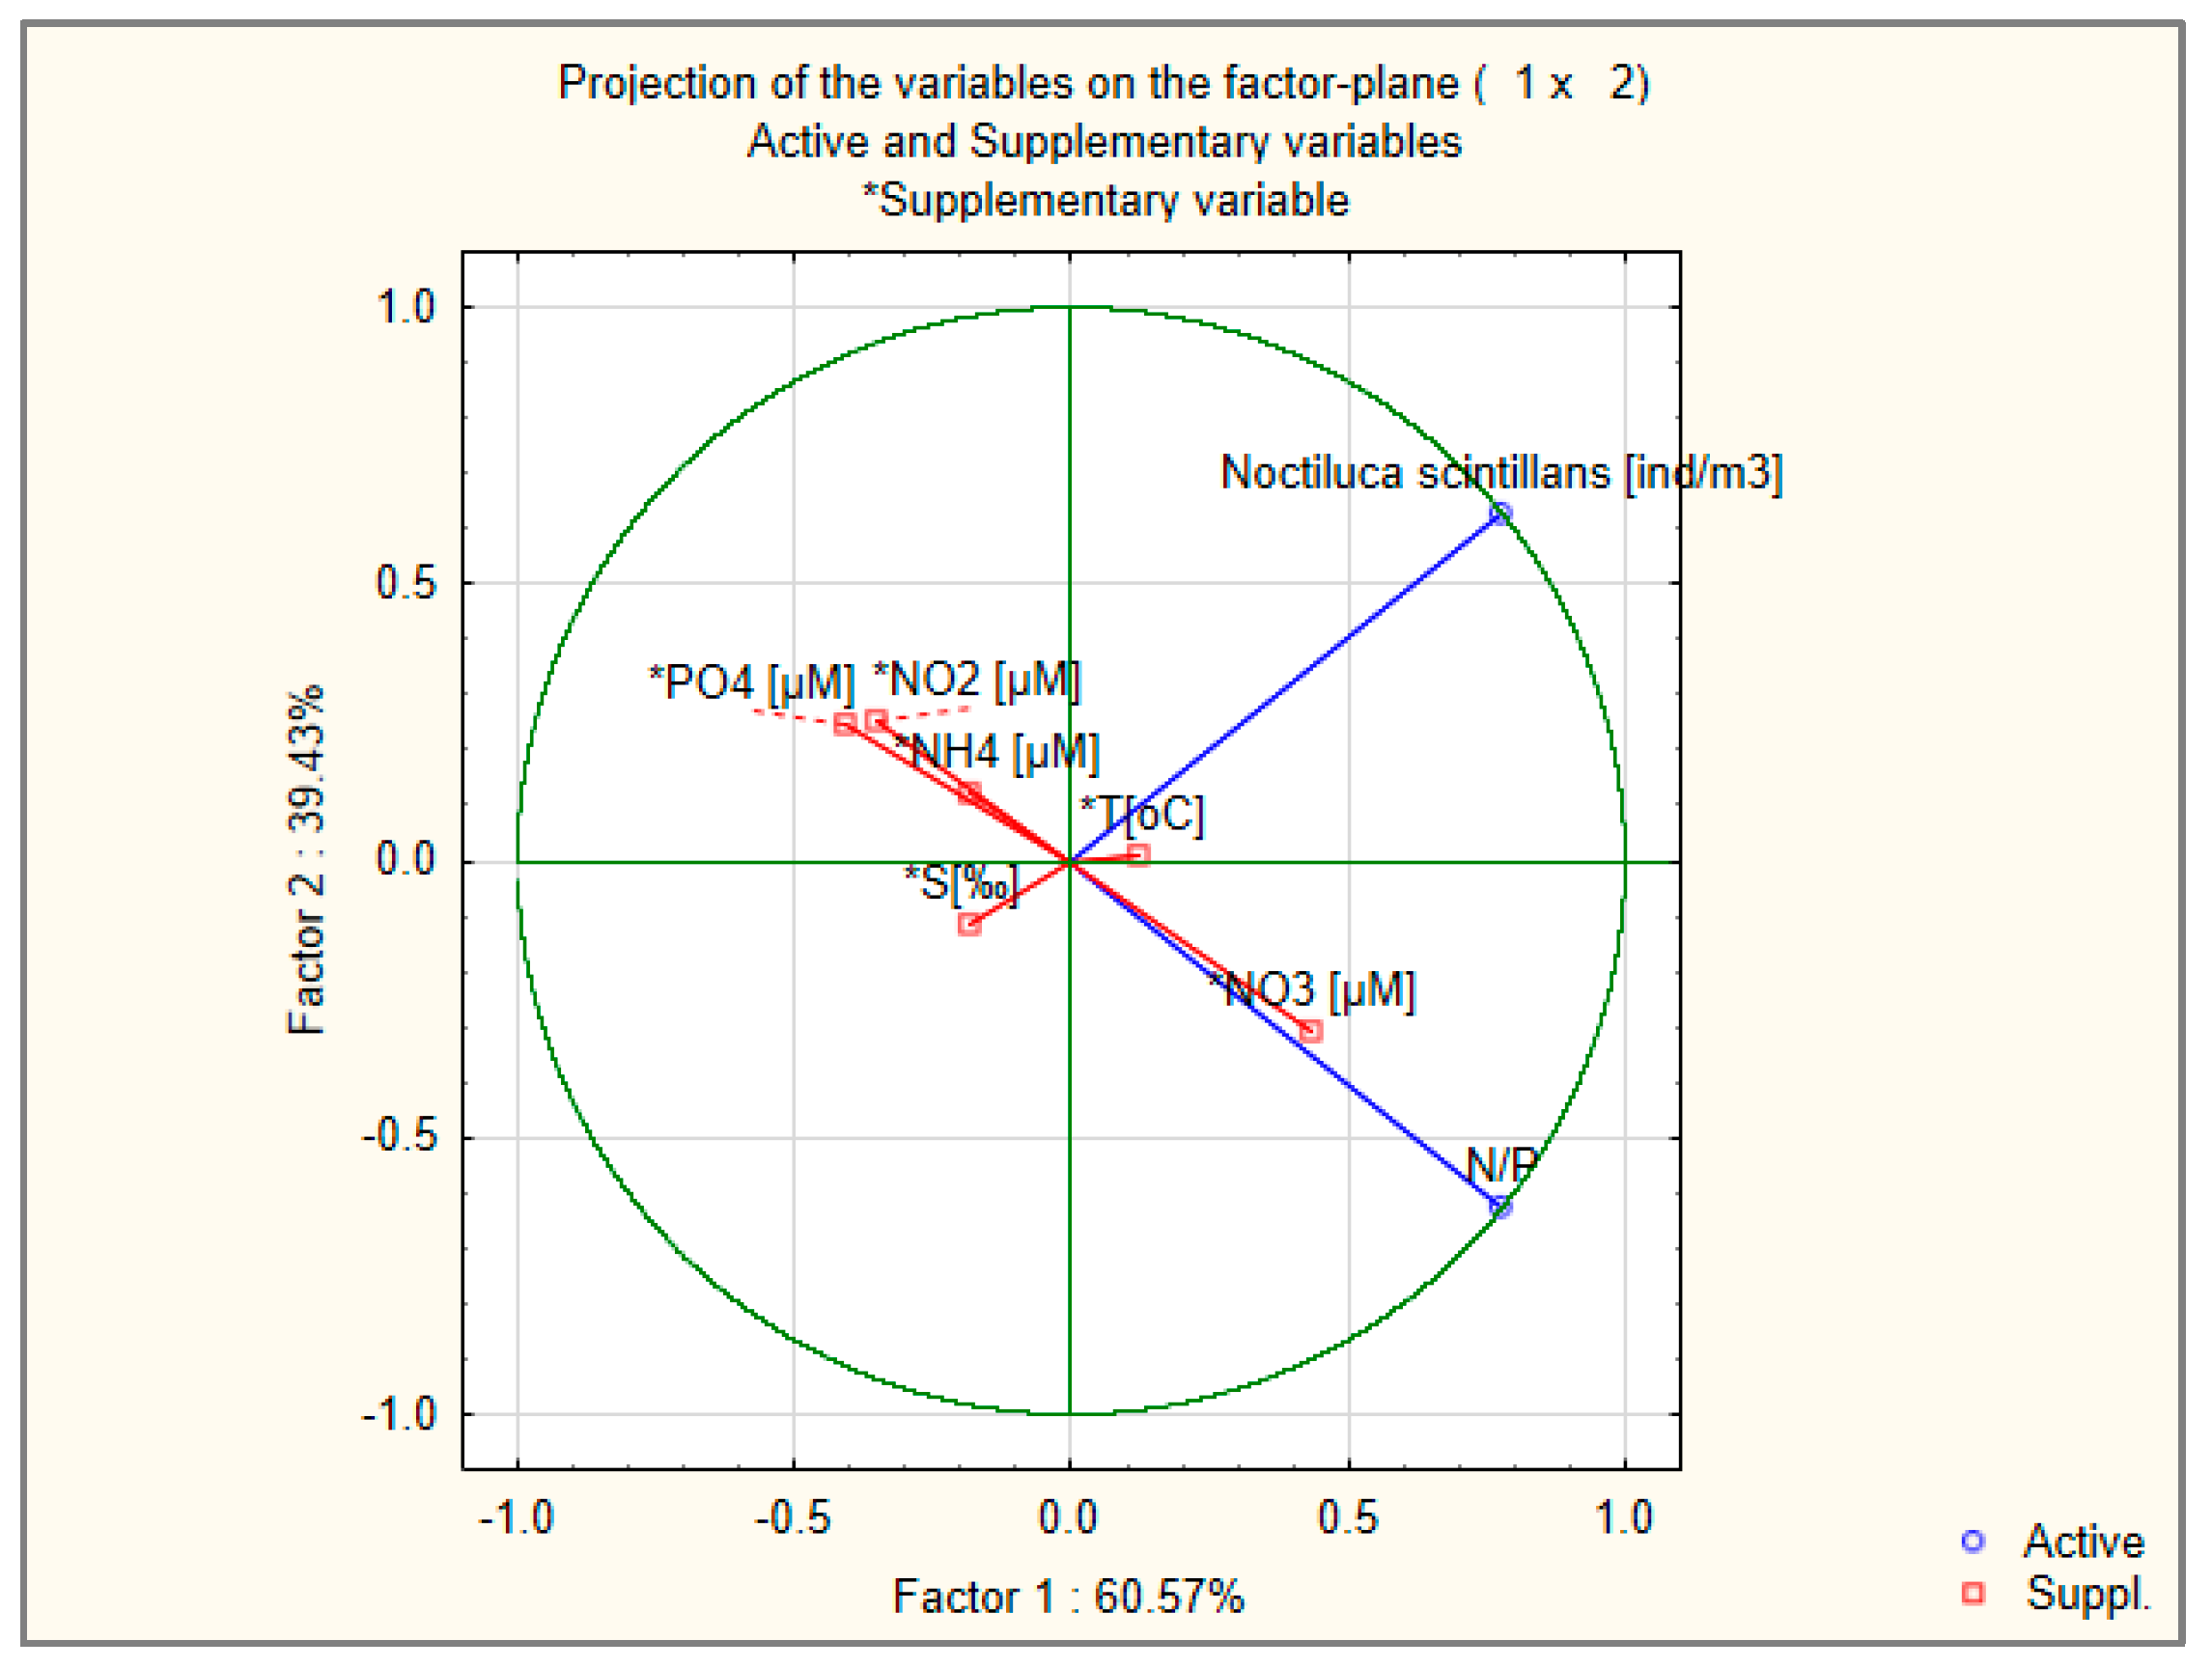
3.5. Harmful Algal Blooms (Noctiluca scintillans)
4. Discussion
5. Conclusions
Supplementary Materials
Author Contributions
Funding
Institutional Review Board Statement
Informed Consent Statement
Data Availability Statement
Conflicts of Interest
References
- Abbass, K.; Qasim, M.Z.; Song, H.; Murshed, M.; Mahmood, H.; Younis, I. A Review of the Global Climate Change Impacts, Adaptation, and Sustainable Mitigation Measures. Environ. Sci. Pollut. Res. 2022, 29, 42539–42559. [Google Scholar] [CrossRef] [PubMed]
- Jeppesen, E.; Moss, B.; Bennion, H.; Carvalho, L.; DeMeester, L.; Feuchtmayr, H.; Friberg, N.; Gessner, M.O.; Hefting, M.; Lauridsen, T.L.; et al. Interaction of Climate Change and Eutrophication. In Climate Change Impacts on Freshwater Ecosystems; Wiley: Hoboken, NJ, USA, 2010; pp. 119–151. [Google Scholar]
- Bennion, H.; Moss, B.; Jeppesen, E.; Carvalho, L.; Demeester, L.; Feuchtmayr, H.; Friberg, N.; Gessner, M.O.; Hefting, M.; Lauridsen, T.L.; et al. Climate Change Impacts on Freshwater Ecosystems; Wiley: Hoboken, NJ, USA, 2010; ISBN 9781405179133. [Google Scholar]
- Smith, W.; Steinberg, D.; Bronk, D.; Tang, K. Marine Plankton Food Webs and Climate Change; William & Mary VIMS: Gloucester Point, VA, USA, 2008; pp. 1–4. [Google Scholar]
- Anderson, J.C.; Craine, I.; Diamond, A.W.; Hansell, R. Impacts of Climate Change and Variability on Unmanaged Ecosystems, Biodiversity, and Wildlife. Can. Ctry. Study Clim. Impacts Adapt. 1998, 7, 121–188. [Google Scholar]
- Mihailov, M.-E.; Ştefan, S.; Diaconu, V.; Lazar, L. Longterm Variability of the Water Mass Structure on the Romanian Black Sea Shelf. Rom. Rep. Phys. 2016, 68, 377–392. [Google Scholar]
- Buga, L.; Mihailov, M.; Malciu, V.; Stefan, S. The Water Mass Variability on the Romanian Black Sea Shelf. EGU Gen. Assem. Conf. Abstr. 2013, 15, 9976. [Google Scholar]
- Stanev, E.V.; Peneva, E.; Chtirkova, B. Climate Change and Regional Ocean Water Mass Disappearance: Case of the Black Sea. J. Geophys. Res. Oceans 2019, 124, 4803–4819. [Google Scholar] [CrossRef]
- Stanev, E.V. Understanding Black Sea Dynamics. Oceanography 2005, 18, 56–75. [Google Scholar] [CrossRef]
- He, Y.; Stanev, E.V.; Yakushev, E.; Staneva, J. Black Sea Biogeochemistry: Response to Decadal Atmospheric Variability during 1960-2000 Inferred from Numerical Modeling. Mar. Environ. Res. 2012, 77, 90–102. [Google Scholar] [CrossRef] [PubMed]
- Panin, N.; Jipa, D. Danube River Sediment Input and Its Interaction with the North-Western Black Sea. Estuar. Coast. Shelf Sci. 2002, 54, 551–562. [Google Scholar] [CrossRef]
- Cozzi, S.; Ibáñez, C.; Lazar, L.; Raimbault, P.; Giani, M. Flow Regime and Nutrient-Loading Trends from the Largest South European Watersheds: Implications for the Productivity of Mediterranean and Black Sea’s Coastal Areas. Water 2019, 11, 1. [Google Scholar] [CrossRef]
- Stewart, R.W. The Role of the Ocean in Climate and Climate Change. In The Global Environment; Springer: Berlin/Heidelberg, Germany, 2017; pp. 118–126. [Google Scholar] [CrossRef]
- Danish Climate Centre. Consequences of Weather and Climate Changes for Marine and Freshwater Ecosystems; Danish Meteorological Institute: Copenhagen, Denmark, 2002.
- Lazar, L.; Vlas, O.; Pantea, E.; Boicenco, L.; Marin, O.; Abaza, V.; Filimon, A.; Bisinicu, E. Black Sea Eutrophication Comparative Analysis of Intensity between Coastal and Offshore Waters. Sustainability 2024, 16, 5146. [Google Scholar] [CrossRef]
- Lazar, L.; Spanu, A.; Boicenco, L.; Oros, A.; Damir, N.; Bisinicu, E.; Abaza, V.; Filimon, A.; Harcota, G.; Marin, O.; et al. Methodology for Prioritizing Marine Environmental Pressures under Various Management Scenarios in the Black Sea. Front. Mar. Sci. 2024, 11, 1388877. [Google Scholar] [CrossRef]
- Bisinicu, E.; Abaza, V.; Boicenco, L.; Adrian, F.; Harcota, G.-E.; Marin, O.; Oros, A.; Pantea, E.; Spinu, A.; Timofte, F.; et al. Spatial Cumulative Assessment of Impact Risk-Implementing Ecosystem-Based Management for Enhanced Sustainability and Biodiversity in the Black Sea. Sustainability 2024, 16, 4449. [Google Scholar] [CrossRef]
- Mee, L.; Friedrich, J.; Gomoiu, M. Restoring the Black Sea in Times of Uncertainty. Oceanography 2005, 18, 100–111. [Google Scholar] [CrossRef]
- Capet, A.; Beckers, J.M.; Grégoire, M. Drivers, Mechanisms and Long-Term Variability of Seasonal Hypoxia on the Black Sea Northwestern Shelf—Is There Any Recovery after Eutrophication? Biogeosciences 2013, 10, 3943–3962. [Google Scholar] [CrossRef]
- Cociasu, A.; Varga, L.; Lazar, L.; Vasiliu, D. Recent Data Concerning the Evolution of the Eutrophication Level Indicators in Romanian Seawater. J. Environ. Prot. Ecol. 2009, 10, 701–730. [Google Scholar]
- Rönnberg, C.; Bonsdorff, E. Baltic Sea Eutrophication: Area-Specific Ecological Consequences. Hydrobiologia 2004, 514, 227–241. [Google Scholar] [CrossRef]
- Le Moal, M.; Gascuel-Odoux, C.; Ménesguen, A.; Souchon, Y.; Étrillard, C.; Levain, A.; Moatar, F.; Pannard, A.; Souchu, P.; Lefebvre, A.; et al. Eutrophication: A New Wine in an Old Bottle? Sci. Total Environ. 2019, 651, 1–11. [Google Scholar] [CrossRef]
- Konovalov, S.K.; Ivanov, L.I.; Murray, J.W.; Eremeeva, L.V. Eutrophication: A Plausible Cause for Changes in Hydrochemical Structure of the Black Sea Anoxic Layer. In Environmental Degradation of the Black Sea: Challenges and Remedies; Springer: Dordrecht, The Netherlands, 1999; pp. 61–74. [Google Scholar]
- Savchuk, O.P.; Wulff, F. Modeling the Baltic Sea Eutrophication in a Decision Support System. Ambio 2007, 36, 141–148. [Google Scholar] [CrossRef] [PubMed]
- Almroth, E.; Skogen, M.D. A North Sea and Baltic Sea Model Ensemble Eutrophication Assessment. Ambio 2010, 39, 59–69. [Google Scholar] [CrossRef]
- Andersen, J.H.; Conley, D.J. Eutrophication in Coastal Marine Ecosystems: Towards Better Understanding and Management Strategies. In Eutrophication in Coastal Ecosystems; Springer: Dordrecht, The Netherlands, 2009; pp. 1–4. [Google Scholar]
- Lancelot, C.; Becquevort, S.; Parent, J.; Breton, E.; Daro, M.; Antajan, E.; Meyer, A.; Ruddick, K. Study and Modeling of Eutrophication-Related Changes in Coastal Planktonic Food-Webs: A Contribution of the AMORE (Advanced Modeling and Research on Eutrophication) Consortium; Federal Science Policy: Brussels, Belgium, 2003; pp. 1–70. [Google Scholar]
- Nixon, S.W. Coastal Marine Eutrophication: A Definition, Social Causes, and Future Concerns. Ophelia 1995, 41, 199–219. [Google Scholar] [CrossRef]
- Andersen, J.H.; Schlüter, L.; Ærtebjerg, G. Coastal Eutrophication: Recent Developments in Definitions and Implications for Monitoring Strategies. J. Plankton Res. 2006, 28, 621–628. [Google Scholar] [CrossRef]
- Solidoro, C.; Bastianini, M.; Bandelj, V.; Codermatz, R.; Cossarini, G.; Melaku Canu, D.; Ravagnan, E.; Salon, S.; Trevisani, S. Current State, Scales of Variability, and Trends of Biogeochemical Properties in the Northern Adriatic Sea. J. Geophys. Res. Oceans 2009, 114. [Google Scholar] [CrossRef]
- IPCC. Climate Change 2014: Synthesis Report. Contribution of Working Groups I, II and III to the Fifth Assessment Report of the Intergovernmental Panel on Climate Change; IPCC: Geneva, Switzerland, 2014. [Google Scholar]
- Sharples, J.; Middelburg, J.J.; Fennel, K.; Jickells, T.D. What Proportion of Riverine Nutrients Reaches the Open Ocean? Glob. Biogeochem Cycles 2017, 31, 39–58. [Google Scholar] [CrossRef]
- Seitzinger, S.P.; Mayorga, E.; Bouwman, A.F.; Kroeze, C.; Beusen, A.H.W.; Billen, G.; Van Drecht, G.; Dumont, E.; Fekete, B.M.; Garnier, J.; et al. Global River Nutrient Export: A Scenario Analysis of Past and Future Trends. Glob. Biogeochem Cycles 2010, 24. [Google Scholar] [CrossRef]
- Parr, W.; Volovik, Y.; Nixon, S.; Lipan, I. Improving the Understanding of the Danube River Impact on the Status of the Black Sea; UNDP-GEF Black Sea Ecosystem Recovery Project Report to the Black Sea-Danube Technical Working Group: Istanbul, Turkey, 2005. [Google Scholar]
- Daskalov, G.M.; Boicenco, L.; Grishin, A.N.; Lazar, L.; Mihneva, V.; Shlyakhov, V.A.; Zengin, M. Architecture of Collapse: Regime Shift and Recovery in an Hierarchically Structured Marine Ecosystem. Glob. Change Biol. 2017, 23, 1486–1498. [Google Scholar] [CrossRef] [PubMed]
- Daskalov, G.M. Long-Term Changes in Fish Abundance and Environmental Indices in the Black Sea. Mar. Ecol. Prog. Ser. 2003, 255, 259–270. [Google Scholar] [CrossRef]
- Grasshoff, K.; Kremling, K.; Ehrhardt, M. Methods of Seawater Analysis, 3rd ed.; Wiley-VCH Verlag GmbH: Hoboken, NJ, USA, 1999; ISBN 3527295895. [Google Scholar]
- Mullin, J.B.; Riley, J.P. The Spectrophotometric Determination of Nitrate in Natural Waters, with Particular Reference to Sea-Water. Anal. Chim. Acta 1955, 12, 464–480. [Google Scholar] [CrossRef]
- Alexandrov, B.; Arashkevich, E.; Gubanova, A.; Korshenko, A. Manual for Mesozooplankton Sampling and Analysis in the Black Sea Monitoring; Black Sea Commission: Istanbul, Turkey, 2014. [Google Scholar]
- Petipa, T.S. On the Mean Weight of the Principle Forms of Zooplankton in the Black Sea. Sevast. Biol. Stn. 1957, 9, 39–57. [Google Scholar]
- TIBCO Software, Version 14.0.1.25 2023; TIBCO Inc.: Palo Alto, CA, USA, 2023.
- Gorley, R.N.; Somerfield, P.J.; Warwick, R. Change in Marine Communities: An Approach to Statistical Analysis, 3rd ed.; PRIMER-E: Plymouth, UK, 2014. [Google Scholar]
- Cociasu, A.; Popa, L. Significant Changes in Danube Nutrient Loads and Their Impact on the Romanian Black Sea Coastal Waters. Cercet. Mar. 2005, 35, 25–37. [Google Scholar]
- Havens, K.E.; James, R.T.; East, T.L.; Smith, V.H. N:P Ratios, Light Limitation, and Cyanobacterial Dominance in a Subtropical Lake Impacted by Non-Point Source Nutrient Pollution. Environ. Pollut. 2003, 122, 379–390. [Google Scholar] [CrossRef]
- Devlin, M.; Brodie, J. Nutrients and Eutrophication. In Marine Pollution—Monitoring, Management and Mitigation; Springer: Cham, Switzerland, 2023; pp. 75–100. [Google Scholar]
- Heisler, J.; Glibert, P.M.; Burkholder, J.M.; Anderson, D.M.; Cochlan, W.; Dennison, W.C.; Dortch, Q.; Gobler, C.J.; Heil, C.A.; Humphries, E.; et al. Eutrophication and Harmful Algal Blooms: A Scientific Consensus. Harmful Algae 2008, 8, 3–13. [Google Scholar] [CrossRef] [PubMed]
- Lan, J.; Liu, P.; Hu, X.; Zhu, S. Harmful Algal Blooms in Eutrophic Marine Environments: Causes, Monitoring, and Treatment. Water 2024, 16, 2525. [Google Scholar] [CrossRef]
- Bișinicu, E.; Lazăr, L.; Timofte, F. Dynamics of Zooplankton along the Romanian Black Sea Coastline: Temporal Variation, Community Structure, and Environmental Drivers. Diversity 2023, 15, 1024. [Google Scholar] [CrossRef]
- Bisinicu, E.; Harcota, G.E.; Lazar, L. Interactions between Environmental Factors and the Mesozooplankton Community from the Romanian Black Sea Waters. Turk. J. Zool. 2023, 47, 202–215. [Google Scholar] [CrossRef]
- European Commission. Commission Decision (EU) 2017/848 of 17 May 2017 Laying down Criteria and Methodological Standards on Good Environmental Status of Marine Waters and Specifications and Standardised Methods for Monitoring and Assessment, and Repealing Decision 2010/477/EU. Off. J. Eur. Union 2017, 125, 43–74. [Google Scholar]
- Jeppesen, E.; Beklioğlu, M.; Özkan, K.; Akyürek, Z. Salinization Increase Due to Climate Change Will Have Substantial Negative Effects on Inland Waters: A Call for Multifaceted Research at the Local and Global Scale. Innovation 2020, 1, 100030. [Google Scholar] [CrossRef]
- Bal, A.; Panda, F.; Pati, S.G.; Anwar, T.N.; Das, K.; Paital, B. Influence of Anthropogenic Activities on Redox Regulation and Oxidative Stress Responses in Different Phyla of Animals in Coastal Water via Changing in Salinity. Water 2022, 14, 4026. [Google Scholar] [CrossRef]
- Egge, J.K.; Aksnes, D.L. Silicate as Regulating Nutrient in Phytoplankton Competition. Mar. Ecol. Prog. Ser. 1992, 83, 281–289. [Google Scholar] [CrossRef]
- Gilpin, L.C.; Davidson, K.; Roberts, E. The Influence of Changes in Nitrogen: Silicon Ratios on Diatom Growth Dynamics. J. Sea Res. 2004, 51, 21–35. [Google Scholar] [CrossRef]
- Davis, C.O. Continuous Culture of Marine Diatoms under Silicate Limitation, Effect of Light Intensity on Growth and Nutrient Uptake of Skeletonema Costatum. J. Phycol. 1976, 12, 291–300. [Google Scholar] [CrossRef]
- Turner, R.E.; Justić, D.; Shaw, R.F.; Cope, J.; Qureshi, N.; Rabalais, N.N.; Dortch, Q. Fluctuating Silicate: Nitrate Ratios and Coastal Plankton Food Webs. Proc. Natl. Acad. Sci. USA 1998, 95, 13048–13051. [Google Scholar] [CrossRef] [PubMed]
- Das, K.; Ray, S. Effect of Delay on Nutrient Cycling in Phytoplankton-Zooplankton Interactions in Estuarine System. Ecol. Model. 2008, 215, 69–76. [Google Scholar] [CrossRef]
- Bișinicu, E.; Boicenco, L.; Pantea, E.; Timofte, F.; Lazăr, L.; Vlas, O. Qualitative Model of the Causal Interactions between Phytoplankton, Zooplankton, and Environmental Factors in the Romanian Black Sea. Phycology 2024, 4, 168–189. [Google Scholar] [CrossRef]
- Winder, M.; Sommer, U. Phytoplankton Response to a Changing Climate. Hydrobiologia 2012, 698, 5–16. [Google Scholar] [CrossRef]
- Johnson, T.; Butcher, J.; Santell, S.; Schwartz, S.; Julius, S.; LeDuc, S. A Review of Climate Change Effects on Practices for Mitigating Water Quality Impacts. J. Water Clim. Change 2022, 13, 1684–1705. [Google Scholar] [CrossRef]
- Wang, H.; Liu, J.; Klaar, M.; Chen, A.; Gudmundsson, L.; Holden, J. Anthropogenic Climate Change Has Influenced Global River Flow Seasonality. Science 2024, 383, 1009–1014. [Google Scholar] [CrossRef]
- Nohara, D.; Kitoh, A.; Hosaka, M.; Oki, T. Impact of Climate Change on River Discharge Projected by Multimodel Ensemble. J. Hydrometeorol. 2006, 7, 1076–1089. [Google Scholar] [CrossRef]
- Shin, S.; Her, Y.; Muñoz-Carpena, R.; Yu, X.; Martinez, C.; Singh, A. Climate Change Impacts on Water Quantity and Quality of a Watershed-Lake System Using a Spatially Integrated Modeling Framework in the Kissimmee River—Lake Okeechobee System. J. Hydrol. Reg. Stud. 2023, 47, 101408. [Google Scholar] [CrossRef]
- Converti, A.; Casazza, A.A.; Ortiz, E.Y.; Perego, P.; Borghi, M. Del Nitrogen Metabolism in Phytoplankton. Chem. Eng. Process. Process Intensif. 2009, 48, 1146–1151. [Google Scholar] [CrossRef]
- Tilman, D.; Kilham, S.S.; Kilham, P. Phytoplankton Community Ecology: The Role of Limiting Nutrients. Annu. Rev. Ecol. Syst. 2003, 13, 349–372. [Google Scholar] [CrossRef]
- Silkin, V.A.; Pautova, L.A.; Giordano, M.; Chasovnikov, V.K.; Vostokov, S.V.; Podymov, O.I.; Pakhomova, S.V.; Moskalenko, L.V. Drivers of Phytoplankton Blooms in the Northeastern Black Sea. Mar. Pollut. Bull. 2019, 138, 274–284. [Google Scholar] [CrossRef] [PubMed]
- Berthold, M.; Karsten, U.; von Weber, M.; Bachor, A.; Schumann, R. Phytoplankton Can Bypass Nutrient Reductions in Eutrophic Coastal Water Bodies. Ambio 2018, 47, 146–158. [Google Scholar] [CrossRef]
- Cloern, J.E.; Jassby, A.D. Patterns and Scales of Phytoplankton Variability in Estuarine-Coastal Ecosystems. Estuaries Coasts 2010, 33, 230–241. [Google Scholar] [CrossRef]
- Dongfang, Y.; Zhenhui, G.; Yu, C.; Peigang, W.; Peiyan, S. Influence of Seawater Temperature on Phytoplankton Growth in Jiaozhou Bay, China. Chin. J. Oceanol. Limnol. 2004, 22, 166–175. [Google Scholar] [CrossRef]
- Peter, K.H.; Sommer, U. Interactive Effect of Warming, Nitrogen and Phosphorus Limitation on Phytoplankton Cell Size. Ecol. Evol. 2015, 5, 1011–1024. [Google Scholar] [CrossRef]
- Mikaelyan, A.S.; Kubryakov, A.A.; Silkin, V.A.; Pautova, L.A.; Chasovnikov, V.K. Regional Climate and Patterns of Phytoplankton Annual Succession in the Open Waters of the Black Sea. Deep Sea Res. Part 1 Oceanogr. Res. Pap. 2018, 142, 44–57. [Google Scholar] [CrossRef]
- Ptacnik, R.; Andersen, T.; Tamminen, T. Performance of the Redfield Ratio and a Family of Nutrient Limitation Indicators as Thresholds for Phytoplankton N vs. P Limitation. Ecosystems 2010, 13, 1201–1214. [Google Scholar] [CrossRef]
- Durisch-Kaiser, E.; Pavel, A.; Doberer, A.; Reutimann, J.; Balan, S.; Sobek, S.; Rădan, S.; Wehrli, B. Nutrient Retention, Total N and P Export, and Greenhouse Gas Emission from the Danube Delta Lakes. Geoecomarina 2008, 14, 81–90. [Google Scholar] [CrossRef]
- Zaitsev, Y.P.; Alexandrov, B.G.; Berlinsky, N.A.; Zenetos, A. Seas around Europe: The Black Sea: An Oxygen-Poor Sea. Europe’s Biodiversity: Biogeographical Regions and Seas; European Environment Agency: Copenhagen, Denmark, 2002.
- Sorokin, Y.I. The Black Sea: Ecology and Oceanography. Biology of Inland Waters; Backhuys Publishers: Leiden, The Netherlands, 2002. [Google Scholar]
- Kudela, R.M.; Seeyave, S.; Cochlan, W.P. The Role of Nutrients in Regulation and Promotion of Harmful Algal Blooms in Upwelling Systems. Prog. Oceanogr. 2010, 85, 122–135. [Google Scholar] [CrossRef]
- Smetacek, V. Coastal Eutrophication: Causes and Consequences. In Ocean Margin Processes in Global Change; Wiley: Hoboken, NJ, USA, 1991; pp. 251–280. [Google Scholar]
- Akinnawo, S.O. Eutrophication: Causes, Consequences, Physical, Chemical and Biological Techniques for Mitigation Strategies. Environ. Chall. 2023, 12, 100733. [Google Scholar] [CrossRef]
- Moschonas, G.; Gowen, R.J.; Paterson, R.F.; Mitchell, E.; Stewart, B.M.; McNeill, S.; Glibert, P.M.; Davidson, K. Nitrogen Dynamics and Phytoplankton Community Structure: The Role of Organic Nutrients. Biogeochemistry 2017, 134, 125–145. [Google Scholar] [CrossRef]
- Yilmaz, A.; East, M.; Sciences, M.; Box, P.O. Primary Production, Availability/Uptake of Nutrients and Photo-Adaptation of Phytoplankton in Three Interconnected Regional Seas: Black Sea, Sea of Marmara and Eastern Mediterranean. In Proceedings of the JGOFS, Open Science Conference, Ocean Biogeochemistry: A New Paradigm, Bergen, Norway, 13–17 April 2000; p. 76. [Google Scholar]
- Lazar, L.; Boicenco, L.; Pantea, E.; Timofte, F.; Vlas, O.; Bișinicu, E. Modeling Dynamic Processes in the Black Sea Pelagic Habitat—Causal Connections between Abiotic and Biotic Factors in Two Climate Change Scenarios. Sustainability 2024, 16, 1849. [Google Scholar] [CrossRef]
- Wells, M.L.; Karlson, B.; Wulff, A.; Kudela, R.; Trick, C.; Asnaghi, V.; Berdalet, E.; Cochlan, W.; Davidson, K.; De Rijcke, M.; et al. Future HAB Science: Directions and Challenges in a Changing Climate. Harmful Algae 2020, 91, 101632. [Google Scholar] [CrossRef] [PubMed]
- Aytan, U.; Senturk, Y. Dynamics of Noctiluca scintillans (Macartney) Kofoid & Swezy and Its Contribution to Mesozooplankton in the Southeastern Black Sea. Aquat. Sci. Eng. 2018, 33, 84–89. [Google Scholar] [CrossRef]
- Tada, K.; Plthakpol, S.; Shigeru, M. Seasonal Variation in the Abundance of Noctiluca scintillans in the Seto Inland Sea, Japan. Plankton Biol. Ecol 2004, 51, 7–14. [Google Scholar]
- Ollevier, A.; Mortelmans, J.; Aubert, A.; Deneudt, K.; Vandegehuchte, M.B. Noctiluca scintillans: Dynamics, Size Measurements and Relationships with Small Soft-Bodied Plankton in the Belgian Part of the North Sea. Front. Mar. Sci. 2021, 8, 777999. [Google Scholar] [CrossRef]
- International Commission for the Protection of the Danube River (ICPDR). Document IC/084; ICPDR: Vienna, Australia, 2005. [Google Scholar]
- Danube Delta Integrated Sustainable Development Strategy. In The Danube River Delta; Environmental Report; Springer: Cham, Switzerland, 2022.
- Zessner, M.; Van Gils, J. Nutrient Fluxes from the Danube Basin to the Black Sea. Water Sci. Technol. 2002, 46, 9–17. [Google Scholar] [CrossRef] [PubMed]
- Gillanders, B.; Kingsford, M. Impact of Changes in Flow of Freshwater on Estuarine and Open Coastal Habitats and the Associated Organisms. Oceanogr. Mar. Biol. Annu. Rev. 2002, 40, 233–309. [Google Scholar]
- Ludwig, W.; Dumont, E.; Meybeck, M.; Heussner, S. River Discharges of Water and Nutrients to the Mediterranean and Black Sea: Major Drivers for Ecosystem Changes during Past and Future Decades? Prog. Oceanogr. 2009, 80, 199–217. [Google Scholar] [CrossRef]
- Sharpley, A.N.; Kleinman, P.J.A.; Flaten, D.N.; Buda, A.R. Critical Source Area Management of Agricultural Phosphorus: Experiences, Challenges and Opportunities. Water Sci. Technol. 2011, 64, 945–952. [Google Scholar] [CrossRef]
- Savic, R.; Stajic, M.; Blagojević, B.; Bezdan, A.; Vranesevic, M.; Nikolić Jokanović, V.; Baumgertel, A.; Bubalo Kovačić, M.; Horvatinec, J.; Ondrasek, G. Nitrogen and Phosphorus Concentrations and Their Ratios as Indicators of Water Quality and Eutrophication of the Hydro-System Danube–Tisza–Danube. Agriculture 2022, 12, 935. [Google Scholar] [CrossRef]
- Bijay-Singh; Craswell, E. Fertilizers and Nitrate Pollution of Surface and Ground Water: An Increasingly Pervasive Global Problem. SN Appl. Sci. 2021, 3, 518. [Google Scholar] [CrossRef]
- Mavrommati, G.; Bithas, K.; Panayiotidis, P. Operationalizing Sustainability in Urban Coastal Systems: A System Dynamics Analysis. Water Res. 2013, 47, 7235–7250. [Google Scholar] [CrossRef]
- National Research Council; Commission on Geosciences, Water Science, Technology Board, Ocean Studies Board; Committee on the Causes & Management of Coastal Eutrophication. Clean Coastal Waters: Understanding and Reducing the Effects of Nutrient Pollution; National Academies Press: Cambridge, MA, USA, 2000.
- Danube Pollution Reduction Program: Causes and Effects of Eutrophication Summary Report. 1999. Available online: https://www.icpdr.org/sites/default/files/CAUSES_AND_EFFECTS_OF_EUTROPHICATION_IN_THE_BLACK_SEA.pdf (accessed on 15 January 2024).
- Delibas, A. Towards a Shared Understanding of Nutrient Pollution in Cape Cod’s Coastal Waters. In Proceedings of the 32nd International Conference of the System Dynamics Society, Delft, The Netherlands, 20–24 July 2014. [Google Scholar]
- Rovira, J.; Pardo, P. Nutrient Pollution of Waters: Eutrophication Trends in European Marine and Coastal Environments. Contrib. Sci. 2006, 3, 181–186. [Google Scholar] [CrossRef]


| N = 64 | Regression Summary for Dependent Variable: T[oC] | |||||
|---|---|---|---|---|---|---|
| R = 0.59483613 R2 = 0.35383003 Adjusted R2 = 0.34340793 F(1,62) = 33.950 p < 0.00000 Std.Error of Estimate: 94304 | ||||||
| b* | Std.Err. of b* | b | Std.Err. of b | t(62) | p-Value | |
| Intercept | −61.504 | 12.709 | −4.839 | 0.000009 | ||
| Year | 0.595 | 0.102 | 0.037 | 0.006 | 5.827 | 0 |
| N = 64 | Regression Summary for Dependent Variable: O2 [mg/L] R= 0.58251671 R2= 0.33932572 Adjusted R2= 0.32866968 F(1,62) = 31.844 p < 0.00000 Std.Error of Estimate: 0.63715 | |||||
|---|---|---|---|---|---|---|
| b* | Std.Err. of b* | b | Std.Err. of b | t(62) | p-Value | |
| Intercept | 58.752 | 8.586 | 6.842 | 0 | ||
| Year | −0.583 | 0.103 | −0.024 | 0.004 | −5.643 | 0 |
| N = 29 | Regression Summary for Dependent Variable: N. scintillans [ind/m3] R = 0.54865601 R2 = 0.30102342 Adjusted R2 = 0.02143279 F(8,20) = 1.0767 | |||||
|---|---|---|---|---|---|---|
| b* | Std.Err. of b* | b | Std.Err. of b | t(20) | p-Value | |
| Intercept | 99,259.44 | 104,695 | 0.94808 | 0.354403 | ||
| T [°C] | 0.482 | 0.469 | 1862.24 | 1813 | 1.027 | 0.31661 |
| S [‰] | −0.401 | 0.244 | −9065.06 | 5513.4 | −1.644 | 0.115765 |
| PO4 [µM] | −0.133 | 0.296 | −2817.5 | 6266.7 | −0.45 | 0.657837 |
| SiO4 [µM] | 0.598 | 0.474 | 2163.67 | 1714.7 | 1.262 | 0.221528 |
| NO3 [µM] | −0.796 | 0.437 | −3868.4 | 2121.6 | −1.823 | 0.083233 |
| NO2 [µM] | 0.269 | 0.312 | 22,904.15 | 26,642.3 | 0.86 | 0.400148 |
| N/P | 0.78 | 0.341 | 394.42 | 172.4 | 2.288 | 0.033147 |
| NH4 [µM] | 0.004 | 0.22 | 30.02 | 2100.9 | 0.014 | 0.988739 |
| Variable | Factor-Variable Correlations (Factor Loadings), Based on Correlations Active and Supplementary Variables *Supplementary Variable | |
|---|---|---|
| Factor 1 | Factor 2 | |
| N/P | 0.778283 | 0.627914 |
| N. scintillans [ind/m3] | 0.778283 | −0.627914 |
| *T [°C] | 0.124689 | 0.010839 |
| *S [‰] | −0.18465 | −0.115939 |
| *PO4 [µM] | −0.408249 | 0.246615 |
| *NO3 [µM] | 0.435026 | −0.305593 |
| *NO2 [µM] | −0.351395 | 0.254426 |
| *NH4 [µM] | −0.181113 | 0.124353 |
Disclaimer/Publisher’s Note: The statements, opinions and data contained in all publications are solely those of the individual author(s) and contributor(s) and not of MDPI and/or the editor(s). MDPI and/or the editor(s) disclaim responsibility for any injury to people or property resulting from any ideas, methods, instructions or products referred to in the content. |
© 2025 by the authors. Licensee MDPI, Basel, Switzerland. This article is an open access article distributed under the terms and conditions of the Creative Commons Attribution (CC BY) license (https://creativecommons.org/licenses/by/4.0/).
Share and Cite
Ristea, E.; Bisinicu, E.; Lavric, V.; Parvulescu, O.C.; Lazar, L. A Long-Term Perspective of Seasonal Shifts in Nutrient Dynamics and Eutrophication in the Romanian Black Sea Coast. Sustainability 2025, 17, 1090. https://doi.org/10.3390/su17031090
Ristea E, Bisinicu E, Lavric V, Parvulescu OC, Lazar L. A Long-Term Perspective of Seasonal Shifts in Nutrient Dynamics and Eutrophication in the Romanian Black Sea Coast. Sustainability. 2025; 17(3):1090. https://doi.org/10.3390/su17031090
Chicago/Turabian StyleRistea, Elena, Elena Bisinicu, Vasile Lavric, Oana Cristina Parvulescu, and Luminita Lazar. 2025. "A Long-Term Perspective of Seasonal Shifts in Nutrient Dynamics and Eutrophication in the Romanian Black Sea Coast" Sustainability 17, no. 3: 1090. https://doi.org/10.3390/su17031090
APA StyleRistea, E., Bisinicu, E., Lavric, V., Parvulescu, O. C., & Lazar, L. (2025). A Long-Term Perspective of Seasonal Shifts in Nutrient Dynamics and Eutrophication in the Romanian Black Sea Coast. Sustainability, 17(3), 1090. https://doi.org/10.3390/su17031090