
Economic Loss and Ecosystem Service Decline in Mediterranean Ponds (Andalusia, Spain): The Impact of Olive Groves over the Last 20 Years

 ,
,  , and
, and 
Abstract
1. Introduction
2. Materials and Methods
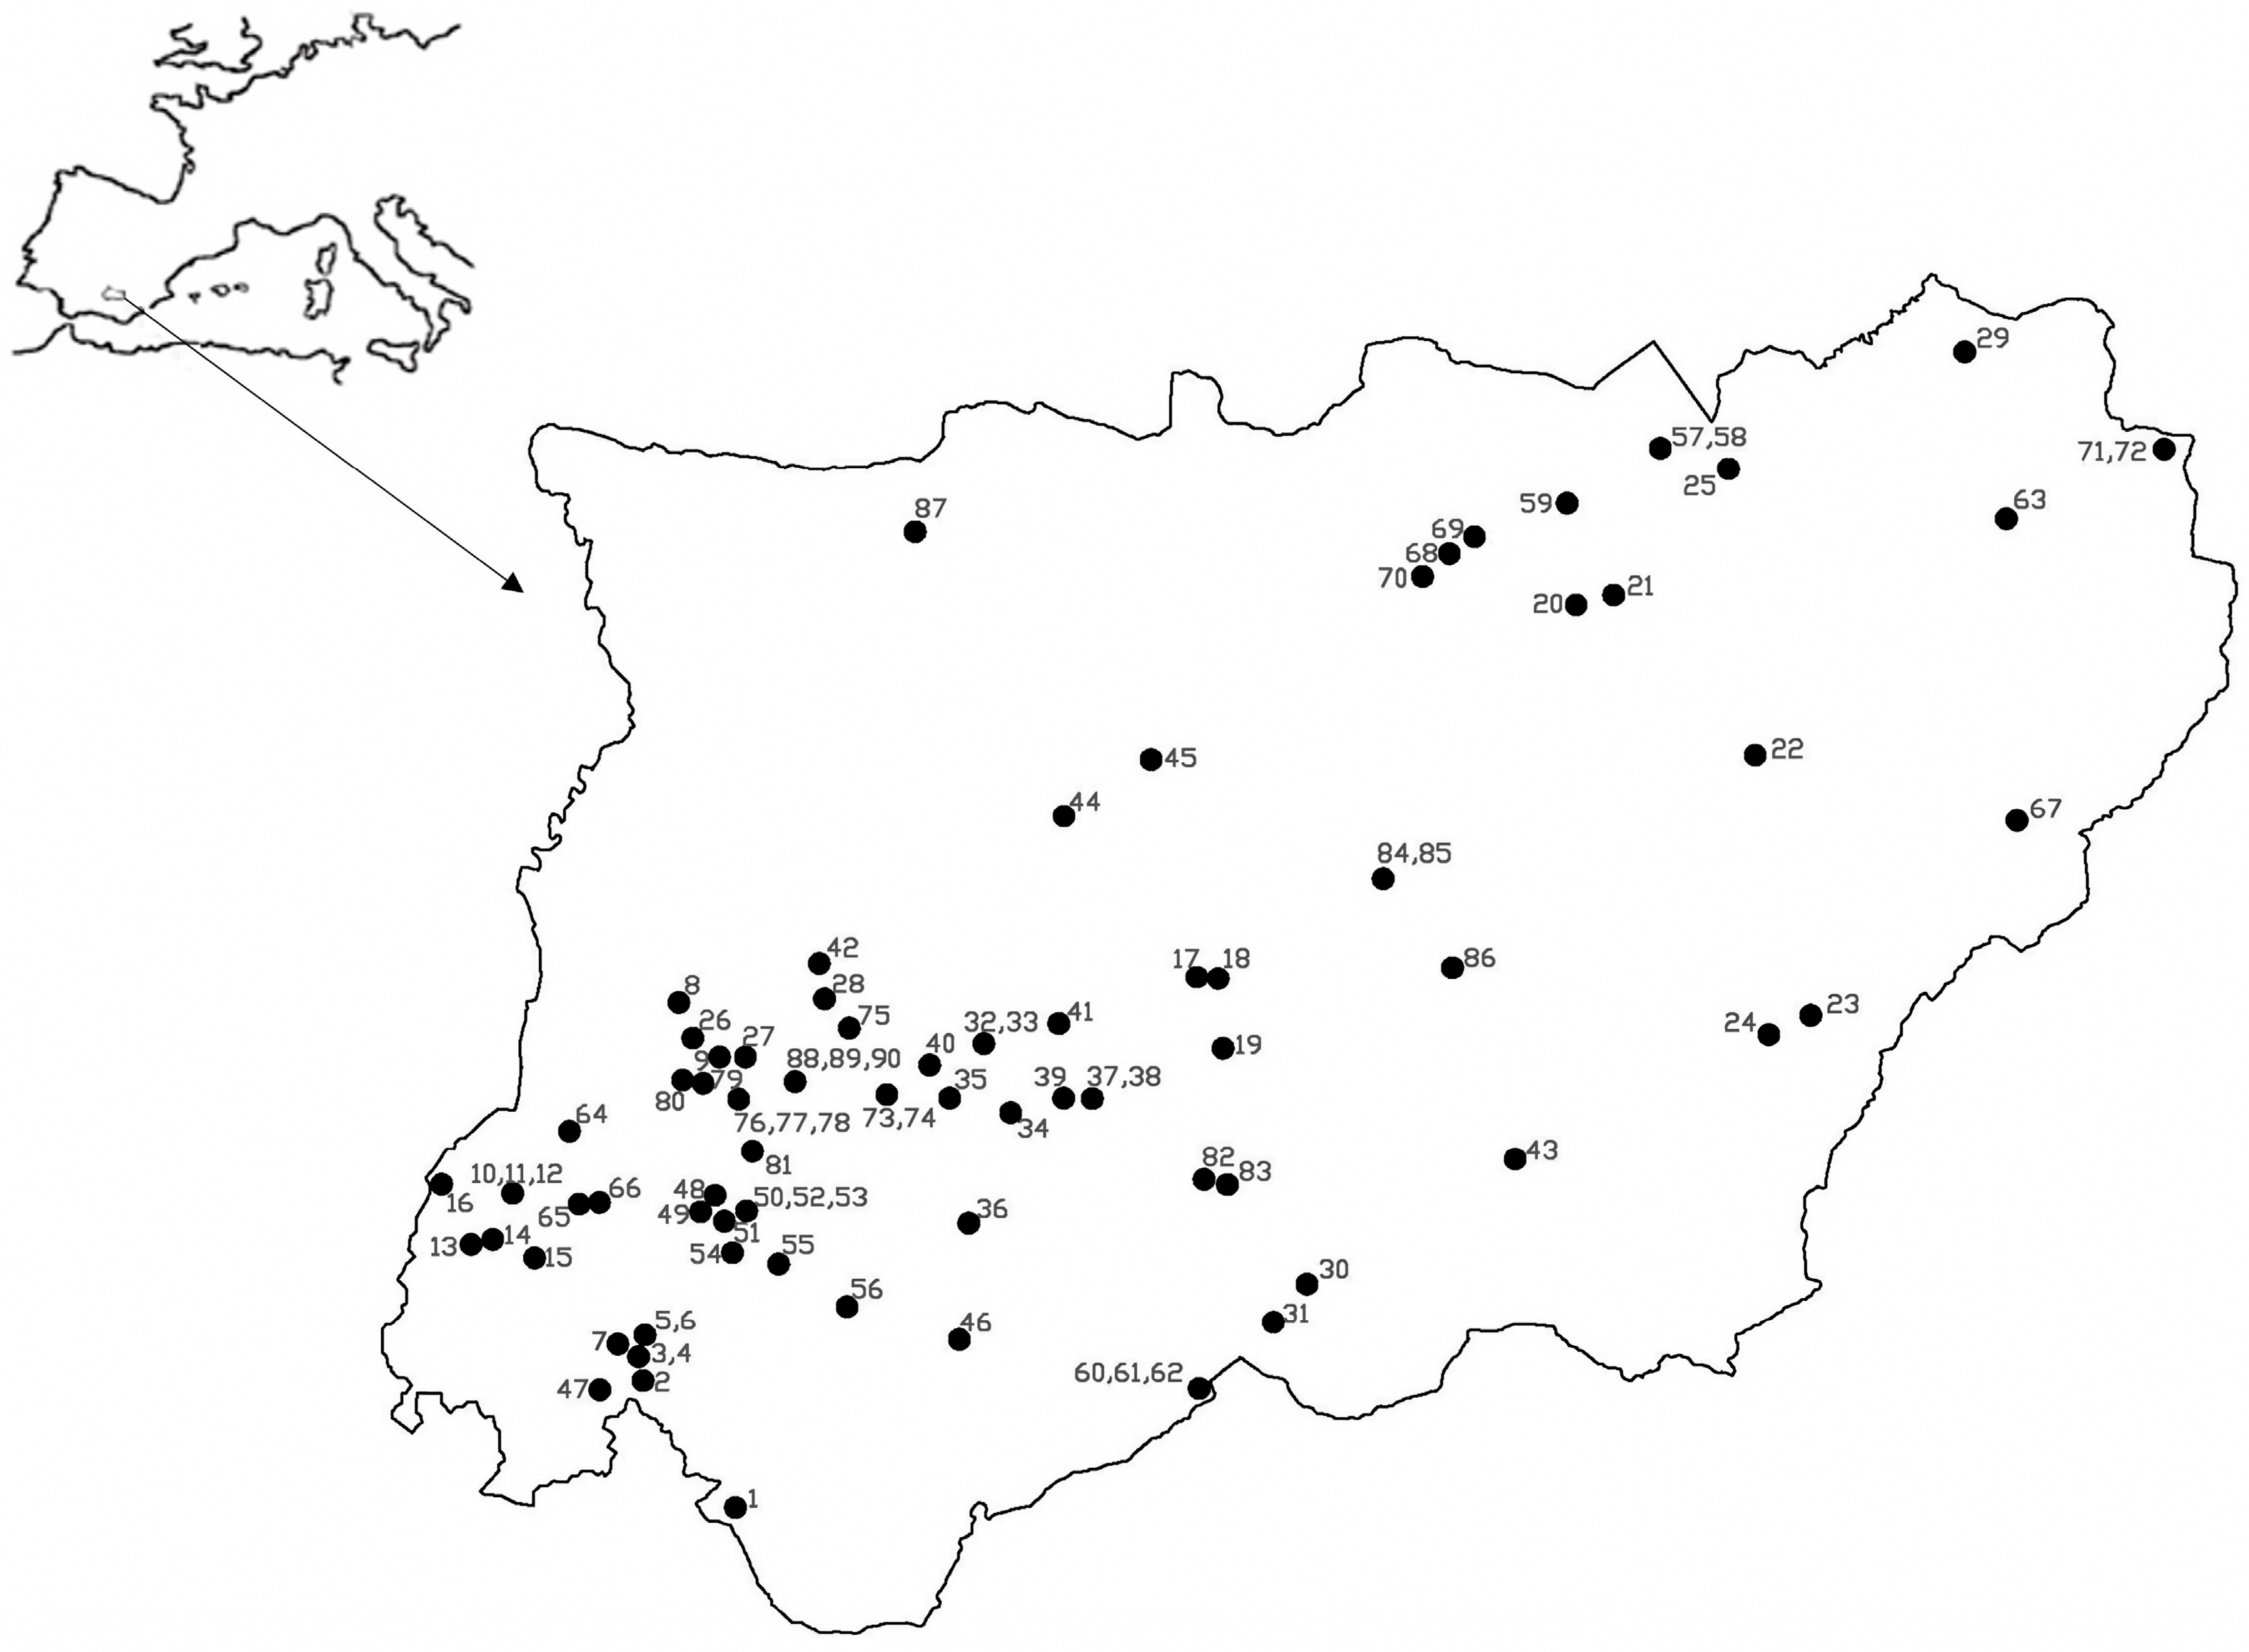
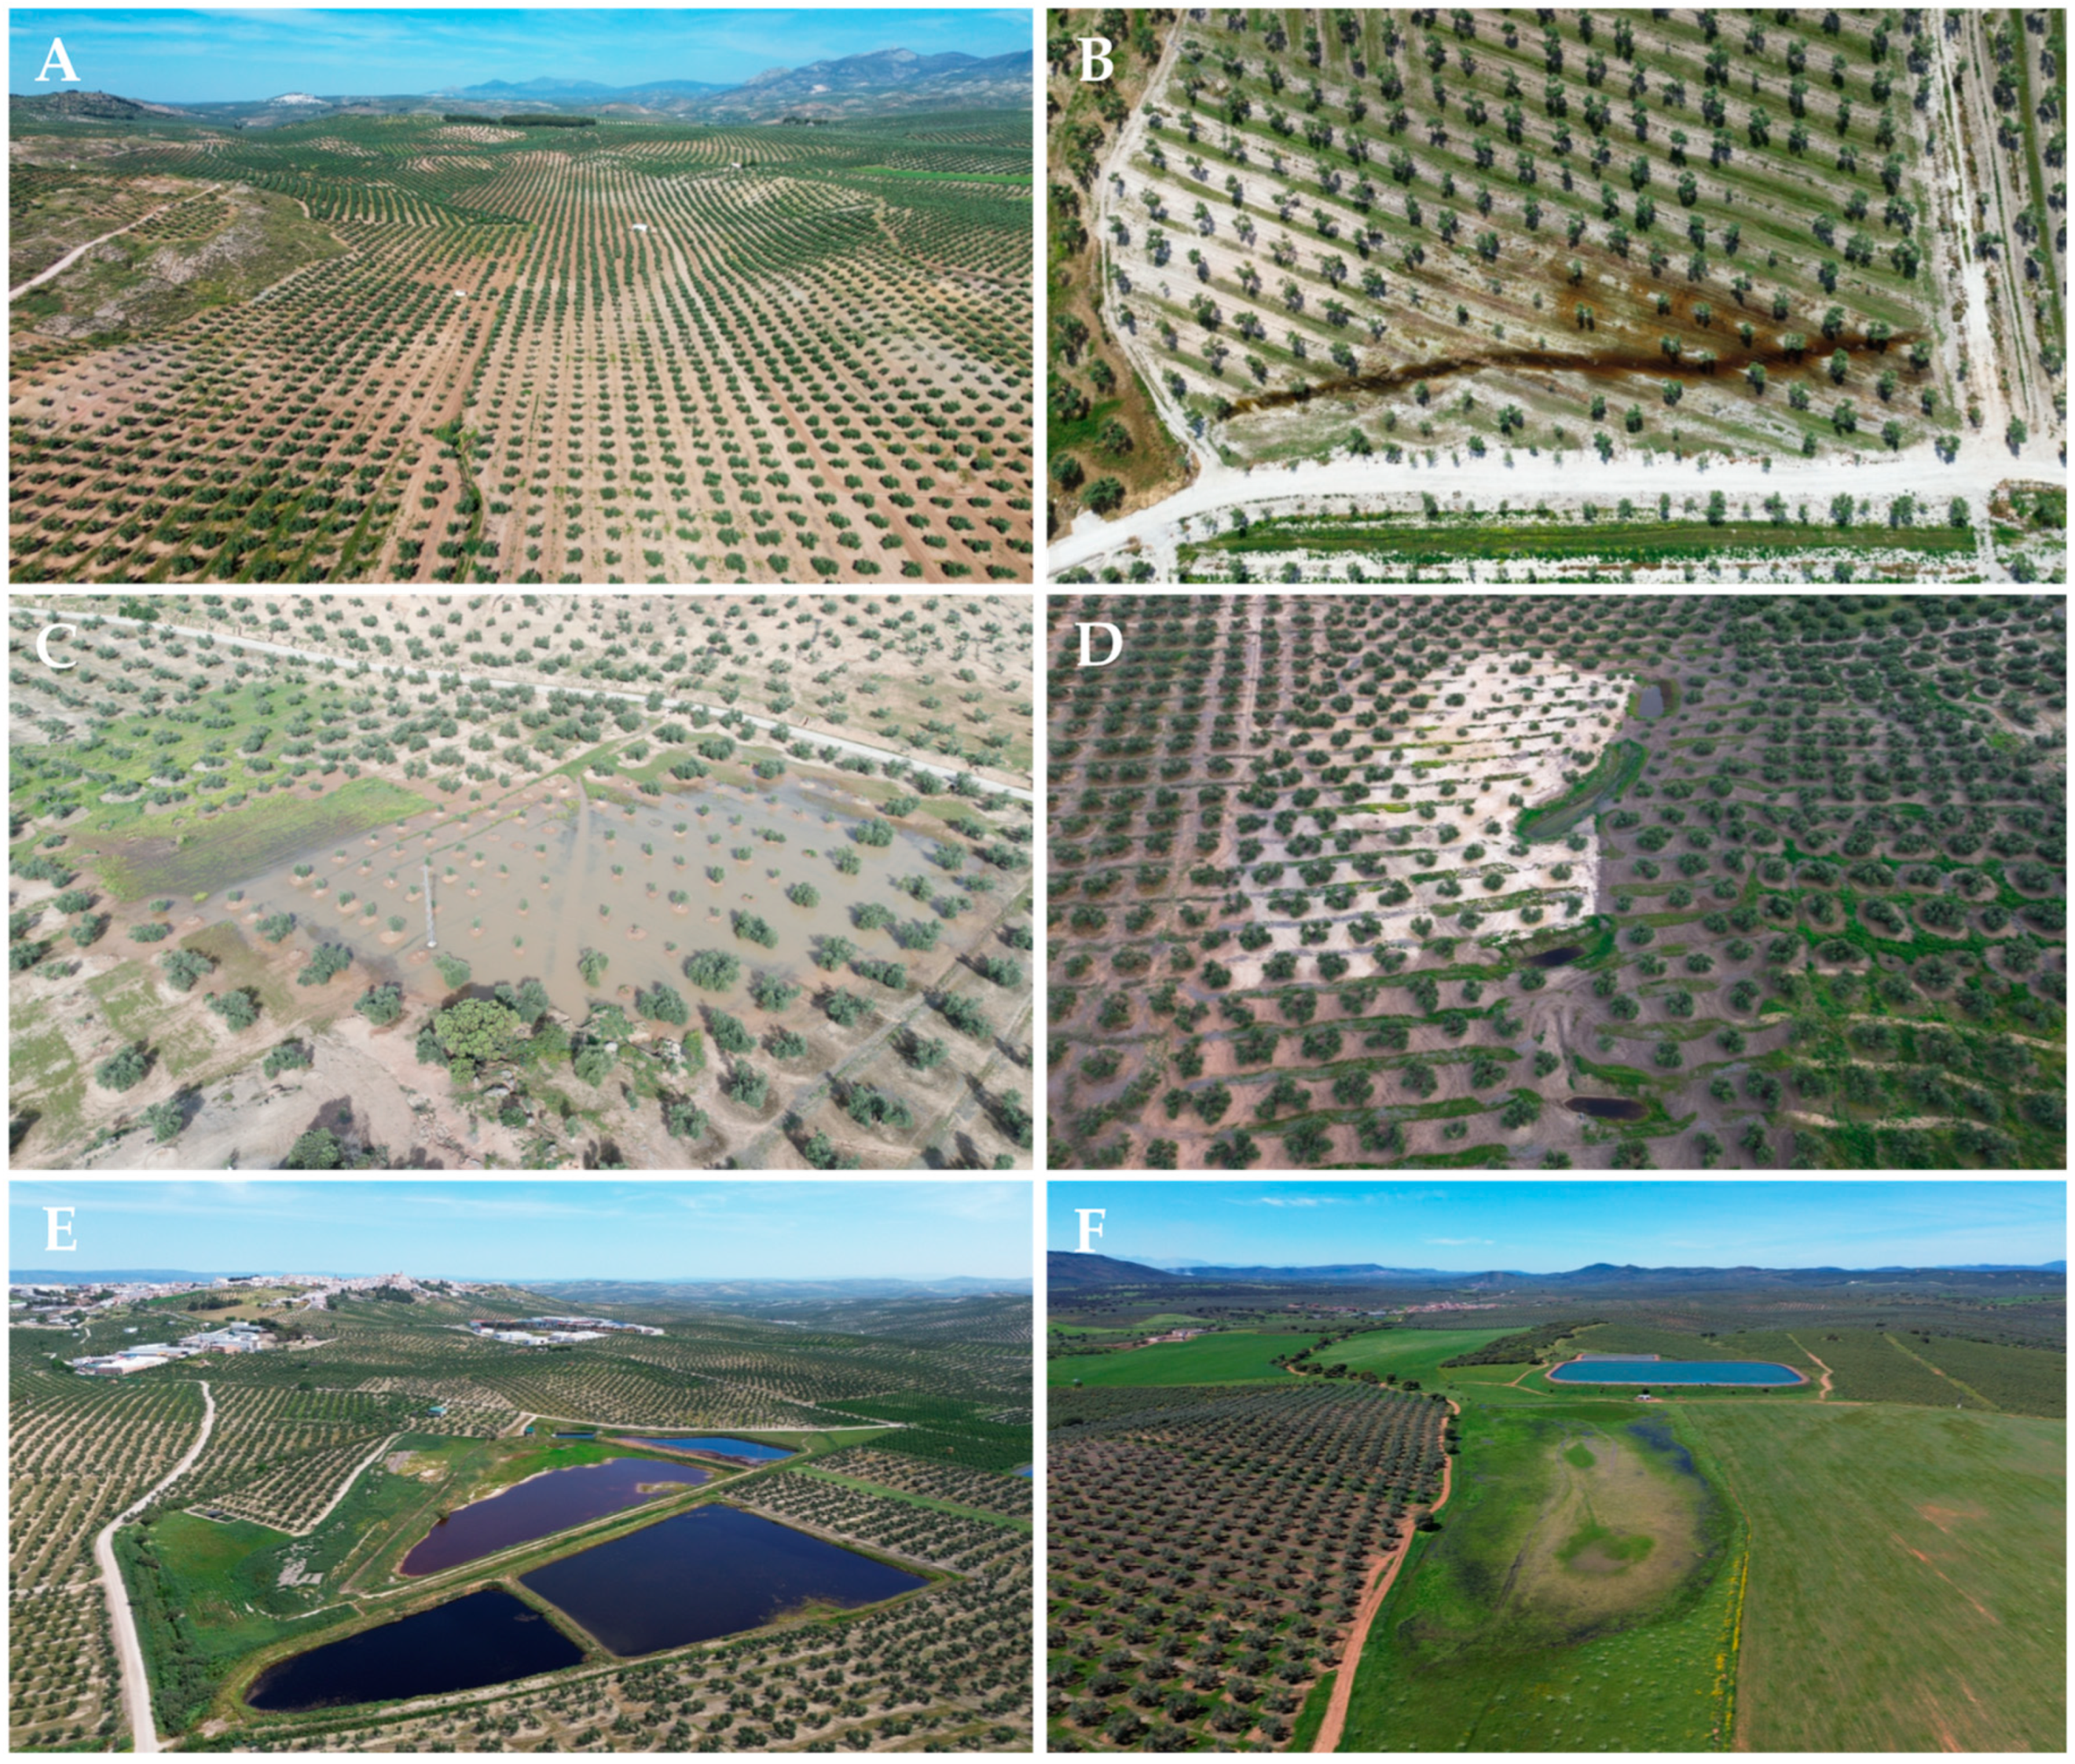
2.1. Study Area
2.2. Data Analysis
3. Results
4. Discussion
Author Contributions
Funding
Institutional Review Board Statement
Informed Consent Statement
Data Availability Statement
Acknowledgments
Conflicts of Interest
References
- Libala, N.; Griffin, N.; Nyingwa, A.; Dini, J. Freshwater ecosystems and interactions with the SDG 2030 Agenda: Implications for SDG implementation in South Africa. Afr. J. Aquat. Sci. 2022, 47, 353–368. [Google Scholar] [CrossRef]
- Ramsar Convention on Wetlands. Scaling Up Wetland Conservation, Wise Use and Restoration to Achieve the Sustainable Development Goals; Ramsar Convention Secretariat: Gland, Swiss, 2018; 13p. [Google Scholar]
- Millennium Ecosystem Assessment. Ecosystems and Human Well-Being: Synthesis; Island Press: Washington, DC, USA, 2005; 137p. [Google Scholar]
- MITECO. Plan Estratégico de Humedales a 2030; Ministerio para la Transición Ecológica y el Reto Demográfico: Madrid, Spain, 2023; 116p. [Google Scholar]
- Nabout, J.C.; Borges Machado, K.; Maciel David, A.C.; Gómez Mendonça, B.; Pereira da Silva, S.; Carvalho, P. Scientific literature on freshwater ecosystems services: Trends, biases, and future directions. Hydrobiologia 2023, 850, 2485–2499. [Google Scholar] [CrossRef]
- Costanza, R.; D’Arge, R.; De Groot, R.; Farber, S.; Grasso, M.; Hannon, B.; Limburg, K.; Naeem, S.; O’Neill, R.V.; Paruelo, J.; et al. The value of the world’s ecosystem services and natural capital. Nature 1997, 387, 253–260. [Google Scholar] [CrossRef]
- Marín-Muñiz, J.L.; Hernández, M.E. Carbon balance in tropical freshwater wetlands on the coastal plain of the Gulf of Mexico. Limnetica 2020, 39, 653–665. [Google Scholar]
- De Groot, R.; Stuip, M.; Finlayson, M.; Davidson, N. Valoración de Humedales: Lineamientos para Valorar los Beneficios Derivados de los Servicios de los Ecosistemas de Humedales; Cuaderno Técnico CBD. 2007. Available online: https://www.cbd.int/doc/publications/cbd-ts-27-es.pdf (accessed on 12 December 2024).
- Csanák, E. Arts and nature: The contribution of artists to understanding of the world and the development of natural sciences. In Proceedings of the 6th International Symposium on Biosphere and Environmental Safety, 1st ed.; ICEEE, Óbuda University: Budapest, Hungary, 2022; pp. 141–152. [Google Scholar]
- Costanza, R.; De Groot, R.; Sutton, P.; van der Ploeg, S.; Anderson, S.J.; Kubiszewski, I.; Farber, S.; Turner, R.K. Changes in the global value of ecosystem services. Global Environ. Change 2014, 26, 152–155. [Google Scholar] [CrossRef]
- Barbier, E.B.; Acreman, M.; Knowler, D. Economic Valuation of Wetlands: A Guide for Policy Makers and Planners; Ramsar Convention Bureau: Gland, Switzerland, 1997; 127p. [Google Scholar]
- Beja, P.; Alcazar, R. Conservation of Mediterranean temporary ponds under agricultural intensification: An evaluation using amphibians. Biol. Conserv. 2003, 114, 317–326. [Google Scholar] [CrossRef]
- Álvarez-Cobelas, M.; Rojo, C.; Angeler, D.G. Mediterranean limnology: Current status, gaps and the future. J. Limnol. 2005, 64, 13–29. [Google Scholar] [CrossRef]
- Ortega, F.; Parra, G.; Guerrero, F. Los humedales del Alto Guadalquivir: Inventario, tipologías y estado de conservación. In Ecología, Manejo y Conservación de los Humedales. Actas de la XIII Aula de Ecología, 1st ed.; Paracuellos, M., Ed.; Instituto de Estudios Almerienses: Almería, Spain, 2003; pp. 113–123. [Google Scholar]
- Vera, J.A. Geología de Andalucía. Enseñanzas Tierra 1994, 2, 306–315. [Google Scholar]
- Parras-Rosa, M.; Ruz-Carmona, A.; Torres-Ruiz, F.J.; Colombo, S. Los costes del olivar en la provincia de Jaén. Mercacei Mag. 2021, 106, 46–50. [Google Scholar]
- Penco Valenzuela, J.M. Aproximación a los Costes del Cultivo del Olivo, 1st ed.; Asociación Española de Municipios del Olivo: Córdoba, Spain, 2020; 56p. [Google Scholar]
- Segrelles, J.A. Las ayudas agrarias y sus repercusiones sobre la agricultura familiar en la última reforma de la política agraria común (2014–2020) de la Unión Europea: ¿cambiar todo para que todo siga igual? Boletín Asoc. Geógrafos Españoles 2017, 74, 161–183. [Google Scholar] [CrossRef]
- Davidson, N.C. How much wetland has the world lost? Long-term and recent trends in global wetland area. Mar. Freshw. Res. 2014, 65, 936–941. [Google Scholar] [CrossRef]
- Casado, S.; Montes, C. Guía de los Lagos y Humedales de España, 1st ed.; JM Reyero: Madrid, Spain, 1995; 225p. [Google Scholar]
- Gallego, J.B.; García-Mora, M.R.; García-Novo, F. Small wetlands lost: A biological conservation hazard in Mediterranean landscapes. Environ. Conserv. 1999, 26, 190–199. [Google Scholar] [CrossRef]
- Zacharias, I.; Dimitriou, E.; Dekker, A.; Dorsman, E. Overview of temporary ponds in the Mediterranean region: Threats, management and conservation issues. J. Environ. Biol. 2007, 28, 1–9. [Google Scholar] [PubMed]
- Zacharias, I.; Zamparas, M. Mediterranean temporary ponds: A disappearing ecosystem. Biodivers. Conserv. 2010, 19, 3827–3834. [Google Scholar] [CrossRef]
- Calhoun, A.J.K.; Mushet, D.M.; Bell, K.P.; Boix, D.; Fitzsimons, J.A.; Isselin-Nondedeu, F. Temporary wetlands: Challenges and solutions to conserving a disappearing ecosystem. Biol. Conserv. 2017, 211, 3–11. [Google Scholar] [CrossRef]
- Angeler, D.G. Conceptualizing resilience in temporary wetlands. Inland Waters 2021, 11, 467–475. [Google Scholar] [CrossRef]
- Finlayson, C.M.; Horwitz, P. Wetlands as settings for human health—The benefits and the paradox. In Wetlands and Human Health, 1st ed.; Finlayson, C.M., Horwitz, P., Weinstein, P., Eds.; Springer: Dordrecht, The Netherlands, 2015; pp. 1–13. [Google Scholar]
- Hotaiba, A.M.; Salem, B.S.; Waseem, M.; Halmy, A. Assessment of wetlands ecosystem’s health using remote sensing—case study: Burullus wetland—Ramsar Site. Estuaries Coast 2023, 47, 201–215. [Google Scholar] [CrossRef]
- Mitsch, W.J.; Gosselink, J.G. Wetlands, 3rd ed.; John Wiley & Sons, Inc.: New York, NY, USA, 2000; 920p. [Google Scholar]
- Mitsch, W.J.; Bernal, B.; Hernández, M.E. Ecosystem services of wetlands. Int. J. Biodivers. Sci. Ecosyst. Serv. Manag. 2015, 11, 1–4. [Google Scholar] [CrossRef]
- Turner, R.K.; Georgiou, S.; Fisher, B. Valuing Ecosystem Services. The Case of Multi-Functional Wetlands, 1st ed.; Earthscan: London, UK, 2008; 240p. [Google Scholar]
- Schuyt, K.; Brander, L. The Economic Values of the World’s Wetlands, 1st ed.; WWF: Gland, Switzerland, 2004; 32p. [Google Scholar]
- Sánchez Martínez, J.D.; Gallego Simón, V.J.; Araque Jiménez, E. El olivar andaluz y sus transformaciones recientes. Estud. Geográficos 2011, 270, 203–229. [Google Scholar] [CrossRef]
- Gleason, R.A.; Laubhan, M.K.; Euliss, N.H. Ecosystem Services Derived from Wetland Conservation Practices in the United States Prairie Pothole Region with an Emphasis on the U.S.; Department of Agriculture Conservation Reserve and Wetlands Reserve Programs; US Geological Professional Paper 1745; USGS: Reston, VA, USA, 2008; 58p. [Google Scholar]
- Félix-Massa, T. Valoración de servicios ecosistémicos y planificación. Una propuesta de gestión sostenible del turismo en humedales. Rev. Atlántica De Econ. 2018, 1, 30. [Google Scholar]
- Rapport, D.; Costanza, R.; McMichael, A.J. Assessing ecosystem health: Challenges at the interface of social, natural and health sciences. TREE 1998, 13, 397–402. [Google Scholar] [PubMed]
- Costanza, R. Toward an operational definition of health. In Ecosystem Health: New Goals for Environmental Management, 1st ed.; Costanza, R., Norton, B., Haskell, B., Eds.; Island Press: Washington, DC, USA, 1992; pp. 239–256. [Google Scholar]
- World Development Report 2004. Making Services Work for Poor People; The International Bank for Reconstruction and Development/The World Bank: Washington, DC, USA, 2003; 271p. [Google Scholar]
- García-Muñoz, E.; Gilbert, J.D.; Parra, G.; Guerrero, F. Wetlands classification for amphibian conservation in Mediterranean landscapes. Biodivers. Conserv. 2010, 19, 901–911. [Google Scholar] [CrossRef]
- Gilbert, J.D.; de Vicente, I.; Ortega, F.; Jiménez-Melero, R.; Parra, G.; Guerrero, F. A comprehensive evaluation of the crustacean assemblages in southern Iberian Mediterranean wetlands. J. Limnol. 2015, 74, 169–181. [Google Scholar] [CrossRef]
- Loreau, M.; Mounquet, N.; Holt, R.D. Meta-ecosystems: A theoretical framework for a spatial ecosystem ecology. Ecol. Lett. 2003, 6, 673–679. [Google Scholar] [CrossRef]
- Álvarez-Cobelas, M.; Cirujano, S.; Rojo, C.; García-Murillo, P.; Rubio, A.; Moreno, M.; Segura, M. Limnología de la Laguna de Zóñar (Córdoba): Efectos de la Retirada Total de Carpas; Serie LimnoIberia, 4; Grupo de Investigación del Agua: Madrid, Spain, 2014; 138p. [Google Scholar]
- Díaz-Paniagua, C.; Ramírez-Soto, M.; Aragonés, D. Pond basin colonization by terrestrial vegetation indicates wetland deterioration. Aquat. Conserv. Mar. Freshw. Ecosyst. 2023, 33, 798–809. [Google Scholar] [CrossRef]
- Ortiz, I.; Luque, J.; de la Cruz, J. Proyecto de restauración hidrológica y ambiental de la laguna de Jarata. Montilla (Córdoba). In Humedales Cordobeses. 40 Años de Investigación, 1st ed.; de la Cruz, J., Ed.; Consejería de Sostenibilidad y Medio Ambiente. Junta de Andalucía: Sevilla, Spain, 2024; pp. 55–62. [Google Scholar]
- De los Ríos-Mérida, J.; Reul, A.; Muñoz, M.; Arijo-Andrade, S.; Tapia-Paniagua, S.; Rendón-Martos, M.; Guerrero, F. How efficient are the semi-natural ponds on the assimilation of wastewater effluents? The case of a Mediterranean Ramsar wetland (Fuente de Piedra, south of Spain). Water 2017, 9, 600. [Google Scholar] [CrossRef]
- Bodini, A.; Ricci, A.; Viaroli, P. A multimethodological approach for the sustainable management of perifluvial wetlands of the Po River (Italy). Environ. Manag. 2000, 26, 59–72. [Google Scholar] [CrossRef]
- Giupponi, L.; Borgonovo, G.; Leoni, V.; Zuccolo, M.; Bischetti, G.B. Vegetation and water of lowland spring-wells in Po Plain (Northern Italy): Ecological features and management proposals. Wetl. Ecol. Manag. 2022, 30, 357–374. [Google Scholar] [CrossRef]
- Rey-Zamora, P.J.; Gutiérrez, J.E.; Valera, F.; Ruiz, C. El olivar andaluz, ¿un bosque humanizado? Aldaba 2017, 41, 113–120. [Google Scholar]
- De Castro-Expósito, A.; García-Muñoz, E.; Guerrero, F. Reptile diversity in a Mediterranean wetlands landscape (Alto Guadalquivir region, southeastern Spain): Are they affected by human impacts? Acta Herpetol. 2021, 16, 27–36. [Google Scholar] [CrossRef]
- Gilbert, J.D.; de Vicente, I.; Ortega, F.; García-Muñoz, E.; Jiménez-Melero, R.; Parra, G.; Guerrero, F. Linking watershed land uses and crustacean assemblages in Mediterranean wetlands. Hydrobiologia 2017, 799, 181–191. [Google Scholar] [CrossRef]
- Woodward, R.T.; Yong-Suhk, W. The economic value of wetland services: A meta-analysis. Ecol. Econ. 2001, 37, 257–270. [Google Scholar] [CrossRef]

| CAP Regions | MDOG | MIOG | NMDOG |
|---|---|---|---|
| I/II | I/II | I/II | |
| Region 19.2 (A) | 2854/2.64 | 3989/2.18 | 2543/3.52 |
| Region 20.2 (B) | 3499/2.64 | 4758/2.18 | 3013/3.52 |
| Region 21.2 (C) | 4843/2.64 | 6768/2.18 | 4314/3.52 |
| Number | Pond Name | CAP Region | Production Type | Surface Difference (ha) | Loss of Wetland Value (EUR) | Olive Benefits (EUR) | Balance (EUR) |
|---|---|---|---|---|---|---|---|
| Ponds in Betic mountains | |||||||
| 1 | La Laguna | B | MIOG | −0.30 (11%) | −8216.77 | 2429.43 | −5787.34 |
| 22 | La Muela | C | - | - | - | - | - |
| 23 | Hoya de la Laguna | A | - | - | - | - | - |
| 24 | Nava del Espino | A | - | - | - | - | - |
| 30 | Hoya de Huelma | B | NMDOG | −1.30 (100%)/−0.52 (40%) | −35,606.02/−14,242.41 | 567.17 | −13,675.24 |
| 31 | La Laguna | B | - | - | - | - | - |
| 36 | Bermeja | B | MIOG | −0.60 (86%) | −16,433.55 | 4858.87 | −11,574.68 |
| 43 | La Laguna | B | MDOG | −3.29 (10%) | −90,110.63 | 14,297.54 | −75,813.08 |
| 46 | Hoyas Pandera | B | - | - | - | - | - |
| 56 | Maribela | B | MIOG | −5.34 (88%)/−3.20 (53%) | −146,258.58/−87,755.15 | 25,946.36 | −61,808.79 |
| 60 | Hoya Noalejo I | B | - | - | - | - | - |
| 61 | Hoya Noalejo II | B | - | - | - | - | - |
| 62 | Hoya Noalejo III | B | - | - | - | - | - |
| 63 | Orcera | A | - | - | - | - | - |
| 67 | Cañada de la Cruz | A | - | - | - | - | - |
| 71 | Siles I | A | - | - | - | - | - |
| 72 | Siles II | A | - | - | - | - | - |
| 82 | Hoya del Almadén | B | - | - | - | - | - |
| 83 | Hoya de Torres | B | - | - | - | - | - |
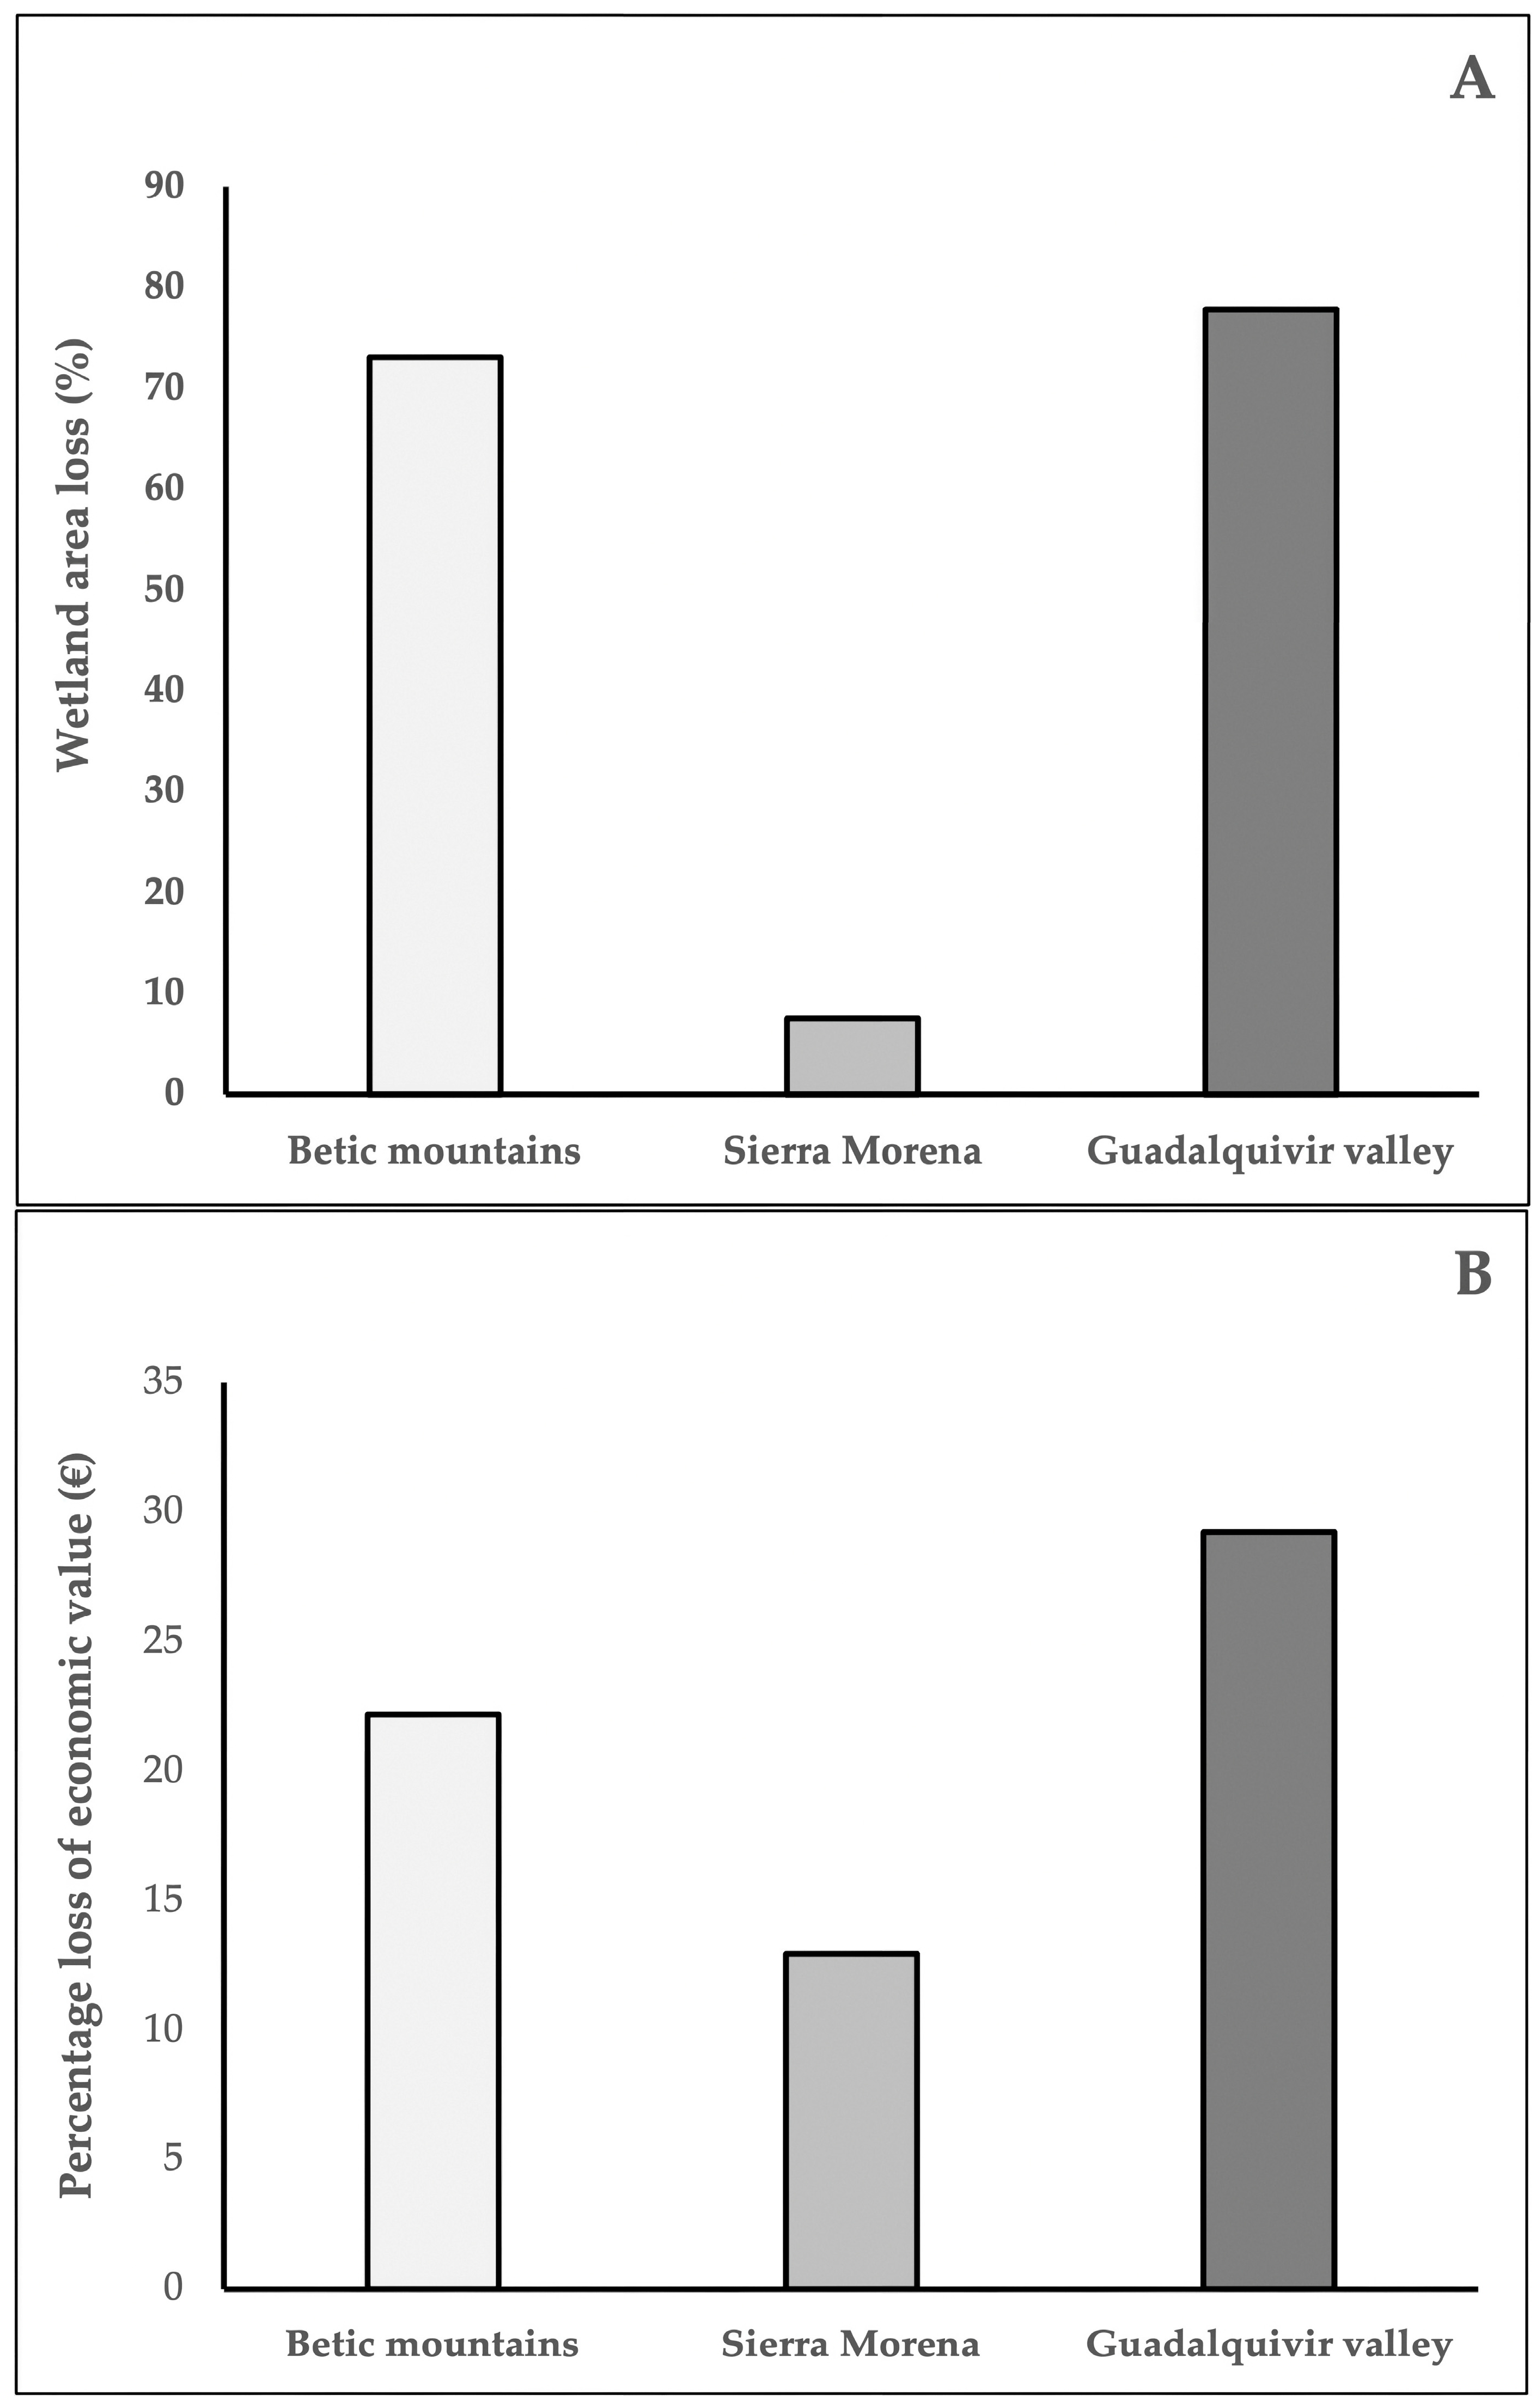
| Summary | −10.83 (12%)/−7.91 (8%) | −296,351.66/−216,758.51 | 48,099.38 | −168,659.13 | |||
| Ponds in Sierra Morena | |||||||
| 25 | Pedernoso | A | - | - | - | - | - |
| 29 | Castillo | A | - | - | - | - | - |
| 44 | Tobaruela | B | - | - | - | - | - |
| 45 | Ardal | B | MIOG | −4.60 (100%)/- | −125,990.54/- | - | - |
| 57 | Perales I | A | - | - | - | - | - |
| 58 | Perales II | A | - | - | - | - | - |
| 59 | Vallejos | A | - | - | - | - | - |
| 68 | Santisteban | A | MDOG | −0.24 (3%)/−0.07 (1%) | −6573.42/1972.03 | 255.22 | −1716.81 |
| 70 | Chaparral | A | MDOG | −0.47 (80%)/−0.33 (56%) | −12,872.95/9011.06 | 1166.20 | −7844.87 |
| Summary | −5.31 (21.5%)/−0.40 (1.6%) | −145,436.91/−10,983.09 | 1421.41 | −9561.68 | |||
| Ponds in the Guadalquivir valley | |||||||
| 2 | Honda | B | MIOG | −1.48 (12%) | −40,536.09 | 11,985.21 | −28,550.88 |
| 3 | Chinche I | B | - | - | - | - | - |
| 4 | Chinche II | B | - | - | - | - | - |
| 5 | Tumbalagraja I | B | MIOG | −1.83 (11%) | −50,122.32 | 14,819.55 | −35,302.77 |
| 6 | Tumbalagraja II | B | MIOG | −0.23 (15%) | −6299.53 | 1862.57 | −4436.96 |
| 7 | Cañada Lucena | B | MIOG | −28.70 (100%) | −786,071.42 | 232,415.93 | −553,655.49 |
| 8 | Ranal | B | - | - | - | - | - |
| 9 | Obispo | B | MIOG | −0.50 (100%) | −13,694.32 | 4049.06 | −9645.57 |
| 10 | Quinta | B | MIOG | −0.60 (5%) | −16,433.55 | 4858.87 | −11,574.68 |
| 11 | Rincón del Muerto | B | MIOG | −0.78 (14%) | −21,363.61 | 6316.53 | 15,047.08 |
| 12 | Casasola | B | MIOG | −1.58 (44%) | −43,275.01 | 12,795.02 | 30,479.99 |
| 13 | Guadajoz I | B | - | - | - | - | - |
| 14 | Guadajoz II | B | - | - | - | - | - |
| 16 | Butaquillos | B | - | - | - | - | - |
| 17 | Grande | C | - | - | - | - | - |
| 18 | Chica | C | - | - | - | - | - |
| 19 | Argamasilla | C | MIOG | −0.44 (8%) | −12,051.27 | 5068.42 | −6982.85 |
| 26 | Torrealcazar | B | MDOG | −2.60 (100%) | −71,212.04 | 11,298.97 | −59,913.07 |
| 27 | Los Prados | B | MDOG | −9.40 (100%)/−7.99 (85%) | −257,458.93/−218,840.09 | 34,722.61 | −184,117.48 |
| 28 | San José | B | MDOG | −11.90 (100%)/−4.76 (40%) | −325,932.05/−130,372.82 | 20,685.81 | −109,687.01 |
| 32 | Prados del Moral I | B | MIOG | −3.20 (100%) | −87,645.59 | 25,913.97 | −61,731.62 |
| 33 | Prados del Moral II | B | MIOG | −4.70 (100%) | −128,729.47 | 38,061.15 | −90,668.32 |
| 34 | Las Lagunillas | B | MIOG | −11.35 (52%)/−1.14 (5%) | −310,867.96/−31,086.80 | 9191.36 | −21,895.43 |
| 35 | Marqués | B | MIOG | −0.08 (4%) | −2191.14 | 647.85 | −1543.29 |
| 37 | Brujuelo | B | MIOG | −4.19 (50%) | −114,760.95 | 33,931.11 | −80,829.84 |
| 38 | Cirueña | B | MIOG | −0.35 (9%) | −9586.24 | 2834.34 | −6751.90 |
| 39 | Torrebuenavista | B | MIOG | −2.80 (100%) | −76,689.89 | 22,674.72 | −54,015.17 |
| 40 | Barrios | B | MIOG | −1.36 (52%) | −37,249.38 | 11,013.44 | −26,235.94 |
| 41 | Almenara | B | - | - | - | - | - |
| 42 | Corbún | B | MIOG | −2.70 (100%)/−2.43 (90%) | −73,950.97/−66,555.87 | 19,678.42 | −46,877.45 |
| 47 | Salobral | B | - | - | - | - | - |
| 48 | Hituelo I | B | MIOG | −0.90 (18%) | −24,650.32 | 7288.30 | −17,362.02 |
| 49 | Hituelo II | B | MIOG | −3.30 (100%) | −90,384.52 | 26,723.78 | −63,660.74 |
| 50 | Mojones | B | MIOG | −4.00 (89%)/−1.32 (29%) | −109,556.99/−36,153.81 | 10,689.51 | −25,464.29 |
| 51 | Naranjeros | B | MIOG | −0.30 (12%) | −8216.77 | 2429.43 | −5787.34 |
| 52 | Rumpisaco | B | MIOG | −2.99 (75%) | −81,893.85 | 24,213.37 | −57,680.48 |
| 53 | Las Ceras | B | MIOG | −2.10 (100%)/−0.85 (41%) | −57,517.42/−23,294.56 | 6887.45 | −30,182.00 |
| 64 | La Orden | B | MIOG | −0.21 (30%) | −5751.74 | 1700.60 | −4051.14 |
| 65 | Valdeutiel | B | MIOG | −0.94 (72%)/- | −25,745.89/- | - | - |
| 66 | San Bartolomé | B | MIOG | −0.80 (100%)/0.48 (60%) | −21,911.40/−13,146.84 | 3887.10 | −9259.74 |
| 73 | Garcíez I | B | - | - | - | - | - |
| 74 | Garcíez II | B | MIOG | −1.42 (13%) | −38,892.73 | 11,499.32 | −27,393.41 |
| 75 | Colmenero | B | - | - | - | - | - |
| 76 | Casillas I | B | MIOG | −0.91 (41%) | −24,924.22 | 7369.29 | −17,554.93 |
| 77 | Casillas II | B | MIOG | −0.19 (7%) | −5203.96 | 1538.64 | −3665.32 |
| 78 | Casillas III | B | MIOG | −0.05 (4%) | −1369.46 | 404.91 | −964.56 |
| 79 | Las Navas I | B | MIOG | −2.06 (38%) | −56,349.16 | 16,660.63 | −39,688.54 |
| 80 | Las Navas II | B | - | - | - | - | - |
| 81 | Hornillo | B | - | - | - | - | - |
| 84 | La Laguna I | C | MDOG | −5.20 (100%)/−2.08 (40%) | −142,424.09/−56,969.64 | 12,511.21 | −44,458.42 |
| 86 | Herradura | C | - | - | - | - | - |
| 88 | Villardompardo I | B | - | - | - | - | - |
| 89 | Villardompardo II | B | - | - | - | - | - |
| 90 | Villardompardo III | B | MIOG | −1.30 (100%) | −35,606.02 | 10,527.55 | −25,078.47 |
| Summary | −123.48 (28.8%)/−96.13 (22.4%) | −3,193,513.63/−2,453,990.24 | 717,521.26 | −1,736,468.98 | |||
Disclaimer/Publisher’s Note: The statements, opinions and data contained in all publications are solely those of the individual author(s) and contributor(s) and not of MDPI and/or the editor(s). MDPI and/or the editor(s) disclaim responsibility for any injury to people or property resulting from any ideas, methods, instructions or products referred to in the content. |
© 2025 by the authors. Licensee MDPI, Basel, Switzerland. This article is an open access article distributed under the terms and conditions of the Creative Commons Attribution (CC BY) license (https://creativecommons.org/licenses/by/4.0/).
Share and Cite
Ortega, G.; Barragán, J.M.; Gilbert, J.D.; Ortega, F.; Guerrero, F. Economic Loss and Ecosystem Service Decline in Mediterranean Ponds (Andalusia, Spain): The Impact of Olive Groves over the Last 20 Years. Sustainability 2025, 17, 2435. https://doi.org/10.3390/su17062435
Ortega G, Barragán JM, Gilbert JD, Ortega F, Guerrero F. Economic Loss and Ecosystem Service Decline in Mediterranean Ponds (Andalusia, Spain): The Impact of Olive Groves over the Last 20 Years. Sustainability. 2025; 17(6):2435. https://doi.org/10.3390/su17062435
Chicago/Turabian StyleOrtega, Gema, Juan Manuel Barragán, Juan Diego Gilbert, Fernando Ortega, and Francisco Guerrero. 2025. "Economic Loss and Ecosystem Service Decline in Mediterranean Ponds (Andalusia, Spain): The Impact of Olive Groves over the Last 20 Years" Sustainability 17, no. 6: 2435. https://doi.org/10.3390/su17062435
APA StyleOrtega, G., Barragán, J. M., Gilbert, J. D., Ortega, F., & Guerrero, F. (2025). Economic Loss and Ecosystem Service Decline in Mediterranean Ponds (Andalusia, Spain): The Impact of Olive Groves over the Last 20 Years. Sustainability, 17(6), 2435. https://doi.org/10.3390/su17062435