Article

Biological Resources for Renewable Energies in the European Union: A Hierarchical Approach

by
Emilia Mary Bălan
1,2,
Cristina Georgiana Zeldea
3,*,
Laura Mariana Cismaș
4,*,
Marioara Iordan
3,
Cristian Mihai Cismaș
5 and
Melinda Petronela Costin
5
1
Institute for Advanced Environmental Research, West University of Timisoara, 300223 Timisoara, Romania
2
Institute for World Economy, Romanian Academy, 050711 Bucharest, Romania
3
Institute for Economic Forecasting, Romanian Academy, 050711 Bucharest, Romania
4
Faculty of Economics and Business Administration, West University of Timisoara, 300223 Timisoara, Romania
5
Doctoral School of Economics and Business Administration, West University of Timisoara, 300223 Timisoara, Romania
*
Authors to whom correspondence should be addressed.
Sustainability 2025, 17(4), 1484; https://doi.org/10.3390/su17041484
Submission received: 19 December 2024 / Revised: 7 February 2025 / Accepted: 9 February 2025 / Published: 11 February 2025

Abstract

:
The bioeconomy is an essential framework for sustainable economic growth in the European Union (EU), leveraging biomass transformation into bioenergy, biofuels, and other high-value products. This study examines the socio-economic impact of bio-based electricity and liquid biofuels in EU from 2008 to 2021, focusing on employment, turnover, and value added at factor cost. Cluster analysis shows that EU countries are divided into four groups based on socio-economic outcomes in the bioenergy sector, highlighting significant differences between Western and Eastern Europe. Notably, countries like Germany, France, and Italy lead in bioenergy development, supported by robust policy frameworks, while several Central and Eastern Europe Countries (CEECs), face challenges in advancing bioeconomy sectors. The analysis also puts forward a socio-economic indicator of bioeconomy (SEIB), which highlights national differences and potential growth paths for the bio-based energy sector. These findings provide valuable insights for policymakers to address regional inequalities and promote sustainable bioeconomic practices across the EU. The study underscores the need for consistent data collection to support future bioeconomy research and policy formulation.

1. Introduction

Bioeconomy represents a viable option for economic development, with the exploitation of biomass and its transformation into bioenergy; biofuels; and, more broadly, value-added products being among the most important methods to achieve both technical and economic consolidation [1]. To achieve a zero-waste, fully circular bioeconomy, it is necessary to overcome challenges arising in the areas of technology, public regulation, and society [2]. Furthermore, to shift the current traditional economic model based on fossil fuels, nature must be placed at the heart of decision-making processes. In Tapiola et al.’s opinion [3], understanding the entire value chain is essential to the success of a bioeconomic product, in terms of both end-user requirements and market demands. Policymakers and researchers increasingly regard bioeconomy as one of the most effective ways to reduce the economy’s dependence on fossil resources [4]. Still, the fossil fuels remain the primary source for generating electricity and heat, as well as for manufacturing chemicals and fuels for the global economy [5].
The energy industry is undoubtedly a driver of economic growth, as its products serve as inputs into almost all goods and services provided in the market. The pandemic crisis in 2020 tested the stability of the energy system, with secondary effects on the entire economy deriving from energy price volatility [6]. Therefore, in the current context of climate change and limited natural resources, their efficient and sustainable use is a goal of both the EU and the Member States (MSs), as well as a project of utmost importance for the future. Renewable resources are the viable solution to environmental problems. The Directive on the Promotion of Energy from Renewable Sources [7] requires EU countries to maximise the use of renewable resources and promote the importance of biomass. The COVID-19 pandemic also illustrated the level of pollution to which the planet is subjected every day, given that the restrictions imposed during that period have limited transportation and industrial activities. Additionally, reduced mobility of labour, goods, and services affected the energy mix [8], substantially diminishing the use of fossil fuels and reducing the demand for electricity in the industry [9].
Renewable energy resources are a viable and sustainable solution to these issues of modern society [10]. Biomass procurement must be carried out in line with the concept of sustainability—without harming the environment, jeopardising food security, or disrupting natural ecosystems. Studies by Shafie et al. [11], Shortall et al. [12], Bracco et al. [13], and Egenolf and Bringezu [14] emphasise the need for continued implementation of sustainable bioeconomy concepts, especially sustainable biomass. Biomass plays a crucial role for the future of energy production for several key reasons. Biomass is important for the future of the energy sector because it is a renewable energy source derived from organic materials like plants and waste, which can be quickly replenished. When managed sustainably, the CO2 released during combustion is offset by the CO2 absorbed during plant growth, fostering a closed carbon cycle and helping to combat climate change [15,16]. It bolsters energy security as biomass resources are globally plentiful, lessening dependence on imported fossil fuels—a benefit for countries with limited fossil fuel reserves [17]. Moreover, biomass promotes rural economic growth by generating employment and stimulating economic activity in agriculture, forestry, and bioenergy production. Its versatility allows it to be converted into electricity, heat, and transportation fuels through technologies like combustion, gasification, and fermentation [18]. Biomass is also compatible with existing energy infrastructure, allowing it to be co-fired with coal in power plants to reduce the carbon footprint of electricity generation [19]. Ultimately, biomass significantly cuts greenhouse gas emissions compared to fossil fuels, particularly when considering its entire lifecycle of production and consumption.
However, the concept of biomass is a subject of debate, polarising researchers around various topics of interest. One of these has been and remains that of biomass from forest sources. In this regard, notable contributions came from Petersen [20], Söderberg and Eckerberg [21], and Schuenemann et al. [22], who argued that biomass production from forest sources significantly impacts the environment, as large-scale deforestation is already a major concern. Using plant biomass as a primary energy source has the advantage of protecting forests by avoiding deforestation, thereby contributing to the reduction of landslides and floods, phenomena associated with climate change.
Biomass is typically obtained from the production of field crops, animal husbandry, forestry, aquaculture, and fishing. Additionally, biomass can be obtained from agricultural residues and waste, indigenous plants, fodder, as well as from bio or energy products [23]. According to Schmidhuber [24], agricultural resources used as biomass do not result in a decrease in food raw materials, as food unavailability for the population is caused by financial incapacity, not insufficient production. On the contrary, the increasing demand for agricultural resources used as biomass (wheat, corn, sorghum, oats, rice, barley, sugar cane, etc.) has contributed to a recovery in agricultural raw material prices, thus supporting farmers in expanding cultivated areas—otherwise, the land would have been at risk of degradation due to non-utilisation, as well as for the development of agricultural businesses. In a similar vein, Welfle et al. [25] concluded that biomass resources could cover up to 44% of the energy demand without having any significant impact on food supply.
The core research problem of this study is the unequal socio-economic growth of the bioenergy industries in EU Member States (MSs), which is caused by differences in resource use, policy frameworks, and infrastructure. This study aims to comprehend these variations and how they affect the EU’s sustainability and climate neutrality objectives.
The research employs a novel approach that simultaneously evaluates bioeconomic indicators in biomass agriculture from two points of view: a cluster analysis and a socio-economic indicator for bioeconomy (SEIB) to emphasise the MSs’s contribution at the EU level. The initial goal of the research is to perform a hierarchical cluster analysis on the socio-economic index related to the bio-based electricity and liquid biofuels sectors in the EU. The authors then go ahead and compute the SEIB index for every nation in order to obtain a deeper understanding of the social and economic aspects of their bioeconomy energy sectors (bio-based electricity and liquid biofuels).
This research objectives address the following questions:
(1)
Which member state has achieved the best socio-economic outcomes in the bio-based energy and biofuels sectors?
(2)
How are the EU member states grouped based on socio-economic indicators in the bioeconomy?
(3)
What are the similarities and differences among the clustered member states according to SEIB?
The study highlights significant disparities in bioenergy sector advancement between Western European countries and CEECs, emphasising the need to bridge these gaps for equitable and sustainable development. Robust policy frameworks and collaboration have driven progress in advanced nations, offering best practices and technologies that can benefit lagging regions. Introducing a socio-economic indicator of bioeconomy (SEIB) enables tailored growth strategies, supporting the EU’s climate neutrality goals and sustainable economic growth. However, data inconsistencies across member states hinder analysis, underscoring the need for standardised data collection. The research provides strategic insights for addressing regional barriers, fostering collaboration, and advancing bioeconomy-driven renewable energy solutions.

2. Literature Background

In Zuniga-Gonzalez et al.’s [26] opinions, bioeconomy is an evolving concept that promotes the sustainable use of renewable biological resources, yet it faces the challenge of balancing sustainability with growth in industries such as forestry, agriculture, and biotechnology. The biofuel sector is essential within the bioeconomy, with significant impacts on energy security and carbon emission reduction. Studies have shown that biofuels not only contribute to diversifying energy sources but also stimulate local economic development by creating jobs in rural areas [27,28]. For instance, the EU’s bioeconomic strategy highlighted the importance of biofuels in achieving sustainable development goals, including those related to climate change and natural resource management [29,30].
A lot of waste can be processed into many different kinds of bioeconomic supplies [31]. As the economy moves toward “decarbonisation” or lowering the quantity of GHG emissions caused by consuming fossil fuels, renewable energy sources are essential to the energy sector.
The bio-based electricity and biofuels sectors in the EU are integral components of the region’s strategy to achieve sustainable energy goals. The EU has set ambitious targets for renewable energy consumption, aiming for 32% by 2030 and climate neutrality by 2050, with bioenergy playing a crucial role in this transition [32]. Bioenergy accounted for approximately 60% of the renewable energy generated in the EU as of 2020, highlighting its significance in the energy mix [33]. This sector encompasses various forms of energy production, including biofuels for transportation and bioelectricity, which are essential for reducing GHGs and enhancing energy security [34].
The bioeconomy, defined as the use of renewable biological resources to produce food, energy, and bio-based products, plays a crucial role in the transition from fossil fuel-based economies to greener solutions [29,35]. In a similar vein, the electricity sector, especially renewable energy, is closely linked to the bioeconomy. The use of biomass for electricity generation is an increasingly common practice that helps reduce dependence on fossil fuels [36,37]. This synergy between biofuels and renewable electricity is essential for achieving climate neutrality goals and promoting a sustainable energy system [38]. Furthermore, integrating these sectors into national and regional bioeconomy strategies is crucial. For example, in Germany and the Czech Republic, national forestry strategies emphasise the importance of biofuels and renewable energy within the bioeconomy, demonstrating a commitment to green transition [35,39]. This integrated approach not only supports economic development but also contributes to environmental conservation and improves quality of life [40]. The literature review on the bio-based electricity and biofuel sectors as key components of the bioeconomy highlights the interconnection between these areas and their contribution to sustainable development.
Biomass represents any organic matter derived from plants or animals, which is transformed into a source of renewable energy. Biomass can be used for the production of thermal and electric energy, as well as biofuels used in transportation. Additionally, biomass can be in solid or gaseous form and can be obtained from agricultural crops and residues, forest sources, and urban waste. The necessity of using biomass as an energy source (electric and thermal), as well as for the production of biofuels, stems from the fact that mineral fuel resources are increasingly depleted, their extraction technologies are environmentally unfriendly, and production costs are relatively high. As determined by Popp et al. [5], biomass contributes to 13% of the world’s final energy consumption, and 5% comes from other renewable sources. According to a study by Bioenergy Europe, in the EU, by 2050, the consumption of energy derived from agricultural biomass will reach 124 million tonnes of oil equivalent, up from just 26 million tonnes of oil equivalent in 2017, while that obtained from forest biomass will decrease from 100 million tonnes of oil equivalent to 5 million tonnes of oil equivalent [41]. Scarlat et al. [42] suggest that the bioeconomy benefits from multiple development conditions in the EU, and the projected increase in plant production, will entail a corresponding increase in biomass production. In the EU, agriculture supported biomass production with approximately 63% of resources, forestry with 36%, and fisheries with less than 1%. Food and feed represent 62% of the EU’s biomass use, with raw materials and energy each accounting for approximately 19% [43]. Crop residues, livestock manure, forestry residues, and garbage were the most significant sources of biomass [44]. The recently launched “Fit for 55” package of measures pinpoints a determination of the European forum to support solid biomass energy production [45]. In line with official commitments to climate and environmental protection, the European Commission intends to strengthen sustainability criteria to intensify bioenergy use and urge MSs to implement support schemes for bioenergy production from wood biomass, which is eligible under the cascade use principle. The principle stipulates that the highest economic and environmental value of woody biomass should be prioritised in the following order: the creation of wood products; their extended use, reuse, and recycling; followed by utilisation as an energy raw material or its treatment as waste as a last resort.
In terms of bioelectricity, the EU’s bioenergy production is expected to grow across various end use sectors, including heating, cooling, and electricity generation [46]. The integration of bioenergy into the electricity sector not only contributes to the reduction of fossil fuel dependency but also supports the overall goal of carbon neutrality. The increasing share of renewable energy in the EU’s energy consumption underscored the importance of bioenergy in achieving these targets [32,33]. Furthermore, the economic implications of bioenergy development were significant, as it has been shown that improvements in bioenergy productivity positively impact sustainable economic development across EU MSs [47].
The biofuels sector, particularly, has seen substantial growth driven by EU policies that mandate a specific percentage of biofuels in transport fuels. For instance, the EU aimed for a 10% share of biofuels in petrol and diesel by 2020, which reflects the commitment to integrating renewable sources into the transportation sector [48]. However, the production of first-generation biofuels, primarily derived from food crops, is experiencing a decline due to sustainability concerns and competition with food production [49]. This shift has prompted a focus on second- and third-generation biofuels, which utilise non-food biomass and waste materials, thereby alleviating some of the pressure on food supplies and enhancing sustainability [50].
Biomass and bioenergy play a critical role in this climate neutrality by 2050 framework, contributing to renewable energy targets and providing a reliable energy source for heat, electricity, and transport. Bioenergy is particularly valued for its abilities to integrate with existing infrastructure and support rural development. The future of bioenergy in the EU is tied to its alignment with sustainability criteria, innovation in advanced biofuels, and a circular economy approach that maximises resource efficiency while minimising environmental impact. As policies like the European Green Deal and Fit for 55 package evolve, bioenergy is expected to remain a key component, provided it adheres to stricter sustainability standards and complements other renewable energy sources.

3. Materials and Methods

The sample included 27 EU countries, covering a period from 2008 to 2021. The analysis included annual data from each country in the bio-based electricity and liquid biofuels sectors, covering the number of people employed, value added at factor cost, and turnover. The number of people employed indicates the number of jobs created in the renewable energy sector, reflecting the industry’s impact on employment and its capacity to support economic development in the EU. Value added at factor cost measures the net output generated by the renewable energy sector after subtracting intermediate costs. It highlights the sector’s contribution to the overall economy and its efficiency. Turnover represents the revenue generated by the renewable energy sector. It is crucial for understanding market size, growth potential, and the sector’s financial health. It should be noted that Ireland does not have data recorded in the Joint Research Centre of the EC (DataM) for the indicators used as variables. Additionally, not all MSs have biomass production for both bio-based electricity and liquid biofuels. For instance, the Czech Rep. and Ireland have no data for the bio-based electricity sector (production of bio-based electricity), while Cyprus, Ireland, Latvia, Luxembourg, Malta, and Slovenia are not registered in DataM with data for manufacture of liquid biofuels indicators. The cluster analysis included all EU member countries. However, the SPSS software (IBM SPSS Statistics 29) excluded the Czech Rep., Ireland, and Malta due to insufficient data for hierarchical clustering (see Table 1). It must be highlighted that including all 27 EU member states ensures full coverage and minimises biases, providing the most accurate representation of the EU as a whole. However, excluding the outliers ensures a more robust result. The removal of the three MSs should have minimal impact on the analysis as the remaining sample is wide, significant, and normally distributed after processing. The remaining sample of 24 countries reflects the economic and regional diversity of the EU and includes large economies, and small economies, which are geographically balanced (northern, southern, eastern, and western) and have distinct renewable energy profiles.
Table 1 highlights the results of the Case Summaries procedure, which calculates the number of valid values and those excluded from the total number of values for all variables included in the model.
The research conducted by Lasarte-Lopez et al. [51] and D’Adamo et al. [52] served as the foundation for the variable selection. All information for the bioeconomy’s specific indicators was sourced from DataM.
The indicators that have been used as variables are as follows: V1—the number of persons employed in the bio-based electricity sector (NPE BBE), V2—turnover in the bio-based electricity sector (TRN BBE), V3—value added at factor cost in the bio-based electricity sector (VAFC BBE), V4—the number of persons employed in the liquid biofuels sector (NPE LB), V5—turnover in the liquid biofuels sector (TRN LB), and V6—value added at factor cost in the liquid biofuels sector (VAFC LB).
The average for the period 2008–2021 for each indicator and each MS is shown in Table 2.
As shown in Table 2, Germany is the clear leader in the selected indicators for both renewable energy sectors included in the bioeconomy. This is also highlighted by other researchers [53,54,55] and is the result of Germany’s early implementation of policies aimed at transitioning to a green and sustainable economy [56,57]. Other essential aspects of the development of the two bioeconomic sectors in Germany are the high consumption of liquid biofuels [58] as well as educating the population to mitigate the effects of climate change at a personal level [59].
On the other hand, Malta has shown the weakest performance in the bio-based electricity sector. Unfortunately, this Mediterranean archipelago has a small land area, and its economy relies heavily on tourism.
Apart from Germany, other countries contributing to the bio-based electricity sector within the EU bioeconomy are as follows: Poland, Italy, and France for NPE; Italy, Belgium, and Finland for TRN; and Italy, Finland, and France for VAFC. Except for Germany, in terms of the liquid biofuels sector, the contributing member states are Poland, France, and the Czech Rep. for NPE; France, Italy, and Belgium for TRN; and France, Italy, and Poland for VAFC.
To sum up, Italy, France, Finland, Spain, Belgium, and Sweden are six other states that hold significant positions in the ranking of the top five countries for each individual indicator. From the quantitative analysis of the data, Poland is the only of CEECs that ranks this high (2nd) in terms of the number of employed persons from the two sectors. Furthermore, Poland has shown notable average values in both turnover and value added in the liquid biofuels sector.

3.1. Cluster Research

As a first analytical approach, a cluster analysis was made using SPSS software (IBM SPSS Statistics 29) to address the second research question: how do EU member states group together based on bioeconomy specific variables within the distinct sectors of renewable energy (production of bio-based electricity and manufacture of liquid biofuels).
Information is often organised by region using cluster analysis to develop compo-site indicators that rank groups (clusters) based on their proximity or dissimilarity to the primary components [60]. This method is important for identifying regional differences and similarities, facilitating the sharing of expertise and local resources for sustainable regional development. The goal is to create a class partition that either maximises or minimises inertia between or within cluster ranks [61,62].
The most common method for evaluating quantitative findings in economic research is testing the null hypothesis, which analysts use to determine the impact of the indicator on each subgroup [60,63]. A p-value greater than 0.05 (at the 95% confidence level) was set as the threshold for accepting the null hypothesis. For the cluster analysis, the null hypothesis was formulated (H0) as the absence of significant differences in the growth rates of each variable across the groups of countries. The alternative hypothesis (H1) posited that there is a significant variation in at least one of the growth rates of the selected parameter for each country.
Values were standardised to Z scores by variable, using the interval measure of Euclidean distance and Ward’s method. A dendrogram based on the bioeconomy-related indicators was generated as a result of the classification algorithm. The research employed Ward’s method, as it is one of the few agglomerative clustering techniques that reduces within-cluster dispersion by considering the value of each variable, following the approaches of Murtagh and Legendre [64] and Bu et al. [65].
By examining the dynamics of the agglomeration schedule coefficients (grouping classes according to the distances in the proximity matrix coefficients) and the resulting dendrogram [66,67], the decision was made to halt the iterative process at 20 and set the aggregation level to 7.5. A visual analysis of the classification tree revealed that with an aggregation level below 7.5, the number of groups would have increased, but a new cluster with only one element would have formed. Conversely, at an aggregation level above 7.5, a group with too many elements would have emerged, while the other single-element clusters remained unchanged. Under these circumstances, it could be determined that an aggregation level of 7.5, resulting in the formation of four clusters, was the optimal solution.
After calculating the growth rates of the indicators for each variable by taking the first difference of the natural logarithm, the robustness of the parameters was assessed using one-way analysis of variance (ANOVA) [68,69]. The third moments suggest a probability distribution closely resembling a Gaussian bell curve.

3.2. The Socio-Economic Indicator of Bioeconomy

A number of authors have emphasised the necessity for better metrics to track the bioeconomy’s development [70]. Ronzon and M’Barek [71] suggested socio-economic metrics for evaluating and contrasting the bioeconomy in EU member states. Sanz-Hernández et al. [72] presented a systematic review that emphasises the need for more thorough socio-economic evaluations in the field of bioeconomy that supports these findings. The monitoring of bioeconomy development and the implementation of a more thorough socio-economic analysis are the two main gaps that SEIB aims to fill.
To calculate the socio-economic indicator of bioeconomy (SEIB), the methodology proposed by D’Adamo et al. [52] was followed. However, this study distinguishes itself by concentrating specifically on the socio-economic performance of bioenergy within EU MSs. The variable selection was based on the research of Lasarte-Lopez [51] and D’Adamo et al. [52]. All information for the bioeconomy specific indicators was sourced from DataM. The detailed description of the variables—number of people employed, value added, and turnover in the bioenergy sectors—is given in the introduction of Section 3.
First, to ensure comparability of the data and to obtain a Gaussian distribution, the series were normalised by dividing each observation by the corresponding standard deviation:
S D = 1 n 1 i = 1 n ( k i k ¯ ) 2
where SD is the standard deviation, n is the number of observations, k i is the individual observation, and k ¯ is the mean of the sample.
The socio-economic performance of the bioenergy sector was assessed as follows:
SEIB = P V k 1 , c 1 , p 1 W P k 1 , p 1 W P k 1 , p 1 W S k 1 , p 1 W S k 1 , p 1 + P V k 1 , c 1 , p 2 P V k 1 , c 1 , p 2 W P k 1 , p 2 W P k 1 , p 2 W S k 1 , p 2 W S k 1 , p 2 + P V k 1 , c 1 , p 3 P V k 1 , c 1 , p 3 W P k 1 , p 3 W P k 1 , p 3 W S k 1 , p 3 W S k 1 , p 3
where PV represents the sector parameter value for year k = 1…n, country c = 1…n, and parameter p = 1…3; WP denotes the weight of socio-economic indicator for the bioenergy and biofuels sectors, respectively; and WS refers to the weight of the bio-based sector, as proposed by Lasarte-Lopez et al. [51]. D’Adamo et al. [52] determined the socio-economic indicator weight (WP) using Saaty’s [73] Analytical Hierarchy Process (AHP) method, relying on input from a panel of experts. The weights used have been taken as they are from the mentioned study. In a similar approach to their study, the following weights were applied to the corresponding indicators (Table 3):
The weights were maintained as constant throughout the sample.
To calculate the total SEIB, the indices from the two individual sectors were combined. As seen above, WP represents the weight assigned to the socio-economic indicator for the bioenergy and biofuels sectors, as put forward by Morone et al. [70], while WS indicates the weight for the bio-based sector, following Lasarte-Lopez et al. [51]. Taking into account the weights for the two bioenergy sectors [51,74], the equation becomes
S E I B = k = 1 n P V   B B E k = 1 , n ; c = 1 , n p = 1 , 3 W P   B B E p = 1 , 3 W S   B B E k 1 , p 3 + P V   L B k = 1 , n ; c = 1 , n p = 1 , 3 W P   L B p = 1 , 3 W S   L B k 1 , p 3
where BBE and LB denote the two sectors, bioenergy and biofuels. SEIB was computed yearly to obtain a time series.

4. Results

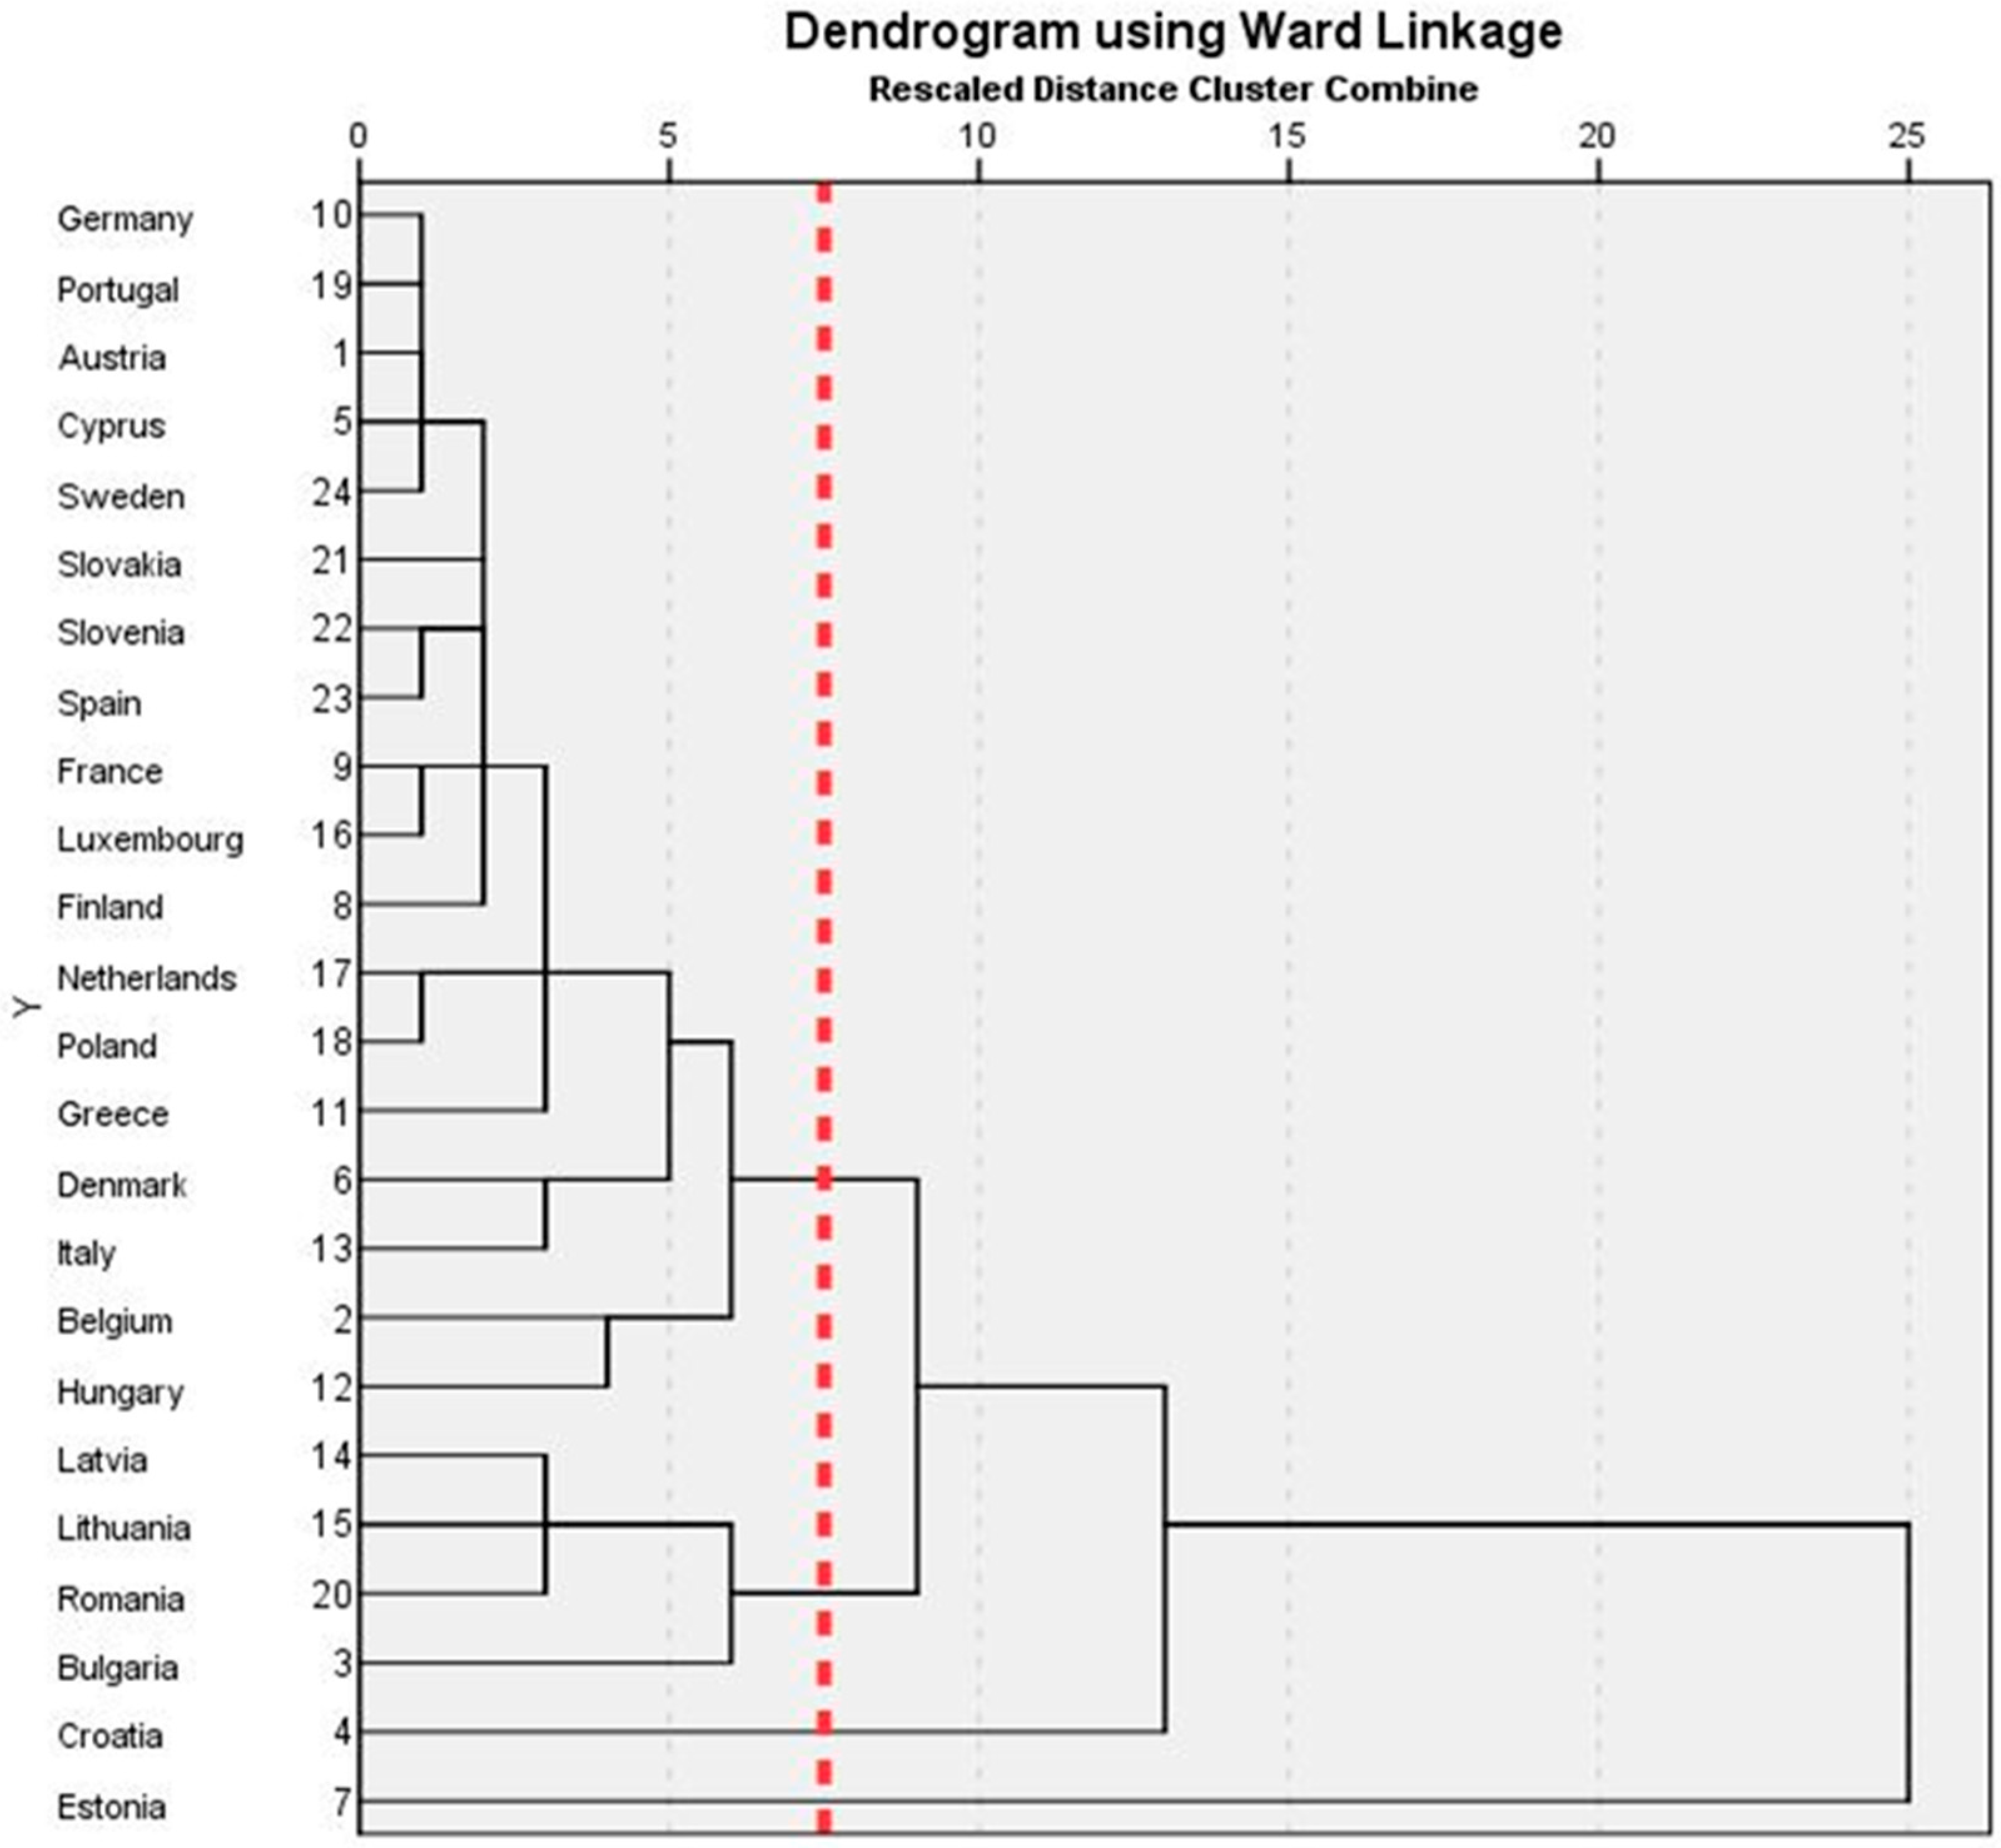
4.1. Cluster Approach
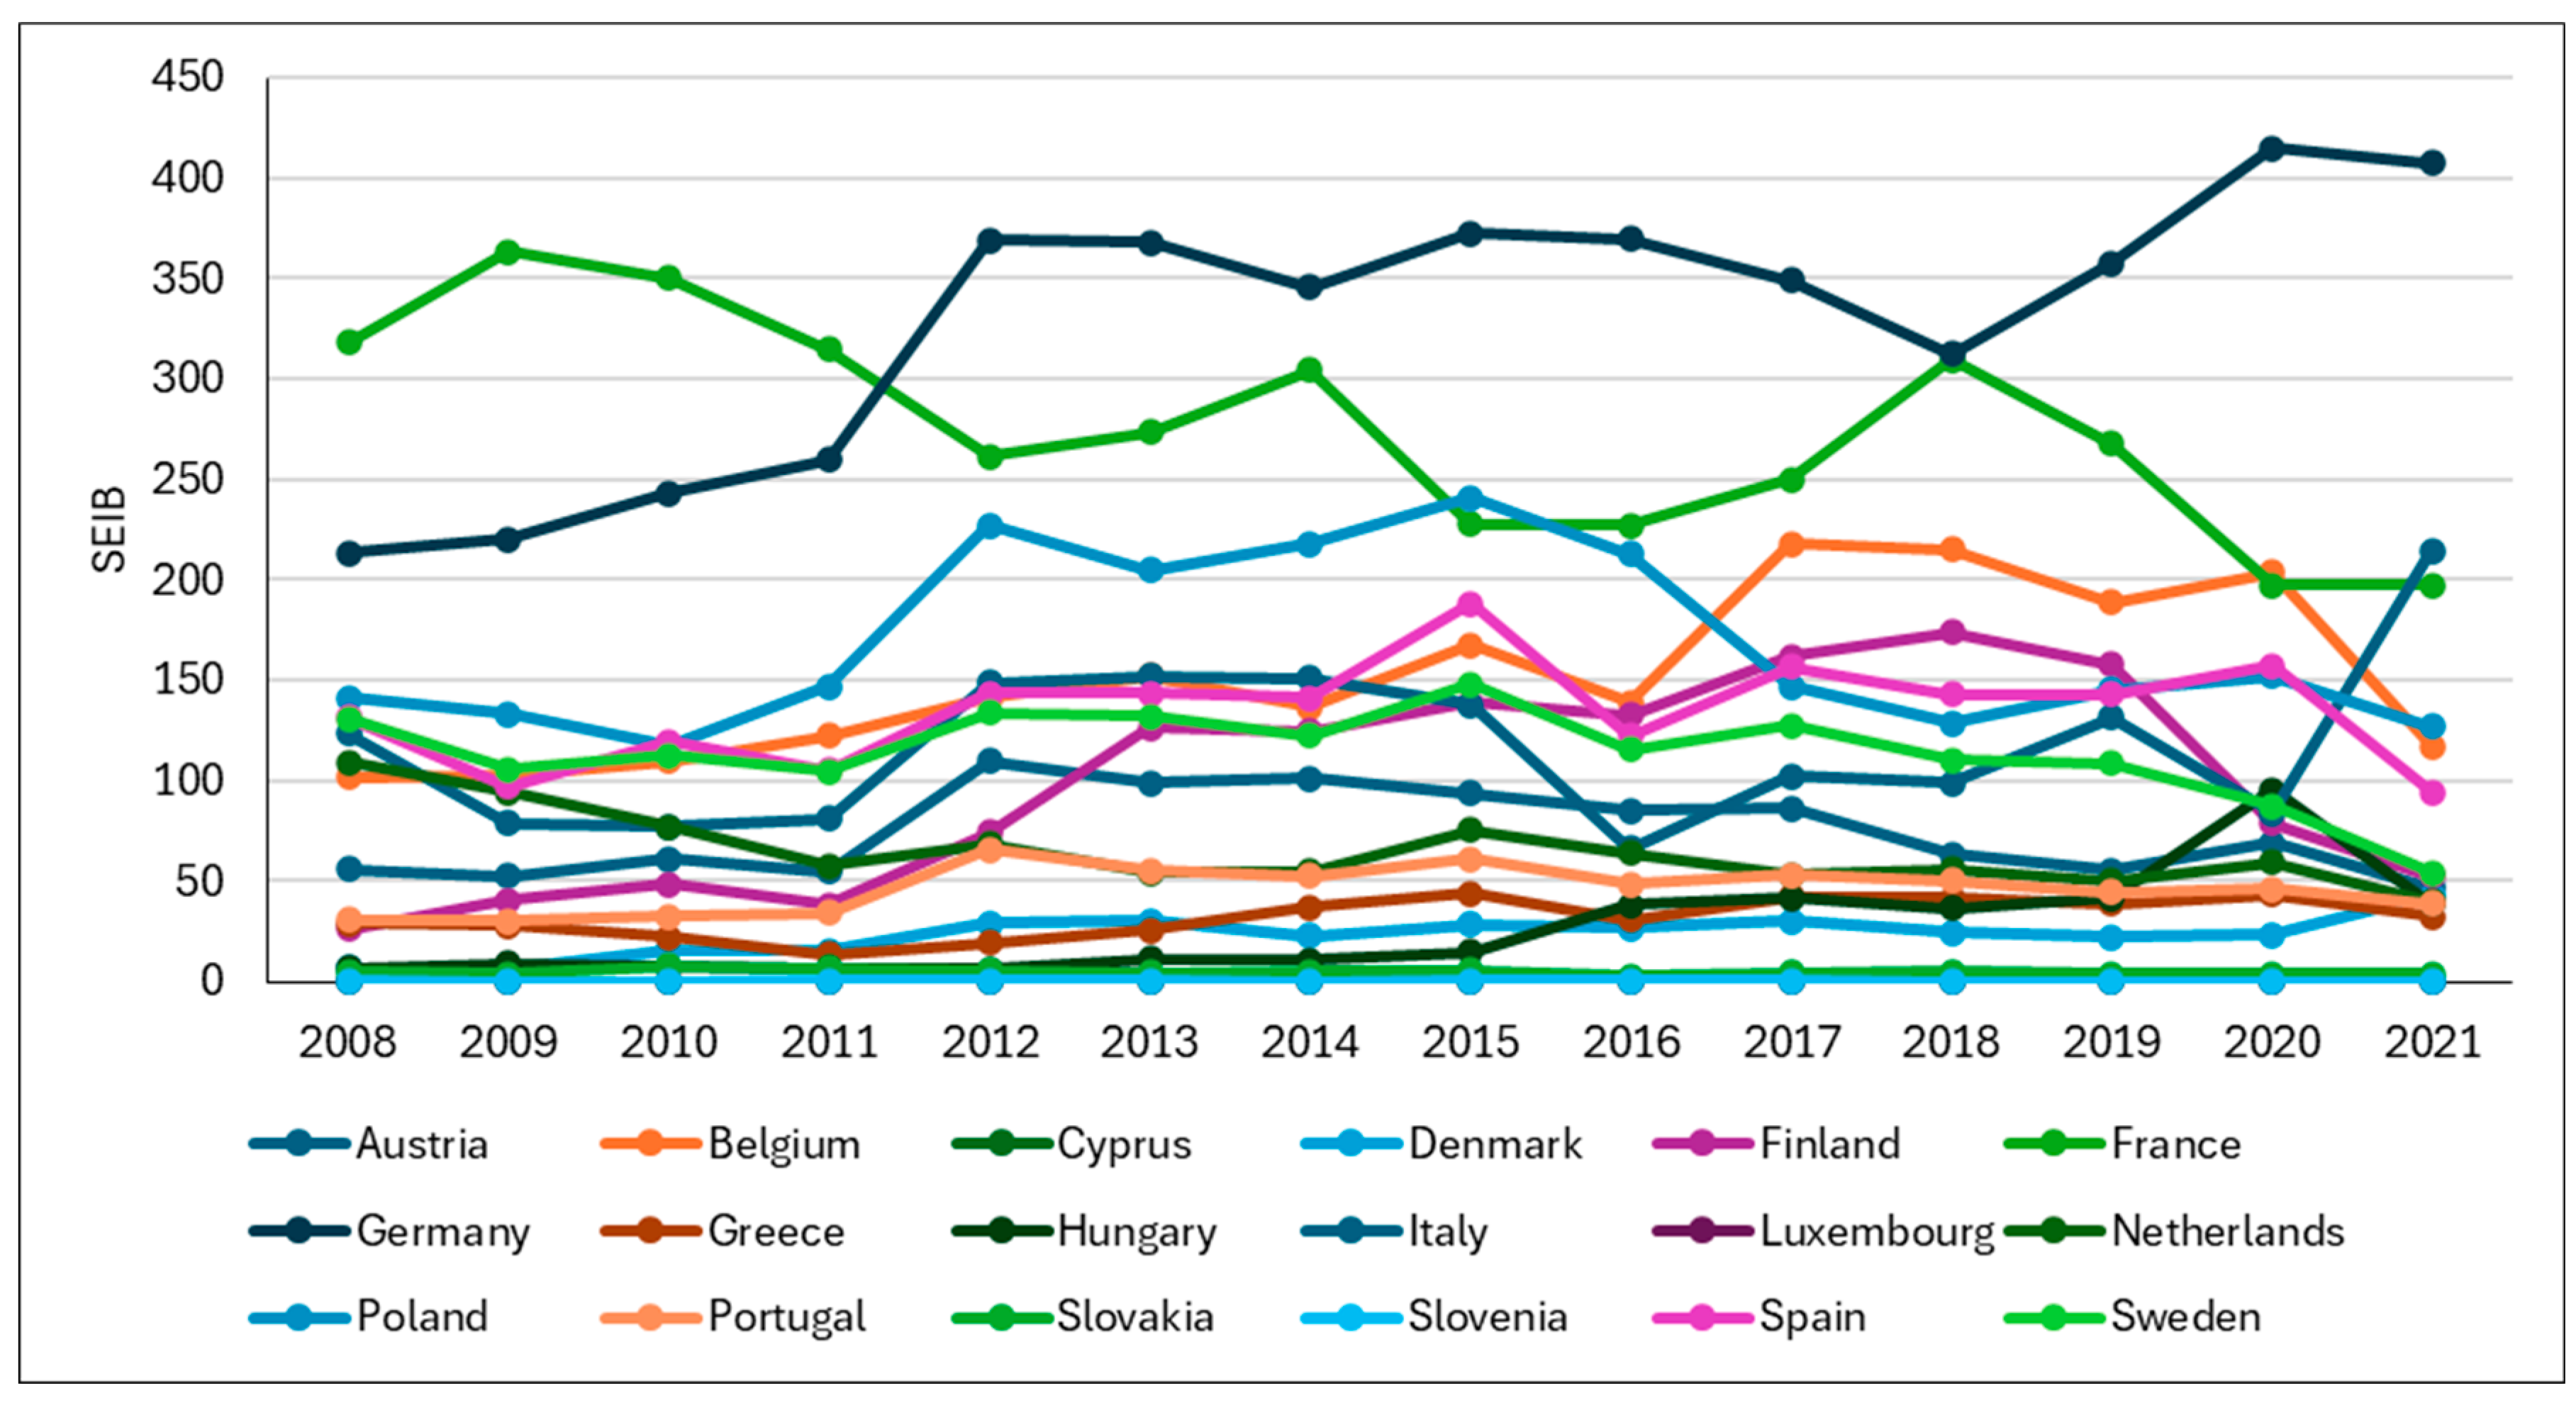
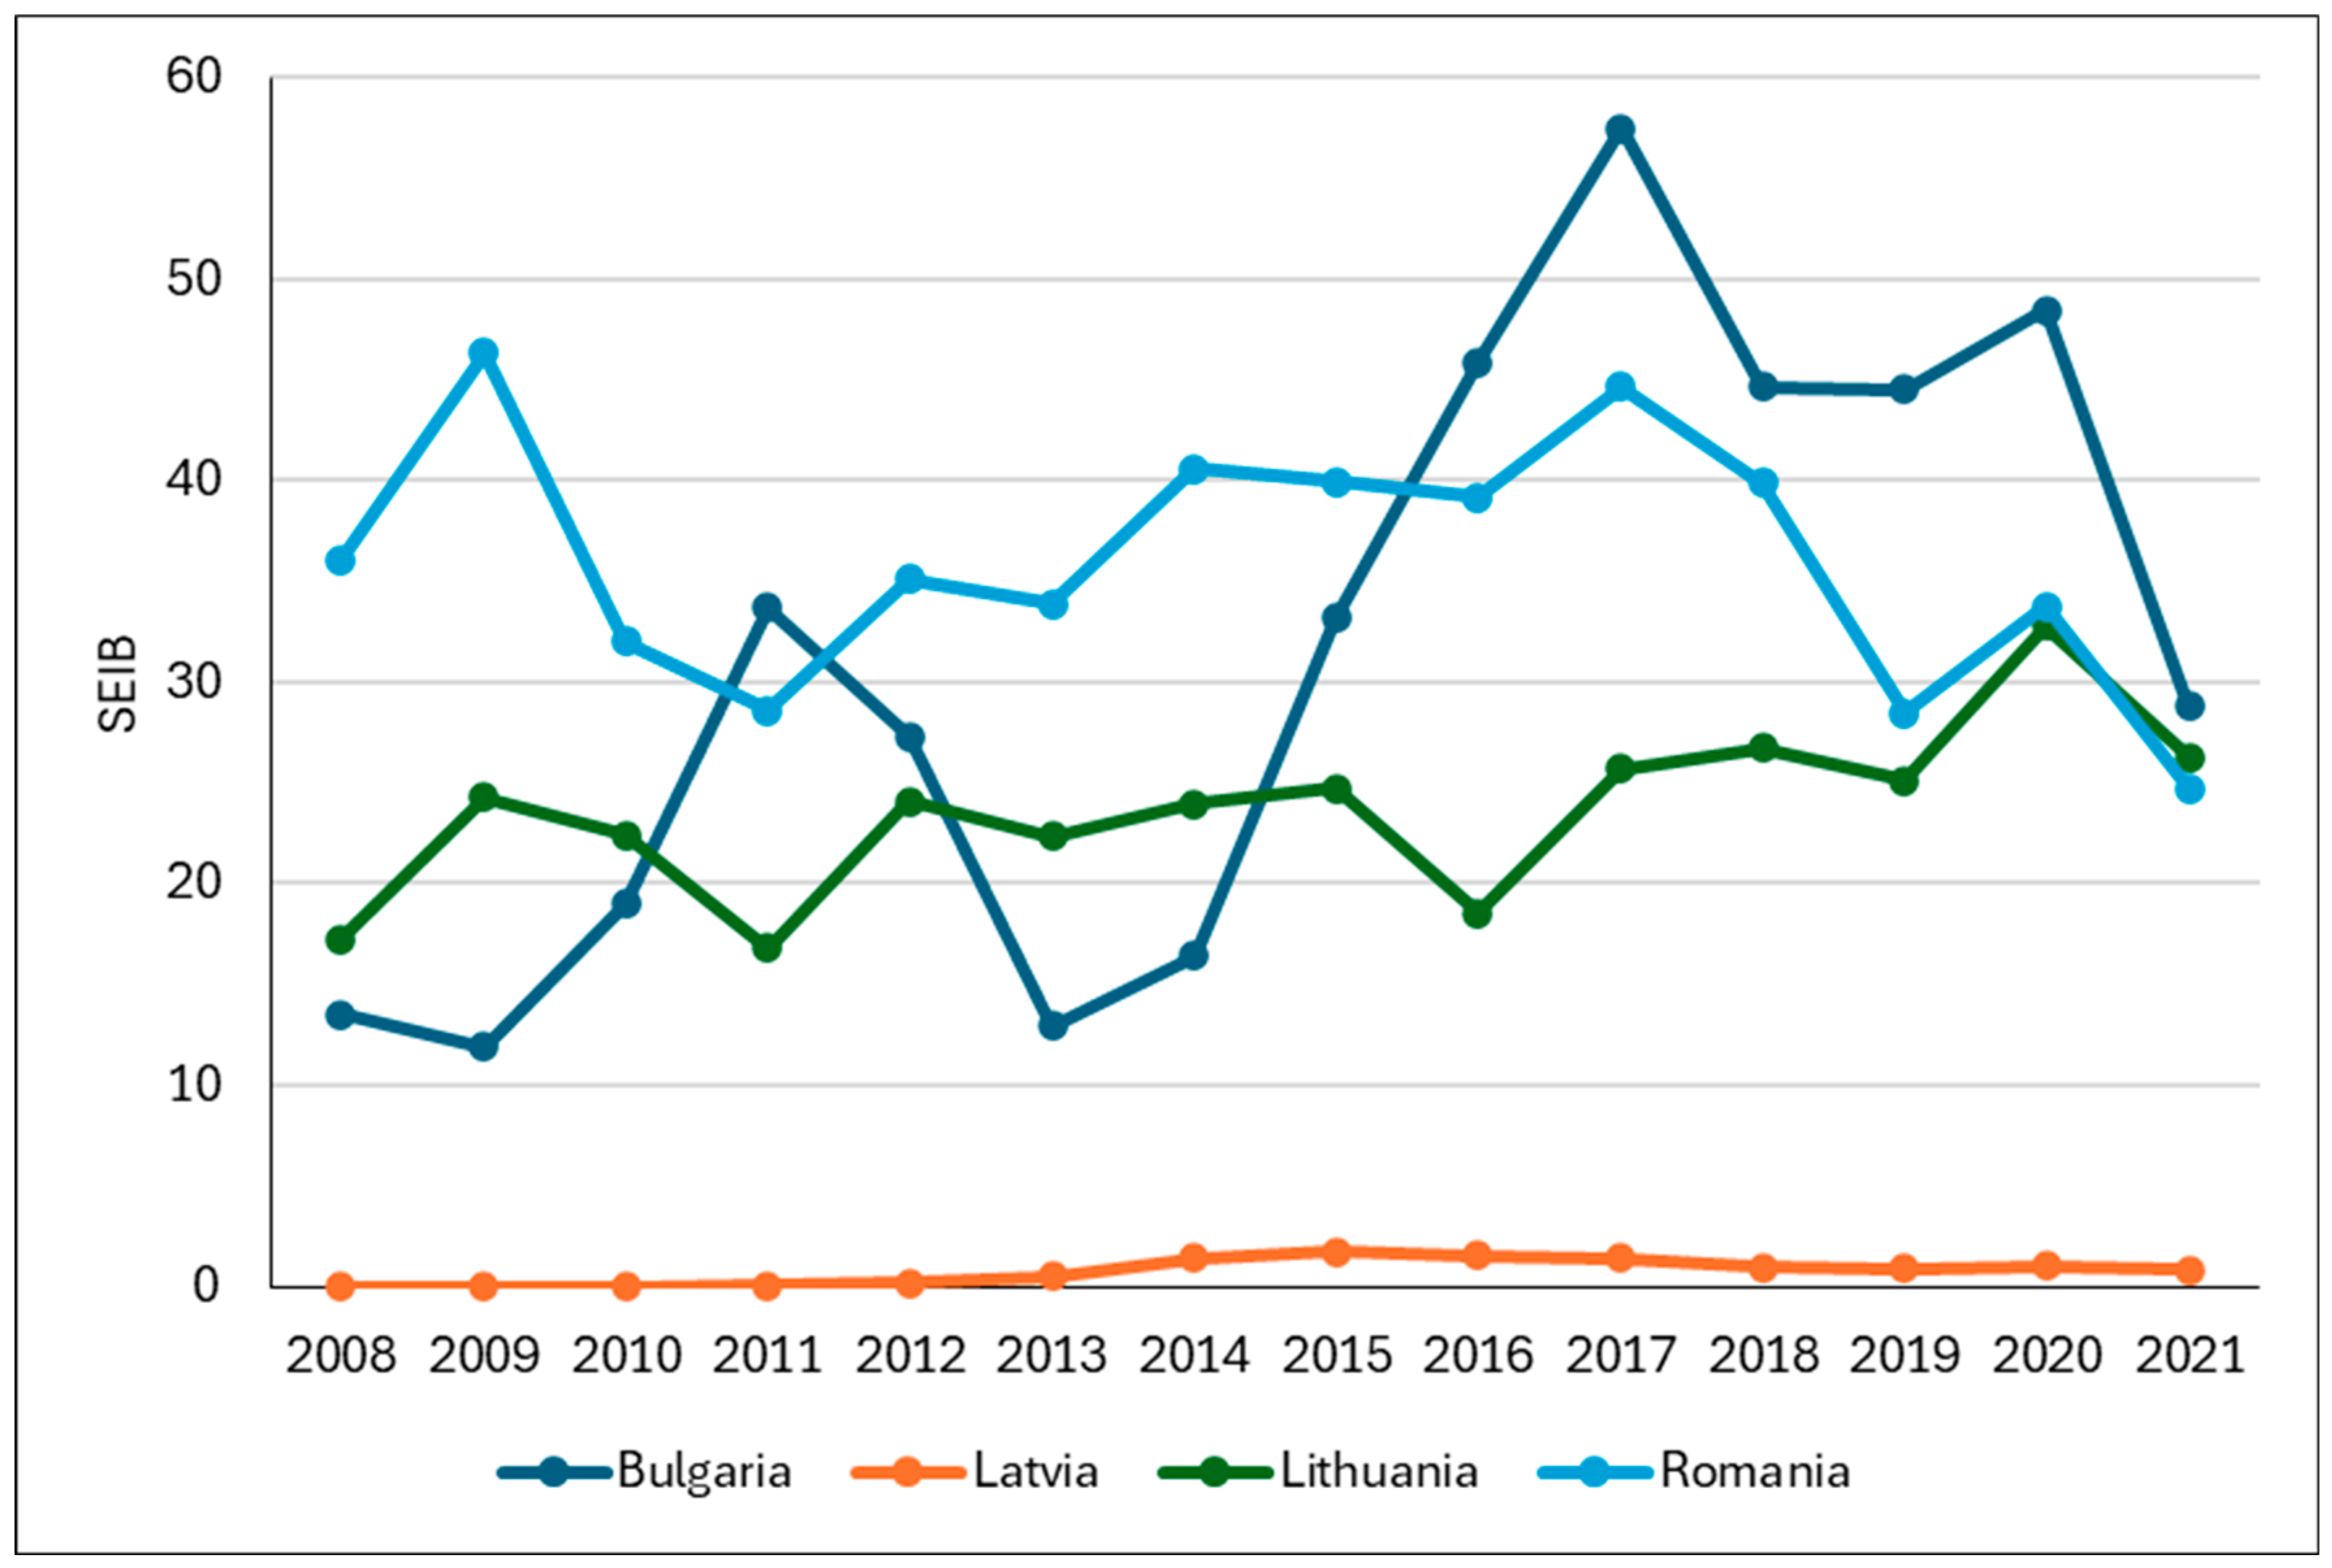
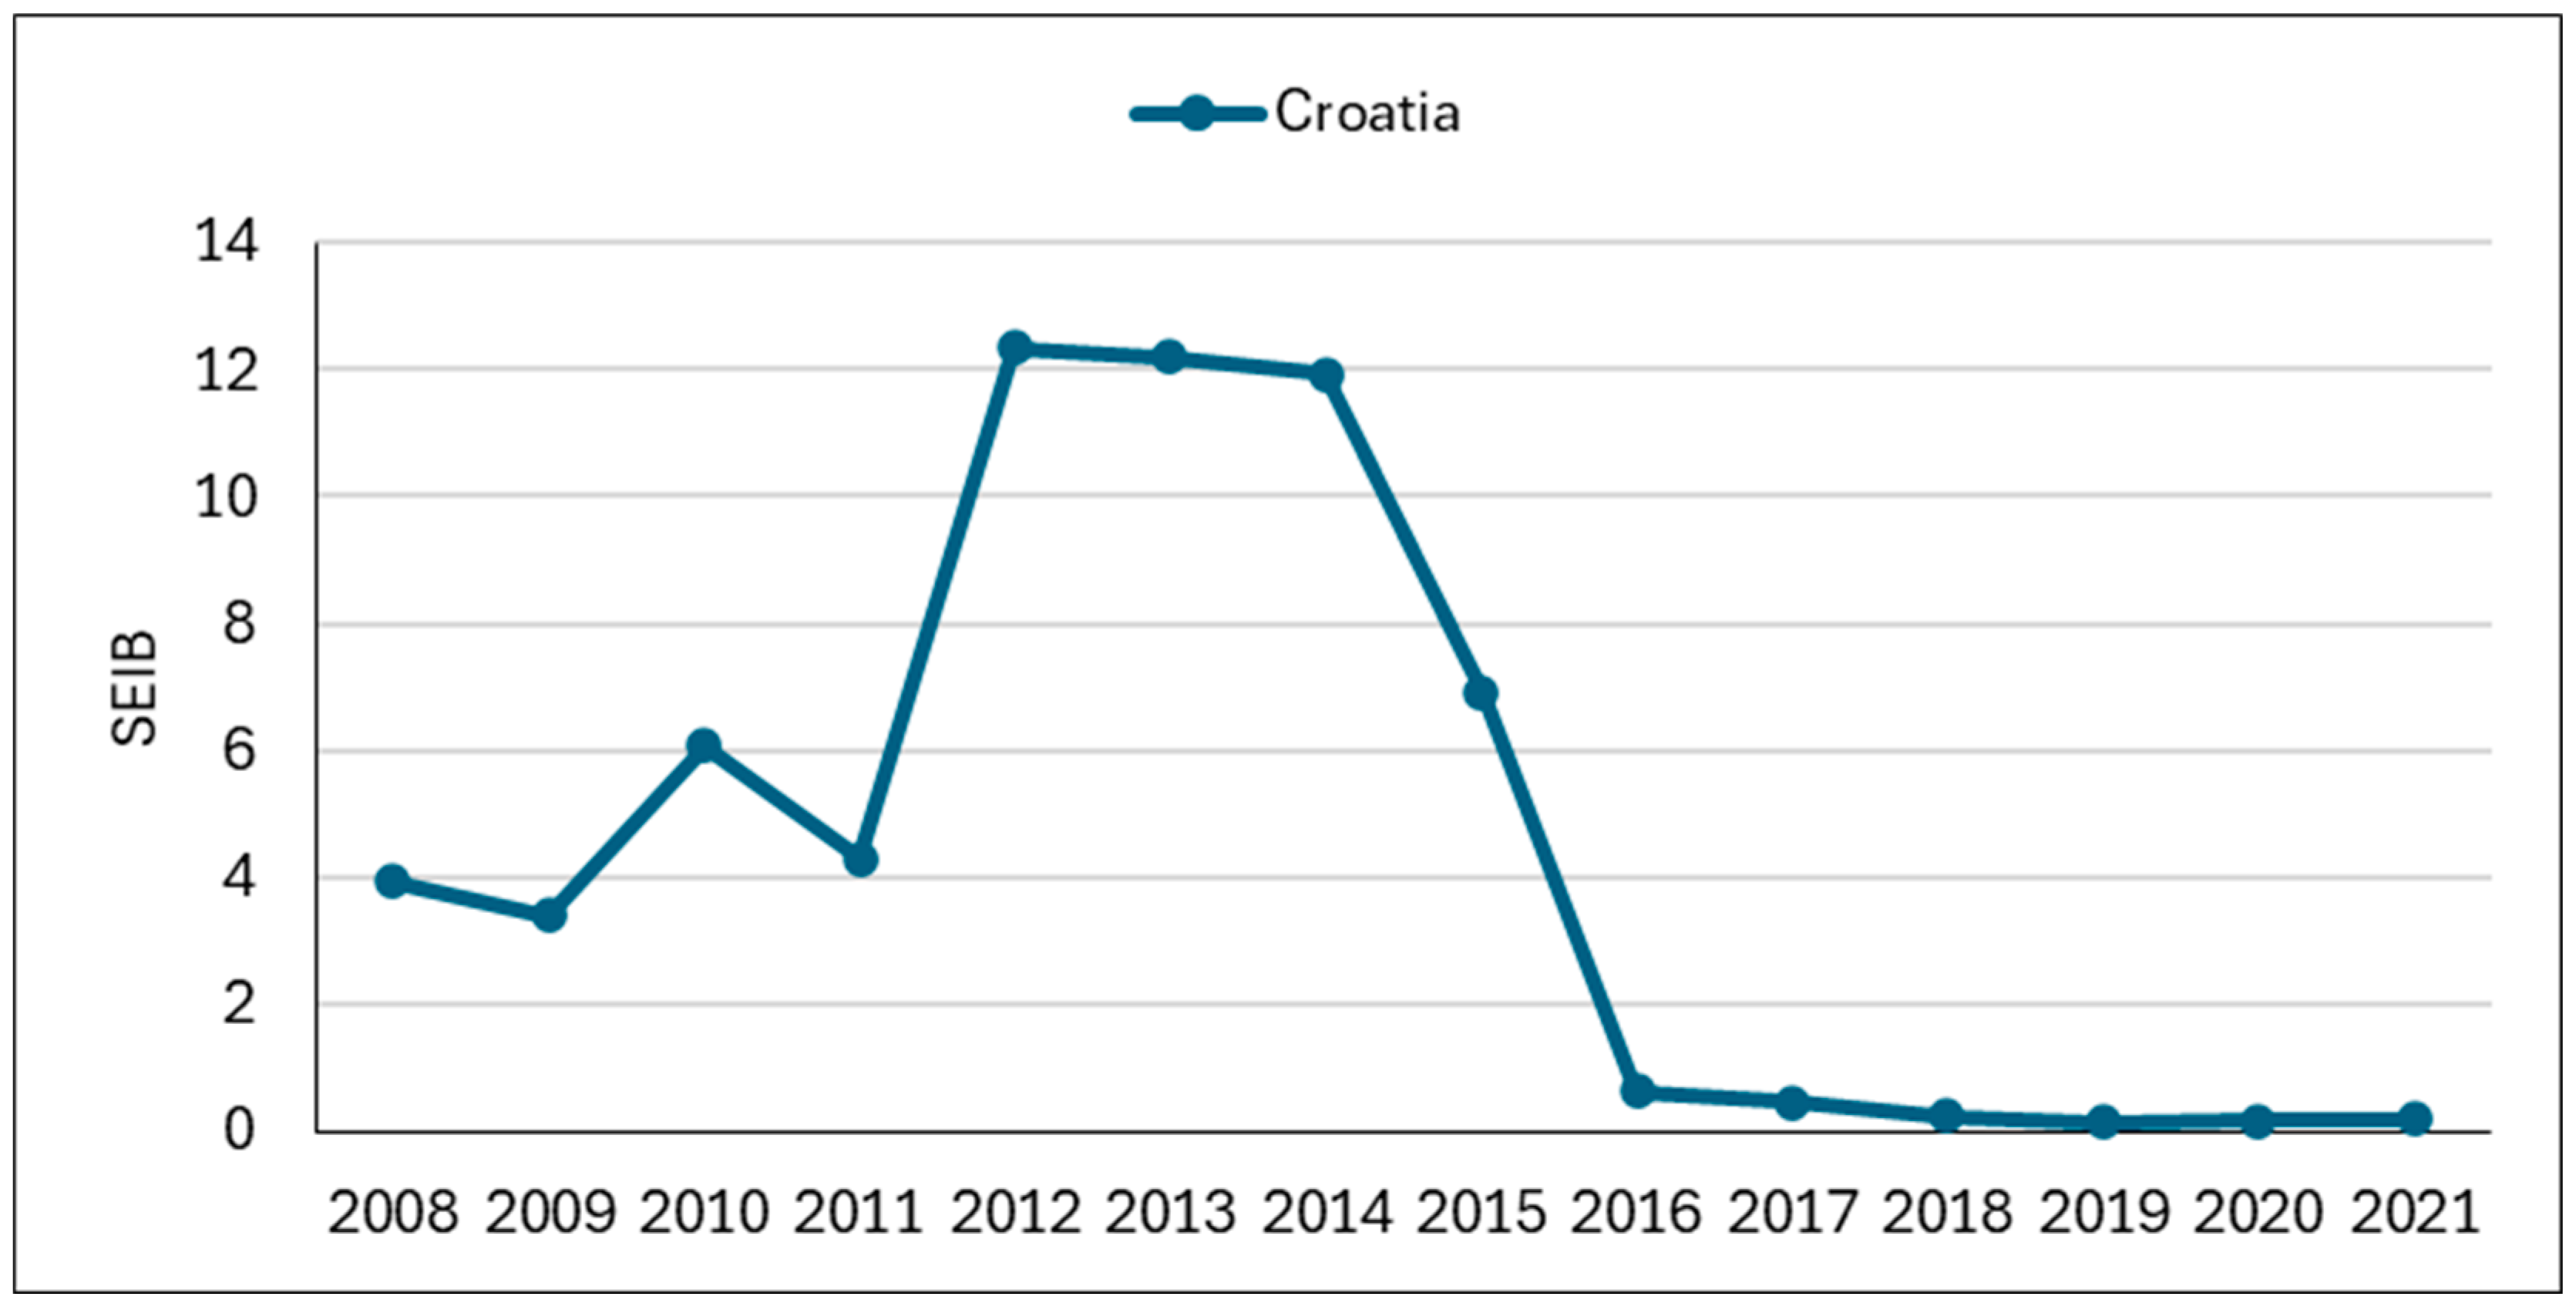
The cluster analysis of variables related to the energy sectors within the bioeconomy reveals an uneven distribution among the MSs of the EU. To evaluate the robustness of the clusters, a dendrogram representation was employed. The number of clusters is not determined automatically but through an analysis of proximity coefficients and the graph, which visualises the distances between connected elements. These distances are transformed onto a scale ranging from 0 to 25 while maintaining the ratio of the distances (Figure 1).
From the research on coefficients and the dendrogram generated in SPSS, the iterative process was halted at 7.5, resulting in the grouping of data into four clusters. Various halting levels were tested previously, but no clustering of countries occurred at levels either above or below 7.5. As can be seen from the dendrogram up to step 13, Croatia forms a cluster by itself, while Estonia does so at step 25.
The first and largest group of countries includes Austria, Belgium, Cyprus, Denmark, Finland, France, Germany, Greece, Hungary, Italy, Luxembourg, the Netherlands, Poland, Portugal, Slovakia, Slovenia, Spain, and Sweden. A second set of states is formed by Bulgaria, Latvia, Lithuania, and Romania (Figure 2).
Figure 2 illustrates the distribution of states across each of the four generated clusters.
As can be seen in Table 4, the descriptive statistical analysis shows that the countries from Cluster 1 have the most compact values around the average for V_1 and V_2. The most compact values around the average are found in V_3 states from Cluster 2. The nations in Cluster 3 have the most widely distributed values for V_2 and V_3 (Table 4).
The datasets of each cluster verify the null hypothesis at a 95% confidence level, according to the p-values obtained from the ANOVA analysis [69] (Table 5). The null hypothesis (H0), which states that there are similarities between the series, is accepted, and the alternative hypothesis (H1) is rejected because a p-value > 0.05 is found for each of the variables entered in the model and for each of the clusters that were constructed.
Table 5 presents the results of the variance analysis test, also known as ANOVA, which compares the explained variance, generated by the input fields, with the unexplained variance, arising from the error source. Analysis of variance (ANOVA) is a linear modelling technique used to assess the relationship between fields to determine whether the mean values differ.
The level of the F < F crit in the ANOVA table indicates the ranking variable that best explains how the clusters formed [68]. The greatest values were recorded by VAFC BBE variable (F = 0. 6889 in Cluster 1), TRN BBE (F = 0.6385 in Cluster 1 and F = 0.5906 in Cluster 2), and NPE BBE (F = 0.56653 in Cluster 1). As the highest values of F show, the highest compatibility is among the countries in Cluster 1 for the bio-based electricity sector. It can be concluded that all of the variables in each group had p-values ≥ 0.05, which indicates statistical significance at a 95% confidence level. Consequently, H0 is approved, and the countries that are included meet the criteria to join the cluster.
The disparity between Cluster 1 and the other clusters indicates an unbalanced approach to the bioeconomy sectors focused on renewable energy in the MSs. This is in line with the findings of Firoiu et al. [75].
A commonality of Cluster 1 lies in the diversification of biomass sources used for bio-based electricity and biofuel production. Countries from Cluster 1 are increasingly focusing on second- and third-generation biofuels, which utilise non-food feedstocks such as agricultural waste and forest biomass, to minimise impacts on food security and the environment. From this perspective, the findings are in line with those of Ranta et al. [46] and Mandley et al. [76]. Additionally, all these states are engaged in research and development initiatives to enhance production efficiency [47] and reduce the carbon emissions associated with bioenergy [77].
The states from Cluster 2—Bulgaria, Latvia, Lithuania, and Romania—are all at roughly similar phases of development. The similarities among them in the bio-based electricity and liquid biofuels sectors are rooted in their shared reliance on locally available biomass, such as agricultural residues and wood. This approach reflects both the abundant availability of these resources and the relatively lower implementation costs compared to other renewable technologies like wind or solar energy. In line with Proskurina et al. [78], and Srebotnjak and Hardi’s [79] results, these states have great potential for producing bio-based energy due to their substantial forest resources and large agricultural activity. This industry is still growing and modernising in many instances. Although still small, the development of liquid biofuels like bioethanol and biodiesel is gaining traction.
Underdeveloped infrastructure, stringent EU sustainability standards, and a reliance on biofuels derived from palm oil are some of the issues preventing Croatia’s bioenergy sector from diversifying and expanding. These characteristics underpin Croatia’s uniqueness and its propensity to form a cluster by itself, and Kaniapan et al. [80] reached a similar conclusion.
Estonia’s singularity derives from it benefitting from biomass and wind but struggling with oil shale dependence and limited biofuel integration due to fossil fuel competition. The sustainability of Estonia’s oil industry has been uncertain throughout recent years according to Kallemets [81].

4.2. SEIB Analysis

The SEIB index for Cluster 1 is depicted in Figure 1. The first cluster is the most numerous one among the four. The evolution from the economic and social points of view of the bio-based electricity and liquid biofuels sectors of Germany must be emphasised again, which is located just above France. Within Cluster 1, Germany and France stand out, having recorded the highest cumulative index value among all EU MSs for the two sectors analysed. While France’s SEIB trend showed a decline, Germany experienced fluctuations between 2012 and 2018. However, in the last three years analysed, Germany’s trend has outperformed that of the other countries in Cluster 1 (Figure 3).
The dynamics of SEIB for the constituent states of Cluster 1 are shown in Figure 3 for the period 2008–2021.
Germany is one of the leading countries within the EU, having actively developed its national bioeconomy strategies. In 2013, a “Bioeconomy Policy Strategy” was adopted, followed by a Progress Report and a national research strategy in 2016. Additionally, in 2010, a national bioeconomy research strategy, titled “National Research Strategy Bioeconomy 2030: The Path to a Sustainable Economy”, was implemented. In France, a national strategy specifically dedicated to bioeconomy, titled “A Bioeconomy Strategy for France”, was published in January 2017, with an action plan released in February 2018. In some regions of France, local bioeconomy strategies are being developed, along with regional bioeconomy roadmaps.
The second cluster presents a rather surprising composition, featuring Romania, Bulgaria, Lithuania, and Latvia (Figure 4), each exhibiting a distinct dynamic, although at very similar levels. These countries have SEIB values exceeding 10 points, yet their dynamics have varied over the 14 years of analysis. Romania led the SEIB rankings in the region, but the index shows a downward trend towards the end of the period. Despite a decline in the employed population within the two renewable energy sectors, Romania’s production performance improved due to technological advancements. Nevertheless, Romania remains one of the lowest performing countries in the group in terms of value added in these two sectors. Romania’s low performance in the bioenergy and biofuels sectors stems from a mix of policy, economic, and technological challenges. These include inconsistent government policies and limited incentives that discourage investment, outdated technology due to low research funding, and fragmented agricultural land that hampers efficient biomass collection [82]. Despite significant biomass potential from agricultural residues, the country lacks the adequate infrastructure and processing facilities to convert this into high-value bioenergy products. Moreover, competition for biomass in traditional uses like heating and limited public awareness further restrict sectoral growth. To address these issues, Romania needs consistent policies, increased R&D investment, and enhanced infrastructure for bioenergy production [83]. In contrast, Bulgaria has demonstrated a marked upward trend since 2014. Romania, Bulgaria, and Lithuania registered sensible decreases in SEIB with the onset of the pandemic crisis.
The SEIB calculated for the period between 2008 and 2021 for the states comprising Cluster 2 is graphically presented in Figure 4.
Cluster 3 includes Croatia (Figure 5). Croatia’s total SEIB experienced major fluctuations, rising from 4.3 in 2011 to 12.3 in 2012, before sharply decreasing to 0.6 in 2016, following three consecutive years of stagnation. Croatia’s bioenergy production is almost entirely dependent on fossil fuel imports, with its supply sourced from neighbouring countries [84]. Political support prioritised biomass over natural gas for home heating.
Figure 5 presents the SEIB dynamics of Croatia between 2008 and 2021, as it is the only country comprising Cluster 3.
The significant shift from natural gas production to bioenergy for heating residential buildings, along with a reduction in gas consumption in industry, were the main factors driving the sharp decline in natural gas demand in Estonia, from 701 million cubic meters (mcm) in 2010 to 477 mcm in 2021 [85]. This is shown in the dynamics of SEIB level in Estonia (Figure 6).
To conclude, the SEIB index analysis highlights the diverse performance trends among EU countries in the bioenergy and biofuels sectors, reflecting varied national strategies and resources. Germany and France lead in cumulative SEIB values within Cluster 1, demonstrating strong bioeconomy initiatives, though with differing trajectories—Germany showing recovery and growth after fluctuations and France declining. Cluster 2, featuring Romania, Bulgaria, Lithuania, and Latvia, shows regional dynamics influenced by technological progress, policy inconsistencies, and the pandemic’s impact. Romania’s significant biomass potential remains underutilised due to structural and policy limitations. Bulgaria has exhibited upward trends since 2014, contrasting with Romania’s decline. Meanwhile, Croatia’s dependency on imported fossil fuels underscores the variability within Cluster 3, while Estonia’s shift from natural gas to bioenergy for heating showcases strategic adaptation to reduce fossil fuel reliance. Disparities in technological progress significantly impact the SEIB results by influencing productivity, policy effectiveness, and overall sectoral performance across EU MSs. Technological advancements drive better utilisation of resources, higher efficiency, and stronger economic integration of bioenergy systems, which is reflected in the SEIB index rankings. Germany’s recovery highlights effective bioenergy innovation, while France’s decline suggests challenges in sustaining competitiveness. In Cluster 2, Romania’s underutilised biomass potential reflects policy and technological constraints, whereas Bulgaria’s steady growth since 2014 indicates successful advancements. Croatia’s reliance on fossil fuel imports hampers SEIB progress, contrasting with Estonia’s strategic shift to bioenergy, which enhances its standing. These trends underscore the critical role of technological adaptation and policy alignment in maximising bioenergy potential across regions. Moreover, these varied trajectories emphasise the need for tailored policies and investments to maximise bioenergy potential across regions.

5. Discussion

The regional dynamics of bioenergy production also reveal disparities in productivity and technological advancement among EU countries. For instance, countries with a higher GDP per capita tend to exhibit greater labour productivity in the biofuels sector [86,87]. This suggests that economic development plays a crucial role in the efficiency and effectiveness of bioenergy utilisation. We recognise that technological progress in bioenergy plays a crucial role in shaping its socio-economic impact by boosting energy security, generating economic opportunities, and supporting environmental sustainability. Technological progress might actually be at the very core of the disparities identified. The differences among the clusters generated by SPSS reveal the high level of labour productivity in the bioeconomy sectors of developed EU countries [86], as well as the advanced state of technologies employed in the renewable energy sector.
In the context of the bio-based electricity and liquid biofuels sectors, Cluster 1 countries exhibit significant similarities within the EU. Most of these MSs encourage the use of renewable resources as part of their energy transition and have adopted measures to promote the use of biofuels in the transport sector. These states have implemented national and local policies supporting the development of bioenergy, aiming to reduce reliance on fossil fuels and achieve EU’s sustainability objectives [33,76]. Most of the Cluster 1 countries generate electricity from biomass, which includes wood, organic waste, and agricultural waste, thereby increasing the share of renewable energy in their national energy mixes [88]. These countries encourage the manufacture and use of biofuels, mostly for transportation, such as bioethanol and biodiesel. This lessens their reliance on fossil fuels.
There are significant parallels between the liquid biofuels and bio-based electricity industries in Cluster 2 countries, especially regarding their integration of renewable energy technologies and dependence on biomass supplies. Due to the necessity for energy security as well as environmental concerns, each of these nations has been aggressively growing its bioenergy industries. In Bulgaria, the production of biogas from agricultural waste, particularly manure, has been a foreground point. Research indicates that Bulgaria has established numerous biogas power plants, with a total capacity of approximately 38.7 megawatts (MWs), primarily utilising farm animal manure as feedstock [88]. This trend reflects a broader European movement towards enhancing energy efficiency and reducing GHG emissions through renewable sources [89]. Similarly, Romania has been exploring the potential of biogas and biomass for energy generation, focusing on the integration of biorefineries that convert agricultural residues into biofuels and bioelectricity [90].
Lithuania and Latvia also share this commitment to bio-based energy. Lithuania, for instance, has been investing in biomass technologies, with a significant emphasis on the development of renewable electricity from biomass sources [91]. The country has been exploring various methods for enhancing the efficiency of biomass conversion processes, including pyrolysis and gasification, to produce both biofuels and electricity [92]. Latvia has similarly focused on biomass energy, leveraging its abundant forest resources to produce wood pellets and other biofuels, which contribute to its energy mix and reduce dependence on fossil fuels [93].
The techno-economic analyses conducted across these nations reveal a common challenge: the need for technological advancements and economic incentives to enhance the viability of bio-based energy systems. For instance, the integration of electro-chemical conversion technologies, such as fuel cells, has been highlighted as a promising avenue for improving the efficiency of biofuel production and electricity generation [94,95]. This aligns with the findings in Romania, where the development of integrated biorefineries is seen as crucial for optimising biomass utilisation [90].
Bulgaria, Latvia, Lithuania, and Romania have adopted national policies that support the use of bioenergy, in line with the EU’s objectives [96]. For example, each of these states has implemented measures to encourage the production of biofuels, particularly from local biomass sources such as agricultural waste and energy crops [97].
Another common aspect is the focus on second-generation biofuels, which utilise non-food feedstocks, thereby helping to reduce the impact on food security and the environment [98]. The four countries from the second cluster have begun to explore the potential of biofuels from waste and forest biomass, allowing them to enhance the sustainability of their bioenergy sectors [96]. Additionally, Bulgaria, Latvia, Lithuania, and Romania collaborate within regional initiatives to share best practices and innovative technologies in the bioenergy field, contributing to the development of a more efficient bio-based economy. Similar conclusions were drawn by Philippidis et al. [96]. Moreover, these countries face similar challenges regarding the implementation of sustainability standards for biofuels, necessitating better coordination between national policies and European regulations [99]. Thus, by adopting common strategies and promoting research and development in the bioenergy sector, Bulgaria, Latvia, Lithuania, and Romania can strengthen their position in the EU bioenergy market and contribute to the climate neutrality goals set by the EU [100].
Bulgaria and Romania focus on using biomass for electricity generation and promoting liquid biofuels for transportation, aligning with the EU’s Renewable Energy Directive [7,101]. Latvia and Lithuania have undertaken initiatives to utilise wood and forestry residues as primary resources for biofuels and bioenergy [102]. In Lithuania, for instance, wood and wood waste constitute the main sources for bioenergy, with energy policies strongly supporting the expansion of bioenergy and biofuel production. The Cluster 2 countries exhibit a high dependence on local biomass resources and emphasise improving the efficiency of resource use to meet EU climate and energy targets.
Cluster 3—Croatia’s bio-based electricity and liquid biofuels sectors include a less developed energy infrastructure compared to other EU MSs, which may limit the integration of renewable energy sources into the power grid [103]. Additionally, challenges related to sustainability regulations and standards could hinder the growth of the bioenergy sector, especially given the strict requirements imposed by the EU [104]. Furthermore, Croatia faces intense competition from other EU countries that have advanced more rapidly in adopting renewable energy technologies [105]. Croatia has made progress in utilising renewable energy sources, with biomass and wind energy playing significant roles. However, compared to other EU countries such as Sweden or Finland, it lags behind in the overall share of renewable energy within its energy mix [32]. In the liquid biofuels sector, Croatia faces challenges related to its reliance on palm oil-based biofuels, which are subject to strict EU regulations. This reliance limits its ability to develop a sustainable and diversified biofuels industry [106]. Although a favourable legislative framework exists for the development of renewable energy, the infrastructure required to support a substantial increase in bioenergy production remains underdeveloped. This limits Croatia’s ability to fully exploit its bioeconomic potential [107].
Cluster 4—Estonia has achieved a considerable share of renewable energy in its gross final energy consumption, with biomass and wind energy playing pivotal roles. In 2020, approximately 37.6% of the country’s energy consumption came from renewable sources, placing Estonia in a competitive position compared to other member states [108,109]. A distinctive feature of Estonia’s energy sector is its heavy reliance on oil shale for energy production. While this contributes to energy security, dependence on fossil fuels, particularly oil shale, represents a significant weakness in transitioning to a low-carbon economy [110]. Although Estonia produces biofuels, their integration into the national energy mix remains limited. The production of biodiesel and bioethanol is hindered by stringent European regulations and competition with fossil fuels, posing challenges to the development of this sector [111]. Estonia has introduced supportive policies for renewable energy, such as feed-in tariffs. However, similarly to Croatia, the infrastructure required for bioenergy production remains undersized, limiting the full utilisation of the country’s bioeconomic potential [112].
It becomes obvious that CEECs face some common challenges. When it comes to producing bioenergy and integrating it into energy networks, many CEECs lack the necessary infrastructure. For example, Estonia’s infrastructure for producing biodiesel and bioethanol is still inadequate, and Croatia’s inadequate energy infrastructure restricts the capacity to scale renewable energy. Harmonising national policies with stringent EU directives, particularly sustainability regulations, poses significant challenges. Countries like Croatia and Estonia struggle with this compliance, which stifles innovation and investment in bioenergy sectors. Moreover, lower GDP per capita in the region affects the capacity to invest in advanced bioenergy technologies, exacerbating disparities in technological development compared to Western Europe.
On the other hand, a series of opportunities arise for CEECs through their abundant biomass resources. Countries like Latvia and Lithuania leverage their rich forest resources, while Bulgaria and Romania utilise agricultural residues, providing significant potential for bioenergy development. Regional collaboration among CEECs would allow for sharing best practices and new technologies, fostering innovation and reducing the technological gap with Western Europe. The exploration of non-food feedstocks, as seen in Bulgaria and Romania, aligns with EU sustainability goals and reduces conflicts between energy and food production.
The harmonisation of public support schemes for bioenergy towards a single clean energy market in the EU is recommended in the short term. This involves some major policy directions for MSs: the need for a comparative analysis of the efficiency of renewable energy support schemes across the EU to facilitate future harmonisation; the creation of national sustainability frameworks that are compatible with each other and with EU directives, developed in collaboration with the private sector, to promote the use of local resources such as forest or agricultural residues with no significant alternative uses; and the promotion of EU-wide research to assess the use of bioenergy at the local level, including its socio-economic impact and its influence on ecosystem services in related agricultural sectors [113].
The integration of the bioeconomy into biodiversity is achieved by adapting strategies to the geographical and socio-economic characteristics of each country, which vary from one national territory to another. Countries with limited biodiversity can adopt integration through coordination, considering the impact of bioeconomy development on biodiversity. In the case of industrialised countries that base their bioeconomy strategies on biomass imports, with specific biodiversity-related activities in other states with intrinsic natural benefits, specialists recommend aligning international legislation governing environmental policy, biosafety, and the equitable distribution of benefits [114].

6. Conclusions

This study highlighted the importance of socio-economic indicators in shaping the bioenergy landscape across EU MSs and contributed to the existing literature by offering a novel assessment of the socio-economic performance of bioenergy sectors within the EU. Both the cluster analysis and the SEIB indicator exhibited significant disparities in the development of the countries’ bioenergy sectors. Through the comprehensive cluster analysis, four distinct groups of countries were identified, reflecting varying levels of advancement and socio-economic outcomes in the bio-based electricity and liquid biofuels sectors. Western European countries—notably, Germany, France, Italy, Belgium, Finland, and Sweden—exhibited highly developed bioenergy infrastructures, primarily fuelled by biomass. These nations benefitted from early investments and robust policy frameworks supporting bioeconomy initiatives, which led to higher employment, turnover, and value added at factor cost in bioenergy sectors. There was a growing trend of collaboration among these countries from Cluster 1 in the field of bioenergy, which facilitated the exchange of best practices and innovative technologies [40]. This cooperation was vital for achieving the climate neutrality goals set by the EU [76].
In contrast, several CEECs, with the notable exception of Poland, lagged behind in the development of these sectors, underscoring the need for customised policy interventions and financial support to bridge this divide. In the second group, Bulgaria, Latvia, Lithuania, and Romania displayed different dynamics but in a very similar SEIB range. Croatia and Estonia each formed their own individual cluster. While Western European countries had highly developed energy sectors based on biomass sources, CEECs needed to make substantial efforts to narrow the gap.
Bulgaria, Latvia, Lithuania, and Romania demonstrated a concerted effort to develop their bio-based electricity and liquid biofuels sectors. Their strategies included leveraging agricultural waste for biogas production, investing in biomass technologies, and addressing the environmental implications of biofuel production. The ongoing collaboration and knowledge sharing among these nations will be essential for overcoming the challenges they face and advancing towards a renewable energy future. These four countries exhibited a high dependence on local biomass resources and emphasised improving the efficiency of resources used to meet EU climate and energy targets. Also, these nations worked to improve their infrastructure and attracted investments in bio-based technologies, leveraging their abundant natural resources and the need to diversify their energy mix. Croatia has held considerable potential in the bio-based electricity and liquid biofuels sectors but must overcome specific infrastructural and regulatory challenges to maximise its contribution to the EU’s sustainability goals. Estonia faced significant challenges in the bio-based energy and liquid biofuels sectors, despite the progress it made in utilising renewable energy sources. Addressing these weaknesses will be crucial to enhancing the competitiveness and sustainability of Estonia’s energy sector.
The analysis was based solely on secondary data, which may have contained inconsistencies or gaps. While primary data could have been superior to secondary data, in this particular field, they are a lot more difficult to obtain, requiring large-scale actions at the national and international levels. The inconsistent statistical data in the two bio-energy industries across all 27 MSs restricted the investigation. Disparities in data availability across EU countries also presented limitations to the analysis, emphasising the need for consistent and comprehensive data collection practices in future research. Data limitations may have introduced some biases and affected the depth of analysis, though the exclusion of three countries had only a minor impact on comprehensiveness. Gaps in sector-specific data can make cross-country comparisons more challenging and may obscure certain regional trends. While reliance on secondary data could lead to some inconsistencies, and the absence of primary data may limit insights into specific nuances and emerging trends, the study still provides a valuable overview of bioenergy dynamics across the EU.
These insights can inform future strategies aimed at fostering equitable growth and development within the EU’s bioeconomy, particularly in regions currently facing barriers to bioenergy advancement. This analysis also emphasises that global bioeconomy strategies can benefit from tailored, region-specific approaches that address local disparities in bioenergy development and foster collaboration for knowledge and technology exchange, which utilise socio-economic indicators to evaluate impacts. Sustainable methods and standardised data collection are essential for striking a balance between environmental objectives and socio-economic advantages like employment and energy security. Countries may create resilient and equitable bioeconomy strategies that promote sustainable growth and international climate action, learning from the EU’s varied experiences.
This research may serve as a foundation for further sector-specific studies and will open avenues for academic and practical advancements in bioeconomy-driven renewable energy solutions across the EU. Delving deeper into the impact of biotechnological processes and techniques on the social and economic dimensions of bioenergy could be a logical upcoming step. This could help with understanding even better what underpins the strengths and weaknesses of the MSs with respect to bioenergy production.

Author Contributions

Conceptualization, E.M.B. and C.G.Z.; methodology, E.M.B. and C.G.Z.; software, E.M.B., C.G.Z., C.M.C. and M.P.C.; validation, L.M.C., M.I., C.G.Z. and E.M.B.; formal analysis, C.G.Z., E.M.B., C.M.C. and M.P.C.; investigation, C.G.Z. and E.M.B.; resources, M.P.C., C.M.C., E.M.B. and C.G.Z.; data curation, L.M.C., M.I., E.M.B. and C.G.Z.; writing—original draft preparation, C.G.Z. and E.M.B.; writing—review and editing, C.G.Z. and E.M.B.; visualization, C.G.Z., E.M.B., C.M.C. and M.P.C.; supervision, L.M.C., M.I., C.G.Z. and E.M.B. All authors have read and agreed to the published version of the manuscript.

Funding

This research received no external funding.

Institutional Review Board Statement

Not applicable.

Informed Consent Statement

In developing the research, no personal data were collected, and the subjects were informed that the information provided was strictly for academic purposes.

Data Availability Statement

The datasets presented in this study are available upon reasonable request from the corresponding author.

Conflicts of Interest

The authors declare no conflicts of interest.

Abbreviations

The following abbreviations are used in this manuscript:
AbbreviationMeaning
AHPAnalytical Hierarchy Process
ANOVAAnalysis of variance
BBEBio-based electricity
CEECsCentral and Eastern European Countries
EU European Union
GHG Greenhouse Gas
LBLiquid biofuels
MSsMember States
SEIBSocio-economic indicator of bioeconomy
NPENumber of persons employed
TRNTurnover
VAFC Value added at factor cost
WPSocio-economic indicator weight
WSWeight of the bio-based sector

References

  1. Barragán-Ocaña, A. Role of Waste Biomass in a Future Circular Bioeconomy: Regulations and Policy Framework. In Catalytic Applications of Biochar for Environmental Remediation: Sustainable Strategies Towards a Circular Economy; American Chemical Society: Washington, DC, USA, 2024; Volume 2, pp. 73–93. [Google Scholar]
  2. Shirvani, T. The Role of Bioengineering in Building a Bioeconomy. Nat. Rev. Bioeng. 2024, 2, 908–910. [Google Scholar] [CrossRef]
  3. Tapiola, T.; Leppälä, J.; Ghalibaf, M. How to Advance Sustainable Innovations for Circular Bioeconomy: Perspectives from a Public Research Institute. J. Innov. Manag. 2024, 12, 117–141. [Google Scholar] [CrossRef]
  4. Van Lancker, J.; Wauters, E.; Van Huylenbroeck, G. Managing Innovation in the Bioeconomy: An Open Innovation Perspective. Biomass Bioenergy 2016, 90, 60–69. [Google Scholar] [CrossRef]
  5. Popp, J.; Kovács, S.; Oláh, J.; Divéki, Z.; Balázs, E. Bioeconomy: Biomass and Biomass-Based Energy Supply and Demand. New Biotechnol. 2021, 60, 76–84. [Google Scholar] [CrossRef] [PubMed]
  6. Rozakis, S.; Juvančič, L.; Kovacs, B. Bioeconomy for Resilient Post-COVID Economies. Energies 2022, 15, 2958. [Google Scholar] [CrossRef]
  7. European Parliament and Council of the European Union. Directive 2009/28/EC of the European Parliament and of the Council of 23 April 2009 on the Promotion of the Use of Energy from Renewable Sources and Amending and Subsequently Repealing Directives 2001/77/EC and 2003/30/EC. Off. J. Eur. Union 2009, L140, 16–62. [Google Scholar]
  8. Rashedi, A.; Khanam, T. Life cycle assessment of most widely adopted solar photovoltaic energy technologies by mid-point and end-point indicators of ReCiPe method. Environ. Sci. Pollut. Res. 2020, 27, 29075–29090. [Google Scholar] [CrossRef] [PubMed]
  9. Kulisic, B.; Gagnon, B.; Schweinle, J.; Van Holsbeeck, S.; Brown, M.; Simurina, J.; Dimitriou, I.; McDonald, H. The Contributions of Biomass Supply for Bioenergy in the Post-COVID-19 Recovery. Energies 2021, 14, 8415. [Google Scholar] [CrossRef]
  10. Erb, K.-H.; Haberl, H.; Plutzar, C. Dependency of global primary bioenergy crop potentials in 2050 on food systems, yields, biodiversity conservation and political stability. Energy Policy 2012, 47, 260–269. [Google Scholar] [CrossRef]
  11. Shafie, S.M.; Mahlia, T.M.; Masjuki, H.H.; Ahmad-Yazid, A. A Review on Electricity Generation Based on Biomass Residue in Malaysia. Renew. Sustain. Energy Rev. 2012, 16, 5879–5889. [Google Scholar] [CrossRef]
  12. Shortall, O.K.; Raman, S.; Millar, K. Are plants the new oil? Responsible innovation, biorefining and multipurpose agriculture. Energy Policy 2015, 86, 360–368. [Google Scholar] [CrossRef]
  13. Bracco, S.; Calicioglu, O.; Gomez San Juan, M.; Flammini, A. Assessing the Contribution of Bioeconomy to the Total Economy: A Review of National Frameworks. Sustainability 2018, 10, 1698. [Google Scholar] [CrossRef]
  14. Egenolf, V.; Bringezu, S. Conceptualization of an Indicator System for Assessing the Sustainability of the Bioeconomy. Sustainability 2019, 11, 443. [Google Scholar] [CrossRef]
  15. Lamers, P.; Junginger, M.; Dymond, C.C.; Faaij, A. Damaged forests provide an opportunity to mitigate climate change. GCB Bioenergy 2014, 6, 44–60. [Google Scholar] [CrossRef]
  16. Casau, M.; Dias, M.F.; Matias, J.C.O.; Nunes, L.J.R. Residual Biomass: A Comprehensive Review on the Importance, Uses and Potential in a Circular Bioeconomy Approach. Resources 2022, 11, 35. [Google Scholar] [CrossRef]
  17. Ersoy, A.E.; Ugurlu, A. Bioenergy’s role in achieving a low-carbon electricity future: A case of Türkiye. Appl. Energy 2024, 372, 123799. [Google Scholar] [CrossRef]
  18. Sharma, V.; Gupta, R. Biomass Digestion for Production of Electrical Energy. In Sustainable and Clean Energy Production Technologies; Pal, D.B., Jha, J.M., Eds.; Clean Energy Production Technologies; Springer: Singapore, 2022; pp. 151–178. [Google Scholar] [CrossRef]
  19. Roni, M.S.; Chowdhury, S.; Mamun, S.; Marufuzzaman, M.; Lein, W.; Johnson, S. Biomass co-firing technology with policies, challenges, and opportunities: A global review. Renew. Sustain. Energy Rev. 2017, 78, 1089–1101. [Google Scholar] [CrossRef]
  20. Petersen, J.-E. Energy production with agricultural biomass: Environmental implications and analytical challenges. Eur. Rev. Agric. Econ. 2008, 35, 385–408. [Google Scholar] [CrossRef]
  21. Söderberg, C.; Eckerberg, K.; Eckerberg, K.; Sandström, C. Rising policy conflicts in Europe over bioenergy and forestry. For. Policy Econ. 2013, 33, 112–119. [Google Scholar] [CrossRef]
  22. Schuenemann, F.; Msangi, S.; Zeller, M. Policies for a sustainable biomass energy sector in Malawi: Enhancing energy and food security simultaneously. World Dev. 2018, 103, 14–26. [Google Scholar] [CrossRef]
  23. Ibitoye, S.E.; Mahamood, R.M.; Jen, T.C.; Loha, C.; Akinlabi, E.T. An overview of biomass solid fuels: Biomass sources, processing methods, and morphological and microstructural properties. J. Bioresour. Bioprod. 2023, 8, 333–360. [Google Scholar] [CrossRef]
  24. Schmidhuber, J. Biofuels: An Emerging Threat to Europe’s Food Security? Impact of an Increased Biomass Use on Agricultural Markets, Prices and Food Security: A Longer-Term Perspective. In Proceedings of the Energy Security in Europe Conference, Lund, Sweden, 24–25 September 2007. [Google Scholar]
  25. Welfle, A.; Gilbert, P.; Thornley, P. Securing a bioenergy future without imports. Energy Policy 2014, 68, 1–14. [Google Scholar] [CrossRef]
  26. Zuniga-Gonzalez, C.A.; Quiroga-Canaviri, J.L.; Brambila-Paz, J.J.; Ceballos-Pérez, S.G.; Rojas-Rojas, M.M. Formulation of an innovative model for the bioeconomy. PLoS ONE 2024, 19, e0309358. [Google Scholar] [CrossRef]
  27. Ronzon, T.; Iost, S.; Philippidis, G. Has the European Union entered a bioeconomy transition? Combining an output-based approach with a shift-share analysis. Environ. Dev. Sustain. 2022, 24, 8195–8217. [Google Scholar] [CrossRef]
  28. Hassan, S.S.; Williams, G.A.; Jaiswal, A.K. Moving towards the Second Generation of Lignocellulosic Biorefineries in the EU: Drivers, Challenges, and Opportunities. Renew. Sustain. Energy Rev. 2019, 101, 590–599. [Google Scholar] [CrossRef]
  29. Liobikienė, G.; Miceikienė, A. Contribution of the European Bioeconomy Strategy to the Green Deal Policy: Challenges and Opportunities in Implementing These Policies. Sustainability 2023, 15, 7139. [Google Scholar] [CrossRef]
  30. Gołębiewski, J. Employment and Added Value in Europen Union Bioeconomy—A Sustainable Development Perspective. Roczniki 2020, XXII, 74–83. [Google Scholar] [CrossRef]
  31. Swetha, T.A.; Mohanrasu, K.; Sudhakar, M.; Raja, R.; Ponnuchamy, K.; Muthusamy, G.; Arun, A. Acomprehensive review on techniques used in conversion of biomass into bioeconomy. Sustain. Energy Technol. Assess. 2022, 53, 102682. [Google Scholar] [CrossRef]
  32. Proskurina, S.; Mendoza-Martinez, C. Expectations for Bioenergy Considering Carbon Neutrality Targets in the EU. Energies 2023, 16, 5314. [Google Scholar] [CrossRef]
  33. Proskurina, S.; Stolarski, M.; Vakkilainen, E. Bioenergy Perspectives in the EU Regions: Carbon Neutrality Pathway. J. Sustain. Bioenergy Syst. 2023, 13, 16–39. [Google Scholar] [CrossRef]
  34. Sterman, J.D.; Siegel, L.; Rooney-Varga, J.N. Does replacing coal with wood lower CO2 emissions? Dynamic lifecycle analysis of wood bioenergy. Environ. Res. Lett. 2018, 13, 015007. [Google Scholar] [CrossRef]
  35. Purwestri, R.C.; Hájek, M.; Šodková, M.; Sane, M.; Kašpar, J. Bioeconomy in the National Forest Strategy: A Comparison Study in Germany and the Czech Republic. Forests 2020, 11, 608. [Google Scholar] [CrossRef]
  36. Philp, J. Biotechnologies to Bridge the Schism in the Bioeconomy. Energies 2021, 14, 8393. [Google Scholar] [CrossRef]
  37. Mainar-Causapé, A.J.; Philippidis, G.; Sanjuán-López, A.I. Constructing an open access economy-wide database for bioeconomy impact assessment in the European Union member states. Econ. Syst. Res. 2021, 33, 133–156. [Google Scholar] [CrossRef]
  38. Morales, D. Spaces of the forest-based bioeconomy in Finnish Lapland and Catalonia: Practitioners, narratives and forgotten spatialities. Fennia 2021, 199, 174–187. [Google Scholar] [CrossRef]
  39. Kleinschmit, D.; Lindstad, B.H.; Thorsen, B.J.; Toppinen, A.; Roos, A.; Baardsen, S. Shades of green: A social scientific view on bioeconomy in the forest sector. Scand. J. For. Res. 2014, 29, 402–410. [Google Scholar] [CrossRef]
  40. McCormick, K.; Kautto, N. The Bioeconomy in Europe: An Overview. Sustainability 2013, 5, 2589–2608. [Google Scholar] [CrossRef]
  41. Calderon, C.; Colla, M.; Jossart, J.-M.; Hemeleers, N.; Martin, A.; Aveni, N.; Caferri, C. Statistical Report 2019; Report Biomass Supply; Bioenergy Europe: Brussels, Belgium, 2019; Available online: https://bioenergyeurope.org/bio-economy/ (accessed on 17 October 2022).
  42. Scarlat, N.; Dallemand, J.F.; Monforti-Ferrario, F.; Nita, V. The role of biomass and bioenergy in a future bioeconomy: Policies and facts. Environ. Dev. 2015, 15, 3–34. [Google Scholar] [CrossRef]
  43. European Network for Rural Development. Mainstreaming the Bioeconomy: EU Rural Review No. 28. 2019. Available online: http://rb.gy/3c5to9 (accessed on 22 June 2023).
  44. Yang, L.; Wang, X.-C.; Dai, M.; Chen, B.; Qiao, Y.; Deng, H.; Zhang, D.; Zhang, Y.; Almeida, C.; Chou, A.; et al. Shifting from Fossil-Based Economy to Bio-Based Economy: Status Quo, Challenges, and Prospects. Energy 2021, 228, 120533. [Google Scholar] [CrossRef]
  45. European Comission (EC). Fit for 55’: Delivering the EU’s 2030 Climate Target on the Way to Climate Neutrality; European Commission: Brussels, Belgium, 2019; Available online: http://rb.gy/n2lv7c (accessed on 15 July 2022).
  46. Ranta, T.; Laihanen, M.; Karhunen, A. Development of the Bioenergy as a Part of Renewable Energy in the Nordic Countries: A Comparative Analysis. J. Sustain. Bioenergy Syst. 2020, 10, 92–112. [Google Scholar] [CrossRef]
  47. Busu, M.; Nedelcu, A.C. Analyzing the Renewable Energy and CO2 Emission Levels Nexus at an EU Level: A Panel Data Regression Approach. Processes 2021, 9, 130. [Google Scholar] [CrossRef]
  48. Walter, S. The regional impact of biofuel economics. Margin J. Appl. Econ. 2018, 12, 369–386. [Google Scholar] [CrossRef]
  49. Takács-György, K.; Lászlók, A.; Takács, I. Examination of first generation biofuel production in some selected biofuel producing countries in Europe: A case study. Agric. Econ. (Zeměd. Ekon.) 2020, 66, 469–476. [Google Scholar] [CrossRef]
  50. Potrč, S.; Čuček, L.; Martin, M.; Kravanja, Z. Synthesis of European Union Biorefinery Supply Networks Considering Sustainability Objectives. Processes 2020, 8, 1588. [Google Scholar] [CrossRef]
  51. Lasarte-López, J.; Piotrowski, S.; M’barek, R.; Carus, M.; Tamosiunas, S.J. EU Bioeconomy Monitoring System Indicators Update: Jobs and Value Added in the EU Bioeconomy 2020; European Commission, Ed.; Publications Office of the European Union, European Commission: Brussels, Belgium, 2023; Available online: https://datam.jrc.ec.europa.eu/datam/perm/dataset/7d7d5481-2d02-4b36-8e79-697b04fa4278 (accessed on 12 March 2024).
  52. D’Adamo, I.; Falcone, P.M.; Morone, P. A New Socio-economic Indicator to Measure the Performance of Bioeconomy Sectors in Europe. Ecol. Econ. 2020, 176, 106724. [Google Scholar] [CrossRef]
  53. Puttkammer, J.; Grethe, H. Who with whom in biofuel policy? Coalitions in the media discourse on liquid biofuels in Germany. Ecol. Perspect. Sci. Soc. 2018, 27, 235–244. [Google Scholar] [CrossRef]
  54. Pata, U.K.; Erdogan, S.; Ozcan, B. Evaluating the role of the share and intensity of renewable energy for sustainable development in Germany. J. Clean. Prod. 2023, 42, 138482. [Google Scholar] [CrossRef]
  55. Hinrichs-Rahlwes, R. Renewable energy: Paving the way towards sustainable energy security. Lessons learnt from Germany. Renew. Energy 2013, 49, 10–14. [Google Scholar] [CrossRef]
  56. Sturm, V.; Banse, M. Transition paths towards a bio-based economy in Germany: A model-based analysis. Biomass Bioenergy 2021, 148, 106002. [Google Scholar] [CrossRef]
  57. Staffas, L.; Gustavsson, M.; McCormick, K. Strategies and Policies for the Bioeconomy and Bio-Based Economy: An Analysis of Official National Approaches. Sustainability 2013, 5, 2751–2769. [Google Scholar] [CrossRef]
  58. Galanopoulos, C.; Barletta, D.; Zondervan, E. A decision support platform for a bio-based supply chain: Application to the region of Lower Saxony and Bremen (Germany). Comput. Chem. Eng. 2018, 115, 233–242. [Google Scholar] [CrossRef]
  59. Goerg, S.J.; Hempel, C.; Pondorfer, A. Stated purchase of bio-based products: Personal and regional factors in Germany. Clean. Circ. Bioecon. 2024, 8, 100087. [Google Scholar] [CrossRef]
  60. Balkin, R.S.; Lenz, A.S. Contemporary Issues in Reporting Statistical, Practical, and Clinical Significance in Counseling Research. J. Couns. Dev. 2021, 99, 227–237. [Google Scholar] [CrossRef]
  61. Sharma, K.K.; Seal, A. Outlier-robust multi-view clustering for uncertain data. Knowl.-Based Syst. 2021, 211, 106567. [Google Scholar] [CrossRef]
  62. Anusha, M.; Sathiaseelan, J. Feature selection using k-means genetic algorithm for multi-objective optimization. Procedia Comput. Sci. 2015, 57, 1074–1080. [Google Scholar] [CrossRef]
  63. List, J.A.; Shaikh, A.M.; Xu, Y. Multiple hypothesis testing in experimental economics. Exp. Econ. 2019, 22, 773–793. [Google Scholar] [CrossRef]
  64. Murtagh, F.; Legendre, P. Ward’s hierarchical agglomerative clustering method: Which algorithms implement Ward’s criterion? J. Classif. 2014, 31, 274–295. [Google Scholar] [CrossRef]
  65. Bu, J.; Liu, W.; Pan, Z.; Ling, K. Comparative Study of Hydrochemical Classification Based on Different Hierarchical Cluster Analysis Methods. Int. J. Environ. Res. Public Health 2020, 17, 9515. [Google Scholar] [CrossRef] [PubMed]
  66. Yim, O.; Ramdeen, K.T. Hierarchical cluster analysis: Comparison of three linkage measures and application to psychological data. Quant. Methods Psychol. 2015, 11, 8–21. [Google Scholar] [CrossRef]
  67. Babucea, A.G.; Danacica, E.D. Using Cluster Analysis for studying the proximity of registered unemployment at the level of counties in Romania at the beginning of the economic crisis. Constantin Brancusi Univ. Ann. Econ. Ser. 2009, 1, 347–356. Available online: https://rebrand.ly/4m4y73o (accessed on 26 July 2024).
  68. M’barek, R.; Philippidis, G.; Suta, C.; Vinyes, C.; Caivano, A.; Ferrari, E.; Ronzon, T.; Sanjuan-Lopez, A.; Santini, F. Observing and analysing the Bioeconomy in the EU: Adapting data and tools to new questions and challenges. Bio-Based Appl. Econ. 2014, 3, 83–91. [Google Scholar] [CrossRef]
  69. Babucea, A.G.; Răbonțu, C.I. The State of Adopting CRM Software-Solutions as Part of The Enterprises’ Internal Processes Integration—A Cluster Analysis at the Level of the EU-Member States just Prior to the COVID-19 Pandemic. Constantin Brancusi Univ. Ann. Econ. Ser. 2020, 5, 115–125. Available online: https://rebrand.ly/ut1eeuz (accessed on 26 July 2024).
  70. O’Brien, M.; Wechsler, D.; Bringezu, S.; Schaldach, R. Toward a systemic monitoring of the European bioeconomy: Gaps, needs and the integration of sustainability indicators and targets for global land use. Land Use Policy 2017, 66, 162–171. [Google Scholar] [CrossRef]
  71. Ronzon, T.; M’Barek, R. Socioeconomic Indicators to Monitor the EU’s Bioeconomy in Transition. Sustainability 2018, 10, 1745. [Google Scholar] [CrossRef]
  72. Sanz-Hernández, A.; Esteban, E.; Garrido, P. Transition to a bioeconomy. Perspectives from social sciences. J. Clean. Prod. 2019, 224, 107–119. [Google Scholar] [CrossRef]
  73. Saaty, T.L. The Analytic Hierarchy Process: Planning, Priority Setting, Resource Allocation; McGraw-Hill International Book Co.: New York, NY, USA; London, UK, 1980; ISBN 978-0070543713. [Google Scholar]
  74. Morone, P.; D’Adamo, I.; Cianfroni, M. Inter-Connected Challenges: An Overview of Bioeconomy in Europe. Environ. Res. Lett. 2022, 17, 114031. [Google Scholar] [CrossRef]
  75. Firoiu, D.; Ionescu, G.H.; Cojocaru, T.M.; Niculescu, M.; Cimpoeru, M.N.; Călin, O.A. Progress of EU Member States Regarding the Bioeconomy and Biomass Producing and Converting Sectors. Sustainability 2023, 15, 14128. [Google Scholar] [CrossRef]
  76. Mandley, S.; Daioglou, V.; Junginger, H.; van Vuuren, D.; Wicke, B. EU bioenergy development to 2050. Renew. Sustain. Energy Rev. 2020, 127, 109858. [Google Scholar] [CrossRef]
  77. Alsaleh, M.; Abdulwakil, M.M.; Abdul-Rahim, A.S. Does Social Businesses Development Affect Bioenergy Industry Growth under the Pathway of Sustainable Development? Sustainability 2021, 13, 1989. [Google Scholar] [CrossRef]
  78. Proskurina, S.; Sikkema, R.; Heinimö, J.; Vakkilainen, E. Five years left—How are the EU member states contributing to the 20% target for EU’s renewable energy consumption; the role of woody biomass. Biomass Bioenergy 2016, 95, 64–77. [Google Scholar] [CrossRef]
  79. Srebotnik, T.; Hardi, P. Prospects for Sustainable Bioenergy Production in Selected Former Communist Countries. Ecol. Indic. 2011, 11, 1009–1019. [Google Scholar] [CrossRef]
  80. Kaniapan, S.; Hassan, S.; Ya, H.; Patma Nesan, K.; Azeem, M. The Utilisation of Palm Oil and Oil Palm Residues and the Related Challenges as a Sustainable Alternative in Biofuel, Bioenergy, and Transportation Sector: A Review. Sustainability 2021, 13, 3110. [Google Scholar] [CrossRef]
  81. Kallemets, K. Economic sustainability of Estonian shale oil industry until 2030. Oil Shale 2016, 33, 272. [Google Scholar] [CrossRef]
  82. Capozza, I. Decarbonising Romania’s Economy; OECD Economics Department Working Papers, No. 1812; OECD Publishing: Paris, France, 2024. [Google Scholar] [CrossRef]
  83. Bădan, D.N.; Dumitru, E.A. The bioenergy potential of agricultural residues in Romania. Sci. Pap. Ser. Manag. Econ. Eng. Agric. Rural Dev. 2020, 20, 125–130. [Google Scholar]
  84. Bilandzija, N.; Voca, N.; Jelcic, B.; Jurisic, V.; Matin, A.; Grubor, M.; Kricka, T. Evaluation of Croatian agricultural solid biomass energy potential. Renew. Sustain. Energy Rev. 2018, 93, 225–230. [Google Scholar] [CrossRef]
  85. Malico, I.; Nepomuceno Pereira, R.; Gonçalves, A.C.; Sousa, A.M.O. Current status and future perspectives for energy production from solid biomass in the European industry. Renew. Sustain. Energy Rev. 2019, 112, 960–977. [Google Scholar] [CrossRef]
  86. Borychowski, M. Labour Productivity in the Liquid Biofuels Sector in Selected European Union countries. In Proceedings of the 2018 International Scientific Conference ‘Economic Sciences for Agribusiness and Rural Economy’ No 1, Warsaw, Poland, 7–8 June 2018; pp. 116–124, ISBN 978-83-7583-802-2. [Google Scholar] [CrossRef]
  87. Proskurina, S.; Vakkilainen, E. Perspectives on challenges to bioenergy use in the EU. Biofuels Bioprod. Biorefin. 2024, 18, 938–951. [Google Scholar] [CrossRef]
  88. Petrov, P.; Zgureva-Filipova, D.; Filipov, K.; Ganev, I. Analysis of the overall potential for electricity production from farm animals manure in Bulgaria. IOP Conf. Ser. Earth Environ. Sci. 2023, 1128, 012001. [Google Scholar] [CrossRef]
  89. Kamburova, V.; Rasheva, V.; Velikanov, M. Energy-Efficient Reconstruction of Public Lighting in Pravets Municipality from Bulgaria. E3S Web Conf. 2019, 112, 04008. [Google Scholar] [CrossRef]
  90. Dang, Q.; Hu, W.; Rover, M.; Brown, R.C.; Wright, M.M. Economics of Biofuels and Bioproducts from an Integrated Pyrolysis Biorefinery. Biofuels Bioprod. Biorefin. 2016, 10, 790–803. [Google Scholar] [CrossRef]
  91. Vojtovic, S.; Stundziene, A.; Kontautiene, R. The Impact of Socio-Economic Indicators on Sustainable Consumption of Domestic Electricity in Lithuania. Sustainability 2018, 10, 162. [Google Scholar] [CrossRef]
  92. Lam, C.H.; Das, S.; Erickson, N.C.; Hyzer, C.D.; Garedew, M.; Anderson, J.E.; Wallington, T.J.; Tamor, M.A.; Jackson, J.E.; Saffron, C.M. Towards sustainable hydrocarbon fuels with biomass fast pyrolysis oil and electrocatalytic upgrading. Sustain. Energy Fuels 2017, 1, 258–266. [Google Scholar] [CrossRef]
  93. Pažėraitė, A.; Brandišauskas, D. Assessment of the Barriers towards More Rapid Development of Solar Power: The Case of Lithuania. Energetika 2022, 68, 68–78. [Google Scholar] [CrossRef]
  94. Dang, Q.; Wright, M.M.; Li, W. Technoeconomic Analysis of a Hybrid Biomass Thermochemical and Electrochemical Conversion System. Energy Technol. 2018, 6, 178–187. [Google Scholar] [CrossRef]
  95. Harnisch, F.; Rosa, L.F.M.; Kracke, F.; Virdis, B.; Krömer, J.O. Electrifying white biotechnology: Engineering and economic potential of electricity-driven bio-production. ChemSusChem 2015, 8, 758–766. [Google Scholar] [CrossRef] [PubMed]
  96. Philippidis, G.; Bartelings, H.; Helming, J.; M’barek, R.; Smeets, E.; van Meijl, H. Levelling the playing field for EU biomass usage. Econ. Syst. Res. 2019, 31, 158–177. [Google Scholar] [CrossRef]
  97. Kapustová, Z.; Kapusta, J.; Boháčiková, A.; Bielik, P. Development status in EU biofuels market. Visegr. J. Bioecon. Sustain. Dev. 2020, 9, 67–71. [Google Scholar] [CrossRef]
  98. Stattman, S.L.; Gupta, A.; Partzsch, L.; Oosterveer, P. Toward Sustainable Biofuels in the European Union? Lessons from a Decade of Hybrid Biofuel Governance. Sustainability 2018, 10, 4111. [Google Scholar] [CrossRef]
  99. Veipa, A.; Kirsanovs, V.; Barisa, A. Techno-economic analysis of biofuel production plants producing biofuels using Fisher Tropsch synthesis. Environ. Clim. Technol. 2020, 24, 373–387. [Google Scholar] [CrossRef]
  100. Follador, M.; Philippidis, G.; Davis, J.L.; Soares Filho, B.S. Assessing the Impacts of the EU Bioeconomy on Third Countries; Publications Office of the European Union: Luxembourg, 2019; ISBN 978-92-76-09820-1. [Google Scholar] [CrossRef]
  101. EUR-Lex. Directive (EU) 2018/2001 of the European Parliament and of the Council of 11 December 2018 on the Promotion of the Use of Energy from Renewable Sources. 2018. Available online: https://rebrand.ly/3vcwt2r (accessed on 2 September 2024).
  102. Trømborg, E.; Jåstad, E. Report on Market Outlook and Future Viability of Different Bioenergy Products and Value Chains in the Baltic Sea Region Energy System for the BalticBiomass4Value Project; Project Co-Funded by the European Regional Development Fund; Norwegian University of Life Sciences: Ås, Norway, 2019. [Google Scholar]
  103. Podolchuk, D. Exploring the Relationship Between the EU Emissions Trading System and Renewable Energy Development in the EU. Int. Sci. J. Manag. Econ. Financ. 2023, 2, 1–12. [Google Scholar] [CrossRef]
  104. Simionescu, M.; Strielkowski, W.; Tvaronavičienė, M. Renewable Energy in Final Energy Consumption and Income in the EU-28 Countries. Energies 2020, 13, 2280. [Google Scholar] [CrossRef]
  105. Xie, Z.; Yin, R.; Zhi, Y. Analysis of the Renewable Energy Development Situations Among Twenty-Seven EU Countries. In Proceedings of the 2022 International Conference on Economics, Smart Finance and Contemporary Trade (ESFCT 2022), Xi’an, China, 22–24 July 2022; Atlantis Press: Dordrecht, The Netherlands, 2022. ISBN 978-94-6463-052-7. [Google Scholar] [CrossRef]
  106. Tsiropoulos, I.; Siskos, P.; Capros, P. The cost of recharging infrastructure for electric vehicles in the EU in a climate neutrality context: Factors influencing investments in 2030 and 2050. Appl. Energy 2022, 322, 119446. [Google Scholar] [CrossRef]
  107. Višković, A.; Franki, V. Status of Croatia’s energy sector framework: Progress, potential, challenges and recommendations. Therm. Sci. 2015, 19, 751–770. [Google Scholar] [CrossRef]
  108. Megyesiova, S.; Dul’ová Spišáková, E.; Gontkovičová, B. European Union and Its Progress towards Affordable and Clean Energy in Context of the Agenda 2030. PLoS ONE 2023, 18, e0291933. [Google Scholar] [CrossRef] [PubMed]
  109. Jaworski, S.; Chrzanowska, M.; Zielińska-Sitkiewicz, M.; Pietrzykowski, R.; Jezierska-Thöle, A.; Zielonka, P. Evaluating the Progress of Renewable Energy Sources in Poland: A Multidimensional Analysis. Energies 2023, 16, 6431. [Google Scholar] [CrossRef]
  110. Khorishko, L.; Horlo, N.; Malovana, Y. Estonian energy policy in the context of modern challenges. Balt. J. Econ. Stud. 2023, 9, 184–188. [Google Scholar] [CrossRef]
  111. Sillak, S.; Vasser, M. How might we co-design energy transition policy in old industrial regions? Environ. Policy Gov. 2023, 33, 139–152. [Google Scholar] [CrossRef]
  112. Poljanskihh, A.; Levina, A.; Dubgorn, A. Investment in Renewable Energy: Practical Case in Estonia. MATEC Web Conf. 2018, 193, 05065. [Google Scholar] [CrossRef]
  113. Banja, M.; Sikkema, R.; Jégard, M.; Motola, V.; Dallemand, J.-F. Biomass for energy in the EU—The support framework. Energy Policy 2019, 131, 215–228. [Google Scholar] [CrossRef]
  114. de Queiroz-Stein, G.; Siegel, K.M. Possibilities for mainstreaming biodiversity? Two perspectives on the concept of bioeconomy. Earth Syst. Gov. 2023, 17, 100181. [Google Scholar] [CrossRef]
Figure 1. The clusters’ output based on the Ward linkage method. Note: The red dashed vertical line indicates the level at which the iterative process was stopped to define the clusters. Source: Own processing in SPSS (IBM SPSS Statistics 29).
Sustainability 17 01484 g001
Figure 2. EU countries categorised into four groups based on socio-economic outcomes in the bioenergy sector. Source: Own processing.
Sustainability 17 01484 g002
Figure 3. First cluster of EU countries based on socio-economic outcomes in the bioenergy sector. Source: Own processing.
Sustainability 17 01484 g003
Figure 4. Second cluster of EU countries based on socio-economic outcomes in the bioenergy sector. Source: Own processing.
Sustainability 17 01484 g004
Figure 5. Third cluster of EU countries based on socio-economic outcomes in the bioenergy sector. Source: Own processing.
Sustainability 17 01484 g005
Figure 6. Fourth cluster of EU countries based on socio-economic outcomes in the bioenergy sector. Source: Own processing.
Sustainability 17 01484 g006
Table 1. Case Processing Summary 1.
Cases
ValidMissingTotal
N 2 Percent N Percent N Percent
2488.9%311.1%27100.0%
1 Squared Euclidean Distance used. 2 The count of valid observations for the variable.
Table 2. The number of persons employed, turnover, and value added at factor cost in production of bio-based electricity and manufacture of liquid biofuels by EU MSs, 2008–2021 average.
NPE 1 BBE 4TRN 2 BBEVAFC 3 BBENPE LB 5TRN LBVAFC LB
UE 2723,32818,354437222,16413,3392924
Austria710.5039450.1124160.9226901.4362490.1357111.2235
Belgium475.6467976.9685134.00091194.18471084.1338249.4574
Bulgaria209.314642.344520.4574889.355990.309815.2742
Croatia58.703516.05557.6312114.322912.89312.9557
Cyprus21.97787.67232.8600---
Czech Rep.---1667.6667308.426561.3661
Denmark649.1663737.2601248.8374212.378696.364332.7368
Estonia238.462592.915924.67142.69721.21010.1560
Finland1131.4345826.6686289.9631813.0163662.6049163.6769
France1595.4913708.3214253.87152728.43821814.4001332.8786
Germany10,185.851214,391.99371527.62583847.52402077.2861453.2493
Greece99.670753.057810.6280596.4262181.577135.2573
Hungary510.3362156.567749.8745424.3854172.760337.5775
Ireland------
Italy1607.34912866.7013564.50371450.9746946.5958151.8676
Latvia217.584670.354424.6205---
Lithuania235.514737.213615.6596294.1737129.761639.9715
Luxembourg16.69397.96224.7824---
Malta0.02602.57960.2289---
Netherlands269.8166572.7719115.9118267.7634605.646967.5360
Poland1868.6154457.0877201.82043729.4237811.7564128.9138
Portugal338.3790246.9682127.0409679.4222395.050741.5789
Romania176.900819.210010.20111012.0118124.204618.6667
Slovakia237.0709130.208934.552082.911721.17243.8875
Slovenia50.077216.29684.5955---
Spain401.6193504.4238179.19541804.6022923.3980178.5154
Sweden976.0049814.1345261.81661110.6264591.6519181.0822
1 NPE—the number of people employed. 2 TRN—turnover (million EUR). 3 VA—value added at factor cost (million EUR). 4 BBE—bio-based electricity sector. 5 LB—liquid biofuels sector. Source: Own calculations based on Lasarte-López et al. [51].
Table 3. The weights of the socio-economic indicators 1.
VariableWorkersTurnoverValue Added
Production of bio-based energy0.3190.3530.328
Production of liquid biofuels0.3150.3560.329
1 Adapted from Morone et al. [70].
Table 4. Cluster-specific descriptive statistics.
Cluster
Number
VariableData
N *MeanStd. DeviationVariance
1V1 NPE BBE520.2776250.52868040.280
V2 TRN BBE520.3145850.53444300.286
V3 VAFC BBE520.3393900.56635210.321
V4 NPE LB390.0341690.27812710.077
V5 TRN LB390.1255130.31178180.097
V6 VAFC LB390.2003820.67146990.451
2V1 NPE BBE520.2776250.52868040.280
V2 TRN BBE520.3145850.53444300.286
V3 VAFC BBE520.3393900.56635210.321
V4 NPE LB390.0341690.27812710.077
V5 TRN LB390.1255130.31178180.097
V6 VAFC LB390.2003820.67146990.451
3V1 NPE BBE----
V2 TRN BBE----
V3 VAFC BBE----
V4 NPE LB----
V5 TRN LB----
V6 VAFC LB----
4V1 NPE BBE----
V2 TRN BBE----
V3 VAFC BBE----
V4 NPE LB----
V5 TRN LB----
V6 VAFC LB----
* Number of observations. Source: Own calculation in SPSS (IBM SPSS Statistics 29) output.
Table 5. The ANOVA test.
Cluster NumberVariableSSdfMSFp-ValueF Crit
1V1 NPE BBE0.62348170.036680.566530.913921.67025
V2 TRN BBE0.77199170.045410.638510.858931.67025
V3 VAFC BBE0.82433170.048490.688930.812241.67070
V4 NPE LB0.80181170.047170.560180.917121.68077
V5 TRN LB1.22640170.072140.588180.897921.68077
V6 VAFC LB0.99998170.058820.432970.975871.68077
2V1 NPE BBE0.2368930.078960.270390.846432.79806
V2 TRN BBE0.5186130.172870.590660.624132.79806
V3 VAFC BBE0.5350230.178340.540990.656542.79806
V4 NPE LB0.1192630.039750.493360.689202.87419
V5 TRN LB0.0939930.031330.304590.821872.87419
V6 VAFC LB0.0973930.032460.066690.977212.87419
3V1 NPE BBE------
V2 TRN BBE------
V3 VAFC BBE------
V4 NPE LB------
V5 TRN LB------
V6 VAFC LB------
4V1 NPE BBE------
V2 TRN BBE------
V3 VAFC BBE------
V4 NPE LB------
V5 TRN LB------
V6 VAFC LB------
SS—Sum of Squares. df—degrees of freedom. MS—Mean Squares. F—ratio between MS value of subject and MS of residual. p-value—Probability value. Source: Own calculation in SPSS (IBM SPSS Statistics 29).
Disclaimer/Publisher’s Note: The statements, opinions and data contained in all publications are solely those of the individual author(s) and contributor(s) and not of MDPI and/or the editor(s). MDPI and/or the editor(s) disclaim responsibility for any injury to people or property resulting from any ideas, methods, instructions or products referred to in the content.

