Abstract
Combined Cycle Combined Heat and Power (CCCHP) systems enhance energy efficiency and reduce emissions by simultaneously generating electricity and heat. This study presents the energy and exergy performance, environmental impact, and efficiency optimization of CCCHP combustion systems using Ebsilon Professional 16 software simulation. Three fuel combustion CCCHP systems of coal, biomass, and coal–biomass cofiring were simulated for 150 MW of total power output with 125 MW of electrical power and 25 MW of a heating energy system. The sensitivity analysis was performed for 16 different systems with the fuel moisture content varying from 10% to 40% (w/w) to identify the energy and environmental effect on simulated CCCHP systems. The simulation results indicate that increasing biomass moisture content enhanced flue gas energy and improved the Rankine cycle performance. The energy efficiency of biomass and coal–biomass combustion CCCHP systems increased from 56.90% to 67.22% and 56.94% to 62.37, with the moisture content rising from 10% to 30% (w/w) and 10% (w/w) to 25.56% (w/w), respectively, but declined beyond these. Moreover, the exergy efficiency showed a similar pattern peaking at 50.06% in biomass samples and 50.10% in the cofiring sample. Furthermore, the environmental impact, CO2 and SO2 emission concentrations reduced from 22.42% (w/w) to 20.77 (w/w) and 0.66% to 0.61%, respectively, with an increase in fuel moisture content from 10% to 25.56% in a biomass cofired combustion CCCHP system.
1. Introduction
Electricity and heating energy are two vital and essential energy types utilized in several industrial and household applications, and solid fuel plays a critical role as a fuel source for producing these energies [1,2]. The technique of solid fuel combustion is especially critical to the power and heat demand in the world. The world produced over 80% of its electricity by utilizing fossil fuel-based sources in 2020 [3]. Even though coal is also a highly environmentally polluting non-renewable energy source, 35% of global electricity energy demand was fulfilled by coal in the year 2024, producing 10,704 terawatt-hours of electricity [4]. However, the world has identified the requirement to phase out coal consumption due to the unhealthy environmental impact of coal combustion [5,6]. Climate analytics and scientists have shown that coal combustion needs to end by at least 2040 to reduce further environmental pollution and move into a sustainable and renewable alternative, such as the utilization of biomass [5,6]. Biomass is a renewable and clean energy source that can be used for the combustion process to produce electricity and heat energy; sources such as wood, agricultural residue, animal waste, and forestry waste can be utilized as sustainable alternatives to coal [7,8]. Furthermore, biomass utilization has shown a promising future in replacing non-renewable coal consumption; the global biomass market was worth around USD 46.98 billion in 2021, and it is expected to increase to USD 84.78 billion in 2030 [9]. The Sun’s energy is stored in the chemical bonds of plant materials and can be extracted as biomass energy from combustion applications [10]. Henceforth, biomass combustion emits roughly the same amount of carbon dioxide to the environment, which is absorbed during the plant growth period, neutralizes the carbon cycle, and does not add additional carbon dioxide to the atmosphere [10]. Therefore, in climate change and environmental pollution reduction perspectives, biomass utilization is preferred over coal. However, the low calorific values, the provision of sustainable biomass feed, and the preprocessing of the biomass are some areas that need to be developed further to completely replace coal. The technological advancement of biomass conversion is a vital factor; technologies such as cofiring of biomass with coal, applying pyrolysis process for biomass to produce biofuels, gasification of biomass to produce syngas, and conversion of biomass to ethanol or methanol are some of the techniques that are being used at the moment to utilize biomass in a more effective manner [11,12]. Furthermore, efficient utilization of fuel in combustion operation is a critical factor in power generation. Techniques such as CCCHP provide efficient operation while reducing the environmental impact [13]. Moreover, several regulations and policies were introduced to enhance CCCHP utilization and support CHP adoption [8]. Especially in the USA, Energy Regulation and Policy, environmental regulation, state climate change plans, and incentives like Electric Utility rates, Feed-in-Tariff, and tax rates are assisting in promoting CCCHP operation [8].
Several large-scale power and heat generation projects have been established in the world, especially in developing countries, to fulfill the increasing energy demand. As an example, a 150 MW renewable energy project was proposed to Sri Lanka to fulfill the energy demand in the southern area. Henceforth, the selection of 125 MW electric power generation was chosen for this simulation by considering the stability and integration with existing infrastructures, available demand, and realistic operation conditions [14]. Furthermore, the 25 MW heating power generation was chosen by targeting the industrial processes and other thermal applications while ensuring efficient operation. This study presents a feasibility study of biomass and coal–biomass combustion CCCHP systems, specifically considering real-world constraints such as energy efficiency, exergy efficiency, environmental impact, and operational stability at different biomass moisture contents. Furthermore, the investigation considers the realistic assessment of utilizing biomass as a sustainable alternative to coal. The contribution of this finding through the identification of optimum biomass moisture content for CCCHP energy generation applications for large-scale energy projects will help in developing an efficient biomass-to-energy conversion approach.
1.1. Combined Cycle Combined Heat and Power (CCCHP) Operation
Producing several types of energy integrating heat and power generation is crucial for improving energy efficiency and sustainability in the current domain; the key benefit of this operation is gaining higher energy and exergy efficiency with significant power output [13]. Combined Heat and Power (CHP) operation, also known as cogeneration, is the simultaneous utilization of electricity energy and heat energy from a power generation plant [15,16]. The CHP process provides a more efficient, economically beneficial, and low environmental impact operation since it utilizes the waste heat and consumes both heat and power energy generated through a single combustion process [15]. The CHP is an ideal operation condition for rising energy demand with limited resources globally. Moreover, the CHP operation reduces fuel consumption compared to traditional power generation due to the higher energetic and energetic CHP efficiency [17]. The utilization of biomass for CHP combustion systems provides a great solution by attaining significant emission reduction while utilizing renewable biomass sources [15]. However, the supply of sufficient and continuous biomass feed to the combustion system is critically important to achieving optimum operation [16]. The CHP systems consist of several components based on the fuel type and the design, such as a combustion unit, gas turbine, steam turbine, combined cycle systems, electric generator, and steam generator with heat recovery units [15,18]. Moreover, the different fuel types can be fed to the CHP system to enhance efficiency, especially when integration with renewable energies, such as biomass and biomethane, is highly beneficial from an environmental perspective. The CHP operation combined with combined cycle power generation affords the production of more electricity by consuming the same fuel source and gaining more efficient operation [19,20]. Compared with single-cycle operation, the combined cycle power plant can have higher efficiency. Generally, a combined cycle can consist of a combination of gas turbine and steam turbine operations, which can reach an efficiency level of over 60% [20]. The gas turbine system employs the Brayton cycle to generate electricity, and the exhaust heat-recovered steam turbine system employs the Rankine cycle to produce extra electricity; therefore, the overall electricity efficiency is the summation of both cycle efficiencies due to the consumption of the same fuel source for both cycle operations [21]. The gasification of solid fuels such as coal, coke, or biomass can also deliver combined cycle operations called integrated gasification combined cycle (IGCC) plants [20,21]. Moreover, the IGCC of coal causes lower environmental pollution compared to normal combustion, with lower environmental impact [21].
1.2. Environmental Impact on Solid Biomass Combustion
Coal burning releases more carbon dioxide than bagasse. This is the main portion of greenhouse gases, and it significantly affects climate change. In 2021, global carbon dioxide emissions due to coal burning were around 15.3 GT, accounting for over 40% of total CO2 emissions in the world [22]. Not only that, but the burning of coal also produces SOx and NOx. Then, it contributes to acid rain and smog formation [23]. However, when considering bagasse combustion, it releases a significantly low amount of CO2. However, the release of CO2 can be absorbed by the cultivated sugarcane; the net emission is zero. SOx and NOx emissions when burning bagasse are also significantly low when compared with coal [24]. Both materials release particulate matter, but the release quantity is higher when burning coal as a fuel. However, when we burn bagasse, particulate matter emission is low, and air pollution is very low [23].
1.3. Research Objective
This research study aims to develop a system model using Ebsilon Professional 16 software to evaluate the effective outputs of different material inputs such as biomass, coal, and coal–biomass mix with different moisture contents in a CCCHP system. This simulation was conducted in three different ways. The first simulation uses coal as the input material with 10% moisture content, the second one uses biomass (bagasse) with a moisture content of 10% to 40%, and the third one uses a coal–biomass mix with varying moisture content. The bagasse moisture content can be varied from 40 to 55% (w/w) range, and dried bagasse was used for the combustion activities [25]. Henceforth, the 10% to 40% range was selected for the simulation.
System energy and exergy (maximum theoretical useful work obtainable from an energy conversion system) efficiency are parameters used to evaluate the effective output of the developed system [26]. The quality of energy is a vital factor for analyzing an energy-associated system. The energy analysis describes only the quantitative part of the energy, but the exergy analysis describes both the quantity and quality of energy and provides information about individual components. Hence, exergy analysis is the best way to evaluate an energy-based system [27]. The system utilizes two power generation units consisting of a combined gas turbine and steam turbine cycle operation, and the power generation was compared and analyzed for different fuel feed systems with different fuel moisture content frameworks. Then, a comprehensive energy and exergy analysis was executed for the systems to analyze the system performance with different fuel feed conditions. Ultimately, the exhaust conditions were investigated for different combustion systems to identify the environmental impact of different solid fuel combustions. A key finding from this research study was the analysis of the performance variation in solid fuel combustion systems in non-renewable coal, renewable biomass, and coal–biomass cofiring processes. Moreover, a comprehensive analysis was performed based on the energetic and environmental perspectives to identify the possibility and importance of replacing non-renewable coal with renewable biomass and cofiring systems.
2. Materials and Methods
2.1. Composition and Calorific Value (CV) Value Measurement and Identification
The Net Calorific Value (NCV) of bagasse was measured using an automatic bomb calorimeter (model 5E-C5508, CKIC—Changsha Kaiyuan Instruments Co., Ltd., Changsha, China) unit, and the value was assigned as 20,000 KJ/kg for the analysis. The NCV for the coal was assigned as 35,590 KJ/kg from the Ebsilon professional 16 (Germany) simulation; the coal is available as an inbuild component in the Ebsilon library database with a weight base composition of 64% carbon, 0.05% hydrogen, 0.07% oxygen, 0.005% nitrogen, 0.25% sulfur, 0.11% ash, and 10% moisture contents. A total of 16 systems were simulated, as shown in Table 1, and different compositions were assigned.

Table 1.
Fuel feed system conditions.
2.2. Ebsilon Simulation and Design
The Ebsilon Professional 16 (Germany) simulation software was used to design and optimize the power generation system through a solid combustion system. The total calculations and simulations of this study were carried out using the Ebsilon software, which is a commonly used software for power station-based simulations and thermodynamic applications compared to other similar software [28]. The Ebsilon software provides predefined components related to thermal power stations and is also compatible with a wide range of working materials (coal, LNG, steam, exhaust gasses, and binary mixtures) with a user-friendly GUI compared to other alternatives such as Aspen HYSYS. Also, these components generate characteristic equations, which can be used in computational matrices. These equations can be solved using the Gaus–Seidel algorithm after linearization. Also, this software uses standard libraries such as water–steam table IAPWS-IF97, the REFProp (for organic fluids), Coolprop, and TREND, which are very useful in thermodynamic applications [28]. Additionally, Ebsilon Professional V14 offers robust steady-state modeling and efficient handling of complex thermal power plant configurations, making it an optimum simulation condition for this study.
The combined heat and power utilization with a combined cycle power generation system was designed, as shown in Figure 1, and the process line identifiers are described in Table 2. The system was designed to generate 125 MW of electricity and 25 MW of heat energy in CHP operation, and the total power is generated through a gas turbine system combined with a steam turbine system. The steam extraction unit was designed to obtain heat energy from the intermediate-pressure steam turbine unit. The overall simulation system was designed as described in the following Section 2.2.1, Section 2.2.2, Section 2.2.3, Section 2.2.4.
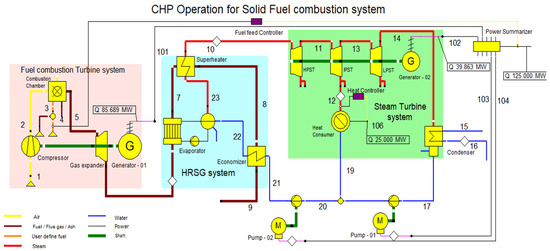
Figure 1.
CCCHP-operated solid fuel (biomass and coal cofiring) combustion simulation system.

The system boundary for the simulated design is based on the fuel input to power generation operation within the plant operation unit, as shown in Figure 1. The primary physical inputs for the system are fuel and air for the combustion unit and water for the cooling tower operation. The system’s physical outputs are electricity power, heat output, and flue gas. All other thermodynamic conditions, such as temperature, pressure, component efficiencies, and ambient conditions, are described in Section 2.2.1, Section 2.2.2, Section 2.2.3, Section 2.2.4, Section 2.3.
2.2.1. Gas Turbine System—Brayton Cycle
The gas turbine Brayton cycle assembly includes an air compressor, combustion chamber, expander, and generator unit to produce electricity. The requirement for the air compression process was designed to utilize the generated power in the gas turbine unit. Three gas turbine systems for biomass, coal, and coal–biomass cofiring fuel feed systems were designed to analyze the system’s performance. The designed gas turbine system for coal–biomass cofiring systems is shown in Figure 2, and the designed parameters are illustrated in Table 3. The simulation was set up to produce 125 MW of electricity, and the fuel feed flow rate was regulated by using a controller to achieve this electricity energy output. The fuel feed flow rate is the controlling variable, and the electrical power produced is the controlled variable.

Table 3.
Gas turbine system parameters.
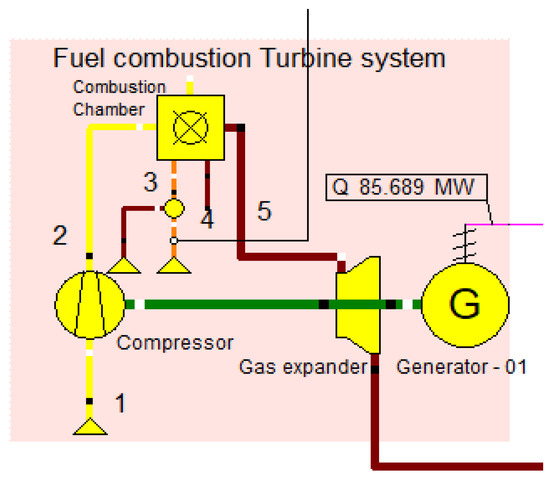
Figure 2.
Gas turbine system design for biomass and coal cofiring combustion.
2.2.2. Heat Recovery Steam Generator (HRSG)
The heat is exchanged between water and exhaust gas through the HRSG system, as shown in Figure 1 and Figure 3. There are several heat-exchanging processes in the HRSG, comprising an economizer, evaporator, and superheater unit. The HRSG system was designed to produce steam at 575 °C with 120 bars from the inlet water around 42 °C. The most critical parameter of the temperature difference between hot and cold fluid streams for the HRSG process is described in Table 4.

Table 4.
HRSG system parameters.
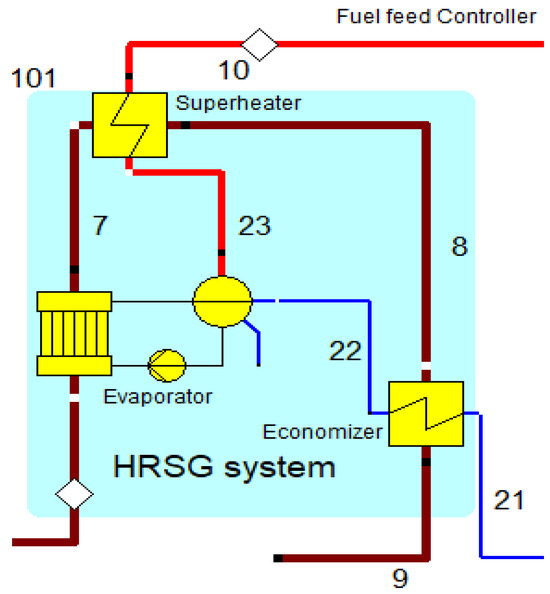
Figure 3.
HRSG system with economizer, evaporator, and superheater unit.
2.2.3. Steam Turbine System
The steam turbine system produces both electricity and heat energy and assists in fulfilling the combined cycle of power generation and CHP concepts. The steam turbine system consists of three different pressure and temperature units: high-pressure steam turbine (HPST), intermediate-pressure steam turbine (IPST), and low-pressure steam turbine (LPST); the operational parameters of these units are described in Table 5. Furthermore, a steam extraction unit was designed from an IPST unit with a steam consumer unit, as shown in Figure 4.

Table 5.
Steam turbine system parameters.
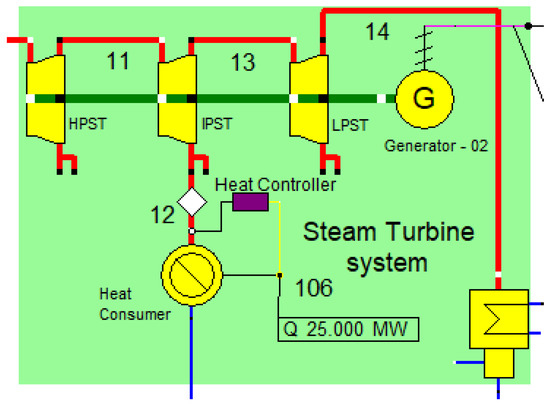
Figure 4.
Steam turbine system.
2.2.4. Power Generation, Collection, and Consumption
The simulation system was designed with combined cycle power generation, and the power is generated at two locations: a gas turbine generator unit and a steam turbine system generator unit. Furthermore, two pumping operations were added to the design to pump back the condensate water to the HRSG system, and the power for the pumping process was taken from the generated power through gas and steam turbine systems, as shown in Figure 1.
2.3. Physical Data Analysis
The data on temperature, pressure, enthalpy, entropy, and power consumption values of each stream and unit were taken from the Ebsilon simulation, and a detailed analysis was performed. These physical parameters were highly important in identifying the units with the highest energy and exergy consumed and the highest power consumed operation, which are critically important to further improving this power generation process.
2.4. Energy Efficiency Calculations
The next step is conducting an energy and exergy analysis on the system as a whole and performing an exergy analysis on components separately. The energy efficiency of the system is calculated using the following formula:
Electricity Energy efficiency = Electricity power produced/Feed Fuel energy = Electricity power produced/[Fuel feed rate × Lower heating value of Fuel].
Overall Energy efficiency (CCCHPeff) = [Electricity power produced + Heat energy produced/[Fuel feed rate × Lower heating value of Fuel].
2.5. Exergy Efficiency Calculations
The exergy is the maximum theoretical useful work (shaft work or electrical work) obtainable from an energy conversion system [26]. The exergy analysis is the best way to describe both the quantity and quality of energy and provides information about individual components. Hence, exergy analysis is the best way to evaluate an energy-based system [27]. The surface tension, nuclear, magnetic, and electrical exergy effects of a system are absent or negligible in most applications, and the overall exergy of a system is calculated without considering these effects. Then, the overall exergy of a system (Esys) is expressed with a summation of the four components of chemical exergy (ECH), physical exergy (EPH), potential exergy (EPT), and kinetic exergy (EKE) [32].
E𝑠𝑦𝑠 = 𝐸𝐶𝐻 + 𝐸𝑃𝐻 + 𝐸𝑃𝑇 + 𝐸𝐾𝐸
In most applications, the system is at rest compared to the environment, and potential and kinetic exergy change is assumed to be zero. Therefore, only chemical and physical exergy remain in the exergy balance equation.
𝐸𝑠𝑦𝑠 = 𝐸𝐶𝐻 + 𝐸𝑃𝐻
The physical exergy values were taken from the Ebsilon simulation software, and the chemical exergy values were calculated from the equation and values described in Appendix A and in Ref. [32].
The exergetic efficiency term ɛ is used to evaluate the thermodynamic performance of a system or component in a system. The ratio between the consumed resource of exergy of fuel EF and the desired product of exergy of product EP of the relevant system or component is used to evaluate the exergetic efficiency [32]. The exergetic efficiency equations for an overall system ‘tot’ are expressed in the following Equation (5). In addition, exergy destruction ED and exergy loss ɛL can be used to evaluate the performance of a system. The exergy destruction value represents the irreversibility of a system, which occurred as a result of chemical reaction, mixing, friction, heat transfer through finite temperature change, etc. [33]. In addition to exergy destruction, the exergy loss term ɛL exemplifies the exergy transmission from the system to the surrounding environment as exergy loss from a system [33].
ɛ = 𝐸𝑃,𝑡𝑜𝑡/𝐸𝐹,𝑡𝑜𝑡
2.6. Environmental Impact Assessment
The environmental impact was analyzed based on the flue gas components and their concentrations in the simulated system. These values were directly exported from the simulated software, providing detailed insights into emission characteristics, including key environment pollutants such as CO2 and SO2. These parameters provide a good insight into the environmental impact of different biomass and coal–biomass combustion systems.
3. Results
3.1. Simulation Result Analysis
3.1.1. Fuel Consumption
Based on the property described in Section 2.1, the coal has a CV of 35,590 KJ/kg, and with that condition, a 7.43 kg/s coal fuel feed flow rate is required to produce a total of 150 MW of power with 125 MW of electricity and 25 MW of heating power, which is the lowest fuel consumption compared with the biomass and coal–biomass cofiring systems as shown in Figure 5. The fuel consumption variation in biomass and coal–biomass cofiring systems with different moisture content for producing 125 MW of power and 25 MW of electricity are described in Figure 6 and Figure 7.
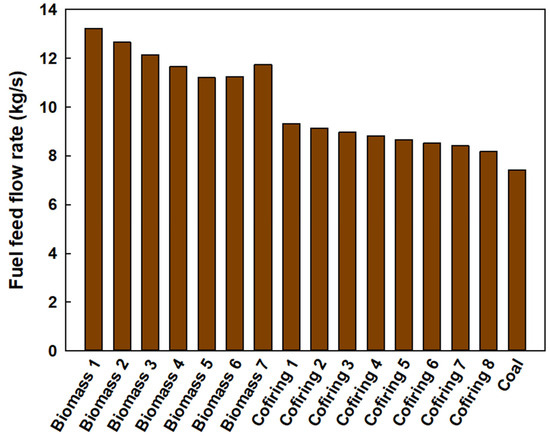
Figure 5.
Fuel feed flow rate kg/s with different fuel feed CCCHP systems to produce 150 MW of energy.
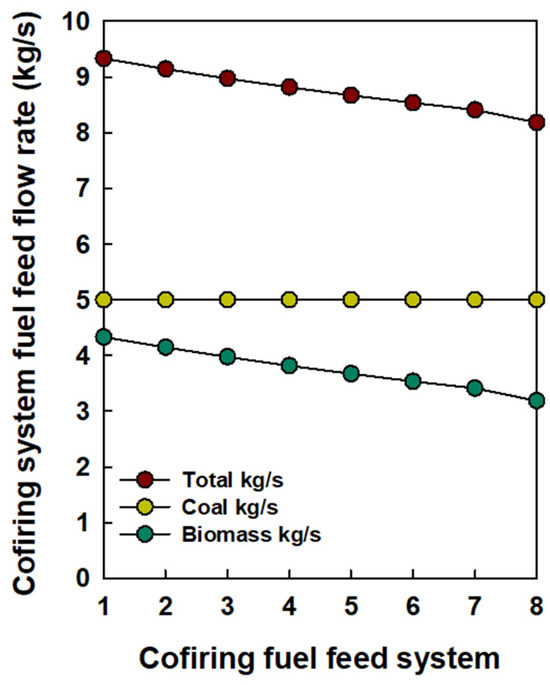
Figure 6.
Biomass fuel feed flow rate kg/s for different moisture contents to produce 150 MW of energy vs. the biomass feed system.
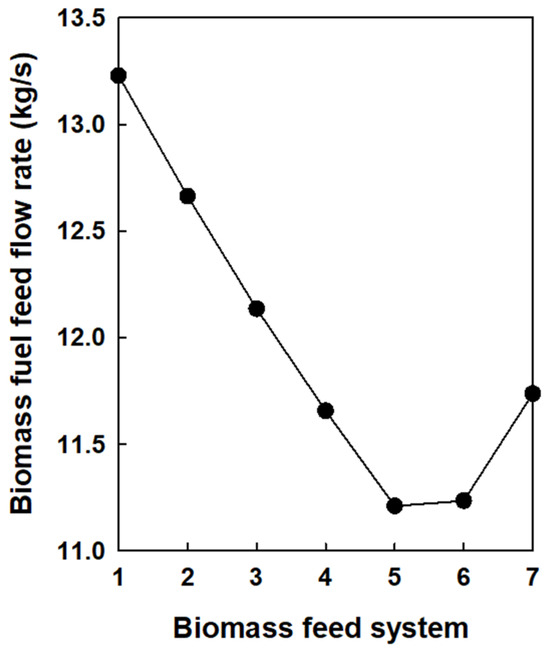
Figure 7.
Cofiring system fuel feed flow rate kg/s to produce 150 MW of energy vs. the cofiring fuel feed system.
The raw bagasse moisture content can be increased up to 52% (w/w) [34]. The amount of total fuel required to produce 150 MW of energy dropped to 11.2 kg/s from 13.25 kg/s, with the moisture content increasing from 10 to 30% (w/w) in the biomass combustion CCCHP systems. However, the further increase in moisture content over 30% leads to an increase in fuel consumption. The cofiring system observes the same pattern as the biomass feed combustion system. However, the required amount of fuel to produce 150 MW of energy was reduced with the increase until reaching the maximum possible moisture content from cofiring system 1 to cofiring system 8.
3.1.2. Enthalpy Analysis
The temperature level and energy content of the flue gas, steam-generated system, and condenser operation are critically important to maintain efficient CCCHP operation [35]. The HRGS efficiency and steam generation capability depend on the flue gas temperature and enthalpy.
As shown in Figure 8 and Figure 9, the enthalpy and temperature values of the streamlines 5, 6, and 7 of the flue gas are higher in the biomass simulated system compared with other systems. Therefore, the energy content of the flue gas just after the combustion process is higher in the biomass-simulated system, and higher energy content can be delivered in the gas expander process to produce power and to the water to produce steam through the HRSG unit [35]. Moreover, the high enthalpy in the flue gas indicates that a significant amount of energy generated in the combustion process is leaving with the exhaust gases, which represents a higher combustion efficiency loss [36,37]. However, this high energy content in the flue gas was recovered in the HRSG by producing steam and generating power through a steam turbine system.
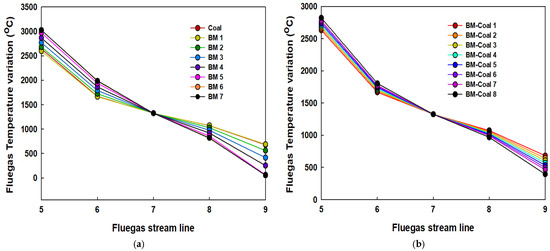
Figure 8.
Flue gas enthalpy: KJ/kg variation in flue gas streamline 5 to 9 of coal, biomass (a), and coal–biomass cofiring (b) systems.
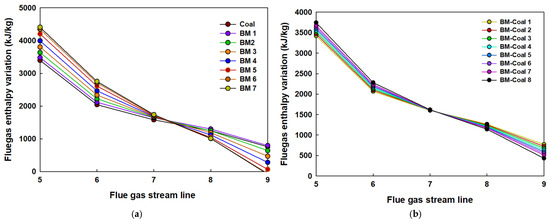
Figure 9.
Flue gas temperature: C variation in flue gas streamline 5 to 9 of coal, biomass (a), and coal–biomass cofiring (b) systems.
Based on Figure 9, the higher moisture content fuel combustion system flue gas emits to the environment at lower temperatures. The coal combustion system flue gas is released to the environment at 680 °C, the biomass combustion temperature flue gas release temperature varies from 688 °C to 56 °C with the moisture content varying from 10% (w/w) to 40% (w/w), and the coal–biomass cofiring combustion system flue gas emits to the environment at the 683 °C to 395 °C range with the moisture content varying from 10% (w/w) to 50% (w/w).
The coal combustion system produces dry flu gas compared with biomass combustion due to the low moisture content; however, biomass with high moisture content results in a higher concentration of water vapor in the exhaust stream. The enthalpy is a function of both temperature and mass specific energy content; the presence of higher water vapor contents leads to an increase in the heat in the exhaust, and biomass with 30% moisture content releases a significant amount of water vapor during the combustion process [38,39]. Furthermore, water vapor has higher specific heat capacity compared to dry flu gases such as CO2 and SO2 and has the ability to retain more energy [39]. Therefore, even with higher energy consumed in the combustion process to evaporate the water, the resulting steam in the flue gas contains a significantly higher amount of latent and sensible heat compared with dry flue gas and carries higher overall enthalpy. Ultimately, based on the second law of thermodynamics, this higher amount of heat will be released to the water through HRSG to produce steam to provide energy to the Ranking cycle. However, higher moisture content over 30% (w/w) can lead to water vapor condensing below the dew point, and the flue gas might cool significantly, releasing latent heat and resulting in a lower or negative enthalpy value [27,40]. Based on the second law of thermodynamics, part of this energy is lost as heat transfer occurs while increasing the entropy generation. Furthermore, biomass consists of relatively higher volatile matter compared to coal. During the combustion, this volatile matter burns rapidly, leading to higher flame temperatures, which generates higher flue gas temperatures [41].
3.1.3. Electrical Energy Produced Through Combined Cycle Operation
The simulation was designed to produce a total of 125 MW of electrical power output by combining a combustion exhaust gas turbine unit with a steam turbine system. As shown in Figure 10, the highest amount of power produced in the gas turbine system employed the Brayton cycle, which is illustrated in the coal and lowest moisture fuel moisture content systems. Furthermore, with the fuel moisture content increase, the amount of power produced in the Brayton cycle reduced from 87.78 MW to 72.18 MW in the biomass CCCHP systems, and it reduced from 87.68 MW to 80.05 MW in the coal–biomass cofiring systems. Vice versa, the power generated fraction to fulfill the 125 MW total requirement in the steam turbine system that employed Rankine cycles increased with the fuel moisture content increase.
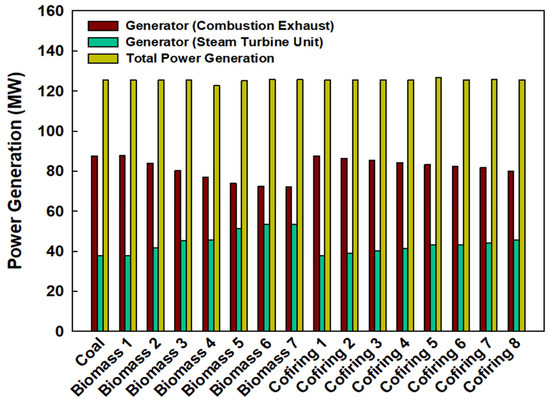
Figure 10.
Power generation (MW) for different moisture content fuel feed systems.
The generated electrical power is used for power 1 and 2, as described in Figure 1. However, the power consumed by these two pumps is highly dependent on the moisture content in the biomass. With the increase in moisture, the power consumed by the pumps also increased, according to Figure 11. According to Figure 11a, when the moisture content increased from 10% to 40%, pump 2 power increased from 511.35 to 695.75 kW, while pump 1 changed from 15.03 to 22.86 kW. It can be seen that from Figure 11b, pump 2 power consumption increased from 512.69 kW to 602.86 kW, while pump 1 power change was from 15.09 kW to 18.92 kW. However, considering the cumulative electrical power efficiency, this scenario can be neglected.
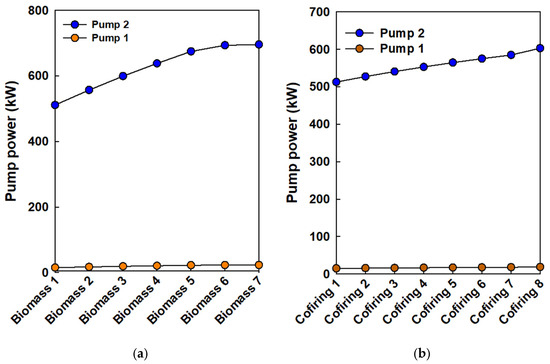
Figure 11.
Pump power with the moisture content of (a) biomass fuel with the sample number and (b) coal–biomass fuel with the sample number.
3.2. Energy Efficiency Calculation
Electric and CHP Efficiency for Biomass, Coal, and Cofiring Simulations
The CHP-operated CCCHP system’s energy efficiency was calculated based on the equations described in Section 2.4. The CHP efficiency is higher than the electrical efficiency in all simulated systems due to the combined energy outputs of energy and electricity in CCCHP systems (Figure 12). For 125 MW of electrical power generation and 150 MW of total heat and power generation, the highest electrical and CCCHP efficiency was observed in biomass combustion simulated systems compared to coal and coal–biomass cofiring systems. The biomass combustion system electric power generation efficiency and CHP efficiency increased from 47.45% and 56.90% to 56.07% and 67.22%, with the moisture content increasing from 10% (w/w) to 30% (w/w) due to the high amount of energy existing in flue gas transfer to the steam turbine system through HRSG and the production of more power via steam turbines that employed the Rankine cycle. However, similar to the enthalpy and energy figures of the flue gas, the biomass combustion systems with moisture content over 30% (w/w) have lower electrical and CCCHP efficiencies. The electrical and CCCHP efficiencies of the coal–biomass cofiring system also increased from 47.49% and 56.94% to 52.02% and 62.37%, and the moisture content increased from 10% (w/w) to 25.56% (w/w).
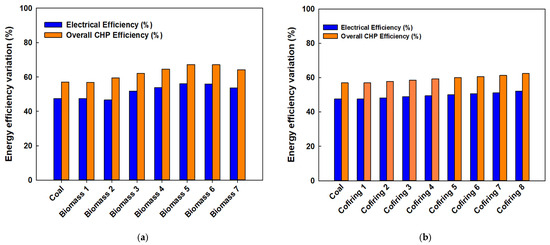
Figure 12.
Energy efficiency: coal and biomass combustion systems: (a) biomass; (b) cofiring.
3.3. Exergy Analysis
Exergy is crucial in the analysis of thermal power plants because it provides a deeper understanding of how energy can be utilized in the system while providing an indication of the usefulness of the energy of the relevant power plant.
Exergy efficiency can also be identified as an indicator of the quality of the energy of the system.
Table 6 and Figure 13 clearly display the behavior of the exergy of fuel, a product with exergy efficiency. The coal sample shows a higher exergy efficiency value compared to biomass samples; however, the exergy value increases with the moisture content of 10% to 30% (w/w). The same scenario can be seen in the coal–biomass cofiring samples. The exergy loss, which should be decreased with the increase in the exergy efficiency, is clearly indicated in Figure 14.

Table 6.
Exergy analysis results.
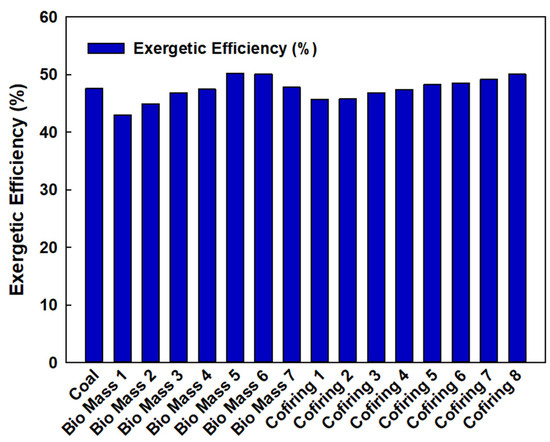
Figure 13.
Exergy efficiency ɛ of different CCCHP simulated systems.
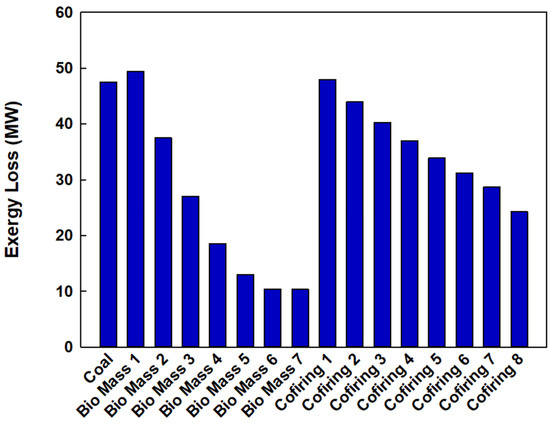
Figure 14.
Exergy loss ɛL of different CCCHP simulated systems.
3.4. Exhaust Condition and Environmental Impact
The findings show that there is a decrease in CO2 and SO2 emissions from Biomass 1 to Biomass 7. Increasing the moisture content of the biomass samples showed a tendency to decrease the emissions. However, at 30% moisture content, the reduction in SO2 and CO2 emissions becomes small and does not vary significantly. In this particular biomass sample, the SO2 level was very low, below 1%, and the CO2 concentration was found to be around 20%. Cofiring biomass systems have been made by mixing constant coal quantity with different types of biomass quantities with different moisture content to obtain constant energy output. The CO2 and SO2 emissions of these cofiring systems are shown in Figure 15.
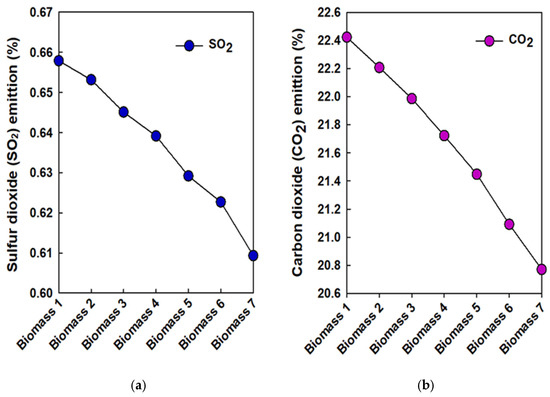
Figure 15.
Gas emission in biomass combustion systems: (a) SO2; (b) CO2.
As illustrated in Figure 16, raising the biomass cofiring amounts causes a decline in emissions of both CO2 and SO2 pollutants. Increasing the moisture content of sample one to sample eight from 10% to 25.56% (w/w) is also responsible for beneficial reductions, as explained in Section 3.2. Therefore, it is possible to achieve further reduction in CO2 and SO2 pollution by raising the level of biomass in the cofiring activity. Moreover, coal is a non-renewable fuel, and biomass, like bagasse, is an agricultural residual that is considered a sustainable and renewable fuel source. Biomass absorbs CO₂ during growth, which offsets the CO₂ released when burned, making it near carbon-neutral. Adding biomass to coal combustion reduces net GHG emissions [42].
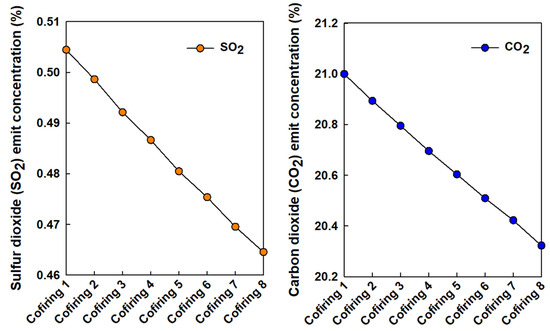
Figure 16.
Sulfur dioxide (SO2) emission concentrations in biomass combustion systems.
3.5. Conclusive Evaluation
Based on the overall fuel consumption figures, the biomass-simulated systems required a larger amount of fuel feed compared with the coal and cofiring systems. The bagasse CVs were chosen as the biomass for the simulation, and it has a lower gross energy content compared to coal; henceforth, biomass consumes a higher quantity of fuels to produce 150 MW of total energy in CCCHP operation.
Based on the Figure 1 design system in this simulation, the flue gas heat recovery and steam generation process take place in streamline 6 to 9, and the highest enthalpy reduction and energy transfer from flue gas to steam was observed in biomass simulations compared to coal–biomass cofiring and coal simulated systems. Therefore, higher energy content has been transferred to the steam turbine system employing the Rankine cycle through high moisture biomass combustion systems in the simulated combined cycle operation. However, as shown in Figure 8, the enthalpy values of the flue gas exiting streamline 9 of the biomass simulated system with a moisture content over 30% showed negative enthalpy figures. The higher moisture content can lead to water vapor condensing below the dew point, and the flue gas might cool significantly, releasing latent heat and resulting in a lower or negative enthalpy value [27,40]. As a result of this operation, the amount of energy transferred to the steam turbine system through HRSG can be lowered at higher moisture content flue gas streams. The flue gas generated in coal–biomass cofiring systems has a higher enthalpy, and energy figures are shown in fuel feeds with higher moisture content compared to fuel feeds with lower moisture.
As described in Section 3.1.2 and Section 3.1.3, the energy transferred to the steam turbine system employed the Rankine cycle through the waste heat recovery in the HRSG unit. The amount of power produced in the steam turbine section depends on the energy content in flue gas, and with the moisture content increased in fuel, the energy content in combustion flue gas increases and provides the opportunity to produce more power in the steam turbine system employed by the Rankine cycle. Finally, as a result of this, the overall CCCHP efficiency enhances with the increase in the fuel moisture content in the biomass and coal–biomass cofiring systems. However, when the moisture content of biomass fuel exceeds 30%, it reduces overall energy efficiency. This occurs because the high moisture content significantly lowers the temperature of the flue gas during the HRSG process. Additionally, water vapor condenses below its dew point, further decreasing the heat transfer from the flue gas to the water in the HRSG system. The efficiency of the biomass combustion CCCHP system increased from 56.90% to 67.22%, with the moisture content increasing from 10% to 30% (w/w) and beyond 30% (w/w) as the efficiency declined. Furthermore, the exergy efficiency showed a similar pattern with the same moisture content range, which increased from 43.03% to 50.06%, with the moisture content increasing up to 30% (w/w) in biomass samples and 45.72% to 50.10% in the cofiring sample. Furthermore, the environmental impact and CO2 and SO2 emission concentrations also reduced from 22.42% (w/w) to 20.77 (w/w) and 0.66% to 0.61%, respectively, with an increase in fuel moisture content from 10% to 25.56% in the biomass combustion CCCHP system.
Normally, when operating using biomass in conventional combustion systems, its combustion efficiency will reduce when increasing the moisture content of the biomass [43]. But the CCCHP systems’ efficiency does not behave like that. Increasing the moisture content of the biomass used in this CCCHP system increases the overall efficiency of the system up to a moisture increase of 30% (w/w). These types of systems differ from the other combustion systems due to these features. The cycle energy efficiency, based on the biomass heating value, has been observed to vary from 46.48% to 53.16% [30]. Similarly, but slightly higher than this simulated system, overall system efficiency varies from 56.95% to 62.37%; this is a comparatively better efficiency value for CHP systems. Cogeneration systems usually work best because they can utilize all the waste heat produced during the power generation process to produce useful thermal energy from it, thereby enhancing efficiency in electricity generation and heat utilization.
The exergy efficiency of the CCCHP system using only coal was said to be around 47% [44]. The simulation was run on coal and provided the same results, thus demonstrating consistency in this simulation model. Based on Reference [44], we can understandably assume that the results obtained from this study are at an adequate level, as it relates to this particular computation. Again, Reference [45] states that the energy efficiency of the system is between 50 and 60%. Our results concerning the coal usage also plugged in a 50 to 60% energy efficiency. With that, comparing the simulation results to earlier research data shows a close relation and further supports the validity of the study model.
4. Conclusions
This study analyzes energy and exergy efficiency variation in a Cycle Combined Heat and Power simulated system with different coal, biomass, and coal–biomass cofiring systems. The different moisture content feed was introduced to the simulation, and this study reveals that biomass-simulated systems utilize a higher amount of fuel compared to coal and cofiring systems due to the lower CV of biomass. The combination of high-moisture biomass combustion with CCCHP operation enhances the energy transferred to the steam turbine through the Rankine cycle. The overall energy and exergy efficiency increased with the increase in fuel moisture content of up to 30%, and beyond this point, the efficiency declined due to the reduction in heat transfer in the HRSG process caused by flue gas cooling and latent heat release. The efficiency of the biomass combustion CCCHP system increased from 56.90% to 67.22%, with the moisture content rising from 10% to 30% (w/w), but declined beyond 30% (w/w). The coal–biomass cofiring system energy efficiency also increased from 56.94% to 62.37%, with the moisture of content fuel feed increasing from 10% (w/w) to 25.56% (w/w). Moreover, the exergy efficiency showed a similar pattern of increase from 43.03% to 50.06%, with moisture content increasing up to 30% (w/w) in biomass samples and 45.72% to 50.10% in the cofiring sample. Moreover, environmental benefits were observed, with reductions in CO2 and SO2 emissions related to increased fuel moisture content. The environmental impact and CO2 and SO2 emission concentrations reduced from 22.42% (w/w) to 20.77 (w/w) and 0.66% to 0.61%, respectively, with an increase in fuel moisture content from 10% to 25.56% in the biomass cofired combustion CCCHP system. Ultimately, this study underscores the importance of optimizing moisture content in biomass and coal–biomass cofiring systems with CCCHP operation to optimize efficiency, energy output, and environmental performance. The findings emphasize that renewable biomasses, such as bagasse, are shown as a promising alternative to replace coal in CCCHP applications. The higher moisture content of 30% (w/w) in bagasse biomass has shown better performance in CCCHP operation, enhancing overall system efficiency, while reducing the drying cost of biomass feedstocks is an additional economic advantage. By utilizing biomass resources effectively, CCCHP systems can improve sustainability, lower carbon emissions, and contribute to the global transition toward cleaner energy solutions.
Author Contributions
Conceptualization, D.W. and K.R.K.; methodology, D.W. and P.A.; validation., A.I. and V.V.; formal analysis, D.W. and P.A.; investigation, D.W.; resources, K.R.K.; data curation, D.W. and P.A.; writing—original draft preparation, D.W., P.A., A.I. and K.R.K.; writing—review and editing, K.R.K.; visualization, D.W., P.A., A.I. and V.V.; supervision, K.R.K.; project administration, K.R.K.; funding acquisition, K.R.K. All authors have read and agreed to the published version of the manuscript.
Funding
This research was supported by the Science and Technology Human Resource Development Project, Ministry of Education, Sri Lanka, funded by the Asian Development Bank (Grant No. CRG-R2-SB-1).
Data Availability Statement
Data are contained within the article.
Conflicts of Interest
The authors declare no conflicts of interest.
Appendix A
Fuel chemical exergy calculation [32].
Entropy calculation [32].
The chemical exergy of an ideal mixture of N ideal gases [32].
, a, b, c, and d values of equations.

Table A1.
, a, b, c, and d values of equations in Appendix A.
Table A1.
, a, b, c, and d values of equations in Appendix A.
| S+ | a | b | c | d | |
|---|---|---|---|---|---|
| CO2 | −87.078 | 51.128 | 4.368 | −1.469 | 0 |
| SO2 | −43.725 | 49.936 | 4.766 | −1.046 | 0 |
| N2 | 51.539 | 24.229 | 10.521 | 0.18 | −2.315 |
| O2 | 36.116 | 29.154 | 6.477 | −0.184 | −1.017 |
| H2O | −11.75 | 34.376 | 7.841 | −0.423 | 0 |
References
- Spliethoff, H. Solid Fuels. In Power Generation from Solid Fuels; Spliethoff, H., Ed.; Springer: Berlin/Heidelberg, Germany, 2010; pp. 15–56. ISBN 978-3-642-02856-4. [Google Scholar]
- Spliethoff, H. Steam Power Stations for Electricity and Heat Generation. In Power Generation from Solid Fuels; Spliethoff, H., Ed.; Springer: Berlin/Heidelberg, Germany, 2010; pp. 73–219. ISBN 978-3-642-02856-4. [Google Scholar]
- Rajabi, M.S.; Moradi, R. Fossil Fuels Reservoirs and Extraction. In Encyclopedia of Renewable Energy, Sustainability and the Environment, 1st ed.; Rahimpour, M.R., Ed.; Elsevier: Oxford, UK, 2024; pp. 61–68. ISBN 978-0-323-93941-6. [Google Scholar]
- Global Coal Consumption, 2022–2024—Charts—Data & Statistics. Available online: https://www.iea.org/data-and-statistics/charts/global-coal-consumption-2022-2024 (accessed on 1 March 2025).
- Balat, M.; Ayar, G. Biomass Energy in the World, Use of Biomass and Potential Trends. Energy Sources 2005, 27, 931–940. Available online: https://www.tandfonline.com/doi/pdf/10.1080/00908310490449045 (accessed on 16 November 2024). [CrossRef]
- Nunes, L.J.R.; Casau, M.; Matias, J.C.O.; Dias, M.F. Coal to Biomass Transition as the Path to Sustainable Energy Production: A Hypothetical Case Scenario with the Conversion of Pego Power Plant (Portugal). Appl. Sci. 2023, 13, 4349. [Google Scholar] [CrossRef]
- Energy from Biomass: Advantages and Disadvantages of This Alternative Source. Available online: https://www.edp.com/en/edp-yes/energy-from-biomass-advantages-and-disadvantages-alternative-source (accessed on 16 November 2024).
- Biomass for Electricity Generation|WBDG—Whole Building Design Guide. Available online: https://www.wbdg.org/resources/biomass-electricity-generation (accessed on 16 November 2024).
- Biomass Power Generation Market Share, Outlook & Analysis 2030|The Brainy Insights. Available online: https://www.thebrainyinsights.com/report/biomass-power-generation-market-12770?utm_source=linkedin_A_a_s_ (accessed on 16 November 2024).
- Choi, S.H.; Manousiouthakis, V.I. On the Carbon Cycle Impact of Combustion of Harvested Plant Biomass vs. Fossil Carbon Resources. Comput. Chem. Eng. 2020, 140, 106942. [Google Scholar] [CrossRef]
- Demirbas, A. Combustion Characteristics of Different Biomass Fuels. Prog. Energy Combust. Sci. 2004, 30, 219–230. [Google Scholar] [CrossRef]
- Bridgwater, A.V. Review of Fast Pyrolysis of Biomass and Product Upgrading. Biomass Bioenergy 2012, 38, 68–94. [Google Scholar] [CrossRef]
- Shariati, M.; Ghaebi, H.; Rashidzadeh, H.; Rostamzadeh Khosroshahi, A. Thermodynamic Evaluation of a State-of-Art Poly-Generation System Fueled by Natural Gas and Biomass for Cooling, Power, and Hot Water Generation. Therm. Sci. Eng. Prog. 2024, 47, 102308. [Google Scholar] [CrossRef]
- Herath, H.D.K.; Lidula, N.W.A. Mitigation of Solar Intermittency Using Battery Energy Storage Systems, as a Case Study for Sri Lanka. In Proceedings of the 2022 IEEE International Conference on Power and Energy (PECon), Langkawi, Malaysia, 5–6 December 2022; pp. 426–430. [Google Scholar]
- Kalam, A.; King, A.; Moret, E.; Weerasinghe, U. Combined Heat and Power Systems: Economic and Policy Barriers to Growth. Chem. Cent. J. 2012, 6, S3. [Google Scholar] [CrossRef]
- Radovanović, M. Strategic Priorities of Sustainable Energy Development. In Sustainable Energy Management; Elsevier: Amsterdam, The Netherlands, 2023; pp. 181–277. ISBN 978-0-12-821086-4. [Google Scholar]
- Mahian, O.; Mirzaie, M.R.; Kasaeian, A.; Mousavi, S.H. Exergy Analysis in Combined Heat and Power Systems: A Review. Energy Convers. Manag. 2020, 226, 113467. [Google Scholar] [CrossRef]
- Cavallaro, F.; Zavadskas, E.; Raslanas, S. Evaluation of Combined Heat and Power (CHP) Systems Using Fuzzy Shannon Entropy and Fuzzy TOPSIS. Sustainability 2016, 8, 556. [Google Scholar] [CrossRef]
- Henning, H.-M.; Palzer, A. A Comprehensive Model for the German Electricity and Heat Sector in a Future Energy System with a Dominant Contribution from Renewable Energy Technologies—Part I: Methodology. Renew. Sustain. Energy Rev. 2014, 30, 1003–1018. [Google Scholar] [CrossRef]
- Islam, M.M.; Hasanuzzaman, M.; Pandey, A.K.; Rahim, N.A. Modern Energy Conversion Technologies. In Energy for Sustainable Development; Elsevier: Amsterdam, The Netherlands, 2020; pp. 19–39. ISBN 978-0-12-814645-3. [Google Scholar]
- Miller, B.G. Clean Coal Technologies for Advanced Power Generation. In Clean Coal Engineering Technology; Butterworth-Heinemann: Oxford, UK, 2010. [Google Scholar]
- Global Energy Review: CO2 Emissions in 2021—Analysis. Available online: https://www.iea.org/reports/global-energy-review-co2-emissions-in-2021-2 (accessed on 16 November 2024).
- Costa, M.A.M.; Schiavon, N.C.B.; Felizardo, M.P.; Souza, A.J.D.; Dussán, K.J. Emission Analysis of Sugarcane Bagasse Combustion in a Burner Pilot. Sustain. Chem. Pharm. 2023, 32, 101028. [Google Scholar] [CrossRef]
- Bragato, M.; Joshi, K.; Carlson, J.B.; Tenório, J.A.S.; Levendis, Y.A. Combustion of Coal, Bagasse and Blends Thereof: Part I: Emissions from Batch Combustion of Fixed Beds of Fuels. Fuel 2024, 96, 43–50. [Google Scholar] [CrossRef]
- Sheehan, M.; Antunes, E.; Seligmann, B.; Weight, C. The Influence of Moisture Content on Dust Generation in Falling Curtains of Sugarcane Bagasse Fiber. Powder Technol. 2022, 397, 117001. [Google Scholar] [CrossRef]
- Morosuk, T.; Tesch, S.; Tsatsaronis, G. Concepts for Regasification of LNG in Industrial Parks. In Advances in Natural Gas Emerging Technologies; Al-Megren, H.A., Altamimi, R.H., Eds.; InTech: London, UK, 2017; ISBN 978-953-51-3433-6. [Google Scholar]
- Petrakopoulou, F. Comparative Evaluation of Power Plants with CO2 Capture: Thermodynamic, Economic and Environmental Performance. Available online: https://inis.iaea.org/records/00s68-e9x69 (accessed on 4 February 2011).
- Hawthorne, C.; Trossmann, M.; Galindo Cifre, P.; Schuster, A.; Scheffknecht, G. Simulation of the Carbonate Looping Power Cycle. Energy Procedia 2009, 1, 1387–1394. [Google Scholar] [CrossRef]
- Mohtaram, S.; Chen, W.; Zargar, T.; Lin, J. Energy-Exergy Analysis of Compressor Pressure Ratio Effects on Thermodynamic Performance of Ammonia Water Combined Cycle. Energy Convers. Manag. 2017, 134, 77–87. [Google Scholar] [CrossRef]
- Soltani, S.; Mahmoudi, S.M.S.; Yari, M.; Rosen, M.A. Thermodynamic Analyses of a Biomass Integrated Fired Combined Cycle. Appl. Therm. Eng. 2013, 59, 60–68. [Google Scholar] [CrossRef]
- Bany Ata, A.; Seufert, P.M.; Heinze, C.; Alobaid, F.; Epple, B. Optimization of Integrated Gasification Combined-Cycle Power Plant for Polygeneration of Power and Chemicals. Energies 2021, 14, 7285. [Google Scholar] [CrossRef]
- Bejan, A.; Tsatsaronis, G.; Moran, M.J. Thermal Design and Optimization; John Wiley & Sons: Hoboken, NJ, USA, 1995; ISBN 978-0-471-58467-4. [Google Scholar]
- Hamdy, S. Cryogenic Energy Storage Systems: An Exergy-Based Evaluation and Optimization. Ph.D. Thesis, Technische Universität Berlin, Berlin, Germany, 2019. [Google Scholar]
- Kalifa, M.A.; Habtu, N.G.; Jembere, A.L.; Genet, M.B. Characterization and Evaluation of Torrefied Sugarcane Bagasse to Improve the Fuel Properties. Curr. Res. Green Sustain. Chem. 2024, 8, 100395. [Google Scholar] [CrossRef]
- Tavana, M.; Deymi-Dashtebayaz, M.; Gholizadeh, M.; Ghorbani, S.; Dadpour, D. Optimizing Building Energy Efficiency with a Combined Cooling, Heating, and Power (CCHP) System Driven by Boiler Waste Heat Recovery. J. Build. Eng. 2024, 97, 110982. [Google Scholar] [CrossRef]
- Dzurenda, L.; Banski, A. Dependence of the Boiler Flue Gas Losses on Humidity of Wood Biomass. Arch. Thermodyn. 2015, 36, 77–86. [Google Scholar] [CrossRef]
- Zhao, N.; Li, B.; Ahmad, R.; Ding, F.; Zhou, Y.; Li, G.; Zayan, A.M.I.; Dong, R. Dynamic Relationships between Real-Time Fuel Moisture Content and Combustion-Emission-Performance Characteristics of Wood Pellets in a Top-Lit Updraft Cookstove. Case Stud. Therm. Eng. 2021, 28, 101484. [Google Scholar] [CrossRef]
- Pihl, E.; Heyne, S.; Thunman, H.; Johnsson, F. Highly Efficient Electricity Generation from Biomass by Integration and Hybridization with Combined Cycle Gas Turbine (CCGT) Plants for Natural Gas. Energy 2010, 35, 4042–4052. [Google Scholar] [CrossRef]
- Förtsch, D. On the Dependencies of the Average Specific Heat Capacity of Flue Gas. Fuel Commun. 2025, 100136. [Google Scholar] [CrossRef]
- Zhao, Y.; Yan, X.; Fan, Y.; Ge, M.; Yue, L.; Wang, S. Analysis of Optimal Humidification Temperature for a Flue Gas Thermoelectric Generation System with Gas Humidification. J. Clean. Prod. 2021, 285, 125467. [Google Scholar] [CrossRef]
- Kijo-Kleczkowska, A.; Szumera, M.; Gnatowski, A.; Sadkowski, D. Comparative Thermal Analysis of Coal Fuels, Biomass, Fly Ash and Polyamide. Energy 2022, 258, 124840. [Google Scholar] [CrossRef]
- Haberl, H.; Sprinz, D.; Bonazountas, M.; Cocco, P.; Desaubies, Y.; Henze, M.; Hertel, O.; Johnson, R.K.; Kastrup, U.; Laconte, P.; et al. Correcting a Fundamental Error in Greenhouse Gas Accounting Related to Bioenergy. Energy Policy 2012, 45, 18–23. [Google Scholar] [CrossRef]
- Lai, Y.; Liu, X.; Davies, M.; Fisk, C.; Holliday, M.; King, D.; Zhang, Y.; Willmott, J. Characterisation of Wood Combustion and Emission under Varying Moisture Contents Using Multiple Imaging Techniques. Fuel 2024, 373, 132397. [Google Scholar] [CrossRef]
- Zhao, S.; Wang, W.; Ge, Z. Energy and Exergy Evaluations of a Combined Heat and Power System with a High Back-Pressure Turbine under Full Operating Conditions. Energies 2020, 13, 4484. [Google Scholar] [CrossRef]
- Çetin, B.; Ozen, E. Comparative energy and exergy analysis of a power plant with super-critical and sub-critical. J. Therm. Eng. 2018, 4, 2423–2431. [Google Scholar] [CrossRef]
Disclaimer/Publisher’s Note: The statements, opinions and data contained in all publications are solely those of the individual author(s) and contributor(s) and not of MDPI and/or the editor(s). MDPI and/or the editor(s) disclaim responsibility for any injury to people or property resulting from any ideas, methods, instructions or products referred to in the content. |
© 2025 by the authors. Licensee MDPI, Basel, Switzerland. This article is an open access article distributed under the terms and conditions of the Creative Commons Attribution (CC BY) license (https://creativecommons.org/licenses/by/4.0/).