Article

A Spatiotemporal Dynamic Evaluation of Soil Erosion at a Monthly Scale and the Identification of Driving Factors in Hainan Island Based on the Chinese Soil Loss Equation Model

1
School of Environmental Science and Engineering, Hainan University, Haikou 570228, China
2
Institute of International Rivers and Eco-Security, Yunnan University, Kunming 650504, China
3
Institute of Environmental and Ecological Engineering, Guangdong University of Technology, Guangzhou 510006, China
4
School of Ecology, Hainan University, Haikou 570228, China
5
College of International Tourism and Public Administration, Hainan University, Haikou 570228, China
6
Key Laboratory of Agro-Forestry Environmental Processes and Ecological Regulation of Hainan Province, Haikou 570228, China
*
Authors to whom correspondence should be addressed.
Sustainability 2025, 17(6), 2361; https://doi.org/10.3390/su17062361
Submission received: 26 December 2024 / Revised: 25 February 2025 / Accepted: 5 March 2025 / Published: 7 March 2025
(This article belongs to the Special Issue Sustainable Agriculture, Soil Erosion and Soil Conservation)

Abstract

:
The damage caused by soil erosion to global ecosystems is undeniable. However, traditional research methods often do not consider the unique soil characteristics specific to China and rainfall intensity variability in different periods on vegetation, and relatively few research efforts have addressed the attribution analysis of soil erosion changes in tropical islands. Therefore, this study applied a modification of the Chinese Soil Loss Equation (CSLE) to evaluate the monthly mean soil erosion modulus in Hainan Island over the past two decades, aiming to assess the potential soil erosion risk. The model demonstrated a relatively high R2, with validation results for the three basins yielding R2 values of 0.77, 0.64, and 0.78, respectively. The results indicated that the annual average soil erosion modulus was 92.76 t·hm−2·year−1, and the monthly average soil erosion modulus was 7.73 t·hm−2·month−1. The key months for soil erosion were May to October, which coincided with the rainy season, having an average erosion modulus of 8.11, 9.41, 14.49, 17.05, 18.33, and 15.36 t·hm−2·month−1, respectively. September marked the most critical period for soil erosion. High-erosion-risk zones are predominantly distributed in the central and eastern sections of the study area, gradually extending into the southwest. The monthly average soil erosion modulus increased with rising elevation and slope. The monthly variation trend in rainfall erosivity factor had a greater impact on soil water erosion than vegetation cover and biological practice factor. The identification of dynamic factors is crucial in areas prone to soil erosion, as it provides a scientific underpinning for monitoring soil erosion and implementing comprehensive water erosion management in these regions.

1. Introduction

The damage caused by soil erosion to global ecosystems is undeniable, and it has become an ecological and environmental problem that cannot be ignored globally [1]. Soil quality is directly related to food security, and the decline in soil fertility caused by erosion significantly restricts social development [2]. However, soil has long been adversely affected by substantial population growth, continuous economic development, and extreme climates, leading to progressively more severe soil degradation due to erosion worldwide [3,4]. Thus, it is imperative to investigate the extent and distribution of soil erosion at sub-annual time resolutions and understand the driving mechanisms behind it. This knowledge is essential for effectively preventing and regulating soil hydraulic erosion, particularly against the backdrop of extreme climatic conditions [5,6].
Since the late nineteenth century, much attention has been paid to the study of soil erosion [7]. Soil erosion models can be utilized in various contexts, including both temporal and spatial dimensions, due to their flexibility [8]. Scholars have established a variety of soil erosion prediction models from diverse perspectives containing experimental data, derived formulas, and empirical evidence [9,10,11]. However, most of the models require extensive input data and high complexity, necessitating numerous experiments and field research and thus limiting their widespread use. Due to their straightforward, mature structures and compatibility with geographic information systems, USLE and RUSLE equations have become the preferred models for soil erosion prediction in various spatial and temporal ranges [12,13]. Given the differences in natural conditions and production modes among China and the United States, Liu et al. [14] refined the CSLE model grounded in the RUSLE model. The CSLE model was localized to reflect the actual situation of natural soil scenario and site conditions in China, and the slope coefficient could be calculated from 9 to 55% [15]. This modification addresses the limitations of the USLE/RUSLE models in factually measuring soil erosion on slopes steeper than 10° [16]. Based on the actual production background and the situation of conserving soil and water resources in China, the C and P factors in the USLE/RUSLE models were updated to the B, E, and T elements in the CSLE model [17]. This categorization enhances the CSLE model’s capacity to more accurately reflect the situation of farming practices and conservation of soil and water in China compared to the USLE/RUSLE model [18], and all factors are recalibrated based on actual measured data from China, thereby enhancing the model’s reliability and its correlation with local conditions [19]. For example, He et al. [19] applied the CSLE model to analyze soil loss changes resulting from various measures, achieving an R2 value of 0.89. However, to date, the CSLE model has primarily been employed to measure fluctuations in soil water loss over the years, and the research on soil water loss at the intra-annual monthly scale is still weak [20,21]. When estimating vegetation cover and the biological practices (B) factor, previous studies have generally used the average annual normalized differential vegetation index (NDVI) assignment for different classifications of land use/cover [22,23]. The actual B factor is influenced by seasonal changes in rainfall erosivity [24], vegetation cover, and land cover [25]. Therefore, this coefficient calculation method covers up the influence of rainfall on the annual dynamic change in vegetation, ignores the annual change in hydraulic erosion, and is not enough to deeply understand the soil erosion status of seasons or months, especially in areas with large annual erosion changes.
Hainan Island lies in the northern section of the South China Sea and is one of the islands with the best natural ecological environment in China, but problems such as soil degradation and salinization still exist [26,27]. With the establishment of Hainan province and the construction of a free trade port, the land use on Hainan Island has undergone significant changes, such as the transformation of natural forests into economic forests, rapid population growth, and urban expansion [28,29,30]. The original land of Hainan Island consists of a tropical rainforest and rain belt rainforest, characterized by a wide variety of plant species and rapid growth rates. The normalized vegetation index exhibits significant seasonal variation, with faster vegetation growth during the summer compared to other seasons [31]. Hainan is influenced by a tropical monsoon climate, as it is positioned at the northern fringe of the tropical zone. The annual rainfall varies significantly by season. In summer, it is affected by the southeast monsoon, which is often accompanied by heavy rainfall and can easily cause soil erosion, particularly on slopes and in exposed areas. Therefore, hydraulic erosion is the predominant type of soil erosion on Hainan Island, and the entire island is classified as an area likely to experience soil erosion [32]. However, soil erosion studies on Hainan Island have mostly focused on annual scales or specific watershed, and the mechanisms of the intra-annual hydraulic erosion drivers of precipitation and vegetation have not yet been clarified.
Given the changing environmental conditions and frequently extreme climate changes, exploring the variability of sub-annual soil loss estimates and pinpointing the periods of the highest loss rates is crucial. This helps identify sensitivity risk periods for hydraulic erosion and implement targeted protection measures. It is assumed that in the absence of large-scale geological or human-induced land change, soil erodibility factors and slope length factors remain relatively static. Nevertheless, rainfall patterns and vegetation growth are expected to fluctuate because of the effects of natural climate conditions and human practice. Rainfall erosivity, vegetation cover, and biological measures are expected to exhibit intra-year variability. Recently, some studies have leveraged the dynamic characteristics of rainfall and vegetation to accurately identify the seasons and regions prone to soil erosion, thereby improving the temporal accuracy of soil erosion assessment. Cao et al. [33] examined the distribution of soil erosion on a multi-year average monthly scale in Northeast China during the 21st century, quantifying the contribution rates of key factors controlling monthly erosion; Castro et al. [34] assessed soil losses associated with rainfall seasonality in the Brazilian Cerrado; Polykretis et al. [35] researched the rates of soil erosion in Crete across different years and determined the seasonal soil erosion in various farming regions and managerial regions; Humphrey et al. [36], based on the monthly spatio-temporal model of soil erosion, proposed erosion protection suggestions for the Winam Gulf catchment in Kenya; and Schmidt et al. [37] mapped soil water erosion seasons in the Swiss National steppe. However, the above studies primarily utilized the RUSLE/USLE model, and there is a scarcity of studies employing the CSLE model to assess soil erosion on a monthly basis. And most soil erosion research focuses on arid and semi-arid areas, with relatively few studies on the mechanisms of soil erosion in tropical regions. The characteristics and mechanisms of soil erosion vary across different regions and have different response rules of soil erosion due to their unique climates and vegetation attributes. Consequently, clarifying the relationship between rainfall, vegetation, and soil erosion during a specific timeframe is essential.
In this research, MODIS data, DEM data, daily rainfall data, and land use data were utilized to modify the Chinese Soil Loss Equation, which was used to estimate the monthly mean soil erosion modulus for Hainan Island during the past two decades. The main objectives are (1) to determine the annual distribution pattern of soil erosion based on static and dynamic factors; (2) to calculate the relative importance of erosion factors and quantify dynamic factors driving the dynamic changes in soil erosion; (3) and to obtain spatio-temporal control strategies for soil erosion throughout the year. To provide evidence and ideas for researching soil erosion in areas with similar characteristics, we analyzed the soil erosion status on a monthly timescale, using the tropical region as the entry point.

2. Materials and Methods
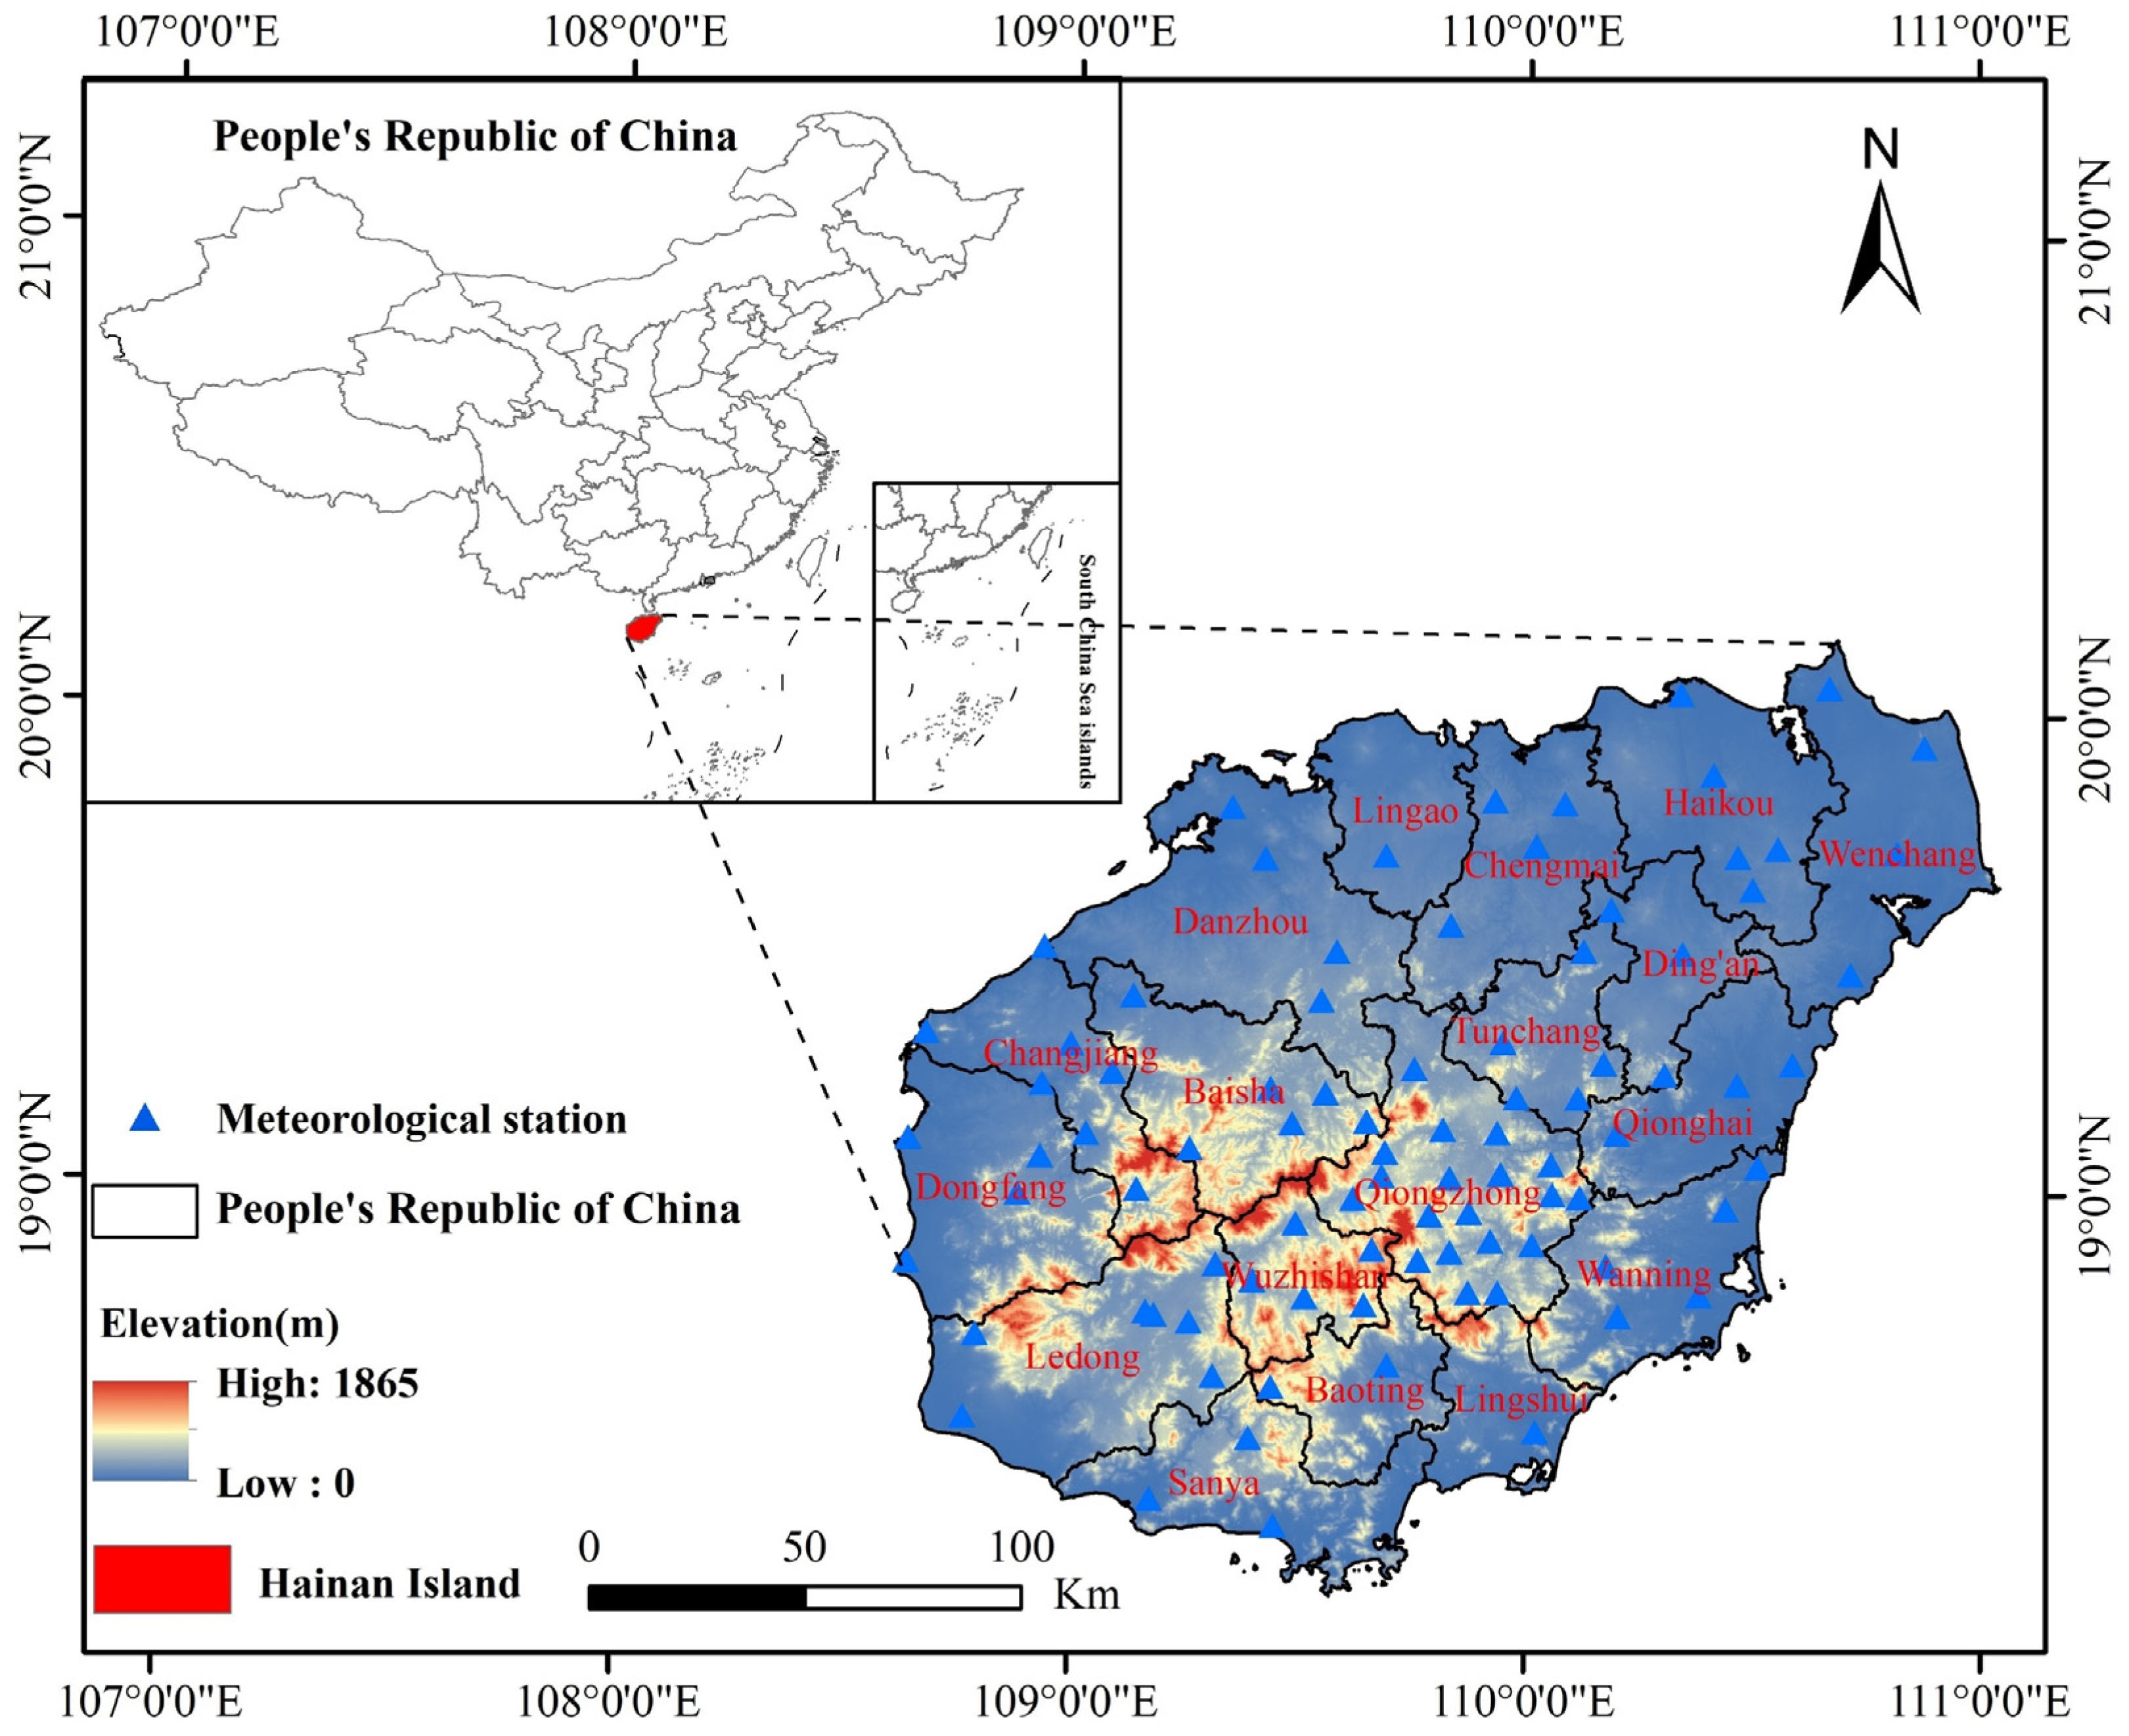
2.1. Study Area

Hainan Island is positioned in the northern section of the South China Sea, between 108°37′ and 111°03′ E and 18°10′ and 20°04′ N, covering a total area of 33,900 km2. It lies to the south of Guangdong Province and the Qiongzhou Strait. Hainan serves as an important region for studying hot zone climate and habitat changes [38]. Hainan Island has the most tropical maritime climate in China, exhibiting an average annual temperature ranging from 22.5 to 26.0 °C and average annual precipitation between 923 mm and 2460 mm. The distribution of precipitation is irregular both spatially and temporally, with summer and winter being influenced by different monsoons, leading to distinct wet and dry seasons [30]. On average, Hainan Island experiences approximately three tropical storms and typhoons annually. The terrain of Hainan Island is unique. It is surrounded by low and flat areas, and the center is dominated by towering dome mountains, with WuZhi Mountain and Yingge Ling as the uplift center; the terrain gradually decreases around the island in the form of mountains, hills, platforms, plains, and beaches. Soil erosion in Hainan Island is mainly hydraulic erosion. Due to the high rainfall, high intensity, and large cutting depth of erosion gullies, the gully walls that form the gullies expand rapidly in both sides, resulting in a large amount of erosion [39]. Especially in the near past, due to the influence of global weather patterns, frequent short-duration heavy rainfall, and human activities, soil and water loss in the region area has become increasingly severe (Figure 1).

2.2. Data Collection

This research predominantly relies on meteorological data, topographic data, land use/cover types, soil data, and MODIS satellite data. These datasets were utilized to assess soil erosion on a monthly scale, as well as the erosion factors in the study area (Table 1). Considering the need for multi-source heterogeneous data in soil erosion calculations, we applied the resampling tool in ArcGIS to harmonize the data to a 10 m resolution.

2.3. CSLE Model

The Chinese Soil Loss Equation is adapted to reflect the characteristics of Chinese soil, making the model applicable for calculating soil erosion across all regions of China [16,21,25]. The basic model expression for soil erosion estimation is as follows:
A = R × K × L × S × B × E × T
where soil erosion modulus is denoted by A (t·hm−2·a−1), and rainfall erosivity and soil erodibility factors are denoted by R (MJ·mm·hm−2·h−1·a−1) and K (t·hm2·h·hm−2·MJ−1·mm−1), respectively. Terrain factors are denoted by LS, while vegetation cover and biological practices, engineering measures, and tillage measures are denoted by B, E, and T, respectively. The units of these factors are all dimensionless. Considering the dynamic nature of rainfall and vegetation, the rainfall erosivity (R) and vegetation cover and biological practices (B) factors in Eq. 1 can be modified to a monthly temporal resolution, and the monthly soil erosion modulus can be calculated by multiplying these factors:
A m o n t h = R m o n t h × K × L × S × B m o n t h × E × T
Based on the monthly soil erosion modulus from five periods (2003, 2006, 2011, 2016, and 2021), the monthly mean soil erosion modulus over five years was calculated as follows:
A ¯ = i n A m o n t h 5
where the value of n = 5 corresponds to the following five time periods: 2003, 2006, 2011, 2016, and 2021.
By quantitatively describing the monthly changes in R and B factors, the CSLE could more accurately reflect soil erosion process in regions with significant seasonal rainfall variation such as Hainan Island. Compared with the traditional RUSLE model [33,35,37,40], it is more adaptive. In terms of resolution, all factors of the CSLE model are output at a resolution of 10 m × 10 m.

2.4. Rainfall Erosivity Factor (R)

The main driving force behind potential fluctuations in soil erosion is rainfall, and the magnitude of rainfall erosivity (R) reflects rainfall intensity’s effect on soil. In this work, we relied on the Technical Guide for Dynamic Detection of Soil and Water Loss in 2020 and utilized the model offered by Xie et al. [41] to compute the R value. This method produces R values across different time scales based on daily rainfall.
R ¯ h m k = 1 N i = 1 N j = 0 m α × P i , j , k 1.7625
where the k-th half-month’s rainfall erosivity was expressed as R ¯ h m k , and the a year is made up of 24 half-months (k = 1–24, a half month was recorded as 15/16 days) in units of MJ·mm·hm−2·h−1·a−1; i = 1, 2, …, N; in this analysis, N represents a 30-year time series length. R-values were calculated for 2003 using daily rainfall data from 1971 to 2000, for 2006 using 1976 to 2005, for 2011 using 1981 to 2010, for 2016 using 1986 to 2015, and for 2021 using 1991 to 2020; j = 0, 1, …, m; m denotes the total days with erosive rainfall occurring in the pertinent half-month, where erosive rainfall is indicated by daily totals of 10 mm or greater. The daily erosive rainfall is denoted by Pi,j,k, mm. In the warm season, which occurs from May to September, α is 0.3937, while it is 0.3101 in the remaining seasons. Based on each weather station, the monthly rainfall is divided into two and a half months, and the monthly rainfall erosivity is obtained by calculating the daily rainfall erosivity. Therefore, the rainfall erosivity of each month is derived by adding the corresponding two and a half months. The calculated values are interpolated into the Hainan Island R-grid layer by the ordinary Kriging method, and the R-grid map with a resolution of 10 m can be obtained.

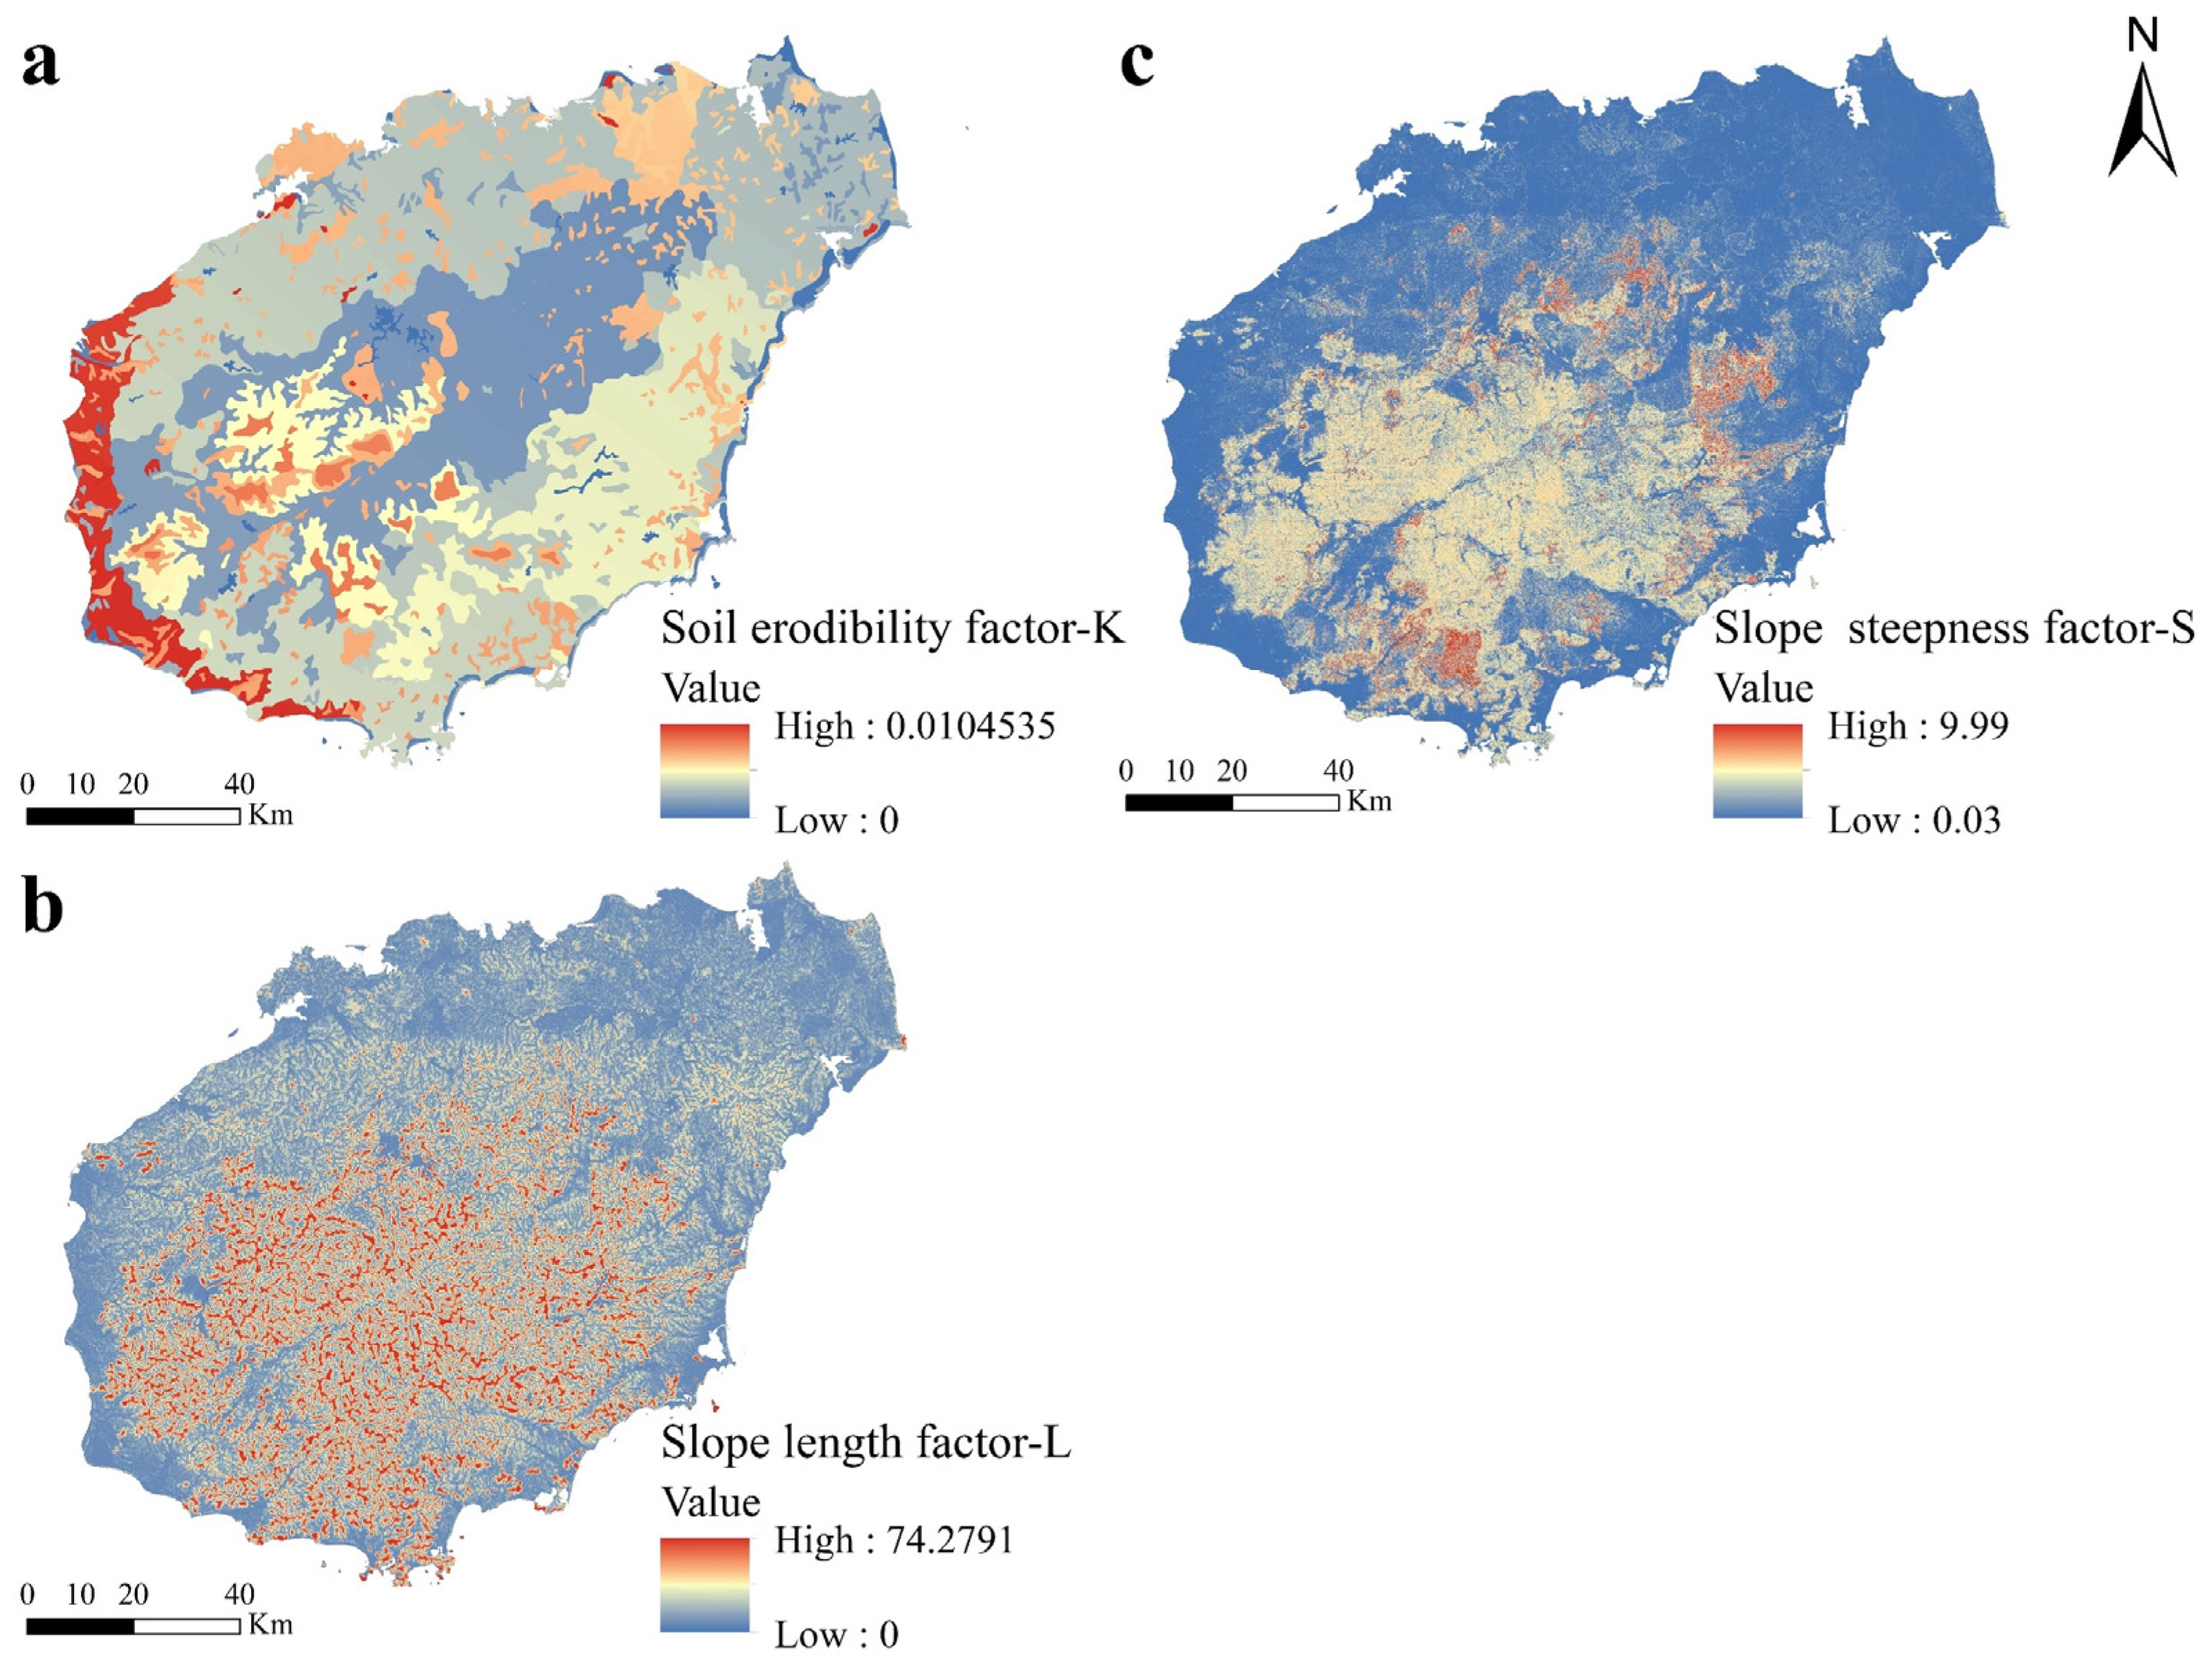
2.5. Soil Erodibility Factor (K)

Erosion leads to soil loss and is a primary source of sediment in rivers. The K value indicates variations in soil properties and measures soil’s ability to resist particle detachment and transport. The calculation method outlined in the EPIC model is utilized in this research, utilizing the formula outlined below [42]:
K = 0.2 + 0.3 × e x p 0.0256 × S A N × 1 S I L 100 × S I L C L A + S I L 0.3 × 1.0 0.25 × C C + e x p ( 3.72 2.95 × C ) × 1.0 0.7 × S N I S N I + e x p ( 5.51 + 22.9 × S N I )
where, denoted by K, the soil erodibility factor is expressed in units of t·hm2·h·hm−2·MJ−1·mm−1; SAN, CLA, SIL, and C represent the content of sand particles, clay particles and organic matter, respectively (%), S N I = 1 0.01 × S A N . In addition, conversion units need to be multiplied by a factor of 0.1317 and assigned according to the soil type.

2.6. Slope Length Factor (L) and Slope Steepness Factor (S)

Topographic relief is a crucial factor in soil erosion. In the calculation model, slope length (L) and slope steepness (S) are used to assess how terrain variations influence spatial differences in soil erosion processes. The resolution of the Digital Elevation Model (DEM) influences the accuracy of LS factor calculations. A higher-resolution DEM leads to more precise calculation results [43]. Based on GIS raster computing technology, DEM data with 10 m resolution are used to calculate LS factor, specifically as follows:
Slope length factor (L):
L i = λ i m + 1 λ i 1 m + 1 λ i λ i 1 × 22.13 m
m = 0.2 θ 1 ° 0.3 1 ° θ 5 ° 0.4 3 ° θ 5 ° 0.5 θ > 5 °
where the slope length factor, illustrated by L, is defined as a dimensionless value; the slope length of each slope section is defined as λ, indicating that the unit is m; and the slope length index is defined as m, which is a dimensionless value and takes different values with the range of slope.
Slope steepness factor (S):
S = 10.8 sin θ + 0.03 θ < 5 ° 16.8 sin θ 0.5 5 ° θ 10 ° 21.9 sin θ 0.96 θ 10 °
where the slope steepness factor is defined as S and is a dimensionless value, and slope is defined as θ in degrees. Furthermore, when the slope of the land use plot is greater than 30°, 30° is substituted into Equation (8) to calculate the slope factor, and woodland and grassland under other slopes are calculated according to equation S = 10.8 sin θ + 0.03 .

2.7. Vegetation Cover and Biological Practices Factor (B)

Vegetation restoration is one of the most effective measures for addressing soil and water loss. The roots, stems, and leaves of vegetation play a critical role in conserving soil and water [14]. Different geographical features and climatic conditions can cause vegetation to change over time, and the extent of soil erosion varies greatly depending on vegetation type and coverage. Considering these factors, the soil loss ratio (SLR) was calculated for each half-month period and weighted by erosive force to obtain the B value [21]. Thus, the factors of B in each month are as follows:
B i = S L R K × R K R K
where factors of vegetation cover and biological measures in each month were expressed as Bi (i = 1, 2, …, 12); SLRk represents the proportion of soil loss in garden, forest, and grassland in the k and a half month (dimensionless, the value ranges from 0 to 1). The Kth semilunar rainfall erosivity was defined as Rk, with K ranging from 1 to 24. In this study, the B value calculated takes into account the impact of rainfall intensity on vegetation in different months.
The calculation steps are as follows: First, continuous normalized differential vegetation index (NDVI) data for different land features are generated using MODIS-MOD13Q1 product data (every 15 days). Second, the NDVI values are converted into vegetation coverage. Third, the soil loss ratio (SLR) is calculated based on different land use types. Fourth, the ArcGIS raster calculator tool is used to calculate B for each month and generate 10 m raster data.
Tea plantations and shrub land SLRk are calculated via the following equation:
S L R k = 1 1.17647 + 0.86242 × 1.05905 100 × F V C
Woodland, other woodland, orchard, and other garden land SLRk are calculated via the following equation:
S L R k = 0.44468 × e 3.20096 × G D 0.04099 × e F V C F V C × G D + 0.25
Grassland SLRk is calculated via the following equation:
S L R k = 1 1.25 + 0.78845 × 1.05968 100 × F V C
F V C = N D V I N D V I s o i l N D V I v e g N D V I s o i l
where FVC is the vegetation coverage; NDVI for pure exposed soil pixels and pure vegetation cover are denoted by NDVIsoil and NDVIveg, respectively; and GD represents the understory coverage of a forest.
The B factor of other land use types is realized by assignment, and the B values of different land uses are shown in Table 2. It is important to note that “other land” refers to saline–alkali land, sandy land, bare land, bare rock gravel land, etc.

2.8. Engineering Practices Factor (E) and Tillage Practices Factor (T)

The effect of engineering control measures on soil loss is represented in the calculation model as the engineering practices factor (E). Engineering control measures involve constructing terraces, sedimentation dams, and other modifications to the landscape aimed at reducing runoff and preventing soil erosion [14]. In this research, due to the extensive size of the research area, it is difficult to accurately determine the location of engineering measures, so a single watershed in the study area is used as a unit to collect engineering measures data. The data will be collected and processed to correct the soil erosion calculation results.
Tillage practices are designed to fertilize fields, increase agricultural output, and conserve both water and soil. They achieve this by altering micro-topography and increasing land cover through various tillage techniques [16]. The tillage factor (T) denotes the ratio of soil loss resulting from a specific tillage practice compared to soil loss in the absence of tillage under identical conditions. Hainan Island is part of the late triple cropping and hot triple cropping zones of the South China hilly coastal plain; the water and heat conditions in this area are the best in China, suitable for planting late double-cropping rice. Warm crops, tropical and subtropical cash crops, and fruit trees can also be grown in winter. The factor values for tillage measures were determined using the rotation measure assignment table from the Technical Guide for Dynamic Detection of Soil and Water Loss in 2020. In the land use grid map, the field assignment resulted in a T value of 0.459, whereas a value of 1 was assigned to other areas.

2.9. Importance of Random Forest Calculation of Erosion Factors

Random forest (RF) is a machine learning algorithm [44]. The calculation of feature importance is a key function of the RF model, where the greater the relative importance of a feature, the greater its impact on the overall model. Therefore, this study calculated the relative importance of soil erosion features using the RF package in R (version R 4.3.2).

2.10. Decomposition Analysis of LMDI Model Change

The logarithmic mean Divisia index (LMDI) approach is a factor decomposition analysis technique characterized by its reliable theoretical basis, strong applicability, simplicity, and lack of residuals in decomposition. This method’s decomposed results clearly illustrate the influence of each individual factor [45,46,47]. The LMDI method was used to measure the influence of each factor to fluctuations in soil erosion and to identify the key drivers. Soil erosion changes are ascribed to climate change and anthropogenic activities, given that the temporal fluctuations in topographic and soil factors are minimal in the short term. Thus, in this study, climate change (rainfall erosivity, R) and human activities (vegetation cover and biological practices, B) were selected to identify the decomposition power of monthly soil erosion changes in Hainan Island. The CSLE model aligns with the structural assumptions of the LMDI model. Using the monthly R and B factors derived from the CSLE model, a suitable LMDI model was developed for this study. The decomposition effect of these two factors was then quantified. The equation used is as follows:
A R = i n A i m A i m 1 ln A i m ln A i m 1 ln R k , i m R k , i m 1
A B = i n A i m A i m 1 ln A i m ln A i m 1 ln B k , i m B k , i m 1
where the contribution degree of factor R and factor B to monthly soil erosion (A) is denoted as A R and A B , respectively; A i m represents the modulus of soil erosion for the m t h month (t/hm2·a); A i m 1 represents the modulus of soil erosion for the ( m 1 ) t h month (t/hm2·a); R k , i m represents the rainfall erosion force factor for the m t h month; R k , i m 1 represents the rainfall erosion force factor for the ( m 1 ) t h month; B k , i m represents the vegetation cover and biological practice factor for the m t h month; and B k , i m 1 represents the vegetation cover and biological practice factor for the ( m 1 ) t h month. A positive index indicates that each driving factor facilitates the progression of soil erosion, resulting in an incremental effect. Conversely, a negative index signifies that each driving factor restricts the progression of soil erosion, leading to a reduction effect. Since each factor in the CSLE model is an independent single set, n is assigned a value of 1.
Incorporating the aforementioned formulas, a total of six combinations of results can be identified regarding the effects of the impact of both factors on shifts in soil erosion (Table 3). The results were presented at 10 m resolution using ArcGIS (version ArcGIS 10.2).

3. Results

3.1. Spatial Layout of Each Static Element in the CSLE Model

Soil erodibility factor (K) values in Hainan Island ranged from 0 to 0.0104535 t·ha2·h·ha−2·MJ−1·mm−1, with an average value of 0.0056 t·ha2·h·ha−2·MJ−1·mm−1 (Figure 2a) The spatial distribution of soil in the study area was complex, with significant variation in soil erodibility, demonstrating a tendency for higher values in the southwest as opposed to the northeast. Slope length factor varied from 0 to 74.2791, with an average value of 3.66 (Figure 2b). In contrast, the slope steepness factor ranged from 0.03 to 9.99, with an average value of 1.84 (Figure 2c).

3.2. Spatial Distribution of Dynamic Factors in CSLE Model

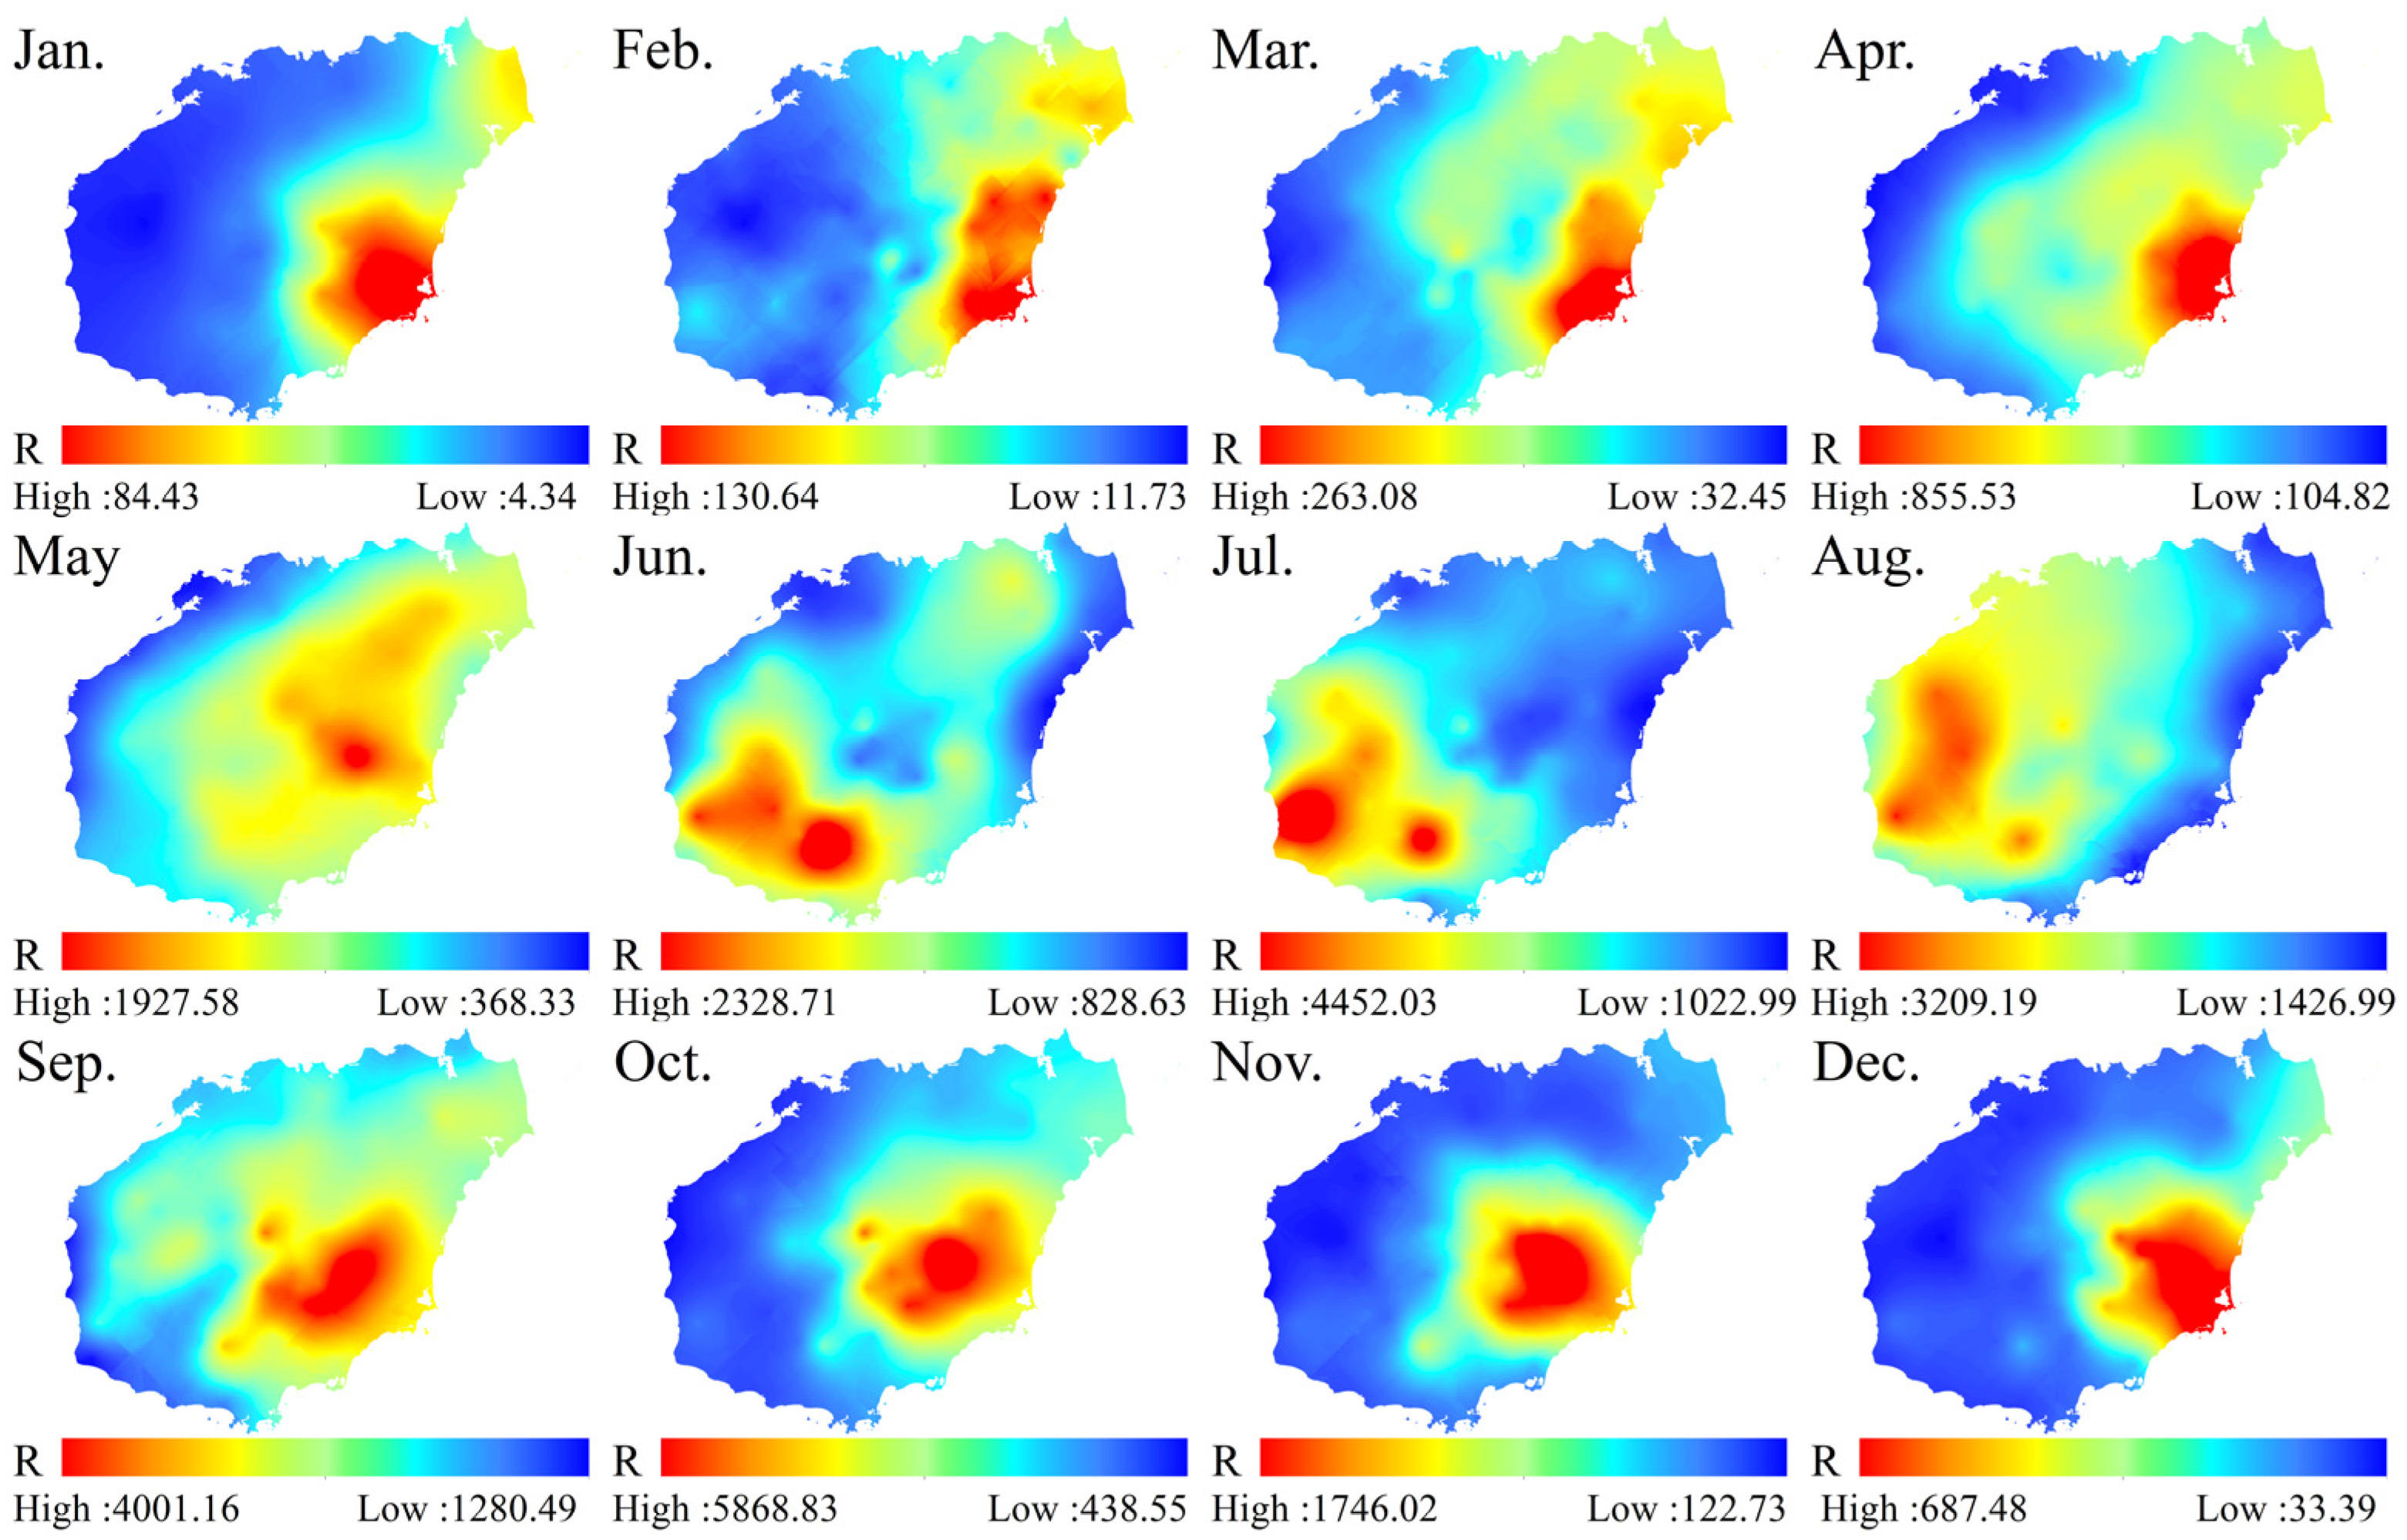
3.2.1. Rainfall Erosivity Factor (R)

From 2003 to 2021, the monthly mean rainfall erosivity factor of Hainan Island shows an increasing spatial distribution from west to east (Figure 3), ranging from 4.34 to 5868.83 MJ·mm·hm−2·h−1·month−1. Rainfall erosivity in the study area is predominantly concentrated from July to October. The minimum value is observed in January, and the maximum value is observed in October. Both the monthly maximum and minimum values of the multi-year slope trend in the study area were observed in October (Figure 4), ranging from −479.12 to 620.97. The areas with negative trends were primarily located in the southwest of Hainan Island, mainly involving Baisha County, Changjiang County, Ledong County, Wuzhishan City, and Qiongzhong County. The R-factor slope trend further indicates that climatic conditions are driving the spatio-temporal changes in soil erosion, with pronounced spatial heterogeneity. The average R factor for each month in the study area, covering the period from 2003 to 2021, is presented in Table 4, with the lowest R value (22.97 MJ·mm·hm−2·h−1·month−1) in January 2006 and the highest R value (2606.35 MJ·mm·hm−2·h−1·month−1) in September 2006. Rainfall erosivity is primarily concentrated in summer and autumn, with the highest values in autumn (11,203.53 MJ·mm·hm−2·h−1·month−1) making up 40% of the annual total. Rainfall erosivity during winter is the lowest (898.23 MJ·mm·hm−2·h−1·month−1), making up 2% of the annual total.

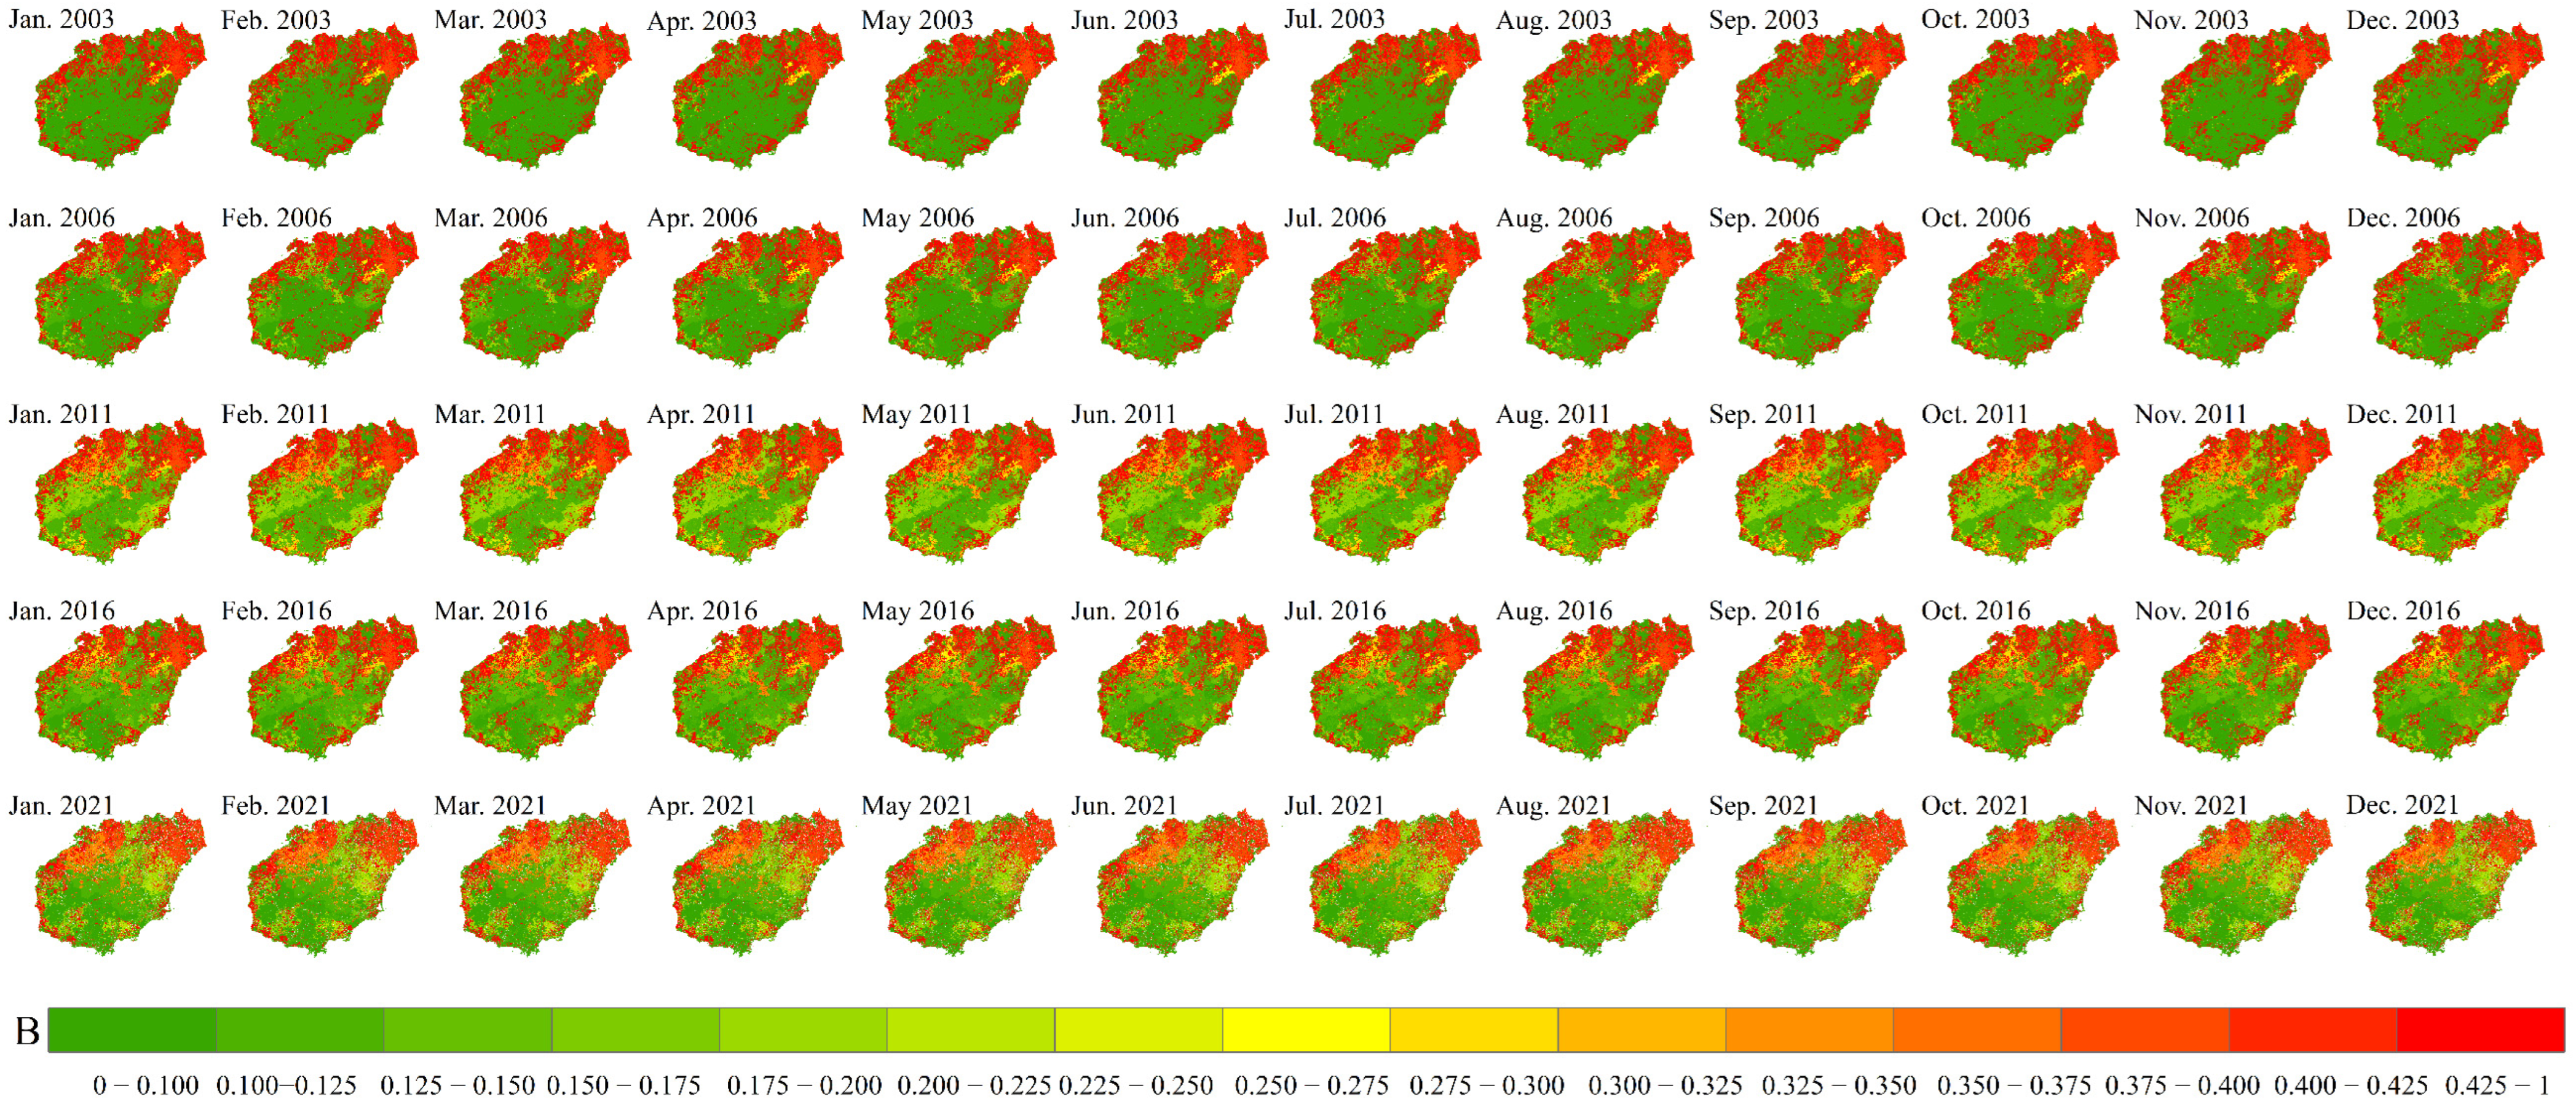
3.2.2. Vegetation Cover and Biological Practice Factor (B)

The dynamic evaluation of the B factor provides critical information for identifying hotspots of soil erosion, as this process is exacerbated in areas with bare or poorly covered soils. A lower value of factor B corresponds to a greater vegetation cover area and a decreased likelihood of soil erosion. Conversely, a higher B-factor value indicates increased sensitivity of bare or uncovered areas to soil erosion. In general, the B-factor exhibited a higher distribution trend in the northeast and a lower distribution trend in the southwest (Figure 5). The monthly mean values of B factor from 2003 to 2021 in the study area were 0.3139, 0.3158, 0.3252, 0.3255 and 0.2812, respectively.

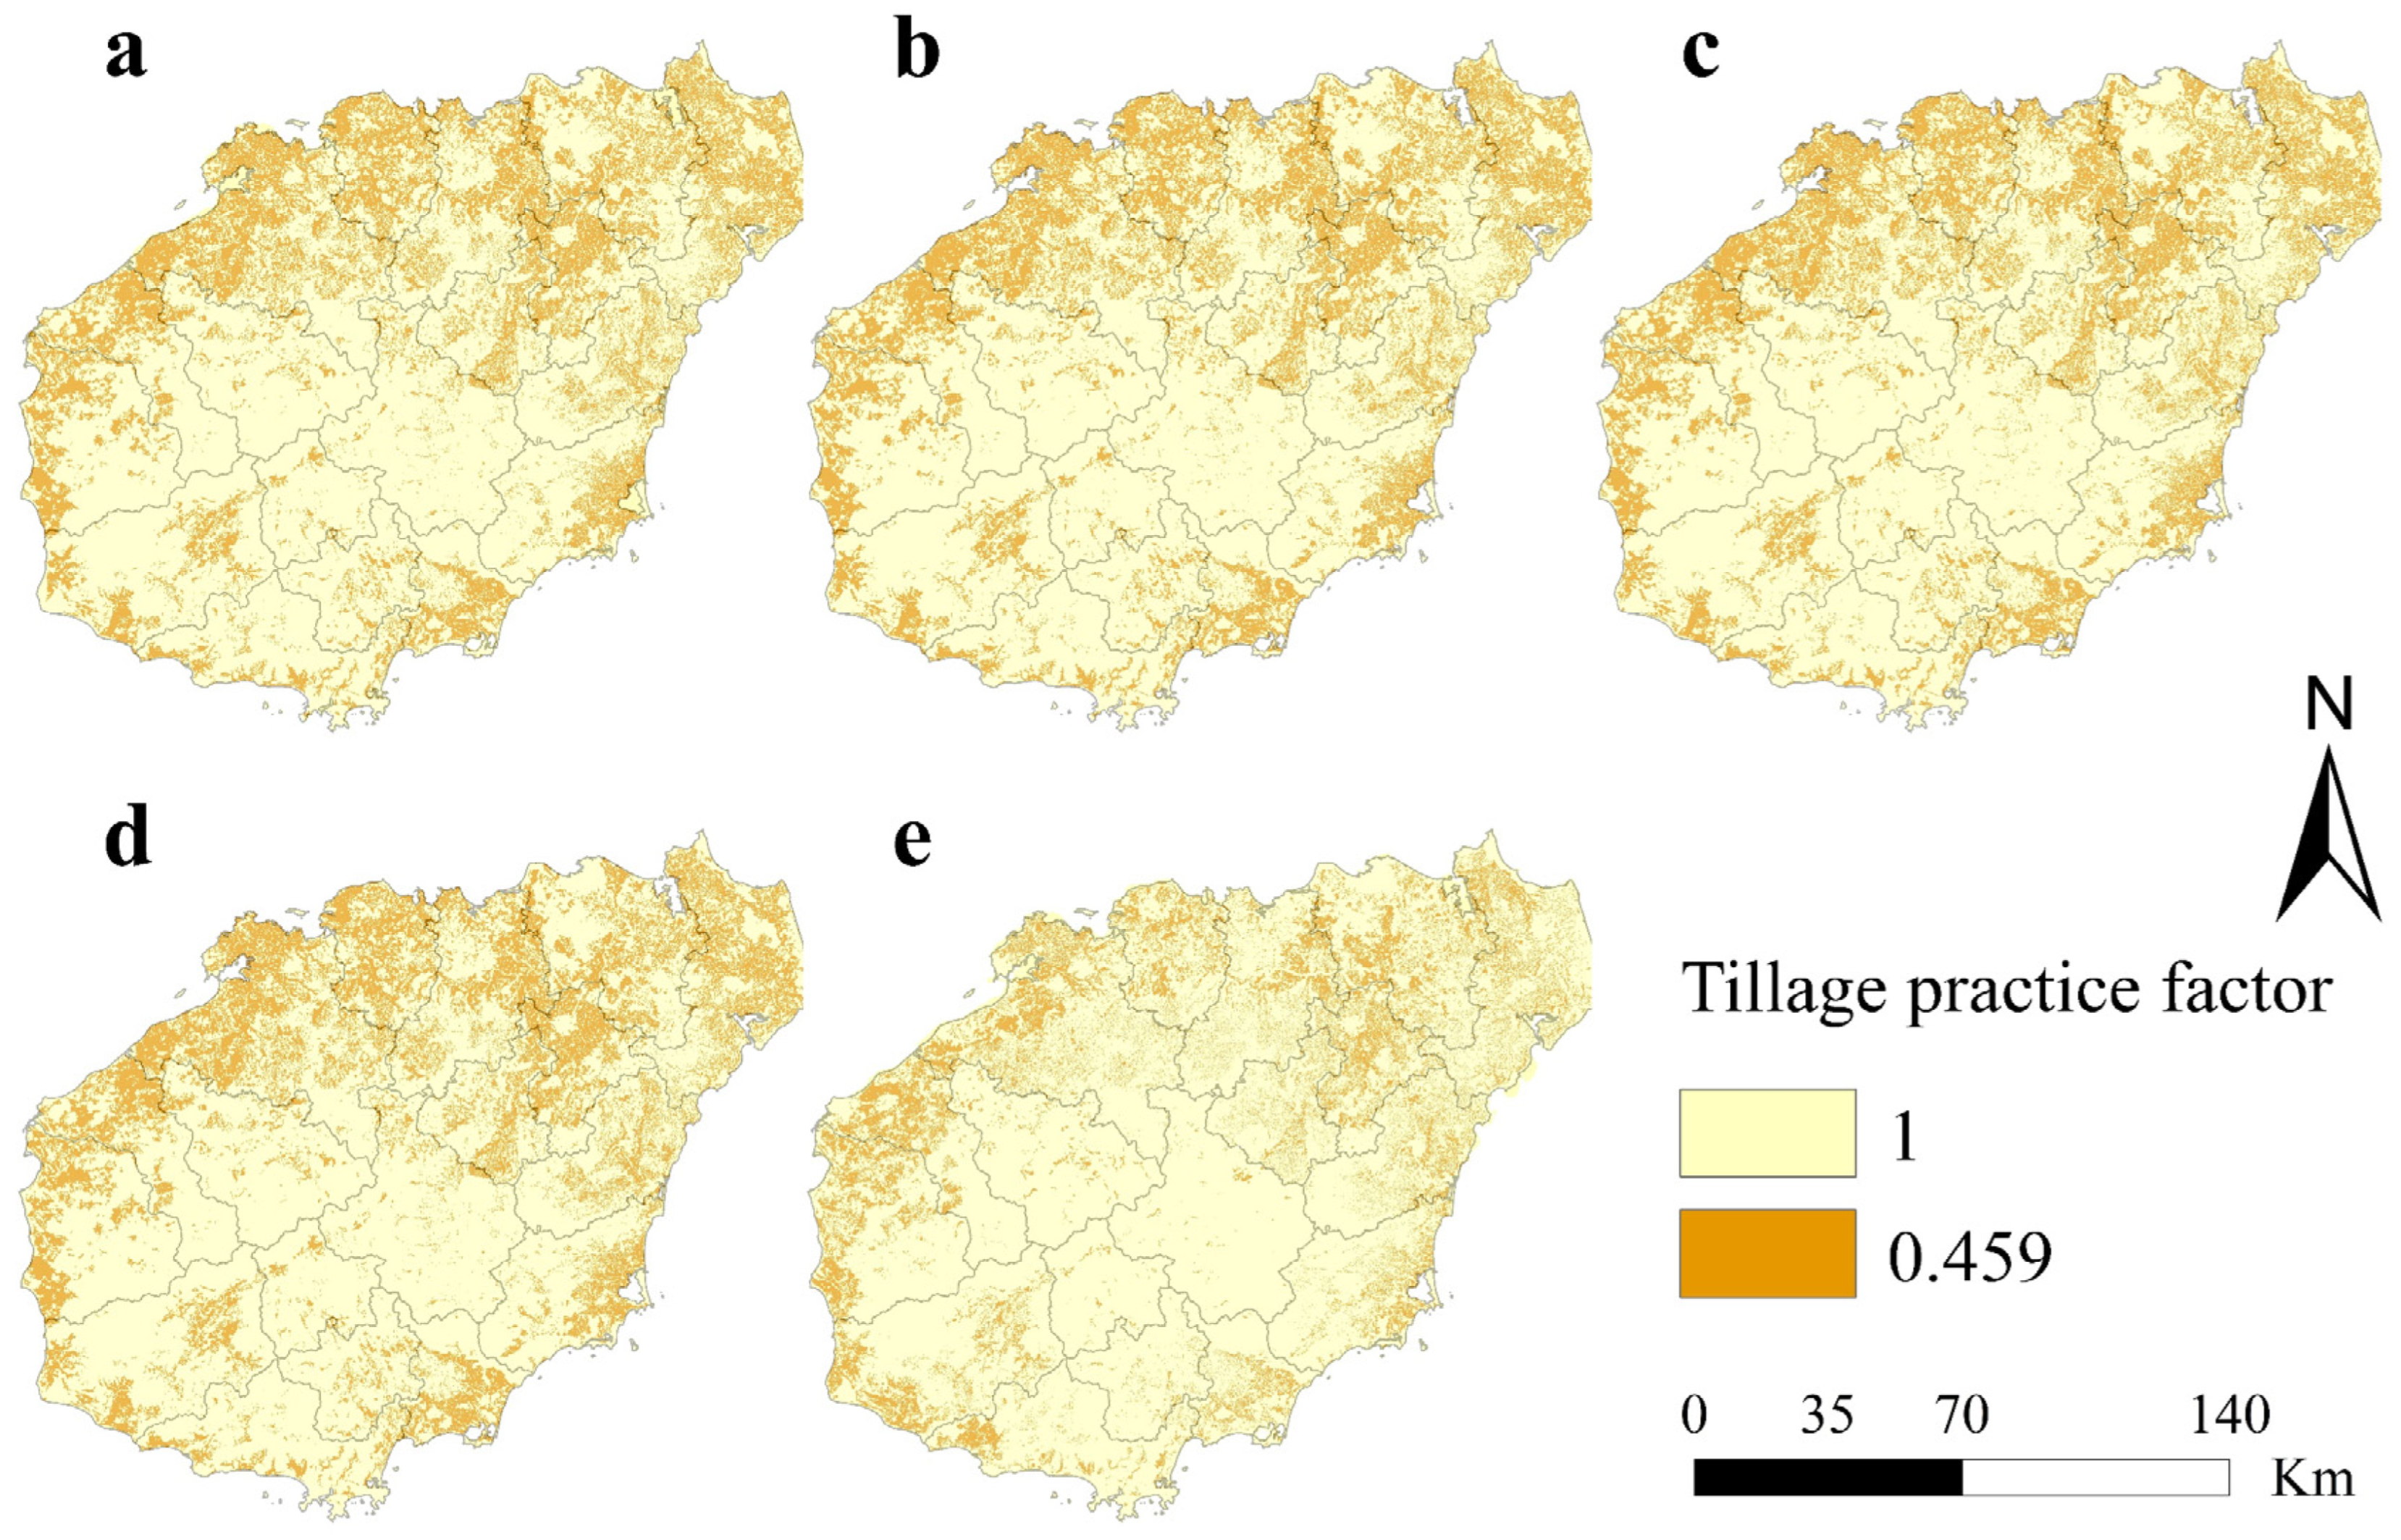
3.2.3. Tillage Practice Factor (T)

The spatial distribution of the T factor varies according to agricultural production modes and is represented by land use types/cover each year, decreasing from northeast to southwest (Figure 6). The study area is a hot cropping area, and the T-factor value is 0.459 (refer to the Technical Guide for Dynamic Monitoring of Soil and Water Loss in 2020). The land use types assigned were wet rice field, irrigated land, and dry land.

3.3. Average Monthly Soil Erosion in Hainan Island and Its Variation Trend

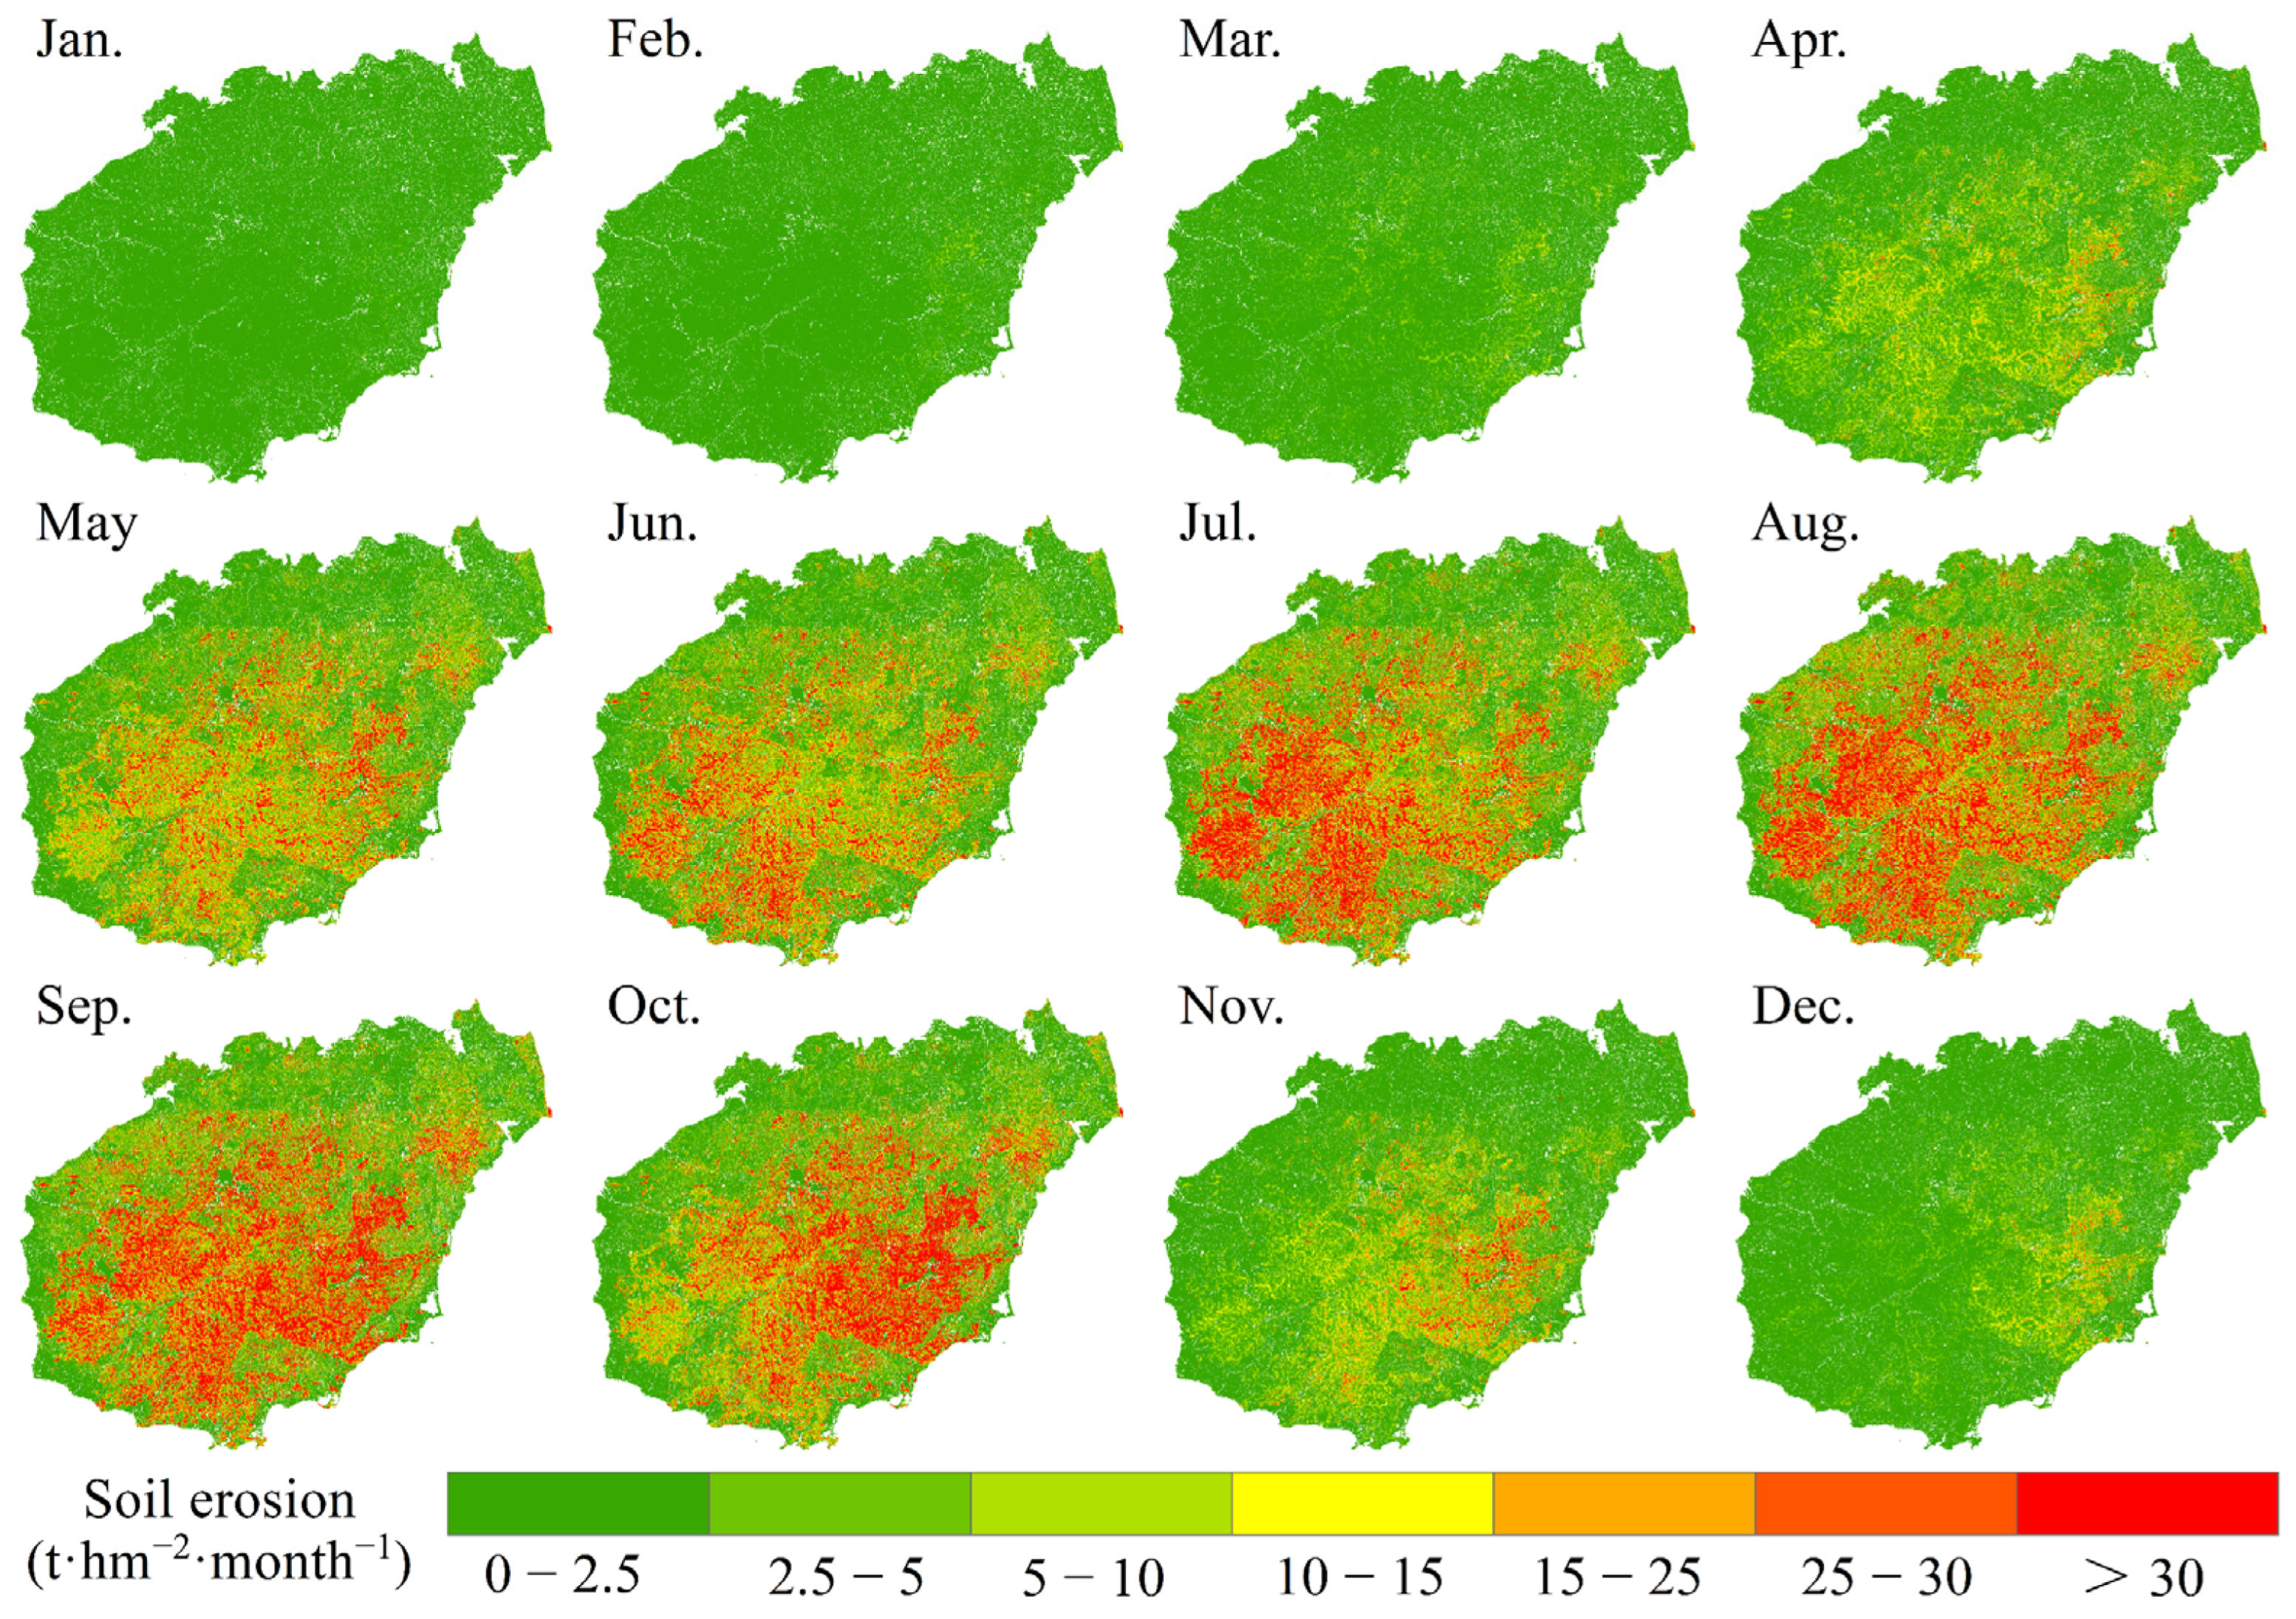
3.3.1. Average Monthly Soil Erosion in Hainan Island

The soil erosion modulus is a comprehensive measure guided by various factors that contribute to erosion, including rainfall, terrain, and soil quality. Monthly soil erosion modulus values at a 10 m resolution for Hainan Island were calculated for the years 2003, 2006, 2011, 2016, and 2021 (Figure 7). The year 2011 is considered the most severe for soil erosion, with an annual average soil erosion modulus of 121.72 t·hm−2·a−1 and a soil erosion area of 2190.69 km2. The findings of this study align closely with the results of the first water conservancy survey conducted in China in 2011, which reported an area of 2116.04 km2 in Hainan Island. Additionally, a comparative analysis of the monthly sediment transport modulus measured at hydrological monitoring stations in three watersheds on Hainan Island over nearly 20 years (Figure 8) reveals the following results: The R2 value between the monthly soil erosion modulus in the Nandu River basin and the Nandu River Longtang station is 0.77 (Figure 8a). In the Changhua River basin, the R2 between the monthly soil erosion modulus and the Changhua River Baoqiao station is 0.64 (Figure 8b). In the Wanquan River basin, the R2 between the monthly soil erosion modulus and the Wanquan River Jiaji station is 0.78 (Figure 8c). Therefore, the calculated results demonstrate good reliability.
The monthly average value of soil erosion modulus within the research area was 7.73 t·ha−1·month−1, with the maximum value of 18.33 t·ha−1·month−1 in September and the minimum value of 0.18 t·ha−1·month−1 in January. Spatial distribution results indicated that the central region (including part of the eastern area) and the southwest of the study area were characterized by a high degree of erosion and were particularly susceptible to soil erosion. The topographic features and rainfall intensity contributed to exacerbating the high erosion risk in these regions (Figure 9). The steep slopes of the mountains accelerate water flow, intensifying the impact of rainwater on the soil and consequently promoting soil and water erosion. From a time frame perspective, the average soil erosion modulus from 2003 to 2021 was 0.0788, 0.1146, 0.2353, 0.23541, and 0.25537 t·hm−2·month−1 due to fewer days of erosive rainfall (10 mm) in January. Between February and August, erosion exhibited a radial distributed pattern from east to west. Beginning in August, erosion intensity declined in the southwest, whereas the main erosion processes occurred in the east. The period from May to October marks the heavy rainfall season in Hainan Island. Extreme weather conditions lead to soil saturation, reducing the erosion resistance of vegetation. The intense rainfall overwhelms the protective abilities of vegetation, thereby augmenting the likelihood of soil and water erosion. September experiences the greatest magnitude of soil erosion, and the soil erosion modulus mean value from 2003 to 2021 is 8.4, 14.04, 23.3, 20.2, and 23.6 t·hm−2·month−1, respectively. Following this, with the reduction in erosive rainfall and the growth of vegetation, soil erosion has been effectively curbed. Our results indicate that the commencement of the rainy season is the most susceptible time for erosion, as the fixation strength of vegetation roots weakens during this time, increasing the risk of soil exposure.
As depicted in Figure 10, the modulus of soil erosion exceeding the monthly average served as the benchmark for determining the high-risk erosion periods each year. In 2021, relatively high soil erosion was recorded from June to October. From 2003 to 2016, the months from May to October exhibited relatively high soil erosion modulus values. Consequently, this six-month period is when the risk of erosion is at its highest. To mitigate the risk of erosion, control should be strengthened in erosion-prone areas during these six months. Across the five comparison years, the monthly soil erosion modulus mean value was the highest in 2011 (10.13 t·hm−2·month−1) and the lowest in 2003 (3.56 t·hm−2·month−1), with September showing the highest erosion and January showing the lowest. In terms of seasons, soil water erosion exhibited greater severity during summer and autumn compared to spring and winter. In light of the outcomes of the monistic linear regression appraisal of the monthly mean soil erosion amount according to the time series, the slope increase trend area in the high-risk period of soil erosion (May–October) was greater than 50%, with the maximum value of 80.51% in October and the minimum value of 58.69% in June.
Figure 10 depicts the monthly fluctuations in dynamic factors and soil erosion. The A factor exhibits a trend similar to the R factor, in line with previous research outcomes [35,37]. The intra-annual variations in the B factor and soil erosion modulus exhibited different trends. Vegetation cover is relatively high in the summer and autumn; however, due to heavy rainfall, the increased vegetation cover is insufficient to offset the impact of rainfall erosivity. This conclusion is consistent with Cao et al.’s [33] study in Northeast China and Polykretis et al.’s [35] study in Greece. Therefore, under the assumption that the static factors remain unchanged within the year, precipitation is the principal determinant affecting soil and water loss within the year in Hainan. During summer and autumn, when soil erosion was severe, the B factor exhibited opposite trends to the R factor, reaching its minimum in September and its maximum in October. The R factor exhibited a single peak, while the B factor demonstrated a multi-peak trend.

3.3.2. Regularity of Terrain, Slope, and Land Use/Cover on Monthly Erosion

Regarding topographic factors, slope length is an indispensable distance scale that determines the development of soil erosion. Additionally, slope and soil properties are the major determinants of soil erosion rates [48,49]. Therefore, to better clarify soil erosion conditions under different landforms and human activities, topographic types and land use/cover types were employed as spatial dimensions to facilitate further investigation into soil erosion patterns. Elevation and slope information is withdrawn from DEM image data using the hydrological analysis module in ArcGIS software. The highest elevation on Hainan Island is 1865 m, and the elevation of Hainan Island is categorized into six levels, namely <100 m, 100–300 m, 300–500 m, 500–800 m, 800–1000 m, and >1000 m. In reference to the General Principles of Comprehensive Soil and Water Conservation Management Planning and soil and water loss investigation work, 8° is commonly used as the classification standard between gentle and steep slopes. The slopes of Hainan Island are categorized as follows: flat land (0–5°), gentle slope land (5–8°), ground of slope (8–15°), steep land (15–25°), sharp steep land (25–35°), and dangerous land (>35°). The specific classification of terrain factors on Hainan Island is detailed in Table 5.
The variation in topography leads to differences in erosion severity. Erosion tends to be less intense on plains and plateaus compared to mountains, with low-relief mountains experiencing less erosion than high-relief mountains. Notably, during the summer months, the average erosion modulus for high-altitude mountains is approximately 1.7 times greater than that of low-altitude mountains. Furthermore, the erosion modulus for high-altitude mountains exceeds that of plains by more than eight times. Specifically, in June, July, and August, the ratios are 8.87, 11, and 9.4 times, respectively (Figure 11). The average erosion modulus increases with the slope’s steepness, following this order: dangerous slope erosion modulus > sharp slope erosion modulus > steep slope erosion modulus > ground slope erosion modulus > gentle of slope erosion modulus > flat slope erosion modulus.
As shown in Figure 12, the land use pattern of Hainan Island over the past 20 years demonstrates that forest land, the dominant land use type, has accounted for more than 60% during all time periods, primarily concentrated in the central region. The plowland is second, accounting for more than 15%, and is primarily distributed in the coastal plains and the low-altitude mountain area in the southwest. Over nearly 20 years of development, cultivated land and grassland on Hainan Island have progressively decreased, whereas forest land and construction land have consistently increased. Among distinct land use patterns, variations in vegetation coverage and the degree of human disturbance result in diverse responses, which will affect the soil erosion behavior, patterns, and the anti-erosion resistance system. Woodland has the highest average erosion modulus among many land use types. The erosion peaks for forest land, cash crops, and food production areas (including paddy fields, other garden lands, and other forest lands) occur in September, whereas grassland experiences erosion peaks in July and August. Additionally, the expansion of rubber plantations on Hainan Island presents a significant challenge to ecological security [50]. Due to the structure and farming practices of rubber plantations, their ability to resist rainfall and protect the soil is lower than that of natural tropical rainforests [51].

3.4. Identification of Main Controlling Factors of Monthly Soil Erosion

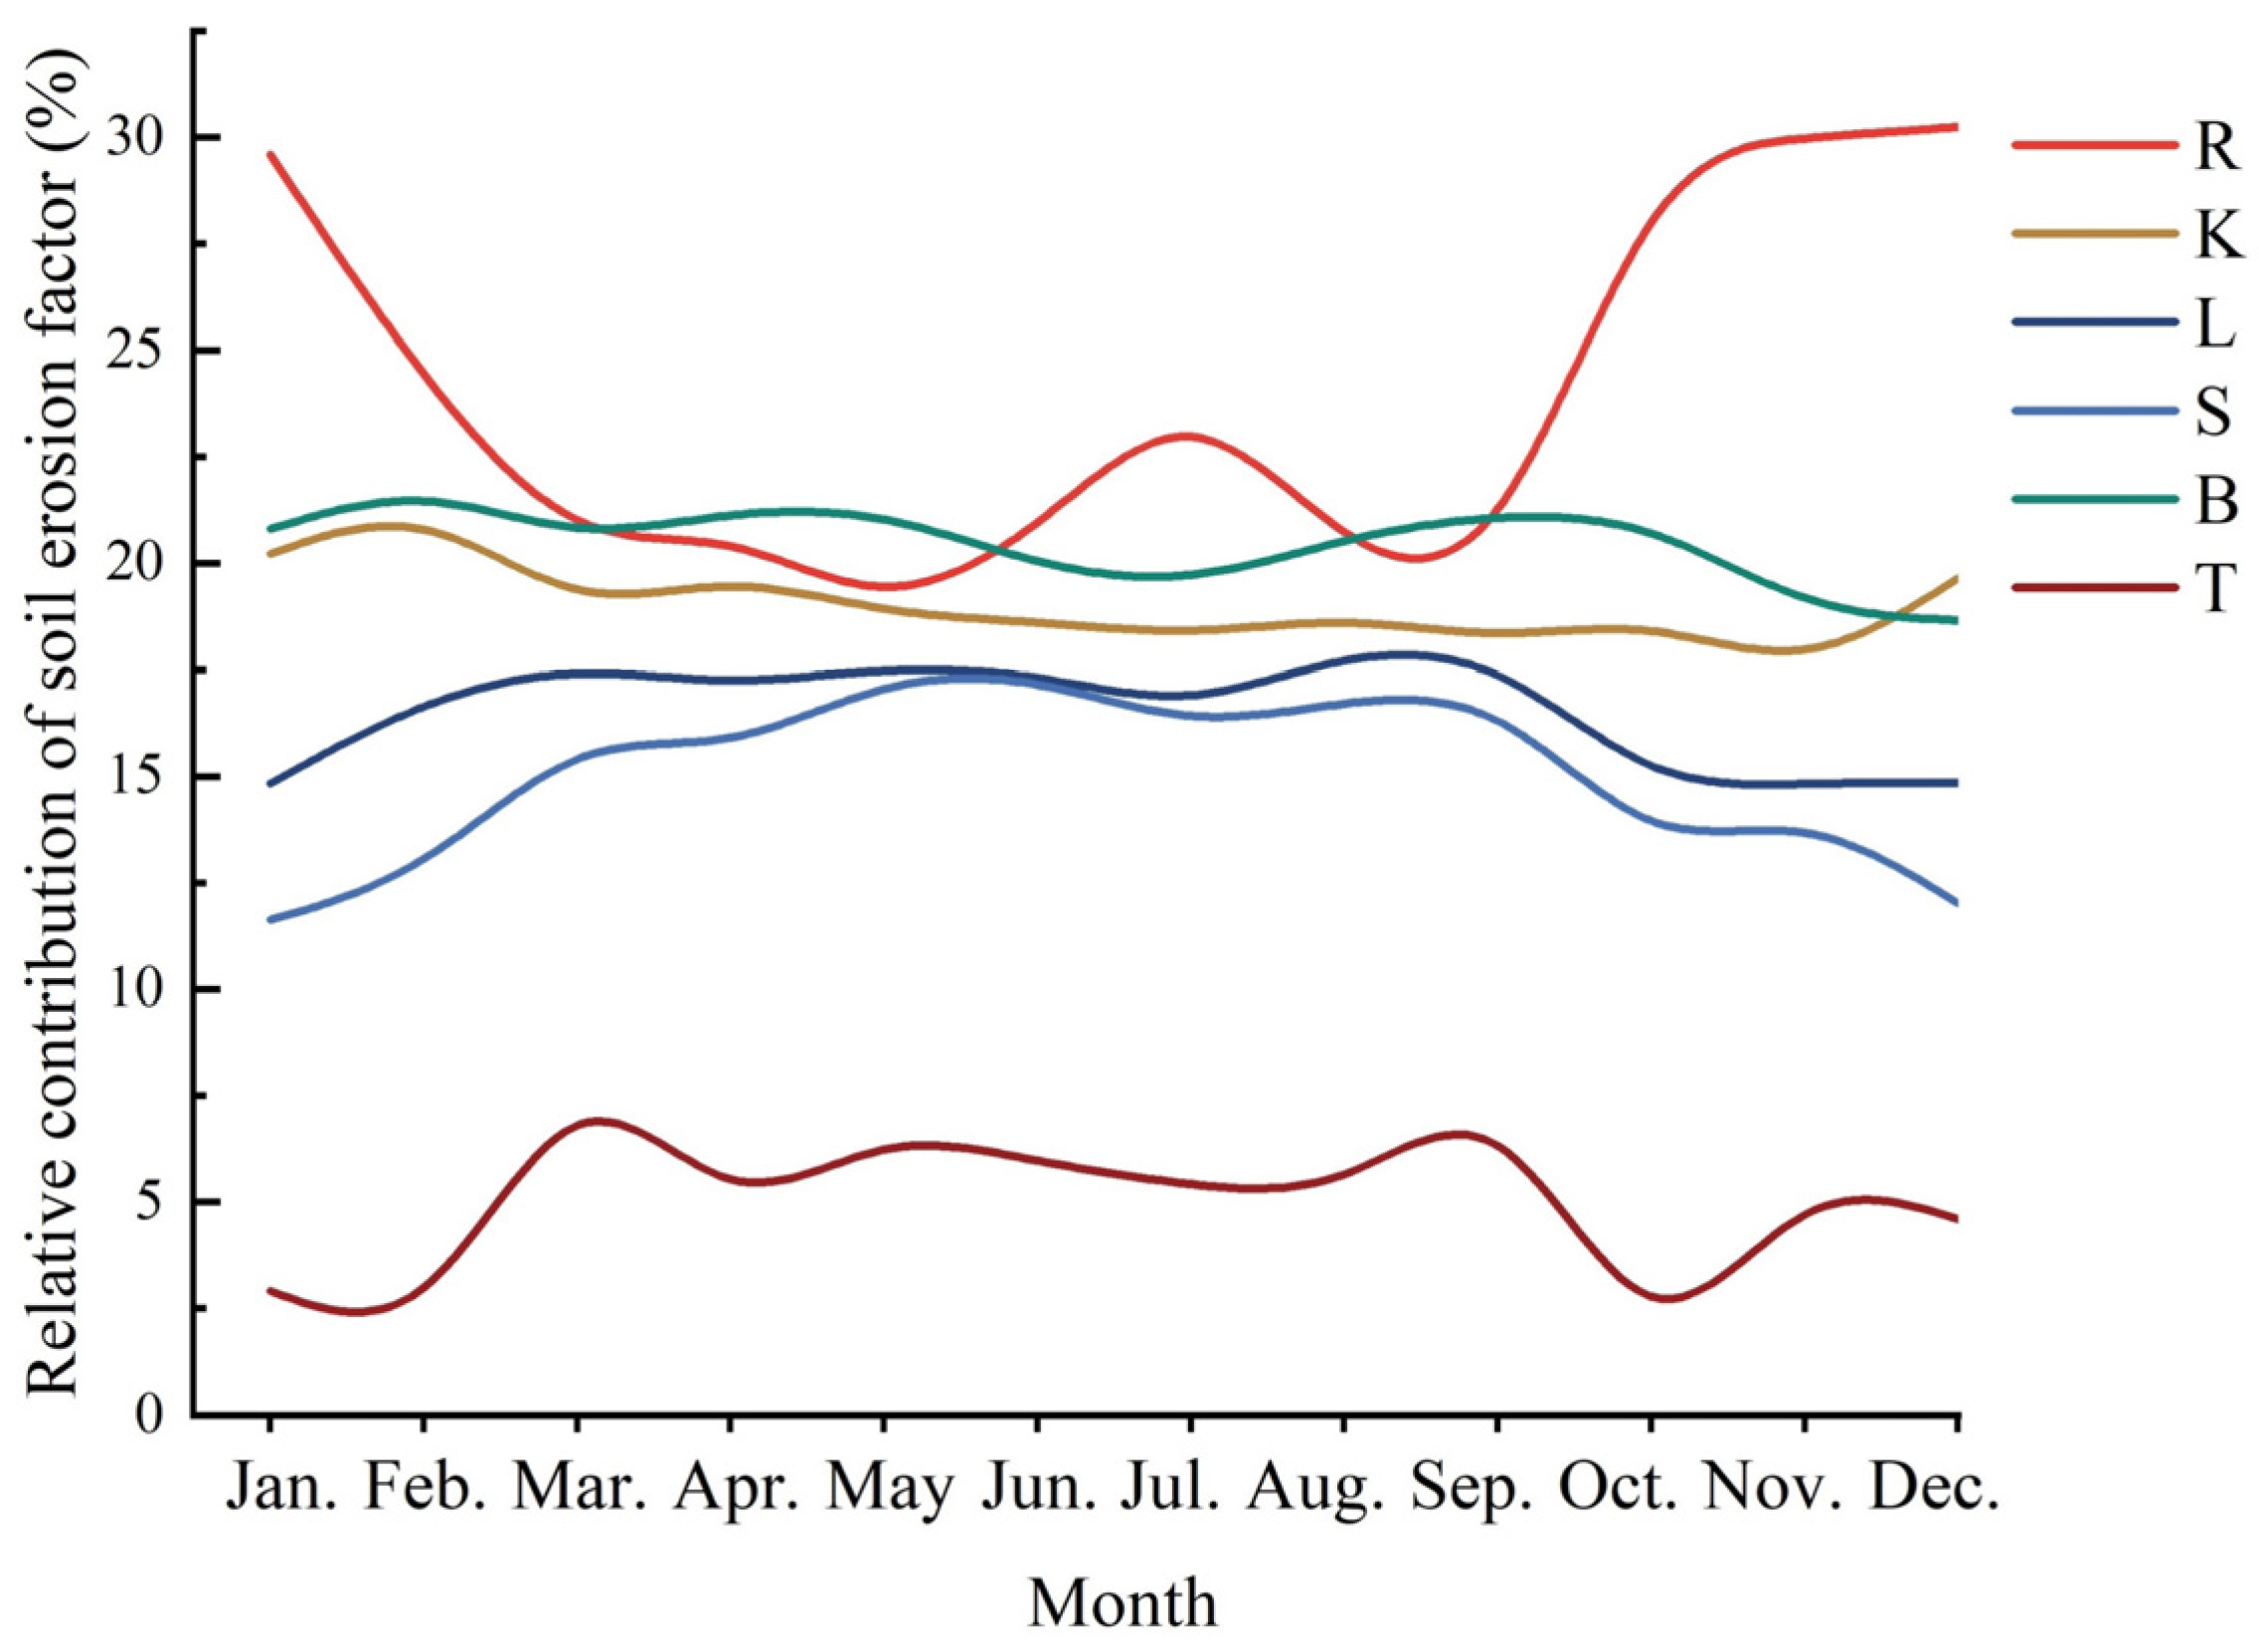
3.4.1. Relative Importance of Soil Erosion Factors

The RF model was utilized to calculate the importance assessment of soil erosion factors, and then it was converted into the relative contribution degree (Figure 13). The erosion factors were ranked by their average importance in the following order: R > B > K > L > S > T. The relative contribution of the R factor on a monthly basis exceeded 18%, with its peak reaching over 30%. The T factor had the smallest contribution, with a maximum of only 6.8% over the 12-month period.

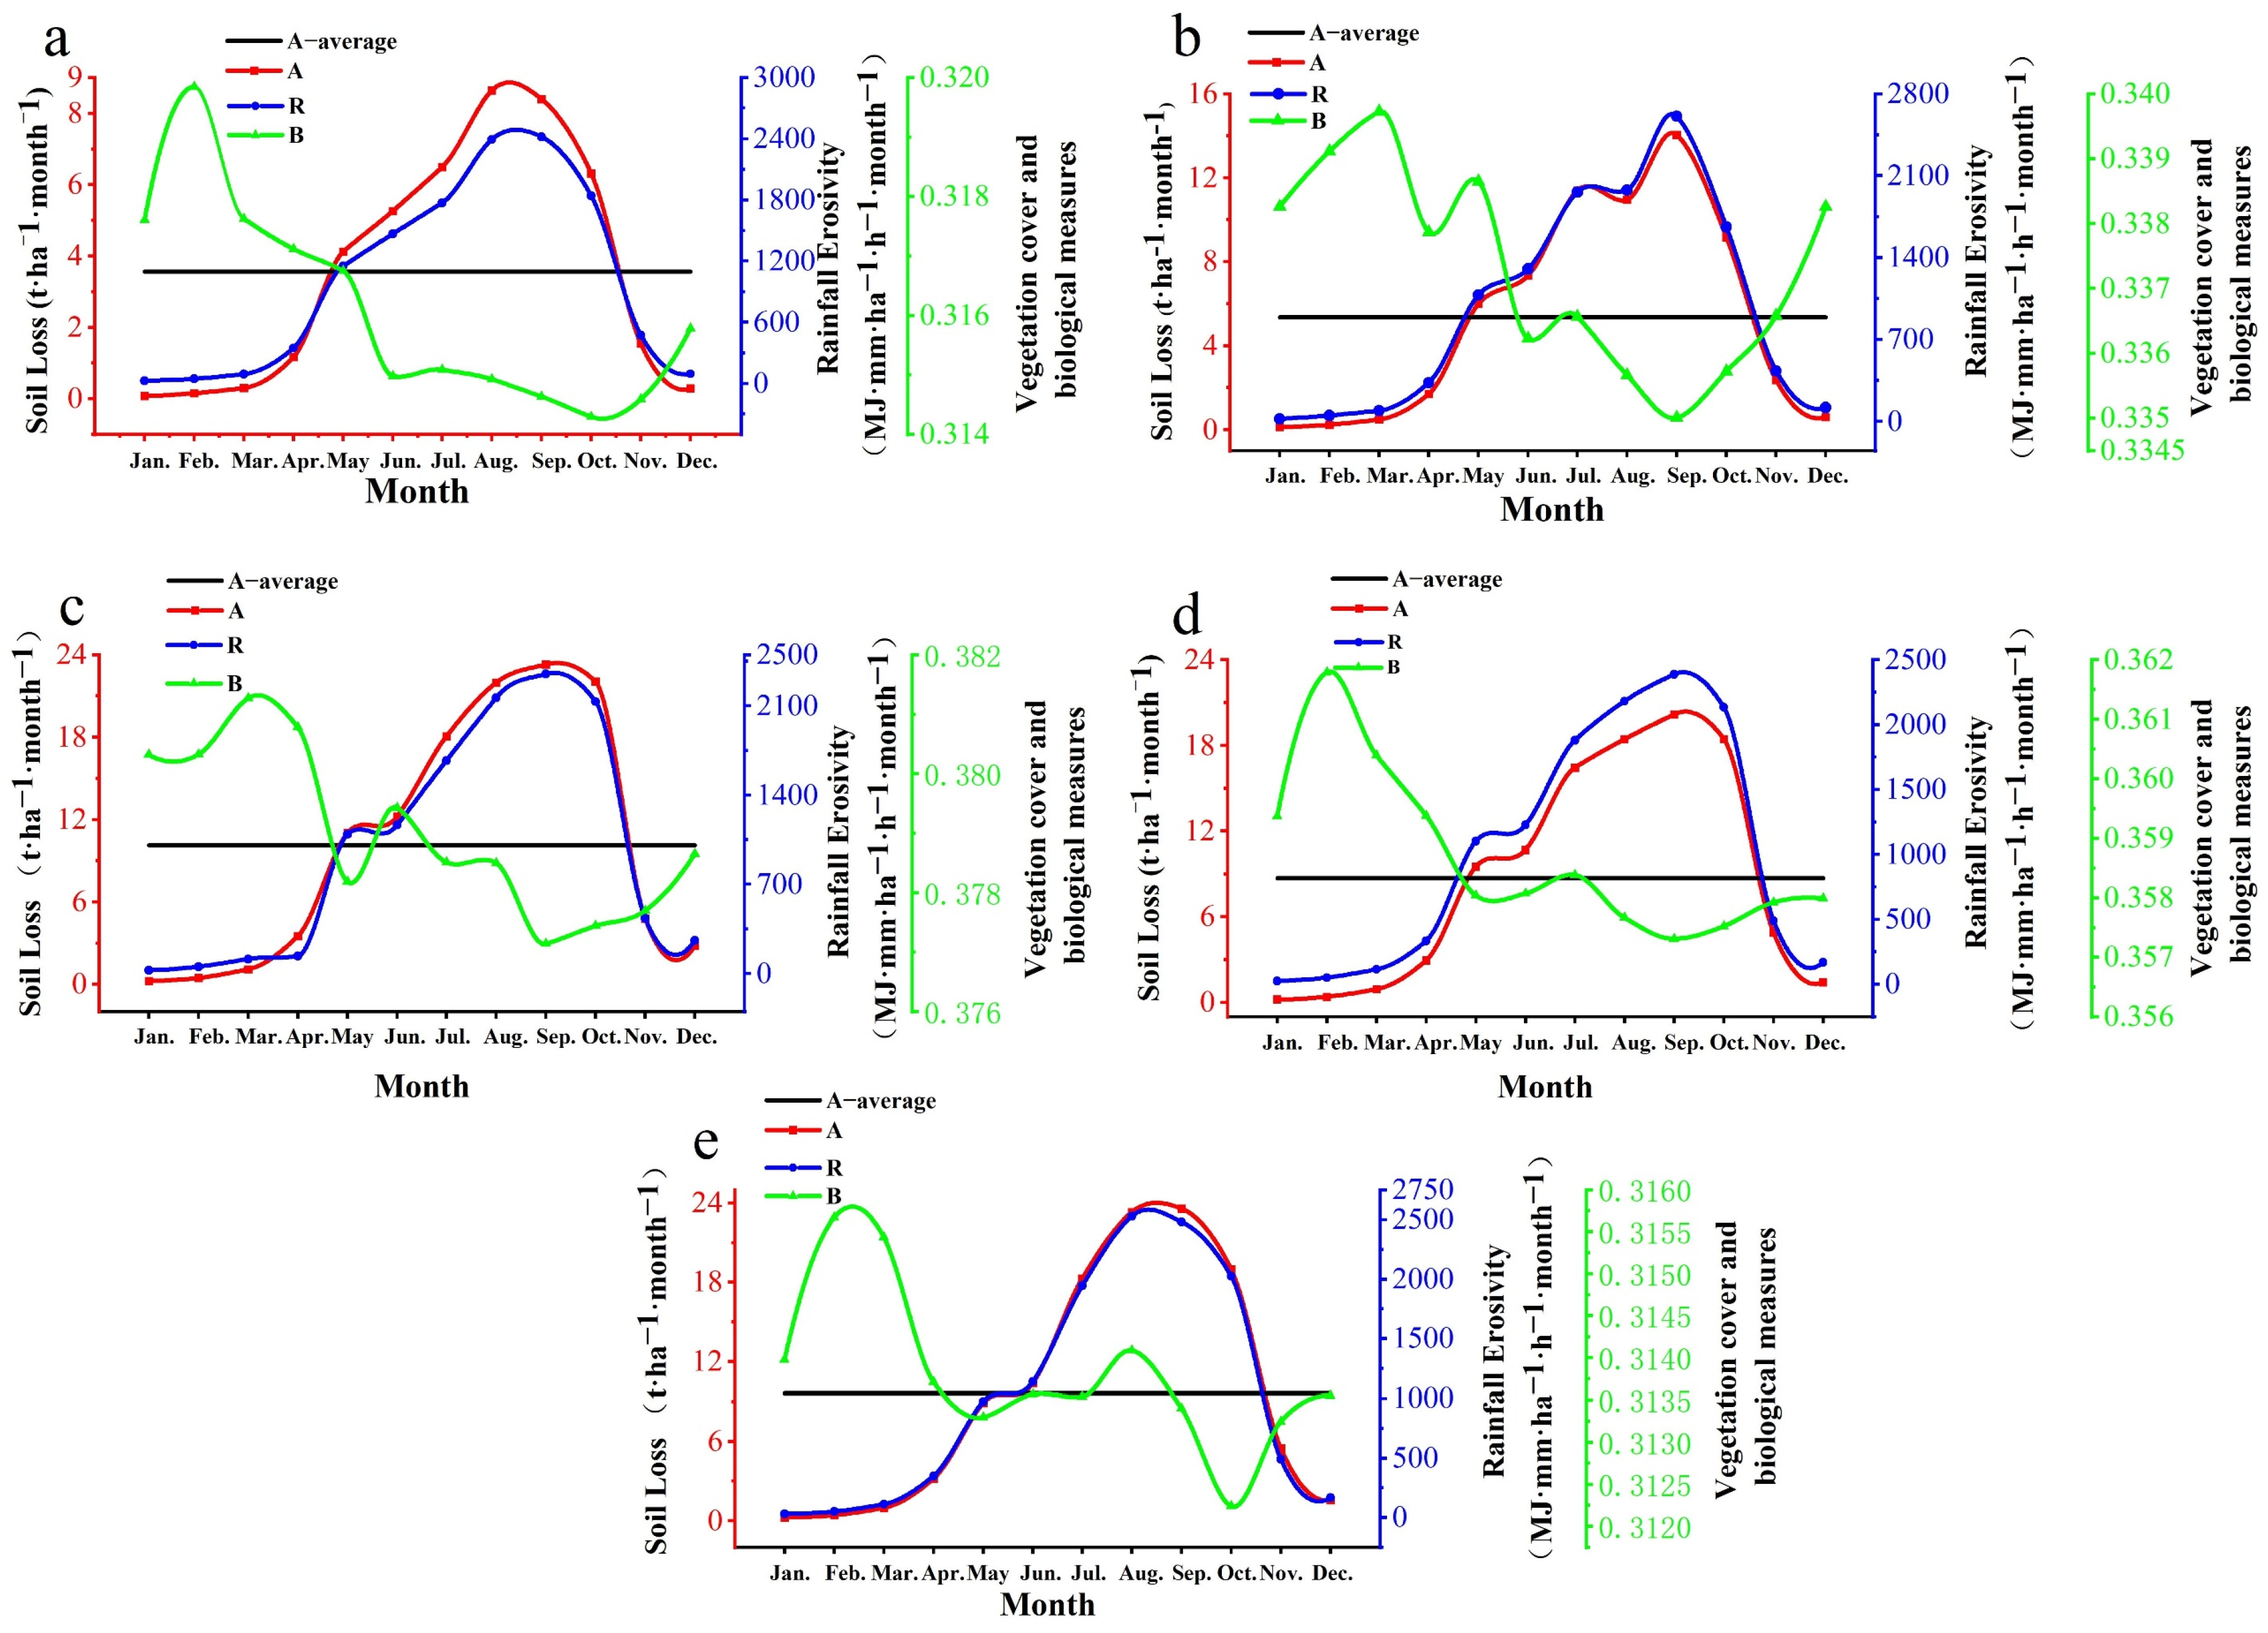
3.4.2. Relationship Between Key Drivers, Including Precipitation and Vegetation Changes, and Soil Erosion

Soil water erosion is impacted by many factors. From the perspective of time change, dynamic factors lead to the change in soil erosion amount. Consequently, it is vital to elucidate how the dynamic factors of soil erosion change and how they contribute to soil variability. Using the additive breakdown of the LMDI model, an analysis was conducted on the spatial variation in erosion patterns within the research area based on the R factor and B factor (Figure 14 and Figure 15). Between January and May of 2003–2021, the red areas gradually increased over time, indicating that heightened rainfall intensified erosion. The impact of the R factor to soil erosion modulus from May to June varied, with the negative contribution observed within the northeastern section of the research area. Rainfall from June to July positively contributed to erosion across the research area, with the southwest experiencing the most significant impact. These findings suggested that effective control measures should be implemented in these areas. From July to December, the green area increased continuously as the rainfall decreased, leading to a gradual weakening of erosion during the period in the southwest from July to August, in the west from August to September, and across all regions except the east from September to October, eventually resulting in a negative contribution of rainfall to the changes in soil erosion intensity throughout the research area from October to December. The phenomenon that the negative contribution decreases from the southwest also corresponds to the strong east and weak west rainfall regularity of Hainan Island.
Vegetation serves as the “link” between soil, atmosphere, and water. It intercepts precipitation, reduces raindrop splashing, arrests runoff, increases soil infiltration, and maintains soil consolidation, which helps significantly in lowering soil erosion. In the CSLE model, the vegetation index was utilized to assess the B factor, which is directly associated with vegetation growth and rainfall intensity. From January to April, the positive contribution of vegetation to soil erosion was primarily within the range of 0–0.1 t·hm−1·month−1, while the detrimental effect was predominantly situated along the coastline of Hainan Island. From April to December, vegetation’s contribution to the soil erosion modulus varied with both positive and negative effects observed in the transition zone from high-altitude mountains to plains. This variation may result from differing vegetation responses to increased rainfall intensity [36].

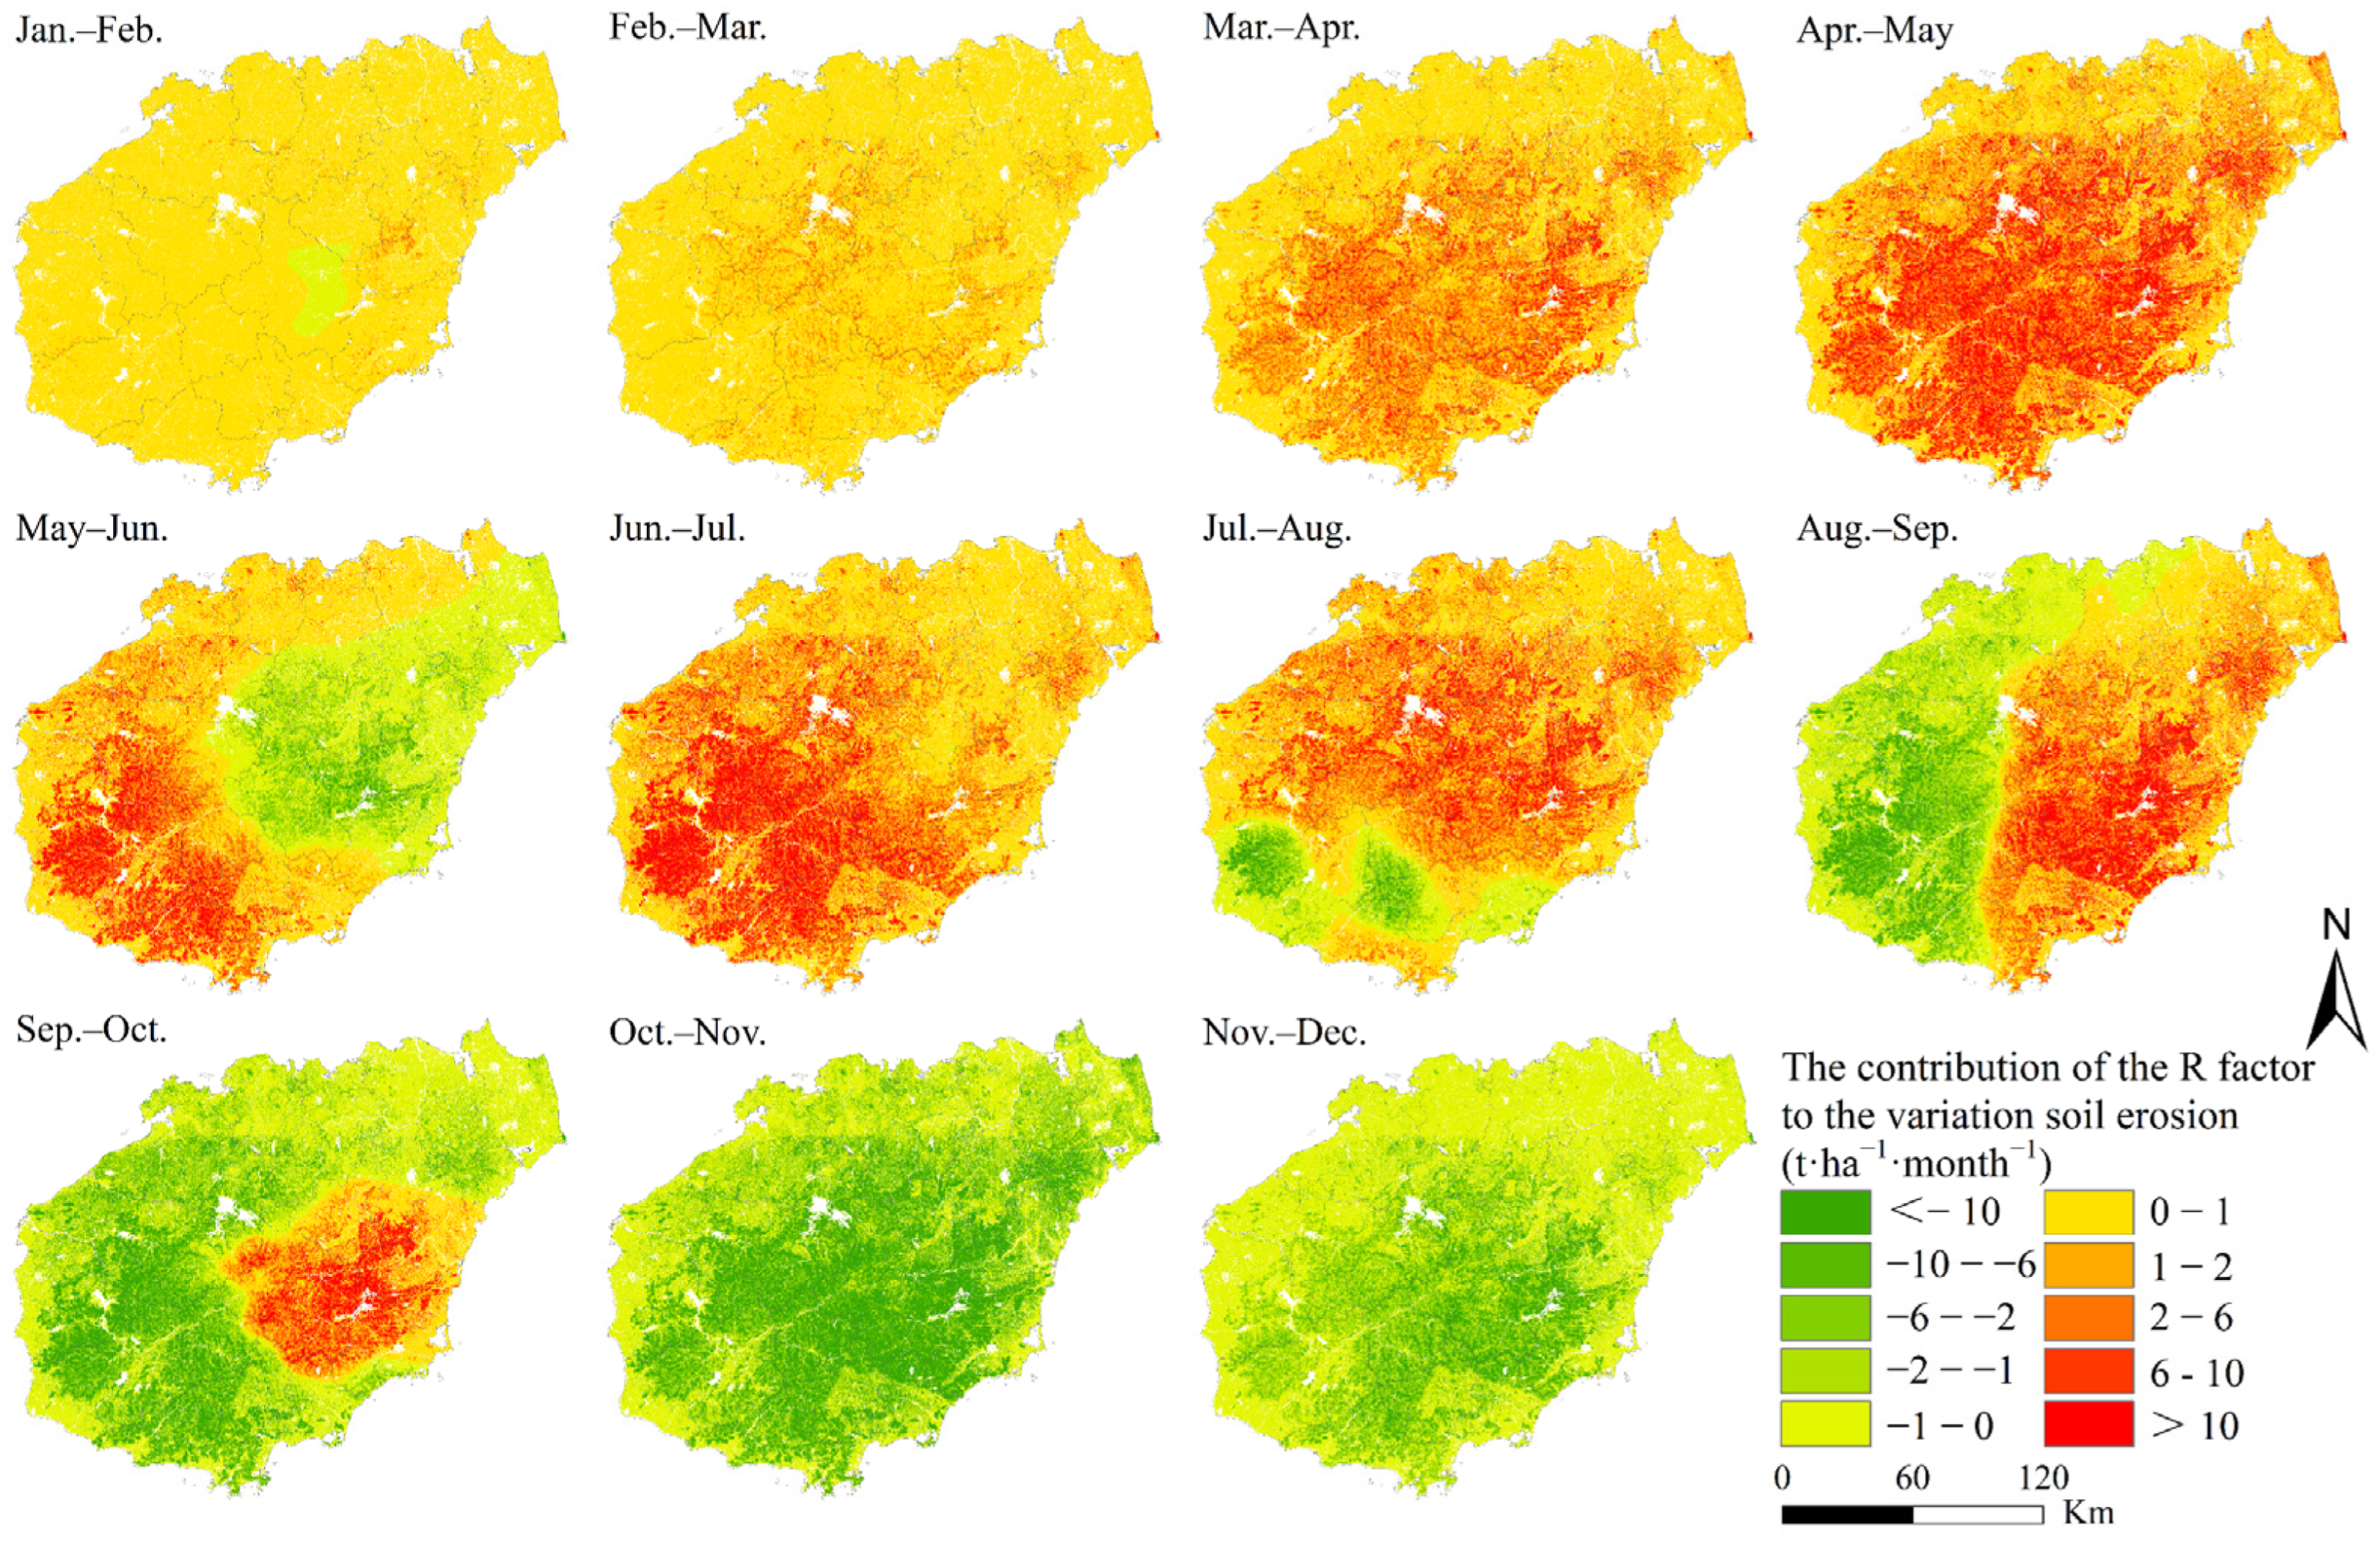
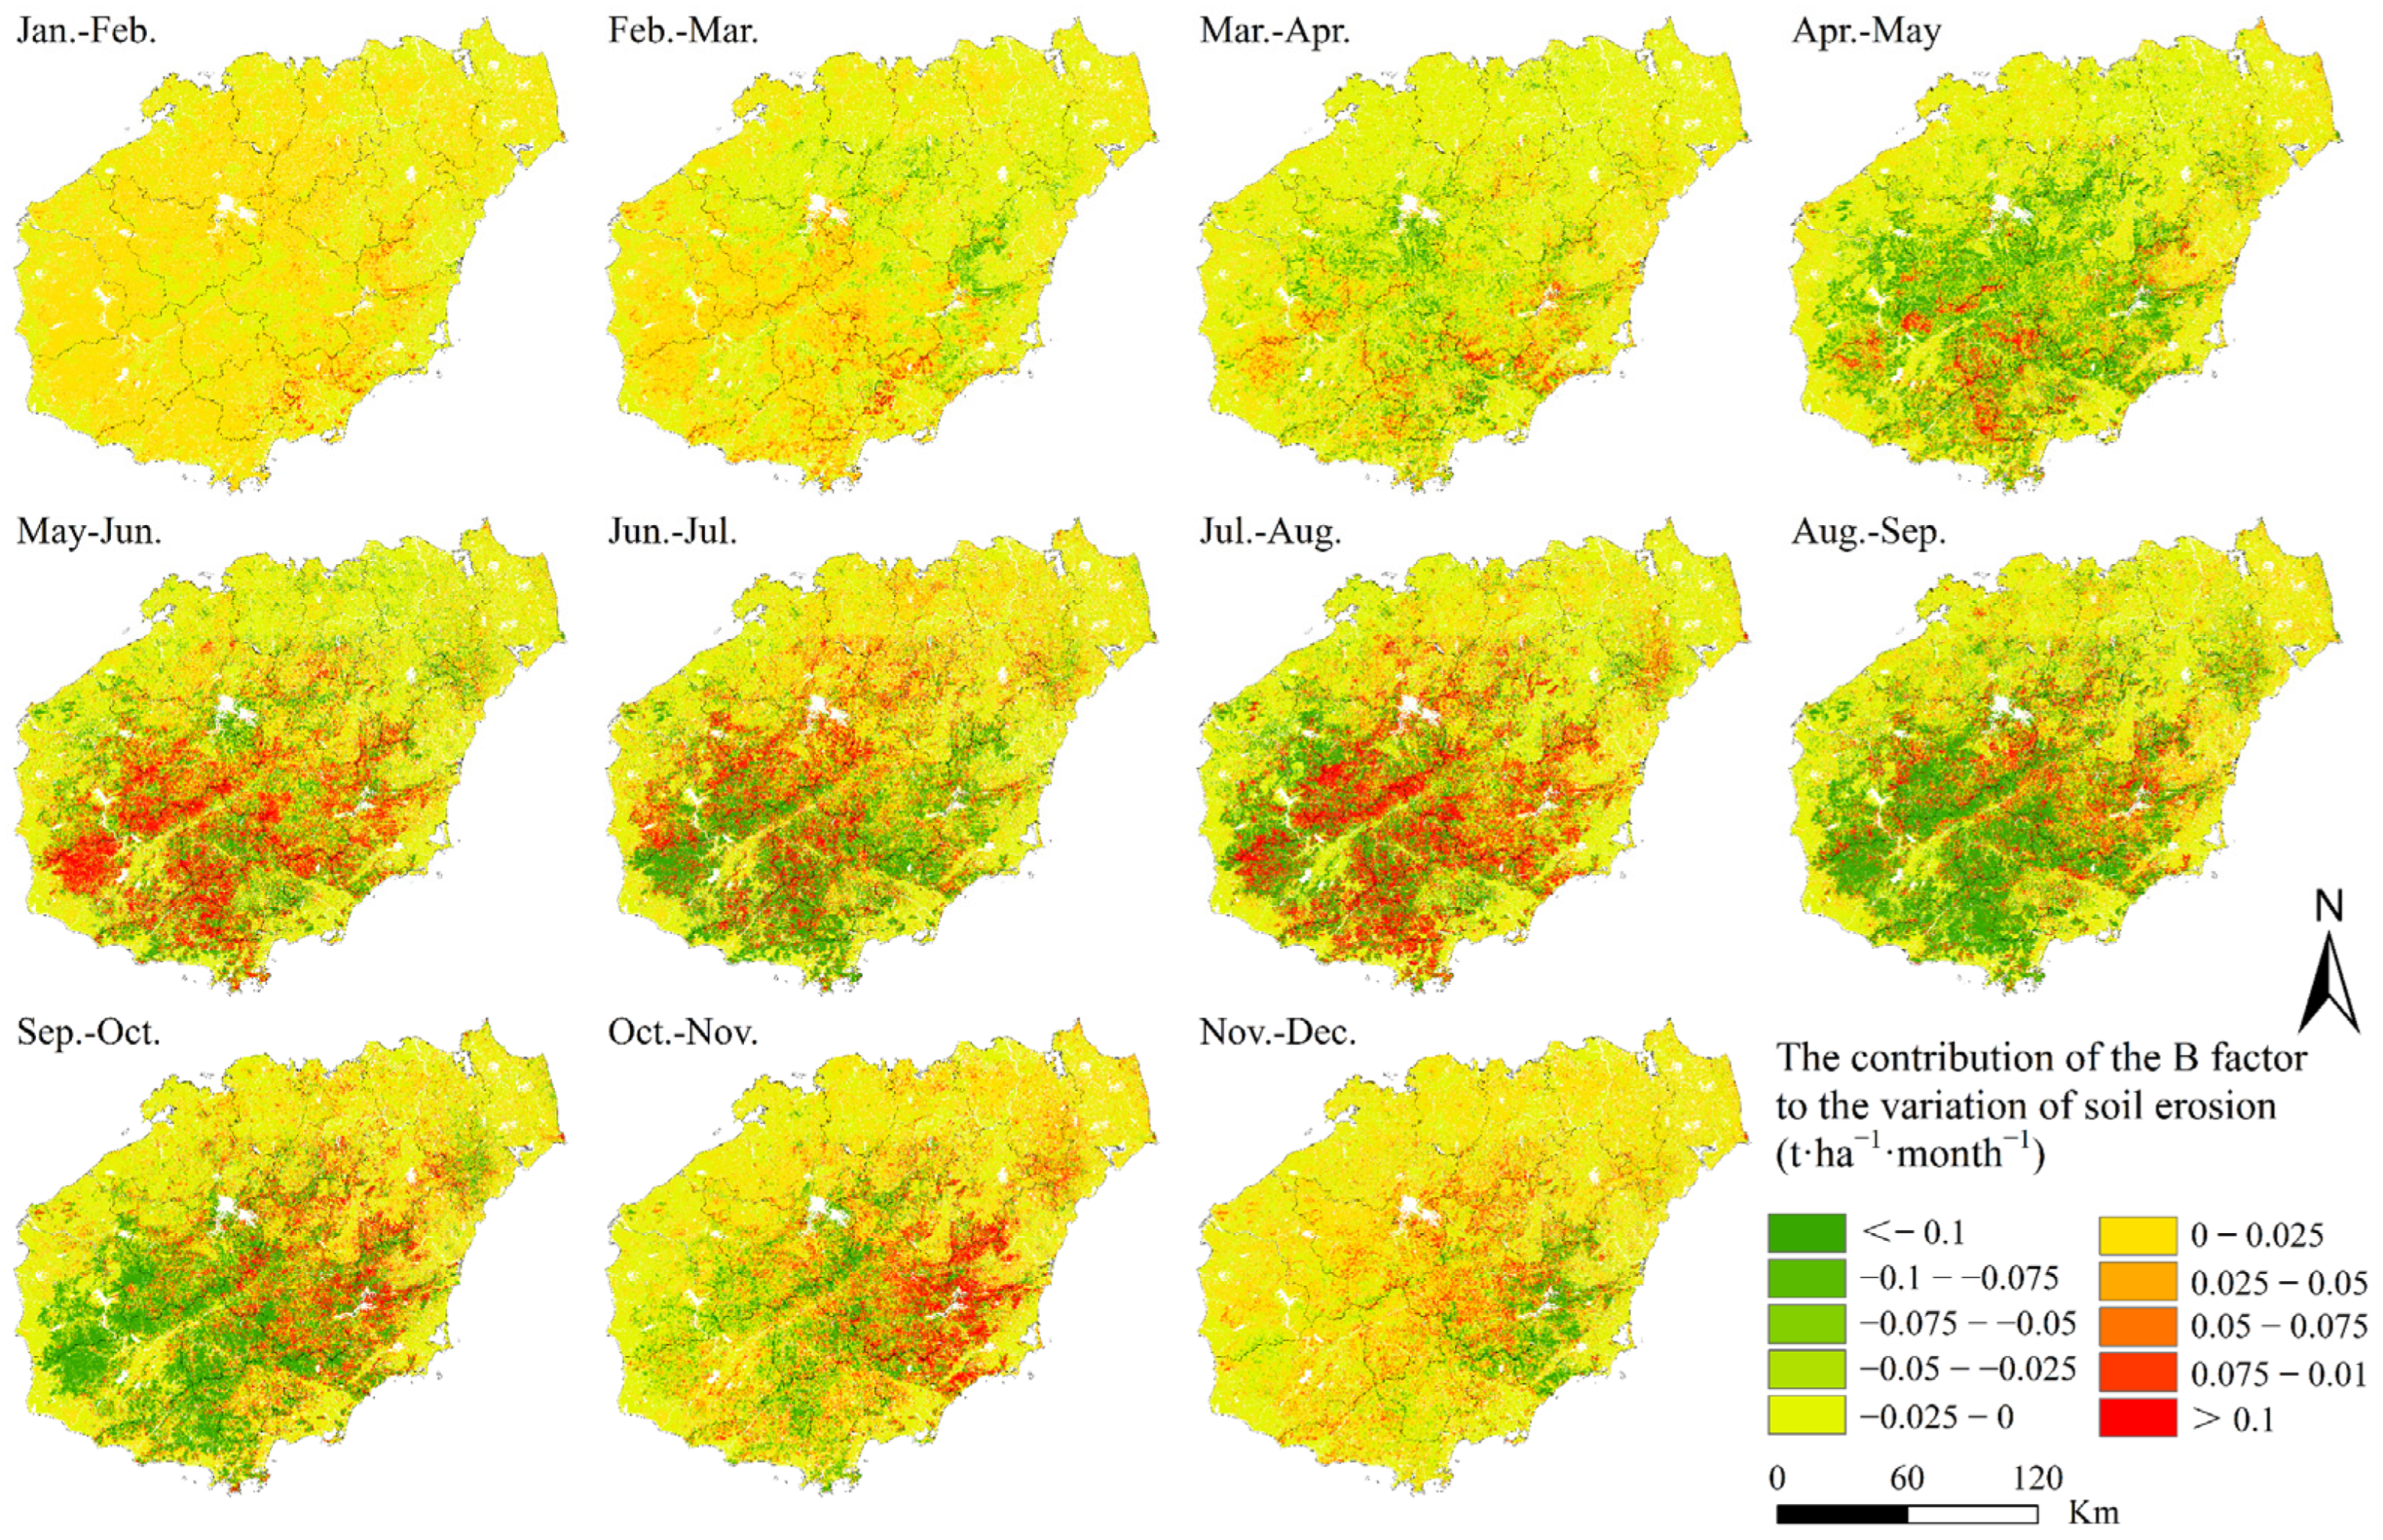
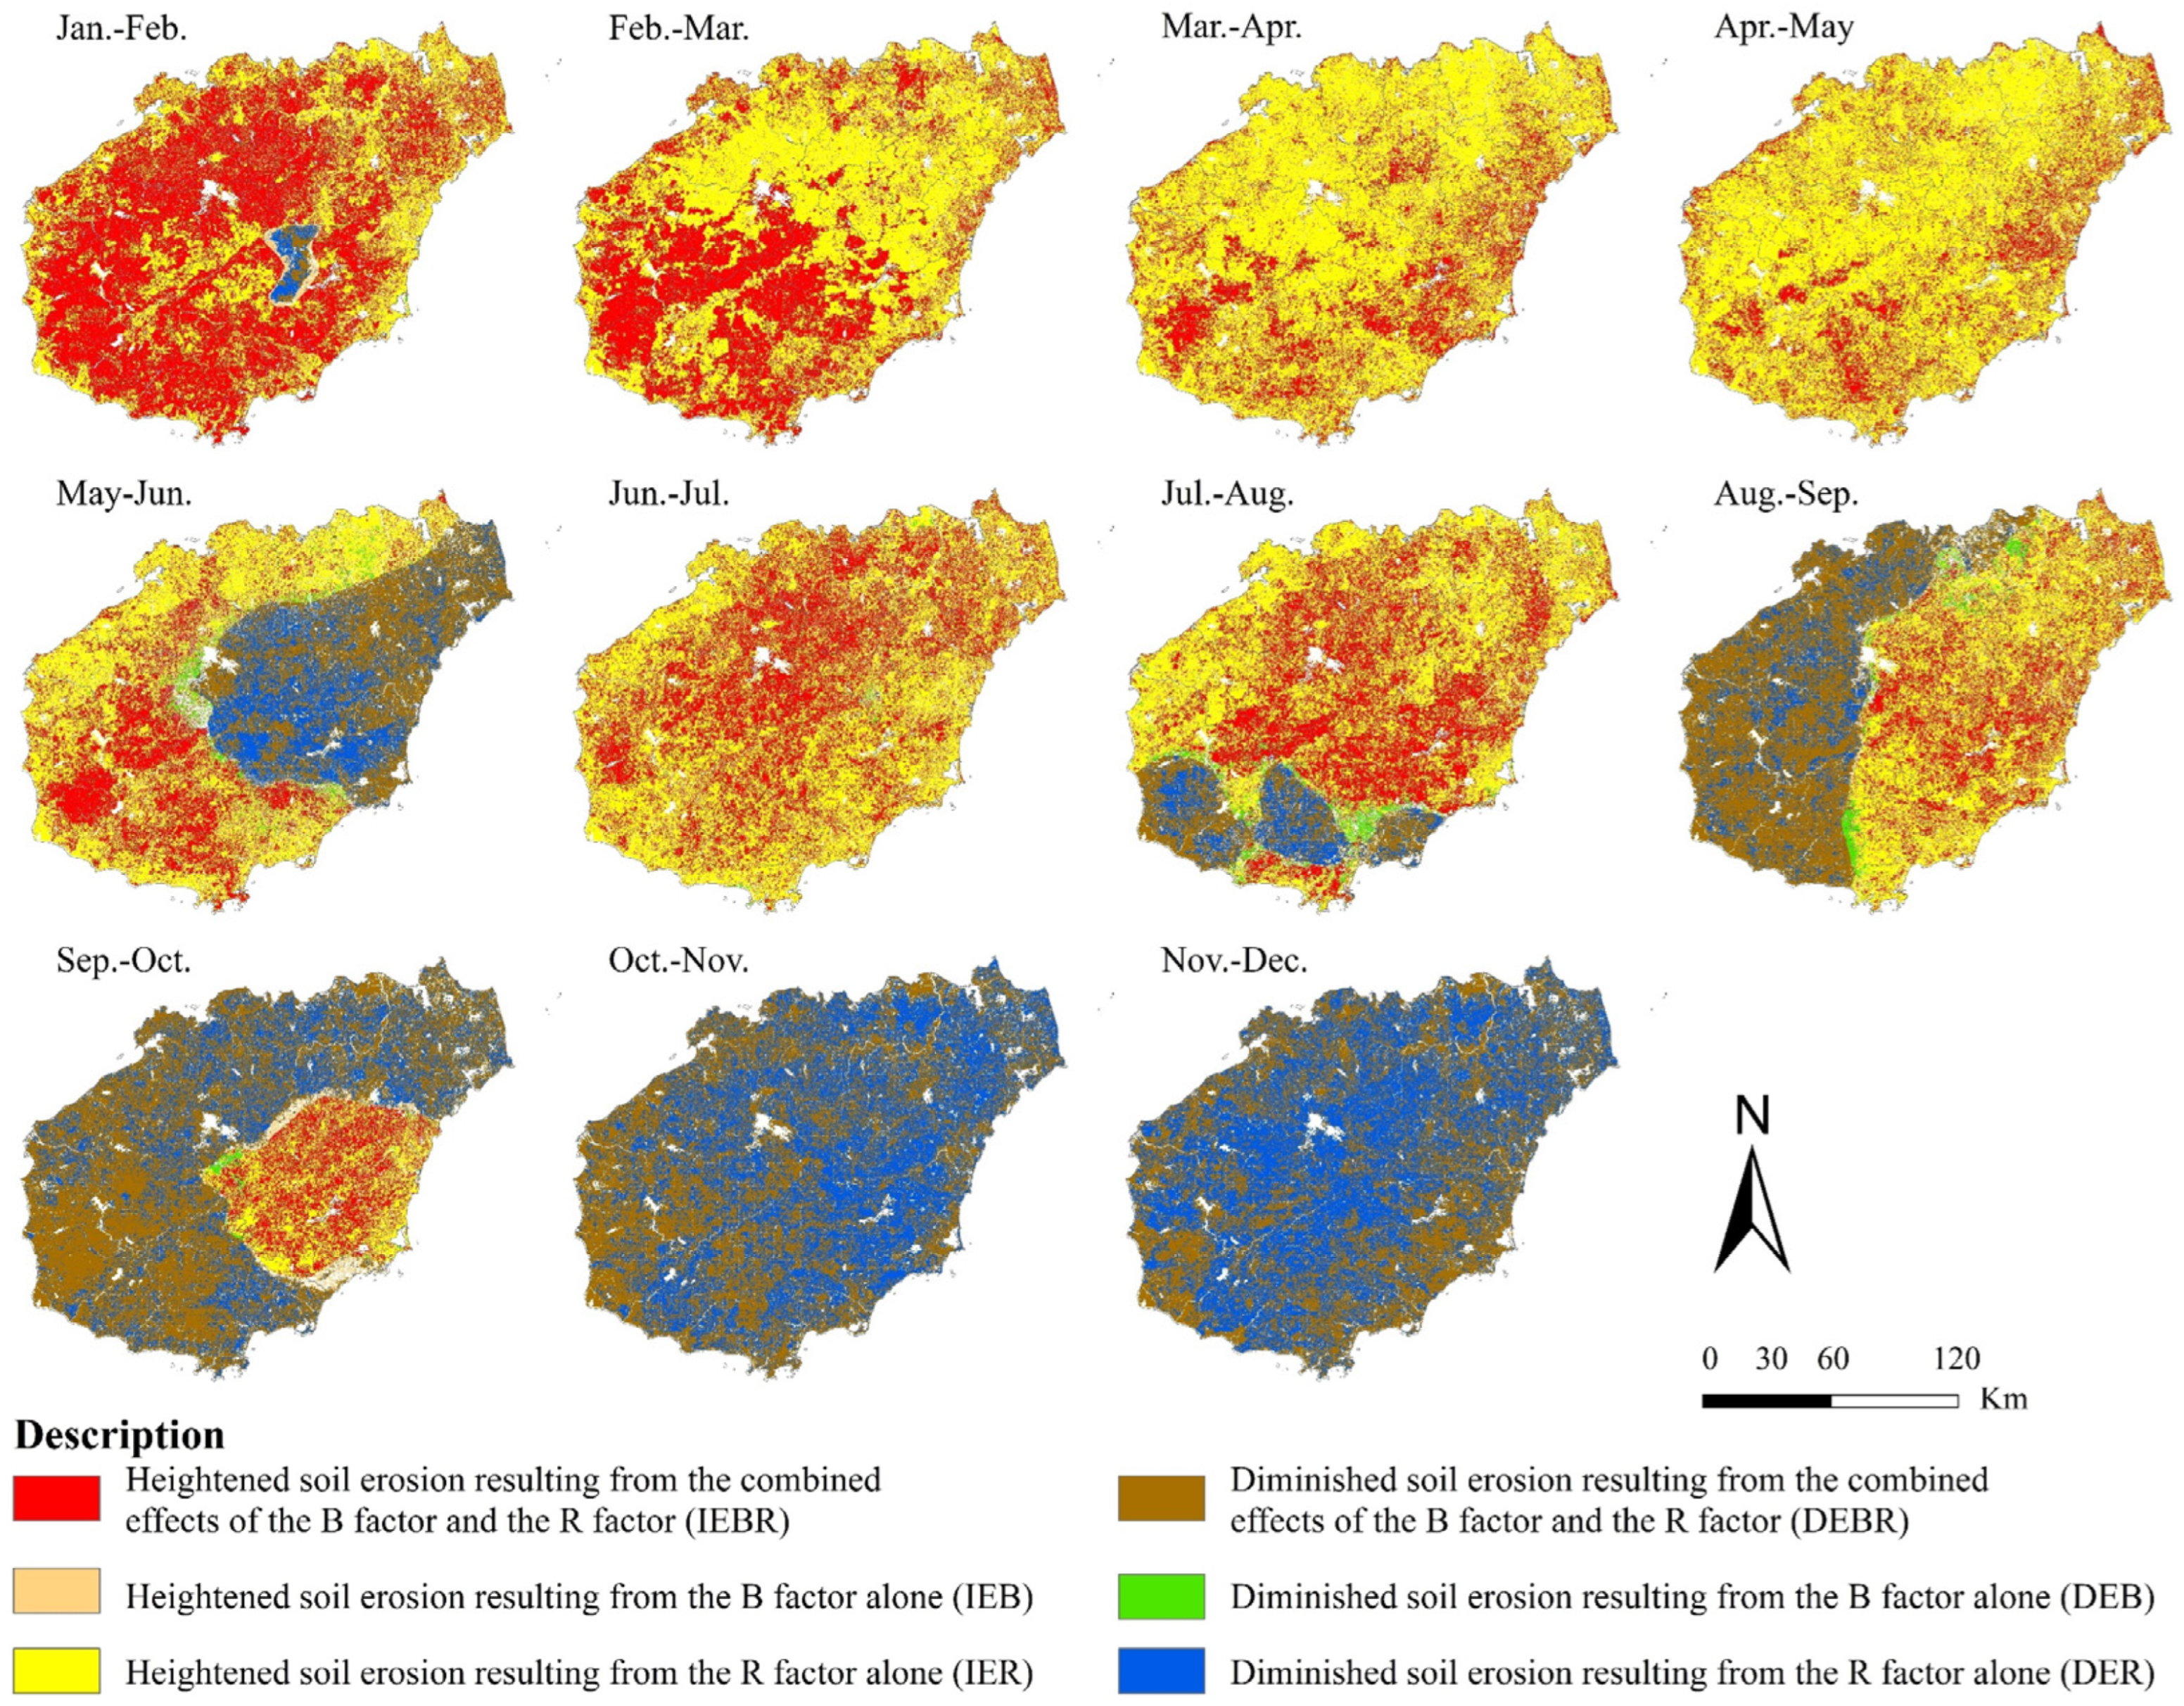
3.4.3. Impact of Driving Factors on Monthly Erosion Variation

This study’s results (Figure 16) indicate that the primary cause of the increased erosion modulus before May was an increase in rainfall, with the yellow area (IER) expanding from the northeast to the southwest. In general, due to factors such as rainfall, vegetation type, and greening time, the erosion resistance provided by vegetation was not prominent, appearing only sporadically in some areas (green area). The interplay between rainfall and vegetation resulted in a reduction in the erosion modulus starting in May. At the start of the rainy season, increased irrigation led to higher vegetation coverage, resulting in reduced erosion. The gradual spread of the brown area from the south to the west between July to December was linked to the topography and the temporal and distribution across space of rainfall on Hainan Island. Notably, beginning in November, the impact of precipitation on the soil erosion modulus became completely negative.

4. Discussion

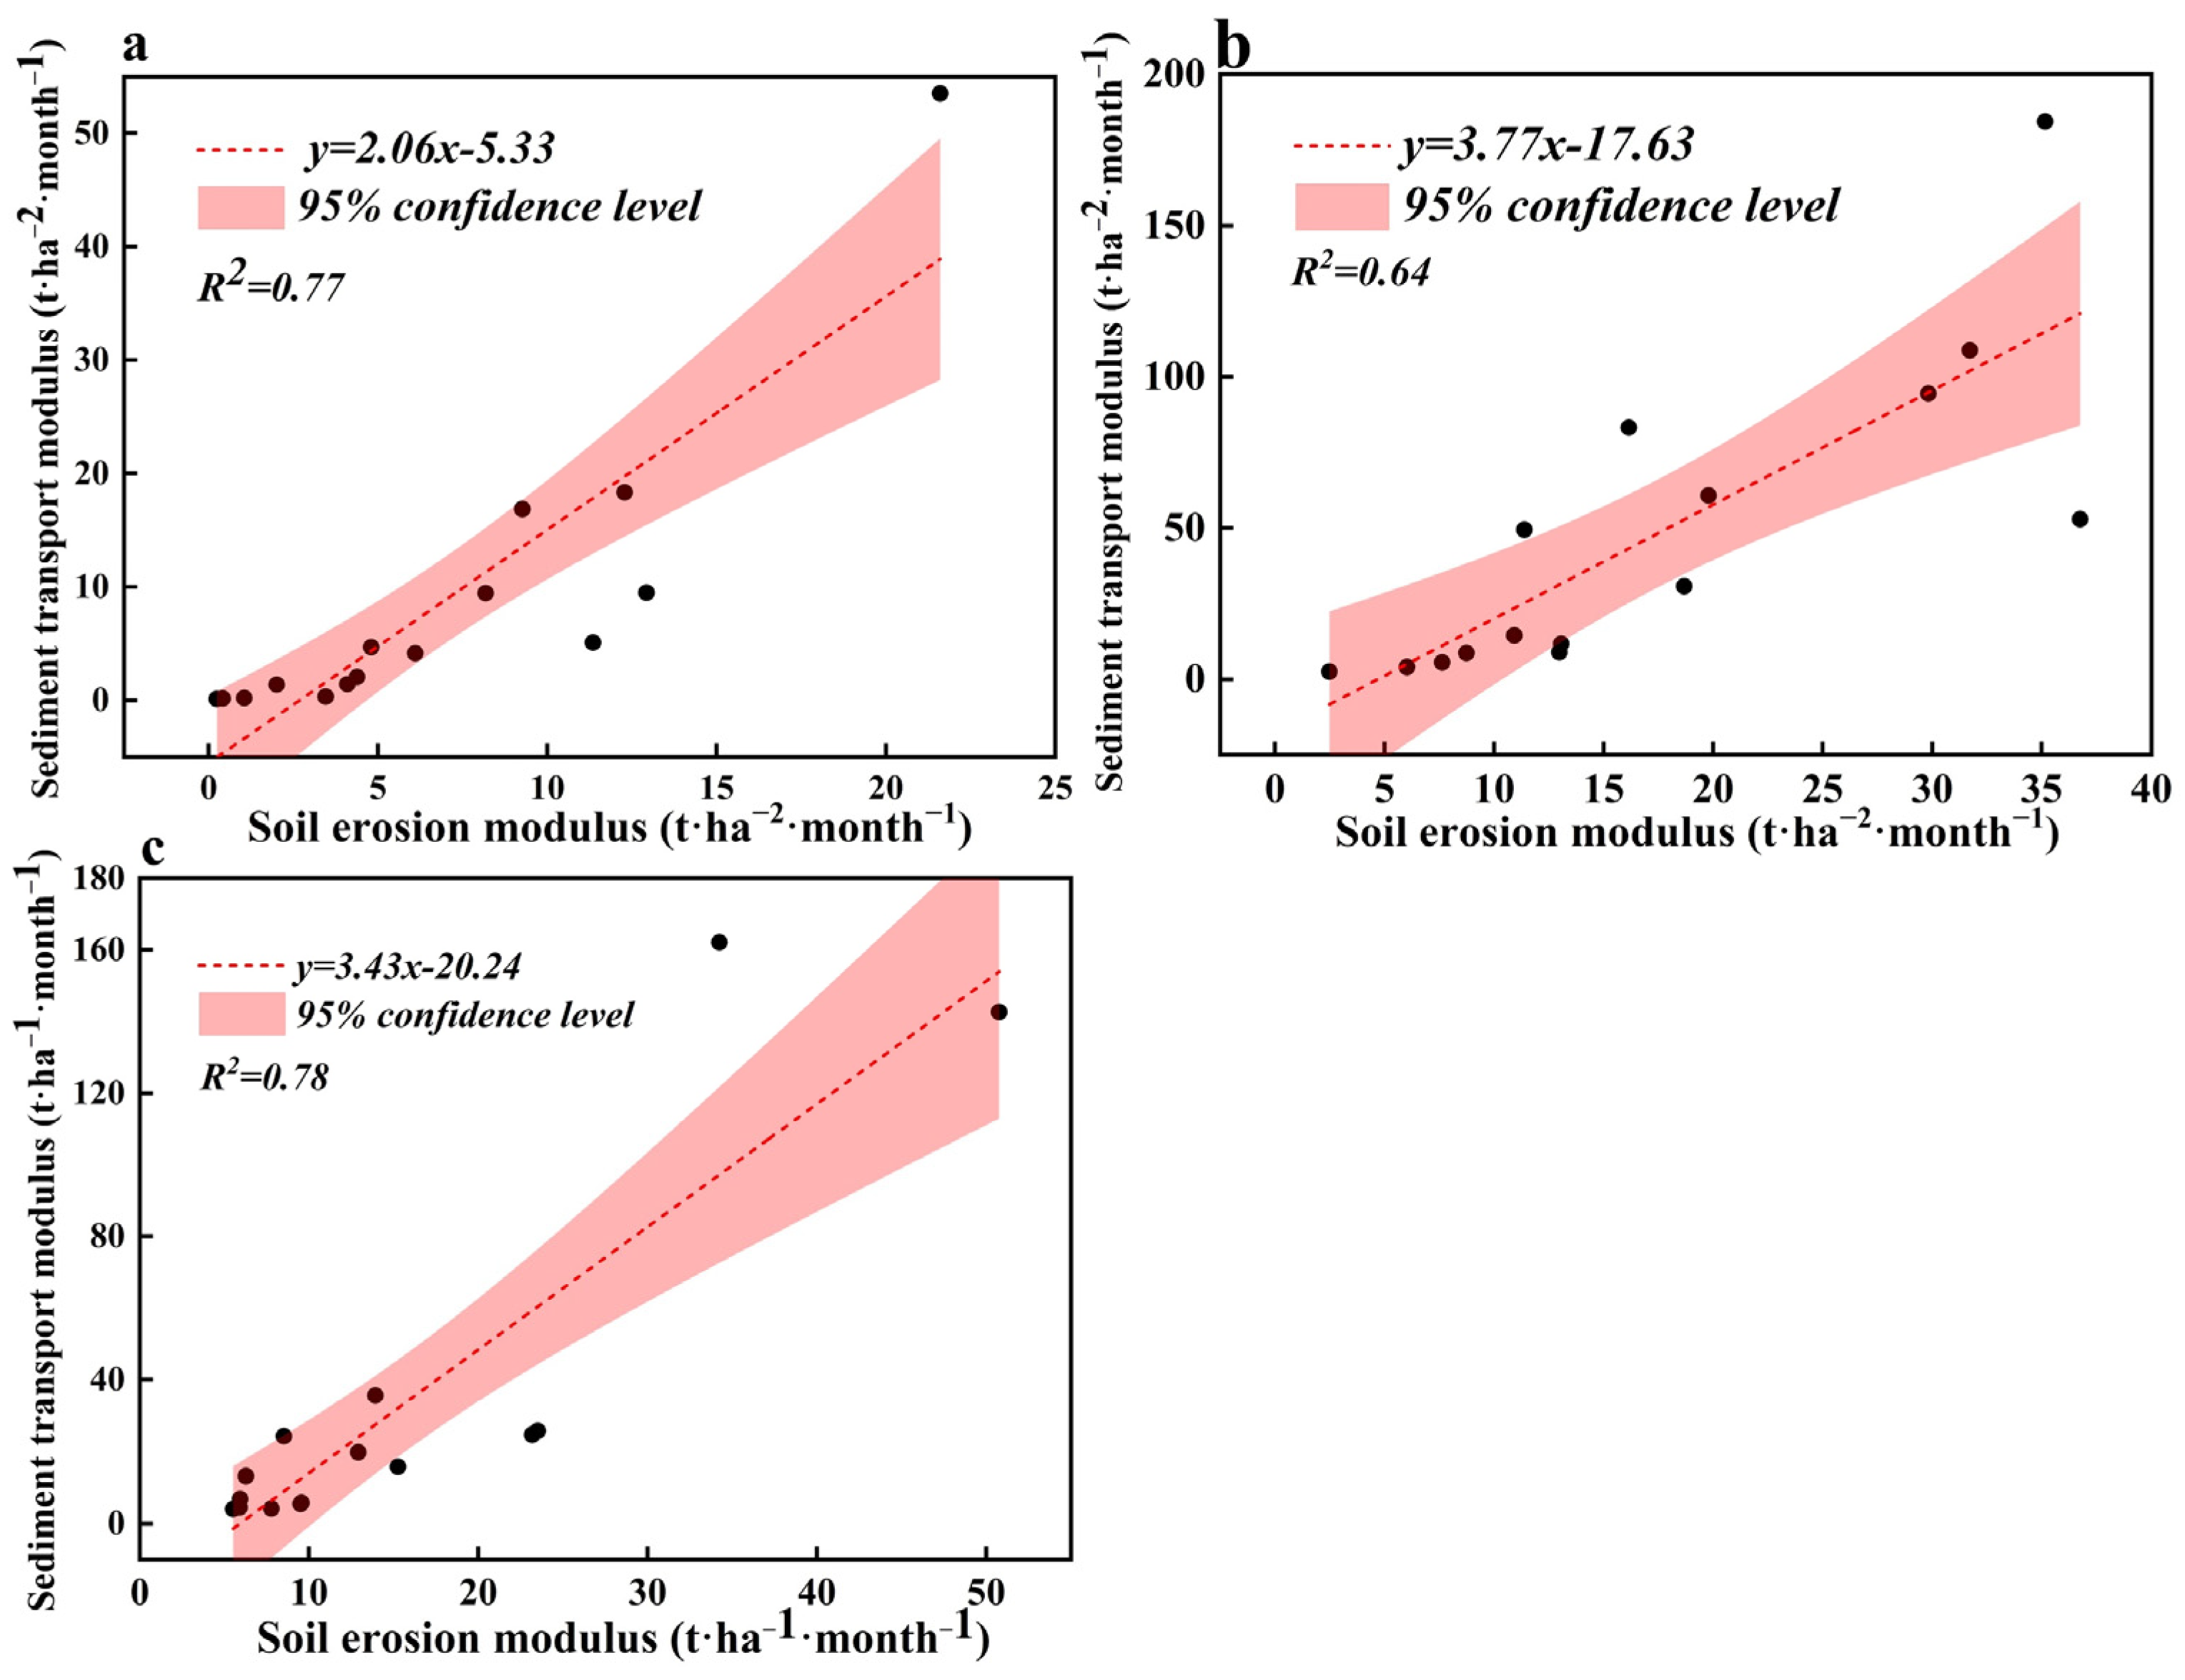
4.1. Availability of the CSLE Model

Investigating the monthly variation in soil erosion is not a novel approach, as researchers have long emphasized the importance of using monthly resolution in soil erosion simulations [6]. Previous studies on the monthly variation in soil erosion primarily employed the USLE/RUSLE model [33,35,36,37,40]. However, this model often neglects the influence of rainfall on vegetation when calculating the C factor. In this research, the CSLE model is utilized to determine the B factor (Equation (9)), incorporating the impact of rainfall erosivity on the intra-annual dynamic changes in vegetation across different months. Compared to Mu et al. [52], who calculated the C factor based on varying levels of FVC in the Pearl River Basin (including Hainan Island), our method more accurately reflects the intra-annual variations in hydraulic erosion. However, the CSLE model does not account for the transient effects of extreme weather events, such as typhoons, on erosion. Therefore, to more accurately estimate soil erosion in various study areas, local adjustments to the model parameters should be made, taking into account measured data and high-resolution rainfall data [22,53].
In our study, the monthly soil erosion modulus was compared with monitored sediment data from three drainage basins on Hainan Island, yielding an R2 value ranging from 0.64 to 0.78 (Figure 8). Furthermore, our results demonstrate strong agreement with the first water conservancy survey conducted in China in 2011. Many studies have demonstrated the availability of the CSLE model in China. Shi et al. [22] found that the CSLE model was superior to the RUSLE by comparing the calculation results of the soil loss of the two models under the background of heavy rain. Similarly, the rainfall in Hainan is intense and temporally concentrated, significantly impacting soil erosion. Ma et al. [16] utilized the CSLE to study long-term soil erosion variation in the Zhifanggou watershed. Zou et al. [54] discussed principal causes of soil erosion occurring in the key watersheds of Hainan Island and demonstrated that changes in soil erosion in tropical regions are predominantly influenced by a mix of natural and human-induced factors. A multitude of studies have demonstrated that the CSLE has evolved to fulfill the standards for soil erosion evaluation and monitoring in China.

4.2. Identify Periods Prone to Soil Erosion

Numerous researchers have centered their discussions on the alterations in soil erosion and elements that lead to these changes [55,56], and it is not uncommon to find studies that reveal the positive correlation between rainfall erosivity factor and soil water erosion change and that the rainfall erosivity factor is regarded as the main controlling factor with the largest contribution [34,57]. Analyzing the spatial dispersion and temporal variation characteristics of rainfall erosivity is essential for soil erosion research, as it aids in assessing soil erosion potential in the research area and quantitatively predicting regional soil loss [58,59]. The R factor and B factor have long time series dynamic data, and the application of these dynamic factors in evaluating soil erosion is crucial for accurately identifying the high-risk periods. This study highlights that the difference concerning the monthly soil erosion modulus was driven by rainfall intensity during various periods. The period characterized by the highest R factor coincided with the most significant instances of soil erosion. May, as the first month of the rainy season in Hainan Island, exhibited an erosion modulus (8.11 t·hm−2·month−1) that was higher than the monthly soil erosion modulus mean value (7.73 t·hm−2·month−1) (Figure 10). In the early rainy season, many plants have not yet fully grown or recovered, especially in early summer, which leads to a reduction in the protective layer of the soil and increases the risk of soil quality being transferred, reflecting the lag in plant development. Therefore, May is identified as the first erosion risk month. September is determined to be the period of most severe soil erosion. Located at the northern boundary of the tropics, Hainan experiences its peak yearly rainfall erosivity from July to October. The tropical monsoon weather pattern results in frequent typhoons and heavy rains during the summer and autumn, leading to the most concentrated erosive rainfall.
The trend in monthly soil erosion on Hainan Island shows a single peak, which aligns with the annual variation patterns observed in previous studies on monthly soil erosion [35,37,40]. Peak erosion occurs during the most intense months associated with rain. Compared with Cao et al. [33], the monthly soil erosion variation in Northeast China showed a bimodal characteristic, and the reason for the difference in results may be the uniqueness of the location in different climatic zones and vegetation types. Hence, it is very important to deeply analyze and explain the changing laws and mechanisms of soil erosion in tropical areas. Analyzing the effect of dynamic factor interactions on soil erosion revealed that months with significant losses in the soil erosion modulus are usually associated with high R and B factor values, which signify high rainfall and low vegetation cover, respectively. These values indicate conditions of excessive rainfall paired with low levels of vegetation, both of which contribute to increased soil erosion throughout this duration. On the other hand, April is a critical point for soil loss, placed in the southwestern vicinity of Qionghai City and the northwestern vicinity of Wanning City. In the eastern part of Hainan Island, human activities have contributed to a favorable trend in erosion, resulting in a high soil loss rate. When rainfall erosivity peaks coincide with exposure to bare soil, for instance, practices such as bare fallow, deforestation, or land clearing significantly enhance the threat of soil erosion [40]. Besides heavy rainfall, intervals of sparse vegetation cover play a major role in soil erosion, especially when these factors overlap, leading to heightened erosion risk. Additionally, the connection between the key driving factors of precipitation and vegetation concerning soil water erosion was addressed. The LMDI model’s quantitative analysis demonstrates that the R factor is more affected by soil erosion changes than the B factor, and it has a greater contribution rate (Figure 14 and Figure 15). The spatial distribution of the effects of vegetation cover and precipitation on soil erosion can be obtained from the contribution maps of the R and B factors. The varying patterns of precipitation and types of vegetation result in different responses to soil erosion, making it essential to recognize regional characteristics to identify potential changes and high-risk periods for erosion.

4.3. Response of Monthly Soil Erosion to Different Topography and Land Use/Cover

The distribution of soil erosion in space is largely determined by static factors, such as the type of soil and the terrain. Different terrain forms different climatic conditions, thus forming different soil types, breeding and growing different vegetation types, and forming regional characteristics. The findings indicate that the erosion modulus correlates positively with the rise in terrain complexity. This is consistent with the previous report that the LS value is usually higher in steep mountainous areas [33], and the LS factor significantly influences the changes in the erosion modulus [60], particularly within Hainan Island’s central hilly zone. Areas with increased soil erosion are often highly susceptible to hydraulic erosion driven by rainfall erosive forces due to undulating topography, relatively high slope length factors, and relatively high soil erodibility (Figure 11). Additionally, Zhu et al. [61] demonstrated that different land use practices had varying impacts on soil permeability characteristics, with farmland exhibiting significantly lower soil permeability compared to other land use types. Different agricultural engineering measures can also alter the terrain’s form, such as by transforming it into a stepped, terraced structure [62]. Therefore, poor land use practices can alter the microtopography and soil quality, thereby impacting soil and water conservation efforts [63]. Characteristics of climatic changes in vegetation influence the development of seasonal soil erosion. On Hainan Island, the greening period of vegetation occurs from late March to early April, a time when vegetation growth is insufficient to intercept rainfall effectively. The leafing-out period and growing season vary across vegetation types; for instance, deciduous broad-leaved forests have the earliest leafing-out period and the longest growing season, while evergreen coniferous forests have the latest leafing-out period and the shortest growing season. Mixed forests exhibit the latest yellowing period and the longest growing season. The distribution of the greening period in Hainan Island is gradually delayed from northeast to southwest, suggesting that earlier greening corresponds to earlier vegetation coverage, indicating that the erosion decline is earlier and the erosion peak is earlier. Conversely, the distribution of the dry and yellow period in Hainan Island is early in the middle and late in the periphery, and the growing season in Hainan Island gradually extends from southwest to northeast [64]. This is roughly the same as the increase or decrease in soil erosion modulus under various vegetation types. Therefore, in view of the common phenomenon of surface erosion and gully erosion caused by slope cultivation, the suitable area should be converted into terrace, and the irrigation and drainage system should be added to promote the development of soil conservation tillage. The under-forest surface cover of slope garden/forest land should be increased, the implementation of a slope drainage system should be promoted, and mountain flood disasters should be appropriately mitigated.
Moreover, the area of rubber forest on Hainan Island has seen substantial growth in recent decades, expanding from 34,000 square kilometers in 1990 to 59,000 square kilometers in 2020, which represents a net increase of 70.11% [65]. The transformation of tropical rainforests into rubber plantations changes soil water retention and infiltration processes [66]. A study by Chen et al. [67] in Baoting County, Hainan Province, found that converting tropical secondary forest to rubber plantations decrease the soil’s ability to retain water and its infiltration rate, making the soil more susceptible to erosion. Furthermore, Zhu et al. [51] demonstrated that the replacement of tropical rainforest with rubber monoculture forests leads to server splash erosion. These studies indicate that rubber monoculture forests exhibit a single community structure, with significant spacing between trees and increased wind exposure. Due to differences in the canopy structure between tropical rainforests and rubber forests, the leaf area index of rubber forests is lower, leading to insufficient ground cover [51]. Therefore, appropriate intercropping patterns with improved soil cover need to be considered.

4.4. Suggestions Based on the Factors That Influence Soil Erosion

Investigating the spatial and temporal differences in soil and water loss, along with their underlying driving mechanisms, is essential for effective soil erosion control planning. From 2003 to 2021, the average annual soil erosion modulus for Hainan Island were 42.80 t·hm−2·a−1, 64.43 t·hm−2·a−1, 121.72 t·hm−2·a−1, 104.68 t·hm−2·a−1, and 115.86 t·hm−2·a−1, respectively. According to the soil erosion classification standards (SL190-2007) [68], soil erosion in Hainan Island is primarily classified as slight. However, the increasing trend in the soil erosion modulus year by year suggests significant potential for further soil erosion in this area. Moreover, due to the independence and fragility of island ecosystems, any damage to them could result in irreversible consequences. Controlling soil erosion is critical for the sustainable advancement and ecological restoration of Hainan Island. Rubber plantations are a common cash crop in tropical regions. In recent years, numerous ecological issues such as drought, soil erosion, biodiversity loss, and conflicts with rainforest protection have arisen due to the irrational planting of rubber plantations [69]. The large-scale monoculture of rubber plantations may lead to ecosystem fragility and a reduction in soil biodiversity, consequently affecting soil stability. Therefore, it is essential to implement timely measures to rationally plan and manage land resources, optimizing land use structures.
Driving factor analysis showed that rainfall and vegetation had different impacts in different seasons. Given the impact of heavy rainfall and agricultural labor, suitable areas should be converted to terraces, irrigation and drainage systems should be installed, and soil conservation tillage methods should be promoted. The undergrowth cover of sloped gardens/forest lands should be increased, the implementation of slope interception drainage systems should be promoted, and mountain flood disasters should be appropriately mitigated. In addition, the sowing method of no-tillage and mulching should be implemented when sowing in the early rainy season to minimize soil surface loosening. Efforts should be made to maintain land productivity after harvest [70]. Summer and autumn are the optimal periods for soil erosion control on Hainan Island. Efforts should focus on preventing erosion issues in the central mountain regions areas and safeguarding important drinking water sources within the study region [71]. In light of the geological features of the study area, LS values are the most elevated in the central mountainous region, decreasing gradually as one moves to the surrounding areas (Figure 2b,c). In areas with steep slopes, slope modifications should be adopted, and the reclamation of slopes above 25° should be strictly controlled. In general, building upon initial comprehensive management efforts, a variety of management techniques should be further developed. By focusing on the integrity of the ecosystem and its functions and services, we should shift towards ecological regulation of soil erosion. At the same time, various measures should be undertaken to enhance the vitality of ecosystem and the relationship between material, energy, and information flows.

5. Conclusions

This research utilizing the CSLE model, combined with dynamic observations of daily rainfall and vegetation coverage to measure monthly assessments of soil erosion risk, were conducted in Hainan Island for the first time. This model demonstrated a relatively high R2, with validation results for the three basins yielding R2 values of 0.77, 0.64, and 0.78, respectively. The data indicated that the annual average soil erosion on Hainan Island was 92.76 t·ha−1·year−1. A modulus of 7.73 t·ha−1·month−1 was observed for average monthly soil erosion, peaking in September at 18.33 t·ha−1·month−1 and reaching its lowest point in January at 0.18 t·ha−1·month−1. Influenced by erosive rainfall, May to October showed elevated soil erosion modulus levels, which resulted in these six months being designated as a period of high erosion risk. High-erosion-risk zones are predominantly distributed in the central and eastern sections of the study area, gradually extending into the southwest. The results demonstrate the necessity of monthly soil erosion assessments. Compared to monthly assessments, annual evaluations commonly overestimate the risk of water erosion in spring and winter while underestimating it in summer and autumn. However, increased green vegetation coverage in summer does not compensate for the high summer rainfall erosivity. The R factor and B factor play crucial roles in influencing the monthly changes in soil erosion. As the growing season for vegetation approaches, the B factor exhibits increasing influence and anti-erosion capability. These results establish a theoretical foundation for improved management of the dynamic distribution of water erosion on Hainan Island, providing scientific backing for the formulation of soil and water conservation measures and promoting high-quality ecological development in the region.

Author Contributions

S.L.: Writing—original draft, Writing—review and editing, Validation, Visualization, Methodology, Conceptualization. Y.Z.: Writing—review and editing, Methodology. Y.H.: Writing—review and editing, Visualization. S.X. and L.Z.: Writing—review and editing. C.Y.: Methodology, Conceptualization, Validation, Visualization, Writing—review and editing, Supervision, Funding. All authors have read and agreed to the published version of the manuscript.

Funding

This research was supported by the National Natural Science Foundation of China (Grant No.: 52069006, 51979043), the Natural Science Foundation of Hainan Province (Grant No.: ZDYF2022SHFZ060, 421RC489), and the Science and Technology Foundation of Hainan Province (Grant No.: ZDYF2023XDNY181).

Institutional Review Board Statement

Not applicable.

Informed Consent Statement

Not applicable.

Data Availability Statement

Data will be made available on request.

Conflicts of Interest

The authors affirm that they have no competing financial interests or personal relationships that could have appeared to influence the work reported in this paper.

References

  1. Panagos, P.; Ballabio, C.; Borrelli, P.; Meusburger, K.; Klik, A.; Rousseva, S.; Tadic, M.P.; Michaelides, S.; Hrabalíková, M.; Olsen, P.; et al. Rainfall erosivity in Europe. Sci. Total Environ. 2015, 511, 801–814. [Google Scholar] [CrossRef]
  2. Borrelli, P.; Robinson, D.A.; Fleischer, L.R.; Lugato, E.; Ballabio, C.; Alewell, C.; Meusburger, K.; Modugno, S.; Schutt, B.; Ferro, V.; et al. An assessment of the global impact of 21st century land use change on soil erosion. Nat. Commun. 2017, 8, 2013. [Google Scholar] [CrossRef]
  3. Gianinetto, M.; Aiello, M.; Vezzoli, R.; Polinelli, F.N.; Rulli, M.C.; Chiarelli, D.D.; Bocchiola, D.; Ravazzani, G.; Soncini, A. Future Scenarios of Soil Erosion in the Alps under Climate Change and Land Cover Transformations Simulated with Automatic Machine Learning. Climate 2020, 8, 28. [Google Scholar] [CrossRef]
  4. Montanarella, L.; Pennock, D.J.; McKenzie, N.; Badraoui, M.; Chude, V.; Baptista, I.; Mamo, T.; Yemefack, M.; Aulakh, M.S.; Yagi, K.; et al. World’s soils are under threat. Soil 2016, 2, 79–82. [Google Scholar] [CrossRef]
  5. Wu, Q.; Jiang, X.; Shi, X.; Zhang, Y.; Liu, Y.; Cai, W. Spatiotemporal evolution characteristics of soil erosion and its driving mechanisms—A case Study: Loess Plateau, China. CATENA 2024, 242, 108075. [Google Scholar] [CrossRef]
  6. Wischmeier, W.H.; Smith, D.D. Predicting rainfall-erosion losses from cropland east of the Rocky Mountains. In Agricultural Handbook; Agricultural Research Service, US Department of Agriculture: Washington, DC, USA, 1965; Volume 282. [Google Scholar]
  7. Zhu, Y. Spatiotemporal Analysis of the Soil Erosion Based on CSLE and CA-Markov Model: A Case Study in the Laohekou City. Master’s Thesis, Central China Normal University, Wuhan, China, 2022. [Google Scholar]
  8. Borrelli, P.; Alewell, C.; Alvarez, P.; Anache, J.A.A.; Baartman, J.; Ballabio, C.; Bezak, N.; Biddoccu, M.; Cerdà, A.; Chalise, D.; et al. Soil erosion modelling: A global review and statistical analysis. Sci. Total Environ. 2021, 780, 146494. [Google Scholar] [CrossRef]
  9. Xiong, M.; Sun, R.; Chen, L. Effects of soil conservation techniques on water erosion control: A global analysis. Sci. Total Environ. 2018, 645, 753–760. [Google Scholar] [CrossRef]
  10. Wen, X.; Deng, X.Z. Current soil erosion assessment in the Loess Plateau of China: A mini-review. J. Clean. Prod. 2020, 276, 123091. [Google Scholar] [CrossRef]
  11. Vente, J.d.; Poesen, J. Predicting soil erosion and sediment yield at the basin scale: Scale issues and semi-quantitative models. Earth Sci. Rev. 2005, 71, 95–125. [Google Scholar] [CrossRef]
  12. Demirci, A.; Karaburun, A. Estimation of soil erosion using RUSLE in a GIS framework: A case study in the Buyukcekmece Lake watershed, northwest Turkey. Environ. Earth Sci. 2012, 66, 903–913. [Google Scholar] [CrossRef]
  13. Karamesouti, M.; Petropoulos, G.P.; Papanikolaou, I.D.; Kairis, O.; Kosmas, K. Erosion rate predictions from PESERA and RUSLE at a Mediterranean site before and after a wildfire: Comparison & implications. Geoderma 2016, 261, 44–58. [Google Scholar]
  14. Liu, B.; Zhang, K.; Yun, X. An Empirical Soil Loss Equation. In Proceedings of the 12th ISCO Conference, Beijing, China, 26–31 May 2002. [Google Scholar]
  15. Liu, B.; Nearing, M.; Risse, M. Slope Gradient Effects on Soil Loss for Steep Slopes. Trans. ASAE 1994, 37, 1835–1840. [Google Scholar] [CrossRef]
  16. Ma, T.L.; Liu, B.Y.; He, L.; Dong, L.X.; Yin, B.; Zhao, Y.E. Response of soil erosion to vegetation and terrace changes in a small watershed on the Loess Plateau over the past 85 years. Geoderma 2024, 443, 116837. [Google Scholar] [CrossRef]
  17. Zhang, J.X.; Wang, N.A.; Wang, Y.F.; Wang, L.H.; Hu, A.P.; Zhang, D.Y.; Su, X.B.; Chen, J.H. Responses of soil erosion to land-use changes in the largest tableland of the Loess Plateau. Land Degrad. Dev. 2021, 32, 3598–3613. [Google Scholar] [CrossRef]
  18. Rao, W.E.; Shen, Z.H.; Duan, X.W. Spatiotemporal patterns and drivers of soil erosion in Yunnan, Southwest China: RULSE assessments for recent 30 years and future predictions based on CMIP6. CATENA 2023, 220, 106703. [Google Scholar] [CrossRef]
  19. He, L.; Guo, J.W.; Zhang, X.P.; Liu, B.Y.; Guzman, G.; Gomeza, J.A. Vegetation restoration dominated the attenuated soil loss rate on the Loess Plateau, China over the last 50 years. CATENA 2023, 228, 07149. [Google Scholar] [CrossRef]
  20. Fu, S.H.; Cao, L.X.; Liu, B.Y.; Wu, Z.P.; Savabi, M.R. Effects of DEM grid size on predicting soil loss from small watersheds in China. Environ. Earth Sci. 2015, 73, 2141–2151. [Google Scholar] [CrossRef]
  21. Duan, X.W.; Bai, Z.W.; Rong, L.; Li, Y.B.; Ding, J.H.; Tao, Y.Q.; Li, J.X.; Li, J.S.; Wang, W. Investigation method for regional soil erosion based on the Chinese Soil Loss Equation and high-resolution spatial data: Case study on the mountainous Yunnan Province, China. CATENA 2020, 184, 104237. [Google Scholar] [CrossRef]
  22. Shi, W.H.; Huang, M.B.; Barbour, S.L. Storm-based CSLE that incorporates the estimated runoff for soil loss prediction on the Chinese Loess Plateau. Soil Tillage Res. 2018, 180, 137–147. [Google Scholar] [CrossRef]
  23. Chen, G.K.; Zhao, J.J.; Duan, X.W.; Tang, B.H.; Zuo, L.J.; Wang, X.; Guo, Q.K. Spatial Quantification of Cropland Soil Erosion Dynamics in the Yunnan Plateau Based on Sampling Survey and Multi-Source LUCC Data. Remote Sens. 2024, 16, 977. [Google Scholar] [CrossRef]
  24. Xu, D.G.; He, Y.H.; Tan, Q. Improvement of sediment yield index model through incorporating rainfall erosivity. Environ. Sci. Pollut. Res. 2023, 30, 38141–38156. [Google Scholar] [CrossRef]
  25. Wu, Y.; Shi, H.; Yang, X. Estimating the CSLE Biological Conservation Measures’ B-Factor Using Google Earth’s Engine. Remote Sens. 2024, 16, 847. [Google Scholar] [CrossRef]
  26. Wu, W.Y.; Zhang, J.; Sun, Z.Y.; Yu, J.A.; Liu, W.J.; Yu, R.; Wang, P. Attribution analysis of land degradation in Hainan Island based on geographical detector. Ecol. Indic. 2022, 141, 109119. [Google Scholar] [CrossRef]
  27. Shi, T.; Yang, S.Y.; Zhang, W.; Zhou, Q. Coupling coordination degree measurement and spatiotemporal heterogeneity between economic development and ecological environment—Empirical evidence from tropical and subtropical regions of China. J. Clean. Prod. 2020, 244, 118739. [Google Scholar] [CrossRef]
  28. Lei, J.; Zhang, L.; Wu, T.; Chen, X.; Li, Y.; Chen, Z. Spatial-temporal evolution and driving factors of water yield in three major drainage basins of Hainan Island based on land use change. Front. For. Glob. Change 2023, 6, 1131262. [Google Scholar] [CrossRef]
  29. Ren, H.; Li, L.J.; Liu, Q.; Wang, X.; Li, Y.D.; Hui, D.F.; Jian, S.G.; Wang, J.; Yang, H.; Lu, H.F.; et al. Spatial and Temporal Patterns of Carbon Storage in Forest Ecosystems on Hainan Island, Southern China. PLoS ONE 2014, 9, 108163. [Google Scholar] [CrossRef]
  30. Sun, R.; Wu, Z.X.; Chen, B.Q.; Yang, C.; Qi, D.L.; Lan, G.Y.; Fraedrich, K. Effects of land-use change on eco-environmental quality in Hainan Island, China. Ecol. Indic. 2020, 109, 105777. [Google Scholar] [CrossRef]
  31. Luo, H.; Wang, L.l.; Cao, J.h.; Dai, S.p.; Li, H.; Xie, Z.; Li, M. NDVl Variables and lts Relationship with Temperature and Precipitation in Hainan Island from 2001 to 2014 Basedon MODIS NDVI. Southwest China J. Agric. Sci. 2018, 31, 856–861. (In Chinese) [Google Scholar]
  32. Lu, X.; Chen, J.; Guo, J.; Qi, S. Variation characteristics of rainfall erosivity in tropical China and its impact on river sediment load. Front. Environ. Sci. 2023, 11, 1084503. [Google Scholar] [CrossRef]
  33. Cao, Y.F.; Hua, L.; Tang, Q.; Liu, L.; Cai, C.F. Evaluation of monthly-scale soil erosion spatio-temporal dynamics and identification of their driving factors in Northeast China. Ecol. Indic. 2023, 150, 110187. [Google Scholar] [CrossRef]
  34. Castro, R.M.; Alves, W.d.S.; Marcionilio, S.M.L.d.O.; De Moura, D.M.B.; Oliveira, D.M.d.S. Soil losses related to land use and rainfall seasonality in a watershed in the Brazilian Cerrado. J. S. Am. Earth Sci. 2022, 119, 104020. [Google Scholar] [CrossRef]
  35. Polykretis, C.; Alexakis, D.D.; Grillakis, M.G.; Manoudakis, S. Assessment of Intra-Annual and Inter-Annual Variabilities of Soil Erosion in Crete Island (Greece) by Incorporating the Dynamic “Nature” of R and C-Factors in RUSLE Modeling. Remote Sens. 2020, 12, 2439. [Google Scholar] [CrossRef]
  36. Humphrey, O.S.; Osano, O.; Aura, C.M.; Marriott, A.L.; Dowell, S.M.; Blake, W.H.; Watts, M.J. Evaluating spatio-temporal soil erosion dynamics in the Winam Gulf catchment, Kenya for enhanced decision making in the land-lake interface. Sci. Total Environ. 2022, 815, 151975. [Google Scholar] [CrossRef]
  37. Schmidt, S.; Alewell, C.; Meusburger, K. Monthly RUSLE soil erosion risk of Swiss grasslands. J. Maps 2019, 15, 247–256. [Google Scholar] [CrossRef]
  38. Lin, S.L.; Chen, L.; Peng, W.X.; Yu, J.H.; He, J.K.; Jiang, H.S. Temperature and historical land connectivity jointly shape the floristic relationship between Hainan Island and the neighbouring landmasses. Sci. Total Environ. 2021, 769, 144629. [Google Scholar] [CrossRef]
  39. Enmin, R.; Yi, X.; Zhiyun, O.; Hua, Z. Spatial characteristics of soil conservation service and its impact factors in Hainan Island. Acta Ecol. Sin. 2013, 33, 746–755. [Google Scholar] [CrossRef]
  40. Panagos, P.; Karydas, C.G.; Gitas, I.Z.; Montanarella, L. Monthly soil erosion monitoring based on remotely sensed biophysical parameters: A case study in Strymonas river basin towards a functional pan-European service. Int. J. Digit. Earth 2012, 5, 461–487. [Google Scholar] [CrossRef]
  41. Xie, Y.; Yin, S.-Q.; Liu, B.-Y.; Nearing, M.A.; Zhao, Y. Models for estimating daily rainfall erosivity in China. J. Hydrol. 2016, 535, 547–558. [Google Scholar] [CrossRef]
  42. Williams, J.R.; Renard, K.G.; Dyke, P.T. EPIC: A new method for assessing erosion’s effect on soil productivity. J. Soil Water Conserv. 1983, 38, 381. [Google Scholar]
  43. Lin, S.P.; Jing, C.W.; Coles, N.A.; Chaplot, V.; Moore, N.J.; Wu, J.P. Evaluating DEM source and resolution uncertainties in the Soil and Water Assessment Tool. Stochastic Environ. Res. Risk Assess. 2013, 27, 209–221. [Google Scholar] [CrossRef]
  44. Breiman, L. Random Forests. Mach. Learn. 2001, 45, 5–32. [Google Scholar] [CrossRef]
  45. Ang, B.W. Decomposition analysis for policymaking in energy: Which is the preferred method? Energy Policy 2004, 32, 1131–1139. [Google Scholar] [CrossRef]
  46. Ang, B. The LMDI Approach to Decomposition Analysis: A Practical Guide. Energy Policy 2005, 33, 867–871. [Google Scholar] [CrossRef]
  47. Ang, B.W. LMDI decomposition approach: A guide for implementation. Energy Policy 2015, 86, 233–238. [Google Scholar] [CrossRef]
  48. Koulouri, M.; Giourga, C. Land abandonment and slope gradient as key factors of soil erosion in Mediterranean terraced lands. CATENA 2007, 69, 274–281. [Google Scholar] [CrossRef]
  49. Hou, J.; Wang, H.; Fu, B.; Zhu, L.; Wang, Y.; Li, Z. Effects of plant diversity on soil erosion for different vegetation patterns. CATENA 2016, 147, 632–637. [Google Scholar] [CrossRef]
  50. Chen, C.F.; Liu, W.J.; Jiang, X.J.; Wu, J.E. Effects of rubber-based agroforestry systems on soil aggregation and associated soil organic carbon: Implications for land use. Geoderma 2017, 299, 13–24. [Google Scholar] [CrossRef]
  51. Zhu, X.; Yuan, X.; Lu, E.; Yang, B.; Wang, H.; Du, Y.; Singh, A.K.; Liu, W. Soil splash erosion: An overlooked issue for sustainable rubber plantation in the tropical region of China. Int. Soil Water Conserv. Res. 2023, 11, 30–42. [Google Scholar] [CrossRef]
  52. Mu, X.L.; Qiu, J.L.; Cao, B.W.; Cai, S.R.; Niu, K.L.; Yang, X.K. Mapping Soil Erosion Dynamics (1990–2020) in the Pearl River Basin. Remote Sens. 2022, 14, 5949. [Google Scholar] [CrossRef]
  53. Hou, Y.P.; Zhang, M.F.; Liu, S.R.; Sun, P.S.; Yin, L.H.; Yang, T.L.; Li, Y.D.; Li, Q.; Wei, X.H. The Hydrological Impact of Extreme Weather-Induced Forest Disturbances in a Tropical Experimental Watershed in South China. Forests 2018, 9, 734. [Google Scholar] [CrossRef]
  54. Zou, Y.; Wang, Y.; He, Y.; Zhu, L.; Xue, S.; Liang, X.; Ye, C. Soil Erosion Characteristics in Tropical Island Watersheds Based on CSLE Model: Discussion of Driving Mechanisms. Land 2024, 13, 302. [Google Scholar] [CrossRef]
  55. Jin, F.M.; Yang, W.C.; Fu, J.X.; Li, Z. Effects of vegetation and climate on the changes of soil erosion in the Loess Plateau of China. Sci. Total Environ. 2021, 773, 145514. [Google Scholar] [CrossRef] [PubMed]
  56. Wang, H.Q.; Sun, B.P.; Yu, X.X.; Xin, Z.B.; Jia, G.D. The driver-pattern-effect connection of vegetation dynamics in the transition area between semi-arid and semi-humid northern China. CATENA 2020, 194, 104713. [Google Scholar] [CrossRef]
  57. Baiamonte, G.; Minacapilli, M.; Novara, A.; Gristina, L. Time Scale Effects and Interactions of Rainfall Erosivity and Cover Management Factors on Vineyard Soil Loss Erosion in the Semi-Arid Area of Southern Sicily. Water 2019, 11, 978. [Google Scholar] [CrossRef]
  58. Xu, X.J.; Yan, Y.J.; Dai, Q.H.; Yi, X.S.; Hu, Z.Y.; Cen, L.P. Spatial and temporal dynamics of rainfall erosivity in the karst region of southwest China: Interannual and seasonal changes. CATENA 2023, 221, 106763. [Google Scholar] [CrossRef]
  59. Jia, L.; Yu, K.X.; Li, Z.B.; Li, P.; Zhang, J.Z.; Wang, A.N.; Ma, L.; Xu, G.C.; Zhang, X. Temporal and spatial variation of rainfall erosivity in the Loess Plateau of China and its impact on sediment load. CATENA 2022, 210, 105931. [Google Scholar] [CrossRef]
  60. Li, A.; Zhang, X.C.; Liu, B.Y. Effects of DEM resolutions on soil erosion prediction using Chinese Soil Loss Equation. Geomorphology 2021, 384, 107706. [Google Scholar] [CrossRef]
  61. Zhu, P.; Zhang, G.; Wang, C.; Chen, S.; Wan, Y. Variation in soil infiltration properties under different land use/cover in the black soil region of Northeast China. Int. Soil Water Conserv. Res. 2024, 12, 379–387. [Google Scholar] [CrossRef]
  62. Lu, X.D.; Guo, J.C.; Chen, J.D.; Wu, H.; Zuo, Q.; Chen, Y.Z.; Lai, J.L.; Liu, S.D.; Wang, M.Y.; Zhang, P.; et al. Study on Functional Effectiveness of Soil and Water Conservation Measures in Rubber Plantations on Hainan Island. Forests 2024, 15, 1793. [Google Scholar] [CrossRef]
  63. Wu, L.; He, Y.; Tan, Q.; Zheng, Y. Land-use simulation for synergistic pollution and carbon reduction: Scenario analysis and policy implications. J. Environ. Manag. 2024, 356, 120603. [Google Scholar] [CrossRef]
  64. Ma, H.; Wang, H.; Zheng, F. Temporal and Spatial Variations of Vegetation Phenology in the Three Provinces (Regions) of South China from 2001 to 2020. J. Trop. Subtrop. Bot. 2024, 32, 330–338. [Google Scholar]
  65. Li, G.; Kou, W.; Chen, B.; Wu, Z.; Zhang, X.; Yuan, T.; Ma, J.; Sun, R.; Li, Y. Spatio-temporal changes of rubber plantations in Hainan Island over the past 30 years. J. Nanjing For. Univ. 2023, 47, 189–198. (In Chinese) [Google Scholar]
  66. Tan, Z.H.; Zhang, Y.P.; Song, Q.H.; Liu, W.J.; Deng, X.B.; Tang, J.W.; Deng, Y.; Zhou, W.J.; Yang, L.Y.; Yu, G.R.; et al. Rubber plantations act as water pumps in tropical China. Geophys. Res. Lett. 2011, 38, L24406. [Google Scholar] [CrossRef]
  67. Chen, Q.; Fu, R.; Cheng, S.; Qiao, D.; Hu, Z.; Zhang, Z.; Dai, L. Effects of the conversion of natural tropical rainforest to monoculture rubber plantations on soil hydrological processes. J. Plant Ecol. 2024, 17, rtae021. [Google Scholar] [CrossRef]
  68. SL 190-2007; Standards for Classification and Gradation of Soil Erosion. China Water & Power Press: Beijing, China, 2007.
  69. Feng, A.; Qiubo, C.; Guishui, X.; Weifu, L.; Xianhai, Z. Summary on Hydroecological Effects of Artificial Rubber Plantations. Chin. Agric. Sci. Bull. 2010, 26, 359–365. (In Chinese) [Google Scholar]
  70. Li, H. Spatial-Temporal Variation and Driving Factors of Soil Water Erosion in the Upper Reaches of the Yellow River Basin in Recent 40 Years. Master’s Thesis, Lanzhou University, Lanzhou, China, 2022. [Google Scholar]
  71. Hu, H.; Ko, C.; Ma, Y. Characteristics of Soil Erosion and Proposals for Prevention and Control Projects in Hainan Province. Pearl River 2017, 38, 31–33. (In Chinese) [Google Scholar]
Figure 1. Geographical location, altitude, and meteorological stations of the study area.
Sustainability 17 02361 g001
Figure 2. Spatial arrangement of static factors in Hainan Island. (a) Soil erodibility factor; (b) Slope length factor; (c) Slope steepness factor.
Sustainability 17 02361 g002
Figure 3. Monthly mean rainfall erosivity factor from 2003 to 2021.
Sustainability 17 02361 g003
Figure 4. Monthly slope trend of rainfall erosivity factors.
Sustainability 17 02361 g004
Figure 5. Monthly vegetation cover and biological practices factor in Hainan Island, 2003 to 2021.
Sustainability 17 02361 g005
Figure 6. Spatial distribution of tillage practice factor (T). (a) 2003, (b) 2006, (c) 2011, (d) 2016, (e) 2021.
Sustainability 17 02361 g006
Figure 7. Monthly soil erosion modulus for each period.
Sustainability 17 02361 g007
Figure 8. CSLE model validation results. (a) Longtang station; (b) Baoqiao station; (c) Jiaji station.
Sustainability 17 02361 g008
Figure 9. Monthly distribution maps of soil erosion intensity.
Sustainability 17 02361 g009
Figure 10. Variations in the soil erosion modulus by month and the dynamic factors throughout the twelve-month period. The soil erosion modulus was denoted by A; mean soil erosion modulus on a monthly basis was expressed as the A-average; rainfall erosivity factor is represented by R; and vegetation cover and biological measures factors are denoted by B. (a) 2003, (b) 2006, (c) 2011, (d) 2016, (e) 2021.
Sustainability 17 02361 g010
Figure 11. Erosion conditions across various spatial units on Hainan Island. (a) Soil erosion modulus at different altitudes from 2003 to 2021. (b) Soil erosion modulus of different slopes from 2003 to 2021.
Sustainability 17 02361 g011
Figure 12. Land use pattern distribution map of Hainan Island.
Sustainability 17 02361 g012
Figure 13. Relative importance of soil erosion factors.
Sustainability 17 02361 g013
Figure 14. Spatial distribution of rainfall change contributions to soil erosion.
Sustainability 17 02361 g014
Figure 15. Spatial distribution of vegetation change contributions to soil erosion.
Sustainability 17 02361 g015
Figure 16. Driving mechanisms of soil erosion change. Note: rainfall erosivity is denoted by R; vegetation cover and biological practice is denoted by B; soil erosion changes are denoted by ΔA; the contribution of vegetation spatial distribution to soil erosion is denoted by ΔAB; and the contribution of spatial distribution of rainfall to soil erosion is denoted by ΔAR.
Sustainability 17 02361 g016
Table 1. Inventory of data.
DataSourceResolution
Rainfall dataHainan Hydrology and Water Resources Survey Bureau/
MODIS-MOD13Q1 product (provides the Normalized Difference Vegetation Index)NASA (https://ladsweb.modaps.eosdis.nasa.gov/search, accessed on 23 August 2023)250 m
Digital Elevation Model (DEM)Hainan Provincial Bureau of Surveying, Mapping and Geographic Information10 m
Land useData Center for Resources and Environment, Chinese Academy of Sciences (http://www.resdc.cn, accessed on 23 August 2023)30 m
Soil dataWorld Soil Database (HWSD) (https://www.trade.gov/harmonized-system-hs-codes, accessed on 13 January 2021)1000 m
Table 2. B factor assignment table of non-garden land, forest land, and grassland.
TypeValueExplanations
Wet rice field1Benefits related to soil and water conservation are observed through the T reaction
Irrigated land1
Dry land1
Urban building land0.01Similar to land that has 80% FVC
Rural building land0.025Similar to land that has 60% FVC
Other construction land0.01Similar to land that has 80% FVC
Rural road1Similar to land that has 60% FVC
Other important traffic areas0.01Similar to land that has 80% FVC
Waterbody and hydrological infrastructure0
Other land0
Table 3. Assessment criteria for monthly soil erosion changes by B and R factors.
A A B A R Description
+++Heightened soil erosion resulting from the combined effects of the B factor and the R factor (IEBR)
+Heightened soil erosion resulting from the B factor alone (IEB)
+Heightened soil erosion resulting from the R factor alone (IER)
Diminished soil erosion resulting from the combined effects of the B factor and the R factor (DEBR)
+Diminished soil erosion resulting from the B factor alone (DEB)
+Diminished soil erosion resulting from the R factor alone (DER)
Note: “+” means greater than 0; “−“ means less than 0.
Table 4. Average rainfall erosivity across each month of the year (Unit: MJ·mm·hm−2·h−1·month−1).
Month/Year20032006201120162021AverageStandard Deviation
January24.3522.9723.9325.0330.3825.332.92
February45.3650.6954.1051.5951.1850.583.20
March91.2593.17112.64113.53111.44104.4111.18
April346.76328.99337.31335.15347.35339.117.87
May1152.921080.971092.081102.84972.691080.3066.15
June1469.091303.311165.091226.211138.211260.38132.83
July1773.391959.031672.661879.471943.511845.61121.16
August2391.261975.332163.332180.592527.652247.63214.94
September2418.242606.352350.082388.662480.672448.80100.76
October1839.351662.882134.322134.152024.451959.03204.76
November475.28432.78433.09490.23491.29464.5329.53
December92.88117.37257.83168.48166.69160.6563.26
Table 5. Topographic factor classification of Hainan Island.
LevelAltitude/mDegree of Slope
1<100 mFlat slope
2100~300Gentle slope land
3300~500Ground of slope
4500~800Steep slope
5800~1000Sharp steep slope
6>1000Dangerous slope land
Disclaimer/Publisher’s Note: The statements, opinions and data contained in all publications are solely those of the individual author(s) and contributor(s) and not of MDPI and/or the editor(s). MDPI and/or the editor(s) disclaim responsibility for any injury to people or property resulting from any ideas, methods, instructions or products referred to in the content.

