1. Smart Resource Management in the Context of the Energy Transition
The climate crisis and current global energy challenges highlight the urgent need to transition to more sustainable energy generation systems. Dependence on fossil fuels not only generates high economic costs but also intensifies environmental and social impacts, putting sustainable development at risk [
1]. In this context, during the various Conferences of the Parties (COP) on climate change, the importance of expanding energy generation from renewable sources with low greenhouse gas (GHG) emissions, such as solar and wind power, has always been highlighted in order to mitigate the effects of climate change [
2].
In this way, the energy transition has emerged as a vital strategy that goes beyond replacing fossil fuels. This change encompasses the modernization of energy generation and management practices, integrating advanced technologies that optimize efficiency, reduce losses, and promote the responsible use of natural resources [
3]. Digitalization plays a central role in this process by enabling the development of intelligent systems that support the creation of advanced electricity grids, efficient energy storage, and resilient operation in adverse conditions [
4].
The advancement of Industry 4.0 technologies, such as Automation, the Internet of Things (IoT), and Cloud Computing, has accelerated this transformation. These technologies enable the efficient monitoring, integration, and optimization of renewable energy sources, transforming conventional electrical systems into smarter, interconnected grids [
5]. Furthermore, the integration of secure technologies, particularly in ecologically sensitive regions like the Amazon, is crucial for enhancing the adoption of renewable energy sources, contributing to a reduced carbon footprint and improved energy resilience [
3].
Among these renewable energy sources, photovoltaic energy has gained prominence due to rapid technological advances, cost reduction, and broad global adoption [
6]. In Brazil, this trend has been intensified by public policies that have reduced taxes on photovoltaic equipment, making it more accessible and expanding installed capacity across the country [
7]. However, studies show that the efficiency of Photovoltaic Systems (PVSs) is influenced by environmental variables such as temperature, humidity, dust, and solar radiation, which directly affect the performance and durability of photovoltaic modules [
8,
9] and impact energy conversion and operational costs [
10].
Overheating of photovoltaic modules is one of the main challenges for operation and energy efficiency in PVS, as it can reduce generated power and even cause severe failures like fires [
11]. Studies indicate that cooling systems can reduce module temperatures by up to 22 °C, significantly increasing generation efficiency [
12]. Additionally, humidity is another critical factor directly affecting module durability, causing corrosion and compromising system performance [
9]. Therefore, simultaneously monitoring temperature and humidity is essential for implementing preventive strategies and improving system longevity [
9].
Remote monitoring solutions enabled by IoT are indispensable for reducing maintenance costs and improving PVS operation. The ability to monitor operational conditions in real time through digital platforms allows for quick fault identification and reduces the need for frequent manual interventions [
13]. Moreover, the adoption of self-sustainable and low-cost systems enables broader access to these technologies in remote regions, promoting greater energy inclusion and sustainability [
14].
In this context, this study presents the design and implementation of an IoT embedded system to monitor temperature and humidity in PVSs in the Amazon region. Low-cost temperature and humidity sensors and a development module with the ESP32 microcontroller were used for this purpose. Among the system’s embeddedfunctionalities is the ability to remotely update its code via Over-the-Air (OTA) and send data using the Message Queuing Telemetry Transport (MQTT) protocol. In addition, the measured data are sent to be stored and visualized in an IoT middleware that allows real-time monitoring. Notably, the embedded system was implemented in a photovoltaic solar plant located in the Amazon region.
The main contributions of this work include:
Development and implementation of an IoT embedded system for temperature and humidity monitoring: The development and implementation of an IoT-based embedded system were carried out to monitor temperature and humidity in photovoltaic systems.
Use of efficient and low-cost technologies: The developed system uses low-cost components, such as temperature and humidity sensors, the ESP32 microcontroller development module, and a photovoltaic energy module, making the solution accessible and feasible for implementation in remote areas, such as the Amazon region.
Implementation of OTA communication and MQTT protocol: The OTA technique, which allows remote code updates, was used to communicate with the embedded system. The MQTT protocol, considered the IoT protocol, was used to send data.
Dojot IoT middleware: The open-source IoT middleware platform Dojot was used to store and visualize the collected data, enabling data centralization and real-time monitoring.
Field test results: The created embedded system was installed in a PV system in the Amazon region to test it, and the test results are presented in this work.
Applicability in remote regions: The solution was designed to be applied in hard-to-access areas where the maintenance and monitoring of photovoltaic systems are challenging. This demonstrates the potential for replicating the solution in other regions with similar characteristics, expanding access to renewable and sustainable energy.
Contribution to sustainable practices: The proposed system introduces intelligent and self-sustaining monitoring. Additionally, it can optimize photovoltaic systems’ efficiency and reduce the need for frequent manual interventions, minimizing the environmental impact associated with maintenance visits. This approach also promotes system longevity, aligning with sustainable practices and Sustainable Development Goals (SDGs), specifically SDG 7 (Affordable and Clean Energy) and SDG 13 (Climate Action).
The work is organized as follows:
Section 2 presents related works on IoT embedded monitoring systems;
Section 3 describes the construction of the proposed embedded system;
Section 4 shows the obtained results;
Section 5 outlines the authors’ conclusions;
Section 6 points out future works, and finally, Abbreviations section lists the abbreviations and symbols used in the paper.
2. Related Works: IoT Monitoring Systems
There are some traditional and simple methods for monitoring PV, such as the RLC circuits method, presented in the work [
8]. However, with the digitalization of the electricity sector, new approaches have been emerging in the literature through the use of smart IoT embedded systems, as will be described below.
The integration of embedded systems in photovoltaic plants has been highlighted in the literature as an essential tool for the efficient, accurate, and robust monitoring of the solar energy generation environment [
15]. These systems enable reduced operational costs, improved energy efficiency, and increased equipment durability [
16], directly contributing to sustainability and the advancement of energy management practices.
In the work presented in [
17], an embedded system was developed for fault diagnosis in solar modules through real-time infrared image analysis. Using convolutional neural networks, the system was able to detect and diagnose problems with high accuracy, demonstrating the potential of integrated artificial intelligence for advanced photovoltaic module monitoring.
Another notable example is the study in [
15], which developed an embedded system to monitor the temperature at different points on the photovoltaic modules, exclusively during periods of solar illumination. This system, powered by a photovoltaic module, also incorporated remote control, excelling in the thermal management of the modules. It is worth noting that the module developed in [
15] served as the basis for the system presented in this work. While they share some similarities, such as monitoring at three strategic points (module surface, shaded area, and ambient temperature), the new version of the system presents improvements over the previous version. Among the improvements made, the following stand out:
- -
Expanded monitoring scope: the inclusion of humidity as a variable;
- -
Improved IoT communication: the centralization of data in the IoT middleware Dojot, allowing more efficient storage, visualization, and retrieval of information;
- -
Hardware improvements: the use of a Printed Circuit Board (PCB) to reduce signal interference and the creation of a case to enhance the thermal insulation of the thermistor;
- -
Measurement validation: the validation of ambient temperature was performed using two types of sensors, the DHT11 and NTC thermistor, providing higher accuracy in the obtained data.
These advances and improvements resulted in approximately 45.45% of the functionalities used being new to this version compared to the previous version of the embedded system in the work [
15].
Table 1 lists the innovations of this module and compares the two versions.
Other works have also explored complementary aspects of thermal monitoring. One paper [
18] describes a predictive model based on electrical, thermal, and optical parameters, highlighting the importance of integrated analysis to prevent the manipulation of photovoltaic modules. In [
19], the scalability of thermal monitoring using catadioptric devices and mathematical models was investigated, allowing the identification of faulty modules on a large scale. Additionally, the work in [
20] used the Grafana platform for data visualization gathered by an IoT sensor network connected to an ESP32, demonstrating an economic system forecast for remote monitoring in smart grids.
In terms of fault diagnosis in photovoltaic modules, the study in [
21] investigated variations in parameters such as current, consumption, solar irradiance, and cell temperature. This system, based on low-cost devices with a web interface, allowed for remote identification of faults such as shading, short circuits, open circuits, and dirt accumulation. Regarding dirt, the authors of [
9] conducted a comprehensive analysis of the physical and chemical composition of dust particles and their impact on photovoltaic module efficiency, emphasizing the importance of environmental monitoring in vulnerable regions.
While [
15,
19,
20] used the ESP32 microcontroller for low-cost applications and [
15,
21] investigated the effects of temperature on photovoltaic cells, our work presents significant distinctions and additional contributions:
- -
Simultaneous monitoring of temperature and humidity: Unlike [
15,
19,
20,
21], our system integrates temperature and humidity monitoring in a single device, using NTC and DHT11 sensors. This approach allows a more comprehensive analysis of the environmental variables affecting photovoltaic module performance.
- -
Data centralization in IoT middleware: Differing from [
20], which used a simpler approach for visualization, we used the IoT Dojot platform to centralize, visualize, and store data robustly, offering scalability and integration with other devices.
- -
Sustainability and applicability in remote areas: The developed embedded system was specifically designed for the Amazon region, addressing climatic and logistical challenges. Thus, with the inclusion of a self-sustaining photovoltaic energy module and remote update capability via OTA, it provides adaptability that is absent from [
20,
21].
- -
Field validation: We conducted tests at a photovoltaic plant in the Amazon, highlighting the system’s robustness under adverse weather conditions. This experimental aspect reinforces the practical applicability of the solution.
- -
Environmental impact reduction: The integration of IoT technologies and efficient communication resources like MQTT reduces the need for on-site maintenance, lowering operational costs and carbon footprint, which differentiates our work from previous studies.
It is also noteworthy that the literature review presented in this work served as theoretical foundation and justification for the three monitoring points chosen. Accordingly, we selected these three points for the following reasons, with reference to studies [
8,
9,
22,
23,
24,
25]:
- (i)
Exposed surface: The temperature of the modules in photovoltaic systems directly impacts their energy generation performance, as module efficiency decreases with increasing temperature. By installing sensors on the module surface, more accurate temperature data can be obtained, facilitating studies and analyses of the temperature generation relationship.
- (ii)
Shaded area: The shaded area generated by photovoltaic panels installed on the ground directly influences temperature reduction (during the daytime) and humidity increase at the site. These factors, combined with the bioclimatic characteristics of the Amazon region, contribute to more vegetation development in areas where the photovoltaic panels are installed. This, in turn, demands more maintenance regarding vegetation cleaning around the panels (thus increasing maintenance costs) and directly impacts the lifespan of components (structure and panels) due to increased humidity.
- (iii)
Ambient temperature: The Amazon region has many “microclimates”. Therefore, measuring temperature and humidity locally where the photovoltaic system is installed better reflects the real conditions. This enables the generation of more precise data for subsequent study and analysis of the relationship between humidity, ambient temperature, module temperature, shaded area temperature, and energy generation.
The literature also reinforces the importance of sustainable, low-cost technologies that minimize frequent component replacement and reduce the consumption of natural resources [
16,
17]. Thus, this work not only complements existing studies but also contributes to sustainable practices in photovoltaic system monitoring.
3. Building an Embedded System
In the present work, an IoT embedded system was developed with the aim of measuring the temperature (at three different points of interest) and humidity in Photovoltaic Systems (PVSs). The system is composed of a hardware component and a software component, which will be presented below.
3.1. Hardware Development
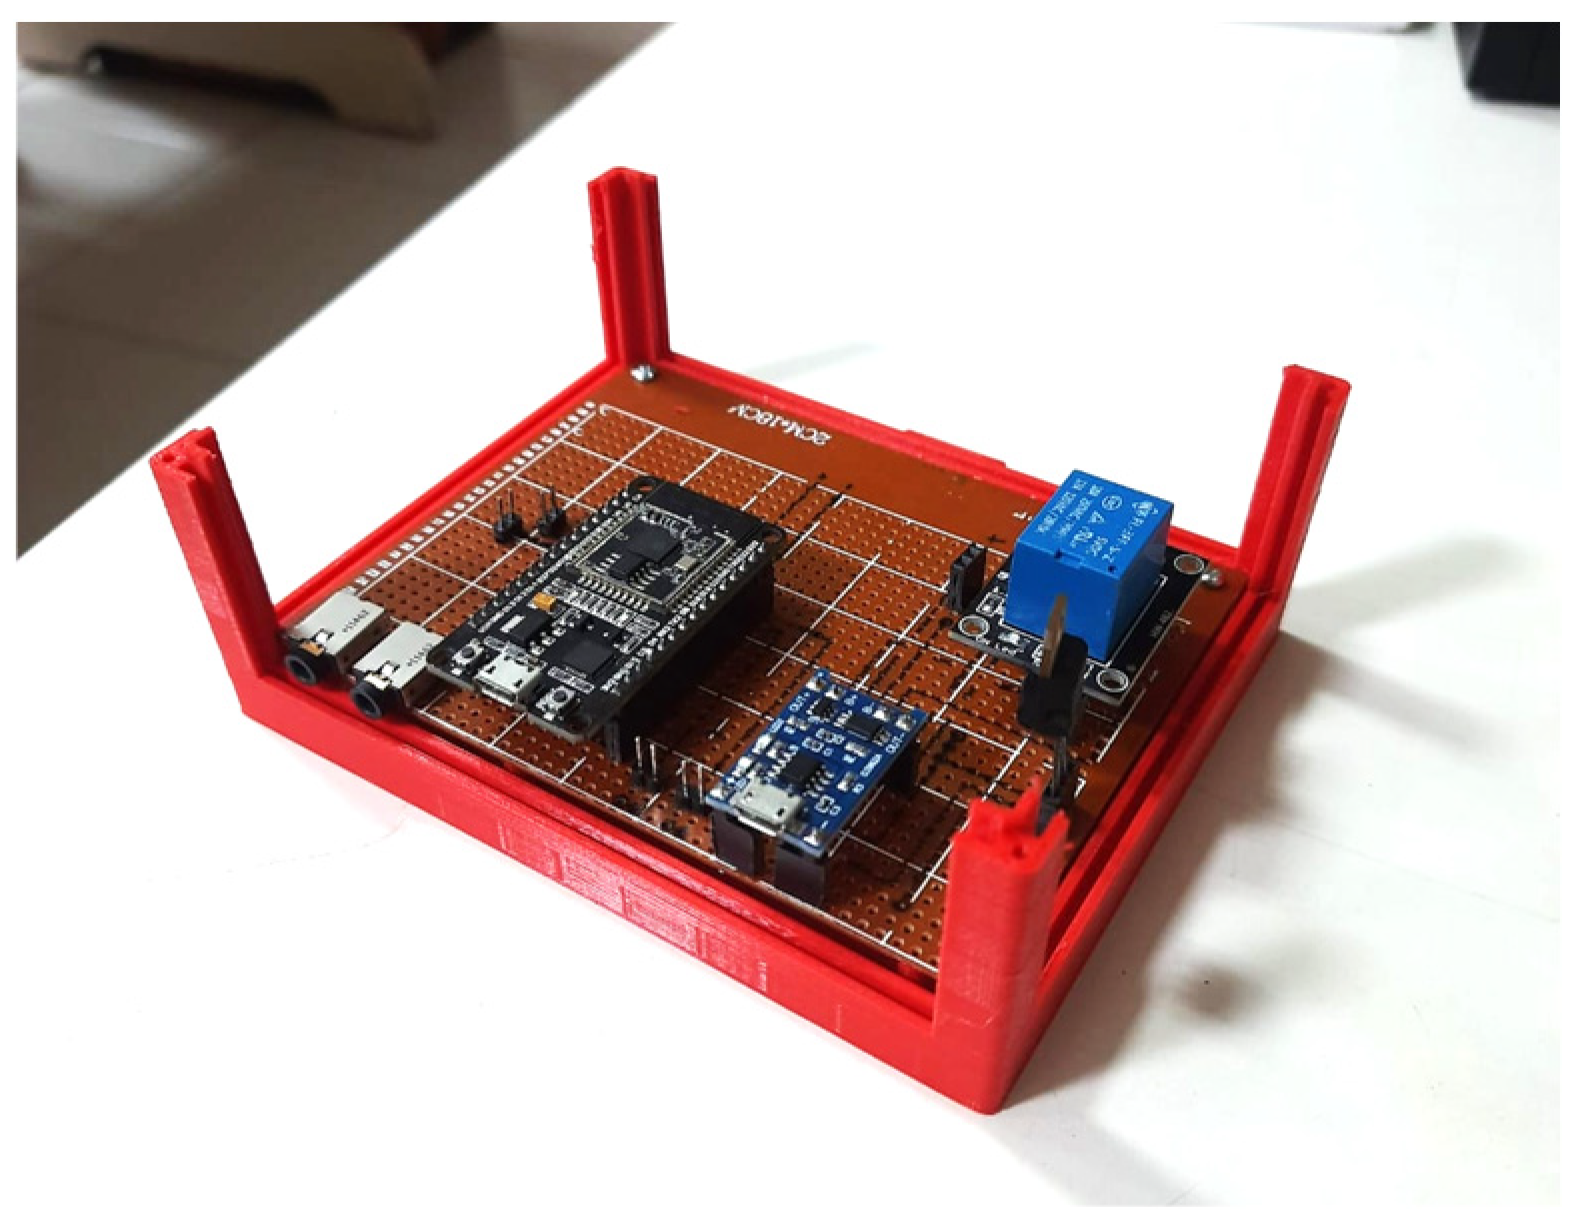
Regarding the hardware component of the developed embedded system, it consists of a power supply system, sensors, and a microcontroller. The main components of the power supply system of the embedded system include a lithium battery, a relay, a Light Dependent Resistor (LDR) sensor, and a charging module (TP4056). It is worth noting that the LDR sensor was added to optimize the activation of the monitoring mode of the embedded system. This way, it operates only during the day, as solar energy generation mainly occurs in daylight hours. The embedded system also features Negative Temperature Coefficient (NTC) temperature sensors for thermal measurement at different points of the photovoltaic system modules. Additionally, the DHT11 sensor was chosen to measure the humidity and temperature of the region. All sensors are connected to the ESP32 microcontroller (Espressif, Shanghai, China).
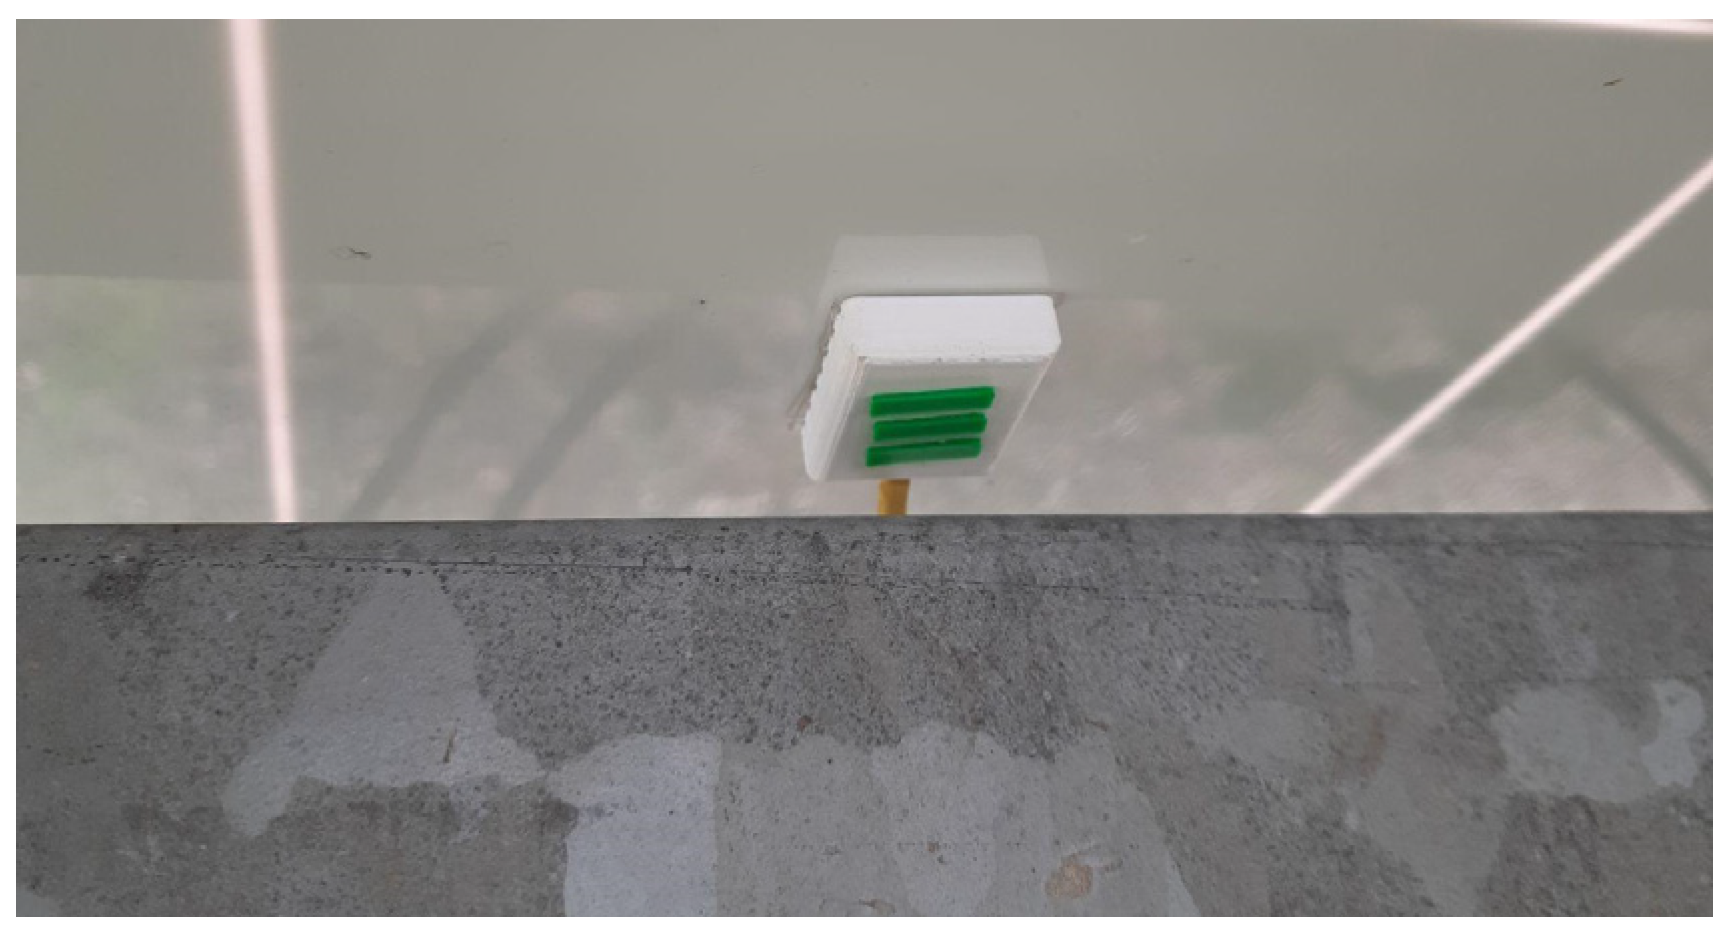
Figure 1 illustrates the developed embedded system.
The choice of components for this system prioritized low-energy-consumption technologies, such as the ESP32 microcontroller, which combines efficiency and robust connectivity [
26]. This decision aligns with eco-friendly design practices, which aim to minimize energy consumption and maximize operational efficiency, thus promoting a more sustainable solution [
27].
The ESP32 microcontroller was chosen for its Wi-Fi and Bluetooth connectivity capabilities. This microcontroller is equipped with a dual-core Xtensa LX6 32-bit CPU, capable of operating at up to 240 MHz, and includes programmable input/output peripherals that require a 3.3 V power supply [
26]. At all stages, the module coding was conducted in C using the open-source Arduino IDE software 1.8.16. The components of the developed embedded system are described below in
Table 2.
It is noteworthy that the aim was to use easily accessible and low-cost electronic components, as this helps in reducing maintenance costs and ensures greater market adherence due to the use of established devices. Additionally, it facilitates large-scale production.
It is also noteworthy that the cost to produce one module of the embedded system in this study, considering all its hardware components, is approximately BRL 588.77 (five hundred and eighty-eight reais and seventy-seven cents) in Brazil, which is equivalent to approximately USD 97.24 (ninety-seven dollars and twenty-four cents). As production volume increases, fixed costs are spread out, and the cost per unit tends to decrease due to factors such as bulk purchasing, production process optimization, and supplier negotiations. As such, based on the initial cost, if the system were to be produced on a large scale, it would incur the following costs:
- -
For 1000 units, the cost per unit would be approximately BRL 500.45 (USD 90.99).
- -
For 10,000 units, the cost per unit would be approximately BRL 382.70 (USD 69.58).
- -
For 50,000 units, the cost per unit would be approximately BRL 294.39 (USD 69.58).
These estimates depend on factors such as supplier negotiations, production optimization, logistical costs, and the exchange rate.
3.1.1. Sensing Module
The following section will describe the sensing modules used in the embedded system.
The embedded system consists of three thermal sensors connected to the ESP32 analog pins, with their data stored in input variables, processed, and sent via the MQTT communication protocol to the Dojot platform.
To monitor temperature, an NTC thermistor was used, a sensor designed to control the temperature of a device through changes in its electrical resistance, which decreases as the temperature increases. According to its datasheet [
28], the NTC thermistor MF52 operates within the temperature range of −40 °C to 125 °C, with 25 °C being its zero-resistance point.
This semiconductor sensor was used at different points to monitor the temperature of the photovoltaic module, namely: the surface of the photovoltaic module in contact with sunlight, the surface shaded by the photovoltaic module, and the ambient temperature. These three points were chosen for the reasons listed and explained in
Section 2 of the Related Works, which are summarized as follows: (i) Exposed surface: The temperature of the modules in photovoltaic systems directly impacts their power generation performance, since the module’s efficiency decreases as the temperature increases. (ii) Shaded area: The shaded area generated by the photovoltaic panels installed on the ground directly influences the reduction in temperature (during the day) and the increase in humidity at the site (iii) Ambient temperature: The Amazon region has many areas of “microclimates. Thus, measuring the temperature and humidity in loco at the location where the photovoltaic system is located more faithfully reflects the reality at the site (
Figure 2).
To calculate the temperature, the Steinhart–Hart Equation (1) was used. This equation relates the temperature to the variation in resistance at the output of the thermistor voltage divider [
29]. It is worth noting that this equation was important for calibrating the sensors in the laboratory.
where
T is the temperature in Kelvin;
R is the resistance of the thermistor, which varies with temperature;
and β are fixed values, determined according to the thermistor and the coefficient of the linear logarithmic term, which is responsible for relating resistance and temperature;
is the coefficient of the cubic logarithmic term, used to adjust the curve of the relationship between resistance and temperature, ensuring greater precision.
The constants
,
β, and
C vary depending on the type of material, its construction, and the operating temperature range of each thermistor. When the temperature range of interest is narrow and there are few non-linear deviations, the parameter
C can be considered null. In the case of the NTC thermistor, this consideration is valid, because its temperature range is relatively narrow and close to the reference point of 25 °C. In this way, it is possible to minimize nonlinear deviations in the resistance–temperature curve. Therefore, the equation starts to consider only the parameter
β, as in Equation (2), reducing the processing required to calculate the temperature.
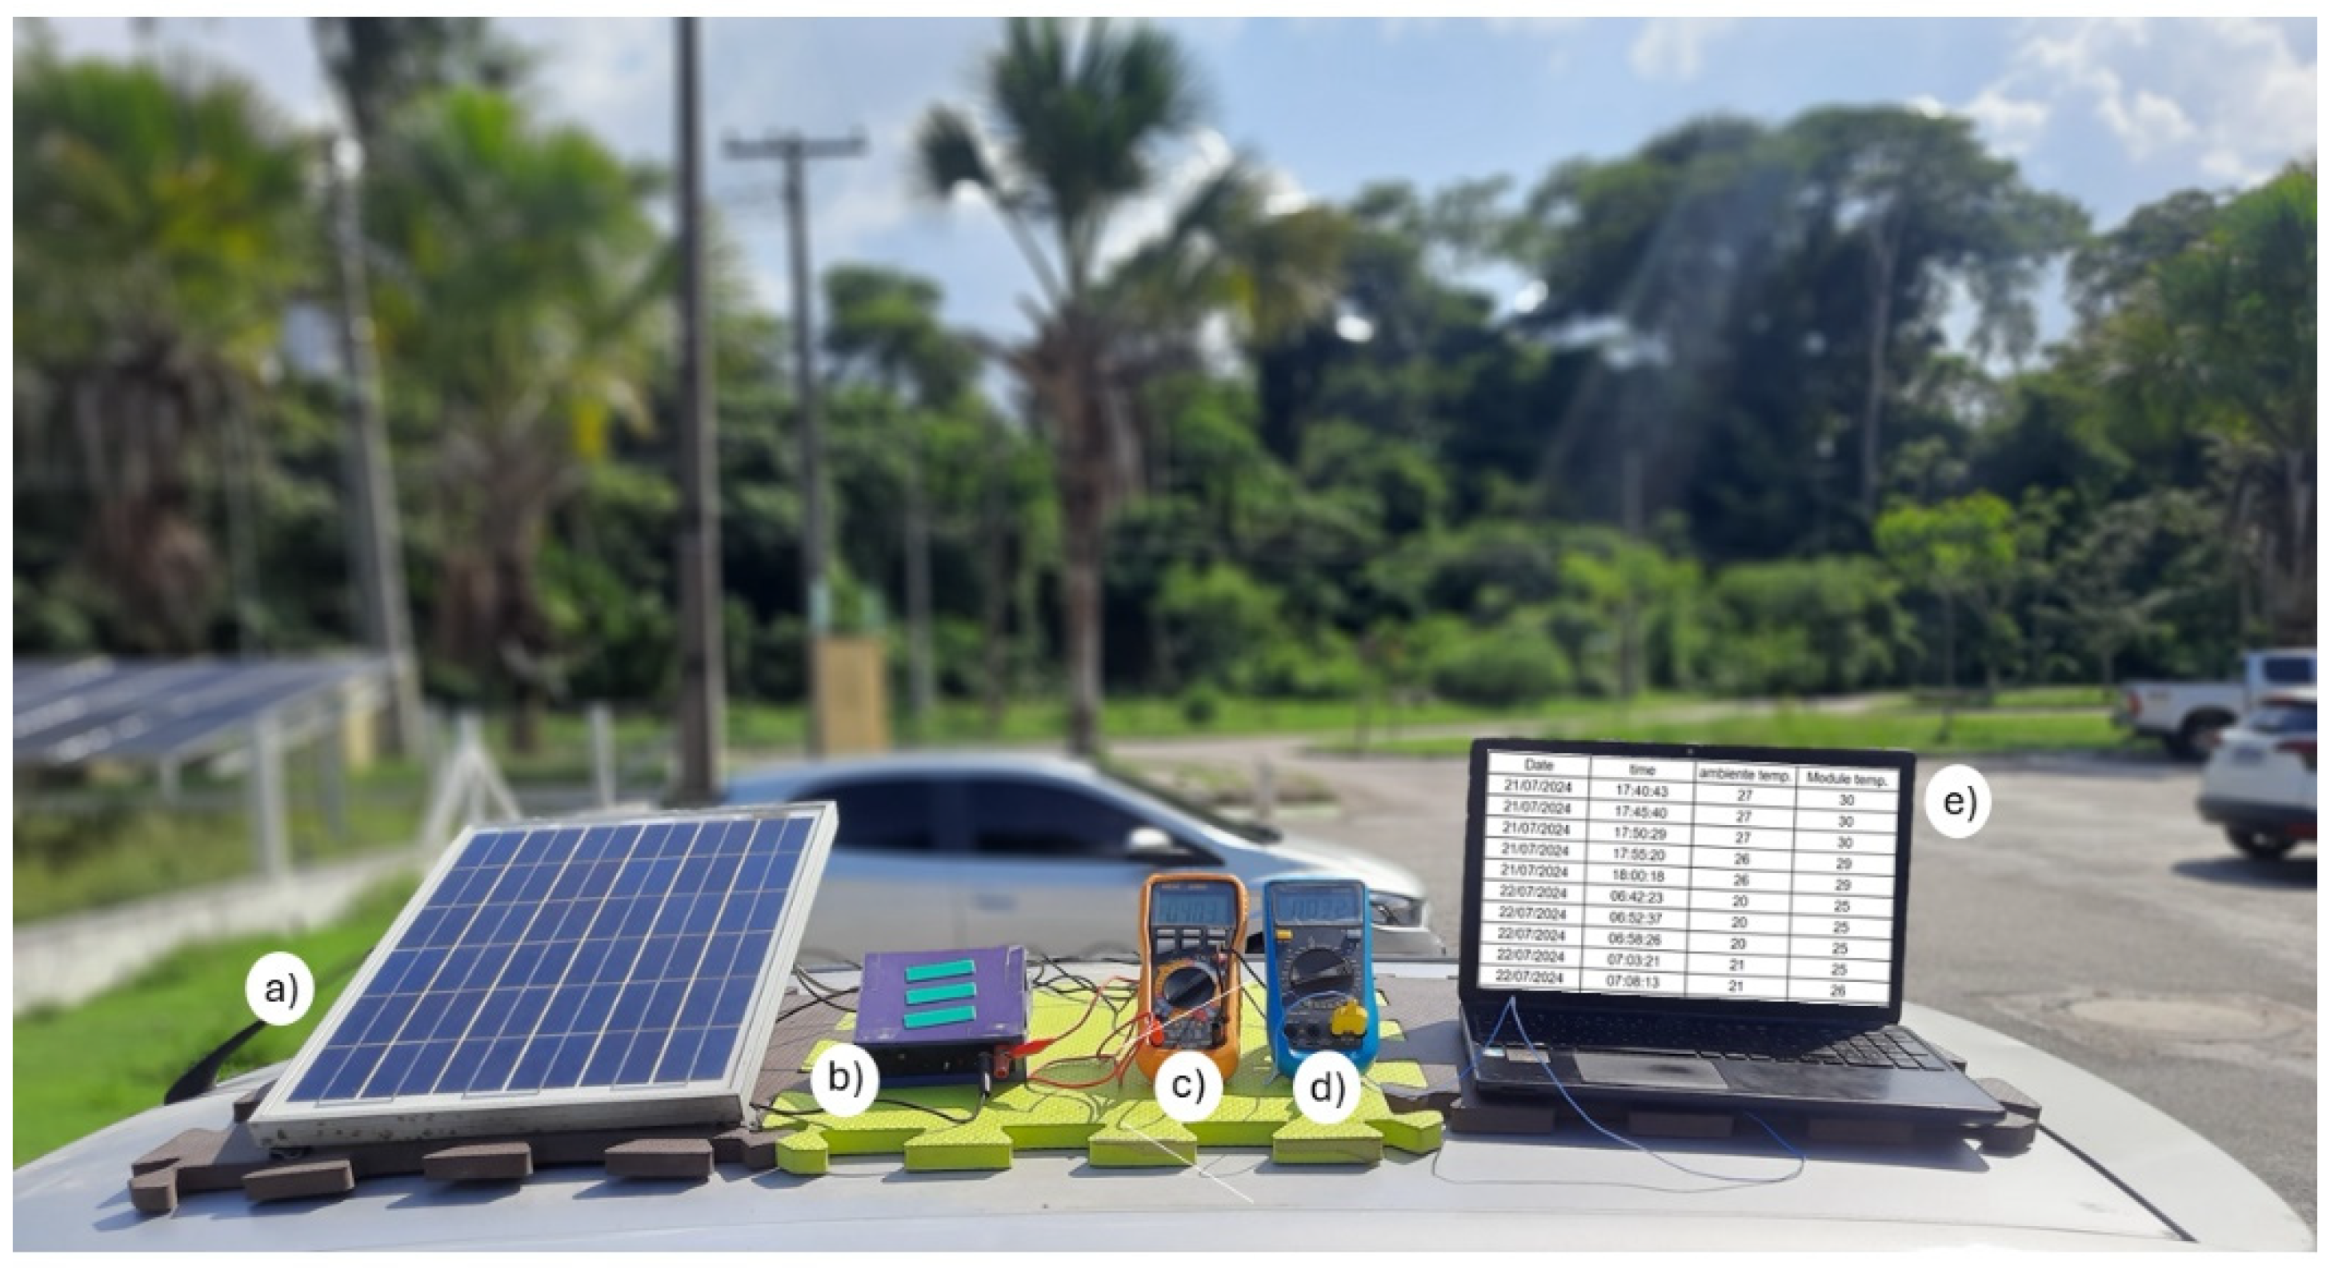
Next, cross-validation of the values obtained from the calibrated sensors was performed using a reference multimeter connected to a thermocouple, as shown in
Figure 3. Additionally, the ClimaTempo platform [
30] was used to obtain temperature and humidity data from the region, contributing to the calibration and verification of the sensors’ accuracy under real operational conditions.
The DHT11 sensor was chosen to check the climatic conditions of the photovoltaic plant for the humidity and ambient temperature parameters. It is known that humidity directly interferes with the thermal sensation of the location [
31]. Therefore, it becomes important to monitor this variable during the day. In addition, the temperature measured by this sensor can be compared with an NTC sensor, which performs the same function. Therefore, it is a comparison datum, in case one of the sensors deviates from the average between them. The sensor connections are shown in
Figure 4.
3.1.2. Automatic Drive Module
The automatic activation module is responsible for activating the on-board system during the daytime, that is, when sunlight hits the photovoltaic system modules. In this way, automatic activation control through sensors contributes to improving the health of the battery, as well as increasing its autonomy, through two markers: the LDR sensor and the power supply system.
The LDR sensor varies its resistance depending on the light intensity reached on the surface, which was chosen to determine the moment when the NTC (Negative Temperature Coefficient) sensors begin thermal monitoring, which must coincide with the generation period. In this way, the 5 V relay can supply electrical power to the temperature-sensing module during the established period without the need for manual intervention from an external source. This automates the process. The automated circuit is described in
Figure 5.
The activation of the LDR sensor determines the relay activation period based on the level of the signal sent, turning the power supply on or off based on the light intensity of the sun. In addition, due to the variation in energy generation, due to the photovoltaic module of the power supply system, a PNP transistor was implemented to control the activation, together with the power supply. In this way, the system starts to present a more suitable and stable voltage level for the electronic components that make up the embedded system.
3.1.3. Power Module
The electrical energy of the embedded system is generated from a 12 V photovoltaic module from the manufacturer Resun (Aarau, Switzerland) [
32], similar to the one shown in
Figure 6. The electrical energy generated by this module is sufficient to charge the battery and power the other components during the day. The use of a photovoltaic module to power the system not only ensures self-sustainable operation but also exemplifies the use of clean and renewable energy [
33]. This approach not only keeps the system running continuously in remote areas but also reinforces the viability of energy-sustainable solutions for environmental monitoring [
34].
However, since the ESP32 microcontroller, sensors, and battery do not support the 12 V voltages provided by the external source, it was necessary to use an LM317T voltage regulator [
35] to provide 5 V to the electronic system. In addition, the TP4056 charging module [
36] was chosen to manage the charge and discharge of the battery and the external source. This management module contains protections against overloads and is easy to remove, thus contributing to the maintenance of the embedded system and to the safety of the charging. The chosen components are shown in
Figure 7.
3.1.4. Integrated Circuit Design
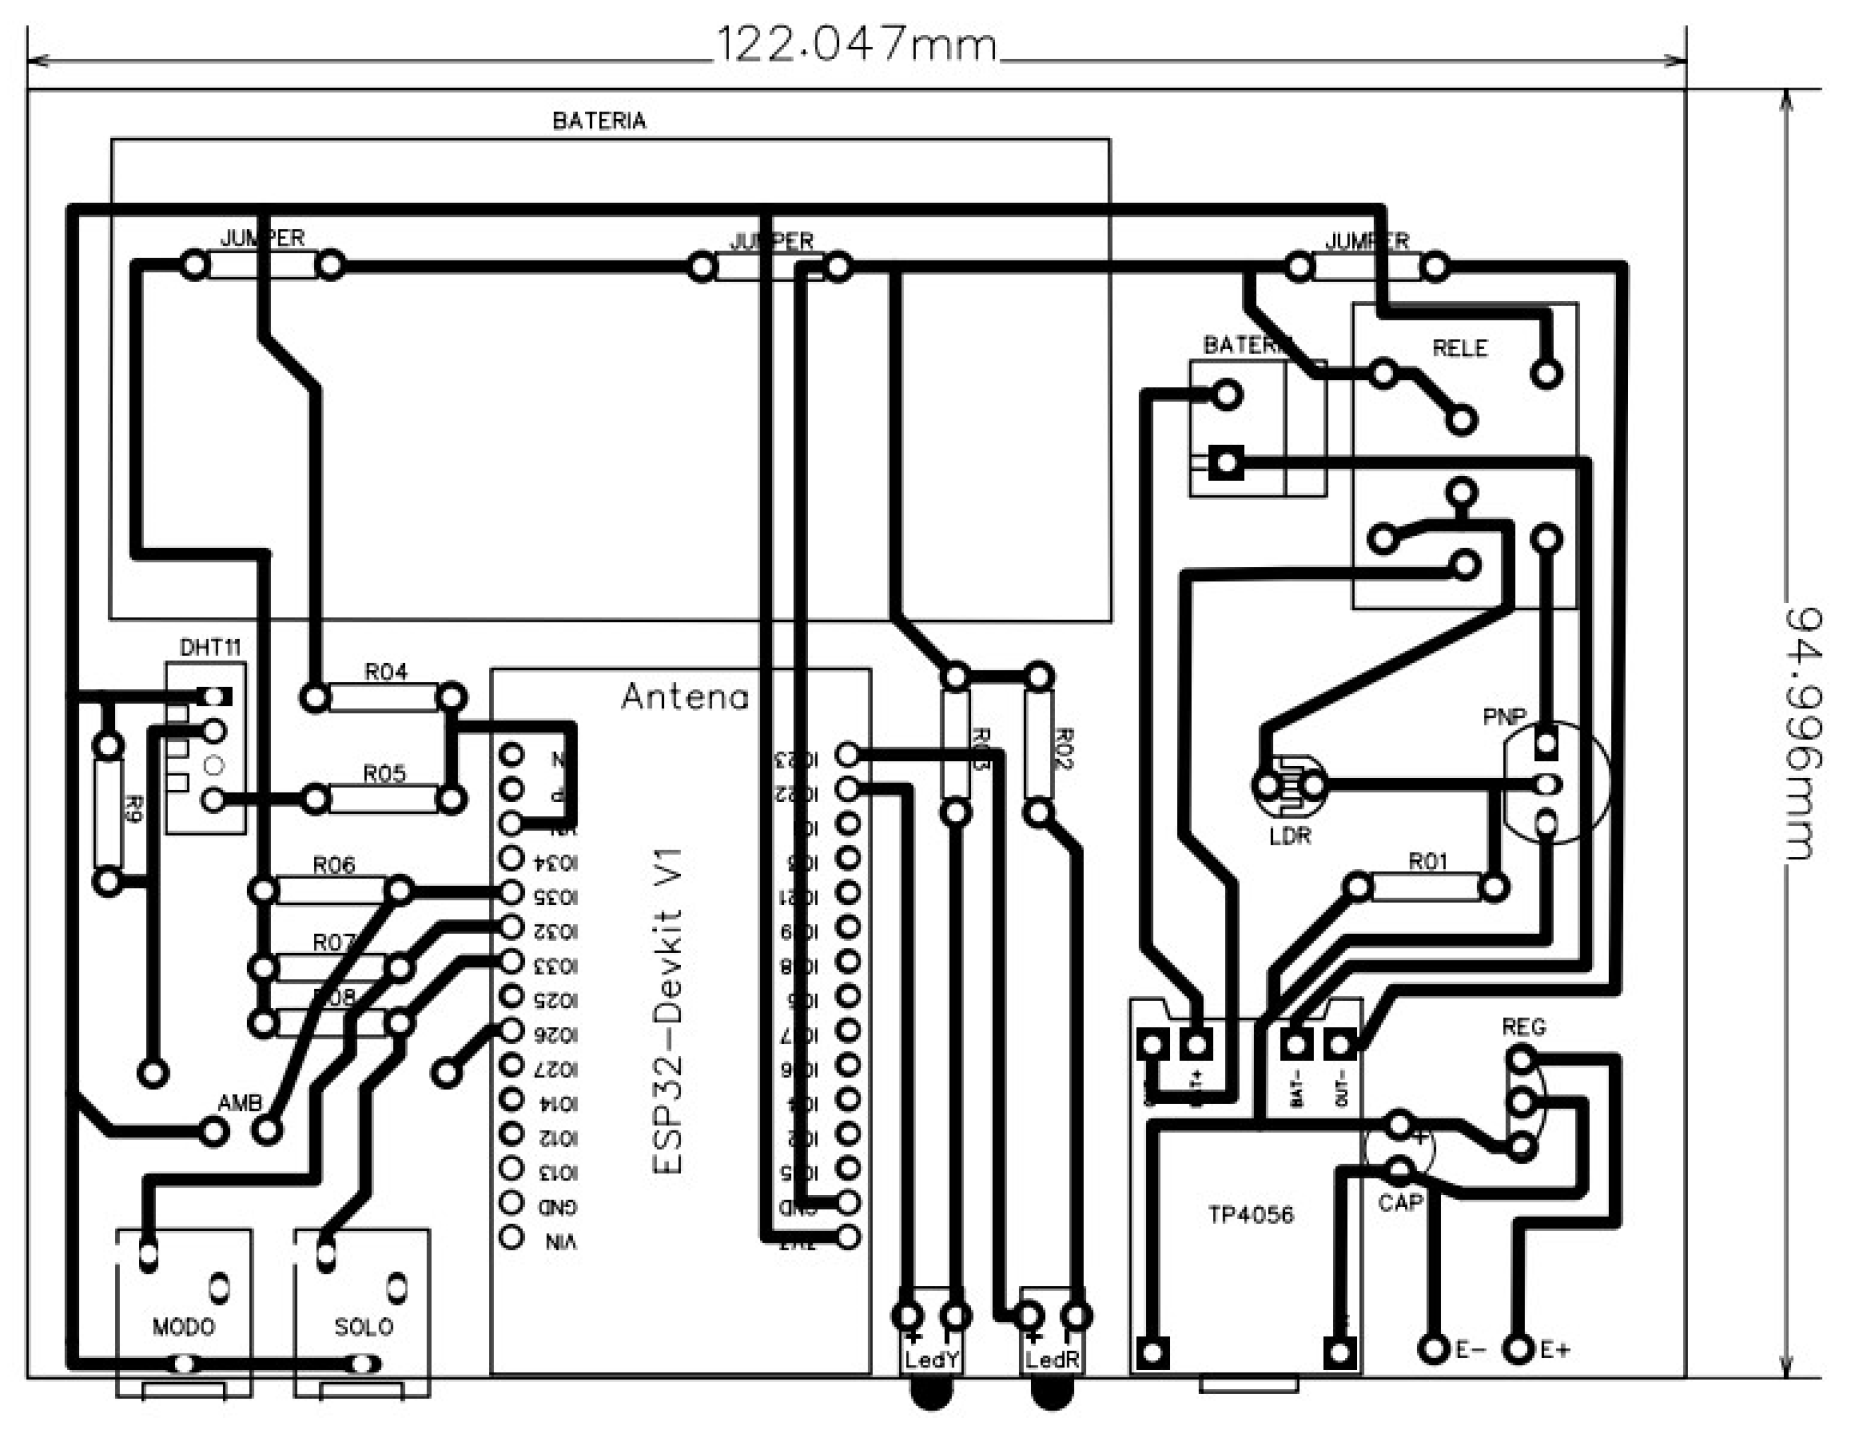
The complexity of integrating several electronic devices into an embedded system created the need to design a circuit for a Printed Circuit Board (PCB). To do this, we used the EasyEDA 6.5.39 software through a free account, by which it was possible to find all the components used in the embedded system and design the tracks more accurately. The complete circuit schematic can be seen in
Figure 8.
3.1.5. Case Wrappers
Since the electronic circuit of the embedded system is fragile and has many components, external interference can compromise data reading or even completely damage the system. To avoid this, a structure was built to protect and shelter the embedded system from dust and water. To do this, the SpaceClaim 2021 design software was used via a student account, which enabled the 3D modeling of the case at a compact size. The modeling of the developed case can be seen in
Figure 9.
The modeled case features the colors green and blue, referring, respectively, to the colors of electrical engineering and sustainability. The three green stripes were inspired by the designer of the name CEAMAZON, which emphasizes the words: Excellence, Efficiency and Energy.
It was decided to model a case for the temperature sensor due to a problem reported in the article by [
33] whereby the thermal effect on the photovoltaic modules creates masses of heat around them that contribute to reduced performance in different environments. Therefore, the best way to place the NTC MF52 temperature sensor in contact with the photovoltaic module was sought. For this, the case was modeled so that there is more contact and adhesion between the case, the sensor, and the lower surface of the photovoltaic system module. This facilitates the installation of the temperature sensor and the embedded system and results in a less invasive embedded system. For the modeling, the SpaceClaim software was used. The modeling followed the same protocol and inspiration as the previous model. The 3D model is shown in
Figure 10.
3.2. Communication Development
The communication flow present in the embedded system consists of connecting the information from the sensing module to technologies that allow the operator to send, request, update, store, and view data in real time. Thus, the microcontroller was connected to a middleware, which allows bidirectional flow and data storage. In addition, it is possible to view the measured data through a Graphical User Interface (GUI). The Over-the-Air protocol was also used for remote calibration of the sensors. Centralized and automated monitoring reduces the need for frequent field visits, which in turn minimizes fuel consumption and CO
2 emissions associated with the movement of technical teams [
14]. This factor is particularly relevant in hard-to-reach regions, where logistics operations can have a considerable environmental impact.
Figure 11 shows the data flow between the embedded system layer and the communication layer.
3.2.1. Middleware
The centralized data from the temperature and humidity sensors are temporarily stored in the ESP32 at each reading cycle. Subsequently, these data are sent to an IoT middleware, which corresponds to the intermediate software layer, to be persisted. This ensures data security, reducing the risk of sample loss. In addition, this middleware facilitates communication and application scalability and allows for better information management [
37].
To control the flow, storage, and request of data, we decided to use Dojot, a Brazilian open-source IoT platform that offers a complete set of tools and services for integrating and managing device data [
38]. To do this, it was initially necessary to deploy a Docker container, and the use of a Linux operating system is recommended. During the configuration in Dojot, it is important to define the storage period for the data, since by default, the system retains information for only seven days. Thus, Dojot was customized for this work to retain data for up to 100 years.
Next, it was necessary to configure the environmental variables, define the devices, and create the topics to receive the data measured by the embedded system sensors. In total, six topics were created for the following variables: humidity, reference temperature, ambient temperature, shaded temperature, upper module temperature, and battery charge.
To transmit the variables from the embedded system to the middleware, the IoT MQTT communication protocol was used. This protocol allows efficient and reliable message exchange in networks with limited resources. Using the publish/subscribe model on topics, devices can publish messages on specific topics, while other devices subscribed to these topics receive the messages in real time [
38].
Data storage is essential for temperature and humidity monitoring of photovoltaic modules, allowing the verification of these variables in the long term. To this end, Dojot uses MongoDB, a NoSQL database. Dojot’s History service was also used to store and manage historical data from the embedded system, thus offering a robust and scalable solution for handling large volumes of data from IoT devices and facilitating analysis.
It is possible to export the data stored in Dojot by requesting a file in CSV or HTML format for a given period. The same process can be conducted via the terminal, requesting the data from the History module and storing the terminal output in a JSON (JavaScript Object Notation) file. It is worth mentioning that for this work, the entire data flow, from the embedded system to Dojot, was conducted in JSON format, which facilitated the reading and writing of data for the exchange of information.
In addition, Dojot offers a GUI for viewing the monitored data in real time. Through the GUI, it is possible to view important information, such as sensor readings, device status, and events. In addition, there are also graphs, tables, and other visualization tools, allowing users to quickly identify patterns, trends, and possible anomalies and thus improving operational efficiency and responsiveness. Thus, this facilitates the management and decision making of photovoltaic system operators.
3.2.2. Over-the-Air Calibration
Considering that photovoltaic power plant installations are not always in easily accessible locations, it is essential to enable remote calibration of the embedded system, without the need to move or disassemble the device or its installation. To this end, we used Over-the-Air (OTA) technology, which uses wireless communication networks, such as Wi-Fi or Bluetooth, to remotely update electronic devices [
39].
Thus, the OTA protocol was used, along with the AsyncElegantOTA library, present in the Arduino IDE, which allows the microcontroller firmware to be updated without the need for a serial connection between the ESP32 and the computer. It is then possible to calibrate and update the embedded system code. In addition, the ESPAsyncWebServer library was used to provide a web server interface for the operator to remotely update the code to calibrate and update the embedded system.
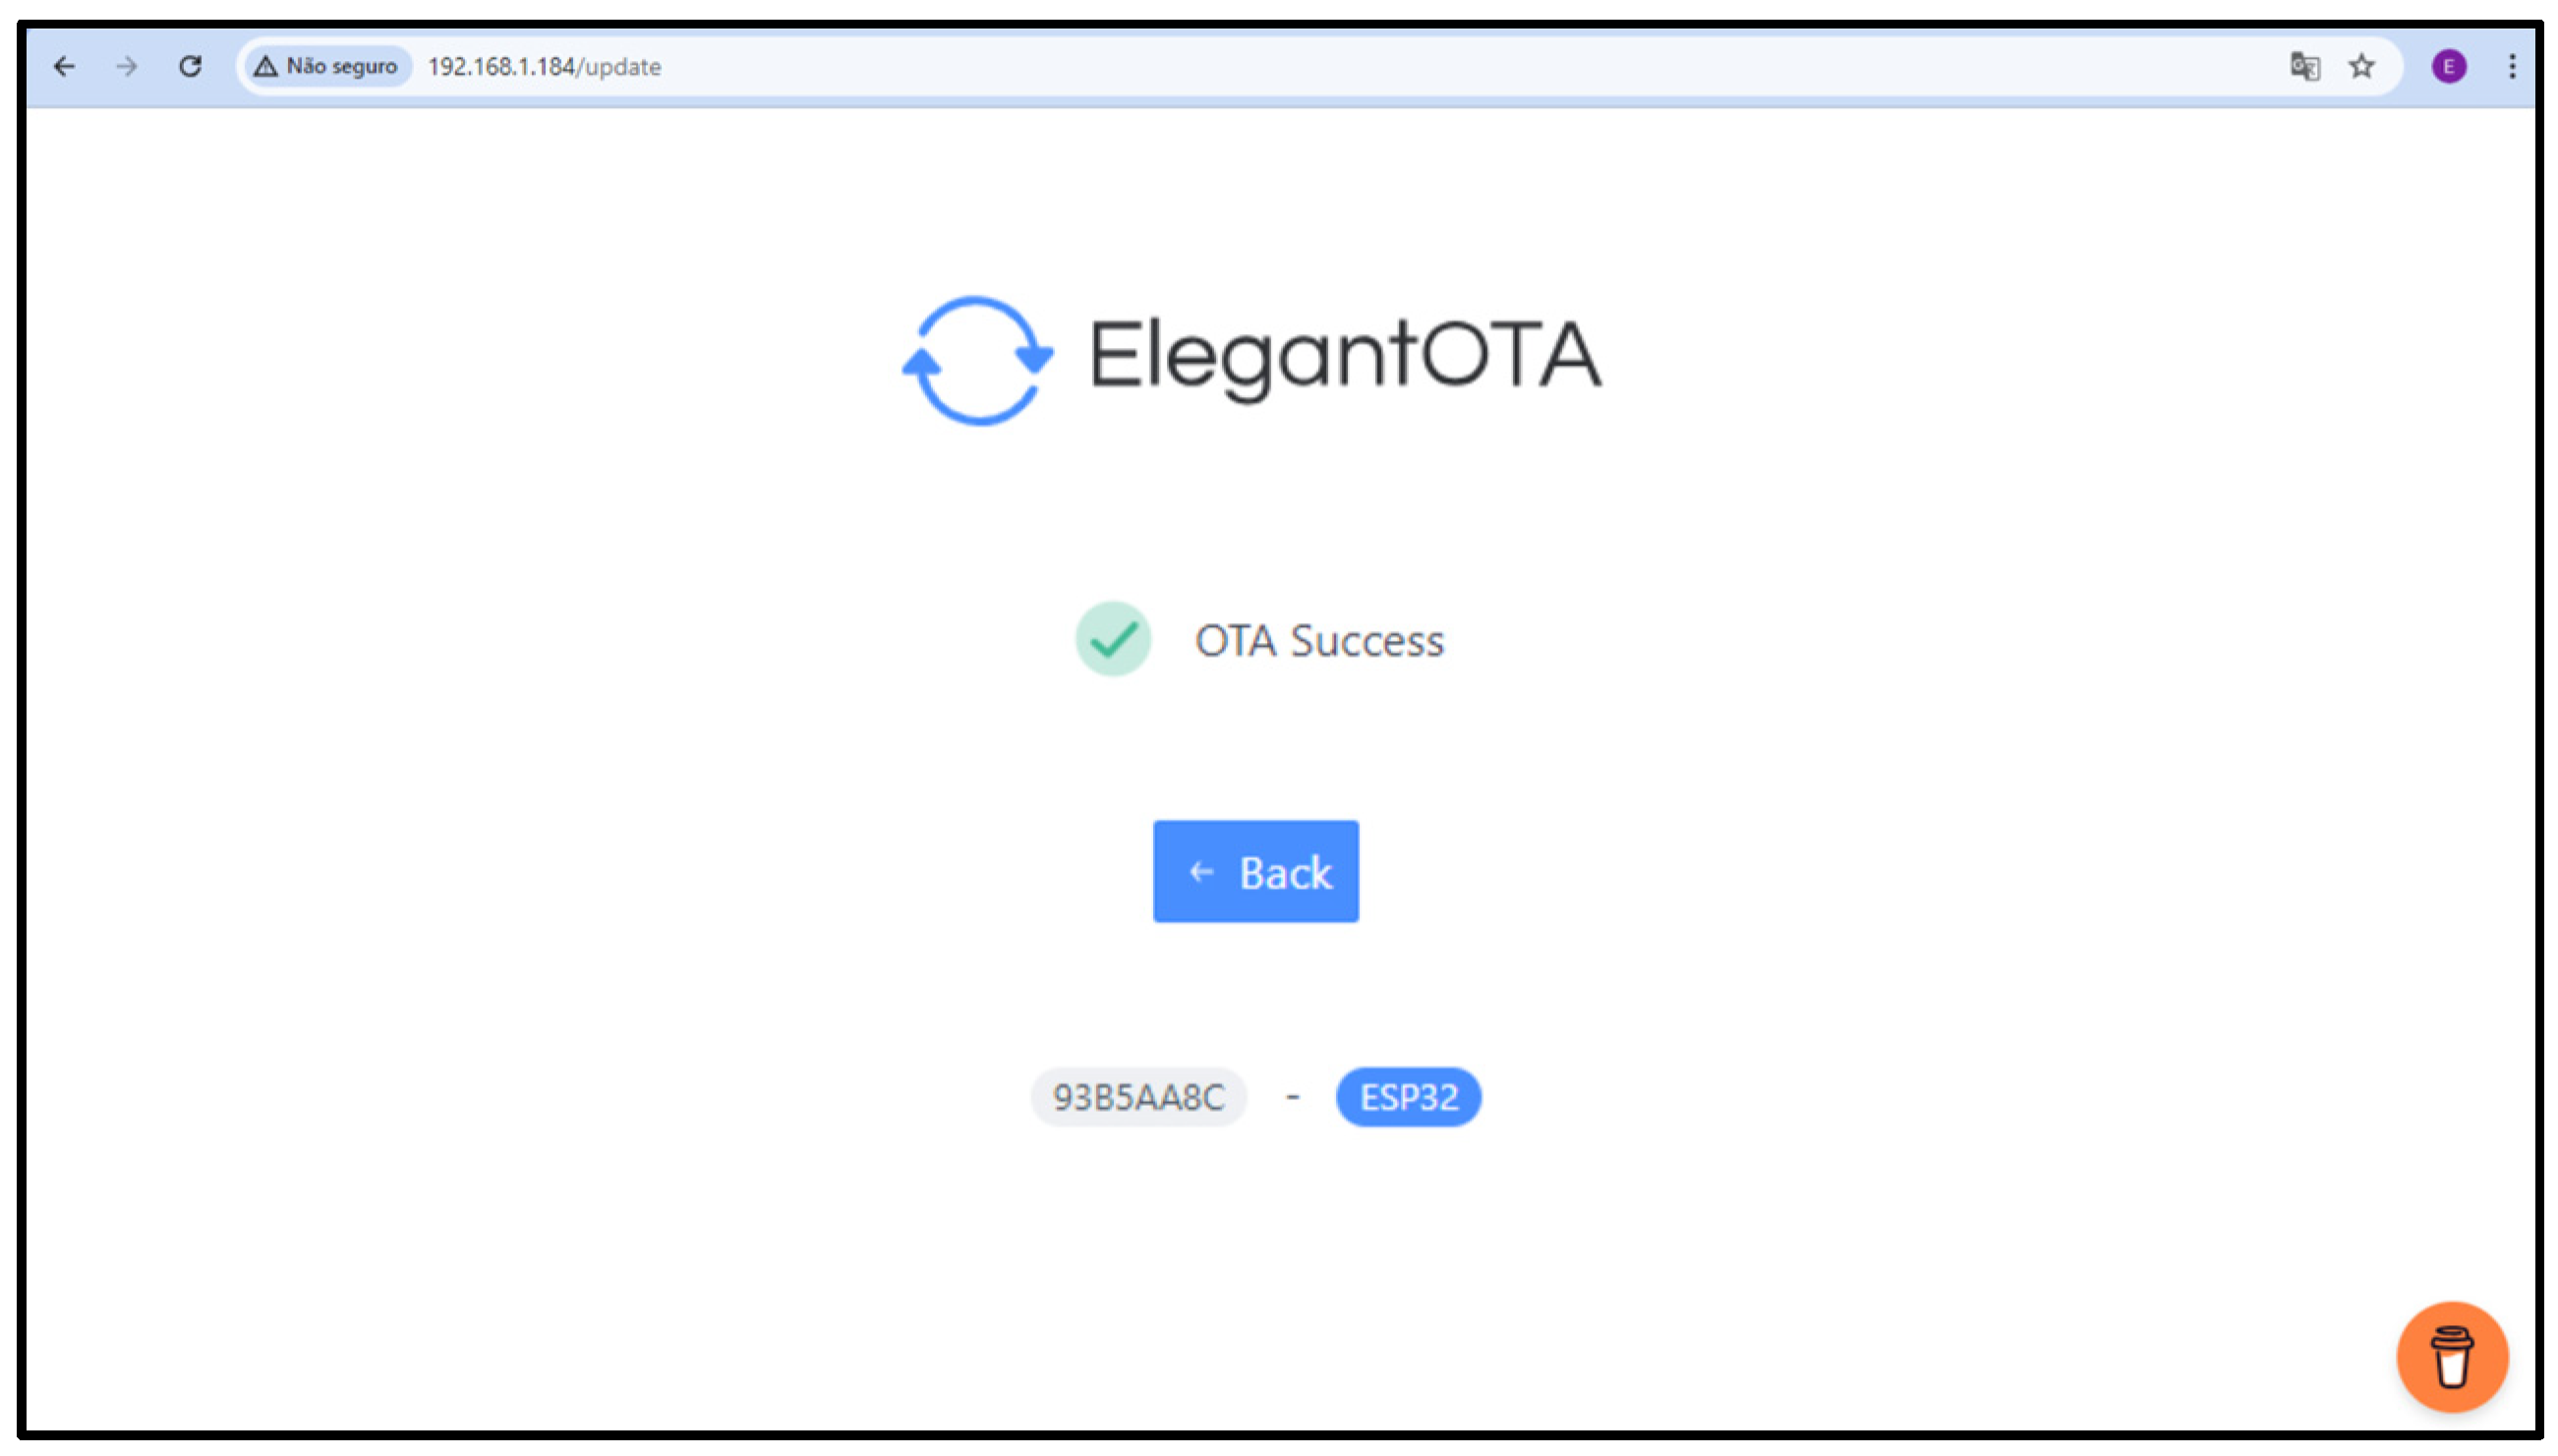
To update the embedded system, the microcontroller’s IP is required to access the web interface and for the new code to be sent, and it must contain the OTA connection parameters to enable future updates to the system. If the remote update is successful, the web page will inform the user that the operation was successful.
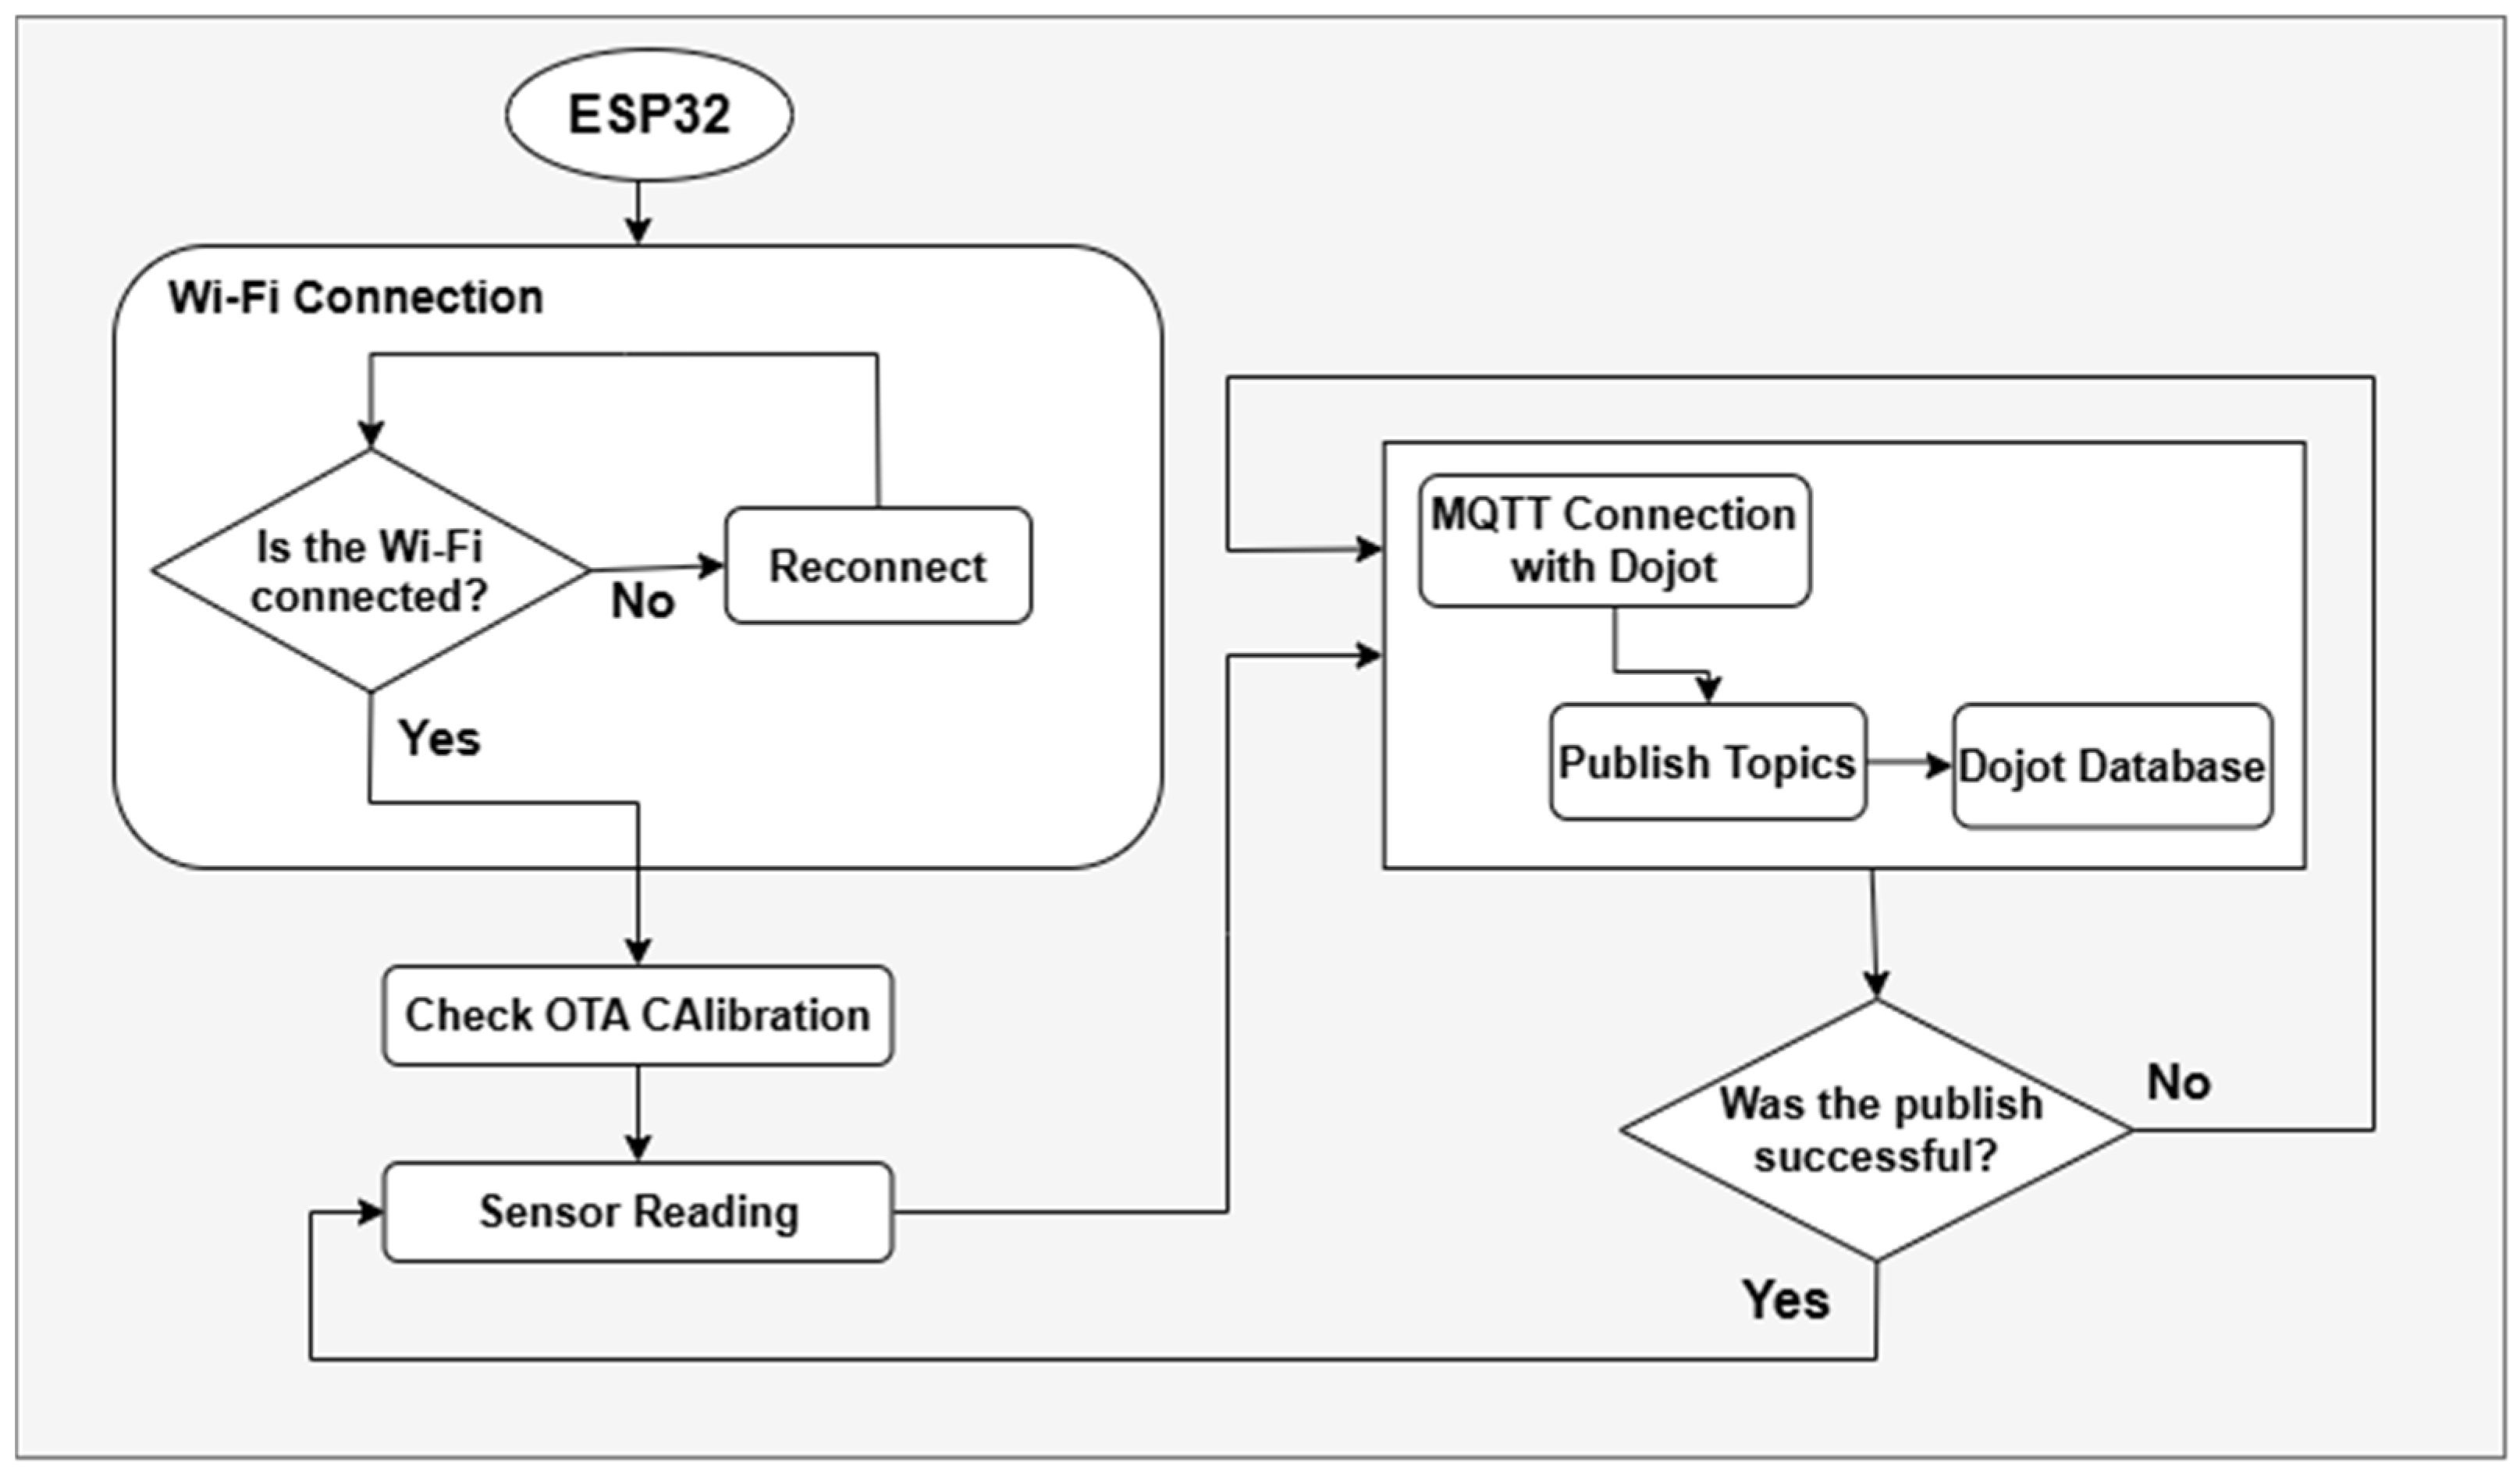
Figure 12 illustrates the entire communication cycle of the embedded system. Initially, the ESP32 microcontroller checks the internet connection and the existence of an OTA calibration request. Subsequently, the sensors are read to calculate the temperature and humidity related to the solar panel. The data are then sent to Dojot via MQTT, which, upon receiving it, stores the history in its database and updates the visualization panel in the GUI. This cycle repeats as long as there is a WiFi connection. Based on the information presented, the results of the project will be discussed in
Section 4.
3.3. Technical Challenges
Although many modules available on the market are technologically mature, the development of this work faced specific challenges, especially due to the conditions and particular objectives of the system. Below are the main technical challenges faced:
- (i)
Adaptation to the Conditions of the Amazon Region
The high temperatures, elevated humidity, and climate fluctuations typical of the Amazon region presented challenges for the stable operation of sensors and electronic components. It was necessary to design solutions, such as the thermal encapsulation and protection of the sensors, to ensure the stable and prolonged operation of the system in the field.
- (ii)
Integration of Sensors with Different Specifications
Integrating temperature (NTC) and humidity (DHT11) sensors required attention to ensure that the readings were accurate and consistent under variable conditions. Additionally, it was necessary to implement mechanisms to validate the collected data and identify potential discrepancies between sensors.
- (iii)
Energy Consumption Optimization
Since the system was designed to operate in remote regions, powered by a photovoltaic module, energy efficiency was a critical challenge. The choice of low-consumption components, such as the ESP32, and the implementation of an automatic activation system based on the LDR sensor were key to maximizing the system’s autonomy.
- (iv)
Implementation of Scalable and Reliable IoT Communication
Using the MQTT protocol and integrating with the Dojot middleware required significant technical effort to ensure reliable and continuous communication in environments with limited connectivity. This involved customizing the Dojot platform to meet the system’s specific needs, such as storing data for extended periods.
- (v)
Design and Manufacturing of PCB
Developing a custom-printed circuit board (PCB) represented another challenge. It was necessary to efficiently integrate the modules and minimize interference that could compromise the accuracy of the measurements.
- (vi)
Field Validation and Testing
Testing the system at an actual photovoltaic plant in the Amazon was a significant challenge, involving logistics and adapting the system to field conditions. These tests were critical in validating the robustness and reliability of the embedded system.
Although the individual modules are technologically mature, the real technical challenge was integrating these components into a cohesive, reliable, and sustainable embedded system, adapted to the adverse conditions of the Amazon region. These efforts resulted in a functional and scalable solution with applicability in remote and ecologically sensitive scenarios.
4. Results
To test the developed embedded system, it was deployed in a ground-mounted photovoltaic power plant at the facilities of the Center for Excellence in Energy Efficiency in the Amazon (CEAMAZON), located at the Belém campus of the Federal University of Pará (UFPA).
4.1. Hardware Application
The hardware construction focused on developing the PCB circuit and printing the embedded system case, which were important for field testing. The process of performing this process will be described below.
4.1.1. Electronic Circuit Production
The printed circuit board used the revelation process, which involves photographic paper, copper-clad phenolic board, Amyl Acetate (CH
3COO(CH
2)
4CH
3), Acetone (CH
3COCH
3), and Ferric Perchloride (FeCl
3). To print the design on the photographic paper, a laser toner print was made to facilitate the transfer of the design to the phenolic board. Amyl acetate and acetone were used to transfer the ink from the photographic paper to the copper plate. Finally, the circuit on the phenolic board was revealed by immersion in ferric perchloride, which corrodes only the copper area without the printed ink, preserving the necessary connections for soldering the electronic system.
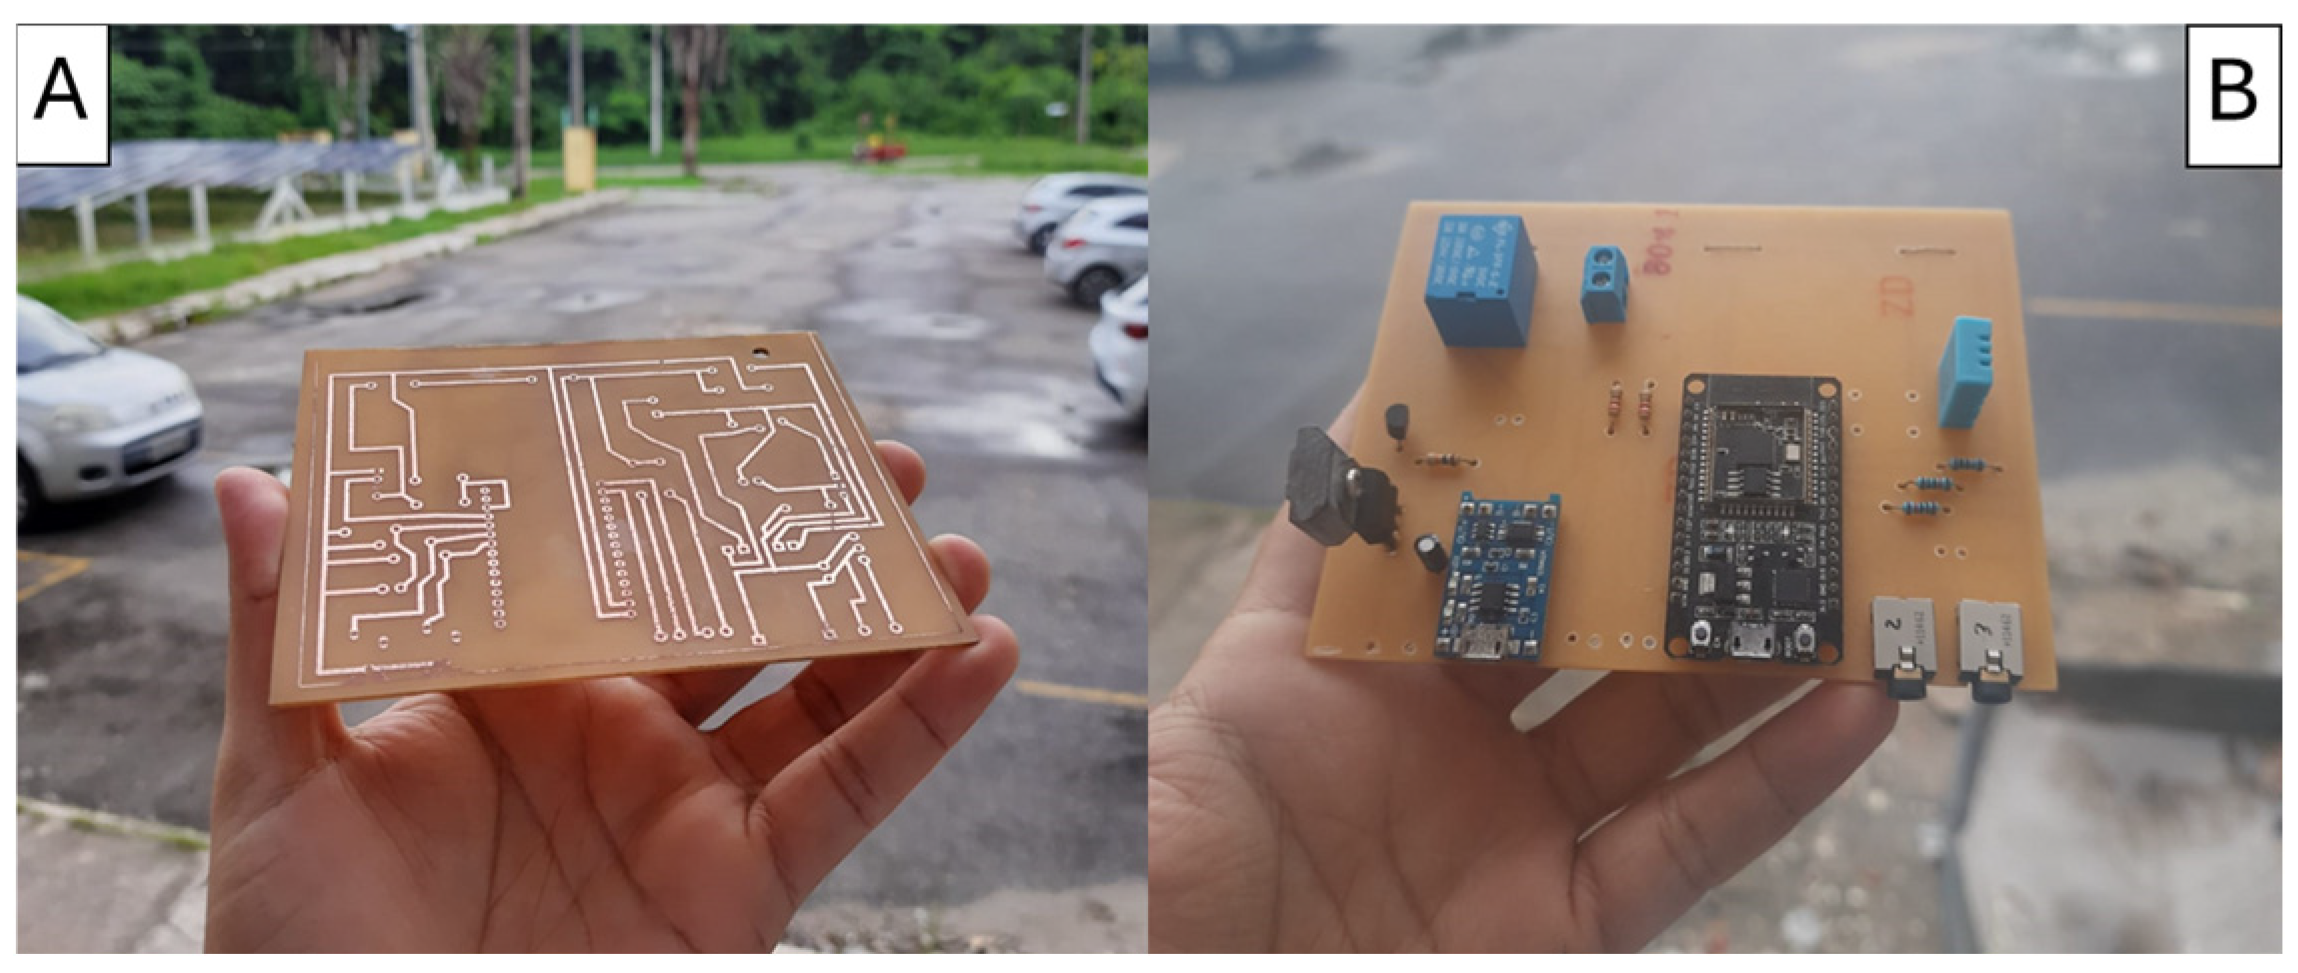
Figure 13A shows the circuit on the phenolic board.
The electronic components were soldered using tin solder, so that the devices adhered precisely to the copper track when heated. Furthermore, the arrangement of the materials followed what was designed in the design software, with the necessary measurements to match the design of the embedded system case.
Figure 13B shows the electronic circuit in its final phase.
4.1.2. Case Assembly
The embedded system case is made up of nine independent parts, made using a 3D printer, which fit together precisely to prevent water, dust, and rain from entering the electronic circuit, which could impact its operation and the duration of its useful life. The design took into account the inputs for the sensors, data, and power source according to the PCB built. For printing, Polyethylene Terephthalate Glycol (PET-G) filament was chosen due to its thermal resistance of 85 °C, considering the equipment’s exposure to the sun and the need to withstand the mechanical stress caused by its weight, ensuring its integrity over time.
Figure 14 shows the integration of the PCB with the case produced using the 3D printer.
The temperature sensor case followed the same design and 3D printing steps. However, the material used was Polylactic Acid (PLA) filament due to the absence of significant mechanical stress associated with the weight of the NTC sensor. The precision of the groove details was considered to facilitate the adhesion of the adhesive tape used. The product in its final stage can be seen in
Figure 15.
4.1.3. Application and Testing of the Embedded System in the Field
The following presents the results of the tests conducted with the developed embedded system, installed at the photovoltaic plant (UFV) on the grounds of CEAMAZON, at UFPA, located in the Amazon region.
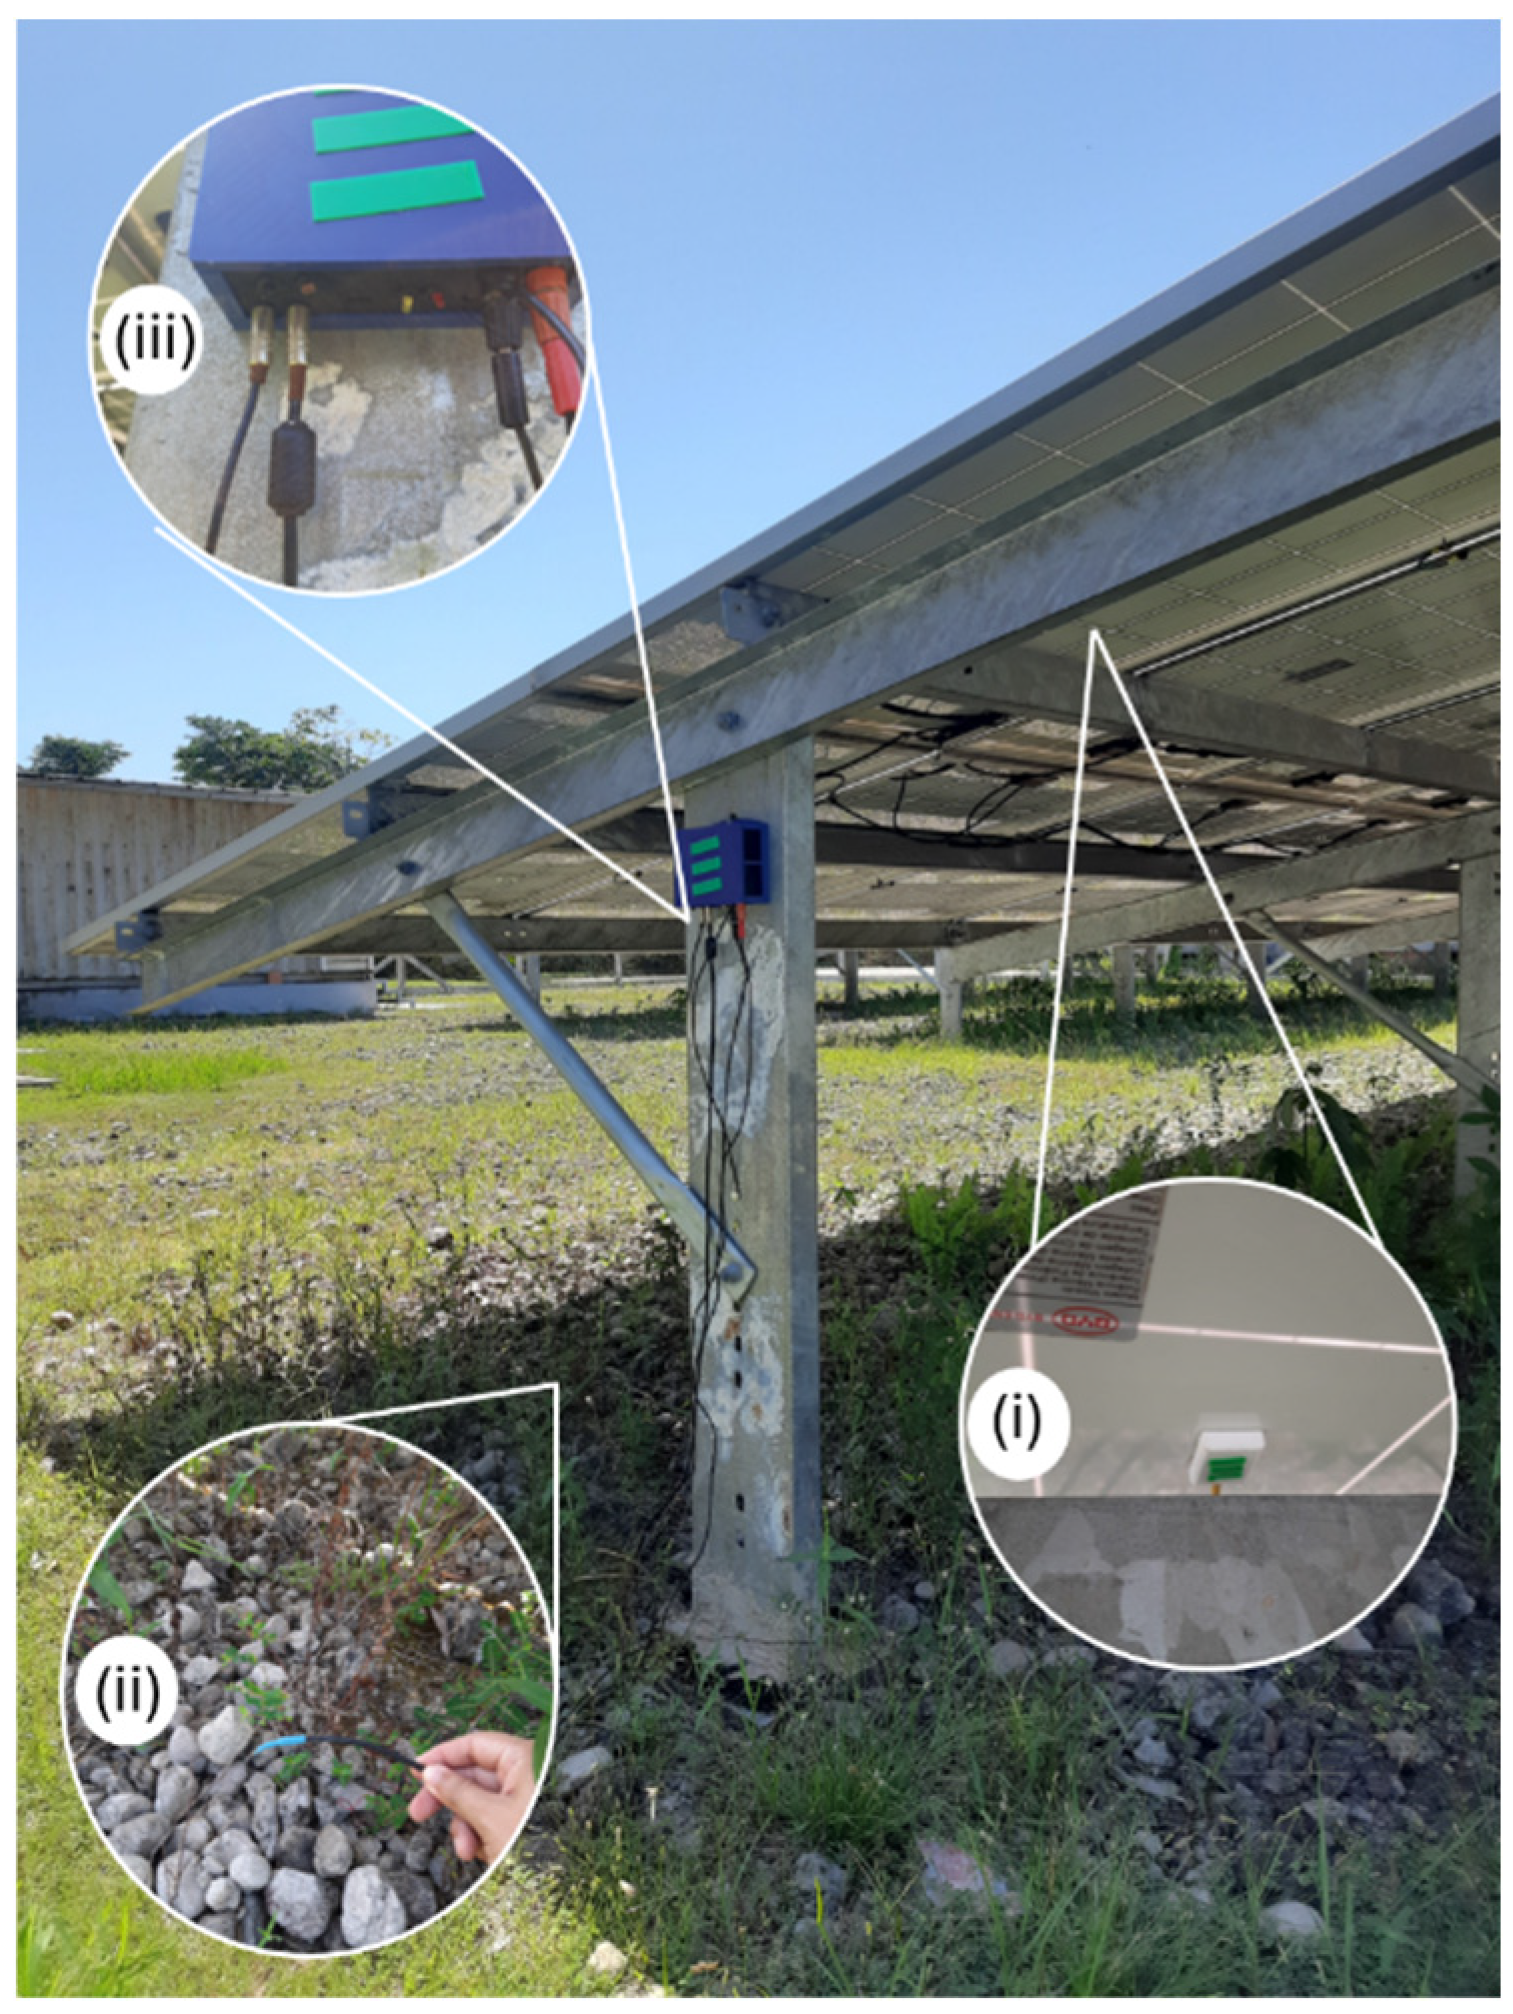
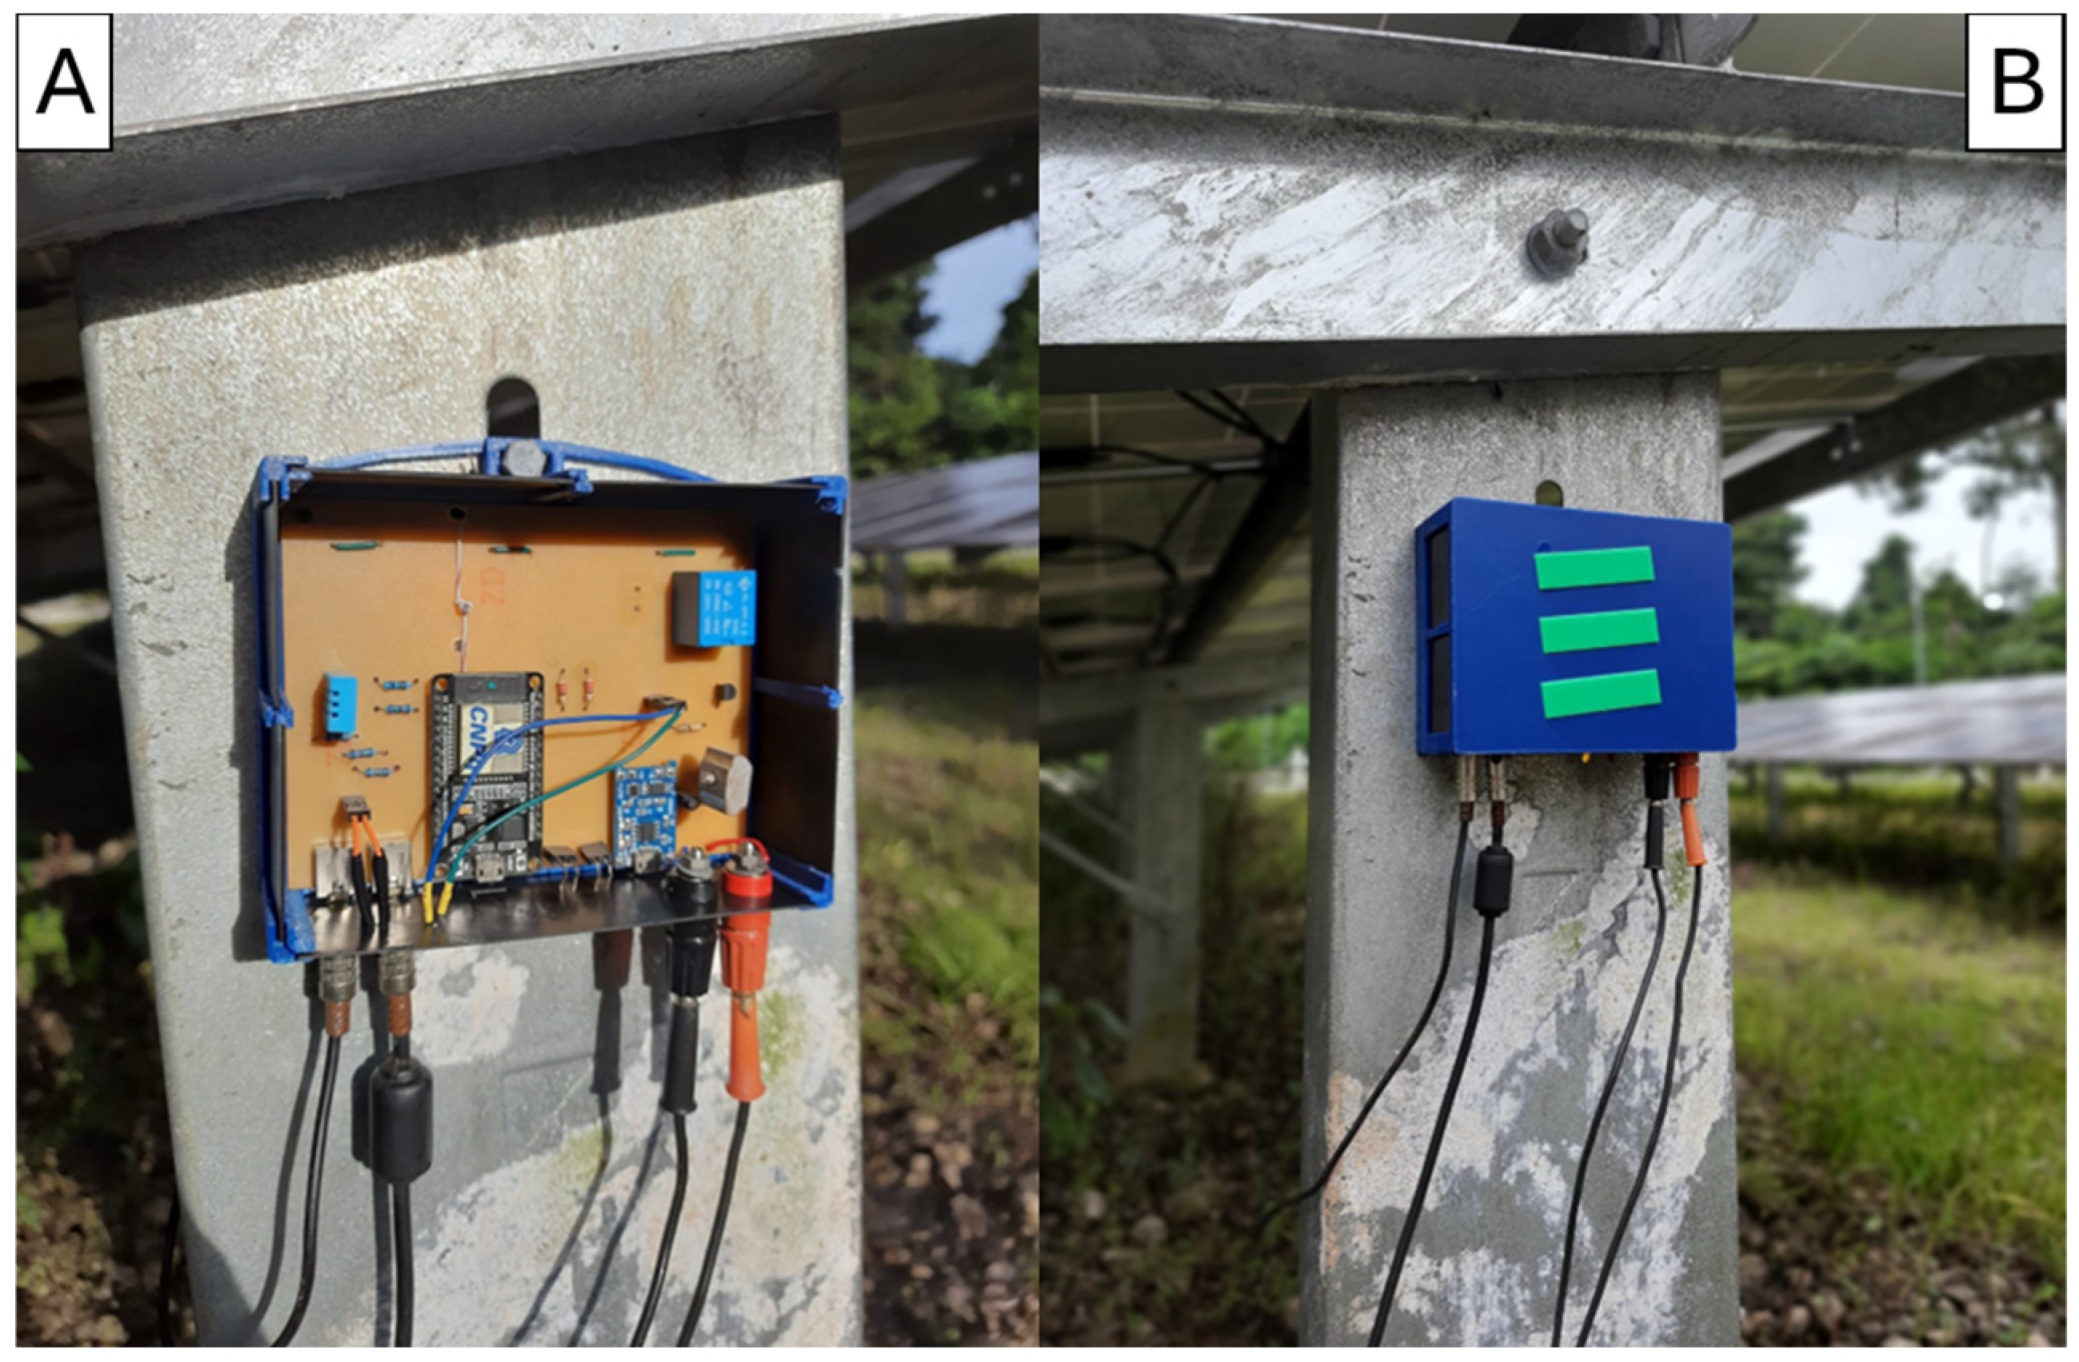
The finished physical structure of the embedded system allows it, upon its installation in the photovoltaic plant, to start monitoring the photovoltaic module, observe its behavior under the influence of the external environment, verify whether the objectives were achieved, and seek improvements for future versions. The installation of the system was designed to be non-invasive, which helps to preserve the integrity of the photovoltaic modules, as well as the local environment, and avoids significant changes in the ecosystem [
38]. This approach contributes to more sustainable practices, especially in places of high ecological value such as the Amazon. The circuit layout and its operation in the field are shown in
Figure 16.
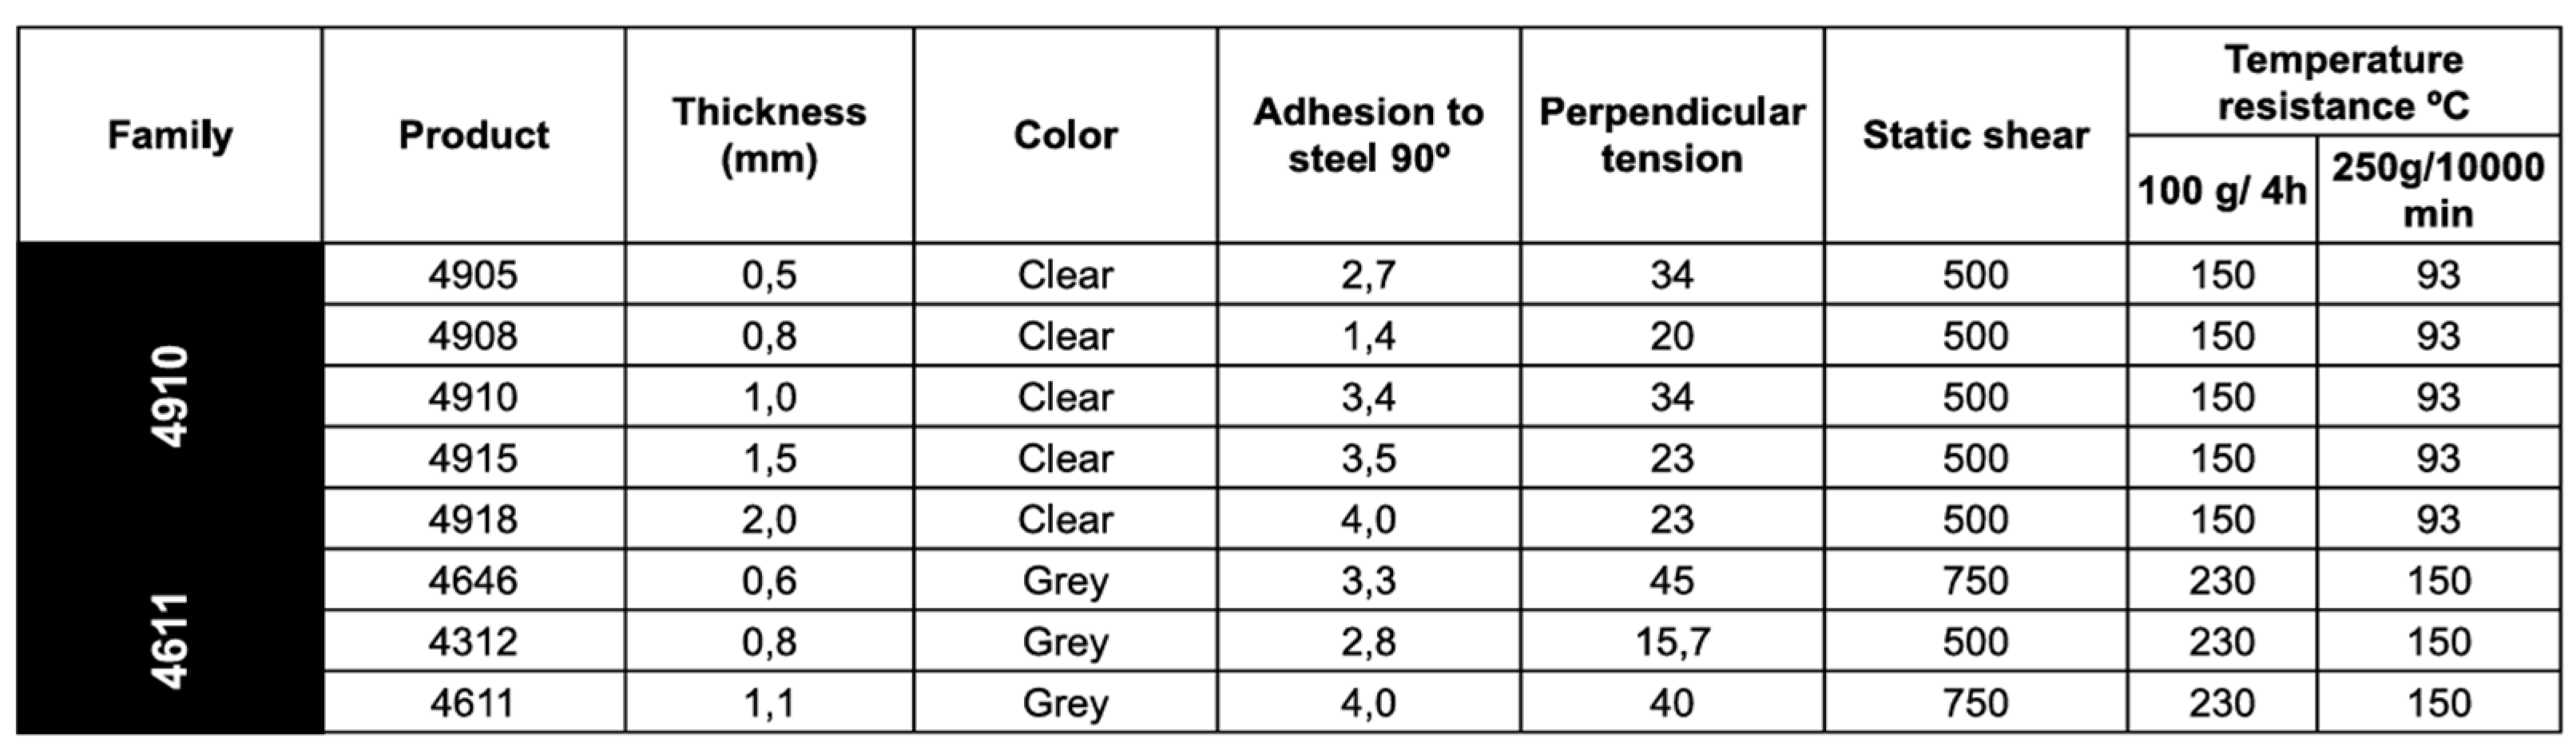
The impact of temperature is directly related to the adhesive tape used, which must withstand temperatures close to 60 °C and the vertical weight of the box. In this context, 3M™ VHB™ Tape 4611 (Paul, MN, USA), due to its characteristics, demonstrated better resistance and perpendicular tension capacity compared to the household adhesive tape, 3M™ VHB™ Tape 4910 [
40].
Figure 17 shows the comparison between the two types of double-sided tape.
The use of adhesive tape on the temperature sensor speeds up the installation of the device in the field and is characterized as a non-invasive method, which facilitates maintenance and avoids hot spots that can increase the risk of fire or short circuit in the solar plant. The installation of the box on the photovoltaic panel is shown in
Figure 18.
The electronic circuit worked as expected based on the data provided by the embedded system, which is stored in an online spreadsheet [
18]. In the validation tests with the sensors, this helped to verify that the information was aligned with the measurements taken on site by the Minipa ET-2042E digital multimeter (Joinville, Brazil) [
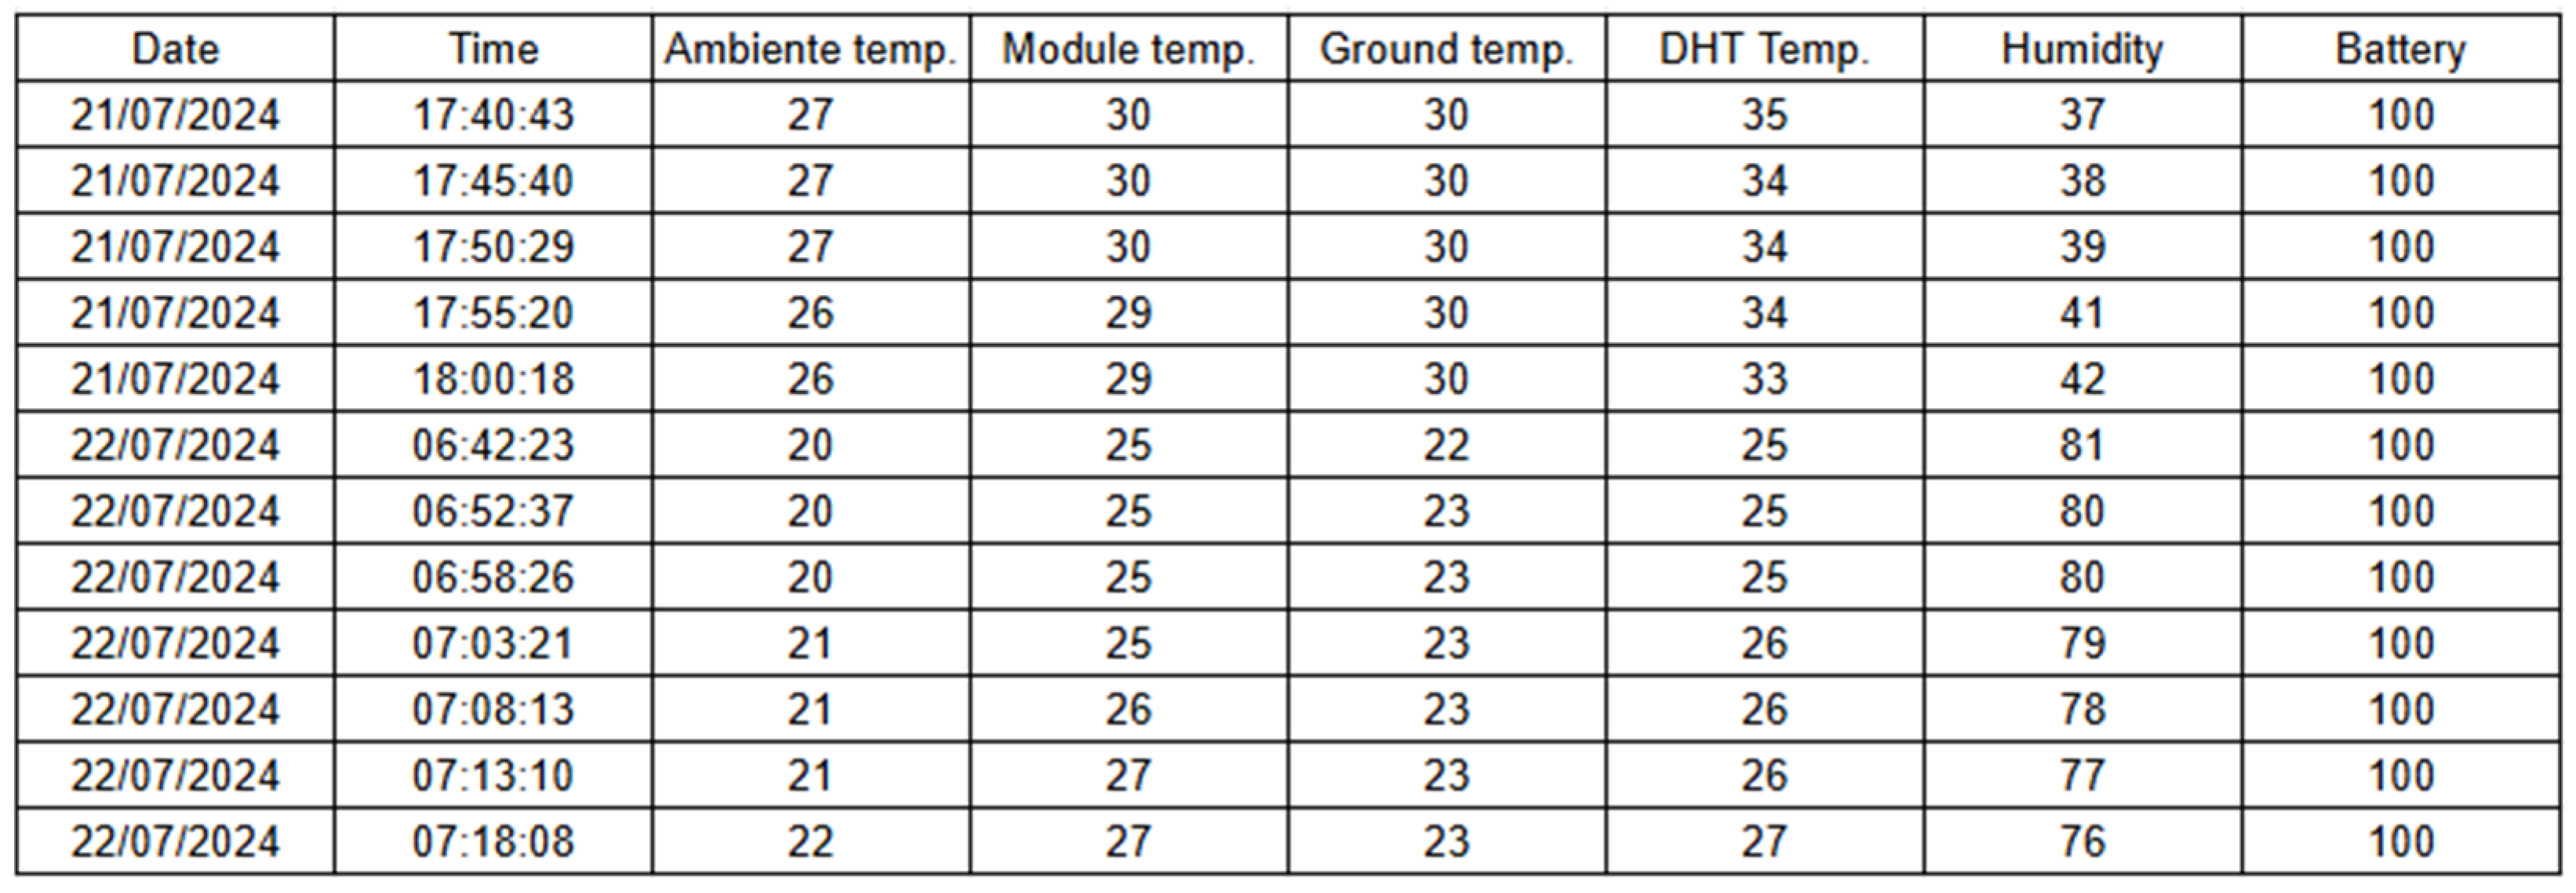
41]. In addition, the performance of the automatic drive system was monitored to ensure that the operation of the embedded system coincided with the generation period of the photovoltaic plant, during which the accumulation of data is reduced and the natural factor is used to initiate monitoring. The data obtained in the field tests are presented in
Figure 19.
In relation to the developed embedded system and in view of the above, it is worth highlighting that the results were satisfactory, demonstrating effective and stable operation in challenging environments. In addition, the embedded system case guarantees protection against water and dust, while the temperature data collected showed significant differences at different analysis points on the photovoltaic modules.
4.2. Application of Communication
To validate the communication application, tests were carried out over the course of a week, from 18 to 24 July 2024, to verify the sending, requesting, viewing, and storing of the measurements sent to the Dojot platform through the ESP32 microcontroller using MQTT. In addition, calibration was verified through remote update (OTA). The following sub-items detail the steps performed.
4.2.1. Middleware Dojot
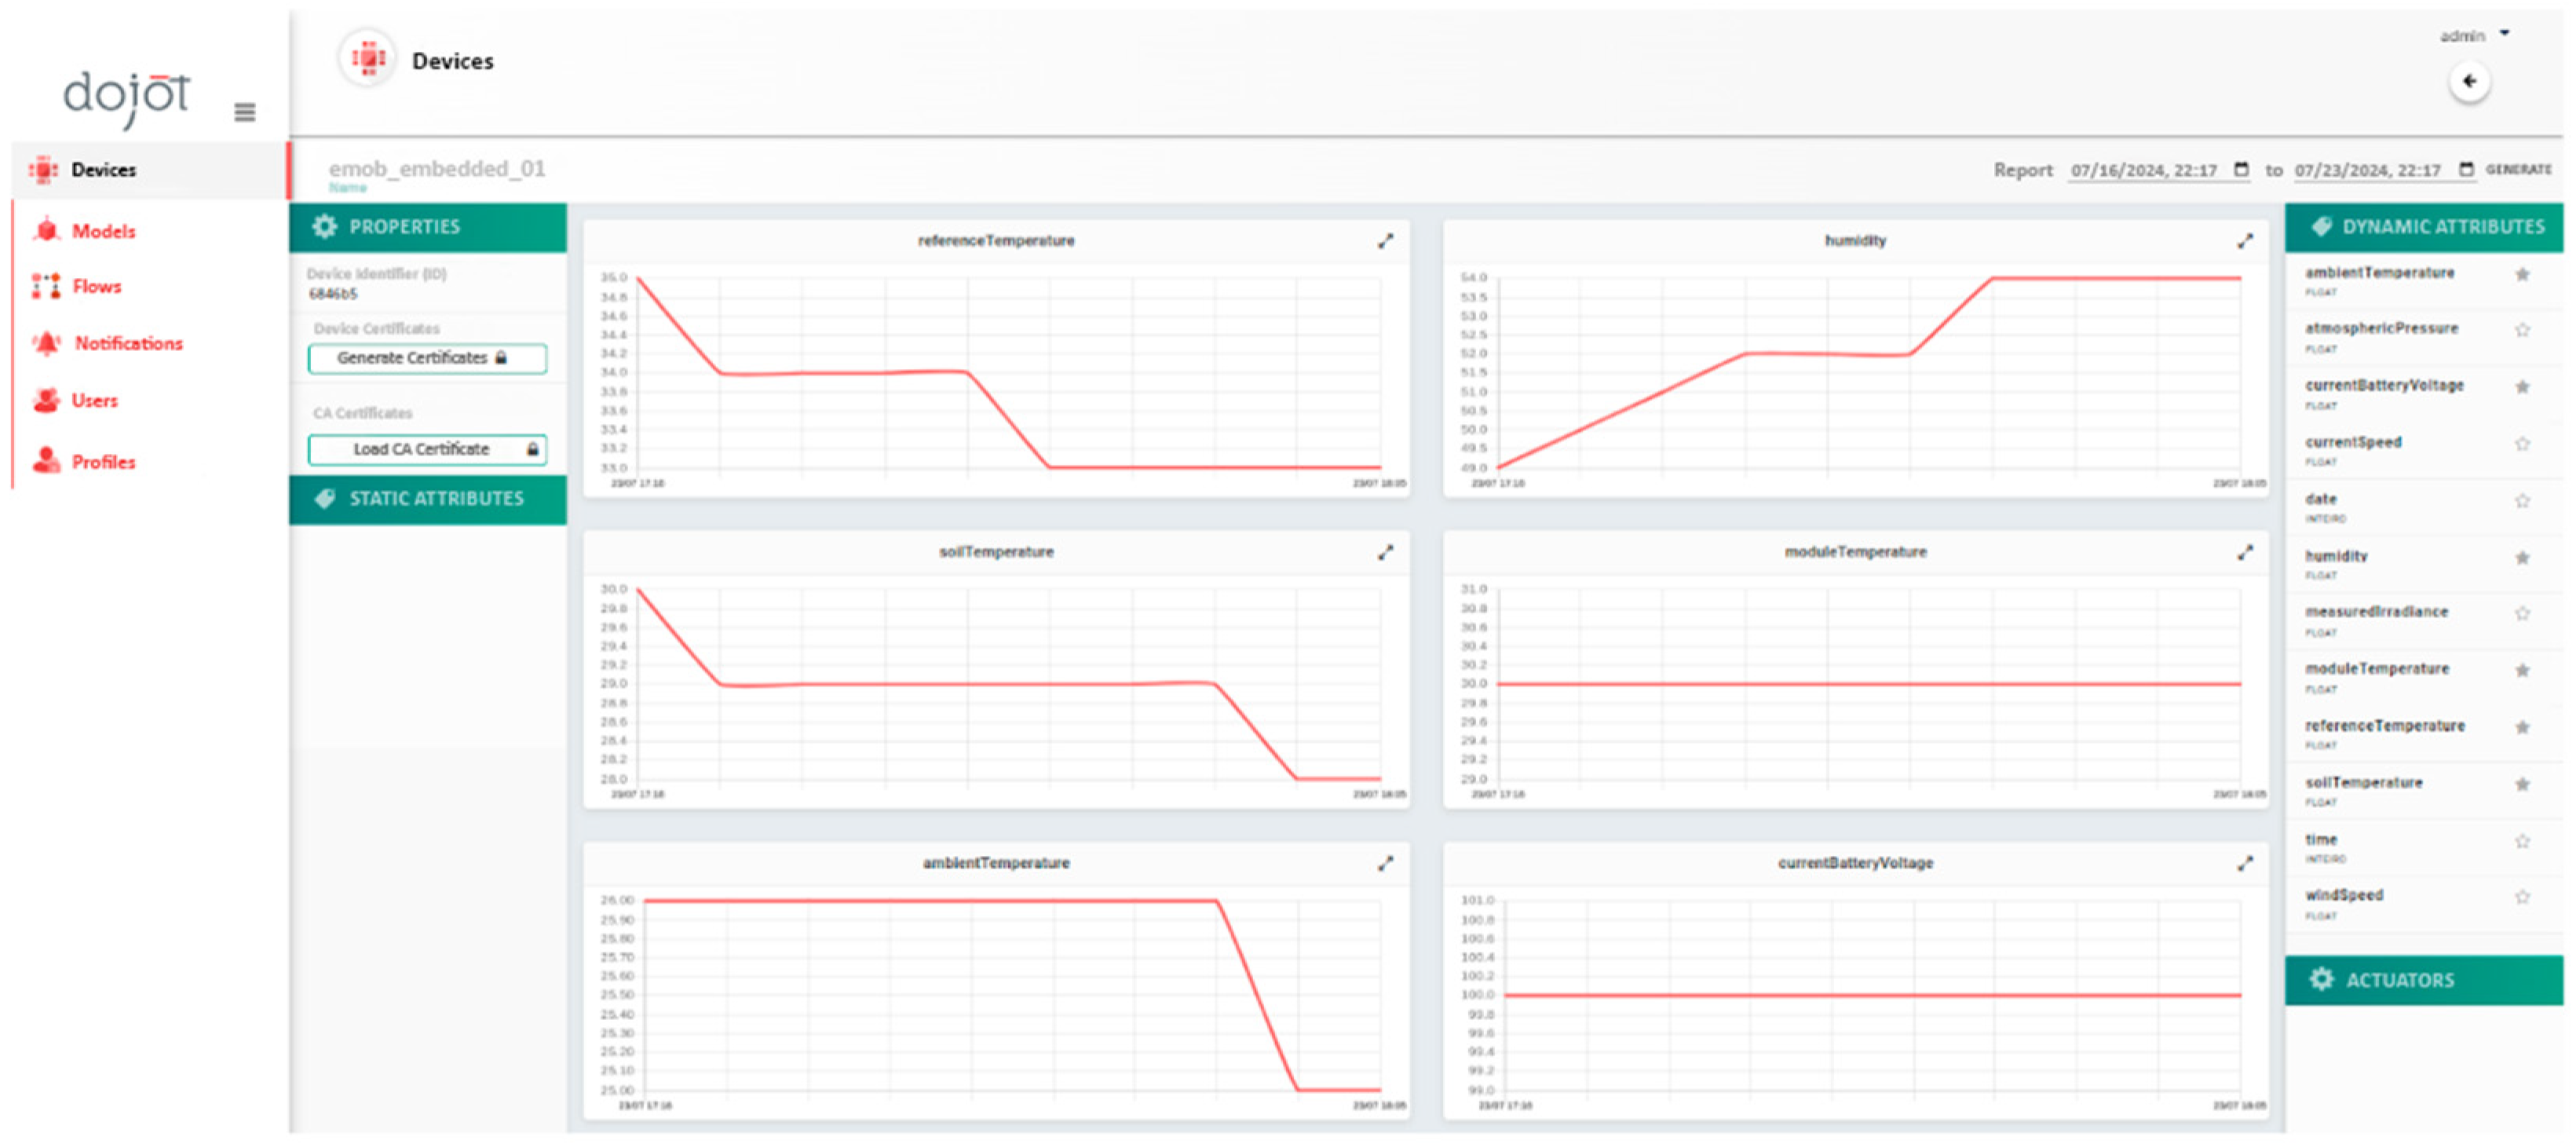
Data transmission from the embedded system to the middleware was stable and can be verified through the visualization panel integrated into the platform itself. In the panel, it is necessary to select the variables of interest to customize which data should be displayed over a period of up to one day.
Figure 20 illustrates the reception of data via MQTT in the Dojot platform.
4.2.2. OTA Update
During the tests, no sudden variations in the sensor readings were observed, so no calibration was required in the final model. However, it was necessary to add a new variable to be monitored: the battery charge. The ESP32 coding was modified again, converted to binary, and sent to the embedded system installed in the solar plant, through a local web page configured with the same IP address as the microcontroller. The update occurred quickly and efficiently, as illustrated in
Figure 21.
Given the above, it is worth noting that communication via MQTT was efficient, with no packet loss, and the possibility of the remote calibration of the sensors via OTA ensures data accuracy. Through the web graphical interface of the IoT middleware, it was possible to perform real-time monitoring, with fast updates and no delays, confirming its suitability for the maintenance of photovoltaic systems in the Amazon region.
4.2.3. Field Test Results
After the monitoring period, the data obtained by the sensors were requested by the Dojot platform in .CSV format. These data were then analyzed using Python 3.13.0, a widely adopted programming language for data analysis, and the Pandas library, known for its efficiency in reading and manipulating spreadsheets and tabular data. Statistical analyses were performed to determine the frequency of the values and calculate the average, maximum, and minimum of each monitored variable. Subsequently, graphs were generated to visualize the temporal behavior of each variable, providing an understanding of their trends over the monitoring period.
Figure 22 shows the temperature variation at three different points on photovoltaic module over the course of a week: the ambient temperature, the temperature of the upper surface of the module exposed to direct sunlight, and the temperature of the shaded area of the module. It can be observed that the temperature of the module’s upper surface reached the highest values due to direct sun exposure, while the shaded area maintained consistently lower values. The ambient temperatures were within an intermediate range. Notably, there was a trend of temperature decrease on the last day of monitoring, indicating potential climatic changes or specific environmental conditions on that day. This variation highlights the importance of monitoring different points for a more comprehensive analysis of thermal dissipation, as shown in the literature [
22,
23,
24,
25,
42].
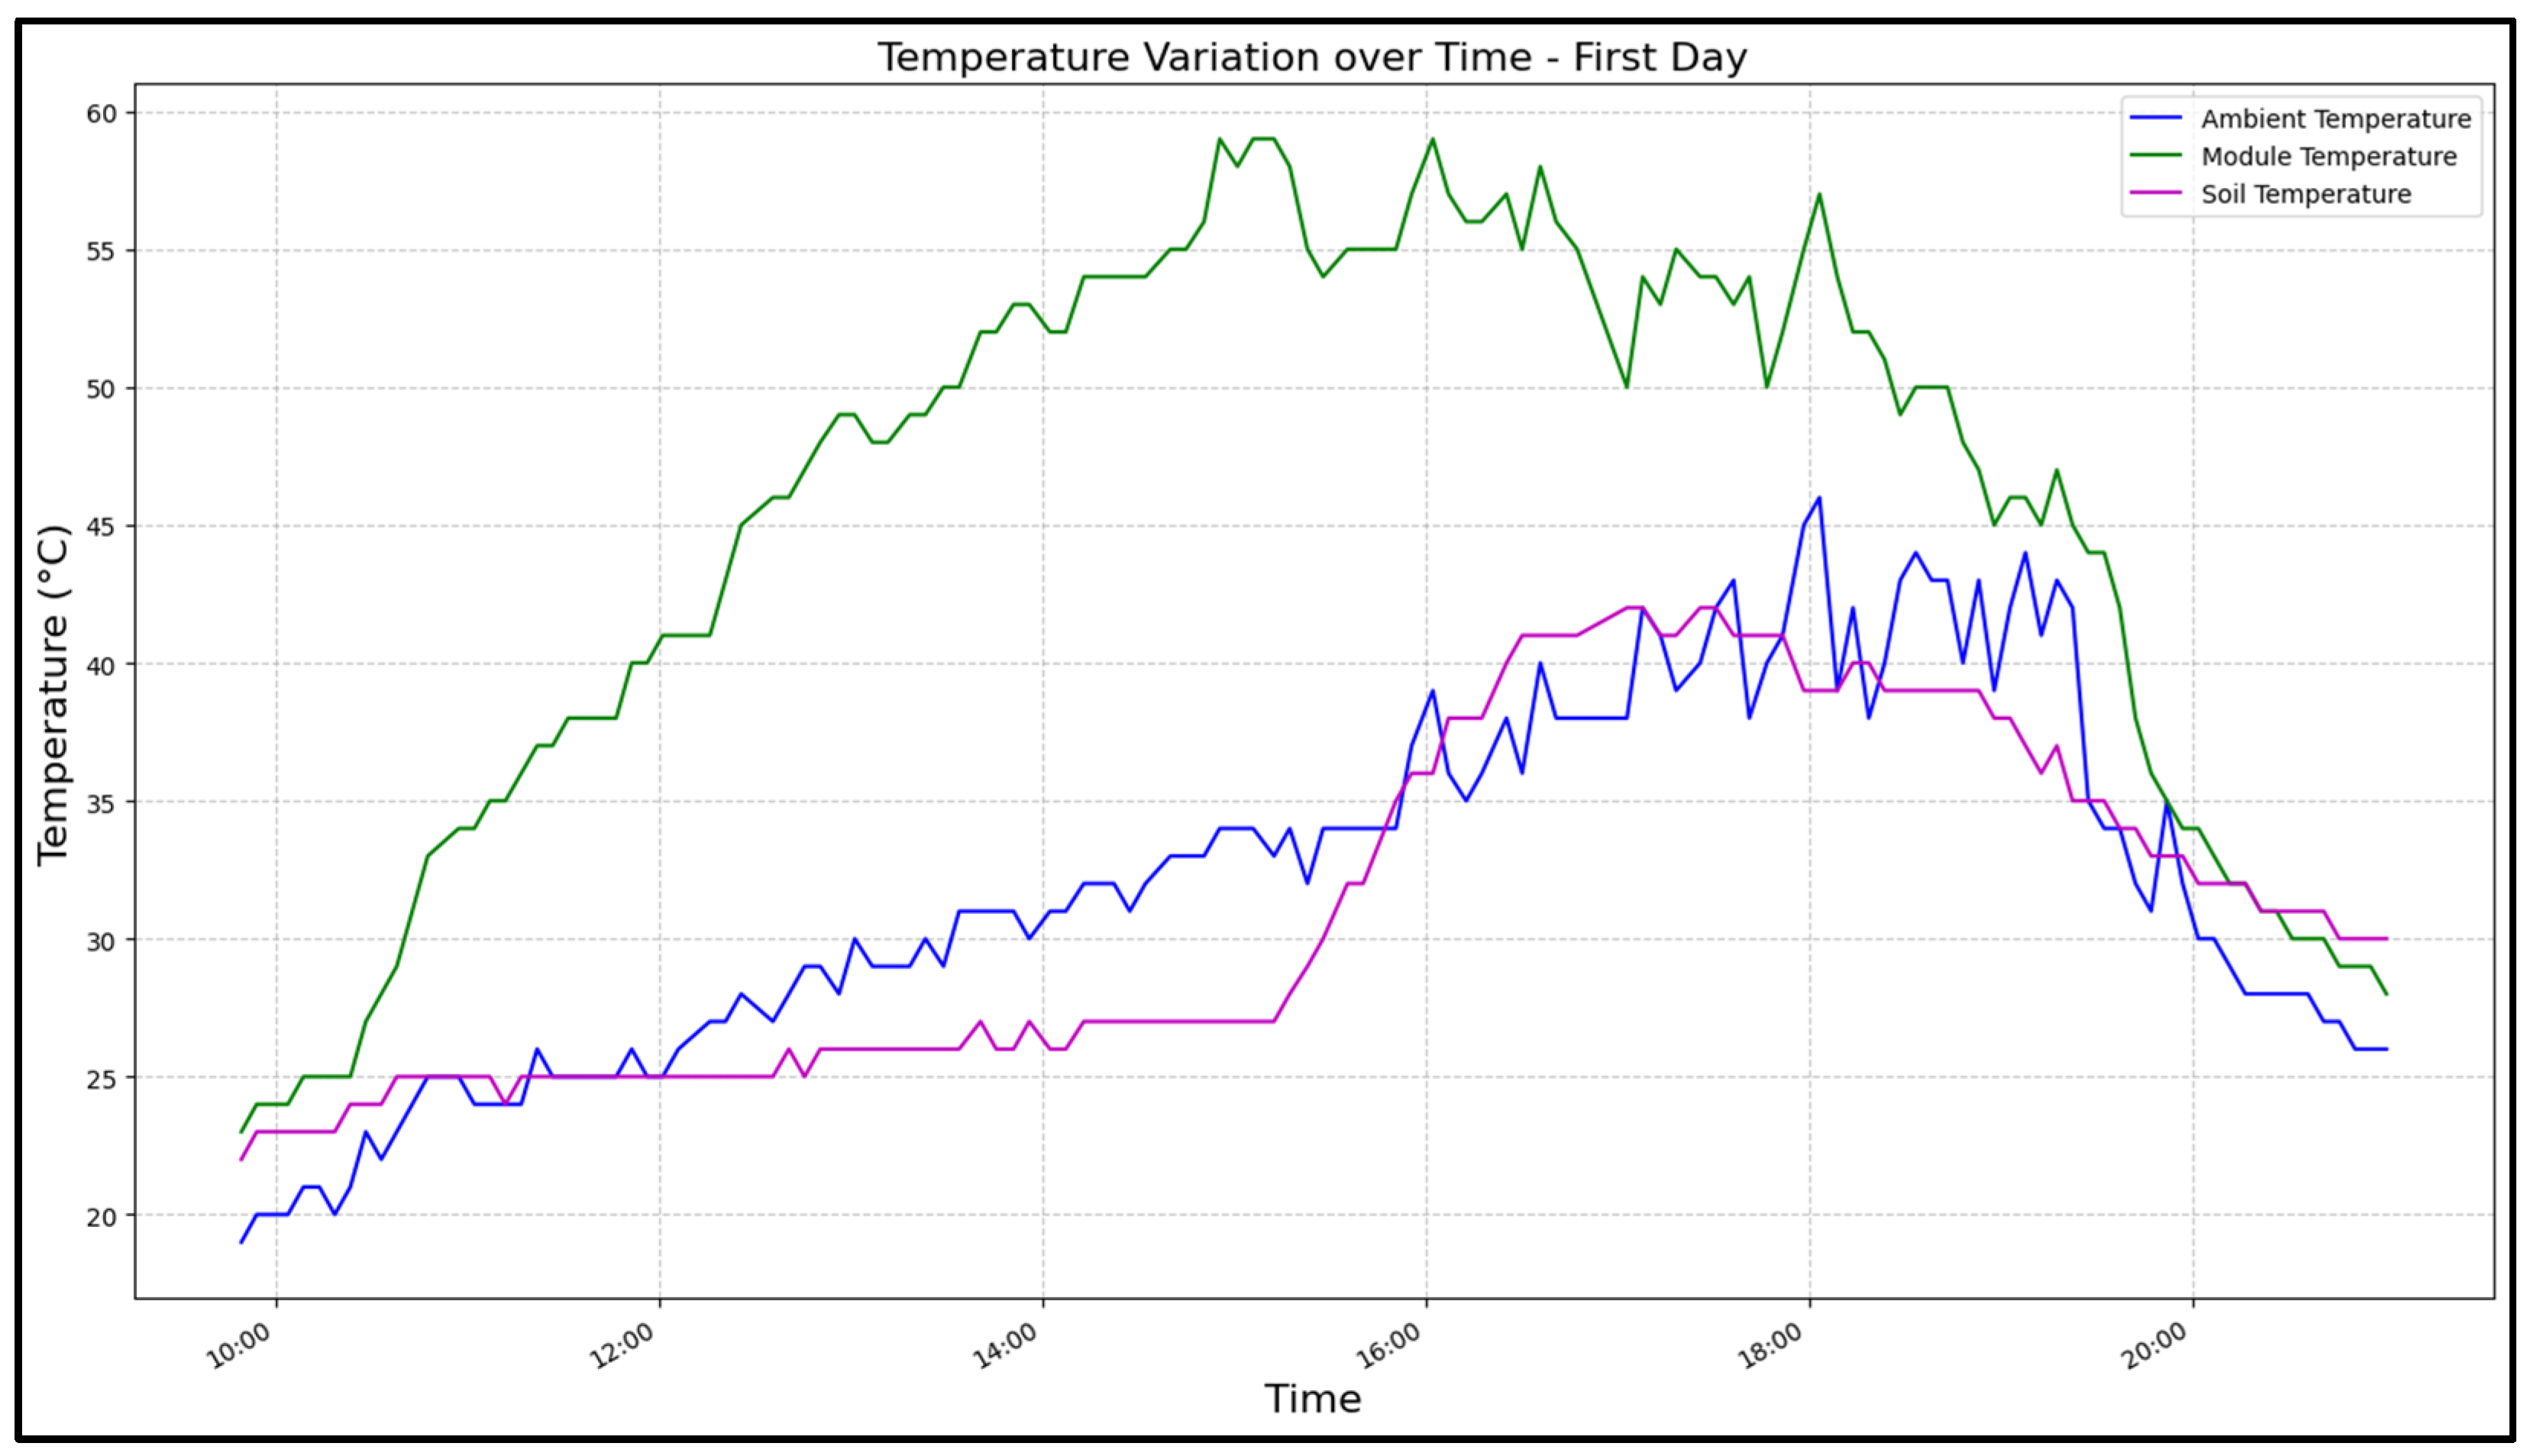
Figure 23 details the temperature variation during the first day of monitoring. The upper surface of the module reached peak temperatures that were 39.63% higher than the ambient temperature, with an average of 44.66 °C, highlighting the significant impact of direct solar radiation. Between 16:00 and 18:00, the temperature in the shaded area exceeded the ambient temperature, a phenomenon that can be attributed to the heat accumulation in the module and the gradual release of residual heat after the decline of solar radiation. This phenomenon can be explained by the thermal conductivity of the module, which responds more quickly to temperature changes due to its material characteristics. However, the soil around the photovoltaic system, which has a higher thermal capacity—especially due to the presence of stones—retains more heat.
After 18:00, the ambient temperature exceeded the temperature of the shaded area due to the module’s faster cooling rate compared to the surrounding environment. This heating and cooling pattern reflects the heat exchange dynamics between the module and the environment, reinforcing the need for thermal control strategies to improve efficiency.
However, in the following two hours, between 18:00 and 20:00, the ambient temperature became warmer than the shaded area temperature. This occurs because, after sunset, the cooling rate of the module may be faster than that of the environment, resulting in a reversal of temperature comparison.
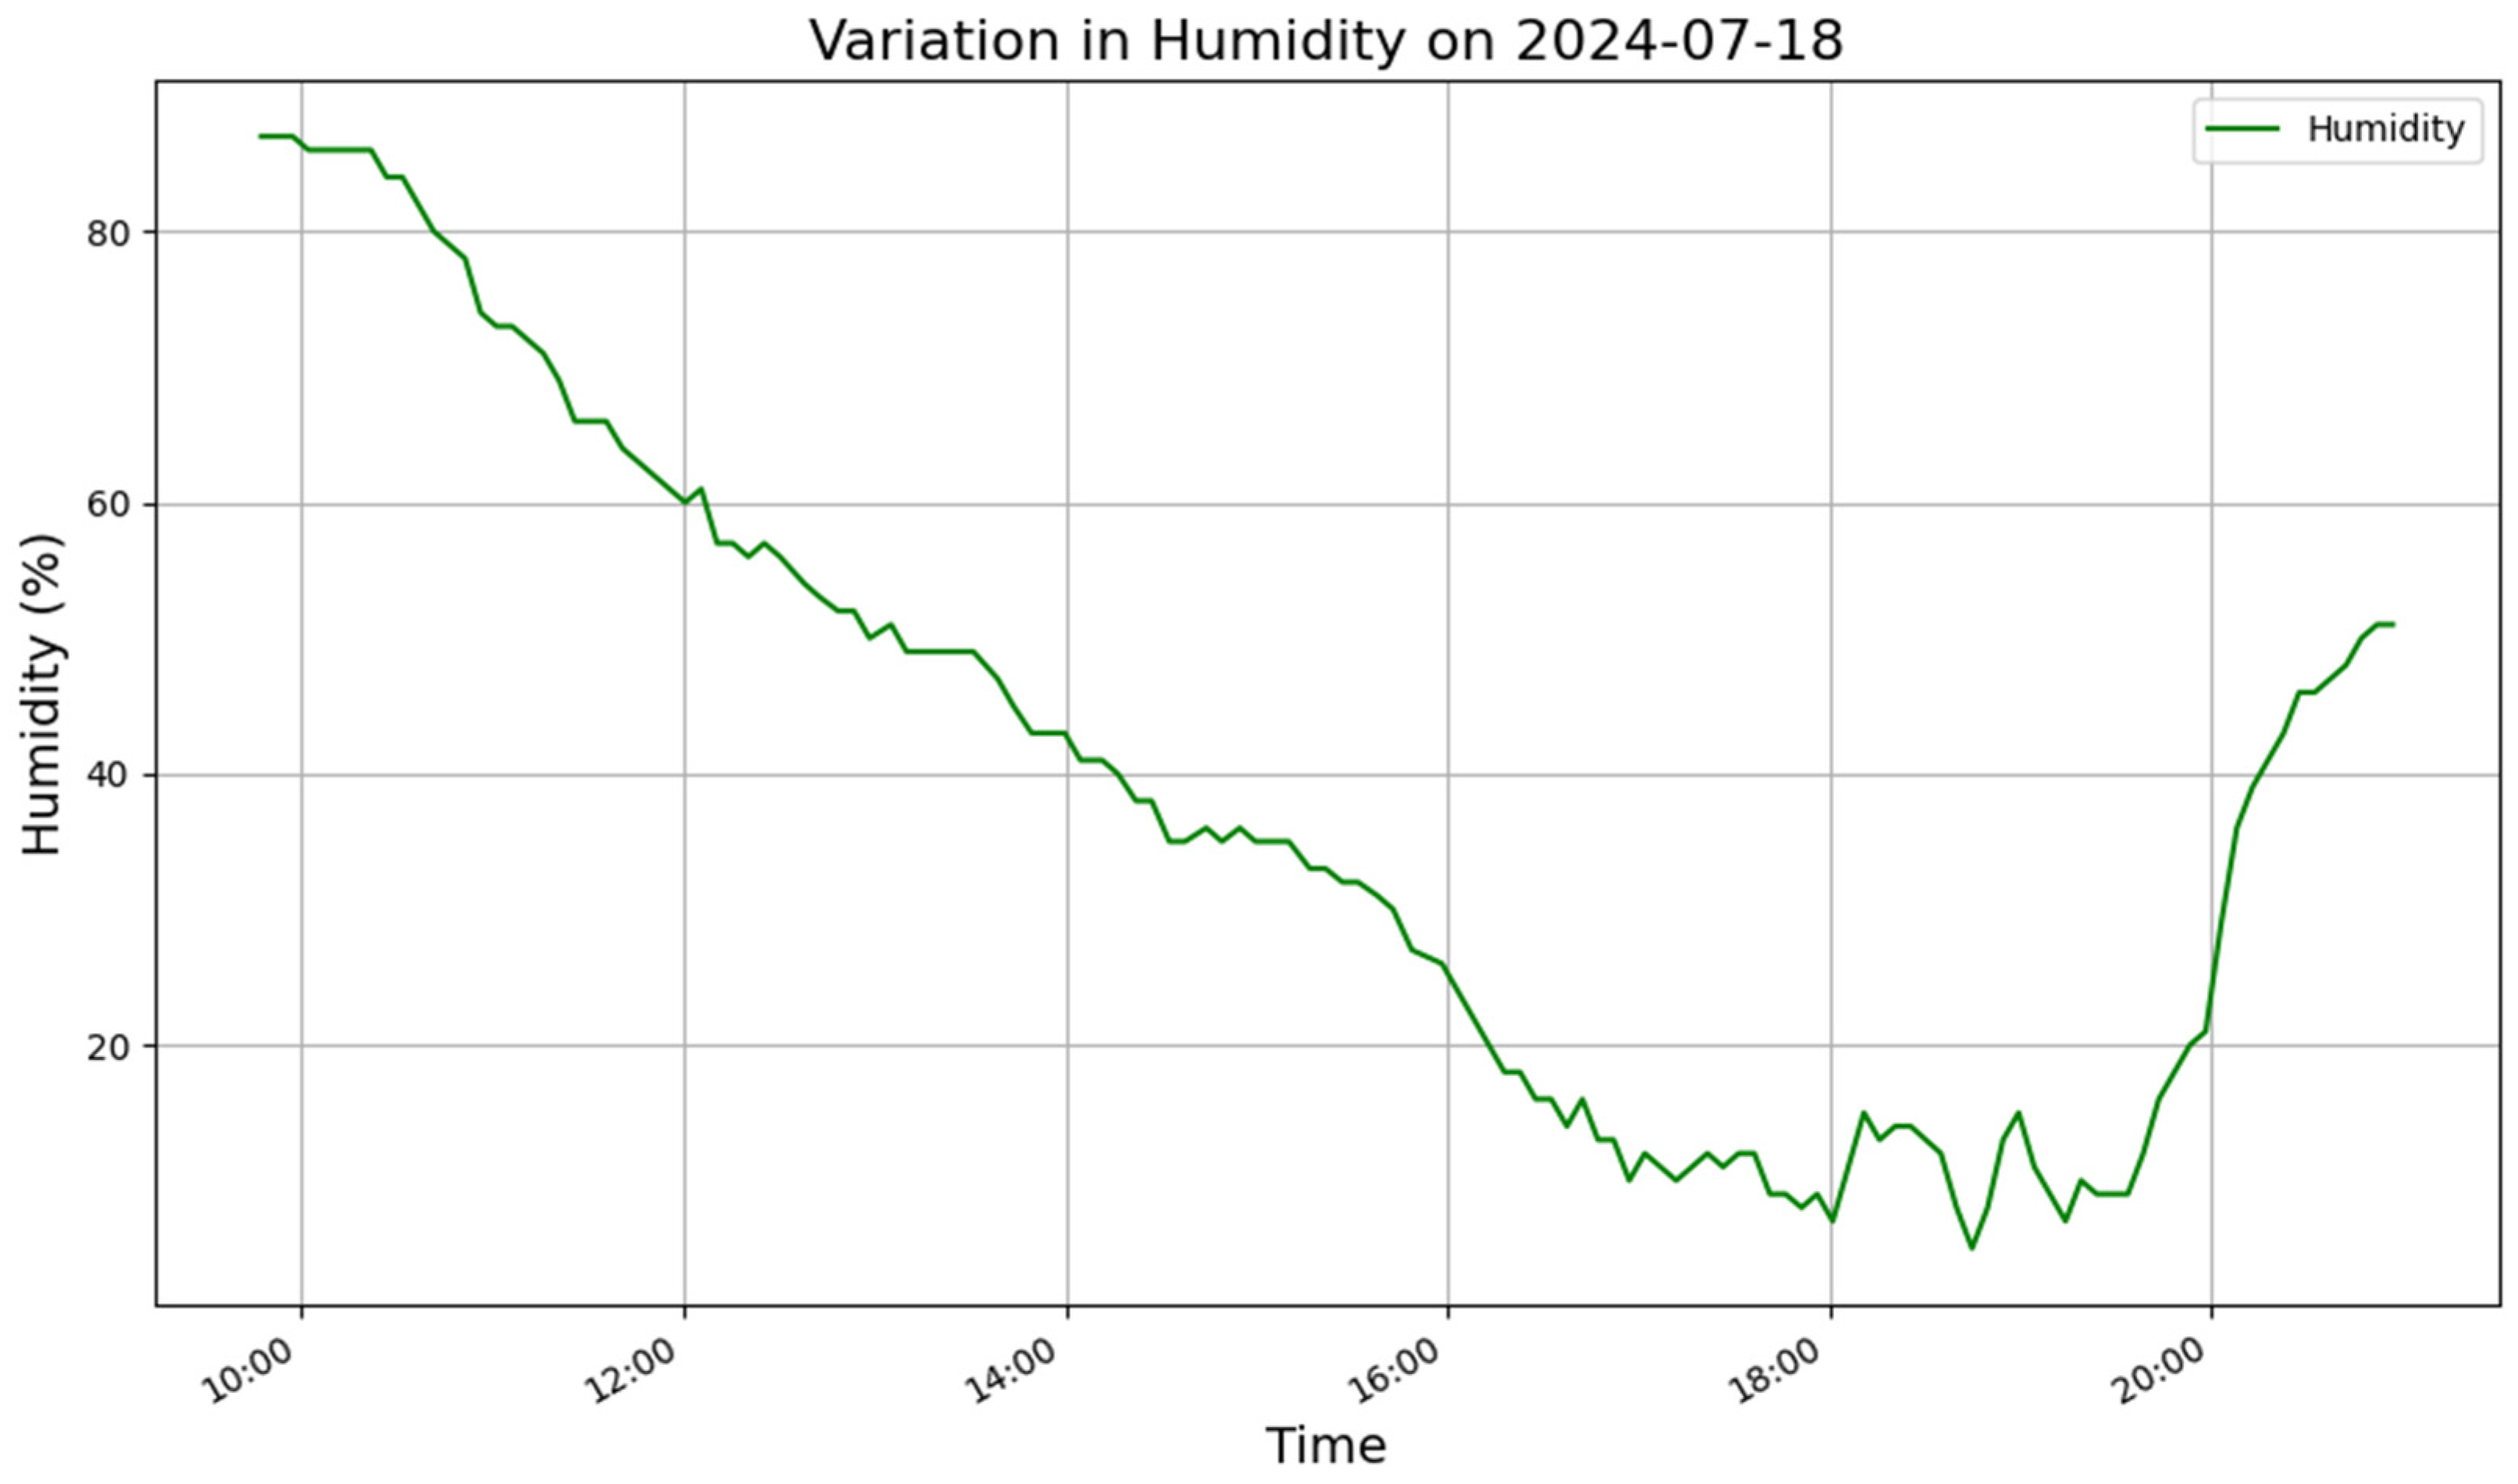
Figure 24 illustrates the variation in humidity on the first day. Immediately after the system was activated, an initial peak in humidity levels was observed, which may be associated with the typical climatic conditions of the Amazon region, such as high humidity in the morning. Throughout the day, humidity levels gradually decreased in response to the rising temperature, reflecting the increased evaporation rate. Around 18:00, humidity levels began to rise again due to the drop in temperature and the cooling process of the environment. This cyclic pattern highlights the strong correlation between humidity and the daily temperature variation.
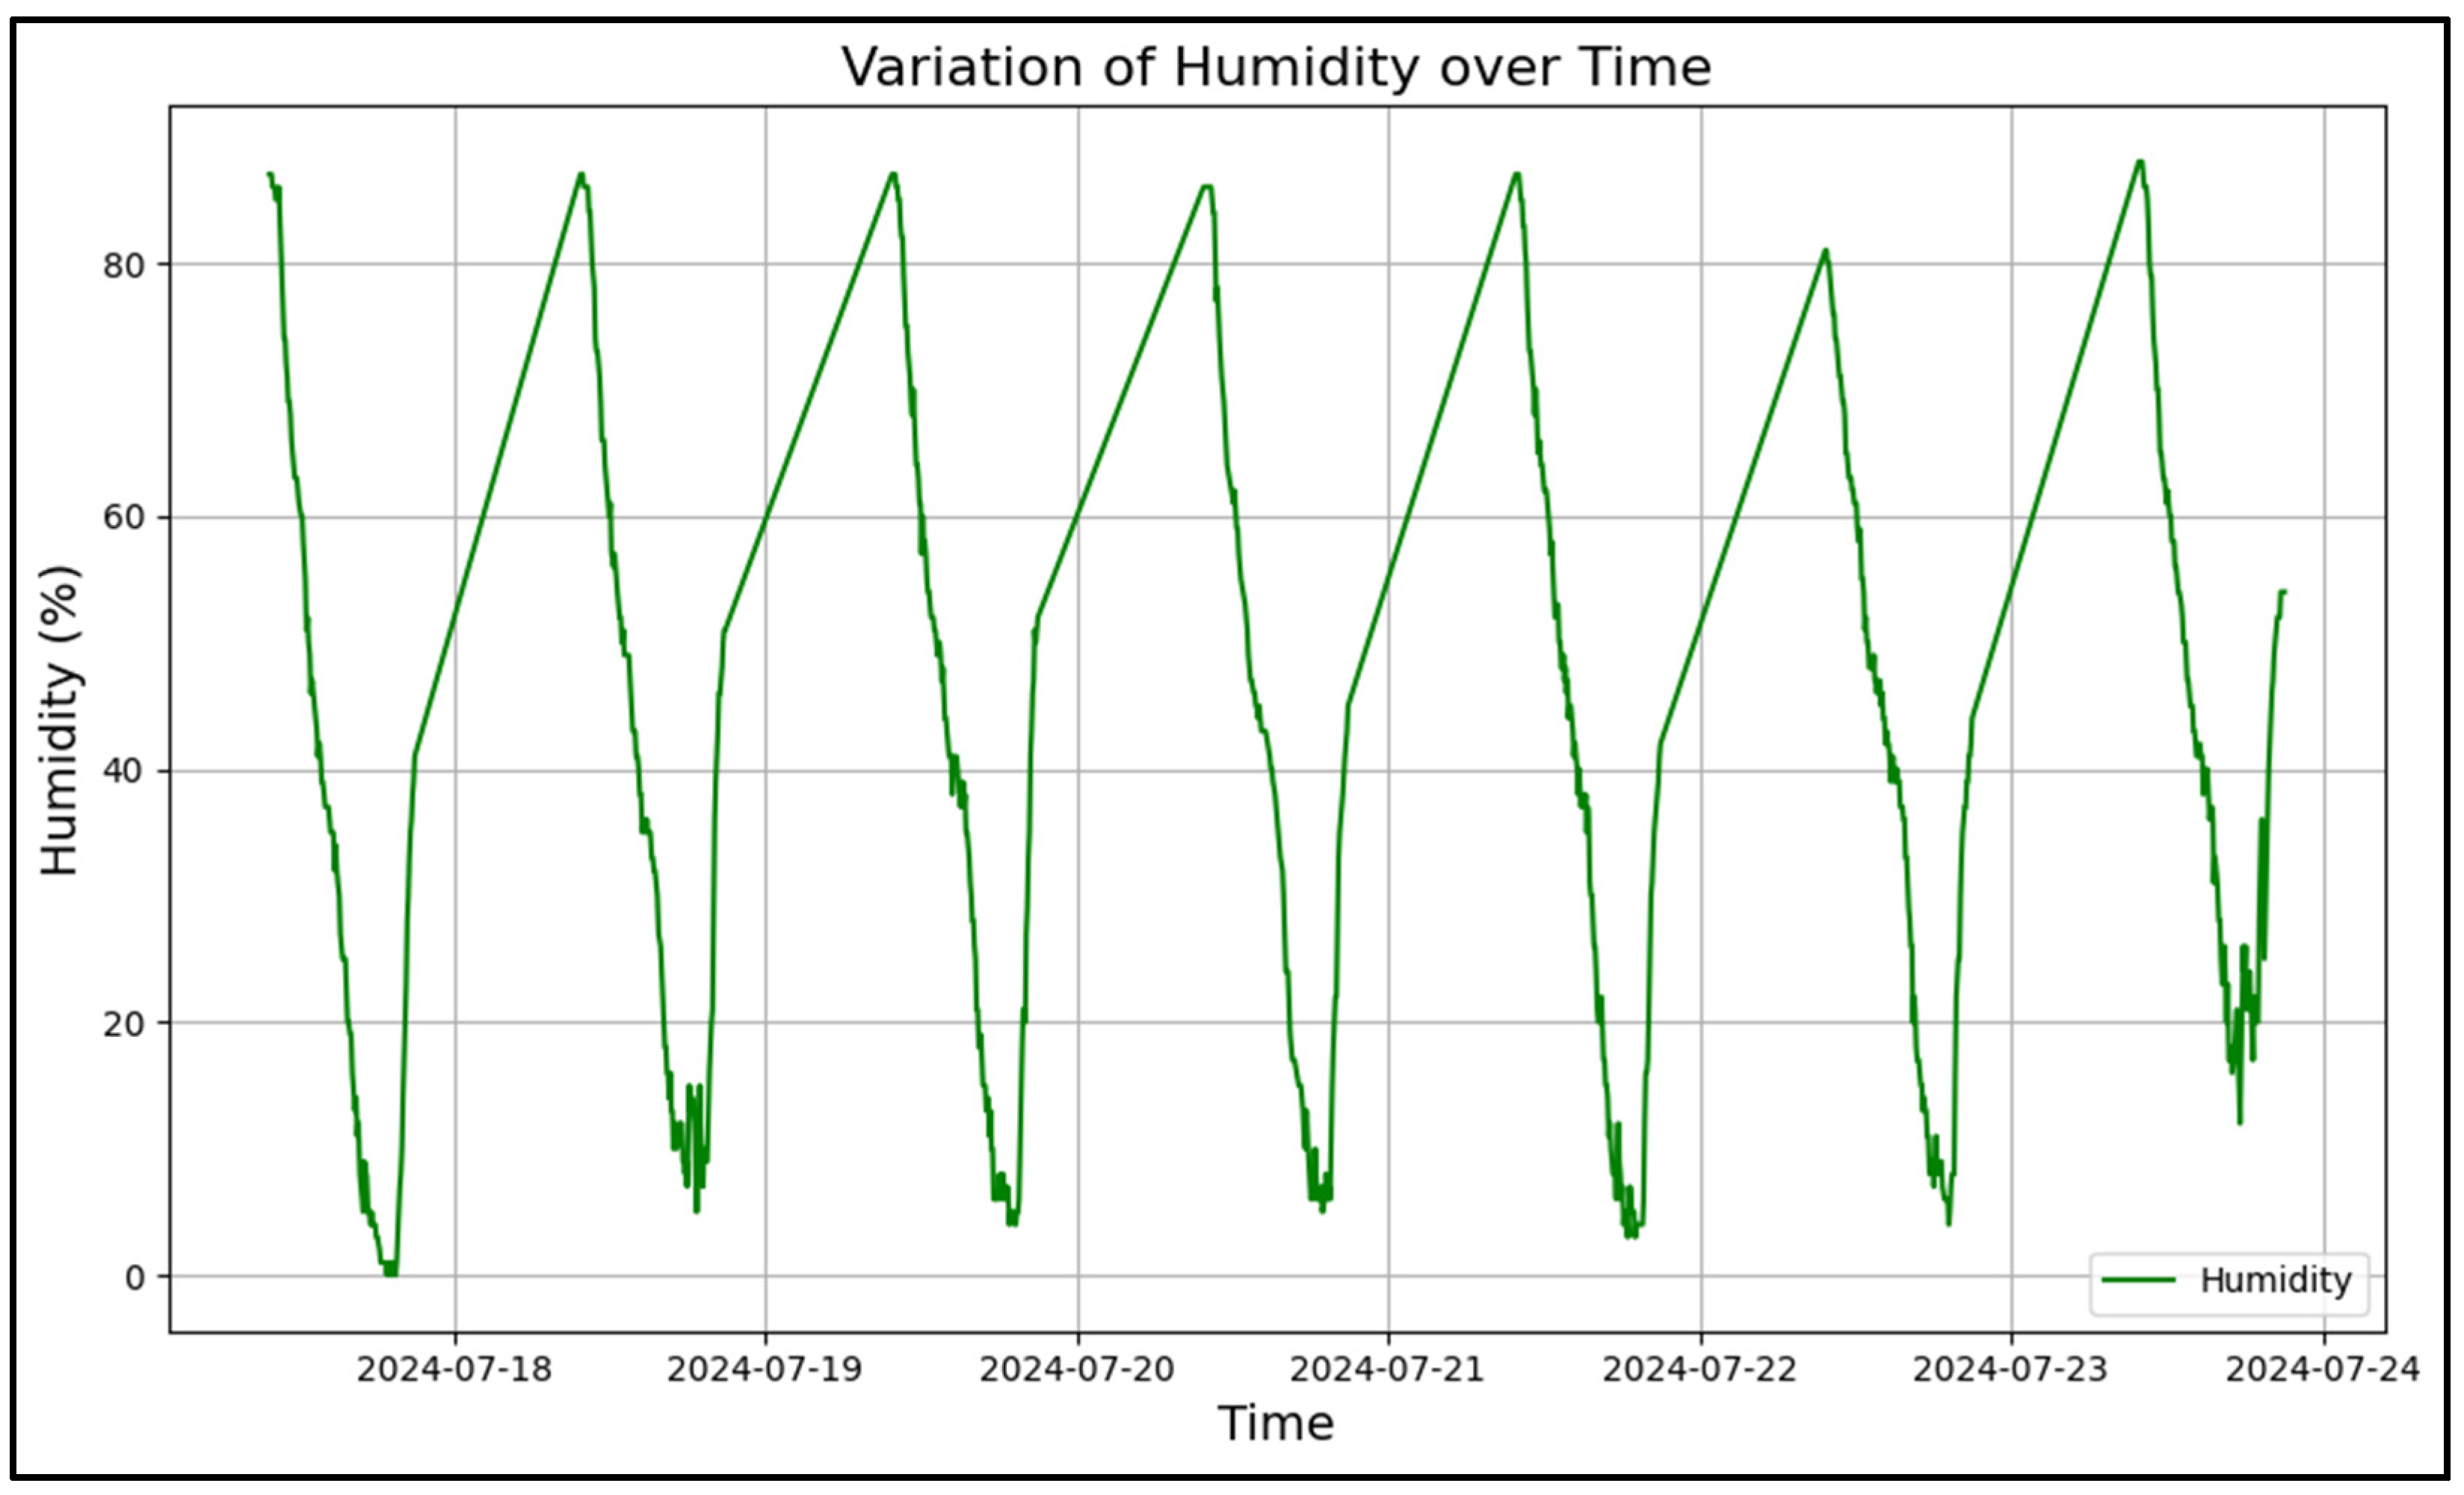
Figure 25 shows the variation in humidity during the monitoring week. The pattern observed in
Figure 24 was repeated throughout the other days, with the exception of the sixth day, which showed lower humidity levels, possibly due to variations in weather conditions. The last day of monitoring showed a less pronounced decline in humidity, suggesting that environmental factors, such as the lack of intense sunlight or changes in wind patterns, may have influenced the stability of humidity.
Figure 26 demonstrates the stability of the power supply system over the week. The battery charge remained at adequate levels throughout the monitoring period, confirming the effectiveness of the power supply system, which consists of a lithium battery and a photovoltaic module. No critical drops in charge were observed that could compromise the system’s operation, which attests to the device’s reliability in operating continuously, even under variable solar radiation conditions. These results reinforce the feasibility of using self-sustaining systems for monitoring in remote regions, ensuring reliable and continuous operation.
The results of the temperature and humidity monitoring reveal crucial insights into how controlling these factors can enhance the durability and efficiency of photovoltaic systems [
24,
25]. High temperatures can reduce conversion efficiency and accelerate material degradation, compromising the long-term sustainability of systems [
13]. Keeping temperature and humidity under control helps extend the lifespan of the modules, resulting in fewer replacements and a lower environmental impact.
Furthermore, it is worth noting that the results of the embedded system developed were satisfactory, demonstrating effective and stable operation in challenging environments. The structure of the device ensures protection against water and dust, while the temperature data collected showed significant differences at different analysis points on the photovoltaic modules. Communication via MQTT was efficient and without packet loss, and the possibility of remote calibration of the sensors guaranteed data accuracy. Through the web graphical interface of the IoT middleware, it was possible to perform real-time monitoring, with fast updates and without delays, confirming its suitability for the maintenance of photovoltaic systems in the Amazon region.
5. Conclusions
This work presented the development of an IoT embedded system for thermal and humidity monitoring in photovoltaic modules, with centralized data storage, visualization, and data request functionalities included in a single IoT platform. The system also incorporates remote communication, power supply via a mini-photovoltaic setup, and structural advancements such as the use of a PCB board to minimize interference and an enclosure that enhances the thermal insulation of the thermistor. These features ensure greater precision and operational robustness.
The results highlight the expansion of environmental monitoring scope by including humidity as a variable and improvements in communication efficiency with OTA updates. Furthermore, data storage and monitoring were successfully implemented through the IoT middleware Dojot. Data validation through the comparison of two sensor types (DHT11 and NTC thermistor) reinforces the system’s reliability, which was designed to operate under challenging conditions, such as those found in the Amazon region.
Additionally, the device is scalable and adaptable, making it easily adjustable for photovoltaic installations of different sizes via an increase in the number of embedded modules used and their different conditions, with the necessary adjustments in sensor types and quantities.
The digitalization of monitoring in photovoltaic systems has proven to be a valuable tool for promoting energy efficiency and prolonging component lifespan by monitoring conditions that directly impact energy generation and module integrity. Variables such as temperature and humidity, if not properly managed, can cause degradation, corrosion, and electrical failures, impacting the overall efficiency of systems. The proposed system offers a practical and efficient solution to address these challenges, reducing the need for manual interventions and contributing to the intelligent management of modules.
The developed device has great potential for application in photovoltaic power plants, especially in the context of the growing solar sector as a primary energy source during the energy transition. Furthermore, the practices presented in this study align with the Sustainable Development Goals (SDGs), such as SDG 7 (Affordable and Clean Energy) and SDG 13 (Climate Action), by reducing environmental impacts, improving energy generation efficiency, and extending the lifespan of photovoltaic modules. This work reinforces the importance of intelligent and sustainable solutions to address global energy challenges, particularly in regions like the Amazon.
6. Future Work
In seeking to improve the work, we propose that the next steps, which will become future tasks, involve utilizing the acquired data to detect anomalies and identify out-of-pattern readings. This will be conducted through analyses of how these variations can influence energy generation, enabling proactive corrective actions to ensure maximum efficiency of the photovoltaic system (SFV). A detailed quantitative analysis is also planned to examine how temperature and humidity variations affect the performance of the photovoltaic system, contributing to a deeper understanding and optimization of energy generation.
Furthermore, future studies may involve seasonal analysis or variation over the course of a day, with prolonged and comprehensive measurements. This way, deeper analyses of the relationship between the monitored variables (temperature and humidity) and energy efficiency can be explored in future work.
As part of these efforts, the addition of new sensors will be considered, such as those for acquiring direct solar radiation, aiming to analyze the effects of irradiation and heat conduction on the system. The temperature of the inverter will also be monitored, as high temperatures can compromise the efficiency of internal components, such as transistors and capacitors, reducing energy conversion and shortening their lifespan. The monitoring of direct solar radiation will also allow for the evaluation of radiation’s impact on material degradation, enriching the system’s analysis. Stress tests will also be conducted to ensure the system’s robustness and reliability, guaranteeing continuous and effective operation even under adverse conditions.
Another key future task is performing stress tests to verify the embedded system’s robustness and reliability, ensuring its continuous and effective operation even in challenging conditions. Additionally, there are plans to compare the developed embedded system with similar commercial systems already available on the market.
It is also worth noting that the developed embedded system could potentially be used to monitor different renewable energy sources, such as wind turbines. However, the system’s hardware would require modifications, such as the addition of other sensors and the definition of new monitoring points, like variables such as wind speed and vibration. There is also the recommendation to remove the functionality that limits operation to daytime, implemented to reduce the system’s energy consumption.
Author Contributions
Conceptualization, Y.L., L.S., E.L., W.F., K.S., I.R. and M.S.; Methodology, Y.L., L.S., E.L., W.F., K.S., I.R. and M.S.; Software, Y.L., L.S., E.L., W.F., K.S., I.R. and M.S.; Validation, Y.L., L.S., E.L., W.F., K.S., I.R. and M.S.; Formal analysis, Y.L., L.S., E.L., W.F., K.S., I.R. and M.S.; Investigation, Y.L., L.S., E.L., W.F., K.S., I.R. and M.S.; Resources, Y.L., L.S., E.L., W.F., K.S., I.R. and M.S.; Data curation, Y.L., L.S., E.L., W.F., K.S., I.R. and M.S.; Writing—original draft, Y.L., L.S., E.L., W.F., K.S., I.R. and M.S.; Writing—review & editing, Y.L., L.S., E.L., W.F., K.S., I.R. and M.S.; Visualization, Y.L., L.S., E.L., W.F., K.S., I.R. and M.S.; Supervision, Y.L., L.S., E.L., W.F., K.S., I.R. and M.S.; Project administration, Y.L., L.S., W.F., K.S., I.R. and M.S.; Funding acquisition, Y.L., L.S., W.F., K.S., I.R. and M.S. All authors have read and agreed to the published version of the manuscript.
Funding
This research was funded by the Financing Agency for Studies and Projects (FINEP) of the Ministry of Science, Technology and Innovation (MCTIC), carried out through the National Science and Technology Plan of the MCTI/FINEP/AT Call for Proposals—Advanced Materials and Strategic Minerals 2020 No. 066/21.
Data Availability Statement
The original contributions presented in this study are included in the article. Further inquiries can be directed to the corresponding author.
Acknowledgments
The authors of this article would like to thank the Financing Agency for Studies and Projects (FINEP) of the Ministry of Science, Technology and Innovation (MCTIC) for their support in carrying out this work, within the scope of the Project entitled “Technological Development and Innovative Extension of Advanced Materials in Energy and Mobility applied to the Amazon context” (EMOB-AMAZON). The authors would also like to thank the Coordination for the Improvement of Higher Education Personnel (CAPES), the Graduate Program in Electrical Engineering (PPGEE), the Center of Excellence in Energy Efficiency of the Amazon (CEAMAZON), and SMA Brasil Tecnologia Solar LTDA.
Conflicts of Interest
The authors declare no conflicts of interest.
Abbreviations
| Abbreviation | Meaning | | |
| A | Electrical Current Ampere [A] | GUI | Graphical User Interface |
| C | Cubic Term Coefficient | IoT | Internet of Things |
| CH3COO(CH2)4CH3 | Amyl Acetate | JSON | JavaScript Object Notation |
| CH3(CO)CH3 | Propane | LDR | Light Dependent Resistor |
| FeCl3 | Ferric Perchloric Acid | MCTIC | Ministry of Science, Technology and Innovation |
| ln | Natural Logarithm | MQTT | Message Queuing Telemetry Transport |
| P | Electrical Power in Watts [W] | NTC | Negative Temperature Coefficient |
| R | Electrical Resistance in Ohms [Ω] | SDG | Sustainable Development Goals |
| T | Temperature in Kelvin [K] or Degrees Celsius [°C] | OTA | Over-the-Air |
| V | Voltage [V] | PCB | Printed Circuit Board |
| CAPES | Coordination for the Improvement of Higher Education Personnel | PET-G | Polyethylene Terephthalate Glycol |
| | | PLA | Polylactic Acid |
| CEAMAZON | Amazon Center of Excellence in Energy Efficiency | PPGEE | Graduate Program in Electrical Engineering |
| COP | Conference of the Parties | SFVs | Photovoltaic System |
| EMOB-AMAZON | Technological Development and Innovative Extension of Advanced Materials in Energy and Mobility Applied to the Amazon Context | UFPA | Federal University of Pará |
| GEE | Greenhouse Gases | β | Thermal Management Coefficient of the Photovoltaic Module |
References
- IRENA. Renewable Power Generation Costs in 2023; International Renewable Energy Agency: Abu Dhabi, United Arab Emirates, 2024. [Google Scholar]
- Xu, M.; David, J.; Kim, S. The Fourth Industrial Revolution: Opportunities and Challenges. Int. J. Financ. Res. 2018, 9, 90. [Google Scholar] [CrossRef]
- Abrão, R.A.F. The Geopolitics of Renewable Energies: Brazil Amidst a Transforming Global Scenario. Monções J. Int. Relat. UFGD 2022, 11, 118–150. [Google Scholar] [CrossRef]
- Debastiani, L.H.; Senger, R.W. Entre o desenvolvimento e a proteção ambiental. Princípios 2024, 43, 47–66. [Google Scholar] [CrossRef]
- Naik, R.S.K.; Devaraju, T. Intelligent Distribution Systems and Grid Integration of Renewable Energy Resources. In Proceedings of the Second International Conference on Smart Technologies for Power and Renewable Energy (SPECon), Ernakulam, India, 2–4 April 2024. [Google Scholar]
- Seah, S.; McGowan, P.; Xing, M.L.Y.; Martinus, M.; Ghoshray, A.; Lorusso, M.; Wong, R.; Poh Onn, L.; Elliott, L.; Setyowati, A.; et al. Energy Transitions in ASEAN, COP26 Policy Report, November 2021. Available online: https://assets.publishing.service.gov.uk/media/6204c9728fa8f5109bfe1183/Energy_Transitions_COP26_Universities_Network_Policy_Report.pdf (accessed on 22 April 2024).
- Bogdanov, D.; Ram, M.; Aghahosseini, A.; Gulagi, A.; Oyewo, A.S.; Child, M.; Caldera, U.; Sadovskaia, K.; Farfan, J.; Simas Barbosa, L.S.N.; et al. Low-Cost Renewable Electricity as the Key Driver of the Global Energy Transition towards Sustainability. Energy 2021, 227, 120467. [Google Scholar] [CrossRef]
- Asbayou, A.; Soussi, A.; Isknan, I.; Aamoume, A.; El Fanaoui, A.; Ihlal, A.; Bouhouch, L. Method Using Simple RLC Circuit for Electrical Characterization of PV Panels. Mater. Today Proc. 2022, 58, 1033–1038. [Google Scholar] [CrossRef]
- Asbayou, A.; Ihlal, A.; Isknan, I.; Soussi, A.; Bouhouch, L. Structural and Physicochemical Properties of Dust and Their Effect on Solar Modules Efficiency in Agadir-Morocco. J. Renew. Mater. 2023, 11, 2249–2264. [Google Scholar] [CrossRef]
- Ministry of Mines and Energy. Brazil Sets Record for Solar Energy Expansion in 2023; With the Construction of Photovoltaic and Wind Power Plants, Brazil’s Electrical Matrix Reaches 83.79% Renewable Sources, Setting an International Benchmark. 2023. Available online: https://www.gov.br/mme/pt-br/assuntos/noticias/brasil-bate-recorde-de-expansao-da-energia-solar-em-2023 (accessed on 27 August 2024).
- Jurasz, J.; Ceran, B.; Orłowska, A. Component Degradation in Small-Scale Off-Grid PV-Battery Systems Operation in Terms of Reliability, Environmental Impact, and Economic Performance. Sustain. Energy Technol. Assess. 2020, 38, 100647. [Google Scholar] [CrossRef]
- Overstraeten, R.W.; Mertens, R.P. Physics, Technology and Use of Photovoltaics; Modern Energy Studies; IET: London, UK, 1996. [Google Scholar]
- Jurinic, F.; Palacios-Felix, J.L.; Cassol, F.; Jurinic, C.K. Study for Improving the Performance and Efficiency of Photovoltaic Panels: Through a Cooling System. J. Manag. Environ. Sustain. 2022, 11, 51–64. [Google Scholar]
- Adhya, S.; Saha, D.; Das, A.; Jana, J.; Saha, H. An IoT-Based Smart Solar Photovoltaic Remote Monitoring and Control Unit. In Proceedings of the 2016 2nd International Conference on Control, Instrumentation, Energy & Communication (CIEC), Kolkata, India, 28–30 January 2016; pp. 432–436. [Google Scholar] [CrossRef]
- Lisboa, Y.; Santos, L.; Lobato, P.; Fonseca, F.; Silva, K.; Rodrigues, I.; Silva, M.O. Development of an Embedded System for Monitoring a Solar Power Plant in the Amazon Region. In Proceedings of the 15th IEEE International Conference on Industry Applications (INDUSCON), São Bernardo do Campo, Brazil, 22–24 November 2023; pp. 1715–1722. [Google Scholar] [CrossRef]
- González, I.; Calderón, A.J.; Portalo, J.M. Innovative Multi-Layered Architecture for Heterogeneous Automation and Monitoring Systems: Application Case of a Photovoltaic Smart Microgrid. Sustainability 2021, 13, 2234. [Google Scholar] [CrossRef]
- Ksira, Z.; Mellit, A.; Blasutting, N.; Massi Pavan, A. A Novel Embedded System for Real-Time Fault Diagnosis of Photovoltaic Modules. IEEE J. Photovolt. 2024, 14, 354–362. [Google Scholar] [CrossRef]
- Cheng, C.; Liu, M.; Yi, H.; Wang, J.; Chen, H. Tendency-Aided Data-Driven Method for Hot Spot Detection in Photovoltaic Systems. IEEE J. Emerg. Sel. Top. Ind. Electron. 2022, 3, 901–910. [Google Scholar] [CrossRef]
- Pramana, P.A.A.; Dalimi, R. Prediction of Photovoltaic (PV) Thermal Fault Location Using the Catadioptric Device. IEEE Access 2023, 11, 75587–75598. [Google Scholar] [CrossRef]
- Portalo, J.M.; González, I.; Calderón, A.J. Monitoring System for Tracking a PV Generator in an Experimental Smart Microgrid: An Open-Source Solution. Sustainability 2021, 13, 8182. [Google Scholar] [CrossRef]
- Hamied, A.; Mellit, A.; Benghanem, M.; Boubaker, S. IoT-Based Low-Cost Photovoltaic Monitoring for a Greenhouse Farm in an Arid Region. Energies 2023, 16, 3860. [Google Scholar] [CrossRef]
- Yue, S.; Guo, M.; Zou, P.; Zhang, X.; Liu, H. Effects of Photovoltaic Panels on Soil Temperature and Moisture in Desert Areas. Environ. Sci. Pollut. Res. 2021, 28, 17506–17518. [Google Scholar] [CrossRef]
- Silva, D.D.; Marson, V.; Souza, R.R.; Oliveira, J.D.; Silva, J.B.C.; Cardoso, E.M. A New Predictive Model for a Photovoltaic Module’s Surface Temperature. Energy Rep. 2022, 8, 15206–15220. [Google Scholar] [CrossRef]
- Reda, M.N.; Spinnler, M.; AL-Kayiem, H.H.; Sattelmayer, T. Assessment of Condensation and Thermal Control in a Photovoltaic Panel by PV/T and Ground Heat Exchanger. Sol. Energy 2021, 221, 502–511. [Google Scholar] [CrossRef]
- Martins da Rocha, N.M.; Lapolli Brighenti, L.; César Passos, J.; Cruz Martins, D. Photovoltaic Cell Cooling as a Facilitator for MPPT. IEEE Lat. Am. Trans. 2019, 17, 1569–1577. [Google Scholar] [CrossRef]
- Espressif Systems. ESP32-WROOM-32D & ESP32-WROOM-32U, Datasheet. 2023. Available online: https://www.espressif.com/sites/default/files/documentation/esp32-wroom-32d_esp32-wroom-32u_datasheet_en.pdf (accessed on 25 March 2024).
- He, W.; Iqbal, M.T. Power Consumption Minimization of a Low-Cost IoT Data Logger for Photovoltaic System. J. Electron. Electr. Eng. 2023, 241–261. [Google Scholar] [CrossRef]
- EPCOS. NTC Thermistors for Temperature Measurement, EPCOS Datasheet. 2006. Available online: https://www.tme.eu/Document/7f93a3d121ea8402378cf8bc6239e8d2/B57164K104J-EPCOS-datasheet-10192.pdf (accessed on 23 April 2024).
- Yu, C.; Zhou, W.; Sun, B.; Zhou, H. Study on NTC Thermistor Characteristic Curve Fitting Methods. In Proceedings of the 2011 International Conference on Computer Science and Network Technology, Harbin, China, 24–26 December 2011; IEEE: New York, NY, USA, 2011; pp. 2209–2213. [Google Scholar]
- Climatempo. Weather Forecast Now: Belém—PA. Available online: https://www.climatempo.com.br/previsao-do-tempo/agora/cidade/232/belem-pa (accessed on 30 November 2024).
- Wu, W.; Yue, S.; Zhou, X.; Guo, M.; Wang, J.; Ren, L.; Yuan, B. Observational Study on the Impact of Large-Scale Photovoltaic Development in Deserts on Local Air Temperature and Humidity. Sustainability 2020, 12, 3403. [Google Scholar] [CrossRef]
- RESUN. RESUN RSM020P Datasheet, RESUN Solar Panels. 2021. Available online: https://www.solarbrasil.com.br/wp-content/uploads/2023/08/Datasheet-RESUN-RSM020P-20W.pdf (accessed on 11 February 2024).
- Fonseca, W.D.S.; Silva, M.O.E.; Lobato, E.P.S.; Sousa, A.R.M.; Rodrigues, I.C.D.S.; Santos, J.F. Study on the Thermal Effect in Floating Photovoltaic Plants (FPP) through Computational Simulation. In Proceedings of the 11th Brazilian Congress of Oil and Gas, Belém, Brazil, 9–12 October 2022; Galoá: Campinas, Brazil, 2022. [Google Scholar]
- Al Enany, M.O.; Harb, H.M.; Attiya, G. A Comparative Analysis of MQTT and IoT Application Protocols. In Proceedings of the 2021 International Conference on Electronic Engineering (ICEEM), Menouf, Egypt, 13–15 December 2021; IEEE: New York, NY, USA, 2021; pp. 1–6. [Google Scholar] [CrossRef]
- ON Semiconductor. LM317T Voltage Regulator Datasheet. 2014. Available online: https://d229kd5ey79jzj.cloudfront.net/436/MC7800-D.PDF (accessed on 5 January 2024).
- National Semiconductor. LM117/LM317A/LM317 3-Terminal Adjustable Regulator. 2024. Available online: https://www.jameco.com/Jameco/Products/ProdDS/898800.pdf?srsltid=AfmBOoo1HstIqUBW9b9maHaErn4vhsZ-G099hr8lEmdpNdzw6o0V0ffE (accessed on 25 November 2024).
- Alfalouji, Q.; Schranz, T.; Kümpel, A.; Schraven, M.; Storek, T.; Gross, S.; Monti, A.; Müller, D.; Schweiger, G. IoT Middleware Platforms for Smart Energy Systems: An Empirical Expert Survey. Buildings 2022, 12, 526. [Google Scholar] [CrossRef]
- Lobato, E.; Prazeres, L.; Medeiros, I.; Araújo, F.; Rosário, D.; Cerqueira, E.; Tostes, M.; Bezerra, U.; Fonseca, W.; Antloga, A. A Monitoring System for Electric Vehicle Charging Stations: A Prototype in the Amazon. Energies 2023, 16, 152. [Google Scholar] [CrossRef]
- Sun, C.; Xing, R.; Wu, Y.; Zhou, G.; Zheng, F.; Hu, D. Design of Over-the-Air Firmware Update and Management for IoT Device with Cloud-based RESTful Web Services. In Proceedings of the 2021 China Automation Congress (CAC), Beijing, China, 22–24 October 2021; pp. 5081–5085. [Google Scholar] [CrossRef]
- 3M. Technical Data of 3M VHB Tape Products, 3M Technical Datasheet. 2024. Available online: https://multimedia.3m.com/mws/media/1859865O/product-data-sheet-vhb-tapes.pdf (accessed on 22 January 2024).
- Minipa. ET-2042E Instruction Manual. 2024. Available online: https://www.minipa.com.br/images/Manual/ET-2042E-1101-BR.pdf (accessed on 12 February 2024).
- Al-Ghussain, L.; Taylan, O.; Abujubbeh, M.; Hassan, M.A. Optimizing the orientation of solar photovoltaic systems considering the effects of irradiation and cell temperature models with dust accumulation. Sol. Energy 2023, 249, 67–80. [Google Scholar] [CrossRef]
Figure 1.
Prototype of the developed embedded system.
Figure 1.
Prototype of the developed embedded system.
Figure 2.
Location of temperature sensors in the photovoltaic solar system.
Figure 2.
Location of temperature sensors in the photovoltaic solar system.
Figure 3.
Validation test: (a) power supply photovoltaic board; (b) embedded system; (c) power supply voltage measurement; (d) ambient temperature measurement; (e) monitored data in the Dojot IoT middleware.
Figure 3.
Validation test: (a) power supply photovoltaic board; (b) embedded system; (c) power supply voltage measurement; (d) ambient temperature measurement; (e) monitored data in the Dojot IoT middleware.
Figure 4.
Schematic of the sensing module, including the temperature and humidity sensors.
Figure 4.
Schematic of the sensing module, including the temperature and humidity sensors.
Figure 5.
Schematic of the automatic drive and power management module.
Figure 5.
Schematic of the automatic drive and power management module.
Figure 6.
Photovoltaic module used in the embedded system.
Figure 6.
Photovoltaic module used in the embedded system.
Figure 7.
(A) Voltage regulator; (B) charging module.
Figure 7.
(A) Voltage regulator; (B) charging module.
Figure 8.
The electronic circuit schematic for PCB.
Figure 8.
The electronic circuit schematic for PCB.
Figure 9.
3D model of the embedded system: (A) bottom view and (B) front view.
Figure 9.
3D model of the embedded system: (A) bottom view and (B) front view.
Figure 10.
3D model of the temperature sensor case: (A) front contact part; (B) back part.
Figure 10.
3D model of the temperature sensor case: (A) front contact part; (B) back part.
Figure 11.
Communication architecture of the developed system.
Figure 11.
Communication architecture of the developed system.
Figure 12.
Flowchart of the embedded system operation.
Figure 12.
Flowchart of the embedded system operation.
Figure 13.
PCB during its production process: (A) electronic circuit with copper connections; (B) electronic components soldered onto the PCB.
Figure 13.
PCB during its production process: (A) electronic circuit with copper connections; (B) electronic components soldered onto the PCB.
Figure 14.
Final model of the embedded system: (A) without cover; (B) with cover.
Figure 14.
Final model of the embedded system: (A) without cover; (B) with cover.
Figure 15.
The case and temperature sensor are ready for installation: (A) front contact part; (B) back part.
Figure 15.
The case and temperature sensor are ready for installation: (A) front contact part; (B) back part.
Figure 16.
IoT embedded system developed and implemented in a photovoltaic plant in the Amazon Region: (A) the electronic circuit installed and (B) the embedded system installed with all components.
Figure 16.
IoT embedded system developed and implemented in a photovoltaic plant in the Amazon Region: (A) the electronic circuit installed and (B) the embedded system installed with all components.
Figure 17.
Double-sided tape data show the difference between families in the datasheet [
40].
Figure 17.
Double-sided tape data show the difference between families in the datasheet [
40].
Figure 18.
The temperature sensor case installed on the back of the PV module.
Figure 18.
The temperature sensor case installed on the back of the PV module.
Figure 19.
Data recorded from the embedded system sensors.
Figure 19.
Data recorded from the embedded system sensors.
Figure 20.
Receiving data in the Dojot IoT middleware via MQTT.
Figure 20.
Receiving data in the Dojot IoT middleware via MQTT.
Figure 21.
Update of the embedded system via OTA.
Figure 21.
Update of the embedded system via OTA.
Figure 22.
Temperature variation at different points related to the PV module over a week.
Figure 22.
Temperature variation at different points related to the PV module over a week.
Figure 23.
Temperature variation at different points related to the PV module during the first day of monitoring.
Figure 23.
Temperature variation at different points related to the PV module during the first day of monitoring.
Figure 24.
Measurements of local humidity levels in the solar system during the first day.
Figure 24.
Measurements of local humidity levels in the solar system during the first day.
Figure 25.
Measurements of local humidity levels in the solar system over a week.
Figure 25.
Measurements of local humidity levels in the solar system over a week.
Figure 26.
The recorded battery charge percentage data.
Figure 26.
The recorded battery charge percentage data.
Table 1.
Comparison between the first version of the developed embedded system and the current version.
Table 1.
Comparison between the first version of the developed embedded system and the current version.
| No | Functionality | First Version [15] | Current Version |
|---|
| 1 | Thermal monitoring at three points of interest | X | X |
| 2 | Monitoring of ambient humidity | | X |
| 3 | Temperature validation with more than one type of sensor | | X |
| 4 | Dashboard for visualization | X | X |
| 5 | Dashboard concentration, data storage, and querying in IoT middleware | | X |
| 6 | Remote calibration via OTA using web server | | X |
| 7 | Activation system | X | X |
| 8 | Power supply with mini photovoltaic panel | X | X |
| 9 | Case to house the embedded system | X | X |
| 10 | PCB circuit | | X |
| 11 | Case to improve temperature sensor insulation | | X |
Table 2.
Components used to build the hardware part of the embedded system.
Table 2.
Components used to build the hardware part of the embedded system.
| Item | Component | Amount |
|---|
| 1 | Photovoltaic Panel 20 Wp | 1 |
| 2 | Battery Lipo 3.7 V | 1 |
| 3 | Thermistor NTC 10 K | 3 |
| 4 | Module TP4056 | 1 |
| 5 | Module Relé 5 V | 1 |
| 6 | Module LDR | 1 |
| 7 | Module LM317T | 1 |
| 8 | Sensor DHT 11 | 1 |
| 9 | ESP32 ESP-WROOM-32 | 1 |
| 10 | 2 Way Terminal Connector | 1 |
| 11 | Phenolite Board 20 × 20 | 1 |
| 12 | Female terminal | 1 |
| 13 | Male terminal | 1 |
| 14 | Plug cable | 2 |
| 14 | Transistor PNP | 1 |
| 15 | Blue PETG Filament | 1 |
| 16 | Red PETG Filament | 1 |
| 17 | Green PETG Filament | 1 |
| 18 | Resistors, Capacitors, etc. | 1 |
| Disclaimer/Publisher’s Note: The statements, opinions and data contained in all publications are solely those of the individual author(s) and contributor(s) and not of MDPI and/or the editor(s). MDPI and/or the editor(s) disclaim responsibility for any injury to people or property resulting from any ideas, methods, instructions or products referred to in the content. |
© 2025 by the authors. Licensee MDPI, Basel, Switzerland. This article is an open access article distributed under the terms and conditions of the Creative Commons Attribution (CC BY) license (https://creativecommons.org/licenses/by/4.0/).


 ,
, 


