Abstract
As a type of high-water-content agricultural waste, vegetable waste (VW) is extremely prone to spoilage and environmental pollution. Anaerobic digestion (AD) technology can accelerate the degradation of VW; however, its direct reaction might encounter the risk of termination due to excessive acidification. How to effectively prevent excessive acidification and further accelerate the degradation and maturity of VW remains a significant challenge at present. This paper employed the methods of AD of biogas and aerobic treatment (AT) of biogas slurry (BS) to develop a set of three groups of coupled devices for thermostatic anaerobic and aerobic processes with temperature control by solar collectors. The reaction process was further facilitated by adopting a mixture of raw materials and exogenous additives. In Lanzhou, a comparative experiment was carried out to examine the impacts of a blank group (BG) (additive-free), a 1 g/L urea group (UG), and a 1 g/L plant ash group (PG) on the decomposition process of the mixture of cow dung and tomato stems and leaves. The thermostatic batch wet AD stage of the mixed raw materials at (26 ± 2 °C) lasted for 49 days. The substrate after digestion underwent aerobic aeration treatment for 8 h at different temperatures and different aeration rates. The results show that the system could be initiated smoothly and maintain stable operation in winter under the temperature control of the solar collector; adding additives during AD significantly boosted biogas and methane production during the first 28 days, with urea being the most effective. During the subsequent aerobic phase, UG demonstrated the highest bio-effectiveness under optimized conditions of (30 ± 1 °C) and an aeration rate of 12 L/min. Comprehensive analysis revealed that the optimal operation strategy was identified as the use of UG with a 29-day reaction cycle. The research results have significant referential value for the rapid decomposition of high-water-content agricultural and livestock waste in cold regions.
1. Introduction
Untreated organic wastes, such as livestock manure and vegetable wastes (VWs), naturally decompose under anoxic conditions, producing biogas, which includes methane and CO2 [1]. Methane is 21 times more efficient at trapping heat in the atmosphere than CO2; if methane is directly released into the atmosphere, it accelerates global warming [2]. Biogas anaerobic digestion (AD) technology is adopted to process organic wastes (such as livestock manure and agricultural wastes) and generate clean energy [3,4,5]. This technology is a sustainable strategy for converting waste into energy [6]. In 2018, over 18,000 biogas AD plants were registered in Europe [7]. Compared with returning untreated organic waste directly to fields, biogas AD reduces the risk of pest and disease infestations and controls the release of methane [8].
A considerable body of research has focused on improving AD technology, primarily by optimizing the reaction process and designing more efficient devices. While new technologies show promise, many existing devices still face limitations, such as small working volumes and high operational and maintenance costs [9,10,11]. For example, some researchers have developed mechanical devices for pre-treating waste sludge [12], resulting in increased methane production and reduced treatment costs. Other innovations include ecological anaerobic reactors and gradient AD systems [13,14], which enhance biogas production efficiency by improving organic load rates and reducing hydraulic residence time (HRT). However, these advancements often come with increased costs or technical challenges, such as the accumulation of digestate at the bottom of the device or issues with reactor heating efficiency and digestate discharge. Some scholars have conducted a comparative analysis between anaerobic pond and high rate upflowed anaerobic sludge blanket (UASB) reactor and have concluded that there is no significant difference in their performance. Furthermore, the anaerobic pool has a lower initial investment, operational, and maintenance cost [15,16]. Biogas digesters equipped with solar heating systems can promote biogas production [17]. Li et al. [9] developed an AD device equipped with a solar energy system. Although it effectively addressed the temperature sensitivity issue of the AD device, technical problems such as thermal expansion and contraction, poor heat exchange effect of the coil, and difficulties in feedstock and digestate discharge still exist. Therefore, to overcome the above-mentioned difficulties, it is extremely necessary to develop a set of efficient and low-operation-cost AD device.
On the other hand, improper farm management and pesticide use practices can lead to reduced soil quality and ecological damage [18]. In China, the annual consumption of pesticides and fertilizers is approximately 1.806 billion kg and 5.8 billion kg, respectively [19]. The long-term overuse of these chemicals leads to significant losses in crop yields and pose risks to human health [20,21,22]. Large quantities of digestive solution (DS) are produced at the end of the AD reaction [23], which can amount to over 1 billion tons of biogas slurry (BS) annually in China [24]. Currently, the prevailing approaches for the treatment of BS are either discharge or resource utilization [25]. Nevertheless, the financial outlay involved in discharging the BS is considerable, which has resulted in this approach not being widely utilized. Research has shown that BS is a rich source of plant nutrients [26]. In comparison to farm fertilizer, the emission of odors from BS fertilization is less pronounced [27]. BS has the potential for soil improvement [28]. However, the untreated BS will not be able to meet the requirements for discharge, and it also contains residues of substances that are harmful to the soil, which can cause problems such as seedling burning. In the absence of intervention, soil health issues will arise [26]. Therefore, the BS used for agriculture requires additional treatment before use [29]. The EU and China have established standards for the agricultural use of decomposed BS [30,31], and clearly stated that the decomposed BS can be recycled for agricultural use. The BS from large-scale biogas projects must be allowed to undergo natural decomposition for a period of 60–90 days, or even up to six months, in order to achieve aerobic decomposition [32]. Despite this, efficient and cost-effective treatment methods for BS remain a challenge. Some studies have demonstrated that the installation of an aerobic device subsequent to the anaerobic process can effectively reduce the concentration of harmful pollutants in wastewater [33,34,35,36]. The process of AT of BS represents a means of transforming BS that has undergone AD into a green liquid fertilizer [37,38,39]. Through AT, the biological toxicity of BS can be decreased, and it can be converted into organic liquid fertilizer to promote the growth of plants, presenting certain economic and environmental benefits.
VWs, as a sort of agricultural waste with high moisture content, are extremely susceptible to decay and pollution of the ecological environment. AD technology can expedite the degradation of VW; however, its direct reaction might encounter the risk of reaction termination caused by excessive acidification [40]. Determining how to effectively avoid excessive acidification and further accelerate the degradation and decomposition rate of VW is a significant challenge at present. The selection of mixed raw materials for feedstock and the addition of exogenous additives constitutes a means to enhance the AD process of VW and facilitate the reaction progress. Jiang et al. [41] researched that, in contrast to single raw materials, conducting anaerobic co-digestion of sewage sludge and fruit and VW can improve the degradability of the raw materials and augment the biogas yield. Bres et al. [42] found that the AD of a mixture of livestock manure and fruit and VW resulted in higher yields of both biogas and methane compared to the reaction with a single raw material. Sha et al. [43] researched that the pretreatment process employing NaOH-urea additives could prominently enhance the methane production of AD of corn stalks. Xie et al. [44] developed a pretreatment approach using solid-state urea; the experimental outcomes demonstrated that this method exhibited a high efficiency in lignin removal, was beneficial for the hydrolysis of corn stalks, and enhanced the CMP of the raw materials. Qu et al. [45,46] found that straw ash can facilitate the AD of high-salinity organic wastewater, augment the proportion of viable cells in high-salinity circumstances, reduce the reaction start-up time, and improve methane yield and reaction stability. Ezieke et al. [47] found that the addition of the bottom ash generated from the combustion of waste coconut shells had a promoting effect on the methane yield of AD of berry waste. Evidently, it is feasible to select urea and plant ash as exogenous additives for the AD of VW. Li et al. [32] carried out thermostatic anaerobic and aerobic experiments on the mixture of vegetable pressing wastewater and VW, the experimental findings indicated that the material liquid could generate biogas during the anaerobic reaction, and the BS after AT could meet the requirements for returning to the field. Despite the potential benefits, the direct processing of raw vegetable waste within a single reaction cycle of this experiment was only 23.4 kg. Furthermore, the pressed VW water after solid–liquid separation involves the energy consumption cost generated by mechanical treatment. Meanwhile, the experiment was carried out in autumn when the anaerobic reaction temperature was 37 °C, and thus it fails to reflect the operational performance of this process in cold regions during winter.
At present, the development of highly efficient and low-operation-cost anaerobic digestion and aerobic treatment devices, as well as the research on large-scale and rapid degradation of vegetable waste in cold regions, is extremely limited. Therefore, to address these challenges, this paper developed a set of three coupled thermostatic anaerobic and aerobic devices with temperature control by a solar collector. The thermostatic batch wet AD experiments with additives for mixed raw materials and AT experiments of BS at different temperatures and distinct aeration rates were carried out during the winter with the aim of increasing the processing volume of vegetable waste and further accelerating its rapid decomposition. The temperature control performance of the system was assessed. The influences of urea and plant ash as exogenous additives on the biogas and BF production performance of the system and the decomposition rate of the BS were examined. The feasibility and treatment effect of the method were evaluated by detecting the relevant parameters throughout the entire reaction process. Finally, the annual organic load treatment capacity (OLTC) of the system was calculated, and the system operation strategy was optimized.
2. Materials and Methods
2.1. Description of the Experimental System
The coupled experimental system of solar energy-controlled thermostatic AD and thermostatic AT is shown in Figure 1. The system consists of several key components: a set of 30 vacuum tube solar collectors (Φ58 × L1800 mm) in the heating unit, three 0.6 m3 AD devices in the AD unit, three 50 L AT devices in the AT unit, three 2 m2 red mud soft biogas collection bags in the biogas storage unit, and 3 biogas lamps in the biogas unit. The AD device features an overflow and an open feedstock hopper, enabling various AD modes such as continuous, intermittent, batch, wet, and dry processes. The system’s inputs include biomass feedstock, exogenous additives, solar energy, water, and electricity, while the outputs consist of biogas, BF, CO2 fertilizer from biogas combustion, and exhaust gas. Biogas fertilizers (BFs) encompass liquid fertilizers and digestate fertilizers, with the option to pyrolyze solid or high-solid digestate to produce biochar, which can be used as a solid fuel or soil amendment [29].
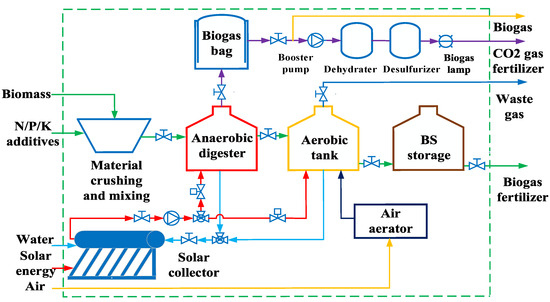
Figure 1.
Coupled experimental system of thermostatic anaerobic and thermostatic aerobic processes controlled by solar collector temperature.
As shown in Figure 2, the AD device is illustrated in both two-dimensional and three-dimensional diagrams. Constructed from 304 stainless steel, the device effectively addresses the expansion and contraction issues that polyethylene plastic drums face in cold environments. An isolation mesh design prevents the material from floating and clogging the biogas guide port, ensuring uninterrupted biogas production. A plexiglass window allows continuous monitoring of the reaction state to optimize feeding intervals. The feed hopper design facilitates easy feeding and mixing, while a liquid seal baffle maintains an anaerobic environment within the tank. The upper and lower combined detachable design simplifies waste discharge and enables efficient cleaning of the coil dirt within the tank. An overflow port facilitates the discharge of supernatant during both batch and continuous AD reactions. The installation of stainless steel coils on the lower side of the device can significantly increase the rate of liquid heating and reduce heat loss compared to winding aluminum-plastic tubes on the outer side. The AT tank features both stainless steel coils and an aeration device, providing optimal temperature and airflow for aerobic reactions (Table 1).
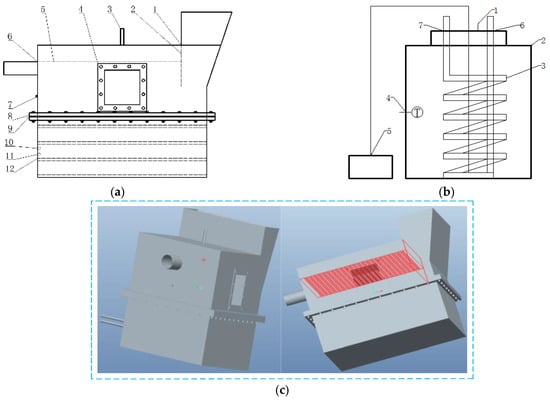
Figure 2.
Two-dimensional (a) (1) feeding hole (2) liquid seal (3) biogas outlet (4) window (5) separation net (6) biogas liquid overflow outlet (7) temperature sensor (8) connection flange (9) sealing gasket (10) coil outlet (11) coil inlet (12) heating coil; (b) (1) exhaust outlet (2) aerobic treatment tank (3) heating coil (4) temperature sensor (5) air pump (6) coil inlet (7) coil outlet. Three-dimensional (c) diagrams of the device.

Table 1.
The design parameters of the anaerobic digestion device and the aerobic treatment tank in the coupled system.
The system’s pipeline layout is designed as follows: the heat required for the AD devices and AT tanks is supplied by hot water from the solar collector’s hot water storage tank. As depicted in Figure 3, the water outlet from the storage tank is connected to a DN20 aluminum–plastic pipe, leading to a ball valve, and then to the circulating water pump. The pump’s outlet is connected to a six-channel water distributor, each channel equipped with an electromagnetic valve. Each aluminum–plastic pipe leads to the coil inlet of each device, and the coil outlets are connected to check valves to prevent water backflow. The water distributor ultimately connects back to the solar collector’s water tank inlet.
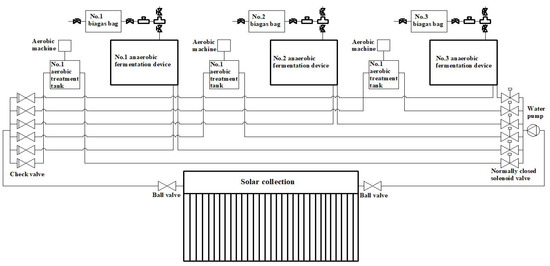
Figure 3.
Pipe layout diagram of the experimental system.
Figure 3 also illustrates the pipeline configuration and control strategy of the experimental system. The circulating water pump and solenoid valves are arranged in a series circuit, with each solenoid valve operating in parallel. Each solenoid valve is controlled by a relay in the control box, while the water pump is connected to a contactor. The relays and contactors are connected in series, such that when any normally closed solenoid valve is energized, the pump activates. The temperature of the DS inside the devices is monitored by a Pt100 temperature sensor, integrated into the system. The data from the sensor are collected by the Agilent 34980A, and the temperature controller in the control box adjusts the system based on the preset temperature limits. If the DS temperature reaches the lower threshold, the temperature controller energizes the relay and contactor, activating the solenoid valve and circulating hot water through the coils to heat the DS. When the DS temperature reaches the upper limit, the temperature controller signals the system to stop heating. If the water tank temperature falls below 24 °C, the temperature controller disables the system.
2.2. Substrate and Inoculum
The experimental raw material came from local agricultural and livestock waste. Cow dung was obtained from Huazhuang Dairy Breeding Farm in Honggu District, Lanzhou City, China. The tomato stems and leaves were pulverized to sizes of 2–3 cm and collected from a greenhouse in Gouya Hill, Weiling Township, Qilihe District, Lanzhou City, China. In this study, the inoculum was the BS of the medium-temperature AD of cow dung, which had been used in the experiment performed by our research group. To minimize the loss of nutrients from the raw material, crushed tomato stalks and leaves were immediately fed in proportion to cow dung. Table 2 lists the information on the main properties of raw materials. The application of diverse raw materials in AD can result in variations in biogas production and the composition of the digestate. The co-digestion synergy of livestock manure and VW can reach the favorable C:N ratio necessary for efficient biogas production and has a positive influence on the stability of the reaction [29,48].
Table 2.
Basic characteristics of the raw materials.
2.3. Experimental Procedures
To investigate the impact of additives on the AD performance of the system, the first phase of AD involved mixing cow dung with tomato stems and leaves in a volatile solid (VS) ratio of 1:1 [49]. The inoculum liquid accounted for 30% of the total mass of the feed mixture [50], and the total solid (TS) of the mixture were adjusted to 8% by adding water. The composition of the feed solution included 135 kg of inoculum liquid, 136 kg of water, 73 kg of cow dung, and 106 kg of tomato stems and leaves. The experiment was conducted in Lanzhou, China, during the winter season. Solar collectors were used to maintain the temperature of the AD devices at (26 ± 2 °C) [51,52]. To minimize heat loss, the experimental devices were housed in plastic greenhouses. The experimental design included a blank control group, and two additional experimental groups were treated with 1 g/L plant ash and 1 g/L urea, respectively. Each group was stirred for 10 min daily, and biogas production rate, CH4 content, ammonia nitrogen (-N) content, pH value, electrical conductivity (EC), total dissolved solids (TDS), and other physicochemical indicators were measured.
To investigate the influence of additives on the biogas fertilizer-producing performance of the system and the decomposition rate of the BS, and to determine the effective BS treatment techniques, previous studies have examined the effects of temperature, aeration duration, and aeration rate on BS [39,53] in the second-stage AT experiment of the BS in the system. Firstly, a BG of BS at the final stage of AD was taken as the research object, and AT was performed at different temperatures (afterheat of the BS, 20 °C, and 30 °C) with a constant aeration rate of 8 L/min. Key parameters including pH, EC, TDS, -N, and germination index (GI)—used to assess the biotoxicity of the biomass—were analyzed to identify the fastest decomposing group and the treatment temperature of optimal nutrient BS. Secondly, experiments were conducted with varying aeration rates at the optimal temperature, with conditions set to natural ventilation, 4 L/min, and 12 L/min, to determine the fastest decomposing group and the aeration rate of optimal nutrient BS. Finally, two additive groups were treated at the optimal temperature and aeration rate, respectively, to compare key indicators of the processed BS and identify the treatment that resulted in the BS with the fastest decomposition rate and the highest nutrient content.
2.4. Determination Index and Methods
Table 3 lists the detailed information of instruments.
Table 3.
Detailed information of instruments.
(1) Biogas production: measured by gas meter type SC300G1.6.
(2) Biogas composition: 0.5 L aluminum foil gas sampling bag from device sampling port for regular daily sampling, and then measured by BIOGAS 5000 portable biogas analyzer.
(3) TS and VS: measured by the drying and burning methods.
(4) TN: determined using an automatic Kjeldahl nitrogen analyzer.
(5) -N: measured by COD rapid determination instrument.
(6) TP: determined by ammonium molybdate spectrophotometry.
(7) TK: determined by the potassium tetraphenylborate weight method, according to the standard (NYT 1977-2010) [54].
(8) Samples: Fresh fermentation samples were extracted by continuous shaking at 200 rpm for 1 h at room temperature. The filtrate was then filtered and collected. The pH value was measured with a pH meter, the EC was measured with a conductivity meter, and the TDS were measured with a TDS meter.
(9) GI: Fresh anaerobically digested and aerobically treated biosolid (BS) samples were collected. Deionized water was added to achieve a concentration of 0.1 g/mL. The samples were extracted by continuous shaking at 200 rpm for 24 h at room temperature. Afterward, 10 mL of the upper clear liquid was collected, and 20 full seeds of creamy pakchoi were sown in Petri dishes (9 cm diameter) lined with filter paper. The Petri dishes were incubated at (20 ± 1 °C) for 48 h. Seed germination and root development were then assessed. In the control group, distilled water was used in place of the extract liquid, and the procedure was repeated three times.
In the formula, GI represents the seed GI of each experimental group; represents the seed germination rate of each experimental group; represents the total root length of each experimental group, mm; represents the germination rate of the control group; represents the total root length of the control group, mm. The Origin 2021 was used for graphing.
3. Results and Discussion
3.1. Temperature Control Performance of the System
Temperature is a key factor influencing the performance of AD [55,56]. It plays a crucial role in stabilizing the system, enhancing the hydrolysis process, and increasing methane production [57,58]. To assess the thermal stability of the coupled experimental system of solar energy controlled thermostatic AD and thermostatic AT, a typical period within the system’s reaction cycle (72 h across three consecutive cloudy and snowy days, starting at 12:00 p.m. each day) was selected for analysis.
Figure 4a shows the variation curves of the ambient temperature, the temperature of the solar collector’s hot water storage tank, and the temperature of the AD devices on the same day. The temperature of the AD devices was maintained at (26 ± 2 °C). The hot water temperature in the storage tank fluctuated between 23.5 °C and 38.2 °C, while the ambient temperature varied between −9.4 °C and 3.5 °C. The temperature of the DS in all three groups of solar-heated AD devices remained between 24 °C and 28.4 °C. The slight 0.4 °C exceedance of the upper temperature limit was due to the delay between the feedback signal from the temperature sensor and the system’s response to stop the pump, causing a brief temperature rise.
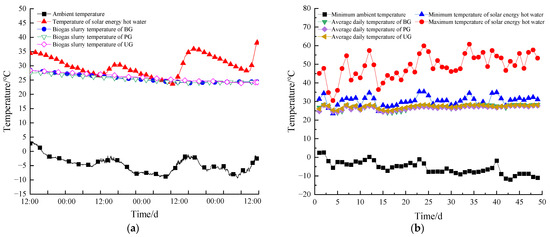
Figure 4.
Temperature distribution in the system during three consecutive cloudy and snowy days (a), average daily temperature change of the system during the anaerobic digestion reaction cycle (b).
On the third cloudy and snowy day, when the solar hot water temperature dropped to 23.5 °C, the AD devices’ temperature remained above 24 °C. According to the system’s control strategy, the temperature controller received a signal from the temperature sensor and switched off the power to the contactor, halting all heating operations. Subsequently, the solar hot water entered the heating phase. As the AD devices’ temperature fell below the set limit, the rising temperature of the solar hot water was used to heat the AD devices. Thus, despite three consecutive days of cloudy and snowy weather, the system effectively maintained the AD devices temperature within the range of (26 ± 2 °C), indicating that the system can consistently regulate the AD devices temperature and support continuous, stable biogas production.
Figure 4b presents the variation curves of the daily minimum ambient temperature, the daily maximum and minimum temperatures of the hot water in the solar collector storage tank, and the daily average temperature of the AD devices during the experimental period. The lowest ambient temperature recorded was −15.1 °C, with an average ambient temperature of −6.3 °C. Notably, the minimum temperature of the hot water in the storage tank was basically consistently higher than the daily average temperature of the AD devices, ensuring that the solar heating system could provide sustainable heat to the biogas digester throughout the experimental period.
3.2. Biogas Production Performance of the System
As shown in Figure 5a,b, to test the biogas production performance and evaluate the energy utilization of waste, biogas and methane production were measured daily throughout the experimental period. During the entire AD process, the daily biogas production (DBP) in each additive group exhibited a pattern of rapid increase followed by a slow decline. In contrast, the biogas production in the BG showed two distinct peaks. The first peak of biogas production in the BG occurred on the second day of the reaction, reaching 241 L, while the PG reached its peak on the third day with 356 L, and the UG peaked on the fourth day with 452 L.
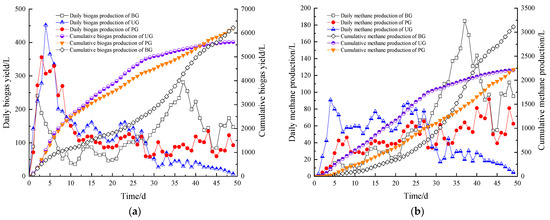
Figure 5.
Biogas (a) and methane (b) production laws of system during the anaerobic digestion stage.
It is evident that the UG demonstrated the most optimal biogas production effect in the start-up phase of the AD process. The PG also exhibited a higher biogas production rate than the BG during the start-up phase. This can be attributed to the plant ash and urea in the C, P elements and N elements to give full play to the effect at the beginning of the reaction; these are the most needed microbial growth elements in the DS [59]. K elements are the trace elements required by the system, which can facilitate the rapid initiation of the system; ash, as a kind of low-priced additive, can also improve the activity of the methane-producing bacteria and the stability of the system [60]. Urea has been shown to reduce digestion time and increase methane yield [61], where urea-enhanced hydrothermal pretreatment improved AD performance by enhancing lignin depolymerization and nitrogen supplementation. Similarly, Wang et al. [62] found that moderate amounts of urea accelerated fermentation initiation and significantly boosted DBP in potato peel AD, which aligns with the findings of this study.
As the degradation of macromolecules in the DS continued, the DBP in the BG increased gradually during the middle phase of the reaction. On the 26th day, the DBP of the BG surpassed that of the PG, and by the 29th day, it exceeded the UG. The second peak of biogas production for BG occurred on the 37th day, with the DBP amounting to 281 L. Notably, throughout the pre-reaction period, the UG consistently outperformed the PG in terms of DBP. However, from day 29 to the end of the reaction, the DBP of the PG surpassed that of UG. This shift can be attributed to the high -N levels produced by UG in the early phase, which helped prevent acidification and supported methanogenesis. However, the accumulation of -N destabilized the system in the later stages, leading to a rapid decline in biogas production. On the other hand, while PG did not show as strong a performance in the early stage, it contributed to greater system stability in the later stages, which was related to the ability of C element to stabilize the digestive system [59,60].
The CBP followed a similar trend. The PG and UG reached 80% of the CBP of the BG, with total production of 5346 L on days 41 and 38, respectively—5 and 2 days earlier than the BG. One-way ANOVA confirmed that the differences in DBP between the groups were highly significant (p < 0.01) during the first 30 days of the reaction. Yin et al. [63] found that bottom ash from sludge incineration improved AD performance, resulting in higher CBP compared to controls after 24 days. Similarly, Qu et al. [46] demonstrated that rice-straw ash, as a source of K+ and alkalinity, enhanced AD by promoting methanogenic bacteria and improving enzyme activity in high-salt organic wastewater. The effect of urea on AD of straw studied by Duan et al. concluded that the CBP in the UG at the end of the reaction period was lower than that of the BG [64], both of which were consistent with the experimental results. Overall, while all experimental groups were able to produce biogas stably during AD, notable performance differences were observed. The PG and UG promoted biogas production in the early and middle stages of AD, but their performance was inferior to that of the BG in the later stages. This indicates that appropriate additives can expedite system start-up, improve biogas production efficiency, and accelerate the reaction process. The UG demonstrated the best biogas production performance in the early and middle stages of the AD process, while the BG achieved the highest total biogas production in the final stages.
3.3. Methane Production Performance of the System
The change curves for the daily methane production (DMP) and CMP of the system are shown in Figure 5b. Until the 28th day of the AD process, the DMP of each additive group was higher than that of the BG. The corresponding CMP of the PG and the UG was higher than that of the BG until the 33rd and 38th day of fermentation, respectively, and accounted for 36.7% and 59.7% of the final CMP of the BG of 3401.5 L, respectively. One-way ANOVA indicated that the differences in DMP between the groups were highly significant (p < 0.01) in the early and middle stages of the system reaction, i.e., during the first 30 days. Jena et al. [65] found that adding a small amount of urea increased the methane percentage in biogas, which is consistent with the findings of this study.
All experimental groups produced methane stably during AD, although their performance varied. The additive groups significantly promoted methane production in the early and middle stages of AD. The DMP in the UG was significantly higher than in the other two groups during the first 25 days of the reaction, but was lower than the BG in the later stage, which corresponds with the biogas production trend. The CMP at the end of the AD reaction for each group was 3110.9 L for the BG, 2222.7 L for the PG, and 2209.1 L for the UG. The final CMP of the BG was close to the value of the biochemical methane potential of cow manure estimated by Toufexis et al. [66]. This suggests that appropriate additives can accelerate system start-up and enhance methane production efficiency. The UG demonstrated the highest methane production during the initial phase, whereas the BG showed the best total methane production in the final stages of the reaction. Li et al. [67] found that the system produced methane volume fraction up to 50% faster under mesophilic AD conditions than the room temperature reaction. It was inferred that if the digestion temperature was increased to 37 °C, the methane production of the control group would be more significant.
Figure 6 shows the cumulative biogas production growth rate and CMP growth rate for each additive group relative to the BG at each stage of the reaction. These values represent the percentage of cumulative biogas production and CMP for each additive group compared to the BG at each day of the reaction. It is evident that the cumulative biogas production growth rate of the UG remained positive for the first 44 days of AD, while the positive cumulative biogas growth rate of PG was maintained for 47 days during the reaction process. The cumulative biogas production growth rate of the UG was higher than that of the PG for the first 41 days. The maximum growth rate for biogas production occurred on day 11 for the PG (117.1%) and on day 12 for the UG (124.3%). The CMP growth rate was greater than 0 in the PG for the first 33 days, and in the UG for the first 38 days, and the CMP growth rate in the UG was better than that in the PG for the first 48 days. The highest growth rates for methane production occurred on day 3 for the PG (242.7%) and day 3 for the UG (1493.2%). These results suggest that the appropriate addition of additives accelerates methane synthesis, with the UG yielding the highest methane production in the early and middle phases of the system reaction and the BG showing superior CMP in the later phase.
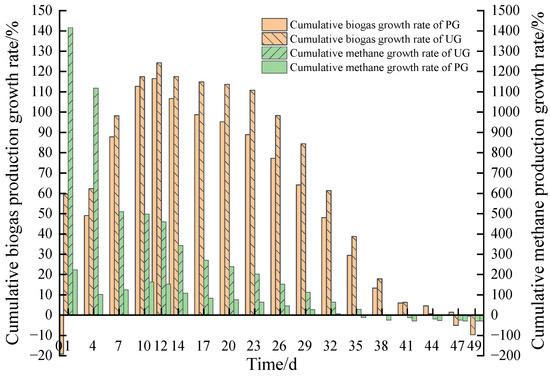
Figure 6.
Cumulative biogas and methane production growth rate of the system.
In conclusion, all three experimental groups in the thermostatic wet AD system performed well during the winter, demonstrating good biogas and methane production. This indicates that the scheme of conducting AD reactions with this system in winter is feasible, and the BG yielding optimal CMP. Furthermore, the reasonable addition of additives enhances the biogas production rate, improves production efficiency, and further expedites the reaction process.
3.4. BF Production Performance of the System
3.4.1. Change in the pH Value of the System Digestive Fluid
Figure 7a illustrates the pH variation of the BS for each group during the AD phase. The pH of each group first increased and then fell during the initiation stage of reaction, before gradually rose and then subsequently reached stabilization. This pattern resulted from hydrolysis and acidification during the start-up phase, which led to a decrease in pH across all groups. However, the pH decline in the additive groups was less pronounced. By comparing the daily biogas production patterns of each group, it was inferred that the UG produced higher amounts of -N during the early stage of the reaction, which regulated the pH of the BS to enhance the buffering capacity of the system against organic acids, maintaining a higher daily biogas production for the first 27 days. On day 27, the pH of the UG was 7.50. However, as the pH continued to increase, the daily biogas production of the UG showed a decreasing trend and eventually the pH increased to 7.73. This suggests that the accumulation of excessive -N inhibited the activity of methanogenic bacteria in the later stages of the reaction. The weak alkaline effect of plant ash helped alleviate acidification during the early phase and maintained a higher daily biogas production for the first 25 days, with the pH at 7.11. In the later stages, biogas production in the PG surpassed that of the UG, and the pH stabilized at approximately 7.60, similar to the BG, indicating that a slightly neutral environment promotes AD.
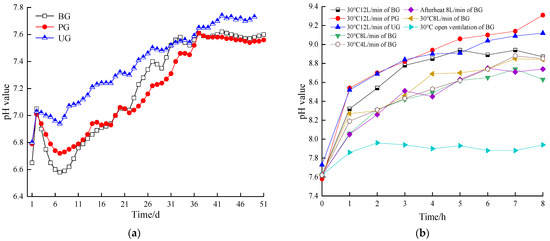
Figure 7.
pH value during anaerobic digestion stage of the digestive fluid (a), pH value during aerobic treatment stage of the digestive fluid (b).
Duan et al. [64] observed that the system could be operated stably with pH values between 7.0 and 7.6, which was consistent with the experimental results. Zhang et al. [68] demonstrated that controlling pH at 7.5 significantly enhanced the performance of high-load digesters, characterized by a high peak methane production rate, substantial methane output, and the highest methane recovery at pH 7.5. The BG and PG exhibited similar trends, with the UG reaching its peak daily methane production on the 4th and 24th days of the reaction, with pH values of 7.0 and 7.4, respectively. This could be attributed to pH control stimulating the growth of syntrophic bacteria while maintaining the activity of hydrogenotrophic methanogens, thus sustaining efficient syntrophic communities and preventing the over-accumulation of volatile fatty acids.
Figure 7b illustrated the variation of pH of the BS during AT under different conditions. Except for the open group, the pH in all experimental groups exhibited an increasing trend. This was because the system was affected by the aeration, i.e., due to the disturbance of the air in the BS, the acidic volatilizable material in the BS escapes, resulting in an increase in the pH value of the BS. The open group, which experienced natural ventilation without aeration, showed minimal fluctuation in pH, maintaining values between 7.6 and 7.9. Additionally, in the BG, treated at different temperatures with a constant aeration rate of 8 L/min, the pH of the BS increased more rapidly at 30 °C. In contrast, the pH in the afterheat group fluctuated during the process, while the 20 °C group showed a slower pH increase. These results indicate that higher temperatures (within the 20–30 °C range) accelerate the pH rise in the BS. The pH value of BS in the BG treated with different aeration amounts and maintained at 30 °C changed with the same regularity as described above, and the higher the aeration amount within a certain range, the faster the pH value of the BS increased. Moreover, when both temperature and aeration were increased simultaneously, the pH of the BS rose more quickly than with a single factor alone. Furthermore, at 30 °C and 12 L/min, pH changes were not significant between the additive groups, although the pH in the BG increased more slowly than in the additive groups. This slower increase in the BG was attributed to the retention of more acidic volatile substances compared to the additive group.
3.4.2. Change in the EC Value of the System Digestive Fluid
At a given temperature, the EC of BS is directly proportional to the concentration of soluble salts in the solution. Figure 8a illustrates the variation in EC of the BS for each group during the AD stage. EC indicates the ability of a solution to conduct electric current and is commonly used to infer the total concentration of ionic constituents in water. The EC index has been widely applied in the analysis of AD fluids [69]. The anaerobic digestate consists of water, mineral components, and incompletely degraded organic compounds [70,71]. At a given temperature, the EC of BS is directly proportional to the concentration of soluble salts in the BS. The EC values increased in all groups during the reaction initiation phase and were 15.6 mS/cm in the UG, 14 mS/cm in the PG and 12.5 mS/cm in the BG on day 5. This was because the material in the initial hydrolysis reaction was intense, there were a large number of substances were decomposed, which led to an increase in ions in the BS, this trend was consistent with the trend of daily biogas production in each group. While in the middle and late stages of the reaction, the EC values of each group showed a continuous fluctuation, which was attributable to the continuous decomposition and conversion of BS into biogas. According to the trend of EC at each stage of the reaction in descending order, UG > PG > BG. It is obvious that the BS of the experimental group with additives contains a rich nutrient profile, which is conducive to the production of BF during the AT phase.
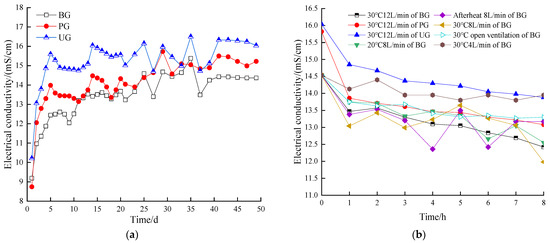
Figure 8.
EC value during anaerobic digestion stage of the digestive fluid (a), EC value during aerobic treatment stage of the digestive fluid (b).
As shown in Figure 8b, during the AT stage of the BS, the EC values of all groups exhibited a decreasing trend with reaction time. This was due to the fact that during the aeration process, volatile acids and free NH3 were blown out of the BS, which consequently reduced the ionic content of the BS. According to the EC values of the BG treated at different temperatures with 8 L/min aeration, it was found that the EC value of the afterheat group fluctuated the most during the reaction process, which may be attributed to the natural decrease in temperature in this group, resulting in an inconsistent decrease in EC value across each stage. At the 8th hour of AT, the EC values of the 30 °C group were small compared to the other temperature groups, which indicated that the higher the temperature the more nutrients were lost from the BS. From the changes in EC values of the BG of BS treated with different aeration and kept at 30 °C, it was found that the EC of the open group decreased slowly, which was due to the fact that the dissolved oxygen in the BS was reduced in the case of natural ventilation, the -N and the organic acid volatilized less, and the loss of ionic substances in the BS was less.
In conclusion, the difference in EC decline between aeration and no aeration was significant, suggesting that more nutrients were lost when aeration treats the BS. In addition, it was found from the EC values of different BS treated at 30 °C and 12 L/min that the EC values at each treatment stage were UG > PG > BG in descending order, which indicated that the ionic concentration of BS in the additive group was still higher under the same AT conditions and the ionic concentration of BS in the UG was the largest.
3.4.3. Change in the -N Content of the System Digestive Fluid
Figure 9a illustrates the variation in -N content in each group during the AD stage. The -N levels initially increased, decreased, and eventually stabilized. Notably, the -N content in the UG was significantly higher than in the other two groups at all stages of digestion. This pattern corresponds to the changes in daily biogas production, with the UG exhibiting rapid biogas production in the early stages of AD, followed by a slowdown in the later stages. It can be deduced that the change was related to the accumulation of -N. Insufficient -N (0.5 g/L) leads to low methane production due to low microbial activity and buffering capacity [72]. However, it has been found that the concentration of total ammonia nitrogen between 1500–7000 mg/L inhibits the biogas production of the system [73]. Inhibition thresholds for -N have also been reported in some studies, but the concentrations found varied significantly. Moreover, the AD process also produces free ammonia, which is particularly toxic to digestate bacteria, penetrating the cell membrane and inhibiting enzyme activity, thereby inhibiting the whole process [74].
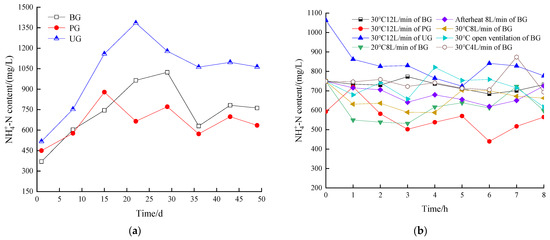
Figure 9.
-N value during anaerobic digestion stage of the digestive fluid (a), -N value during aerobic treatment stage of the digestive fluid (b).
Thus, the system’s ability to utilize -N depends on factors such as raw materials, ratios, and temperature, and excessive -N can reduce the activity of methanogenic bacteria, ultimately inhibiting biogas production. For the UG, the -N concentration exceeded 1062 mg/L in the later stages, exerting an inhibitory effect on biogas production. The amount of -N in the BG was higher than that in the PG in the middle and late stages of AD, reaching a peak value of 1024 mg/L on day 29 of the reaction, and the daily biogas production in the BG was also in the ascending stage of the second peak of biogas production. The PG showed lower -N levels than both the UG and BG, likely due to the adsorption properties of plant ash.
Figure 9b illustrates the changes in -N concentrations in each group during the AT stage. The -N content generally decreased over time, although fluctuations occurred throughout the reaction process. This was primarily due to aeration, which promoted the volatilization of free NH3 from the BS into the atmosphere. Additionally, some -N was oxidized by nitrifying bacteria to nitrite and nitrate, which increased the concentration of dissolved nutrients in the BS. As a result, -N levels initially decreased but later rose again due to the decomposition and deamidation of large organic molecules, peptides, and amino acids in the BS [39].
For the BG treated at different temperatures and maintaining an aeration volume of 8 L/min, the highest -N concentrations observed were 722 mg/L at the 7th hour in the afterheat group, 725 mg/L at the 8th hour in the 20 °C group, and 703 mg/L at the 5th hour in the 30 °C group. The lowest -N concentrations were 532 mg/L at the 3rd hour in the afterheat group, 619 mg/L at the 6th hour in the 20 °C group, and 588 mg/L at the 4th hour in the 30 °C group. When the BG was treated with different aeration rates at 30 °C, the highest -N concentrations were 821 mg/L at the 4th hour in the open group, 874 mg/L at the 7th hour in the 4 L/min group, and 773 mg/L at the 3rd hour in the 12 L/min group. The lowest -N concentrations were 617 mg/L at the 8th hour in the open group, 694 mg/L at the 8th hour in the 4 L/min group, and 684 mg/L at the 6th hour in the 12 L/min group. According to the changes of -N in different BS treated aerobically at 30 °C and 12 L/min. For BS treated aerobically at 30 °C and 12 L/min, the highest -N concentrations were 862 mg/L at the 1st hour in the UG and 720 mg/L at the 1st hour in the PG. The lowest -N concentrations were 724 mg/L at the 5th hour in the UG and 440 mg/L at the 6th hour in the PG. In all treatment stages, the -N concentrations followed the order: UG > BG > PG, indicating that the UG maintained higher levels of -N under the same aeration conditions, while the BG also retained a significant amount of -N.
3.4.4. BF Production Quality Evaluation of the System
GI is commonly used as an indicator of the degree of decomposition in the composting process [75]. It is a crucial parameter for determining whether organic fertilizers are fully decomposed and for assessing their potential toxicity to crops. Additionally, GI can be an important metric for evaluating the stability of the anaerobic co-digestion process [76], and it is frequently used to analyze the biotoxicity of BS [39], which comprehensively reflects the degree of bioavailability of BS to crops [77]. Specifically, when GI reaches 50%, the fertilizer is basically decomposed and has basically no biological toxicity; when GI reaches 80%, the fertilizer is completely decomposed [78].
As listed in Table 4, the GI of BS in each group without AT was measured at 1.7% in the BG, 47.8% in the PG, and 27.4% in the UG. These values indicate that the BS in each group had not yet reached the required level of humification, contained significant toxicity, and inhibited seed growth. Some studies have shown that higher -N content of BS may be toxic to plants, which is also corroborated by the BS in the UG [79]. Inadequate BS management may lead to increased emissions of greenhouse gases such as ammonia, nitrous oxide, CO2, and methane [80].
Table 4.
Germination index of different biogas slurry without aerobic treatment.
To reduce the biotoxicity of BS and enhance its decomposition rate and bioavailability, an AT is necessary. Figure 10 illustrated that the trend of initial decreasing, followed by increasing, and then decreasing of GI in all groups during AT of the BS. This trend is consistent with previous studies, which suggest that, in the early stages of aeration, the substances in the BS are inhibitory and toxic to crops were partially removed through volatilization [81]. Additionally, some reductive substances are oxidized and decomposed, reducing biotoxicity and increasing GI. The later decrease in GI is attributed to the oxidative decomposition of macromolecules into small-molecule organic acids that inhibit crop growth [82,83].
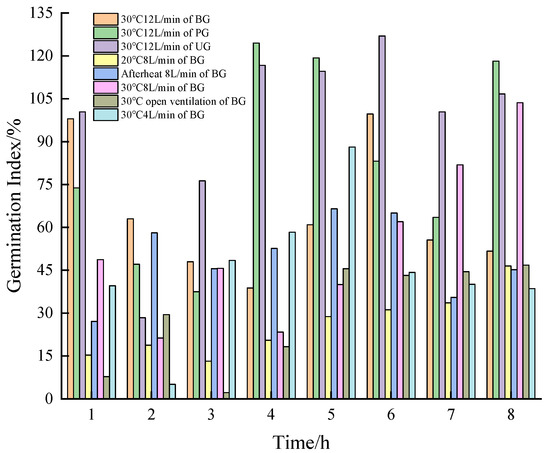
Figure 10.
Changes of germination index of different biogas slurry in aerobic treatment.
Observing the GI values of the seeds cultivated in the BS of BG that is treated every 1 h under different temperatures while maintaining an aeration rate of 8 L/min, it was found that the GI in the 20 °C group did not reach the decomposition threshold during the 8 h of AT, with a maximum GI of 46.5% at the 8th hour. The GI in the 20 °C group was higher than that of the afterheat group only at the 8th hour. In the afterheat group, GI exceeded 50% by the 2nd hour, indicating basic decomposition, with a maximum value of 66.5% at the 5th hour. The GI of the 30 °C group was higher than that of the 20 °C group, and was higher than that of the afterheat group in the 1st, 7th, and 8th hour, respectively; in the 6th hour of treatment, the GI reached the basic decomposition; in the 7–8th hour of treatment, the GI reached complete decomposition, which was 81.9% and 103.6%, respectively. The TDS at the 7th hour was 6.09 g/L, higher than the 5.60 g/L at the 8th hour, while the -N content was 672 mg/L at the 7th hour, higher than the 662 mg/L at the 8th hour. In contrast, the GI of the anaerobically treated BS was only 1.7%. These results clearly demonstrate the effectiveness of AT in reducing the biotoxicity of BS, which aligns with the role of oxidation tanks used to enhance BS bioavailability [84]. Furthermore, AT at 30 °C proved to be more effective in improving the degree of decomposition, bio-effectiveness, and nutrient content.
When observing the GI of BS treated at different aeration volumes at 30 °C, the GI of the open group did not reach the decomposition threshold during the 8 h period, with a maximum value of 46.8% at the 8th hour. The GI of the 4 L/min group was higher than 80% to reach the complete decomposition in the 5th hour of the treatment, and it was the maximum value of this group’s process, which was 88.1%. The GI of the 12 L/min group was consistently higher than that of the open group and exceeded that of the 4 L/min group at the 1st, 2nd, and 6–8th hours, and was higher than the 8 L/min group at the 1st–6th hours. At the 2nd, 5th, and 7th hours, the GI reached basic decomposition (63%, 60.9%, and 55.6%, respectively), and complete decomposition was achieved at the 1st and 6th hours (98% and 99.7%, respectively). The TDS at the 1st hour was 5.67 g/L, higher than the 5.29 g/L at the 6th hour, while -N was 734 mg/L at the 1st hour, higher than the 684 mg/L at the 6th hour. These findings indicate that BS treated with 12 L/min decomposed more quickly and retained a greater amount of nutrients than BS treated with 8 L/min. Therefore, AT at 30 °C and 12 L/min has superior effects on the degree of decomposition, bioavailability, and nutrient content.
Finally, the GI of seeds cultivated after AT of each control BS at 30 °C and 12 L/min revealed that the GI of the PG reached basic decomposition at the 1st and 7th hours (73.8% and 63.5%, respectively) and reached complete decomposition at the 4th to 6th and 8th hours (124.5%, 119.3%, 83.2%, and 118.2%, respectively). At the 4th hour, TDS and -N were 5.35 g/L and 538 mg/L, respectively. The GI of the UG reached basic decomposition at the 3rd hour (76.3%) and complete decomposition at the 1st hour and from the 4th to 8th hours (100.4%, 116.7%, 114.6%, 127%, 100.4%, and 106.7%, respectively). At the 1st hour, TDS and -N were 7.01 g/L and 862 mg/L, respectively. A one-way ANOVA analysis indicated that the difference in TDS changes among all groups was highly significant (p < 0.01). Notably, under the identical conditions of AT for different BS, the BG and UG showed the fastest rates of decomposition (within 1 h), indicating that both the added and unadded experimental groups exhibited improved bio-effectiveness after AT. From a nutrient retention perspective, the UG retained the most nutrients.
Figure 11 illustrates the physical properties of BS both before and after AT, as well as the germination of seeds. It is evident that the undecomposed BS was black, with a large amount of suspended material on the surface and a strong, irritating odor. Seeds of creamy pak choi cultured with this BS at 8 h (20 ± 1 °C) under dark conditions showed negligible germination. In contrast, the aerobically treated BS, which had decomposed, was brown, with a clarified liquid surface and no irritating odor. Seeds of creamy pak choi cultured under the same conditions exhibited a high germination rate, indicating improved biological activity. Thus, the use of decomposed BS after AT significantly enhanced seed growth.
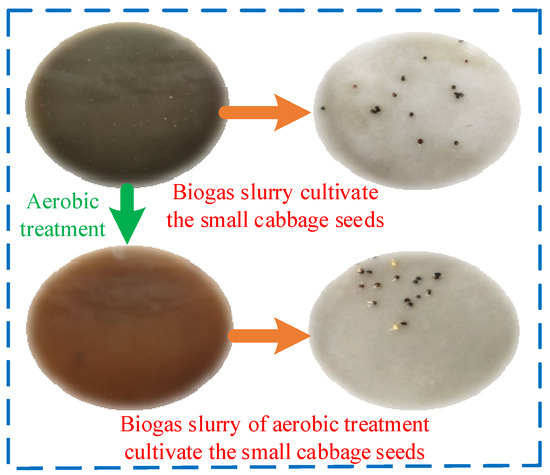
Figure 11.
Properties of biogas slurry before and after decomposition and status of seed germination.
It was observed that the trends in BS parameters across the groups were similar under the same conditions, indicating that the addition of moderate amounts of exogenous additives did not interfere with the operation of the reaction process. Furthermore, the pH values of all groups of BS, diluted to a 0.1 g/mL culture solution for the seed germination rate experiment after AT, met the standard for liquid fertilizers. The EC value and -N concentrations in each group of BS during the aerobic stage showed a decreasing trend compared to the anaerobic stage. The EC value and -N levels in the UG were the highest, and the TDS values were optimal at all stages, indicating that the ionic concentration in the BS of the UG remained optimal after AT. Additionally, under the same AT conditions for the same duration, the degree of decomposition of the UG was higher in the first hour. Evidently, the UG had the optimum quality of fertilizer production and the fastest decomposition rate after AT. Based on these observations, it can be concluded that AT with AT tanks is effective for BS, and the addition of exogenous additives does not hinder the reaction process. Under the treatment conditions of 30 °C and 12 L/min, all BS groups achieved decomposition and the BS of the UG has the fastest decomposition rate and retains the maximum nutrients.
Table 5 presents the total dissolved organic and inorganic nutrients in each group of BS during the two-stage reaction process. The fastest decomposed nutrient contents for the BG, PG, and UG were 5.67 g/L, 5.35 g/L, and 7.01 g/L, respectively. According to the Organic-Inorganic Compound Liquid Fertilizer Standard [85], BS requires 110 g/L of total nutrients to meet the liquid fertilizer standard. Therefore, to meet the standard, adjustments are needed to increase the nutrient content. It is estimated that total nutrient content can be improved by mixing water-soluble organic fertilizers with a concentration of 34.3% [86]. Clearly, the application of BS as fertilizer not only recycles nutrients but also reduces the reliance on mineral fertilizers [87].
Table 5.
Total dissolved solid mass concentration in biogas slurry during anaerobic fermentation and aerobic treatment.
3.4.5. Comprehensive Performance Evaluation of Biogas and BF Production in the System with Regulated HRT
From the perspective of the system’s OLTC, the HRT of AD in the three experimental groups was 49 days. If the system were to operate with continuous thermostatic batch AD throughout the year, maintaining consistent raw material proportions and temperature, and with an interval of 0.5 days between each batch’s inlet and outlet, the experimental groups would be capable of processing 538.3 kg of cow manure and 781.6 kg of VW annually. Considering the biogas production efficiency of AD, medium-temperature AD typically operates within the range of 20–45 °C [88], and its HRT is approximately 20~40 days, and the HRT can be appropriately shortened [89], which not only increase the biogas production efficiency of the system and the biogas production rate per unit volume of the tank, but also enhance the system’s OLTC and expedite the reaction process.
The UG exhibited the fastest reaction during the early and middle stages of AD, with 80% of its cumulative methane production occurring by the 29th day of the reaction, making 29 days the shortest reaction cycle. Table 6 shows the annual OLTC of each group after shortening the reaction cycle. It was found that when the HRT of UG was adjusted to 29 days, its annual biogas, methane, and BF production performed optimal among the cycles of UG, producing 61,542.7 L of biogas, 22,041.2 L of methane, and 5567.8 kg of BS with a TDS concentration of 7.34 g/L. The annual disposal of cow manure and VW was 903.2 kg and 1311.5 kg, respectively. The complete combustion of methane under standard conditions provides an additional 880.1 MJ of heat to the greenhouse annually. The PG achieved optimal annual biogas and BF production of 54,774.7 L and 5567.8 kg, respectively, with a TDS concentration of 6.99 g/L, and the same annual disposal of 903.2 kg of cow manure and 1311.5 kg of VW at an HRT of 29 days. The highest annual methane production (17,819.9 L) occurred at an HRT of 40 days. The complete combustion of methane under standard conditions at this stage provides an additional 711.5 MJ heat to the greenhouse annually. For the BG, when the HRT was 49 days, the annual biogas production was optimal at 45,842.5 L. When the HRT was reduced to 40 days, the best annual methane production of 24,414.1 L was achieved. The complete combustion of methane at this stage provides an additional 974.8 MJ of heat to the greenhouse annually. At an HRT of 29 days, the BG achieved optimal BF production (5567.8 kg), with a TDS concentration of 6.73 g/L, and the annual disposal of 903.2 kg of cow manure and 1311.5 kg of VW.
Table 6.
Evaluation of the annual biogas production, methane production, biogas slurry production and organic load treatment capacity of the system through adjusting the hydraulic retention time.
Comparing the results across all experimental groups, the optimal biogas and BF production system is the UG model with an HRT of 29 days, while the best methane production system is the BG model with an HRT of 40 days. Furthermore, methane production in the UG with an HRT of 29 days accounted for 90.3% of the methane production in the BG with an HRT of 40 days. Meanwhile, BF production in the BG with an HRT of 40 days accounted for 72.8% of the BF production in the UG with an HRT of 29 days. Combining the four indicators—biogas production, methane production, BF production, and the OLTC system—the optimal operational mode is the 29-day urea experimental group. During the AD stage, the biogas produced by the system releases heat upon combustion and generates CO2, which is able to increase the temperature of the greenhouse and replenish the light to promote the growth of plants, thus reducing greenhouse gas emissions. The BS produced during the AT stage decreases the need for chemical fertilizers, further mitigating greenhouse gas emissions.
In conclusion, this experimental system possesses an efficient capacity for biogas and BF production and is capable of reducing greenhouse gas emissions. The application of urea as an exogenous additive not only expedites the rapid decomposition of high-moisture agricultural and livestock wastes but also shortens the HRT, further enhancing the annual organic load treatment capacity of the apparatus.
4. Conclusions
To further accelerate the rapid decomposition of high-moisture agricultural and livestock wastes and enhance the treatment volume of VWs, this paper independently devised and fabricated a set of three coupled devices for thermostatic anaerobic and aerobic processes that are temperature-controlled by solar collectors. Commencing from the factors affecting the rapid decomposition of organic wastes and the rapid production of biogas and BF, cow manure and tomato stems and leaves were used as fermentation raw materials, with plant ash and urea additives as the control groups. A comparative study on the coupling performance of pilot-scale thermostatic batch wet AD of mixed raw materials for biogas production and AT for BF production was carried out in winter. The main conclusions are as follows:
- (1)
- In cold regions, the system demonstrates the ability to thermostatically control the DS, maintaining stable operation within a temperature range of (26 ± 2 °C) even during three consecutive days of cloudy and snowy weather. Both the BG and the two control groups achieved continuous and stable biogas and BF production while simultaneously reducing greenhouse gas emissions. This is a key advantage of the system, as the AD device overcomes issues related to heat expansion, cold contraction, and discharge difficulties. The system is capable of performing a range of AD reactions, including batch, continuous, intermittent, dry, and wet AD. The AT tank facilitates rapid aeration treatment of BS, improving its biological effectiveness.
- (2)
- The addition of appropriate amounts of two exogenous additives—plant ash and urea—was found to be feasible. These additives promote biogas production and result in the production of BF with higher nutrient content. Furthermore, the BS of UG achieved the highest decomposition degree within the shortest AT time. The content of total soluble organic and inorganic nutrients in the UG that decomposed the fastest was 7.01 g/L, with a GI of 100.4% and -N at 862 mg/L. Thus, the application of an appropriate amount of exogenous additives can further drive the reaction process of the entire technology and accelerate the decomposition of DS.
- (3)
- Regarding the reaction period of this experiment, the BG demonstrated the optimal biogas and methane production performance at the terminal stage of AD. In terms of BF production characteristics, the UG showed the best BS decomposition rate and nutrient retention capacity. To shorten the HRT and based on a comprehensive assessment of the annual biogas and methane production, BF production, and OLTC, the UG with an AD cycle of 29 days was the most favorable operation strategy. Meanwhile, the system operation strategy can be adjusted in accordance with the actual requirements.
Author Contributions
Conceptualization, J.L.; methodology, J.L.; formal analysis, D.C.; investigation, D.C. and J.H.; data curation, D.C., J.H., J.K. and B.J.; writing—original draft preparation, D.C.; writing—review and editing, J.L., V.N. and Y.S.; visualization, D.C.; supervision, J.L.; project administration, J.L.; funding acquisition, V.N. All authors have read and agreed to the published version of the manuscript.
Funding
This research was funded by Gansu Major Science and Technology Projects (22ZD6WA056), and Gansu Key R&D Program Project (24YFGA061), and Gansu Province Higher Education Industry Support and Guidance Project (2022CYZC-28), and Science and Technology Plan Project of Gannan (2023JY1SC002), and Gansu Top Leading talents Project ([2024]12), and from Gansu Major Science and Technology Projects (24ZDNA004, 25JRRA059) and Modern Silk Road Cold and Drought Agricultural Science and Technology Support Project (GSLK-2022-19).
Institutional Review Board Statement
Not applicable.
Informed Consent Statement
Not applicable.
Data Availability Statement
The data that support this study are available from the authors upon reasonable request.
Acknowledgments
The authors would like to thank the editor and the anonymous referees for their helpful comments and suggestions.
Conflicts of Interest
The authors declare no conflicts of interest.
Abbreviations
The following abbreviations are used in this manuscript:
| AD | Anaerobic digestion |
| AT | Aerobic treatment |
| VW | Vegetable waste |
| OLTC | Organic load treatment capacity |
| CBP | Cumulative biogas production |
| CMP | Cumulative methane production |
| BS | Biogas slurry |
| DS | Digestive solution |
| HRT | Hydraulic residence time |
| BF | Biogas fertilizer |
| VS | Volatile solid |
| TS | Total solid |
| EC | Electrical conductivity |
| TDS | Total dissolved solids |
| -N | Ammonia nitrogen |
| GI | Germination index |
| DBP | Daily biogas production |
| DMP | Daily methene production |
| UG | Urea group |
| PG | Plant ash group |
| BG | Blank group |
References
- Purdy, A.; Pathare, P.B.; Wang, Y.; Roskilly, A.P.; Huang, Y. Towards sustainable farming: Feasibility study into energy recovery from bio-waste on a small-scale dairy farm. J. Clean. Prod. 2018, 174, 899–904. [Google Scholar] [CrossRef]
- Lawson, A.; Ahmad, F.M. Decarbonizing US Transportation. Climate Innovation. (7). 2018. Available online: https://www.c2es.org/wp-content/uploads/2018/07/innovation-transportation-background-brief-07-18.pdf (accessed on 2 November 2024).
- Massé, D.I.; Saady, N.M.C. High rate psychrophilic anaerobic digestion of undiluted dairy cow feces. Bioresour. Technol. 2015, 187, 128–135. [Google Scholar] [CrossRef] [PubMed]
- Metyouy, K.; González, R.; Gómez, X.; González-Arias, J.; Martínez, E.J.; Chafik, T.; Sánchez, M.E.; Cara-Jiménez, J. Hydrothermal carbonization vs. anaerobic digestion to valorize fruit and vegetable waste: A comparative technical and energy assessment. J. Environ. Chem. Eng. 2023, 11, 109925. [Google Scholar] [CrossRef]
- Singh, R.; Paritosh, K.; Pareek, N.; Vivekanand, V. Integrated system of anaerobic digestion and pyrolysis for valorization of agricultural and food waste towards circular bioeconomy: Review. Bioresour. Technol. 2022, 360, 127596. [Google Scholar] [CrossRef]
- Vlachokostas, C. Closing the Loop Between Energy Production and Waste Management: A Conceptual Approach Towards Sustainable Development. Sustainability 2020, 12, 5995. [Google Scholar] [CrossRef]
- EBA. European Biogas Association Statistical Report 2020. 2020. Available online: https://uabio.org/en/materials/7524/ (accessed on 2 November 2024).
- Yu, Q.; Liu, R.H.; Li, K.; Ma, R.J. A review of crop straw pretreatment methods for biogas production by anaerobic digestion in China. Renew. Sustain. Energy Rev. 2019, 107, 51–58. [Google Scholar] [CrossRef]
- Li, J.P.; Wan, D.D.; Jin, S.R.; Ren, H.W.; Gong, S.Y.; Novakovic, V. Feasibility of annual wet anaerobic digestion temperature-controlled by solar energy in cold areas. Appl. Therm. Eng. 2023, 219, 119333. [Google Scholar] [CrossRef]
- Liu, Y.X.; Lv, Y.Y.; Cheng, H.; Zou, L.P.; Li, Y.Y.; Liu, J.Y. High-efficiency anaerobic co-digestion of food waste and mature leachate using expanded granular sludge blanket reactor. Bioresour. Technol. 2022, 362, 127847. [Google Scholar] [CrossRef] [PubMed]
- Zhan, Y.H.; Cao, X.X.; Xiao, Y.T.; Wei, X.Y.; Wu, S.; Zhu, J. Start-up of co-digestion of poultry litter and wheat straw in anaerobic sequencing batch reactor by gradually increasing organic loading rate: Methane production and microbial community analysis. Bioresour. Technol. 2022, 354, 127232. [Google Scholar] [CrossRef] [PubMed]
- Cho, S.; Ju, H.; Lee, J.; Kim, S. Alkaline-mechanical pretreatment process for enhanced anaerobic digestion of thickened waste activated sludge with a novel crushing device: Performance evaluation and economic analysis. Bioresour. Technol. 2014, 165, 183–190. [Google Scholar] [CrossRef]
- Chen, W.D.; Tang, H.M.; Xu, D.D.; Li, W.J.; Pan, C.; Guo, L.Y.; Kang, D.; Hu, B.L.; Zheng, P.; Zhang, M. Ecological distribution of anaerobic granular sludge towards efficient anaerobic reactor. Bioresour. Technol. 2023, 386, 129495. [Google Scholar] [CrossRef] [PubMed]
- Chen, X.T.; Liu, W.; Zhao, Y.H.; He, H.B.; Ma, J.T.; Cui, Z.J.; Yuan, X.F. Optimization of semi-continuous dry anaerobic digestion process and biogas yield of dry yellow corn straw: Based on “gradient anaerobic digestion reactor”. Bioresour. Technol. 2023, 389, 129804. [Google Scholar] [CrossRef] [PubMed]
- Peña, M.r.; Rodriguéz, J.; Mara, D.D.; Sepulveda, M. UASBs or anaerobic ponds in warm climates? a preliminary answer from Colombia. Water Sci. Technol. 2000, 42, 59–65. [Google Scholar] [CrossRef][Green Version]
- Yacob, S.; Ali Hassan, M.; Shirai, Y.; Wakisaka, M.; Subash, S. Baseline study of methane emission from anaerobic ponds of palm oil mill effluent treatment. Sci. Total Environ. 2006, 366, 187–196. [Google Scholar] [CrossRef]
- Makamure, F.; Mukumba, P.; Makaka, G. Biogas Production from a Solar-Heated Temperature-Controlled Biogas Digester. Sustainability 2024, 16, 9894. [Google Scholar] [CrossRef]
- Setboonsarng, S.; Gilman, J. Alternative Agriculture in Thailand and Japan. Asia-Pac. J. Rural. Dev. 1998, 8, 71–86. [Google Scholar] [CrossRef]
- Adisa, I.O.; Pullagurala, V.L.R.; Peralta-Videa, J.R.; Dimkpa, C.O.; Elmer, W.H.; Gardea-Torresdey, J.L.; White, J.C. Recent advances in nano-enabled fertilizers and pesticides: A critical review of mechanisms of action. Environ. Sci. Nano 2019, 6, 2002–2030. [Google Scholar] [CrossRef]
- Erisman, J.W.; Galloway, J.N.; Seitzinger, S.; Bleeker, A.; Dise, N.B.; Petrescu, A.M.R.; Leach, A.M.; Vries, W.D. Consequences of human modification of the global nitrogen cycle. Philos. Trans. R. Soc. B Biol. Sci. 2013, 368, 20130116. [Google Scholar] [CrossRef] [PubMed]
- Sánchez, P.A. Tripling crop yields in tropical Africa. Nat. Geosci. 2010, 3, 299–300. [Google Scholar] [CrossRef]
- Tudi, M.; Ruan, H.D.; Wang, L.; Lyu, J.; Sadler, R.; Connell, D.; Chu, C.; Phung, D.T. Agriculture Development, Pesticide Application and Its Impact on the Environment. Int. J. Environ. Res. Public Health 2021, 18, 1112. [Google Scholar] [CrossRef]
- van Midden, C.; Harris, J.; Shaw, L.; Sizmur, T.; Pawlett, M. The impact of anaerobic digestate on soil life: A review. Appl. Soil Ecol. 2023, 191, 105066. [Google Scholar] [CrossRef]
- Gao, P.L.; Shi, D.L.; Liu, C.; He, Y.T.; Xue, G. Research progress on denitrification technology for biogas slurry from anaerobic fermentation of organic wastes. Mod. Chem. Ind. 2024, 44, 48–53. [Google Scholar] [CrossRef]
- Aziz, Y.; Shah, G.A.; Rashid, M.I. ZnO nanoparticles and zeolite influence soil nutrient availability but do not affect herbage nitrogen uptake from biogas slurry. Chemosphere 2019, 216, 564–575. [Google Scholar] [CrossRef]
- Alfa, M.I.; Adie, D.B.; Igboro, S.B.; Oranusi, U.S.; Dahunsi, S.O.; Akali, D.M. Assessment of biofertilizer quality and health implications of anaerobic digestion effluent of cow dung and chicken droppings. Renew. Energy 2014, 63, 681–686. [Google Scholar] [CrossRef]
- Stürmer, B. Biogas–Part of Austria’s future energy supply or political experiment? Renew. Sustain. Energy Rev. 2017, 79, 525–532. [Google Scholar] [CrossRef]
- Mukhtiar, A.; Mahmood, A.; Zia, M.A.; Ameen, M.; Dong, R.; Shoujun, Y.; Javaid, M.M.; Khan, B.A.; Nadeem, M.A. Role of biogas slurry to reclaim soil properties providing an eco-friendly approach for crop productivity. Bioresour. Technol. Rep. 2024, 25, 101716. [Google Scholar] [CrossRef]
- Samoraj, M.; Mironiuk, M.; Izydorczyk, G.; Witek-Krowiak, A.; Szopa, D.; Moustakas, K.; Chojnacka, K. The challenges and perspectives for anaerobic digestion of animal waste and fertilizer application of the digestate. Chemosphere 2022, 295, 133799. [Google Scholar] [CrossRef] [PubMed]
- Stürmer, B.; Pfundtner, E.; Kirchmeyr, F.; Uschnig, S. Legal requirements for digestate as fertilizer in Austria and the European Union compared to actual technical parameters. J. Environ. Manag. 2020, 253, 109756. [Google Scholar] [CrossRef] [PubMed]
- GB/T 40750-2021; Biogas Slurry for Agricultural Use. China Standards Publishing House: Beijing, China, 2021; pp. 2–3, (In Chinese with English Abstract).
- Li, J.P.; Wan, D.D.; Jin, S.R.; Ren, H.W.; Wang, Y.R.; Huang, J.J.; Li, H.; Zhang, G.Q. Fast treatment and recycling method of large-scale vegetable wastes. Sci. Total Environ. 2023, 892, 164308. [Google Scholar] [CrossRef]
- Al-Mutairi, N.Z. Aerobic selectors in slaughterhouse activated sludge systems: A preliminary investigation. Bioresour. Technol. 2009, 100, 50–58. [Google Scholar] [CrossRef] [PubMed]
- Farooq, R.; Ahmad, Z. Slaughterhouse Wastewater: Treatment, Management and Resource Recovery. In Physico-Chemical Wastewater Treatment and Resource Recovery; IntechOpen: Rijeka, Croatia, 2017; Chapter 8. [Google Scholar] [CrossRef]
- Lischeid, G.; Kalettka, T.; Holländer, M.; Steidl, J.; Merz, C.; Dannowski, R.; Hohenbrink, T.; Lehr, C.; Onandia, G.; Reverey, F.; et al. Natural ponds in an agricultural landscape: External drivers, internal processes, and the role of the terrestrial-aquatic interface. Limnologica 2018, 68, 5–16. [Google Scholar] [CrossRef]
- Sengar, A.; Aziz, A.; Farooqi, I.H.; Basheer, F. Development of denitrifying phosphate accumulating and anammox micro-organisms in anaerobic hybrid reactor for removal of nutrients from low strength domestic sewage. Bioresour. Technol. 2018, 267, 149–157. [Google Scholar] [CrossRef] [PubMed]
- Ai, P.; Jin, K.; Alengebawy, A.; Elsayed, M.; Meng, L.; Chen, M.; Ran, Y. Effect of application of different biogas fertilizer on eggplant production: Analysis of fertilizer value and risk assessment. Environ. Technol. Innov. 2020, 19, 101019. [Google Scholar] [CrossRef]
- Wang, L.; Guo, S.R.; Wang, Y.; Yi, D.D.; Wang, J. Poultry biogas slurry can partially substitute for mineral fertilizers in hydroponic lettuce production. Environ. Sci. Pollut. Res. 2019, 26, 659–671. [Google Scholar] [CrossRef]
- Zhang, B.X.; Sun, Q.P.; Li, S.Y.; Li, G.X.; Du, L.L.; Wang, Y.Y.; Yuan, J.; Zhang, D.F. Aeration parameter optimization for improving biological effectiveness of biogas slurry. Trans. CSAE 2016, 32, 226–232. [Google Scholar] [CrossRef]
- Shi, C.; Wang, K.; Zheng, M.; Liu, Y.; Ma, J.; Li, K. The efficiencies and capacities of carbon conversion in fruit and vegetable waste two-phase anaerobic digestion: Ethanol-path vs. butyrate-path. Waste Manag. 2021, 126, 737–746. [Google Scholar] [CrossRef] [PubMed]
- Jiang, X.; Xie, Y.; Liu, M.; Bin, S.; Liu, Y.; Huan, C.; Ji, G.; Wang, X.; Yan, Z.; Lyu, Q. Study on anaerobic co-digestion of municipal sewage sludge and fruit and vegetable wastes: Methane production, microbial community and three-dimension fluorescence excitation-emission matrix analysis. Bioresour. Technol. 2022, 347, 126748. [Google Scholar] [CrossRef] [PubMed]
- Bres, P.; Beily, M.E.; Young, B.J.; Gasulla, J.; Butti, M.; Crespo, D.; Candal, R.; Komilis, D. Performance of semi-continuous anaerobic co-digestion of poultry manure with fruit and vegetable waste and analysis of digestate quality: A bench scale study. Waste Manag. 2018, 82, 276–284. [Google Scholar] [CrossRef] [PubMed]
- Sha, H.; Wang, Q.; Dong, Z.; Cao, S.; Zhao, B.; Wang, G.; Duan, J. NaOH-urea pretreatment enhanced H2 and CH4 yields via optimizing mixed alkali ratio, pretreatment time, and organic loading rate during anaerobic digestion of corn stover. Energy 2024, 288, 129595. [Google Scholar] [CrossRef]
- Xie, Z.; Zou, H.; Zheng, Y.; Fu, S.-F. Improving anaerobic digestion of corn straw by using solid-state urea pretreatment. Chemosphere 2022, 293, 133559. [Google Scholar] [CrossRef]
- Qu, Y.; Zhai, Y.; Ma, C.; Shi, W.; Zhao, M.; Huang, Z.; Ruan, W. Rapid start-up of anaerobic digestion reactor with rice-straw ash addition for treating high salinity organic wastewater. Process Saf. Environ. Prot. 2023, 175, 806–813. [Google Scholar] [CrossRef]
- Qu, Y.H.; Guan, Q.Y.; Du, Y.; Shi, W.S.; Zhao, M.X.; Huang, Z.X.; Ruan, W.Q. Insight into the effect of rice-straw ash on enhancing the anaerobic digestion performance of high salinity organic wastewater. Chemosphere 2023, 340, 139920. [Google Scholar] [CrossRef]
- Ezieke, A.H.; Serrano, A.; Clarke, W.; Villa-Gomez, D.K. Bottom ash from smouldered digestate and coconut coir as an alkalinity supplement for the anaerobic digestion of fruit waste. Chemosphere 2022, 296, 134049. [Google Scholar] [CrossRef] [PubMed]
- Dalke, R.; Demro, D.; Khalid, Y.; Wu, H.; Urgun-Demirtas, M. Current status of anaerobic digestion of food waste in the United States. Renew. Sustain. Energy Rev. 2021, 151, 111554. [Google Scholar] [CrossRef]
- Cui, W.D. Study on the Methane Production Properties of the Mixture with Synergistic Anaerobic Digestion. Master’s thesis, Lanzhou University of Technology, Lanzhou, China, 2018. [Google Scholar]
- Wang, H.X.; Xu, J.L.; Sheng, L.X.; Liu, X.J. Effect of addition of biogas slurry for anaerobic fermentation of deer manure on biogas production. Energy 2018, 165, 411–418. [Google Scholar] [CrossRef]
- Li, J.P.; Shan, S.X.; Dong, T. Characteristic of gas production of over-ground household thermostatic biogas digester heated by solar energy. Trans. CSAE 2015, 31, 287–291. [Google Scholar] [CrossRef]
- Li, J.P.; Zhen, X.F.; Yang, A.R.; Huang, J.J.; Dong, T. Gas characteristics of household solar biogas production system with constant temperature in whole year. Trans. CSAE 2016, 32, 220–225. [Google Scholar] [CrossRef]
- Sun, Q.; Zhang, Z.Y.; Li, G.X.; Du, L.L. Effects of different aeration conditions on nutrients and biological toxicity of biogas slurry for drip irrigation. China Biogas 2017, 35, 43–47. [Google Scholar]
- NYT 1977-2010; Water-soluble Fertilizers-Determination of Total Nitrogen, Phosphorus and Potassium Content. Ministry of Agriculture and Rural Affairs of the Peoples Republic of China: Beijing, China, 2010; pp. 1–8, (In Chinese with English Abstract).
- De Vrieze, J.; Saunders, A.M.; He, Y.; Fang, J.; Nielsen, P.H.; Verstraete, W.; Boon, N. Ammonia and temperature determine potential clustering in the anaerobic digestion microbiome. Water Res. 2015, 75, 312–323. [Google Scholar] [CrossRef]
- Kim, M.S.; Kim, D.H.; Yun, Y.M.J.F. Effect of operation temperature on anaerobic digestion of food waste: Performance and microbial analysis. Fuel 2017, 209, 598–605. [Google Scholar] [CrossRef]
- Cremonez, P.A.; Teleken, J.G.; Weiser Meier, T.R.; Alves, H.J. Two-Stage anaerobic digestion in agroindustrial waste treatment: A review. J. Environ. Manag. 2021, 281, 111854. [Google Scholar] [CrossRef] [PubMed]
- Jiang, J.F.; Wu, P.W.; Sun, Y.M.; Guo, Y.F.; Song, B.; Huang, Y.; Xing, T.; Li, L.H. Comparison of microbial communities during anaerobic digestion of kitchen waste: Effect of substrate sources and temperatures. Bioresour. Technol. 2020, 317, 124016. [Google Scholar] [CrossRef]
- Zhang, X.M.; Yun, S.N.; Du, Y.F.; Du, T.T.; Gai, G.S.; Zhang, W.Q. Recent progress and outlook of biocatalysts for anaerobic fermentation in biogas production process. Trans. CSAM 2015, 46, 141–155. [Google Scholar] [CrossRef]
- He, Y.; Yan, X.X.; Li, Y.; Liu, H.H.; Yang, H.; Duan, X.Y.; Lu, X.Y.; Tian, Y.; Wang, C. Progress in anaerobic digestion of exogenous additives. EnEng 2024, 42, 175–186. [Google Scholar] [CrossRef]
- Lu, Y.; Yuan, H.R.; Yan, B.B.; Zuo, X.Y.; Li, X.J. Improved performance of corn stover anaerobic digestion by low-temperature hydrothermal pretreatment with urea enhancement. Biomass Bioenergy 2022, 164, 106553. [Google Scholar] [CrossRef]
- Wang, Y.Z.; Peng, Z.; Liao, Q.; Zhu, X.; Li, J.; Wang, H.; Ding, Y.D.; Ye, D.D. Effect of supplements on biogas production characteristics in anaerobic digester with anti-scum device. Acta Energiae Solaris Sin. 2013, 34, 116–122. [Google Scholar] [CrossRef]
- Yin, C.K.; Shen, Y.W.; Zhu, N.W.; Huang, Q.J.; Lou, Z.Y.; Yuan, H.P. Anaerobic digestion of waste activated sludge with incineration bottom ash: Enhanced methane production and CO2 sequestration. Appl. Energy 2018, 215, 503–511. [Google Scholar] [CrossRef]
- Duan, N.; Lin, C.; Tian, H.; Zhong, M.; Zhang, D.; Liang, S. Effects of urea and inorganic saline soil on anaerobic digestion of straw. Trans. CSAE 2015, 31, 254–260. [Google Scholar] [CrossRef]
- Jena, S.P.; Mishra, S.; Acharya, S.K.; Mishra, S.K. An experimental approach to produce biogas from semi dried banana leaves. Sustain. Energy Technol. Assess. 2017, 19, 173–178. [Google Scholar] [CrossRef]
- Toufexis, C.; Makris, D.-O.; Vlachokostas, C.; Michailidou, A.V.; Christos, M.; Vachtsiavanou, A. Bridging the Gap between Biowaste and Biomethane Production: A Systematic Review Meta-Analysis Methodological Approach. Sustainability 2024, 16, 6433. [Google Scholar] [CrossRef]
- Li, J.P.; Zhou, D.D.; Zhang, Q.F.; Zhai, P.P.; Feng, R. Effect of temperature on the composition of biogas produced by high concentration constant temperature anaerobic fermentation. J. Lanzhou Univ. Technol. 2012, 38, 44–48. [Google Scholar] [CrossRef]
- Zhang, W.L.; Wang, X.; Xing, W.L.; Li, R.D.; Yang, T.H. Responses of anaerobic digestion of food waste to coupling effects of inoculum origins, organic loads and pH control under high load: Process performance and microbial characteristics. J. Environ. Manag. 2020, 279, 111772. [Google Scholar] [CrossRef]
- Ma, J.Y.; Pan, J.T.; Gao, T.L.; Qiu, L.; Liu, H.B. Enhanced anaerobic digestion of chicken manure by bentonite addition. Res. Environ. Sci. 2016, 29, 442–448. [Google Scholar] [CrossRef]
- Negri, M.; Bacenetti, J.; Fiala, M.; Bocchi, S. Evaluation of anaerobic degradation, biogas and digestate production of cereal silages using nylon-bags. Bioresour. Technol. 2016, 209, 40–49. [Google Scholar] [CrossRef]
- Reinhold, G.; Breitschuh, G.; Herold, L. Standpunkt zur Ermittlung der Nährstoffgehalte und zur Nährstoffbilanzierung bei Einsatz von Biogasgülle. 2006. Available online: https://www.db-thueringen.de/receive/dbt_mods_00024413 (accessed on 2 November 2024).
- Procházka, J.; Dolej, P.; Máca, J.; Dohányos, M. Stability and inhibition of anaerobic processes caused by insufficiency or excess of ammonia nitrogen. Appl. Microbiol. Biotechnol. 2012, 93, 439–447. [Google Scholar] [CrossRef] [PubMed]
- Rajagopal, R.; Massé, D.I.; Singh, G. A critical review on inhibition of anaerobic digestion process by excess ammonia. Bioresour. Technol. 2013, 143, 632–641. [Google Scholar] [CrossRef]
- Jiang, Y.; McAdam, E.; Zhang, Y.; Heaven, S.; Banks, C.; Longhurst, P. Ammonia inhibition and toxicity in anaerobic digestion: A critical review. J. Water Process. Eng. 2019, 32, 100899. [Google Scholar] [CrossRef]
- Huang, G.Q.; Huang, J.; Zhang, Y.; Han, L.J. Feasibility Analysis of Rapid Prediction of Seed Germination Index during Digestate Aerobic Composting. Trans. CSAM 2016, 47, 177–182. [Google Scholar] [CrossRef]
- Di Maria, F.; Sordi, A.; Cirulli, G.; Gigliotti, G.; Massaccesi, L.; Cucina, M. Co-treatment of fruit and vegetable waste in sludge digesters. An analysis of the relationship among bio-methane generation, process stability and digestate phytotoxicity. Waste Manag. 2014, 34, 1603–1608. [Google Scholar] [CrossRef]
- Zeng, G.M.; Huang, D.L.; Huang, G.H.; Hu, T.J.; Jiang, X.Y.; Feng, C.L.; Chen, Y.N.; Tang, L.; Liu, H.L. Composting of lead-contaminated solid waste with inocula of white-rot fungus. Bioresour. Technol. 2007, 98, 320–326. [Google Scholar] [CrossRef] [PubMed]
- Zucconi, F.; Pera, A.; Forte, M.; Bertoldi, M.D. Evaluating toxicity of immature compost. BioCycle 1981, 22, 54–57. [Google Scholar] [CrossRef]
- Manu, M.K.; Li, D.Y.; Liwen, L.; Jun, Z.; Varjani, S.; Wong, J.W.C. A review on nitrogen dynamics and mitigation strategies of food waste digestate composting. Bioresour. Technol. 2021, 334, 125032. [Google Scholar] [CrossRef] [PubMed]
- Verdi, L.; Kuikman, P.J.; Orlandini, S.; Mancini, M.; Napoli, M.; Dalla Marta, A. Does the use of digestate to replace mineral fertilizers have less emissions of N2O and NH3? Agr. Forest Meteorol. 2019, 269–270, 112–118. [Google Scholar] [CrossRef]
- Zhang, L.; Lee, Y.-W.; Jahng, D. Ammonia stripping for enhanced biomethanization of piggery wastewater. J. Hazard. Mater. 2012, 199–200, 36–42. [Google Scholar] [CrossRef] [PubMed]
- Ağdağ, O.N.; Sponza, D.T. Effect of alkalinity on the performance of a simulated landfill bioreactor digesting organic solid wastes. Chemosphere 2005, 59, 871–879. [Google Scholar] [CrossRef] [PubMed]
- Baun, A.; Ledin, A.; Reitzel, L.A.; Bjerg, P.L.; Christensen, T.H. Xenobiotic organic compounds in leachates from ten Danish MSW landfills—Chemical analysis and toxicity tests. Water Res. 2004, 38, 3845–3858. [Google Scholar] [CrossRef] [PubMed]
- Zilio, M.; Orzi, V.; Chiodini, M.E.; Riva, C.; Acutis, M.; Boccasile, G.; Adani, F. Evaluation of ammonia and odour emissions from animal slurry and digestate storage in the Po Valley (Italy). Waste Manag. 2020, 103, 296–304. [Google Scholar] [CrossRef]
- DB33 699-2008; Quality and Safety Requirements for Organic Liquid Fertilizer and Organic-Inorganic Compound Liquid Fertilizer. Zhejiang Provincial Bureau of Quality and Technical Supervision: Hangzhou, China, 2008; pp. 1–5, (In Chinese with English Abstract).
- HG/T4365-2012; Water Soluble Fertilizer. The Chemical Industry Press: Beijing, China, 2012; pp. 1–19, (In Chinese with English Abstract).
- Risberg, K.; Cederlund, H.; Pell, M.; Arthurson, V.; Schnürer, A. Comparative characterization of digestate versus pig slurry and cow manure—Chemical composition and effects on soil microbial activity. Waste Manag. 2017, 61, 529–538. [Google Scholar] [CrossRef] [PubMed]
- Kothari, R.; Pandey, A.K.; Kumar, S.; Tyagi, V.V.; Tyagi, S.K. Different aspects of dry anaerobic digestion for bio-energy: An overview. Renew. Sustain. Energy Rev. 2014, 39, 174–195. [Google Scholar] [CrossRef]
- Wu, G.Y. Analysis of influencing factors of anaerobic fermentation of livestock and poultry manure. Anhui Agric. Sci. 2020, 48, 211–224. [Google Scholar] [CrossRef]
Disclaimer/Publisher’s Note: The statements, opinions and data contained in all publications are solely those of the individual author(s) and contributor(s) and not of MDPI and/or the editor(s). MDPI and/or the editor(s) disclaim responsibility for any injury to people or property resulting from any ideas, methods, instructions or products referred to in the content. |
© 2025 by the authors. Licensee MDPI, Basel, Switzerland. This article is an open access article distributed under the terms and conditions of the Creative Commons Attribution (CC BY) license (https://creativecommons.org/licenses/by/4.0/).