Article

A Novel Sensitivity Analysis Framework for Quantifying Permafrost Impacts on Runoff Variability in the Yangtze River Source Region

1
State Key Laboratory of Simulation and Regulation of Water Cycle in River Basin, China Institute of Water Resources and Hydropower Research (IWHR), Beijing 100038, China
2
China Renewable Energy Engineering Institute, Beijing 100120, China
*
Author to whom correspondence should be addressed.
Sustainability 2025, 17(4), 1570; https://doi.org/10.3390/su17041570
Submission received: 23 December 2024 / Revised: 9 February 2025 / Accepted: 12 February 2025 / Published: 14 February 2025
(This article belongs to the Special Issue Sustainable Water Management in Rapid Urbanization)

Abstract

:
In the context of global climate change, understanding cryosphere degradation and its impact on water resources in alpine regions is crucial for sustainable development. This study investigates the relationship between permafrost degradation and runoff variations in the Source Region of the Yangtze River (SRYR), a critical water tower for sustainable water supply in Asia. We propose a novel method for assessing permafrost sensitivity, which establishes the correlation between cryosphere changes and hydrological responses, contributing to sustainable water resource management. Our research quantifies key uncertainties in runoff change attribution, providing essential data for sustainable decision making. Results show that changes in watershed characteristics account for up to 20% of runoff variation, with permafrost degradation (−0.02 sensitivity) demonstrating a greater influence than NDVI variations. The findings offer critical insights for the development of sustainable adaptation strategies, particularly in maintaining ecosystem services and ensuring long-term water security under changing climate conditions. This study offers a scientific basis for climate-resilient water management policies in high-altitude regions.

1. Introduction

Global climate change has altered the spatial and temporal distribution of precipitation and temperature, leading to more frequent extreme weather events. The Qinghai-Tibetan Plateau is often referred to as an “amplifier” of global climate change [1,2]. Due to its high elevation, low temperatures, and fragile ecosystems, the plateau is more vulnerable to the impacts of global climate change compared to other regions, experiencing more intense and uncertain effects [3]. Notably, the Qinghai-Tibetan Plateau contains the largest area of alpine permafrost in the world [4]. In recent years, continued warming has disrupted the freeze–thaw balance of the surface [5,6,7]. In permafrost regions, this degradation has been manifested by a decreasing permafrost area and an increasing Active Layer Thickness (ALT) [8,9]. However, the hydrological impacts of permafrost degradation on the Qinghai-Tibetan Plateau remain largely unknown.
Permafrost, as a solid water reservoir, plays a critical role in cold-region hydrology by regulating and storing runoff [10,11]. To date, both statistical and physically based hydrological models have been employed for runoff attribution analysis in watersheds [12,13,14]. However, the fact that permafrost primarily exists in remote, difficult-to-access, high-latitude and high-altitude regions, combined with the high cost and logistical challenges of deploying and maintaining monitoring facilities, has limited the acquisition of continuous, long-term data [15]. This poses a significant challenge for physical modeling, which requires large volumes of high-quality, accurate data [16,17], thereby constraining hydrological research on permafrost to some extent. In contrast, conceptually based statistical approaches have demonstrated good performance, even in the absence of extensive calibration data [18,19]. Notably, Budyko functions provide a simple yet effective method for analyzing runoff variation and attributing watershed runoff contributions, with high reliability [20]. The Budyko hypothesis reflects the water–energy balance of a watershed by employing the aridity index, which is defined as the ratio of potential evaporation to precipitation, and enables the incorporation of other watershed factors via a comprehensive parameter in Budyko functions [21,22]. For example, Fu’s function [23] and the Choudhury–Yang function (Yang’s function) [24] are designed based on the supply and demand limits of water resources, using comprehensive watershed parameters to adjust the shape of the Budyko curves. The aridity index is used to express the influence of precipitation and potential evaporation, which is attributed to climate change, while the comprehensive parameter accounts for anthropogenic factors, vegetation cover, and other watershed characteristics influencing runoff variations [25,26,27]. The Budyko functions establish the relationship between the aridity index and changes in watershed characteristics through the comprehensive parameter, facilitating runoff attribution based on the Budyko hypothesis [16].
To analyze runoff attribution, decomposition and sensitivity methods have been introduced into Budyko functions, with many studies confirming their feasibility [18,28,29,30]. The decomposition method involves assuming different runoff states under varying environmental conditions and using breakpoints to divide the runoff series into two phases, thereby quantitatively distinguishing the contributions of climate change and watershed characteristics to runoff variations [31]. The sensitivity method derives analytical expressions for runoff sensitivity to variables based on the Budyko function, incorporating elasticity coefficients to represent runoff sensitivity to climate factors [24,32,33]. Previous studies using Budyko analysis to assess the impacts of climate change and watershed characteristics have generally only considered vegetation cover and land use changes [16,34]. Therefore, it is necessary to analyze the response of runoff to changes in permafrost characteristics to provide a reference for runoff attribution in alpine watersheds.
The Source Region of the Yangtze River (SRYR), located in the central Qinghai-Tibetan Plateau, has over 70% of its basin covered by permafrost and serves as a significant runoff-generating region, contributing more than 20% of the Yangtze River’s total runoff [35,36]. Although previous studies have extensively investigated runoff attribution on the Qinghai-Tibetan Plateau, research specifically focusing on attribution between changes in permafrost characteristics and basin runoff remains limited. Therefore, this study employs two Budyko functions incorporating comprehensive watershed parameters to assess and compare their applicability in evaluating runoff variations in the SRYR. Two distinct change-point detection methods are used to differentiate phases of runoff changes, thereby enhancing the accuracy of runoff analysis. Finally, a calculation method is proposed to quantify the relationship between changes in permafrost characteristics and runoff variations, with a focus on the sensitivity of runoff to changes in permafrost characteristics in the SRYR.

2. Materials and Methods
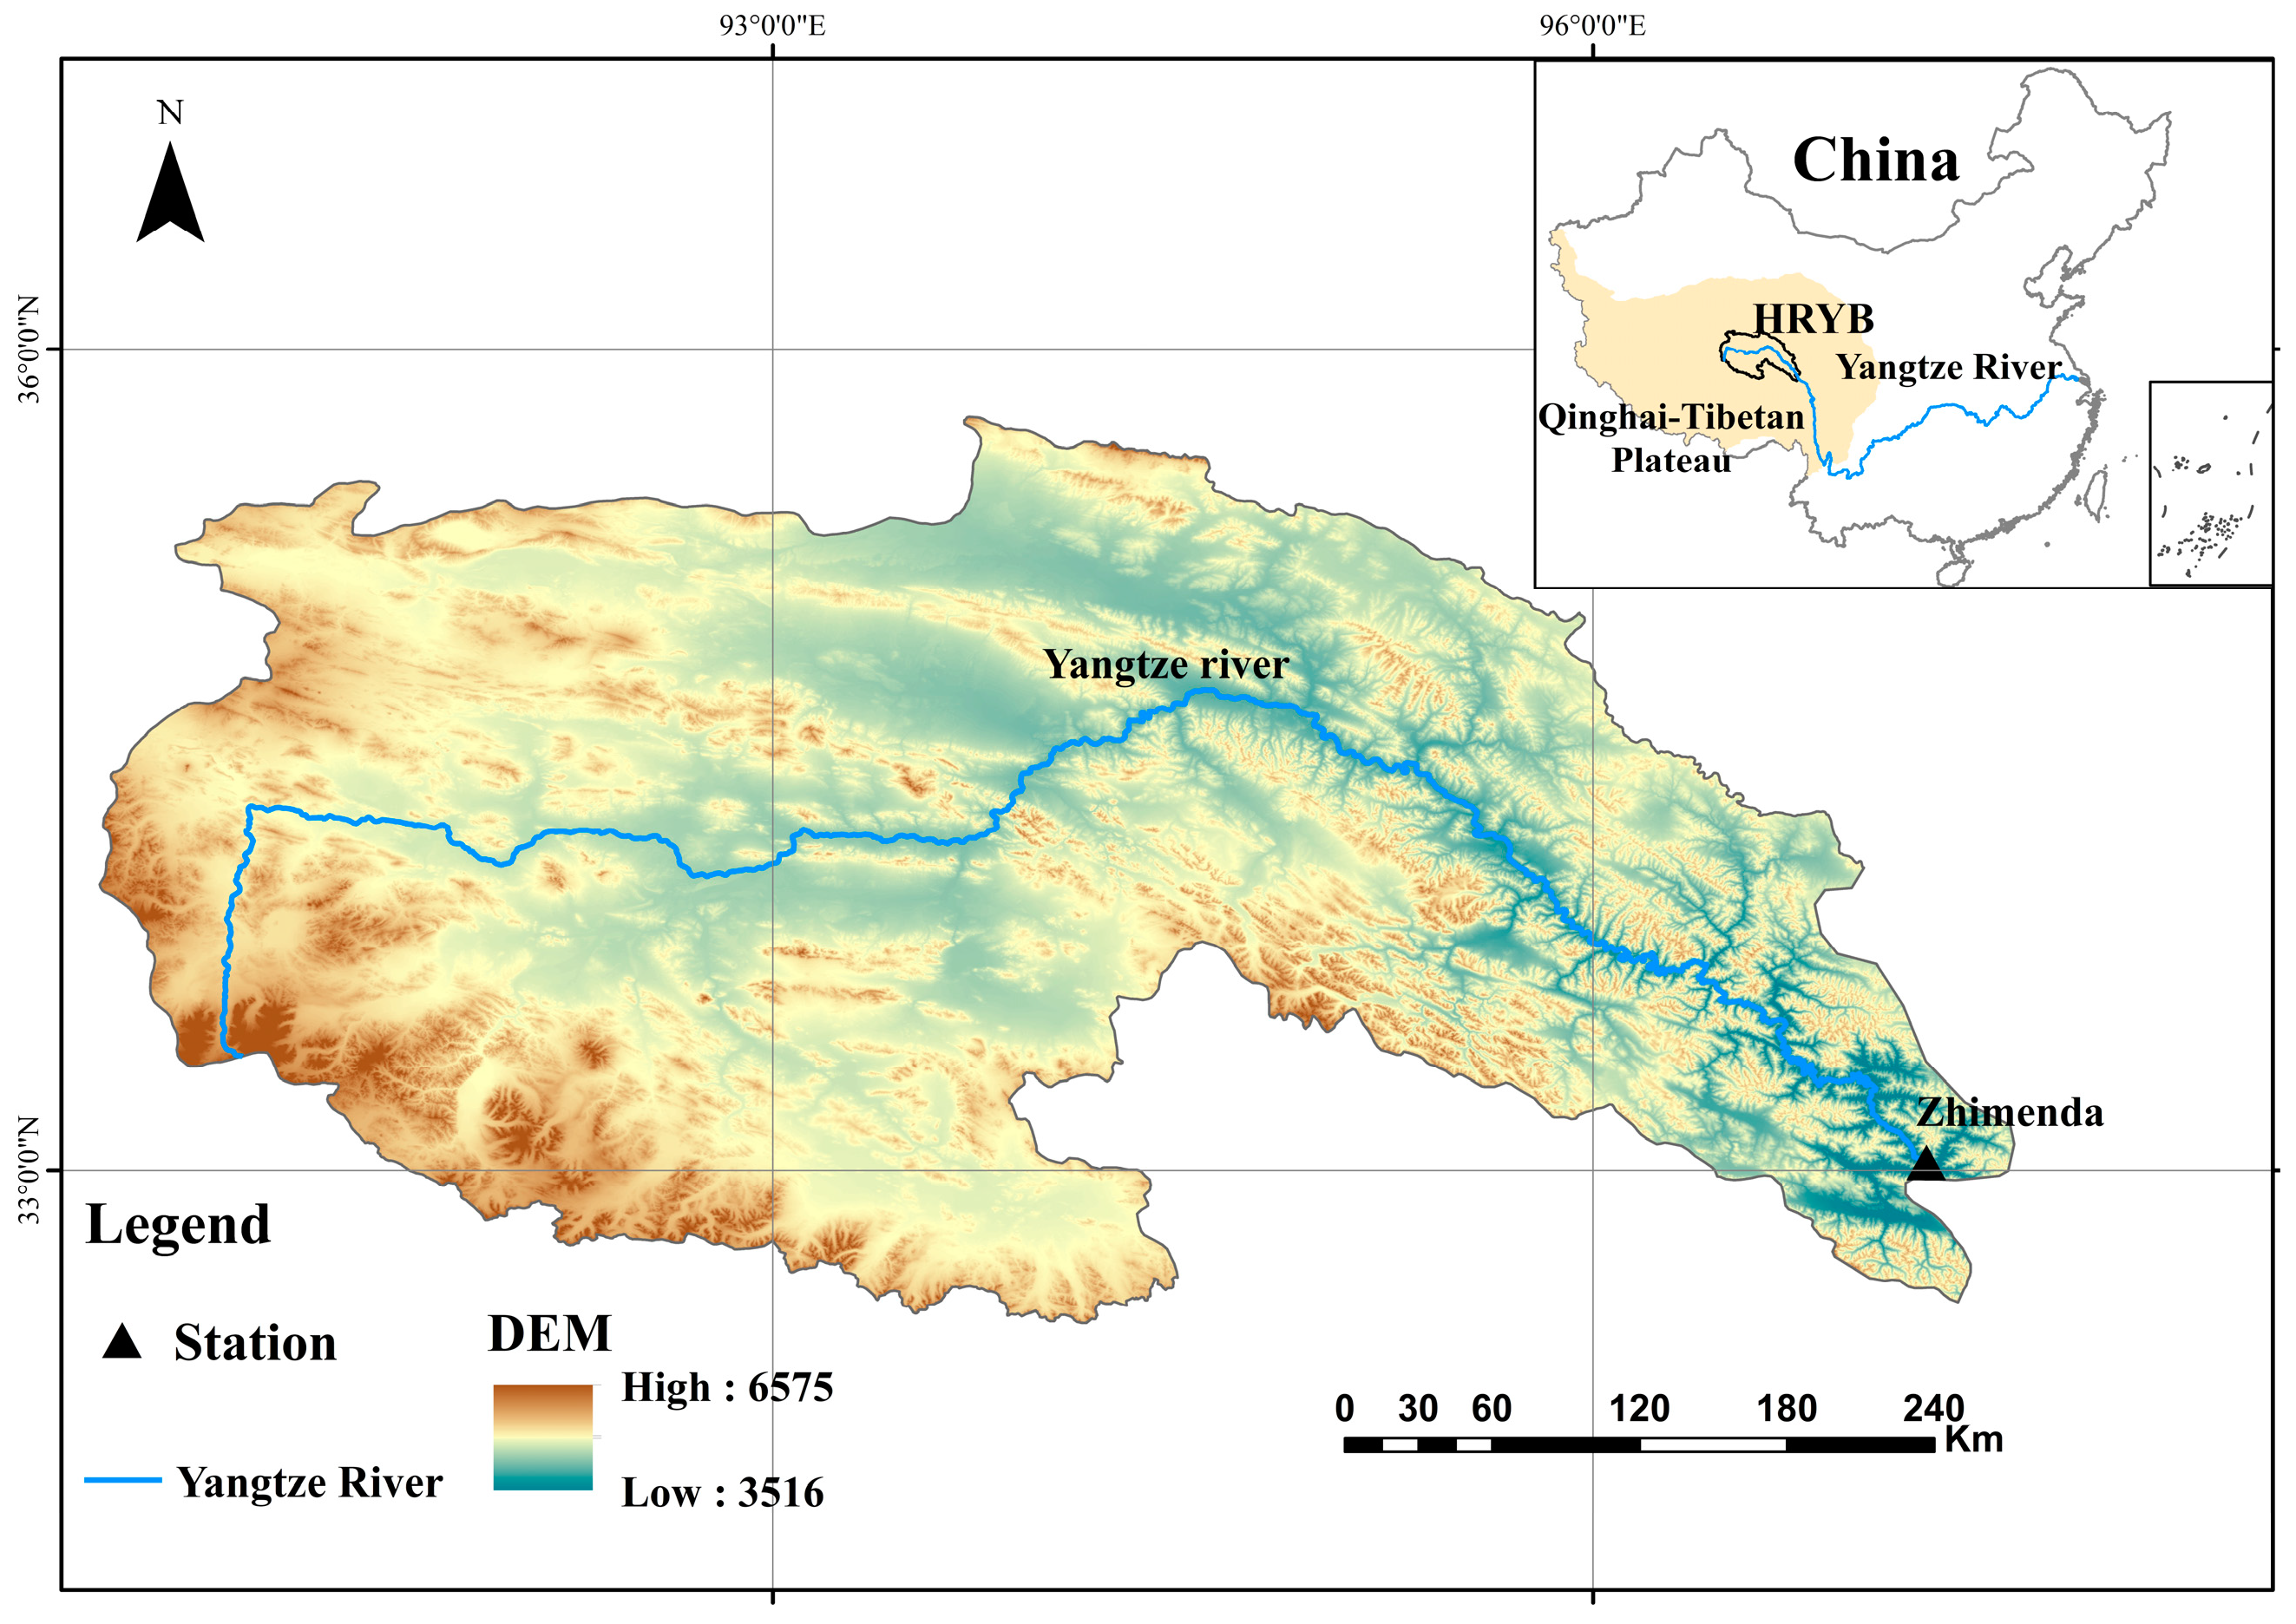
2.1. Study Area

The SRYR (32°26′–35°53′ N, 90°13′–97°19′ E), which is the catchment area of the Yangtze River basin above the Zhimenda (ZMD) hydrological station, is located in the central part of the Qinghai-Tibetan Plateau and covers an area of 142,700 km2 (Figure 1). The SRYR comprises only 7.9% of the total area of the Yangtze River Basin but provides about 20% of the water to the basin [36,37]. The SRYR’s elevation ranges from 3516 m to 6575 m, and the temperature in the region has increased at a rate of 0.3 °C per decade since 1961. Additionally, the study area has a high permafrost coverage of 78% [35].

2.2. Data

This study employed meteorological data, runoff data, land cover data, and permafrost data to explore the long-term climate and hydrological changes in the SRYR. Precipitation and temperature data were obtained through spatial downscaling of the global 0.5° climate dataset from the Global Runoff Unit (GRU) and the high-resolution dataset from WorldClim, with a monthly temporal resolution and a 1 km spatial resolution [38,39,40,41]. The Potential Evaporation dataset has a monthly temporal resolution and a spatial resolution of 1 km, obtained using the Hargreaves potential evapotranspiration calculation formula [38,39,41]. With the aim of reflecting the variations in the characteristics of the river basin, this study used the Normalized Difference Vegetation Index (NDVI) and permafrost datasets. The PKU GIMMS Normalized Difference Vegetation Index product (PKU GIMMS NDVI, version 1.2) provides spatiotemporally consistent global NDVI data at half-month intervals and a spatial resolution of 1/12° from 1982 to 2022 [42]. In this study, the maximum value method was used to obtain the maximum value of each pixel within a year, resulting in annual NDVI data. The maximum NDVI value is usually in the summer and reflects the most vigorous vegetation conditions in the watershed. Land use and land cover changes [43] within the basin were monitored using multi-temporal remote sensing imagery to capture the impacts of human activities, such as changes in cropland, construction land areas, and reservoir regulation [44]. The permafrost data, including permafrost area and active layer thickness (ALT), were obtained from the National Tibetan Plateau Data Center of China. These data were derived using the Top Temperature of Permafrost (TTOP) model to simulate permafrost distribution based on remote sensing surface temperature and meteorological station measurements, while the Stefan equation was employed to estimate the active layer thickness [45]. The permafrost data have a spatial resolution of 1 km and a temporal resolution of five-year intervals from 1961 to 2020. Runoff data were obtained from the Yangtze River Water Resources Commission. The datasets and acquisition methods are summarized in Table 1. All data used in this study passed data quality control measures.

2.3. Methodology

The trend-free pre-whitening Mann–Kendall test (TFPW-MK) was employed for non-monotonic trend analysis. The TFPW-MK and the sliding t-Test were employed to identify potential breakpoints in annual mean runoff. The base periods and change periods of runoff in the watershed were determined based on the corresponding breakpoint. The contributions of precipitation (P), potential evapotranspiration (E0), and watershed characteristic parameters to runoff change were then evaluated using the climate elasticity coefficient method based on different Budyko functions under uncertainty conditions. An uncertainty analysis of runoff change attribution was performed based on different breakpoints and functions. Finally, the constructed sensitivity coefficients of permafrost features were used to identify the sensitivity of various permafrost features to runoff changes in the watershed. The methodological framework is illustrated in Figure 2.

2.3.1. Trend Analysis and Breakpoint Test

  • TFPW-MK
The Mann–Kendall test is a widely used nonparametric statistical test [47,48,49]. It is independent of the sample value distribution type and addresses issues of skewness, non-homogeneous distribution, and outliers in hydrological data [50]. Since autocorrelation can exist in precipitation and runoff data, the results of the MK test can be influenced by the trend and correlation components of the series itself [49,51]. The trend-free pre-whitening (TFPW) method (Equation (1)) is used to transform the autocorrelation series (lag = 1) using Theil–Sen estimator (Sen’s slope). The transformed series is then subjected to the Mann–Kendall nonparametric-order statistics test, addressing the autocorrelation in hydrometeorological time series [52]. Positive values (slope > 0) represent an upward trend, and a trend with MK values greater than 1.96 is considered significant at the 95% confidence level (p < 0.05). The TFPW-MK calculation method [53] is expressed as follows:
β = m e d i a n x j x i j i , j < i
Y t = X t β · t
Y t = Y t r · Y t 1
Y t = Y t β · t
where β denotes the slope trend of the sample data sequence ({x}), Y t denotes the sequence after removing the trend component, Y t denotes the sequence after removing the serial correlation component, r is the lagged correlation coefficient (lag = 1), and Y t is the sequence obtained by the TFPK process.
2.
Sliding t-Test method
The sliding t-test analyzes data trends by comparing the means of two random samples. The mean change in hydrometeorological data can reflect basic climate change trends in the watershed to some extent [34]. By setting different window sizes, the local trend characteristics of the data series can be identified. The t-test was calculated as follows:
t = x 1 ¯ x 2 ¯ s 1 L 1 + 1 L 2
s = L 1 s 1 2 + L 2 s 2 2 L 1 + L 2 2
where x i ¯ is the mean of subsequence i , s i is the standard deviation of the subsequence, and L i ( i = 1,2 ) is the length of the subsequence. For a sliding t-test, a fixed window size (L) is used for t-value calculation before and after the data points ( L 1 = L 2 = L ) . To ensure that the results are statistically significant ( L > 5   a n d   L N 2 ) , N is the total number of data series [54]. In this study, L = 10 ,   t α = 0.01 = 2.878 .

2.3.2. Elasticity of Runoff Derived from the Budyko Function

The Budyko function is a useful tool for studying the interaction of climate variables in long-term water balance, characterizing the partitioning of precipitation (P) into actual evapotranspiration (E) and runoff (R) under two physical limiting conditions [55]. Originally a nonparametric model, numerous functions based on the Budyko hypothesis were later developed to incorporate the effects of various factors on water balance [23,24,56,57,58,59]. Among these formulas, the Choudhury–Yang function [24,56] (Yang’s function, Equation (7)) and Fu’s function [23] (Equation (8)) are based on analytical formulas formed through mathematical reasoning on the basis of the water–energy balance analysis. These equations express precipitation (P) as the amount of water available in the region and potential evapotranspiration (E0) as the available energy. Watershed characteristic parameters (n and ω) are used to represent watershed characteristics such as human activities, relative infiltration capacity, vegetation, land use, soil, and topographic features [60].
  • Yang’s function:
E P = 1 + E 0 P n 1 / n
  • Fu’s function:
E P = 1 + E 0 P 1 + E 0 P ω 1 / ω
Parameters in Yang’s and Fu’s functions lack a priori physical meaning and are typically interpreted as watershed characterization synthesis parameters, representing characteristics other than average climatic conditions (E/P). Therefore, these two functions were used in this study to analyze watershed runoff variability.
According to Equations (7) and (8), the ratio of actual evapotranspiration to precipitation is a function of potential evapotranspiration from the watershed, precipitation, and watershed parameters. Over a long time scale, assuming negligible change in soil water storage, the long-term average water balance of the watershed is P = E + R, meaning the precipitation is equal to the sum of runoff and evapotranspiration. If there is a clear trend in annual runoff, it can be attributed to trends in annual precipitation (P), potential evapotranspiration ( E 0 ), and watershed characteristic parameters ( W p ). The change in annual runoff in the watershed can be expressed as follows:
R = R P P + R E 0 E 0 + R ( W p ) ( W p )
Note: W p represents parameters n and w in Yang’s function and Fu’s function.
To assess the sensitivity of river runoff changes to climate change, Schaake (1990) [61] introduced the concept of precipitation elasticity (Equation (10)). However, precipitation changes alone may not fully capture climate change characteristics, so potential evapotranspiration elasticity coefficients were introduced to similarly obtain the coefficients of variation for watershed characteristic parameters [62,63]. Different differential forms of the Budyko function (Equations (7) and (8)) can be used to derive the precipitation elasticity coefficient of runoff, the potential evapotranspiration elasticity coefficient of runoff, and the subsurface elasticity coefficient of runoff (Equations (10)–(12)):
ε P = d R / R d P / P
ε E 0 = d R / R d E 0 / E 0
ε W p = d R / R d W p / W p
According to the definition of the elasticity coefficient and the results of Equations (9)–(12), the expression of the elasticity coefficient for the change in multi-year runoff in the watershed can be deduced by Equation (13).
d R R = ε P d P P + ε E 0 d E 0 E 0 + ε W P d W p W p

2.3.3. Quantitative Contribution of Variables to Changes in Runoff

Runoff change attribution analysis using the Budyko elasticity coefficient is based on changes in the runoff process within the watershed. The base period ( T b ) and the change period ( T c ) are defined based on the results of the breakpoint analysis. The average multi-year runoff volume in the base period is denoted as R 1 , while the average multi-year volume in the change period is denoted as R 2 . The amount of change in the watershed runoff process is expressed as follows:
R = R 2 R 1 = ε P R P P + ε E 0 R E 0 E 0 + ε W p R W p W p
Runoff changes can be decomposed into runoff changes due to changes in climate variables ( R c l i m a t e ) and runoff changes due to changes in watershed landscape features ( R l u c c ):
R = R c l i m a t e + R l u c c = R p + R E 0 + R W p
The climatic variables mainly consist of the sum of runoff changes due to precipitation changes ( R p ) and runoff changes due to potential evaporation changes ( R E 0 ). In this study, changes in landscape characteristics of the watershed were mainly runoff changes ( R W p ) caused by changes in different land use categories and the permafrost distribution. The contribution of different categories of feature changes to runoff changes can be defined as follows:
V C x = R x R × 100 %
where V C x represents the contribution of factor x ( x = P ,   E 0 ,   W p ) to the change in runoff ( R ) and R x is the amount of change in runoff caused by factor x .

2.3.4. Sensitivity Analysis of Runoff Changes to Permafrost Characteristic Variation

Many studies have used different Budyko functions and elasticity calculation methods for runoff change attribution analysis [64]. They concluded that changes in formula parameters indicate the contribution of changes in watershed characteristics to runoff change. However, most studies have only considered the influence of vegetation changes in watersheds [65,66]. For runoff change attribution in alpine watersheds, it is essential to also consider changes in permafrost characteristics as a major influence, alongside vegetation change.
Building on the findings of previous studies, particularly those by Sankarasubramanian et al. (2001) [32], we propose a new method for calculating the sensitivity of runoff change. This method is based on the concept of the elasticity coefficient (Equation (17)). We characterize the changes in each period by calculating the degree of deviation of permafrost characteristics and runoff from their respective steady-state values, where ‘steady-state’ refers to the long-term average condition assumed to represent equilibrium in the absence of external forcing. The sensitivity of runoff changes in response to variations in permafrost characteristics is quantified by the ratio of the deviation in permafrost characteristics to the corresponding deviation in runoff. This ratio serves as an elasticity coefficient, reflecting how sensitive the runoff is to changes in frozen ground conditions. The calculation is performed as follows:
e F * = m e d i a n F * t F * ¯ | R W p , t | R W p ¯   R W p ¯ F * ¯
where F∗(t)F_*(t)F∗(t) and RW(p,t)R_{W(p,t)}RW(p,t) represent the absolute values of the contributions of basin permafrost characteristics (* can represent either permafrost area or ALT) and basin characteristics to runoff at different periods of time, respectively, and A l t ¯ and R W p ¯ stand for their long-term sample mean values in the basin, respectively.
The climatic elasticity of watershed runoff is refers to the proportional change in watershed runoff in response to changes in climatic variables, such as precipitation [61]. Equation (17) reflects how changes in the permafrost characteristics affect runoff over time. Specifically, the magnitude of the absolute value indicates the sensitivity of watershed runoff changes to variations in permafrost characteristics. A larger absolute value signifies greater sensitivity of runoff to permafrost changes. Positive values suggest that runoff and permafrost characteristic changes follow the same trend, while negative values indicate opposite trends. When the characteristic change approaches the multi-year average value, Equation (17) approaches zero, indicating that permafrost changes have not significantly affected runoff. If runoff deviates significantly from the multi-year average, Equation (17) tends towards positive infinity, suggesting that factors other than permafrost changes are influencing runoff more substantially.

3. Results

3.1. Analysis of Variable Trends

3.1.1. Hydrometeorological Variables

The SRYR has become warmer and wetter in recent years. Figure 3 shows the statistical results of the long-term non-monotonic trend of hydrometeorological variables and their significance calculated by the TFPW-MK method. The hydrometeorological climate variability of the SRYP showed a significant upward trend (p < 0.05). The annual increase in minimum temperature (0.03 °C y−1) was greater than that of maximum temperature (0.02 °C y−1). This indicates that the warming trend in the study area primarily increased the minimum temperature, consistent with previous studies [67].
Over the past 60 years (1961–2020), the mean annual precipitation in the study area has shown an increasing trend (1.12 mm y−1). Precipitation ranged from a minimum of 292.4 mm in 1984 to a maximum of 497.6 mm in 2009. The multi-year mean precipitation for the periods of 1961–1980, 1981–2000, and 2001–2020 was 364.69 mm, 376 mm, and 414.88 mm, respectively. The annual mean precipitation for 2001–2020 was 29.69 mm higher than the overall multi-year mean. The potential evapotranspiration in the study area has also shown an increasing trend, averaging 0.44 mm per year. This phenomenon may be attributed to rising temperatures, which alter the active layer thickness (ALT) of permafrost, thereby affecting the basin’s water cycle to some extent [68]. The establishment of the Sanjiangyuan Nature Reserve by the Chinese government in 2000 may also have contributed to this trend. The restoration of vegetation in the study area led to increased evapotranspiration, which subsequently altered the watershed’s cloudiness and affected the regional energy balance [69].

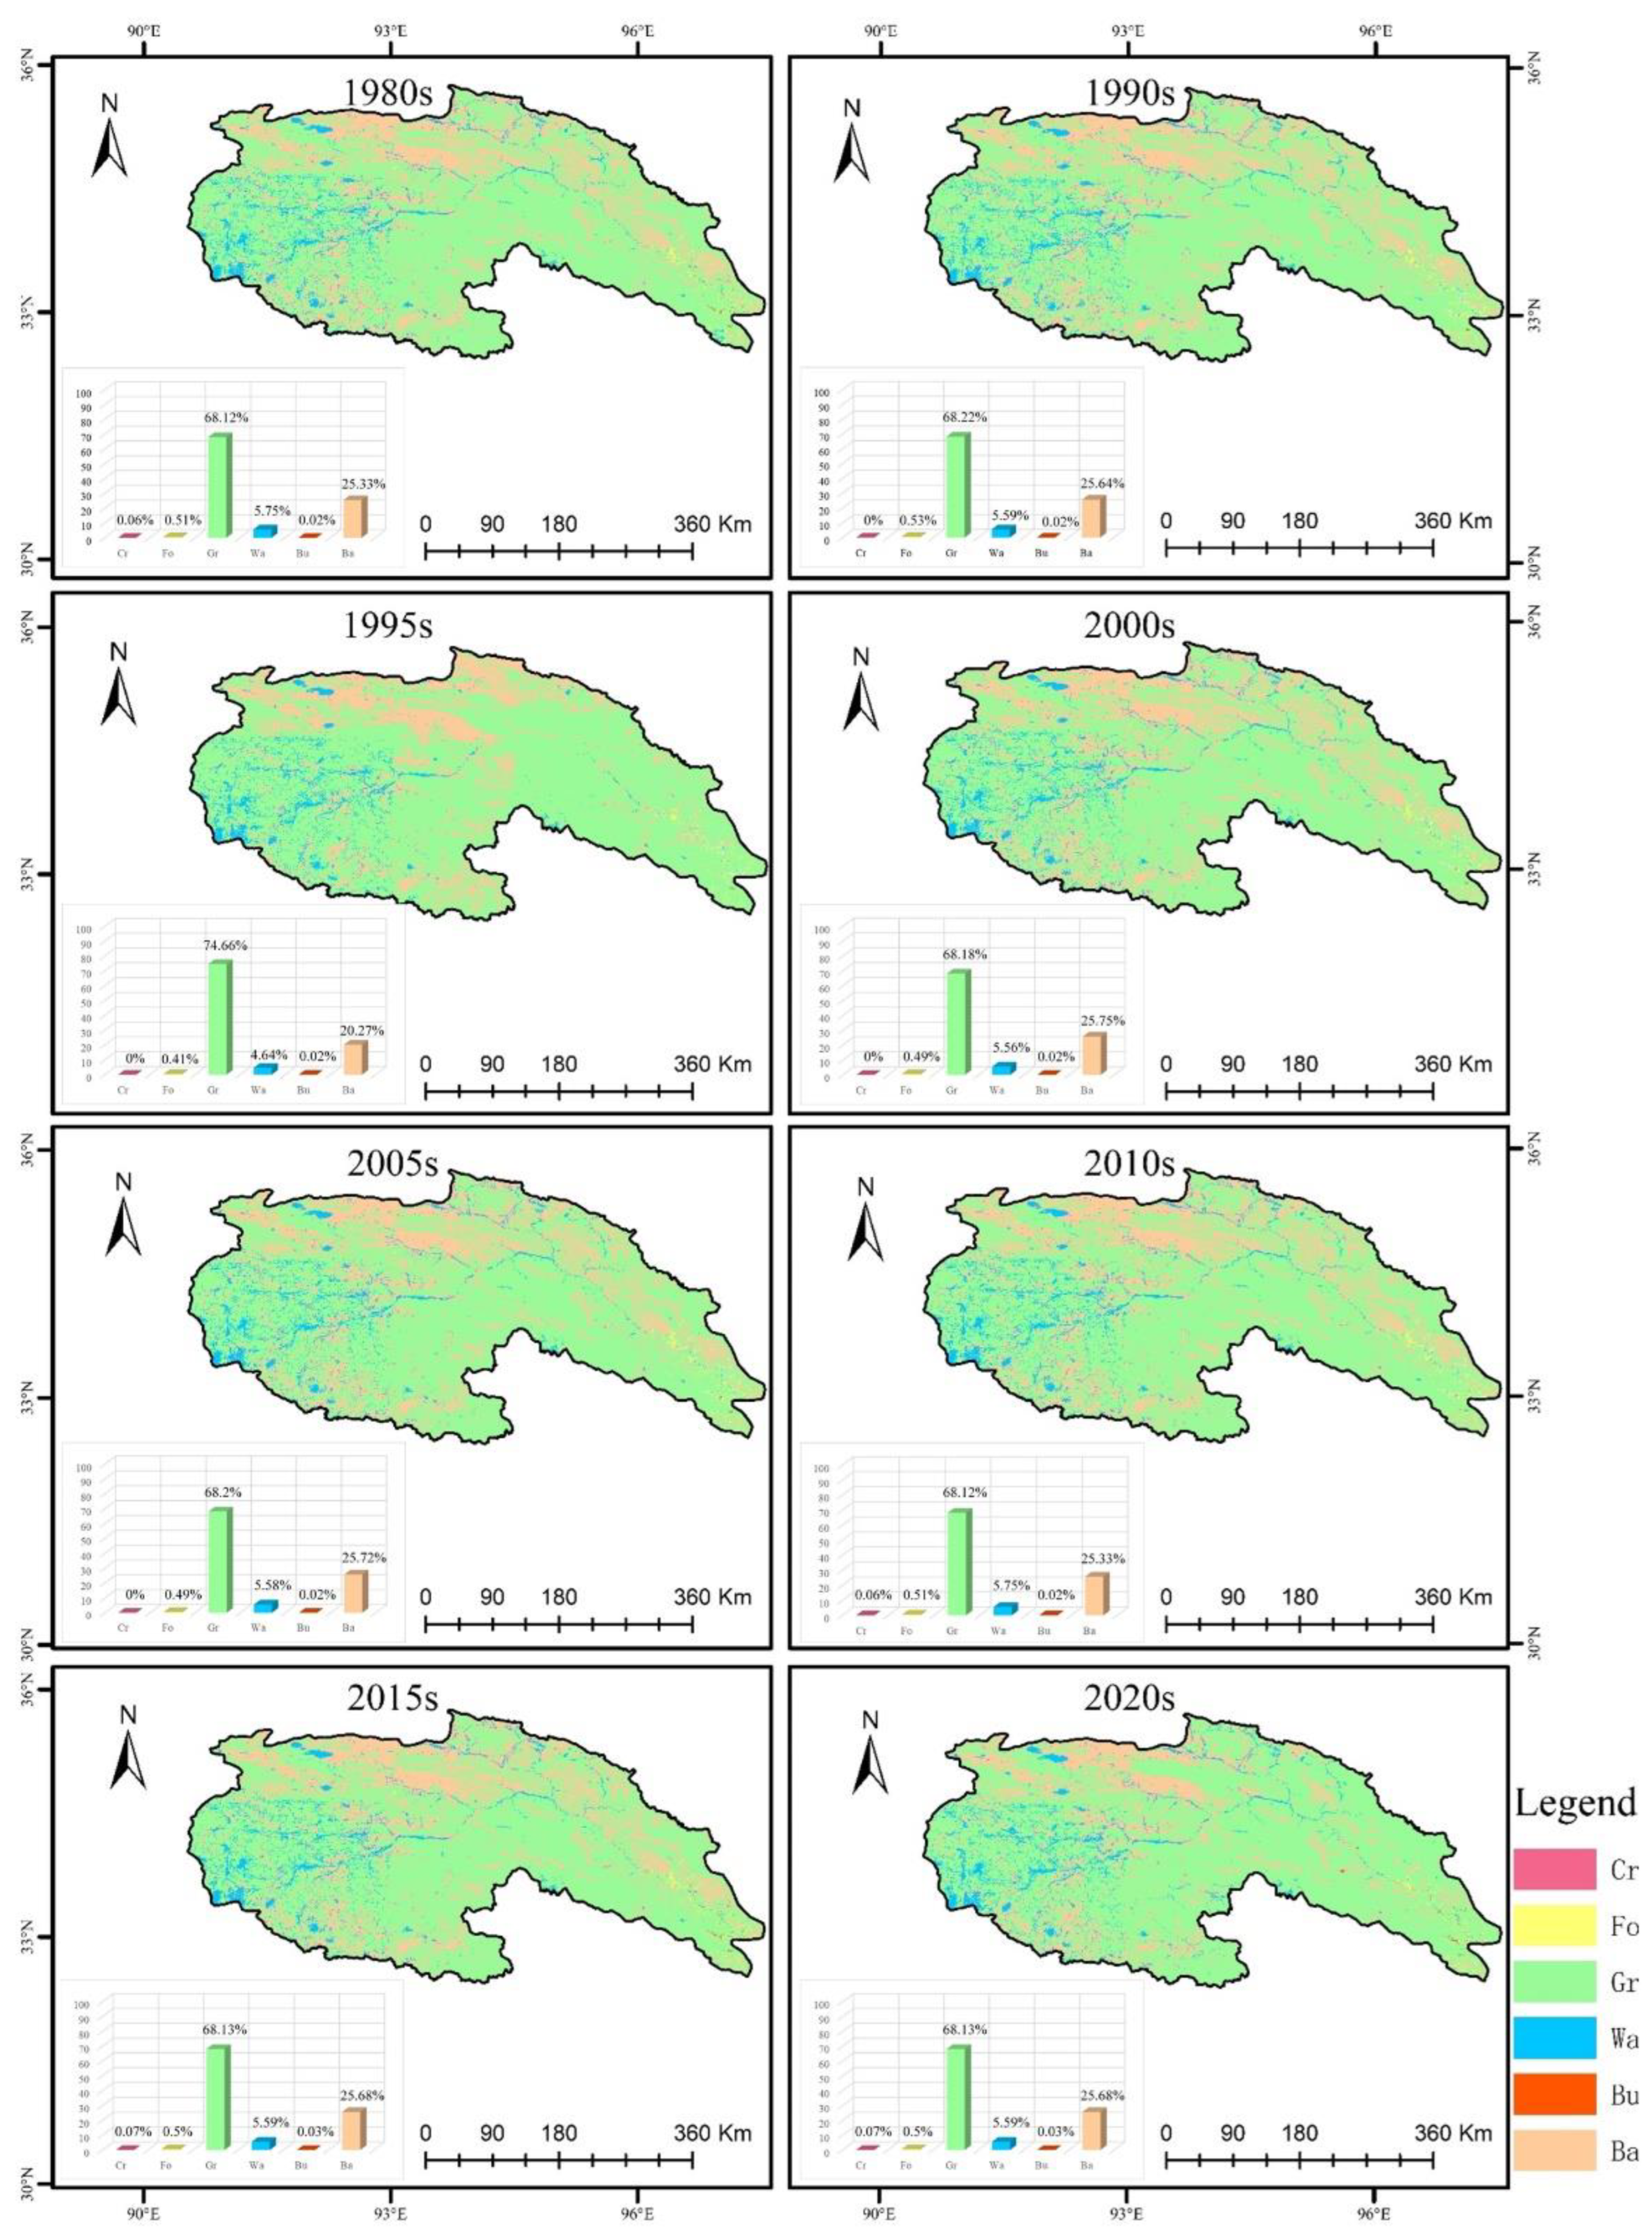
3.1.2. Land Use and Land Cover Changes

To evaluate the applicability of two distinct Budyko functions and explore the variation patterns of land cover and watershed characteristic parameters and their relationships with changes in hydrological variables in the SRYR, we analyzed land use and land cover changes in the basin. Based on the analysis of land use imagery in different periods, grasslands were identified as the dominant land cover type, accounting for roughly 70% of the watershed area. Subsequently, bare land (areas with vegetation cover below 5%, including alpine deserts and tundra) accounted for approximately 24% of the watershed area. From 2000 to 2020, the bare land area decreased by 5.62%, while the areas of cultivated land, forest, grassland, water bodies, and construction land increased by 0.08%, 0.02%, 5.22%, 0.3%, and 0.01%, respectively (Figure A1). These findings suggest that changes in cultivated and construction land in the SRYR basin were insignificant, indicating that the impact of agricultural activities on the changes in watershed characteristics can be deemed negligible. In a specific watershed such as the SRYR, the average slope and relief ratio can be considered constant over a given period. Therefore, it is reasonable to attribute watershed changes primarily to variations in vegetation cover and permafrost extent in this study. The annual maximum NDVI was used to represent regional vegetation dynamics, reflecting the peak growth stage of vegetation. As shown in Figure 4, the annual mean NDVI in the SRYR exhibits fluctuations but remains relatively stable when viewed through a 5-year moving average. Permafrost consists of an active layer on the surface, which undergoes seasonal thawing and freezing, potentially influencing river flow within the permafrost zone [35]. The extent of permafrost in the SRYR has shown a decreasing trend, shrinking from approximately 70% of the watershed area in 1965 to 62% in 2020. Simultaneously, the average active layer thickness increased from 1.9 m in 1965 to 2.1 m in 2020 (Figure 5). These changes suggest that with ongoing climate warming, permafrost in the SRYR is undergoing degradation, which may have significant implications for runoff variation in the region.

3.2. Breakpoint Detection and Water–Energy Balance Analysis

Figure 6 presents the results of the TFPW-MK breakpoint test for annual runoff in the SRYR from 1961 to 2020. The intersection of the forward (UF) and backward (UB) curves in 2017 indicates a change in annual runoff. However, dividing the runoff time series into two periods based on the 2017 breakpoint may lack practical significance, as one of the periods would span only four years. To verify this hypothesis, the study also applied the sliding t-test with window sizes of L 1 = L 2 = 10 and a significance level of α = 0.01 ( t α = 2.878 ) to examine the annual runoff series, as shown in Figure 7. The test for 2004 indicates a significant change in the t-value, exceeding the critical threshold ( | t _ v a l u e | > t α ). This suggests that the detection of breakpoints in the annual runoff series by the TFPW-MK approach might be affected by runoff from special years. Thus, we performed a breakpoint analysis on the runoff series using 5-year moving average runoff values, following the methodology outlined in [16], which supports the use of multi-year averaging to reduce short-term fluctuations and enhance the robustness of change-point detection. As shown in Figure 8, both the TFPW-MK test and the moving t-test indicate a significant breakpoint between 2004 and 2005. Based on these results, 2004 was selected as the breakpoint for runoff changes in the SRYR.
Based on the identified breakpoint (2004), the annual runoff data were divided into two subsequences: a baseline period (1961–2004) and a change period (2005–2020). Table 2 summarizes the changes in the precipitation (P), potential evapotranspiration ( E 0 ), runoff (R), runoff coefficient (R/P), and parameters n and w from different Budyko functions for the two periods. Annual average precipitation increased by 13%, while annual average runoff increased by 33.26%. Parameters n and w decreased by 0.08 and 0.09, respectively. The R/P in the SRYR exceeded 0.2, with an average annual runoff of approximately 100 mm or higher, reflecting typical characteristics of alpine regions. The elasticity coefficient method was used to analyze the contributions of climate and watershed characteristic changes to runoff variation. Using Yang’s function (Equation (7)) and Fu’s function (Equation (8)), the contributions of climatic variables and watershed characteristics to runoff changes in the SRYR were quantified (Table 3). Both equations indicated that watershed characteristics contributed 20% to runoff changes, suggesting that the parameters in the two equations respond similarly to watershed characteristic changes in the SRYR. Runoff results simulated using different Budyko functions are shown in Figure 9. The two functions demonstrated similar accuracy in runoff simulation for the SRYR (NSE = 0.65 and R = 0.82), indicating that both the Yang and Fu functions are well-suited for the SRYR. For further analysis of characteristic parameters and watershed change patterns, Yang’s function was selected in this study.

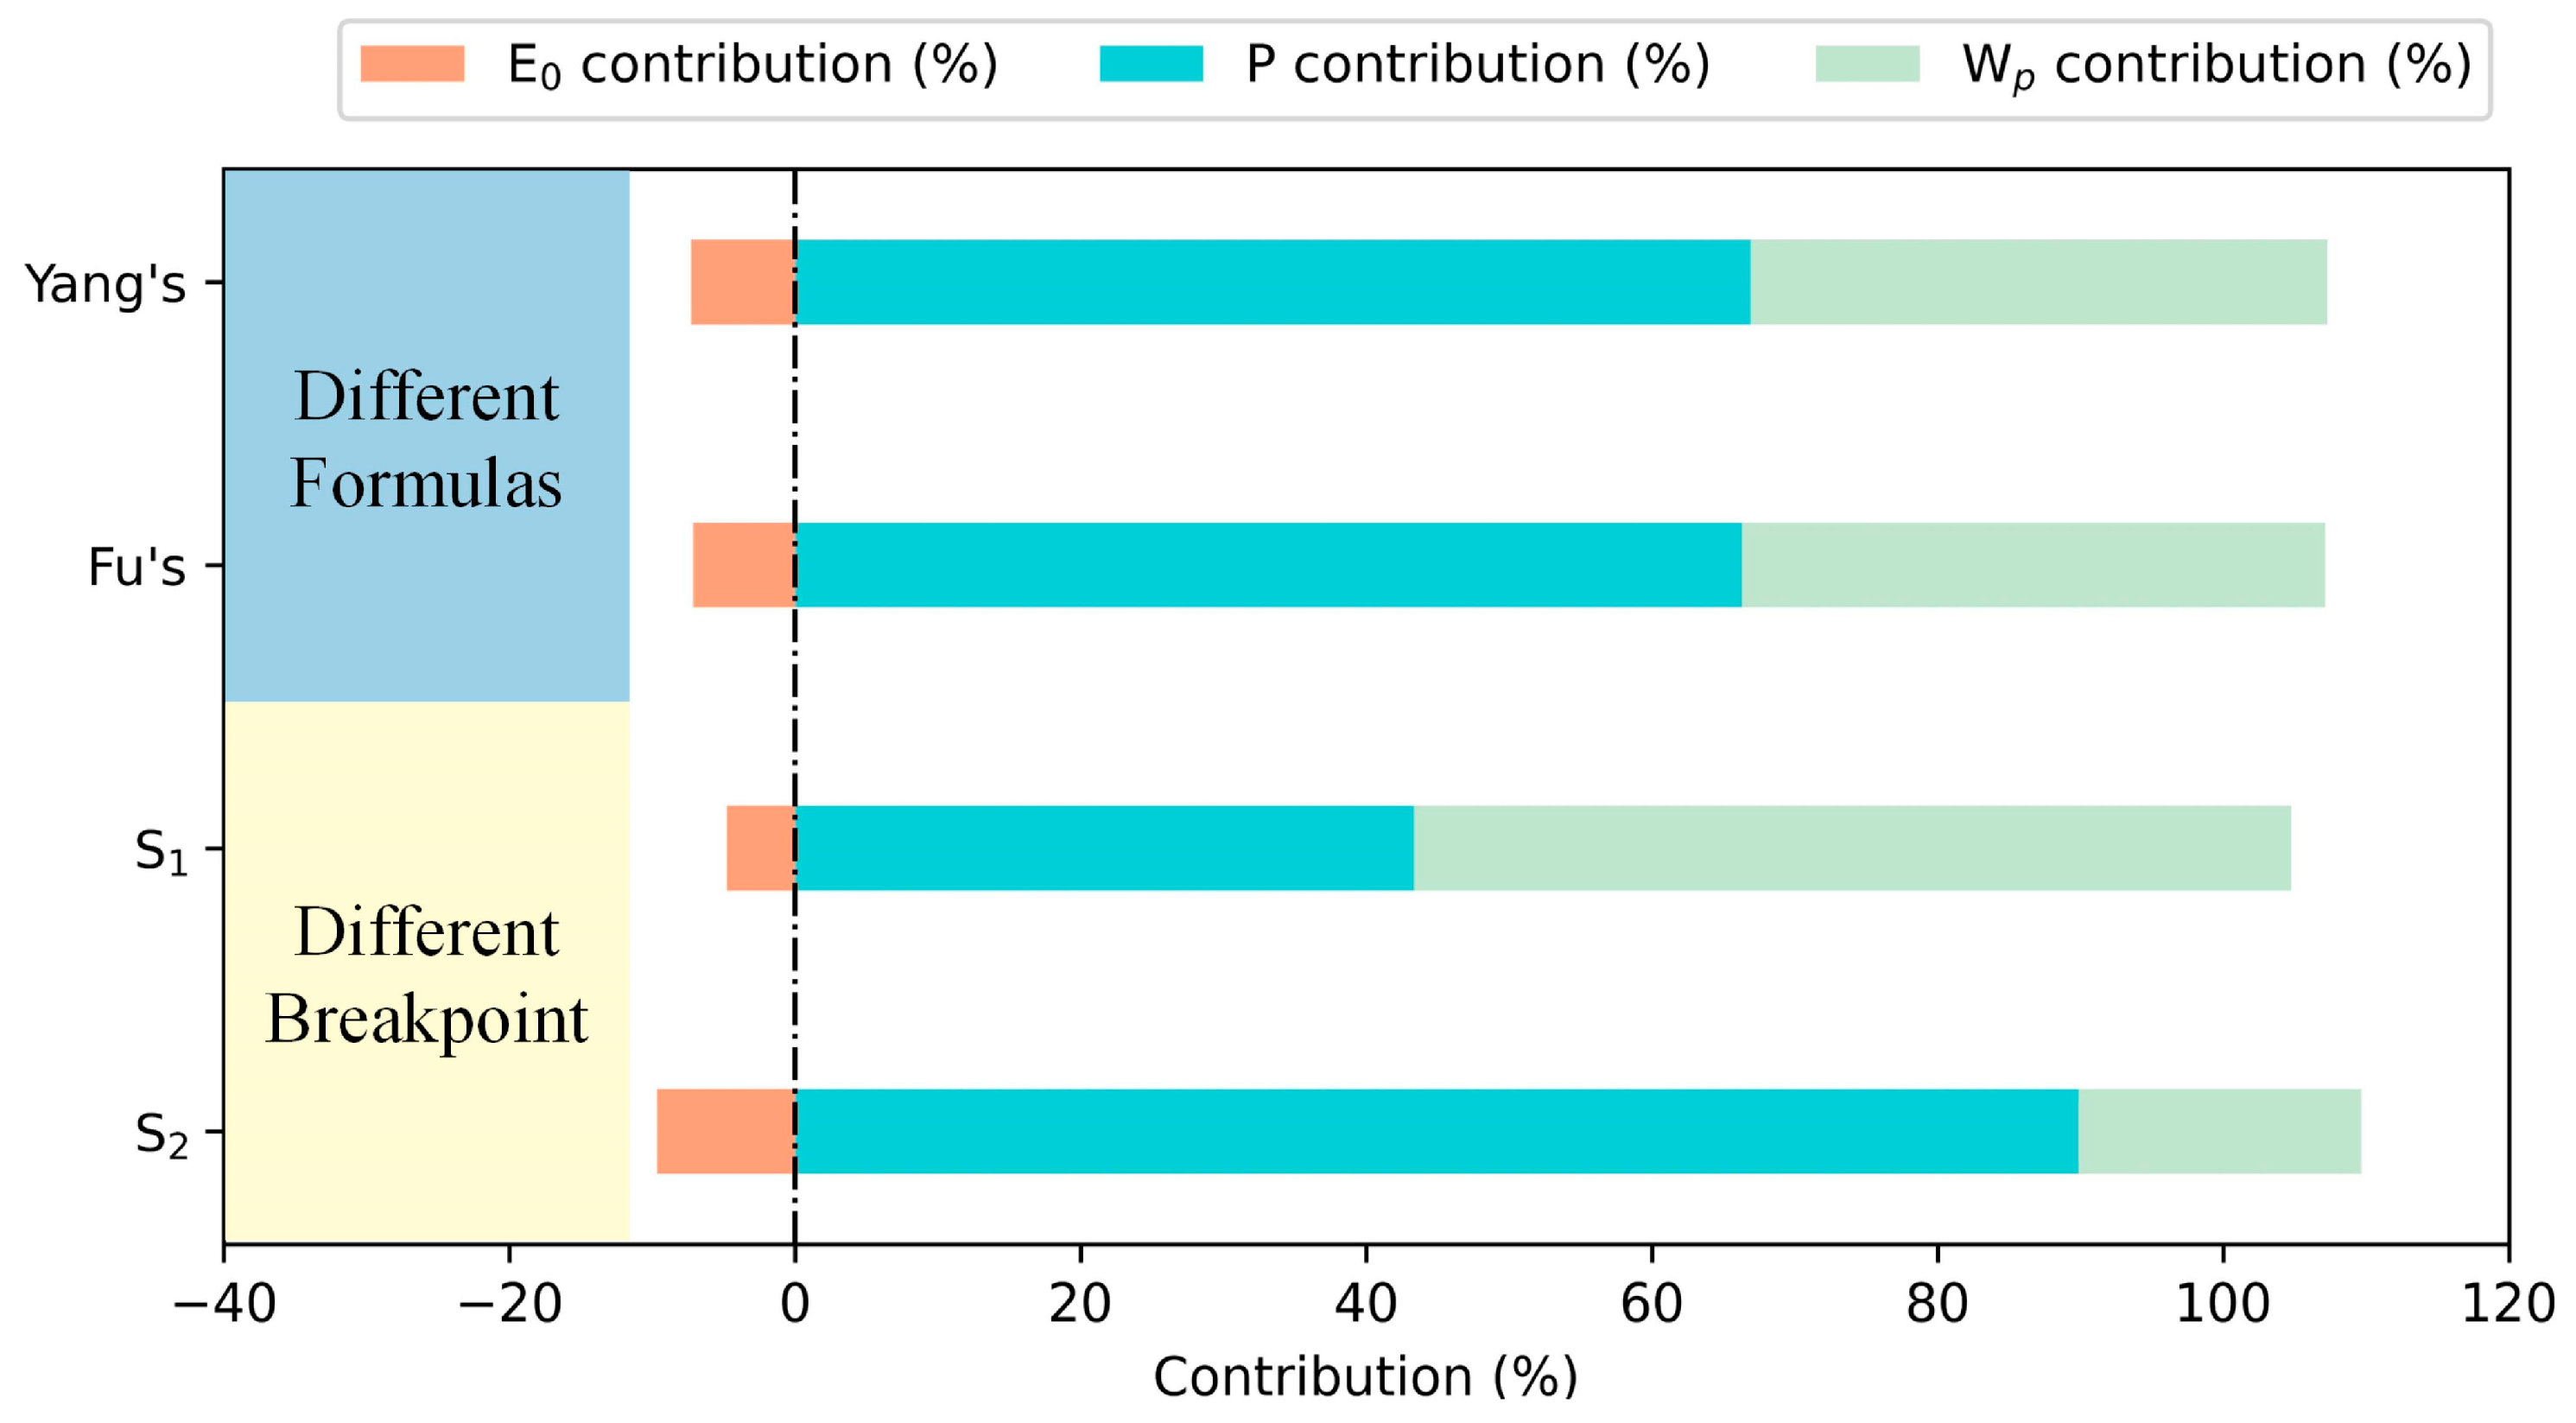
3.3. The Runoff Difference Resulting from Climate and Catchment Changes for Each Sub-Period

This section primarily analyzes the variations in watershed characteristics and basin parameters and their impact on runoff. Due to limitations of permafrost data, the study period was divided into 12 sub-periods, each spanning 5 years (Table 4). According to previous research [16,35], groundwater storage within the basin does not undergo significant changes over these intervals, justifying the analysis of surface conditions and watershed parameter dynamics over time. ΔR is typically defined as the difference in runoff between the final and initial states; in this study, it refers to the difference between consecutive sub-periods. For instance, ΔR6 = R6 − R5. The results indicate that the estimated ΔR closely matches the observed ΔR (Table 5), suggesting that climate and watershed changes may have contributed oppositely to runoff variations in this study. For example, during ΔR12, △Rclimate contributed negatively to runoff change (−1.66 mm), whereas △RWp (where Wp denotes parameter n in Yang’s function) contributed positively (19.56 mm). In this study, both △Rclimate and △RWp were derived from the sensitivity of runoff elasticity to climate (i.e., runoff elasticity with respect to precipitation and potential evapotranspiration). It should be noted that runoff elasticity is influenced by both climate factors and watershed characteristics.

3.4. Relationship Between RWp and Permafrost Characteristic Changes

P and E0 represent the effective water availability and effective energy in the basin, respectively, and are the two key variables in the water–energy balance. While climate change is the main driver of runoff variations, watershed characteristics also influence runoff generation. As previously discussed, this study assumes that characteristic changes in the SRYR basin are primarily reflected by variations in the NDVI and permafrost features (permafrost area and ALT). In theory, it is possible to derive the variational function of these features and their impact on △RWp. However, due to the limited amount of data and the ambiguous contributions of each characteristic to △RWp, deriving precise functional relationships remains challenging. As an initial approach, we used a sensitivity function (Equation (17)) to assess the sensitivity of △RWp to permafrost changes in different periods (Table 6). The results indicate that variations in the permafrost area have a greater impact on △RWp than changes in active layer thickness in the SRYR and that changes in the permafrost area exhibit an opposite trend to △RWp. To further verify the reasonableness of the sensitivity analysis results, we employed Pearson correlation coefficients to examine the relationship between △RWp and changes in the characteristics of the SRYR basin (Figure 10). The results show that the correlation between △RWp and the permafrost area is stronger than that between △RWp and the NDVI, suggesting that the melting of permafrost (decreasing permafrost area and increasing ALT) has recently played a dominant role in runoff changes in the SRYR.

4. Discussion

Runoff change attribution analysis is crucial for understanding water flow trends in a watershed and provides valuable insights for downstream water resource management [70,71]. Previous studies have primarily focused on the impacts of precipitation and temperature variations on runoff changes in the Yangtze River Basin, with findings indicating that the region is expected to experience future warming and wetting [72,73,74]. Research has shown that permafrost thawing had a positive effect on runoff increases in the SRYR during both 1961–2004 and 2005–2020. Unlike previous studies that divided the study period into baseline and change phases based on a detected breakpoint, we divided the study period into 12 sub-periods, each representing a 5-year average, to investigate the correlations between integrated basin parameters, permafrost characteristics, and the NDVI. The results indicate that permafrost changes are the primary driver of the contribution of SRYR basin characteristics to runoff. The effect of permafrost thawing accounts for 20% of the runoff increase in the study area. Permafrost thawing is primarily characterized by a reduction in permafrost area and an increase in active layer thickness. The SRYR basin has experienced widespread thaw settlement and melting of ground ice, but there was no significant trend in 5-year seasonal deformation, indicating that active-layer water storage has not significantly changed, with most meltwater being released as surface runoff [35]. We used permafrost sensitivity coefficients to reflect this trend, showing that the sensitivity of runoff to changes in the permafrost area is greater than that to changes in active layer thickness, suggesting that the permafrost area better represents regional characteristics. However, due to data limitations, further evaluation is needed to validate this conclusion.
Furthermore, our findings indicate that runoff breakpoints are the primary source of uncertainty in runoff attribution, compared to the application of different Budyko functions [31]. Different breakpoint detection methods were applied to identify runoff breakpoints in the SRYR basin. Sequence 1 (S1) represents a runoff breakpoint in 2017 (baseline period: 1961–2017; change period: 2018–2020), while Sequence 2 (S2) represents a breakpoint in 2004 (baseline period: 1961–2004; change period: 2005–2020). The results show that, as illustrated in Figure 11, climate change contributed 42% to runoff in S1, which is lower than the 90% contribution in S2. This suggests that selecting 2017 as the runoff breakpoint may not be representative and could underestimate the influence of climate change on runoff. Earlier research identified differences between various Budyko functions [75]. In this study, we found that simply comparing the runoff simulated by different functions with observed runoff does not clearly differentiate the applicability of each formula to the study area. To determine the applicability of different Budyko functions, extensive hydrometeorological data under both wet and dry conditions may be required.
As shown in Figure 12, we also observed that the basin sensitivity coefficients are not constant but vary with climatic conditions. The results revealed that ∂R/∂P decreases significantly with decreasing E0/P (R = −0.79, p < 0.05), while ∂R/∂E0 increases significantly with increasing E0/P (R = 0.96, p < 0.05). Unlike previous studies, within the Tibetan Plateau, changes in watershed characteristics in the source region of the Yellow River [34] and the SRYR show opposite trends in their contributions to runoff. This difference may reflect spatial heterogeneity in the response of runoff to permafrost degradation [4,76,77], further demonstrating the significant contribution of permafrost changes to runoff. In the SRYR basin, the contribution of permafrost characteristics to runoff may be greater than that from vegetation changes.
This study provides valuable insights into the relationship between permafrost degradation and runoff changes in the SRYR, highlighting the primary role of watershed characteristics in shaping hydrological responses. By leveraging statistical analyses based on observations from hydrological stations, this study captures overall basin-scale runoff changes. However, limitations in the spatial resolution of permafrost data and the relatively short 5-year analysis period constrain our ability to fully establish causal links between temperature, permafrost characteristics, and runoff variations. Additionally, while the study effectively identifies general trends, sub-basin hydrological processes remain unresolved, and the absence of a non-stationary hydrological framework limits the assessment of long-term climate–runoff interactions. Future research should integrate high-resolution permafrost datasets, extend the temporal scope of runoff attribution analyses, and incorporate dynamic hydrological modeling to further enhance our understanding of climate-driven hydrological changes.

5. Conclusions

Based on hydrological and meteorological observation data, as well as datasets on land use and permafrost characteristic changes, we applied the Budyko functions of Yang and Fu to attribute runoff changes in the SRYR over a 60-year period (1961–2020). Two different breakpoint detection methods were used to assess the contributions of climate change and basin characteristics to runoff changes in this region. Additionally, we proposed a novel method for calculating permafrost sensitivity, which can identify the correlation between permafrost changes and runoff variations within the basin. The findings of this study can be summarized in the following two key aspects:
The TFPW-MK results indicate that the SRYR basin experienced gradual warming and wetting from 1961 to 2020. Key factors contributing to this trend include an increase in minimum temperature and the degradation of permafrost on the Tibetan Plateau. Breakpoints represent a major source of uncertainty in runoff change analysis. The moving t-test method proved to be more effective in capturing runoff changes in the SRYR basin.
By calculating the permafrost sensitivity coefficient, we found that the sensitivity of runoff changes to the permafrost area (−0.02) is greater than that to active layer thickness (0.01). Additionally, the correlation between the long-term NDVI and basin characteristic parameters (−0.59) is lower than that between the permafrost area and basin characteristics (−0.65), indicating that permafrost degradation serves as the primary contributor to runoff change due to watershed characteristics in the SRYR.

Author Contributions

Conceptualization, J.C., X.S. and Y.J.; methodology, J.C.; software, J.C.; validation, J.Q.; formal analysis, Y.Z. (Yun Zhang), J.Q. and Y.Z. (Yang Zheng); investigation, J.Q. and H.D.; resources, J.C.; data curation, Y.Z. (Yun Zhang) and J.Q.; writing—original draft preparation, J.C.; writing—review and editing, X.S. and Y.J.; visualization, Y.Z. (Yang Zheng); supervision, Y.J.; project administration, X.S.; funding acquisition, X.S. All authors have read and agreed to the published version of the manuscript.

Funding

This research was funded by the National Natural Science Foundation of China (U2243233). This research was also funded by the CYPC Project “Research on the Impact Assessment and Decision Mechanism of the Drought Limited Water Level Operation in the Three Gorges Reservoir” (Z242302036), and the Major Science and Technology Project of the Ministry of Water Re-sources of China (SKS-2022118). The authors would also like to thank the anonymous reviewers for their valuable comments and suggestions on the manuscript, which truly improved the quality of the manuscript.

Data Availability Statement

The data presented in this study are available from the corresponding author upon request.

Acknowledgments

The authors would like to thank the anonymous reviewers for their valuable comments and suggestions on the manuscript, which truly improved the quality of the manuscript.

Conflicts of Interest

The authors declare that they have no known competing financial interests or personal relationships that could have appeared to influence the work reported in this paper.

Appendix A

Figure A1. SRYR land use data for 1980, 1990, 1995, 2000, 2005, 2010, 2015, and 2020. Cr: cropland; Fo: forest; Gr: grassland; Wa: water; Bu: built-up; Ba: barren land. Bars represent the total area (%) of the watershed for each type.
Sustainability 17 01570 g0a1

References

  1. Duan, A.; Xiao, Z. Does the climate warming hiatus exist over the Tibetan Plateau? Sci. Rep. 2015, 5, 13711. [Google Scholar] [CrossRef] [PubMed]
  2. Yao, T.; Liu, X.; Wang, N.; Shi, Y. Amplitude of climatic changes in Qinghai-Tibetan Plateau. Chin. Sci. Bull. 2000, 45, 1236–1243. [Google Scholar] [CrossRef]
  3. Hu, J.; Wu, Y.; Sun, P.; Zhao, F.; Sun, K.; Li, T.; Sivakumar, B.; Qiu, L.; Sun, Y.; Jin, Z. Predicting long-term hydrological change caused by climate shifting in the 21st century in the headwater area of the Yellow River Basin. Stoch. Environ. Res. Risk Assess. 2022, 36, 1651–1668. [Google Scholar] [CrossRef]
  4. Yang, J.; Wang, T.; Yang, D.; Yang, Y. Insights into runoff changes in the source region of Yellow River under frozen ground degradation. J. Hydrol. 2023, 617, 128892. [Google Scholar] [CrossRef]
  5. Jin, H.; Huang, Y.; Bense, V.F.; Ma, Q.; Marchenko, S.S.; Shepelev, V.V.; Hu, Y.; Liang, S.; Spektor, V.V.; Jin, X.; et al. Permafrost Degradation and Its Hydrogeological Impacts. Water 2022, 14, 372. [Google Scholar] [CrossRef]
  6. Jin, H.; Ma, Q. Impacts of Permafrost Degradation on Carbon Stocks and Emissions under a Warming Climate: A Review. Atmosphere 2021, 12, 1425. [Google Scholar] [CrossRef]
  7. Schuur, E.A.G.; McGuire, A.D.; Schädel, C.; Grosse, G.; Harden, J.W.; Hayes, D.J.; Hugelius, G.; Koven, C.D.; Kuhry, P.; Lawrence, D.M.; et al. Climate change and the permafrost carbon feedback. Nature 2015, 520, 171–179. [Google Scholar] [CrossRef]
  8. Guo, D.; Wang, H. Simulation of permafrost and seasonally frozen ground conditions on the Tibetan Plateau, 1981–2010. J. Geophys. Res. Atmos. 2013, 118, 5216–5230. [Google Scholar] [CrossRef]
  9. Luo, D.; Wu, Q.; Jin, H.; Marchenko, S.S.; Lü, L.; Gao, S. Recent changes in the active layer thickness across the northern hemisphere. Environ. Earth Sci. 2016, 75, 555. [Google Scholar] [CrossRef]
  10. Zdanowicz, C.; Karlsson, P.; Beckholmen, I.; Roach, P.; Poulain, A.; Yumvihoze, E.; Martma, T.; Ryjkov, A.; Dastoor, A. Snowmelt, glacial and atmospheric sources of mercury to a subarctic mountain lake catchment, Yukon, Canada. Geochim. Cosmochim. Acta 2018, 238, 374–393. [Google Scholar] [CrossRef]
  11. Zipper, S.C.; Lamontagne-Hallé, P.; McKenzie, J.M.; Rocha, A.V. Groundwater Controls on Postfire Permafrost Thaw: Water and Energy Balance Effects. J. Geophys. Res. Earth Surf. 2018, 123, 2677–2694. [Google Scholar] [CrossRef]
  12. Bao, Z.; Zhang, J.; Wang, G.; Fu, G.; He, R.; Yan, X.; Jin, J.; Liu, Y.; Zhang, A. Attribution for decreasing streamflow of the Haihe River basin, northern China: Climate variability or human activities? J. Hydrol. 2012, 460–461, 117–129. [Google Scholar] [CrossRef]
  13. Ning, T.; Li, Z.; Liu, W. Separating the impacts of climate change and land surface alteration on runoff reduction in the Jing River catchment of China. Catena 2016, 147, 80–86. [Google Scholar] [CrossRef]
  14. Sinha, J.; Das, J.; Jha, S.; Goyal, M.K. Analysing model disparity in diagnosing the climatic and human stresses on runoff variability over India. J. Hydrol. 2020, 581, 124407. [Google Scholar] [CrossRef]
  15. Zhou, L.; Yang, Y.; Zhang, D.; Yao, H. Recent advances in hydrology studies under changing permafrost on the Qinghai-Xizang Plateau. Res. Cold Arid Reg. 2024, 16, 159–169. [Google Scholar] [CrossRef]
  16. Sun, X.; Dong, Q.; Zhang, X. Attribution analysis of runoff change based on Budyko-type model with time-varying parameters for the Lhasa River Basin, Qinghai–Tibet Plateau. J. Hydrol. Reg. Stud. 2023, 48, 101469. [Google Scholar] [CrossRef]
  17. Wang, W.; Shao, Q.; Yang, T.; Peng, S.; Xing, W.; Sun, F.; Luo, Y. Quantitative assessment of the impact of climate variability and human activities on runoff changes: A case study in four catchments of the Haihe River basin, China. Hydrol. Process. 2013, 27, 1158–1174. [Google Scholar] [CrossRef]
  18. Li, H.; Shi, C.; Zhang, Y.; Ning, T.; Sun, P.; Liu, X.; Ma, X.; Liu, W.; Collins, A.L. Using the Budyko hypothesis for detecting and attributing changes in runoff to climate and vegetation change in the soft sandstone area of the middle Yellow River basin, China. Sci. Total Environ. 2020, 703, 135588. [Google Scholar] [CrossRef]
  19. Xue, D.; Zhou, J.; Zhao, X.; Liu, C.; Wei, W.; Yang, X.; Li, Q.; Zhao, Y. Impacts of climate change and human activities on runoff change in a typical arid watershed, NW China. Ecol. Indic. 2021, 121, 107013. [Google Scholar] [CrossRef]
  20. Xing, W.; Wang, W.; Shao, Q.; Yong, B. Identification of dominant interactions between climatic seasonality, catchment characteristics and agricultural activities on Budyko-type equation parameter estimation. J. Hydrol. 2018, 556, 585–599. [Google Scholar] [CrossRef]
  21. Tan, X.; Jia, Y.; Yang, D.; Niu, C.; Hao, C. Impact ways and their contributions to vegetation-induced runoff changes in the Loess Plateau. J. Hydrol. Reg. Stud. 2024, 51, 101630. [Google Scholar] [CrossRef]
  22. Xu, X.; Liu, W.; Scanlon, B.R.; Zhang, L.; Pan, M. Local and global factors controlling water-energy balances within the Budyko framework. Geophys. Res. Lett. 2013, 40, 6123–6129. [Google Scholar] [CrossRef]
  23. Fu, B.P. On the calculation of the evaporation from land surface. Sci. Atmos. Sin. 1981, 5, 23. [Google Scholar]
  24. Yang, H.; Yang, D.; Lei, Z.; Sun, F. New analytical derivation of the mean annual water-energy balance equation. Water Resour. Res. 2008, 44, W03410. [Google Scholar] [CrossRef]
  25. Yang, Y.; Roderick, M.L.; Zhang, S.; McVicar, T.R.; Donohue, R.J. Hydrologic implications of vegetation response to elevated CO2 in climate projections. Nat. Clim. Change 2019, 9, 44–48. [Google Scholar] [CrossRef]
  26. Zhou, G.; Wei, X.; Chen, X.; Zhou, P.; Liu, X.; Xiao, Y.; Sun, G.; Scott, D.F.; Zhou, S.; Han, L.; et al. Global pattern for the effect of climate and land cover on water yield. Nat. Commun. 2015, 6, 5918. [Google Scholar] [CrossRef]
  27. Zhou, S.; Yu, B.; Huang, Y.; Wang, G. The complementary relationship and generation of the Budyko functions. Geophys. Res. Lett. 2015, 42, 1781–1790. [Google Scholar] [CrossRef]
  28. Liang, W.; Bai, D.; Wang, F.; Fu, B.; Yan, J.; Wang, S.; Yang, Y.; Long, D.; Feng, M. Quantifying the impacts of climate change and ecological restoration on streamflow changes based on a Budyko hydrological model in China’s Loess Plateau. Water Resour. Res. 2015, 51, 6500–6519. [Google Scholar] [CrossRef]
  29. Wang, D.; Hejazi, M. Quantifying the relative contribution of the climate and direct human impacts on mean annual streamflow in the contiguous United States. Water Resour. Res. 2011, 47, W00J12. [Google Scholar] [CrossRef]
  30. Zhang, S.; Yang, H.; Yang, D.; Jayawardena, A.W. Quantifying the effect of vegetation change on the regional water balance within the Budyko framework. Geophys. Res. Lett. 2016, 43, 1140–1148. [Google Scholar] [CrossRef]
  31. Mo, C.; Huang, K.; Ruan, Y.; Lai, S.; Lei, X. Quantifying uncertainty sources in runoff change attribution based on the Budyko framework. J. Hydrol. 2024, 630, 130790. [Google Scholar] [CrossRef]
  32. Sankarasubramanian, A.; Vogel, R.M.; Limbrunner, J.F. Climate elasticity of streamflow in the United States. Water Resour. Res. 2001, 37, 1771–1781. [Google Scholar] [CrossRef]
  33. Wang, W.; Zou, S.; Shao, Q.; Xing, W.; Chen, X.; Jiao, X.; Luo, Y.; Yong, B.; Yu, Z. The analytical derivation of multiple elasticities of runoff to climate change and catchment characteristics alteration. J. Hydrol. 2016, 541, 1042–1056. [Google Scholar] [CrossRef]
  34. Zheng, Y.; Huang, Y.; Zhou, S.; Wang, K.; Wang, G. Effect partition of climate and catchment changes on runoff variation at the headwater region of the Yellow River based on the Budyko complementary relationship. Sci. Total Environ. 2018, 643, 1166–1177. [Google Scholar] [CrossRef]
  35. Wang, L.; Zhao, L.; Zhou, H.; Liu, S.; Liu, G.; Zou, D.; Du, E.; Hu, G.; Wang, C. Quantification of Water Released by Thawing Permafrost in the Source Region of the Yangtze River on the Tibetan Plateau by InSAR Monitoring. Water Resour. Res. 2023, 59, e2023WR034451. [Google Scholar] [CrossRef]
  36. Li, Z.; Liu, M.; Li, Z.; Feng, Q.; Song, L.; Xu, B.; Liu, X.; Gui, J. Where does the runoff come from in dry season in the source region of the Yangtze River? Agric. For. Meteorol. 2023, 330, 109314. [Google Scholar] [CrossRef]
  37. Mao, T.; Wang, G.; Zhang, T. Impacts of Climatic Change on Hydrological Regime in the Three-River Headwaters Region, China, 1960–2009. Water Resour Manag. 2016, 30, 115–131. [Google Scholar] [CrossRef]
  38. Ding, Y.; Peng, S. Spatiotemporal Trends and Attribution of Drought across China from 1901–2100. Sustainability 2020, 12, 477. [Google Scholar] [CrossRef]
  39. Peng, S.; Ding, Y.; Liu, W.; Li, Z. 1 km monthly temperature and precipitation dataset for China from 1901 to 2017. Earth Syst. Sci. Data 2019, 11, 1931–1946. [Google Scholar] [CrossRef]
  40. Peng, S.; Gang, C.; Cao, Y.; Chen, Y. Assessment of climate change trends over the Loess Plateau in China from 1901 to 2100. Int. J. Climatol. 2018, 38, 2250–2264. [Google Scholar] [CrossRef]
  41. Peng, S.; Ding, Y.; Wen, Z.; Chen, Y.; Cao, Y.; Ren, J. Spatiotemporal change and trend analysis of potential evapotranspiration over the Loess Plateau of China during 2011–2100. Agric. For. Meteorol. 2017, 233, 183–194. [Google Scholar] [CrossRef]
  42. Li, M.; Cao, S.; Zhu, Z.; Wang, Z.; Myneni, R.B.; Piao, S. Spatiotemporally consistent global dataset of the GIMMS Normalized Difference Vegetation Index (PKU GIMMS NDVI) from 1982 to 2022. Earth Syst. Sci. Data 2023, 15, 4181–4203. [Google Scholar] [CrossRef]
  43. Xu, X.; Liu, J.; Zhang, S.; Li, R.; Yan, C.; Wu, S. Remote Sensing Monitoring Data Set for Land Use and Cover in China. Data Registration and Publishing System of the Resource and Environmental Science Data Center of the Chinese Academy of Sciences. 2018. Available online: https://www.resdc.cn/DOI/DOI.aspx?DOIid=54 (accessed on 24 August 2024).
  44. Xu, N.; Lu, H.; Li, W.; Gong, P. Natural lakes dominate global water storage variability. Sci. Bull. 2024, 69, 1016–1019. [Google Scholar] [CrossRef] [PubMed]
  45. Yan, D.; Zhao, Z.X.; Liang, S.; Kuang, X.; Feng, Y.; Hu, Z.; Feng, M. Frozen Ground Change Data Set in the Tibetan Plateau (1961–2020); National Tibetan Plateau Data Center: Tibet, China, 2024. [Google Scholar] [CrossRef]
  46. Peng, S. 1-km Monthly Potential Evapotranspiration Dataset for China (1901–2023); National Tibetan Plateau Data Center: Tibet, China, 2024. [Google Scholar] [CrossRef]
  47. Kendall, M.G. Rank Correlation Methods; Rank Correlation Methods; Griffin: Oxford, UK, 1948. [Google Scholar]
  48. Mann, H.B. Nonparametric Tests Against Trend. Econometrica 1945, 13, 245–259. [Google Scholar] [CrossRef]
  49. Yong, B.; Ren, L.; Hong, Y.; Gourley, J.J.; Chen, X.; Dong, J.; Wang, W.; Shen, Y.; Hardy, J. Spatial–Temporal Changes of Water Resources in a Typical Semiarid Basin of North China over the Past 50 Years and Assessment of Possible Natural and Socioeconomic Causes. J. Hydrometeorol. 2013, 14, 1009–1034. [Google Scholar] [CrossRef]
  50. Fu, G.; Chen, S.; Liu, C.; Shepard, D. Hydro-Climatic Trends of the Yellow River Basin for the Last 50 Years. Clim. Change 2004, 65, 149–178. [Google Scholar] [CrossRef]
  51. Zhai, L.; Feng, Q. Spatial and temporal pattern of precipitation and drought in Gansu Province, Northwest China. Nat. Hazards 2009, 49, 1–24. [Google Scholar] [CrossRef]
  52. Yue, S.; Pilon, P.; Phinney, B.; Cavadias, G. The influence of autocorrelation on the ability to detect trend in hydrological series. Hydrol. Process. 2002, 16, 1807–1829. [Google Scholar] [CrossRef]
  53. Sonali, P.; Nagesh Kumar, D. Review of trend detection methods and their application to detect temperature changes in India. J. Hydrol. 2013, 476, 212–227. [Google Scholar] [CrossRef]
  54. Zheng, H.; Zhang, L.; Liu, C.; Shao, Q.; Fukushima, Y. Changes in stream flow regime in headwater catchments of the Yellow River basin since the 1950s. Hydrol. Process. Int. J. 2007, 21, 886–893. [Google Scholar] [CrossRef]
  55. Budyko, M.I.; Miller, D.H. Climate and Life; Academic Press: New York, NY, USA, 1974. [Google Scholar]
  56. Choudhury, B.J. Evaluation of an empirical equation for annual evaporation using field observations and results from a biophysical model. J. Hydrol. 1999, 216, 99–110. [Google Scholar] [CrossRef]
  57. Zhang, L.; Dawes, W.R.; Walker, G.R. Response of mean annual evapotranspiration to vegetation changes at catchment scale. Water Resour. Res. 2001, 37, 701–708. [Google Scholar] [CrossRef]
  58. Donohue, R.J.; Roderick, M.L.; McVicar, T.R. Roots, storms and soil pores: Incorporating key ecohydrological processes into Budyko’s hydrological model. J. Hydrol. 2012, 436–437, 35–50. [Google Scholar] [CrossRef]
  59. Wang, W.; Fu, J. Global assessment of predictability of water availability: A bivariate probabilistic Budyko analysis. J. Hydrol. 2018, 557, 643–650. [Google Scholar] [CrossRef]
  60. Xing, W.; Wang, W.; Zou, S.; Deng, C. Projection of future runoff change using climate elasticity method derived from Budyko framework in major basins across China. Glob. Planet. Change 2018, 162, 120–135. [Google Scholar] [CrossRef]
  61. Schaake, J.C. From Climate to Flow; John Wiley and Sons Inc.: New York, NY, USA, 1990. [Google Scholar]
  62. Yang, H.; Yang, D. Derivation of climate elasticity of runoff to assess the effects of climate change on annual runoff. Water Resour. Res. 2011, 47. [Google Scholar] [CrossRef]
  63. Xu, X.; Yang, D.; Yang, H.; Lei, H. Attribution analysis based on the Budyko hypothesis for detecting the dominant cause of runoff decline in Haihe basin. J. Hydrol. 2014, 510, 530–540. [Google Scholar] [CrossRef]
  64. Wang, S.; Zhang, Z.; McVicar, T.R.; Guo, J.; Tang, Y.; Yao, A. Isolating the impacts of climate change and land use change on decadal streamflow variation: Assessing three complementary approaches. J. Hydrol. 2013, 507, 63–74. [Google Scholar] [CrossRef]
  65. Zheng, H.; Zhang, L.; Zhu, R.; Liu, C.; Sato, Y.; Fukushima, Y. Responses of streamflow to climate and land surface change in the headwaters of the Yellow River Basin. Water Resour. Res. 2009, 45. [Google Scholar] [CrossRef]
  66. Zou, F.; Li, H.; Hu, Q. Responses of vegetation greening and land surface temperature variations to global warming on the Qinghai-Tibetan Plateau, 2001–2016. Ecol. Indic. 2020, 119, 106867. [Google Scholar] [CrossRef]
  67. Fu, J.; Liu, B.; Wang, W.; Fei, E.X. Evaluating main drivers of runoff changes across China from 1956 to 2000 by using different budyko-based elasticity methods. J. Environ. Manag. 2023, 329, 117070. [Google Scholar] [CrossRef] [PubMed]
  68. Cheng, G.; Wu, T. Responses of permafrost to climate change and their environmental significance, Qinghai-Tibet Plateau. J. Geophys. Res. Earth Surf. 2007, 112, F02S03. [Google Scholar] [CrossRef]
  69. Yang, M.; Nelson, F.E.; Shiklomanov, N.I.; Guo, D.; Wan, G. Permafrost degradation and its environmental effects on the Tibetan Plateau: A review of recent research. Earth-Sci. Rev. 2010, 103, 31–44. [Google Scholar] [CrossRef]
  70. Berghuijs, W.R.; Larsen, J.R.; van Emmerik, T.H.M.; Woods, R.A. A Global Assessment of Runoff Sensitivity to Changes in Precipitation, Potential Evaporation, and Other Factors. Water Resour. Res. 2017, 53, 8475–8486. [Google Scholar] [CrossRef]
  71. Yaseen, Z.M.; Sulaiman, S.O.; Deo, R.C.; Chau, K.-W. An enhanced extreme learning machine model for river flow forecasting: State-of-the-art, practical applications in water resource engineering area and future research direction. J. Hydrol. 2019, 569, 387–408. [Google Scholar] [CrossRef]
  72. Li, Y.; Yan, D.; Peng, H.; Xiao, S. Evaluation of precipitation in CMIP6 over the Yangtze River Basin. Atmos. Res. 2021, 253, 105406. [Google Scholar] [CrossRef]
  73. Wu, H.; Lei, H.; Lu, W.; Liu, Z. Future changes in precipitation over the upper Yangtze River basin based on bias correction spatial downscaling of models from CMIP6. Environ. Res. Commun. 2022, 4, 045002. [Google Scholar] [CrossRef]
  74. Wan, H. Projection of Future Climate Change and Its Influence on Surface Runoff of the Upper Yangtze River Basin, China. Atmosphere 2023, 14, 1576. [Google Scholar] [CrossRef]
  75. He, S.; Chen, K.; Liu, Z.; Deng, L. Exploring the impacts of climate change and human activities on future runoff variations at the seasonal scale. J. Hydrol. 2023, 619, 129382. [Google Scholar] [CrossRef]
  76. Wang, T.; Yang, H.; Yang, D.; Qin, Y.; Wang, Y. Quantifying the streamflow response to frozen ground degradation in the source region of the Yellow River within the Budyko framework. J. Hydrol. 2018, 558, 301–313. [Google Scholar] [CrossRef]
  77. Woo, M.-K.; Kane, D.L.; Carey, S.K.; Yang, D. Progress in permafrost hydrology in the new millennium. Permafr. Periglac. Process. 2008, 19, 237–254. [Google Scholar] [CrossRef]
Figure 1. Relative location of the SRYR and distribution of ZMD hydrological stations.
Sustainability 17 01570 g001
Figure 2. Methodological framework of the study.
Sustainability 17 01570 g002
Figure 3. Long-term trends in watershed hydroclimatic variables. (a) Annual maximum temperature; (b) annual minimum temperature; (c) average annual precipitation; (d) average annual potential evapotranspiration.
Sustainability 17 01570 g003
Figure 4. Trends in NDVI change. The black solid line with inverted triangle markers represents the annual maximum NDVI values, while the green solid line with square markers represents the 5-year moving average.
Sustainability 17 01570 g004
Figure 5. Trends in the multi-year averages for the SRYR. The blue bar chart represents the 5-year average ALT (m) (e.g., 1965 corresponds to the multi-year average for 1961–1965), while the gray solid line represents the 5-year average permafrost area (104 km2).
Sustainability 17 01570 g005
Figure 6. Results of the TFPW-MK test with forward (UF) and backward (UB) curves at the ZMD hydrological station. The horizontal dashed lines represent the 95% significance level (|UF| = 1.96).
Sustainability 17 01570 g006
Figure 7. Sliding t-test t-values for the annual runoff series. The red dashed line represents the critical t-value at a significance level of α = 0.01.
Sustainability 17 01570 g007
Figure 8. Results of the (a) TFPW-MK and (b) Sliding t-test for annual runoff series at the ZMD hydrological station.
Sustainability 17 01570 g008
Figure 9. Simulated runoff based on different Budyko functions. The blue solid line represents the observed runoff at the ZMD hydrological station (mm). The green dashed line with diamond markers represents the runoff simulated using Fu’s Budyko function (mm), while the orange dashed line with circular markers represents the runoff simulated using Yang’s Budyko function (mm).
Sustainability 17 01570 g009
Figure 10. (a) The contribution of parameter n (RWp = Rn, where Wp denotes parameter n in Yang’s function) to runoff variation versus NDVI; (b) Rn versus permafrost area (104 km2); (c) Rn versus ALT (m); (d) permafrost area (104 km2) versus ALT (m).
Sustainability 17 01570 g010
Figure 11. SRYR annual runoff change attribution. Orange, blue, and green colors in figure represent the contributions of E0, P, and Wp to runoff change, respectively.
Sustainability 17 01570 g011
Figure 12. Relationship between Rn and parameter n. Rn represents the contribution of watershed characteristic changes to runoff variations, and n is the watershed characteristic parameter in Yang’s Budyko function. The dashed line denotes the linear trend between Rn and n.
Sustainability 17 01570 g012
Table 1. Dataset description and acquisition details.
DataTime SpanTemporal ResolutionData SourceAvailable Data
Precipitation1961–2020Monthly[38,39,40,41]https://doi.org/10.5281/zenodo.3114194 (accessed on 24 August 2024)
Temperature1961–2020Monthlyhttps://doi.org/10.11888/Meteoro.tpdc.270961 (accessed on 24 August 2024)
Potential evapotranspiration1961–2020Monthly[46]https://doi.org/10.11866/db.loess.2021.001 (accessed on 24 August 2024)
Permafrost data1961–20205-Yearly[45]https://doi.org/10.11888/Cryos.tpdc.300955 (accessed on 24 August 2024)
LUCC1980, 1990, 1995, 2000, 2005, 2010, 2015, 2020Yearly[43]https://www.resdc.cn/ (accessed on 24 September 2024)
Runoff1961–2020Yearly/http://www.cjw.gov.cn/ (accessed on 24 February 2024)
NDVI1982–2020Half month[42]https://zenodo.org/records/8253971 (accessed on 24 October 2024)
Table 2. Climate variations and basin characteristics of the SRYR.
PeriodAverage P (mm)Change (%)Average E0 (mm)Change (%)Average R (mm)Change (%)R/PChange (%)nChange (%)wChange (%)
1961–2004372.3N/A560N/A91.1N/A0.24N/A1.53N/A2.24N/A
2005–2020420.713%574.62.61%121.433.26%0.2920.83%1.45−5.23%2.15−4.02%
1961–2020385.23.46%563.90.70%99.28.89%0.268.33%1.5−1.96%2.21−1.34%
Table 3. Contribution of hydrometeorological and watershed characterization variables to runoff variability.
BreakpointBudyko FunctionWpElasticity CoefficientRunoff Change (mm)Variable Contribution (%)
εPεE0εWpΔRPΔRE0ΔRWpVCPVCE0VCWp
2004Yang’s1.451.96−0.96−1.1427.34−2.965.9290.23−9.7719.54
Fu’s2.151.94−0.94−1.7127.11−2.896.0889.47−9.5420.07
Table 4. Average evapotranspiration (E), potential evapotranspiration (E0), precipitation (P), runoff (R), and parameter n in Equation (5) for each sub-period.
Sub-PeriodYear RangeCorresponding RunoffE (mm)P (mm)R (mm)Permafrost Area (104 km2)ALT (m)nNDVI
T11961–1965R1545.1373.7110.19.771.881.35/
T21966–1970R2557.335779.79.761.791.59/
T31971–1975R3565.237591.99.621.921.52/
T41976–1980R4552.6353.2799.741.761.58/
T51981–1985R5555.3388107.89.671.911.440.38
T61986–1990R6569.8376.396.99.581.961.460.394
T71991–1995R7565.7351.480.89.61.991.520.381
T81996–2000R8562.3388.4829.662.041.770.391
T92001–2005R9566402.2103.69.242.061.550.379
T102006–2010R10586.4428.4116.68.942.151.520.385
T112011–2015R11567.4414.8111.99.292.121.530.379
T122016–2020R12574414.1129.88.442.111.330.382
Table 5. Rclimate (mm), RWp (mm), and observed R (mm).
Observed ∆R∆Rclimate∆RWp
∆R2−30.4−9.97−20.43
∆R312.27.844.36
∆R4−12.9−8.45−4.45
∆R528.818.6310.17
∆R6−10.9−8.55−2.35
∆R7−16.1−11.3−4.8
∆R81.218.41−17.21
∆R921.66.5715.03
∆R101310.332.67
∆R11−4.7−3.68−1.02
∆R1217.9−1.6619.56
Table 6. SRYR ΔArea (104 km2), ΔALT (m), and the sensitivity results of permafrost features.
ΔAreaΔALTEAreaEALT
∆R2−0.01−0.090.03−0.08
∆R3−0.140.13−0.040.05
∆R40.12−0.16−0.060.21
∆R5−0.070.150.28−0.38
∆R6−0.090.05−0.020.01
∆R70.020.03−0.040
∆R80.060.050.030.03
∆R9−0.420.02−0.020.06
∆R10−0.30.090.07−0.11
∆R110.35−0.030.01−0.07
∆R12−0.85−0.01−0.090.05
median (E*)−0.020.01
Disclaimer/Publisher’s Note: The statements, opinions and data contained in all publications are solely those of the individual author(s) and contributor(s) and not of MDPI and/or the editor(s). MDPI and/or the editor(s) disclaim responsibility for any injury to people or property resulting from any ideas, methods, instructions or products referred to in the content.

