Article

Research on Joint Operation of Flood Diversion and Storage Measures: A Case Study of Poyang Lake

1
Jiangxi Academy of Water Science and Engineering, Nanchang 330029, China
2
College of Water Conservancy and Hydropower Engineering, Hohai University, Nanjing 210024, China
3
Jiangxi Key Laboratory of Flood and Drought Disaster Defense, Jiangxi Academy of Water Science and Engineering, Nanchang 330029, China
*
Author to whom correspondence should be addressed.
Sustainability 2025, 17(4), 1522; https://doi.org/10.3390/su17041522
Submission received: 13 January 2025 / Revised: 10 February 2025 / Accepted: 11 February 2025 / Published: 12 February 2025
(This article belongs to the Special Issue Sustainable Water Management in Rapid Urbanization)

Abstract

:
In recent years, flood hazards have occurred increasingly worldwide, posing significant threats to the safety of life and property in lacustrine and riverine environments. To mitigate the devastating impacts of floods, it is crucial to explore optimal strategies for joint flood diversion of flood diversion and storage measures (FDSM). The FDSM management of Poyang Lake in China focuses on studying semi-restoration polder areas (SR Polders) and flood storage and detention areas (FS Detentions), which are subjects of ongoing research. Existing studies primarily focus on SR Polders or FS Detentions, with limited research on the joint flood diversion potential of these two measures, particularly regarding optimal scheduling. This study takes 185 SR Polders and the Kangshan flood storage and detention area (KS Detention) as the primary research objects. By integrating hydraulic theory, numerical simulation techniques, and survey data, we develop a hydraulic model for the SR Polders and a hydrodynamic model for the KS Detention to carry out flood diversion simulation. The 1998 flood is chosen as a typical case to simulate and analyze their flood diversion processes under various schemes. The results indicate that altering the operation criteria for FDSM influences both the maximum diversion discharge and the timing of the main diversion period. For the SR Polders, under the current flood control scheme, raising the operation water level (OWL) of SR Polders-I by 1.0 m increases the maximum diversion discharge by 894 m3/s. Additionally, raising the OWL of SR Polders-II by 0.37 m delays the main diversion period by one day. For the KS Detention, higher flood diversion water levels correspond to greater discharge capacities. Furthermore, a fuzzy optimization method is applied to optimize nine joint schemes of the SR Polders and KS Detention. The results indicate that the optimal joint flood diversion strategy for Poyang Lake is operating SR Polders-I, SR Polders-II, and KS Detention at a Hukou water level of 21.65 m, 22.05 m, and 22.50 m, respectively. Finally, the study provides insights and recommendations for flood control management at Poyang Lake. The results of this study not only have important guiding significance for flood control management of large plain lakes but also provide references for the joint operation of flood diversion and storage areas in other regions.

1. Introduction

In recent years, extreme rainfall events leading to flooding have occurred with increasing frequency, driven by the intensifying effects of climate change and rapid urbanization [1,2]. Flooding has had devastating global impacts, with global losses estimated at USD 651 billion between 2000 and 2019, affecting 1.6 billion people [3]. It has become one of the most frequent, widespread, and economically damaging natural disasters, posing a significant threat to human life [4]. Flooding events in countries such as China [5], Vietnam [6], Germany [7], and Pakistan [8] highlight the universal and severe nature of this phenomenon.
With its vast territory and numerous rivers and lakes, China is particularly vulnerable to flooding. Poyang Lake, the largest freshwater lake in China, is located in the Yangtze River Delta plain and is influenced by the floods of the five rivers (Gan River, Fu River, Xin River, Rao River, and Xiu River) as well as the Yangtze River [9]. Due to the low-lying topography of the lake area and inefficient flood diversion, Poyang Lake has long been a hotspot for flood disasters in the middle and lower reaches of the Yangtze River [10]. These flood disasters pose a serious threat to the lives and property of people in the lakeside area, which covers about 18% of the province’s total land area, supports 26% of its population, and accounts for 41% of its economic output [11]. This area is the core economic zone of Jiangxi Province, underscoring the critical importance of improving its flood control system to enhance disaster resilience. Over several decades of water conservancy construction, Jiangxi Province has established a flood control engineering system primarily consisting of reservoirs, Polders, and FS Detentions [12].
As the typical FDSM in the Poyang Lake area, the current research mainly focuses on the individual operation of SR Polders or FS Detentions. However, studies on the joint flood diversion operation of these two measures remain insufficient. Scholars such as Min Qian [13] and Jiang Lugang [14] focused on the role of SR Polders in flood control, investigating the flood diversion capacity of Poyang Lake after returning farmland to lake areas and addressing issues related to polders management. Lei Sheng [12], Ma Qiang [15], and Wan Zhihao [16] analyzed the practical application of SR Polders in flood diversion during the 2020 floods. Yan Hong, Fu Chun [17], and Wen Tianfu [18] conducted in-depth studies on the flood control optimization scheduling strategy of SR Polders using fuzzy optimization theory. Jiang Shuihua [19] applied the MIKE 21 model to develop a loss assessment method based on flood evolution and inundation data from FS Detentions, accurately estimating the potential life and property losses caused by a breach of the Kangshan embankment in Poyang Lake. Chen Yubin [20] proposed a flood regulation model that integrates the River–Lake–Detention system, creating flood simulation schemes that consider the impact of FS Detentions and conducting real-time scheduling simulations for the operation of SR Polders during the 2020 floods. Most of the above-mentioned studies are mainly based on the macroscopic perspective of water balance in the lake area, focusing on the total volume and impact of using FDSM for flood diversion, and the research methods are mostly based on spatial data analysis or statistical models. However, the research on systematic simulation and comprehensive analysis of FDSM for flood diversion, especially joint flood diversion still needs to be strengthened.
Few studies have explored the joint operation of the two. Zou Jiayu [21] developed a hydrodynamic model of Poyang Lake using Mike 21, which couples SR Polders and FS Detentions and then simulated the joint operation of flood diversion under different schemes. The model constructed in [21] was constructed by merging the same type of SR Polders into a whole. However, this generalization method still needs to be improved from the verification results of the model. In order to explore the potential of joint flood diversion operation and optimize the flood control scheduling strategy of SR Polders and FS Detentions, this study takes 185 SR Polders and the KS Detention in Poyang Lake as research objects. First, a hydraulic model for the SR Polders and a hydrodynamic model for the KS Detention are developed using hydraulic theory, numerical simulation techniques, and survey data to carry out flood diversion simulation. Then, the 1998 flood is selected as a typical case to simulate the flood diversion under different operational schemes for SR Polders and the KS Detention, respectively. Subsequently, a fuzzy optimization method is employed to optimize the nine schemes of the joint flood diversion operation by evaluating three key aspects: the reduction in maximum water level at the Xingzi Station (WL Reduction), the duration of exceeding KS Detention OWL (EL Duration), and the total flood diversion volume (FD Volume). Finally, this paper discusses insights and recommendations for improving the flood control management of Poyang Lake. The innovation of this study lies in the first systematic evaluation and optimization of different strategies for the joint operation of SR Polders and KS Detention for flood diversion under the 1998 flood, filling the gap in the research on the joint operation of flood diversion and storage measures in the Poyang Lake. The objectives of this study are (a) to investigate the effects of different operation criteria on the flood diversion capacities of SR Polders and KS Detention under the current status and (b) to evaluate and optimize the joint operation schemes of SR Polders and KS Detention by adopting a fuzzy optimization method.

2. Materials and Methods
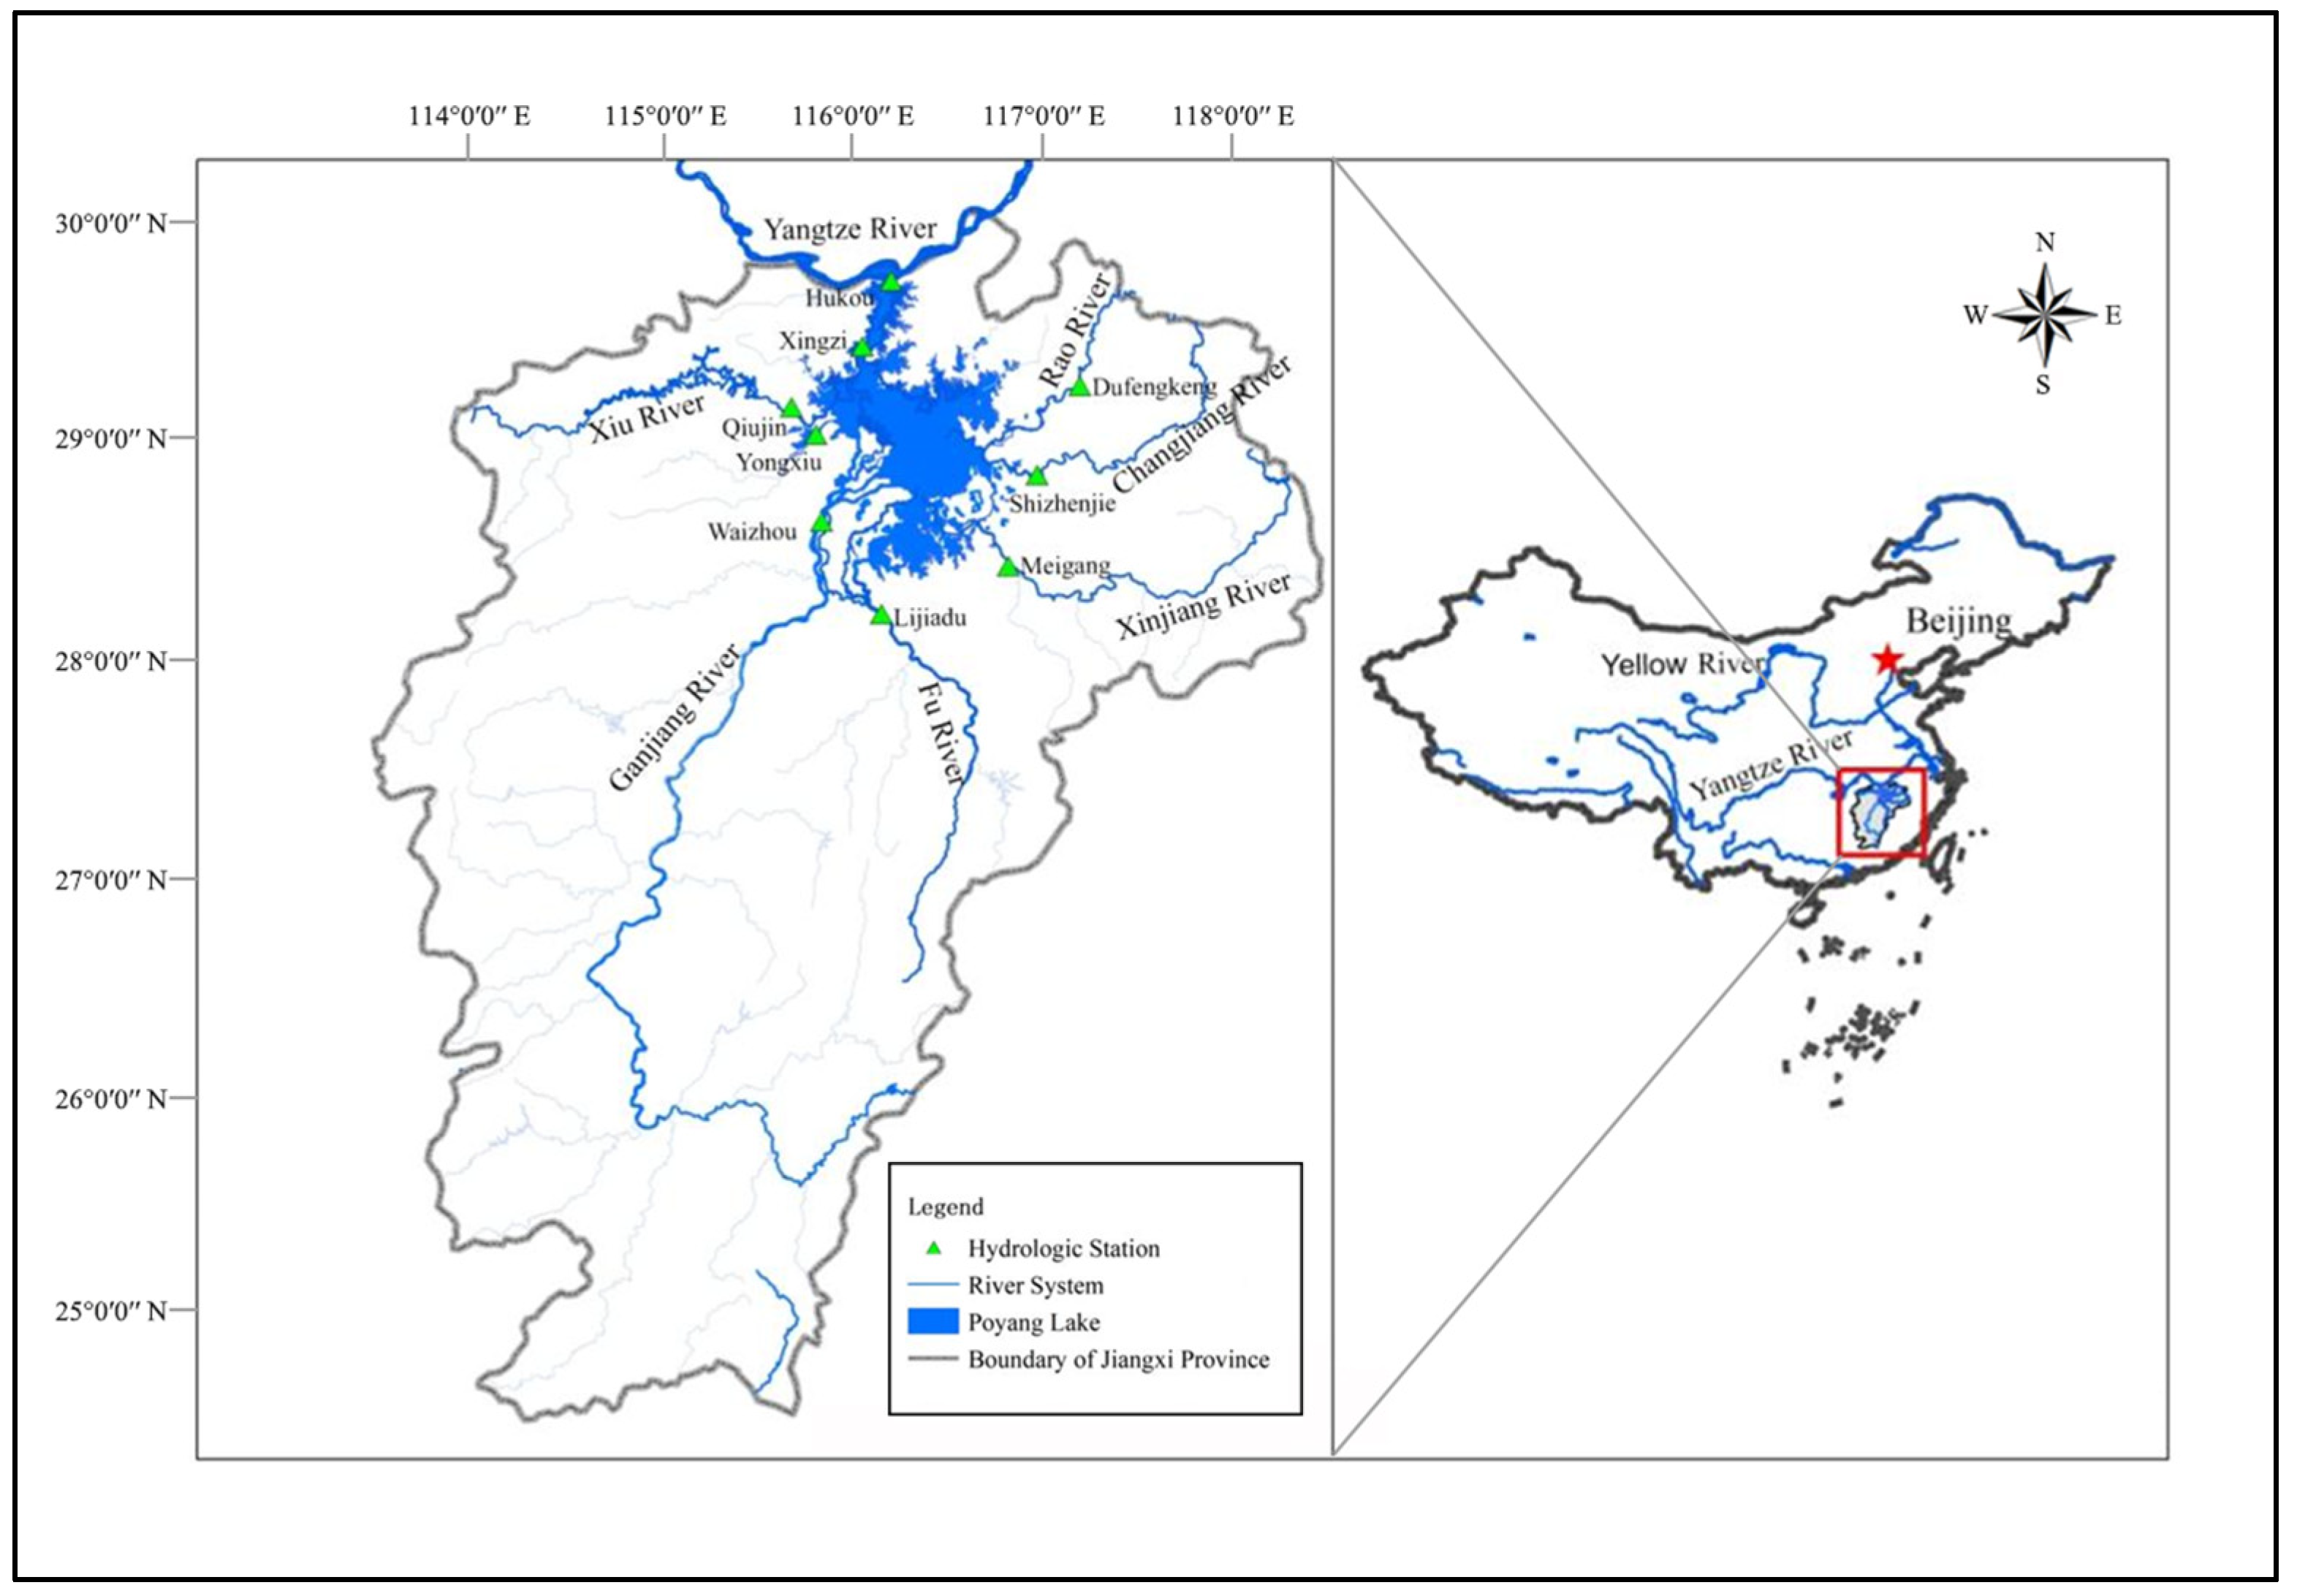
2.1. Study Area

Poyang Lake, located on the southern bank of the middle and lower reaches of the Yangtze River in northern Jiangxi Province, consists of the main lake area and the tails of five rivers. The basin area of Poyang Lake is 162,200 km2, accounting for about 94% of the area of Jiangxi Province. After receiving water from the five rivers, the lake stores and regulates it before discharging it into the Yangtze River through Hukou, as shown in Figure 1. From April to June, the main flood season for the five rivers, the increased upstream discharge causes the water level in the lake to rise, expanding the areas of lake. From July to September, the inflow from the five rivers decreases, while the Yangtze River enters the main flood season, with the increased Yangtze inflow causing backflow into the lake, hindering outflow and resulting in a rapid rise in the water level of Poyang Lake, which increases the risk of flooding disasters. Since the 20th century, the frequency and severity of flooding disasters in Poyang Lake have significantly increased [22,23]. In 1998, the water level at the Poyang Lake Hukou Station reached 22.59 m, surpassing the WWL (19.50 m) by 3.09 m, and the OWL of FS Detentions (22.50 m) by 0.09 m. In 2020, the water level at the same station peaked at 22.49 m and the average water levels during the period of July to August were 20.41 m, with water level variations ranging from 17.91 m to 22.49 m. The frequent occurrence of flooding disasters in Poyang Lake poses a severe threat to the safety of life and property for the people living in the lakeside areas.
The SR Polders and KS Detention are critical components of the flood control system in Poyang Lake. According to the ‘Regulations on the Relocation of Villages and Restoration of Lakes for Flood Discharge in Jiangxi Province’ [12], the OWL of SR Polders with less than 6.67 km2 of crop cultivation (SR Polders-I) is 20.50 m, and the OWL of SR Polders with more than 6.67 km2 of crop cultivation (SR Polders-II) is 21.68 m. However, studies indicate that current operation water levels are significantly lower [17,18]. According to the “Flood Control Scheme for the Yangtze River”, the OWL of the KS Detention is 22.50 m. In 2023, Jiangxi Province started to advance the construction project of FS Detentions, along with the reinforcement and improvement of flood diversion facilities. In this context, it is crucial to study the joint flood diversion operation of the SR Polders and KS Detention under typical flood conditions.

2.2. Data and Analysis

The data from the main hydrologic stations of Poyang Lake in 1998, along with the survey data of each SR Polder, as well as the physical model testing data of the flood diversion sluice in the KS Detention, were all provided by the Jiangxi Academy of Water Science and Engineering.

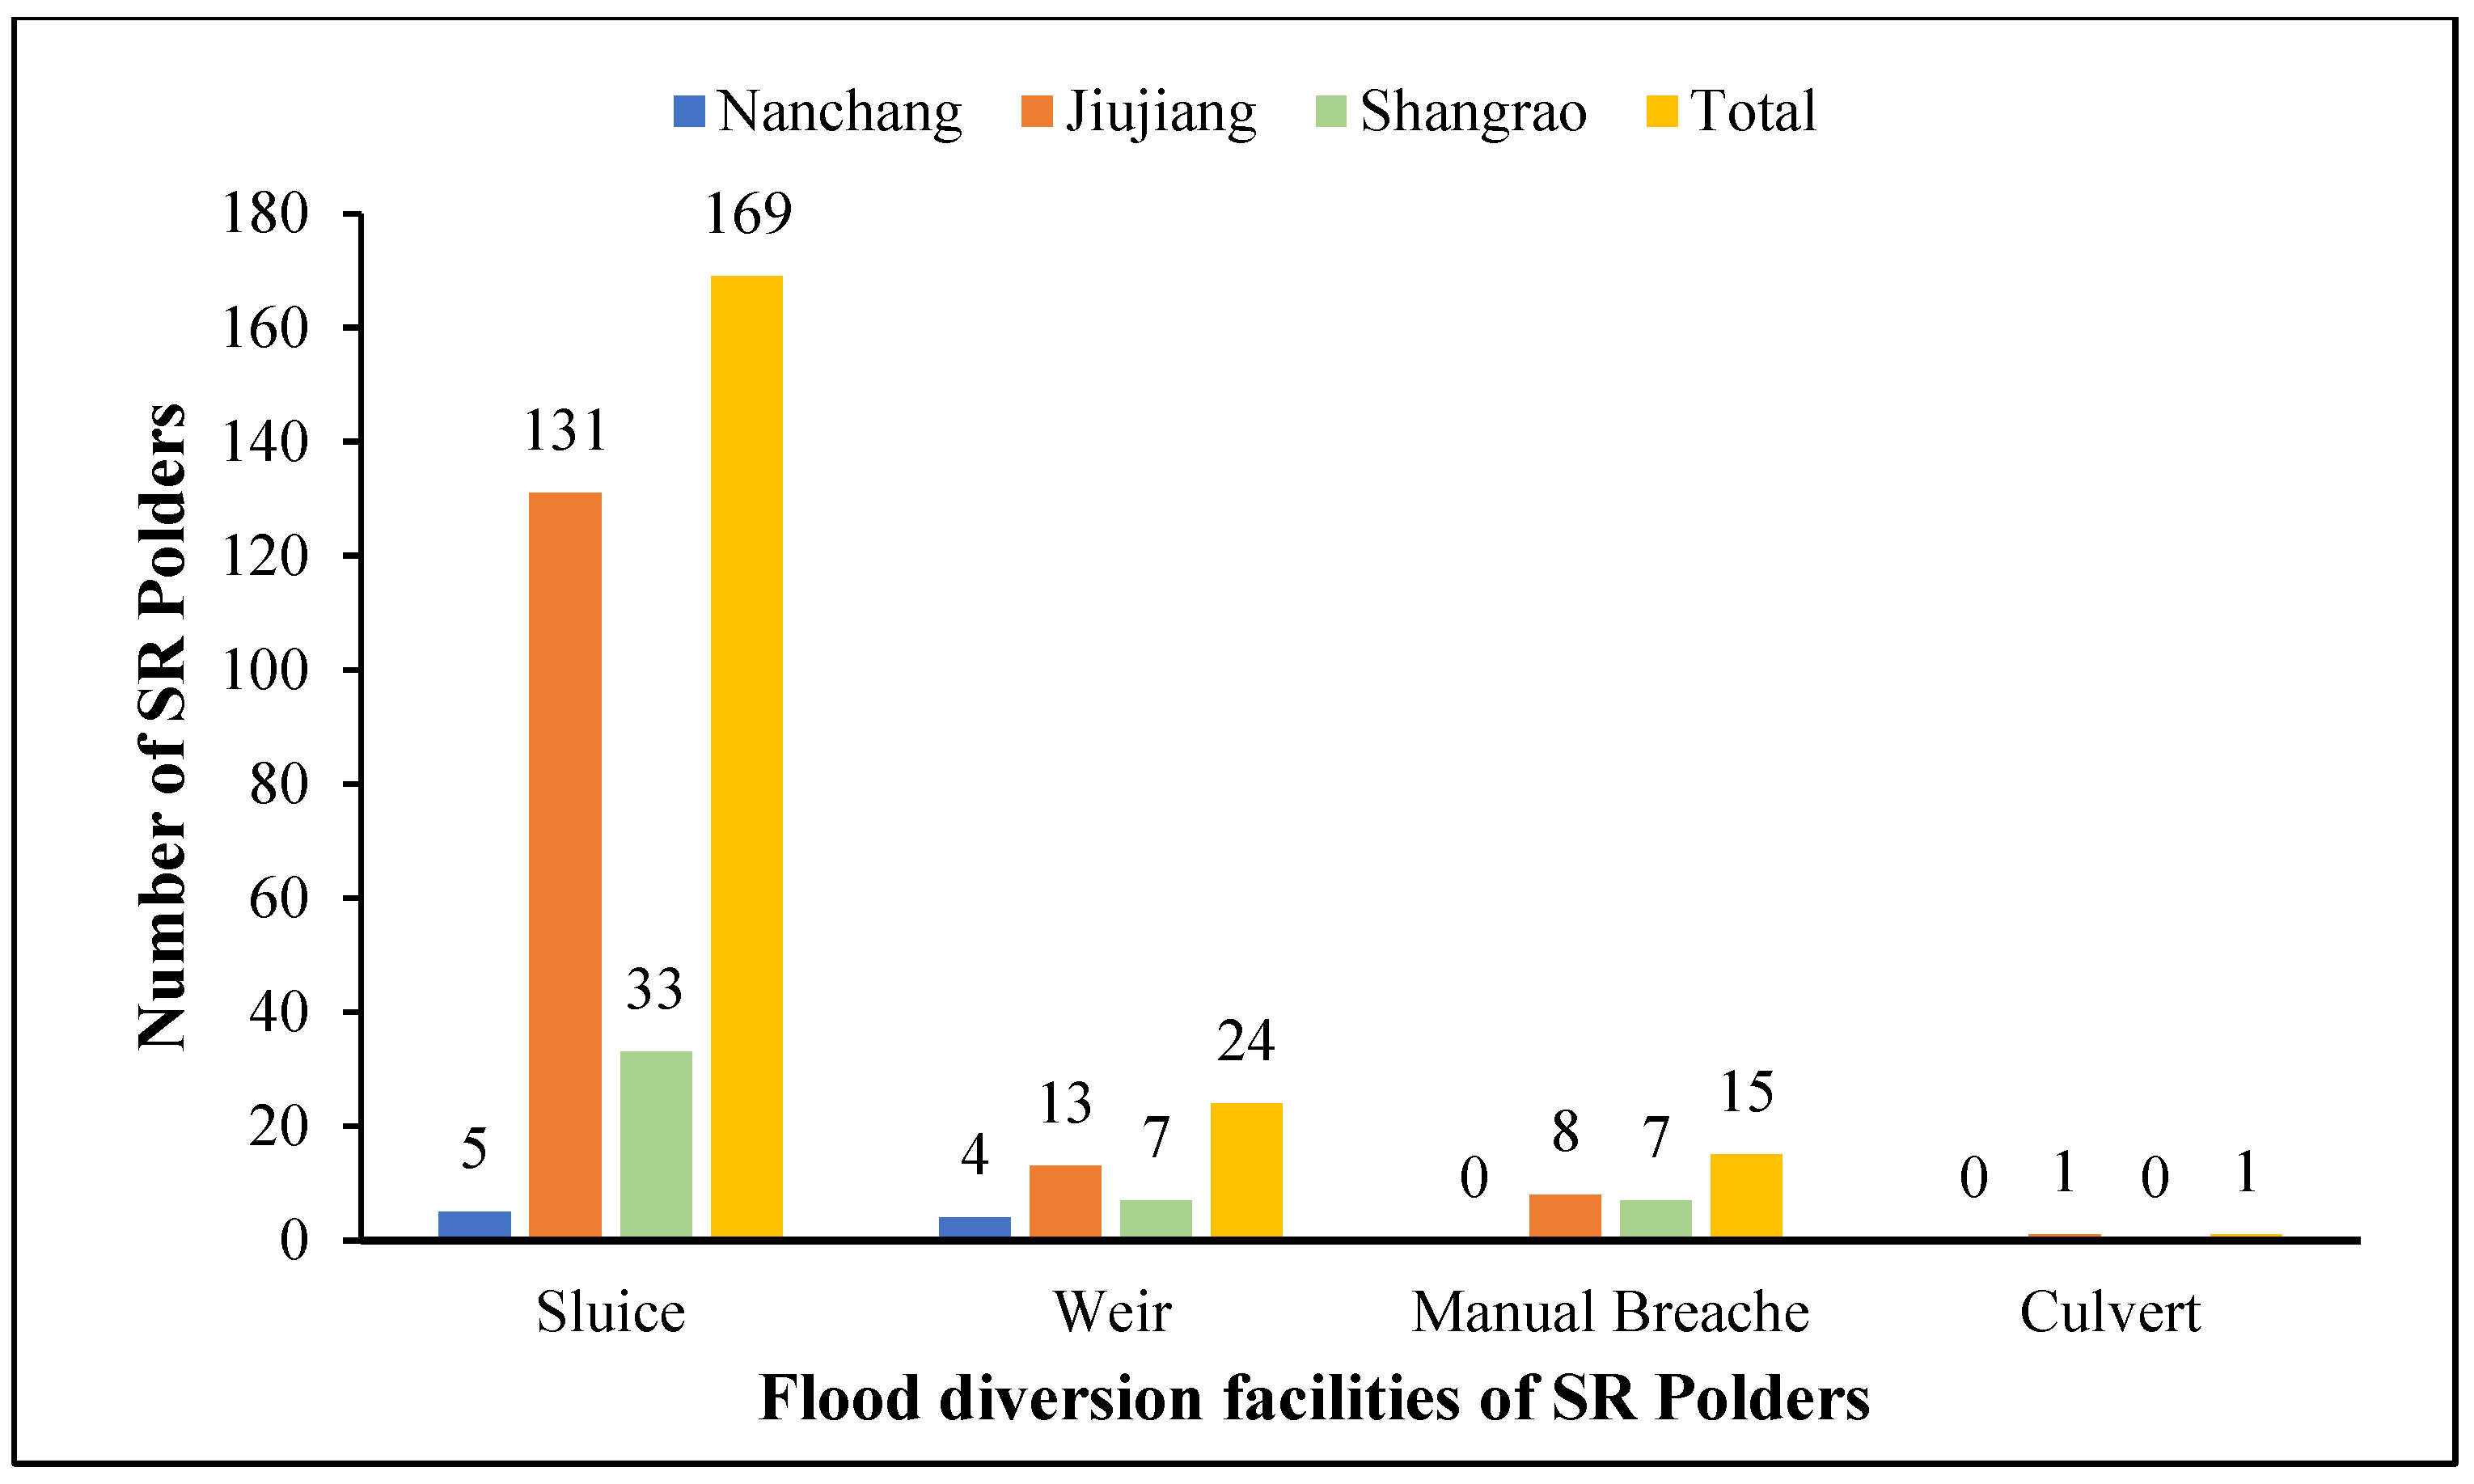
2.2.1. Current Status of SR Polders in the Poyang Lake

SR Polders are areas where crops are cultivated within the dikes that surround polders when the water level outside the dikes is lower than the OWL, and which are used for flood storage when the water level outside the dikes rises above the OWL. Figure 2 shows the Zenglong SR Polder located in Zenglong Village, Jiangyi Town, Gongqingcheng County, Jiujiang City, Jiangxi Province. By collecting historical data, reading literature, and conducting a field survey in 2021, relevant data, such as the detailed and newest data of flood diversion facilities, the location of each polder, and the area of crop cultivation, was compiled and analyzed to study the current status of the SR Polders.
There are a total of 240 SR Polders in Jiangxi Province, distributed across 18 counties (cities, districts) in the three cities of Nanchang, Shangrao, and Jiujiang. Among these, Nanchang has 7 SR Polders, Jiujiang has 194, and Shangrao has 39. In terms of river basins, 185 of these SR Polders are located in the Poyang Lake area, while 55 are situated along the Jiangxi area of the Yangtze River [10]. The dikes surrounding 185 SR Polders with an area of 4697.35 km2 of crop cultivation are 604.13 km in total length. Among these, 152 SR Polders are classified as SR Polders-I, whereas 33 SR Polders fall under the category of SR Polders-II. According to flood diversion statistics from the 2020 flood, the 185 SR Polders utilize various facilities for flood storage, including weirs, sluices, breaches, and a small number of culverts. The specifics of these facilities are shown in Figure 3. As seen in Figure 3, the most commonly used facility is the sluice, followed by the weir. Over the years, many facilities have experienced aging, lack of maintenance, or partial damage. Due to the absence of a regular management and maintenance system, timely repairs are not carried out, leading to a decrease in their flood diversion capacity and a reduction in efficiency [10,24].

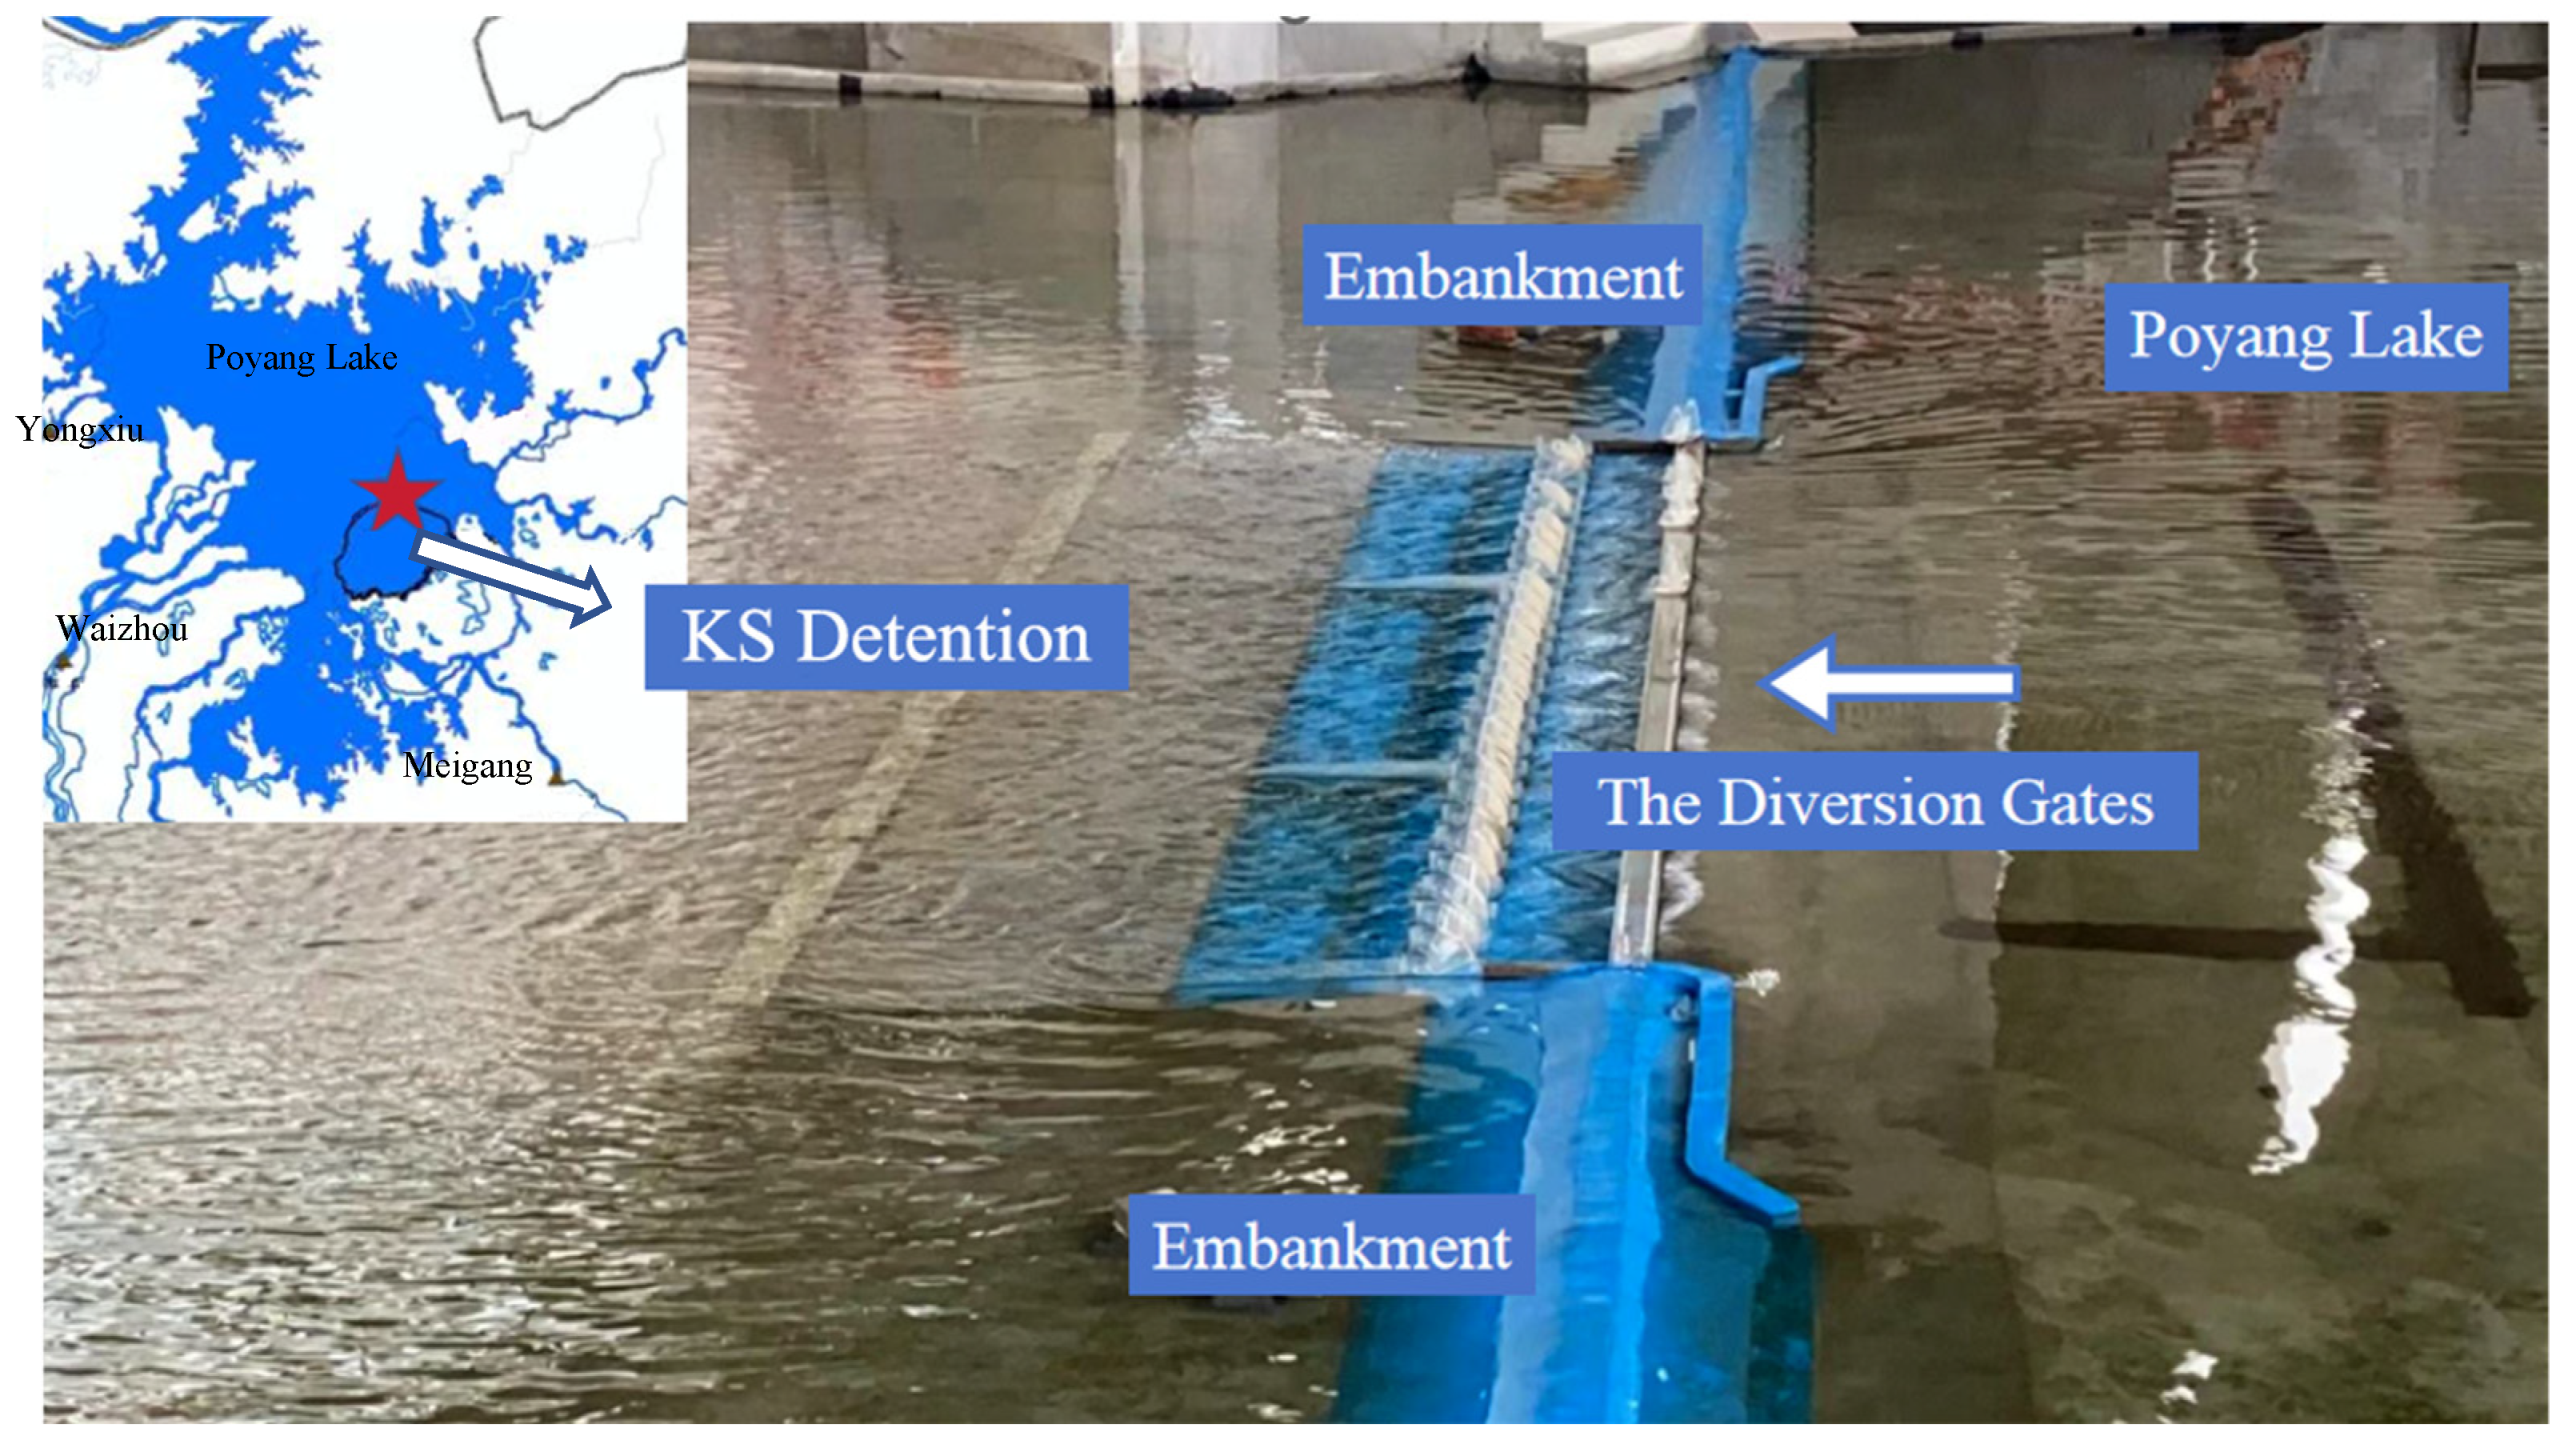
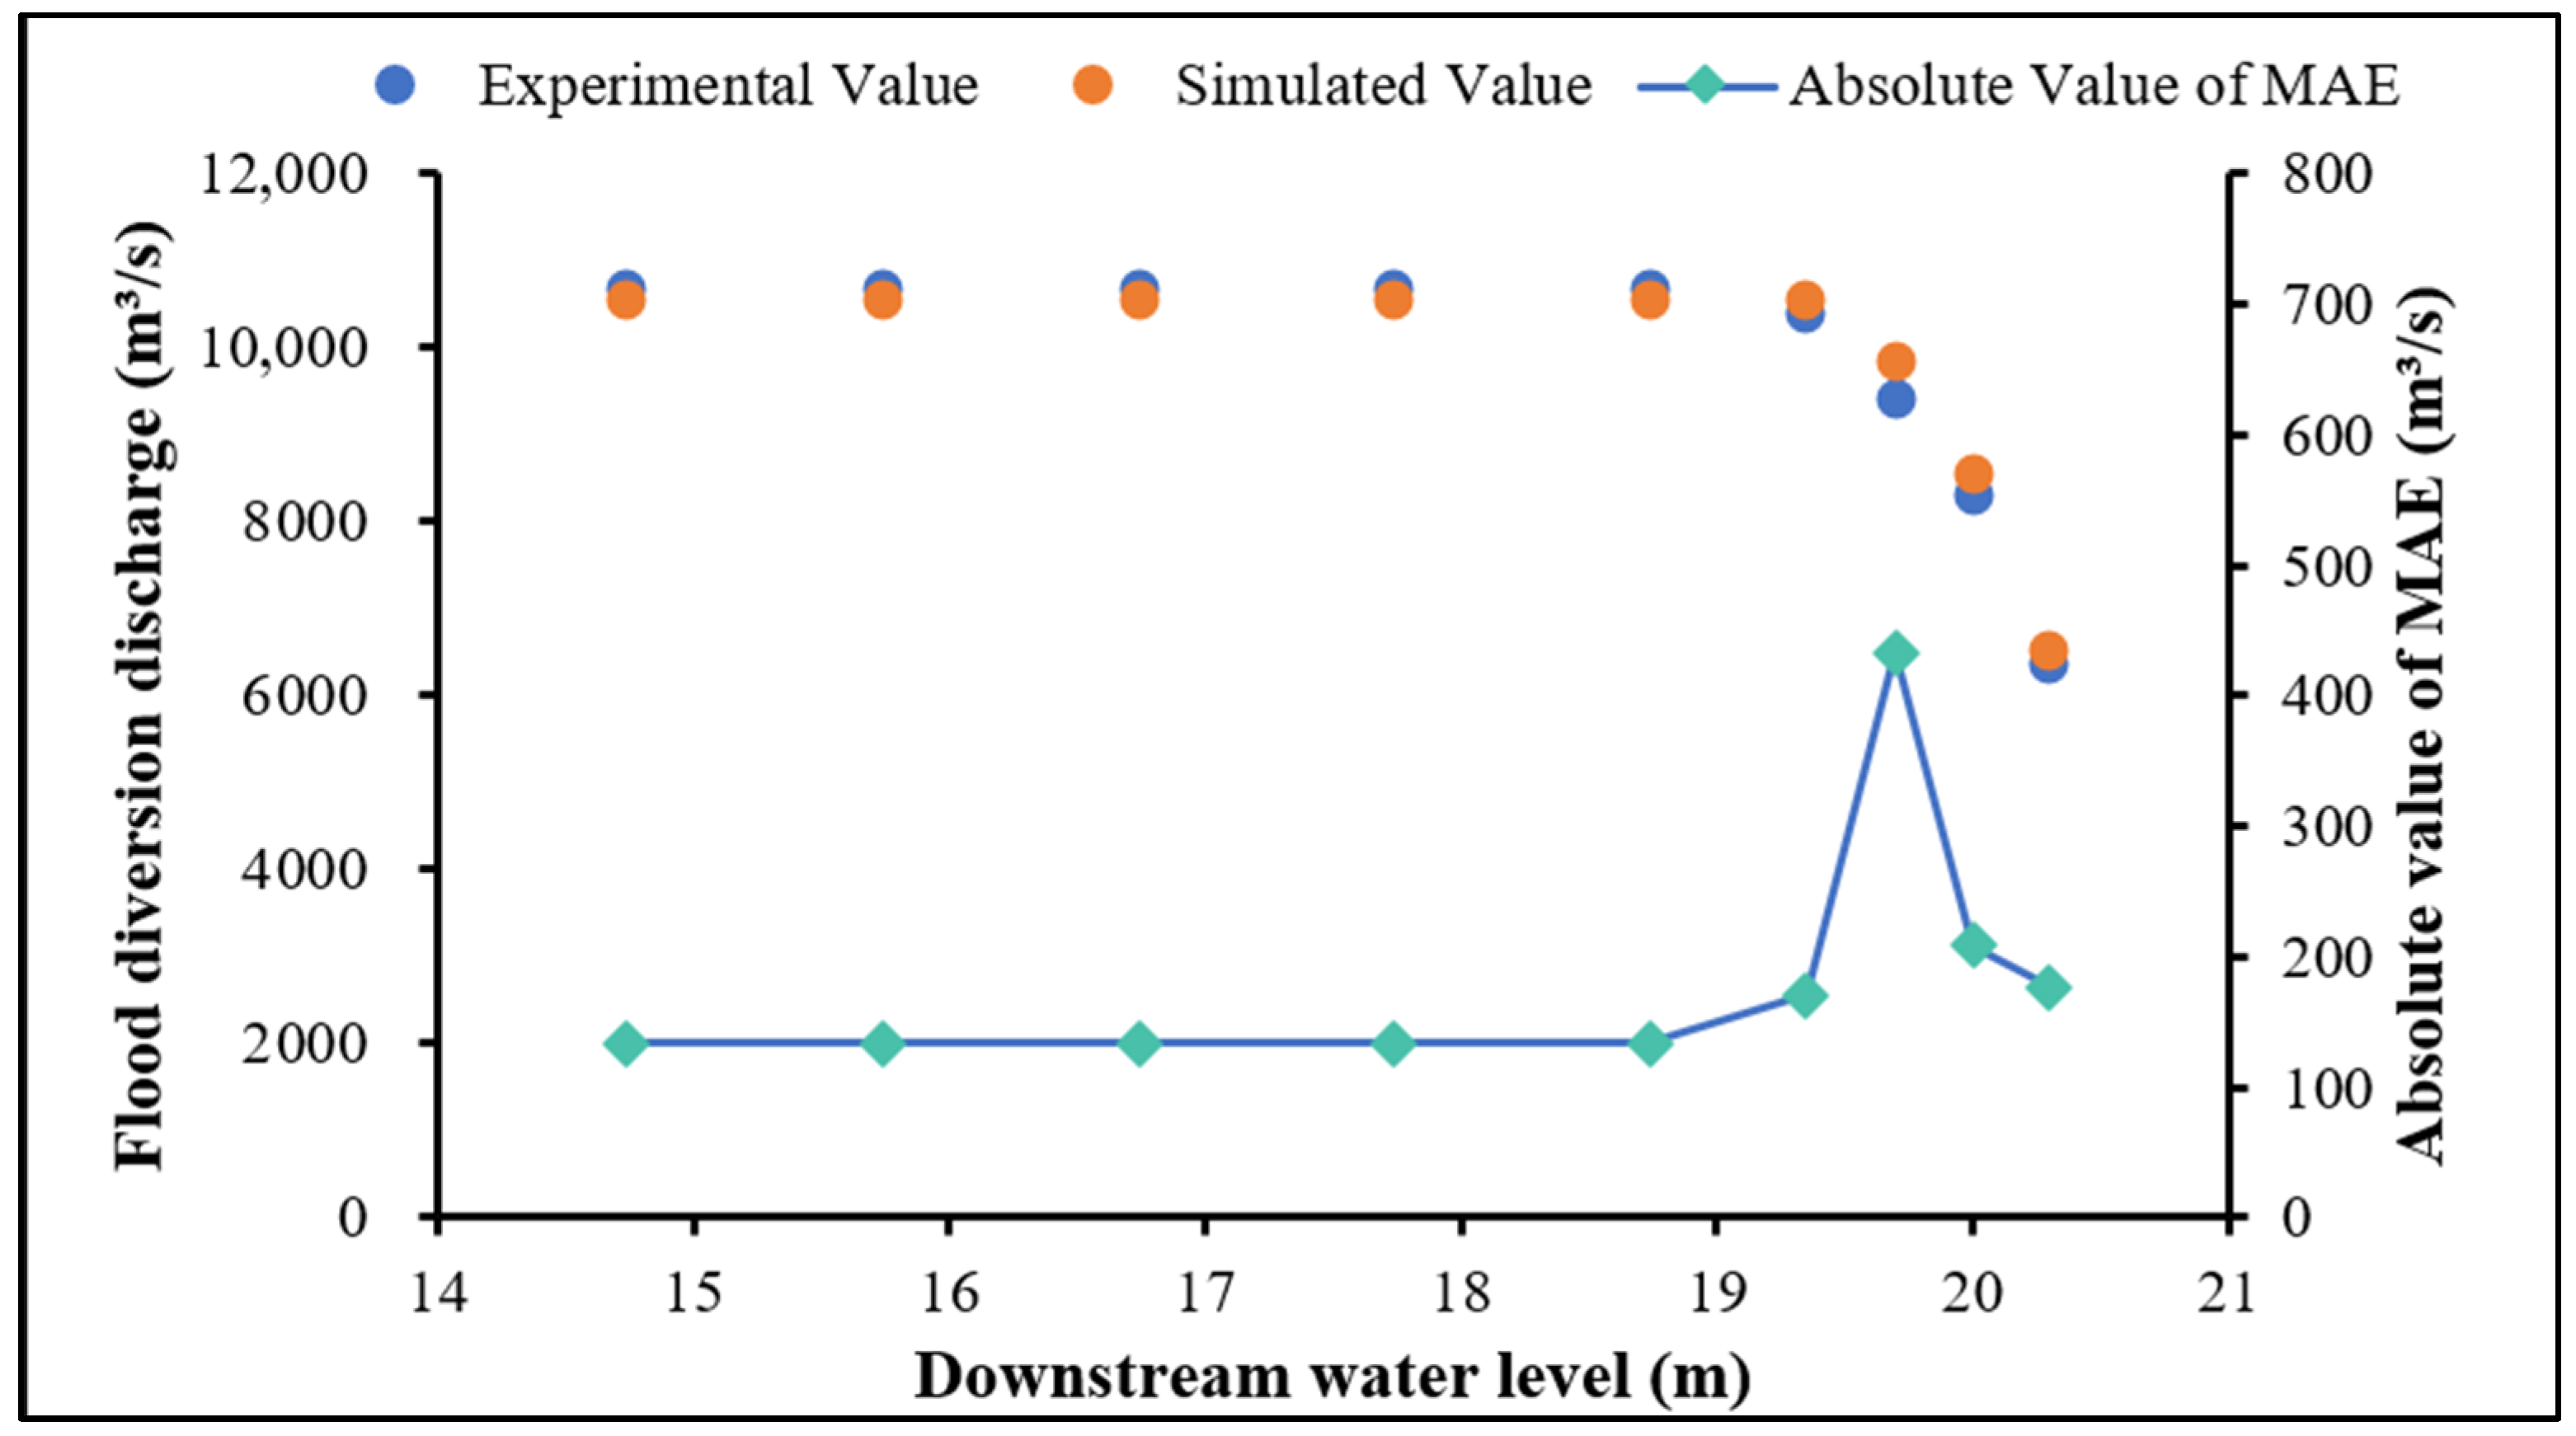
2.2.2. Physical Model Testing of the Kangshan Flood Diversion Sluice

Situated on the southeastern shore of Poyang Lake and positioned downstream of the confluence of the southern branch of the Gan River, the Fu River, and the Xin River, the KS Detention functions as a vital flood detention area for Poyang Lake, with the responsibility of diversion 1.57 billion m3 of floods from the Yangtze River [10].
On 10 May 2023, the construction project of KS Detention officially started. The designed flood diversion discharge of the sluice is 10,673 m3/s, with a total of 28 gates, each having a clear width of 14 m. The sluice is operated when the water level of the Kangshan Station reaches 20.68 m. The physical model was designed and built according to the Froude’s similarity, with a total area of about 551 m2 and a geometric scale of 1:100. The model is shown in Figure 4. With the upstream water level maintained at 20.68 m, various experimental conditions were obtained by adjusting the downstream water level. The relationship between the downstream water level and the flood diversion discharge when all 28 gates are fully open is illustrated in Figure 5.
As depicted in Figure 5, the Kangshan flood diversion sluice achieves a peak discharge of 10,694 m3/s with all 28 gates in full operation at an upstream water level of 20.68 m. This substantial diversion discharge remains constant when the downstream water level is maintained below 18.74 m, indicating characteristics typical of free flow. However, a significant shift is observed when the downstream water level exceeds 19.35 m. Specifically, the coefficient of discharge progressively decreases with the rising downstream water level, leading to a consistent decline in the diversion discharge. This decline marks a transition from free flow to submerged flow. Importantly, our findings suggest that the critical threshold for this transition in the downstream water level is approximately 18.74 m. This understanding is crucial for the comprehension of the flood diversion capacity of the KS Detention.

2.3. Research Method

2.3.1. Methods for Flood Diversion Simulation of SR Polders

To simulate and analyze the flood diversion process of SR Polders, this study optimizes the hydraulic model of SR Polders established in [10]. The optimization includes the flow calculation method for sluice and the selection of water level reference stations. The specific details of the model design and calculations are as follows.
Upon thorough investigation and rigorous analysis, it has been established that when the SR Polders use weirs for flood diversion, it can be classified as a broad-crested weir equipped with a sill, whereas the manual breach can be generalized as a broad-crested weir devoid of a sill. The flow calculation of sluice is based on the maximum opening. The flow calculation of open-type sluice can use the flow calculation formula of the weir, while the culvert-type sluice requires the formula of the weir or culvert. When the flow pattern is non-pressurized, it can be calculated according to the flow calculation formula of weir; when the flow pattern is pressurized or culvert outflow, the flow calculation formula of the culvert is used. The specific calculation formulas are as follows.
The flow calculation formula of weir, breach, open-type sluice, and culvert-type sluice without pressure that is used in the hydraulic model is as follows [25]:
Q = σ ε mnb 2 g H 0 3 2
In the formula, σ represents the submergence coefficient; ε represents the side contraction coefficient; m represents the discharge coefficient, which is related to the type and height of the weir; n represents the number of gates; b represents the net width of each gate; H0 represents the upstream water head including the approach velocity head, H0 = H + αv2/2g; H represents the water head at the upstream end of the weir; α represents the kinetic energy correction coefficient; and v represents the approach velocity.
The flow calculation formula for while the flow pattern of sluice is pressurized or culvert outflow that is used in the model is as follows [26]:
Q = μ w 2 g H 0 + iL   -   h
In the formula, μ represents the discharge coefficient; w represents the cross-sectional area of the outlet; H0 represents the sum of the elevation difference between the upstream water surface and the outlet of the culvert, as well as the approach velocity head; i represents the slope of the culvert; L represents the length of the culvert; and h represents the water depth in downstream.
The calculation process of flood diversion in the hydraulic model of SR Polders includes basic data input, condition judge, external data access, intermediate process, and result output. Firstly, the basic hydrological data and flood diversion facility data are input into the model. Then, the program judges the flood diversion conditions and flow patterns of each facility. The intermediate process includes dynamically adjusting various parameters in the flow calculation formula in real-time. At the same time, based on the water level-capacity curve of SR Polder, it determines whether the flood diversion has ended. Finally, the program statistically outputs the changes in the flood diversion discharge (Q) and cumulative flood diversion volume (V) of each facility. The specific calculation process of the model is shown in Figure 6.
The operation of each SR Polder is closely related to Hukou Station. Due to the different distances from Hukou Station, in actual use, the relevant Polders need to be operated accordingly when the adjacent stations (reference stations) reach the OWL. The water level stations selected in this model mainly include Hukou, Xingzi, Duchang, Tangyin, Poyang, Sanyang, Kangshan, and other stations. Among them, Hukou Station is the representative station, and the other water level stations are reference stations.
To verify the rationality of the model design and the accuracy of calculations, this study selected Nanbei Port Polder, Shuilanzhou Polder, Lianbei Polder, and Liannan Polder as typical examples. The data of flood diversion facilities corresponding to each Polder into the model was inputted, and the boundary conditions were set to the observed water levels of Hukou Station (Nanbei Port Polder), Sanyang Station (Shuilanzhou Polder), and Poyang Station (Lianbei Polder and Liannan Polder). The parameters such as the discharge coefficient and submergence coefficient are dynamically and automatically adjusted during the calculation process, and the comparison between the simulated results and the survey results is shown in Table 1.
According to the “Hydrological Information and Forecasting Specification (GB T 22482-2008)” [27], combined with Table 1, it can be seen that the accuracy of this flood diversion simulation meets the requirements. The selected Polder has a flood diversion duration and diversion volume relative error of less than 20% of the allowable error. The flood diversion process of the Polder is basically consistent with the actual situation. It can be considered that the design of the hydraulic model of SR Polders is reasonable, and the calculation is accurate.

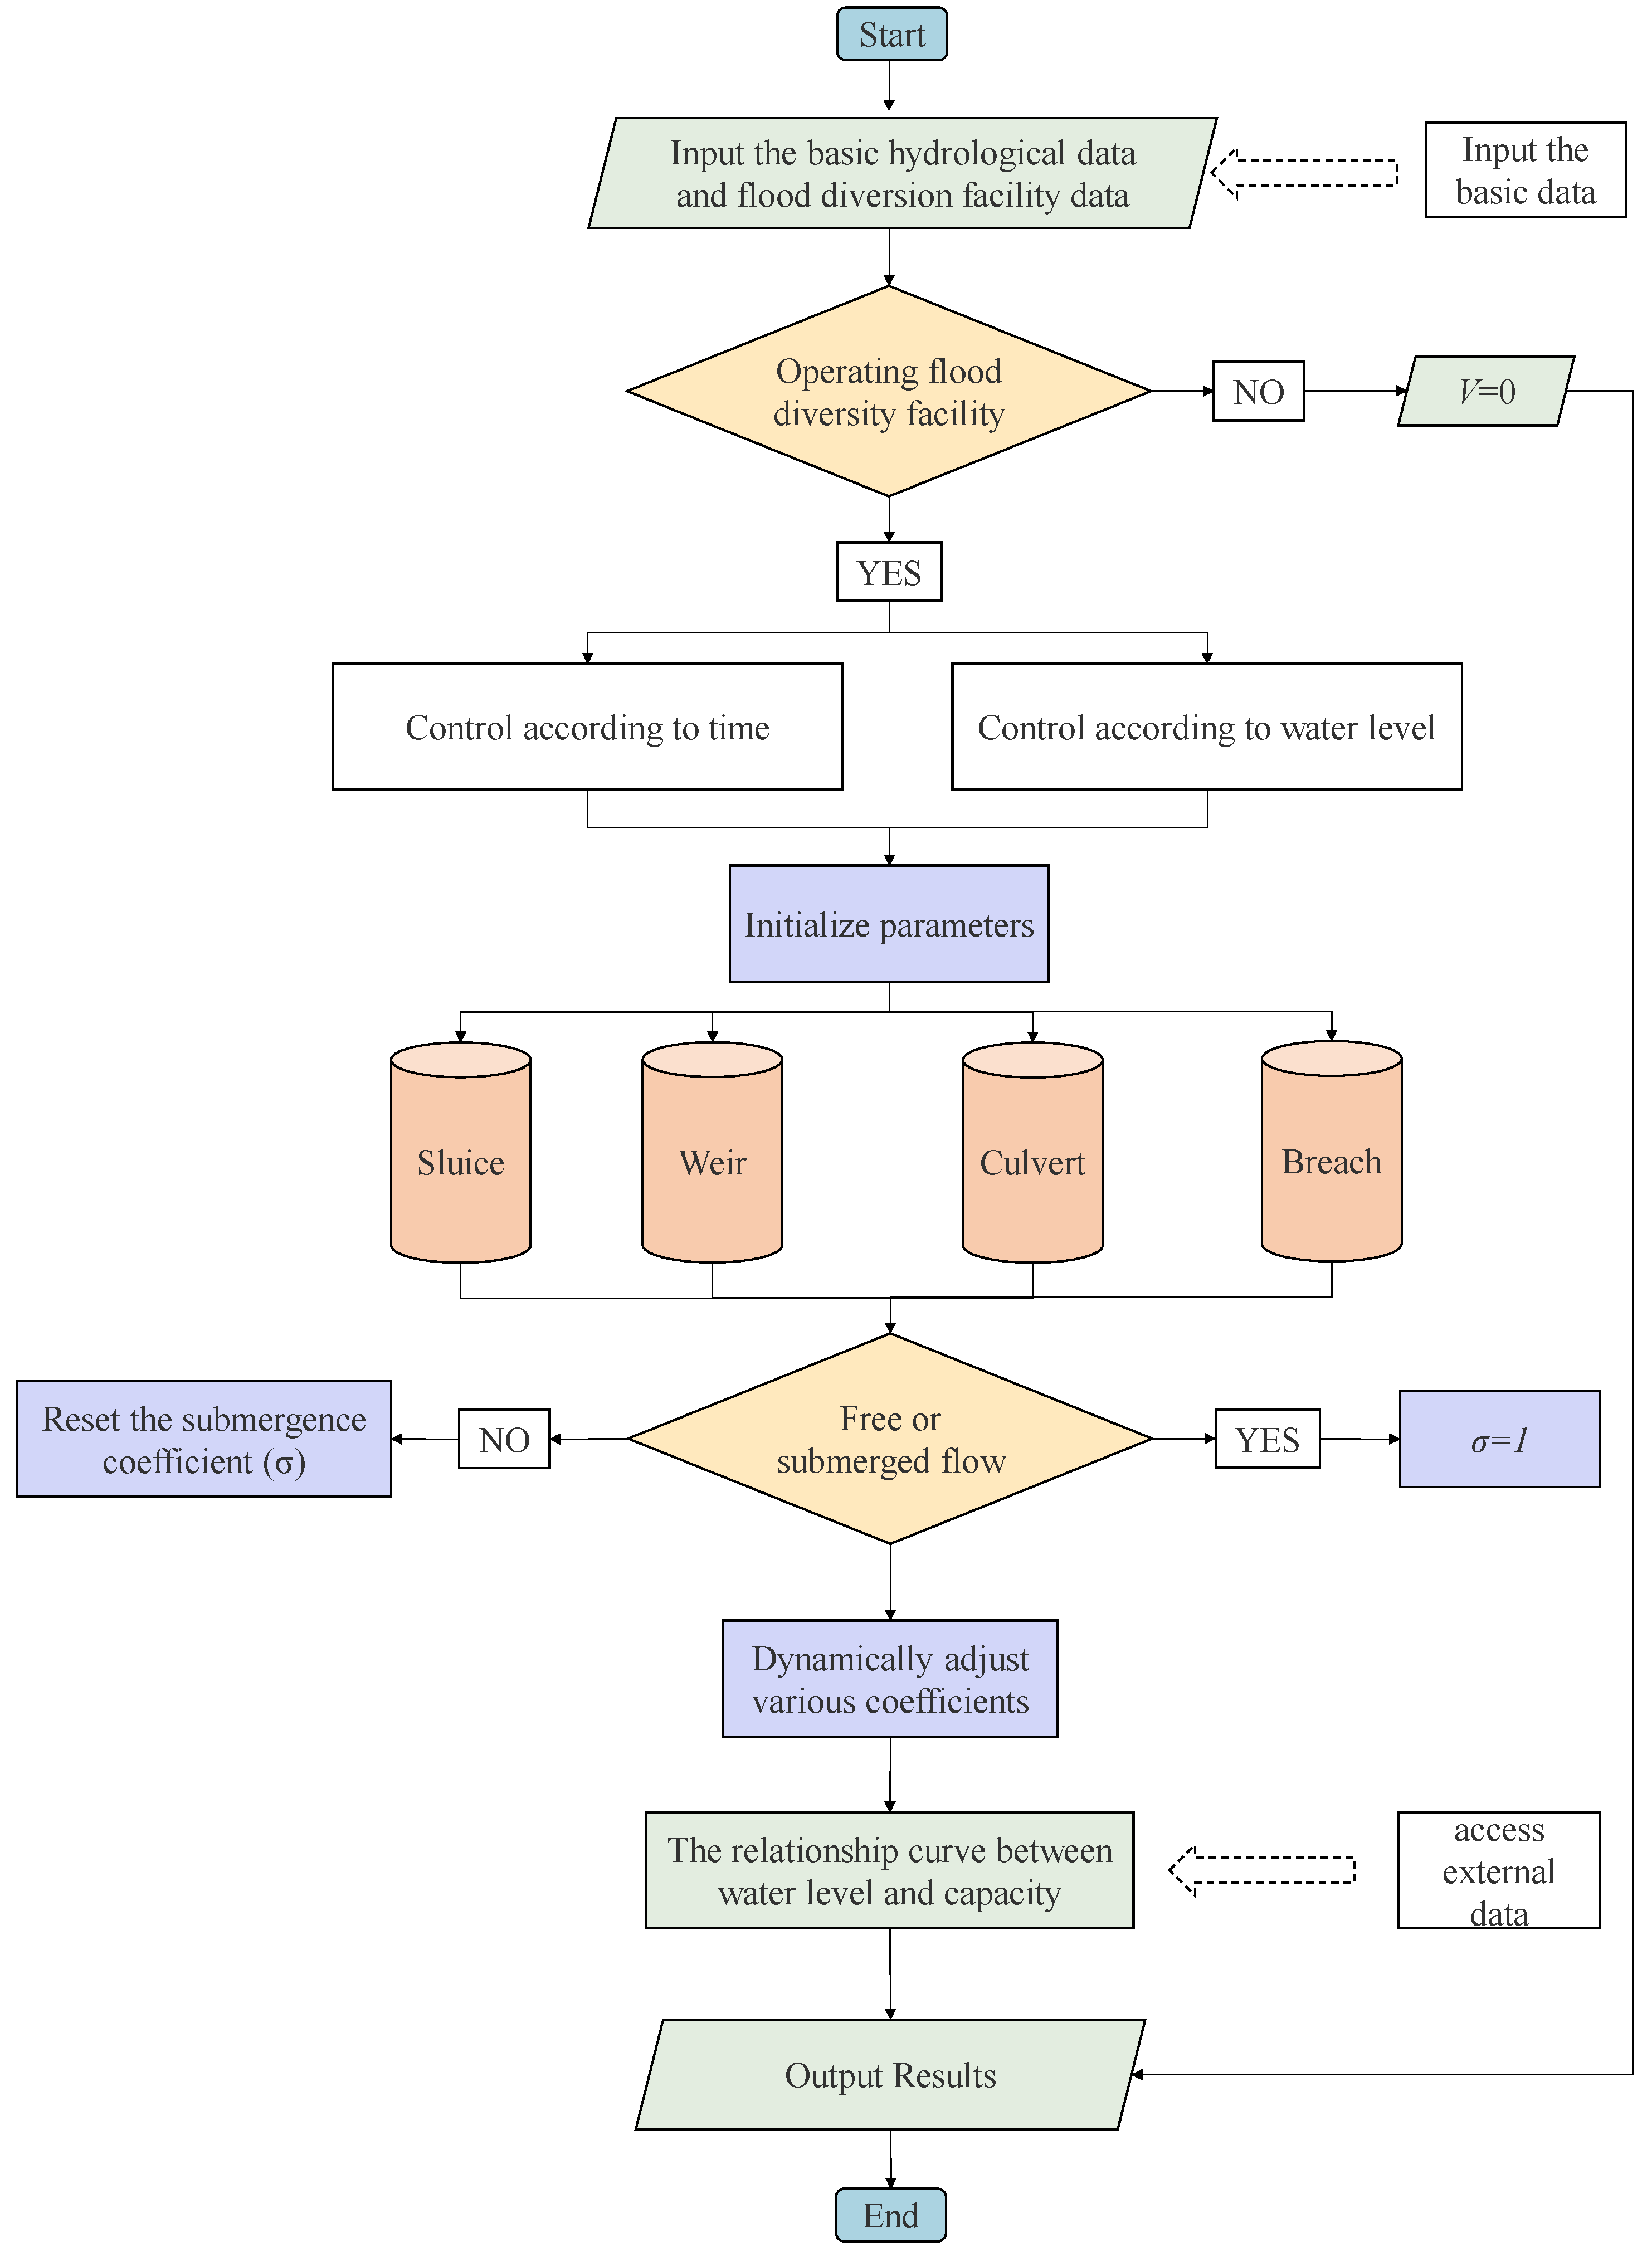
2.3.2. Methods for Flood Diversion Simulation of KS Detention

A hydrodynamic model was constructed based on DHI MIKE software 2014 to carry out a flood diversion simulation of KS Detention. The model adopts unstructured grids, mainly quadrilateral grids supplemented by triangular grids. The study area of the hydrodynamic model is approximately 340.39 km2, with the grid length ranging from 10 to 130 m. The model has a total of 50,794 grids, notably the grid near the sluice is densified. The hydrodynamic model of KS Detention is shown in Figure 7.
Without considering the influence of factors, such as tide, wind force, temperature, etc., several typical conditions to verify the discharge capacity of the hydrodynamic model are the various downstream water levels of gates which are 14.74 m, 15.74 m, 16.74 m, 17.74 m, 18.74 m, 19.35 m, 19.7 m, 20.0 m, and 20.3 m. Consistent with the physical model testing, the upstream boundary of the hydrodynamic model is given as the water level which is 20.68 m. The downstream boundary condition of the model is Land (zero normal velocity) due to the Xinrui and Kangshan embankments. The verification results are shown in Figure 8, below.
From Figure 8, it can be observed that the mean absolute error (MAE) of the flood diversion discharge under various conditions is 184.22 m3/s, the root mean square error (RMSE) is 205.68 m3/s, the coefficient of determination (R2) is 0.85, and the Nash–Sutcliffe efficiency coefficient (NSE) is 0.98. According to the “Hydrological Information and Forecasting Specification (GB/T 22482-2008)” [27], this model demonstrates certain feasibility and can accurately simulate the flood diversion of KS Detention.

2.3.3. Fuzzy Optimization Methods for Joint Flood Diversion Operation Schemes of Flood Diversion and Storage Measures

Flood control optimization scheduling poses a complex, multi-objective decision-making challenge. In the process of selecting and identifying the optimal scheme, there is no absolute distinction between its advantages and disadvantages. This process exhibits an intermediate transitional nature, embodying a fuzzy concept.
In this study, we applied the fuzzy optimization theory to develop a fuzzy optimization model for the joint operation schemes of SR Polders and KS Detention based on the methods and theories described in [28]. The process of solving the optimal scheme is as follows.
(1)
Calculating the relative superiority degree matrix of quantitative targets
The quantitative objectives were selected as the reduction in maximum water level at the Xingzi station (WL Reduction, ΔH), the duration of exceeding KS Detention OWL (EL Duration, T) and the total flood diversion volume (FD Volume, V).
Assuming there are m flood control targets and n scheduling schemes, the relative superiority degree (RSD) of the i-th target (i = 1, 2, 3, …, m) and j-th scheme (j = 1, 2, 3, …, n) is denoted as r i j . When calculating the RSD, it is necessary to first analyze whether the eigenvalue of quantitative target belongs to the “larger, better” type, “smaller, better” type, or “intermediate” type. Since the WL Reduction belongs to the “larger, better” quantitative target, the EL Duration belongs to the “smaller, better” quantitative target, and the FD Volume belongs to the “intermediate” quantitative target, Equations (3)–(5) are used to calculate their RSD.
r i j = x i j min j   x i j max j   x i j min j   x i j , j
r i j = max j   x i j x i j max j   x i j min j   x i j . . , j
r i j = 1 x i j x i max j   x i j x i , j
In the Equations, r i j represents the RSD of target i in scheme j; max j   x i j denotes the maximum eigenvalue of target i in the scheme set; min j   x i j indicates the minimum eigenvalue of target i in the scheme set; and x i signifies the intermediate optimal value of target i in the scheme set.
By calculating the RSD of each target under each scheme, the relative superiority degree matrix (RSDM, R ) for quantitative targets is obtained.
R = r 11 r 12 r 1 n r 21 r 22 r 2 n r m 1 r m 2 r m n = r i j
(2)
Determining the weights of quantitative targets
The determination of quantitative target weight typically involves a combination of subjective and objective methods. However, in practical applications, objective methods are often used to achieve satisfactory accuracy [17,18]. The process of objectively determining the target weight vector ( w ) begins by ranking the importance of each target in descending order. Next, the fuzzy linguistic modifier (FLM) is determined according to importance, and then the relative membership degree (RMD) is calculated by the FLM. The RMD is normalized to obtain the weight for each target.
w = w 1 , w 2 , , w m
In the Equation, w m represents the weight of the m-th quantitative target.
(3)
Solving the optimal relative membership degree matrix
The level of superiority or inferiority of the scheme is determined based on target eigenvalues, categorized into c levels ranging from superiority to inferiority. For any target, the standard value vector of RSD (s) for each level from level 1 to level c is shown in Equation (8).
s = 1 , c 2 c 1 , c 3 c 1 , , 0 = s h
In the Equation, h = 1, 2, 3, …, c.
After comparing the r1j, r2j, …, rmj of the m targets in scheme j with the s shown in Equation (8) one by one, it is found that the RMD of the m targets in scheme j fall within the adjacent level intervals [a1j, b1j], …, [amj, bmj]. Consequently, the upper limit bj and lower limit aj for scheme j are determined.
a j = min i   a i j b j = max i   b i j
In order to solve for the optimal relative membership degree (ORMD) of level h in scheme j ( u h j ), the objective function is established as Equation (10), shown below. Meanwhile, since the sum of u h j of each scheme is 1, the constraint is expressed by Equation (11), shown below.
min { F ( u h j ) = h = a j b j u h j 2 { i = 1 m [ w i j ( r i j - s h ) ] 2 } }
h = 1 c u h j = 1 , j
The Lagrange function L u h j , λ j is constructed according to Equation (10) and Equation (11), as shown in Equation (12), where λ j is the Lagrange multiplier. When Equation (12) takes a partial derivative of 0 for u h j and λ j , the u h j can be solved, as shown in Equation (13).
L u h j , λ j = h = a j b j u h j 2 d h j 2 λ j ( h = a j b j u h j 1 )
u h j = 0 ; h < a j   or   h > b j 1 k = a j b j i = 1 m w i r i j s h 2 i = 1 m w i r i j s k 2 1 ; d h j = 0 ; a j h b j , d h j 0
In the Equations, d h j = i = 1 m w i r i j s h 2 1 2 .
After calculating the u h j , the optimal relative membership degree matrix (ORMDM, U ) can be established.
U = u 11 u 12 u 1 n u 21 u 22 u 2 n u c 1 u c 2 u c n = u h j
In the Equation, h = 1, 2, 3, …, c; j = 1, 2, 3, …, n.
(4)
Selecting the optimal flood control operation scheme.
The vector expression of the level eigenvalue (H) is as follows:
H = 1 , 2 , , c u h j = H 1 , H 2 , , H n
Equation (15) can be used to optimize the scheme set, wherein the scheme corresponding to the smallest level eigenvalue H m i n   represents the optimal scheme.

2.3.4. Design of Flood Control Schemes and Calculation of Target Eigenvalues

(1)
Design of Flood Control Schemes
This study selected the 1998 flood from previous years of major floods, with the highest water level and relatively complete hydrological data at Hukou Station, as a typical case to carry out research on optimal operation of FDSM in Poyang Lake. The OWL of SR Polders-I and SR Polders-II as well as the KS Detention were changed. At the same time, the operation time of the KS Detention was limited to 48 h, and three schemes for the operation of Polders were set, denoted A, B, and C. There are three schemes for KS Detention, denoted I, II, and III, as shown in Table 2 and Table 3 below. After cross-combination, a total of 9 joint flood diversion schemes were obtained, as shown in Table 4 below.
(2)
Calculation of Target Eigenvalues
The quantitative target eigenvalues are solved utilizing the hydraulic model developed for SR Polders in Section 2.3.1 alongside the hydrodynamic models built for the KS Detention in Section 2.3.2. These calculations adhere to the schemes outlined in Table 2 and Table 3, simulating the flood diversion processes. The cumulative flood diversion volume changes are denoted V1—T for the Polder and V2—T for the Detention. Subsequently, with a time interval ΔT set at one hour, the incremental volumes ΔV1 and ΔV2 from the same period are summed to derive the cumulative flood diversion changes (V3—T), representing the joint operation of the Polders and Detention. Ultimately, adopting the water level-capacity relationship of Poyang Lake and the observed water level data (Z1—T) at Xingzi Station, the water level changes (Z2—T) at Xingzi Station, before the joint operation of the Polders and Detention, are meticulously calculated.
(a)
WL Reduction (ΔH)
Δ H   = Z 2 max T = T 0 Z 1 T = T 0
In the Equation, Z 2 max T = T 0 represents the maximum water level of Xingzi Station before the implementation of the Polders and Detention at time T = T0; and Z 1 T = T 0 represents the observed water level of Xingzi Station at time T = T0.
(b)
EL Duration (T)
The operation of the KS Detention corresponds to a water level of 22.50 m at Hukou Station. According to the correlation between the water level at Hukou Station and Xingzi Station, it can be inferred that the water level at Xingzi Station corresponds to 22.57 m at a water level of 22.50 m at Hukou Station [29]. Assuming that the water level before the implementation of the Polders and Detention at Xingzi Station is greater than 22.57 m from time T1 to time T2, then:
T = T 2   - T 1
(c)
FD Volume (V)
The FD Volume is the sum of the cumulative flood diversion volume of SR Polder and KS Detention, that is:
V = V 1 sum + V 2 sum

3. Results

3.1. Flood Diversion Simulation of Flood Diversion and Storage Measures Under Different Schemes

3.1.1. Analysis of SR Polders Flood Diversion Simulation

Based on the hydraulic model of SR Polders established in Section 2.3.1, 185 Polders were placed in the model using the observed water levels at various stations in 1998 as boundary conditions. The diversion conditions of each polder facility in the model are set to be controlled according to the water level, and the water level is determined based on the OWL in each scheme shown in Table 2 and the correlation between the water level of the reference station and the representative station. The results of changes in the flood diversion discharge (Q1T) and cumulative flood diversion volume (V1T) of schemes A, B, and C from July 19th to August 8th are shown in Figure 9 and Figure 10, respectively.
Analysis of Figure 9 and Figure 10 reveals that:
(1)
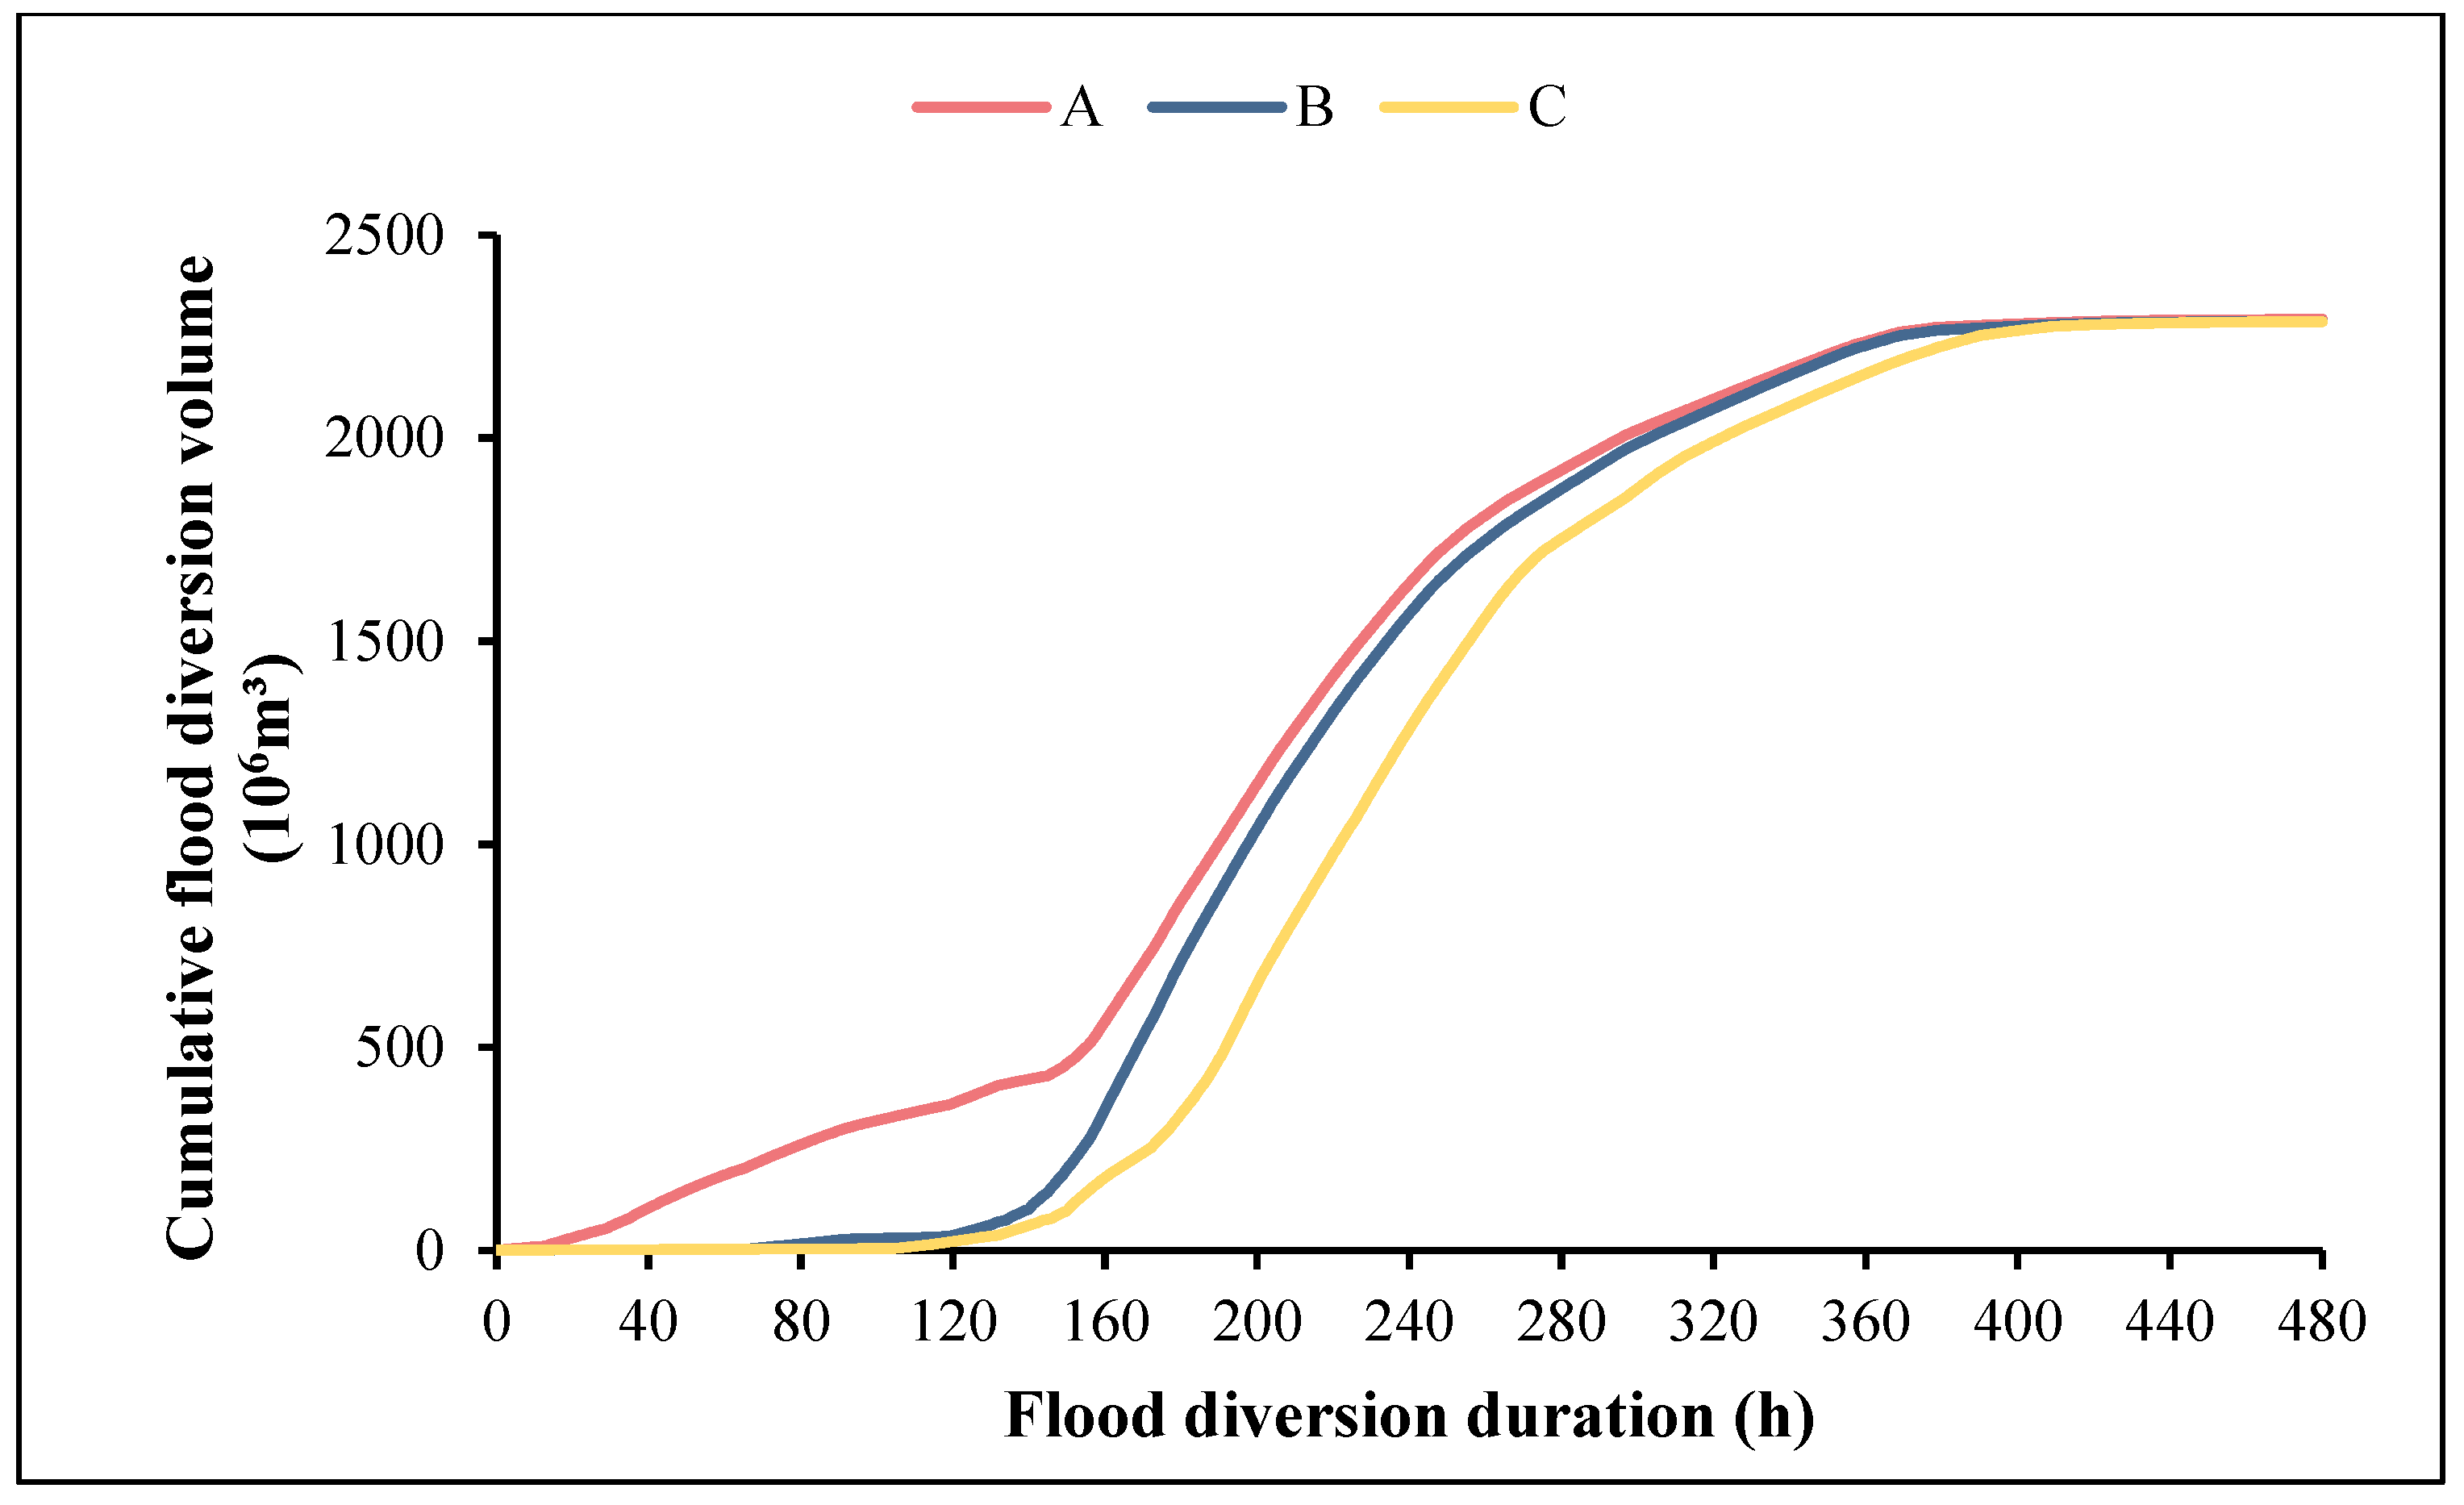
The rise in the OWL of the SR Polders has caused some Polders to fail to meet the flood diversion conditions during the flood diversion period, resulting in a decrease in the total flood volume. The total duration of the 1998 flood in the Poyang Lake area was 480 h (20 days), and the maximum diversion discharge for schemes A, B, and C were 4498 m3/s, 5392 m3/s, and 5358 m3/s, respectively. The total flood diversion volume was 2292.55 million m3, 2287.76 million m3, and 2287.13 million m3, respectively.
(2)
Raising the OWL of SR Polders-I has led to an increase in the maximum flood diversion discharge, but the main flood diversion period remains basically unchanged. Compared with scheme B, scheme A has increased the OWL of SR Polders-I by 1.0 m, while the OWL of SR Polders-II remains unchanged. The maximum diversion discharge of scheme B exceeds that of scheme A by 894 m3/s. Meanwhile, the main flood diversion periods for both are from 26 July to 29 July, during which the diversion volume accounts for 46.19% and 47.26% of the total flood volume, respectively. Raise the OWL of SR Polders-II, and the maximum flood diversion discharge remains basically unchanged, but the main flood diversion period is relatively lagging. Compared with scheme C, the OWL of SR Polders-I remains basically unchanged, with a difference of 0.15 m, while the OWL of SR Polders-II increases by 0.37 m. However, the maximum diversion discharge of the two only differs by 34 m3/s. At the same time, the main diversion period is from 27 July to 30 July, during which the diversion volume accounts for 48.53% of the total diversion volume.

3.1.2. Analysis of KS Detention Flood Diversion Simulation

According to the operation conditions of schemes I, II, and III, the observed water levels at Kangshan Station from 14:00 on 29 July to 14:00 on 31 July, 1:00 on 25 July to 1:00 on 27 July, and 0:00 on 19 July to 0:00 on 21 July were selected as the boundary conditions for the hydrodynamic model. Based on the model of the KS Detention established in Section 2.3.2, the flood diversion of three schemes was simulated, and the changes in flood diversion discharge (Q2-T) and cumulative flood diversion volume (V2-T) of schemes I, II, and III were obtained. The results are shown in Figure 11 and Figure 12.
Analysis of Figure 11 and Figure 12 shows that:
(1)
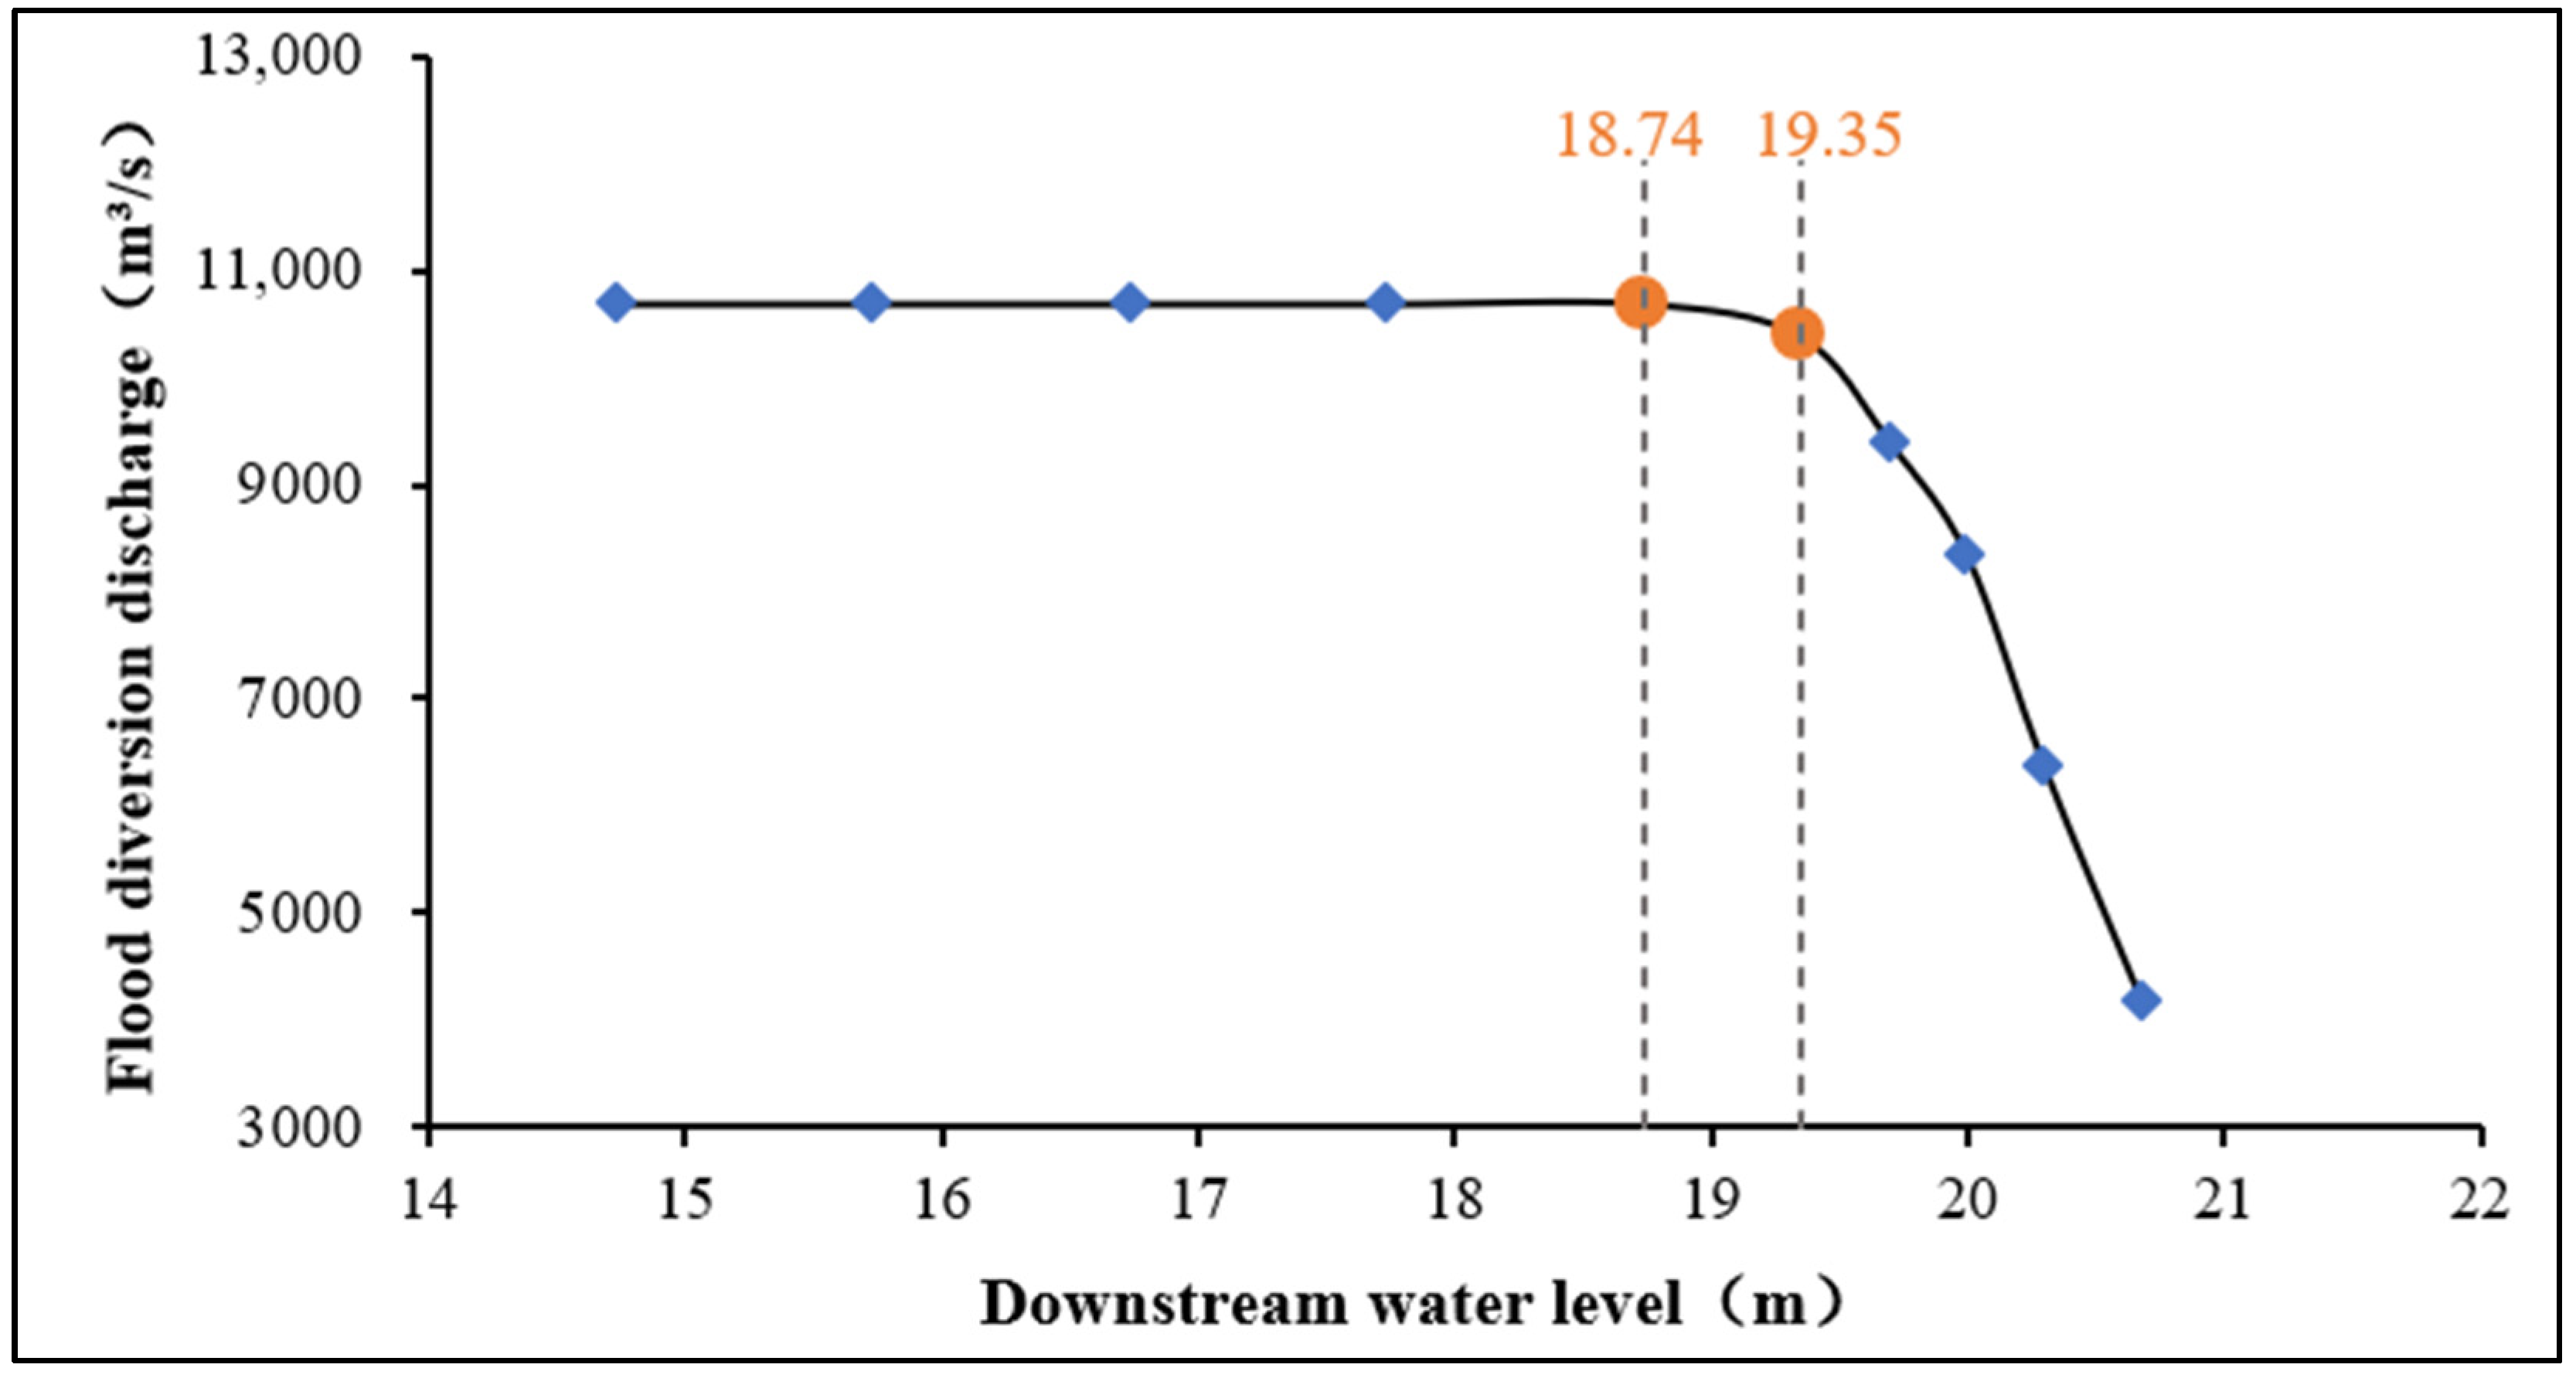
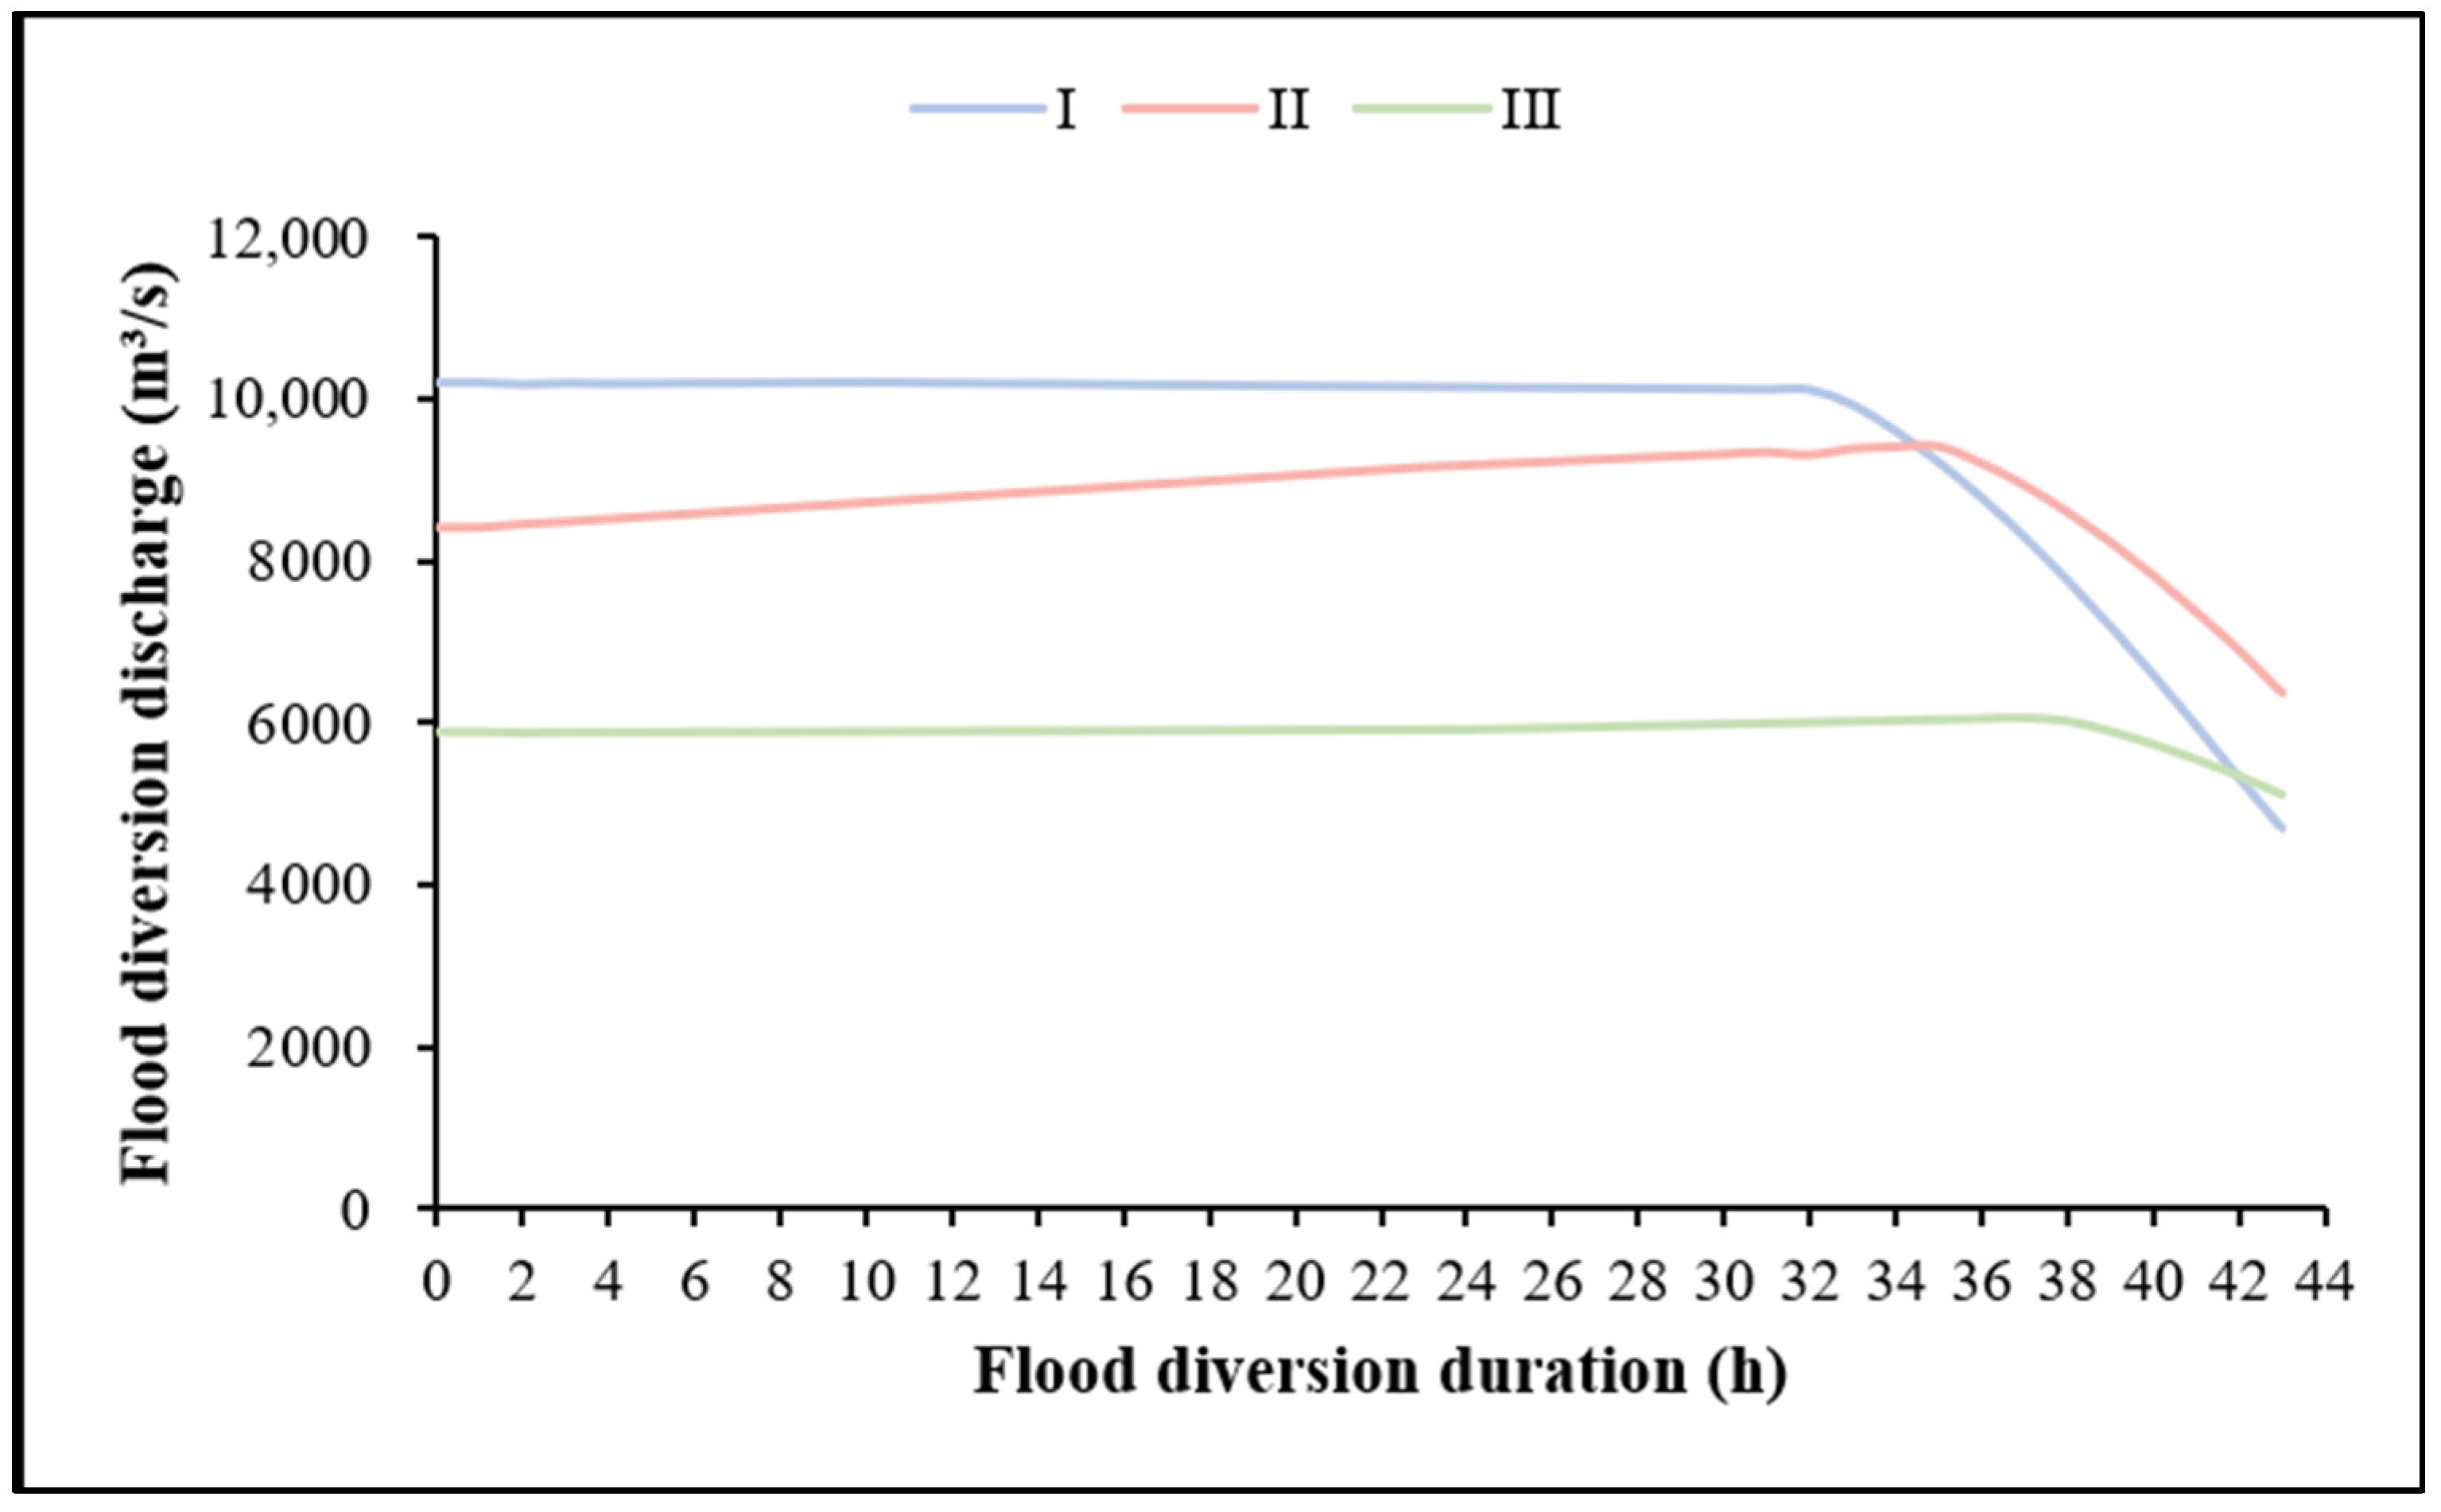
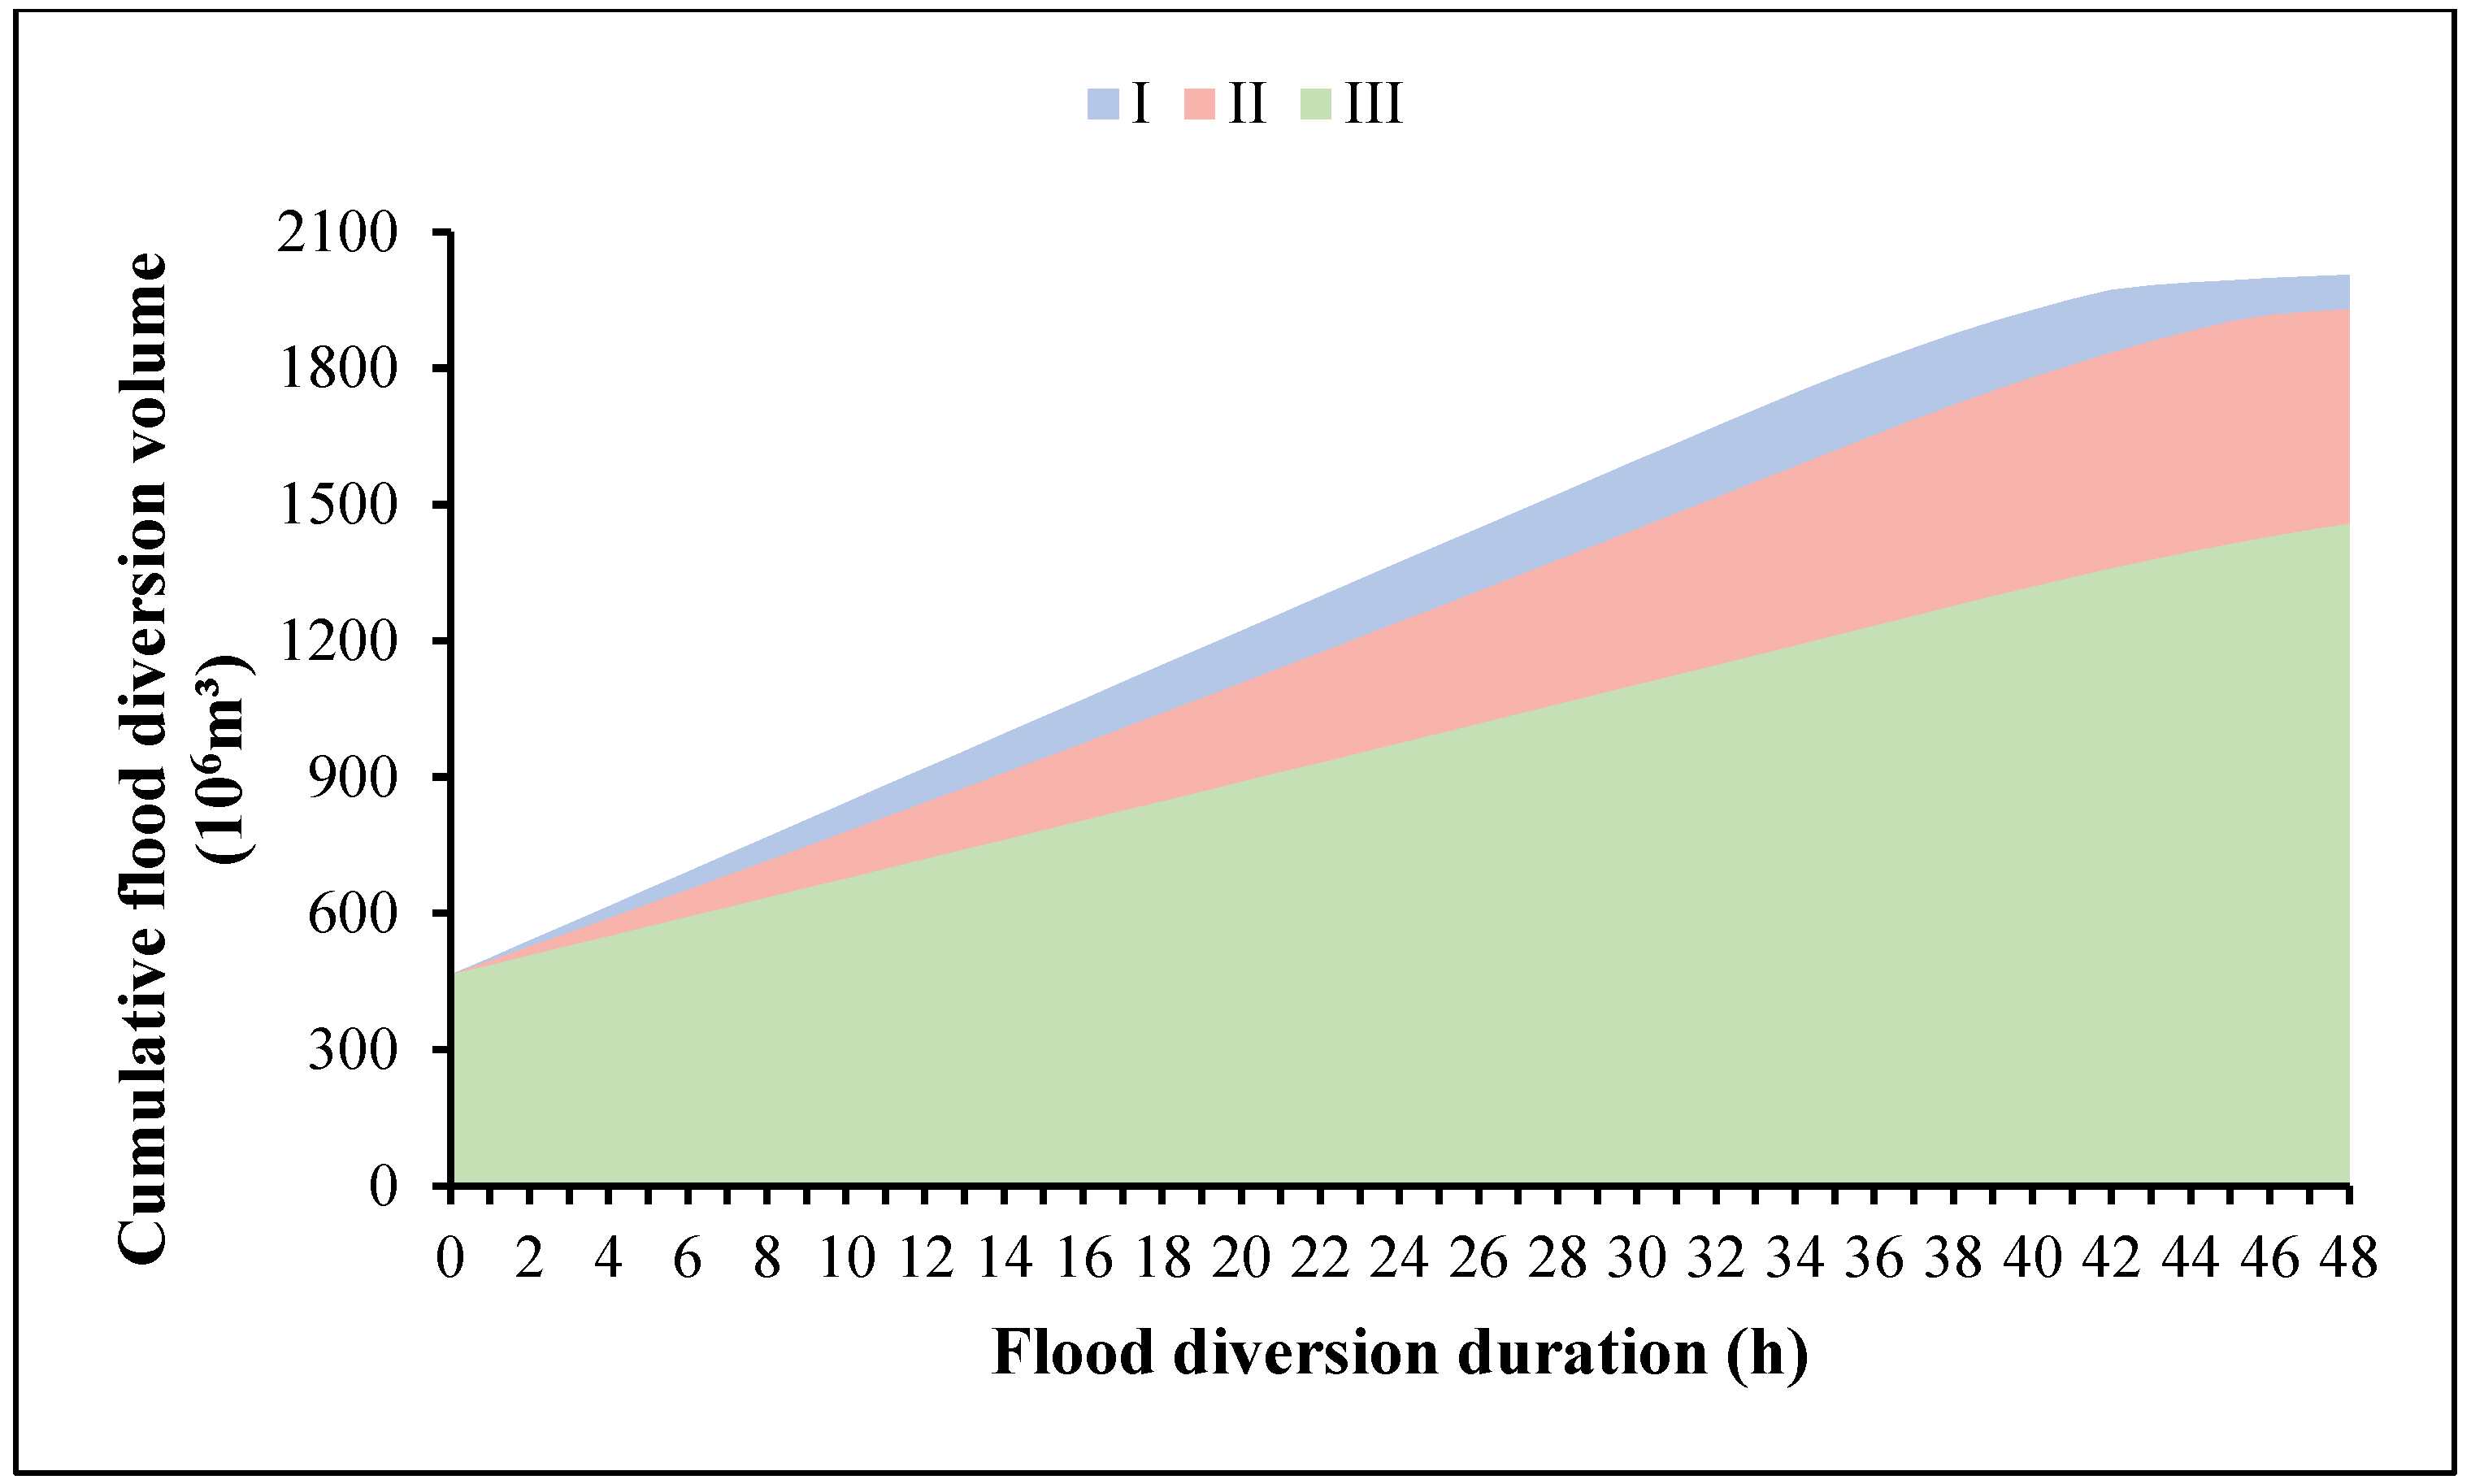
In the early stage of flood diversion, due to the small change in water level at Kangshan Station during the diversion periods of scheme I and scheme III, with a variation of less than 0.04 m, the flood diversion discharge remained basically unchanged. During the flood diversion period of scheme II, the water level at Kangshan Station rose from 19.74 m to 20.19 m, an increase of 0.45 m, and its flood diversion discharge showed a gradual upward trend. In the later stage of flood diversion, due to the rise in downstream water level, the flow pattern gradually varies from free flow to submerged flow under the three schemes, and its discharge capacity gradually decreases.
(2)
Higher flood diversion levels correspond to greater discharge capacities. Comparing schemes I, II, and III, when the flood diversion levels are 20.52 m, 20.19 m, and 18.64 m, the corresponding diversion discharges are 10,193 m3/s, 9411 m3/s, and 6062 m3/s, respectively. In the early stage of flood diversion, the duration of flood diversion under each scheme is approximately linearly increasing with the cumulative flood diversion volume, and the higher the flood diversion water level, the more flood diversion volume will be in the same period; In the later stage of flood diversion, as the downstream water level gradually rises, the upward trend of flood volume gradually slows down. After about 43 h of flood diversion in scheme I, the flood storage capacity of the KS Detention approaches its limit which is to store 2.07 billion m3 of floods.

3.2. Fuzzy Optimization for Joint Flood Diversion Operation Scheme of Flood Diversion and Storage Measures

3.2.1. Calculation of the RSDM of Quantitative Targets

According to Table 4, the simulated results in Section 3.1, and the method described in Section 2.3.4 was used to obtain the water level of Xingzi Station before the implementation of the Polders and Detention for different schemes, as shown in Figure 13. The eigenvalues of quantitative targets for different schemes are shown in Table 5.
By analyzing and comparing the results of each scheme in Figure 13 and Table 5, it can be concluded that:
(1)
Raising the OWL of SR Polders, due to the observed water level outside the Polder being lower than OWL, some Polders have not been used, resulting in a smaller FD Volume. The total flood volume of scheme 1 exceeds that of scheme 4 and scheme 7 by 10,479 and 105.42 million m3, respectively. Compared with scheme 4, scheme 7 has a similar total flood volume, with a reduction of 630,000 m3. After comparative analysis, the main reason is the insufficient flood diversion of Lixin Polder and Longtan Polder belonging to SR Polders-II and Zhangshan Polder belonging to SR Polders-I.
(2)
Raising the OWL of SR Polders will reduce EL Duration. Among them, scheme 4 and scheme 7 reduced the time by 3 h and 15 h, respectively, compared to scheme 1; scheme 5 and scheme 8 reduced the time by 2 h and 6 h, respectively, compared to scheme 2; and scheme 6 and scheme 9 reduced the time by 4 h and 12 h, respectively, compared to scheme 3.
(3)
When the OWL of the KS Detention is the same, the WL reduction in different schemes are relatively close, and scheme 4 has the best flood diversion effect. Comparing the different schemes, such as scheme 1 and scheme 4 or scheme 2 and scheme 5, it can be seen that the OWL of SR Polders-I is relatively low.
According to the results in Table 5, convert it into a quantitative target eigenvalue matrix (X) as follows:
X = 1.128 1.105 0.963 1.134 1.110 0.971 1.118 1.094 0.956 285 306 308 282 304 304 270 300 296 393 , 367 375 , 755 328 , 546 382 , 888 375 , 276 328 , 067 382 , 825 375 , 213 328 , 004
Convert the quantitative target eigenvalue matrix ( X ) into the RSDM ( R ) as follows:
R = 0.966 0.837 0.039 1.000 0.865 0.084 0.910 0.775 0.000 0.605 0.053 0.000 0.684 0.105 0.105 1.000 0.211 0.316 0.150 0.648 0.015 0.446 0.662 0.002 0.448 0.664 0.000

3.2.2. Determination of the Weight of Quantitative Targets

Qualitative analysis has led to the ranking of the importance of each quantitative target in descending order: WL Reduction, EL Duration, and FD Volume. After the calculation by adopting the method in Section 2.3.3, the final weight of each target is shown in Table 6.

3.2.3. Solution of the ORMDM

To improve the accuracy of the optimal selection decision, the membership degree is set to level 5, that is, c = 5. Therefore, according to Equation (8), the standard value vector of the RSD (s) is:
s = 1 , 0.75 , 0.50 , 0.25 , 0
According to R, s, and Equation (9), the values of aj and bj for each scheme can be obtained. Meanwhile, by using Table 6 and applying Equation (13), the uhj is obtained, and finally transformed into the U as shown below:
U = 0.181 0.125 0 0.253 0.135 0 0.341 0.108 0 0.349 0.253 0 0.485 0.277 0 0.454 0.280 0 0.277 0.332 0 0.189 0.328 0 0.146 0.387 0.092 0.129 0.194 0.015 0.073 0.175 0.174 0.059 0.158 0.379 0.064 0.096 0.985 0 0.085 0.826 0 0.067 0.529

3.2.4. Optimal Selection of Flood Control Schemes

Apply Equation (15) to solve the H, and the result is as follows:
H = ( 1 ,   2 ,   3 ,   4 ,   5 ) ( u h j ) = ( 2.549 ,   2.882 ,   4.985 ,   2.082 ,   2.799 ,   4.826 ,   1.924 ,   2.797 ,   4.438 )
According to Table 7, comparing the H j under different schemes, it can be concluded that:
(1)
The higher the OWL of KS detention, the better the scheme. Comparing schemes 1, 2, and 3, it can be seen that the OWL of the KS detention is scheme 1 > scheme 2 > scheme 3. The superiority of schemes is scheme 1 > scheme 2 > scheme 3.
(2)
The higher the OWL of SR Polders-I, the better the scheme. Comparing scheme 1 and scheme 4, it can be seen that the OWL of SR Polders-I is scheme 4 > scheme 1, and the superiority of schemes is scheme 4 > scheme 1.
(3)
When the OWL of KS detention exceeds 21.68 m, raising the OWL of SR Polders-II has a limited effect on optimizing the scheme. The H j of scheme 8 is only 0.002 smaller than scheme 5. When the OWL is below 21.68 m, increasing the OWL significantly enhances the superiority of the scheme. Comparing scheme 6 with scheme 9, it can be seen that the H j of scheme 9 is 0.388 smaller than that of scheme 6.
(4)
According to the principle of the H min , representing the optimal scheme, the optimal joint flood diversion strategy for Poyang Lake involves operating SR Polders-I at a Hukou water level of 21.65 m, operating SR Polders-I at a Hukou water level of 22.05 m, and operating the KS Detention at a Hukou water level of 22.50 m.

4. Discussion

(1)
A comprehensive approach to flood control through the strategic deployment of FDSM, coupled with the meticulous timing of flood diversion, is imperative to safeguard the flood control security of lakeside areas. The current water levels for operating the SR Polders in Poyang Lake are deemed lower. Building upon the work of Fu Chun [17] and Wen Tianfu [18], who employed fuzzy optimization theory to identify the optimal operation strategy for SR Polders, a consensus emerges that an appropriate raising of the OWL for Polders is justified. Our research corroborates this finding. As delineated in Table 7, a comparative analysis of schemes 1, 4, and 7 reveals that, under identical conditions, an appropriate raising of the OWL for SR Polders-I correlates positively with the superiority of the scheme. Notably, basing our investigation into the optimized flood control operation of SR Polders, we conducted a nuanced analysis of the OWL for joint flood diversion involving SR Polders and the KS Detention. The results underscore a direct correlation; as the OWL for the KS Detention incrementally decreases across schemes 1, 2, and 3, the superiority of the respective schemes progressively diminishes, highlighting a positive correlation between the OWL of the KS Detention and the superiority of schemes.
(2)
As an integral component of flood control engineering systems, FDSM such as SR Polders and FS Detentions play a vital role in alleviating the flood control pressures on rivers and lakes, as well as safeguarding people’s lives and property. It is of paramount importance to enhance the construction of flood control engineering systems and implement effective management and operational mechanisms. Since Jiangxi Province initiated the embankment area project of “leveling embankments for flood diversion and returning farmland to lakes” in 2003, many flood diversion facilities have, over the years of operation, suffered from aging, disrepair, or partial damage. The absence of a routine operation and management mechanism for Polders has prevented timely maintenance, leading to a diminished actual flood diversion capacity. In recent years, to effectively bolster the overall flood control capabilities of lakeside areas, Jiangxi Province issued the “Overall Plan for the Safety of Poyang Lake and the Well-being of Its People” in 2021, which mandates the coordinated implementation of embankment reinforcement to eliminate hazards and upgrade quality, strengthening the capacity for flood diversion and storage, and forming a scientific and rational spatial layout of flood storage and detention areas to achieve modernization in water governance systems and capabilities. In May 2023, the Jiangxi Provincial Water Resources Department progressively advanced construction projects and the reinforcement and improvement of flood inlet facilities for the Kangshan, Zhuhu, Huanghu, and Fangzhouxietang FS Detentions. The research findings presented in this paper provide technical methodologies and support for the optimization and scheduling of joint flood diversion operations across multiple FDSM, offering promising application prospects.
(3)
Poyang Lake in China is a large plain lake, and there are many lakes in the world that also belong to this type, such as Amazon floodplain lakes [30], Tonle Sap Lake in Southeast Asia [31], and Winnipeg Lake in North America [32]. Due to their unique geographical features, these lakes are unable to construct water conservancy hubs to effectively regulate floods, resulting in relatively limited flood control measures. Therefore, the construction of flood diversion and storage areas, including polders and flood storage and detention areas, has become an important measure to make up for this deficiency. The research on flood diversion of polders and flood storage and detention areas conducted in this paper not only has important guiding significance for flood control management of lakes with similar characteristics, but also provides useful references for the joint operation of flood diversion and storage areas in other regions around the world.
(4)
The limitations of this paper and potential research directions in the future are as follows. (a) This study investigated the joint operation of flood diversion with the KS Detention at operation water levels of 22.50 m, 21.68 m, and 20.50 m, alongside SR Polders, through the establishment of nine distinct schemes. Schemes involving water levels higher than 22.50 m were not considered. (b) With the gradual escalation of environmental protection awareness, it has become imperative to incorporate ecological benefits as a flood control target in the optimization of flood management. (c) Based on the constructed hydraulic model for SR Polders and hydrodynamic model for KS Detention, an innovative joint flood diversion simulation system for the SR Polders and FS Detentions of Poyang Lake, integrating big data analysis and artificial intelligence technology, is expected to be developed. The system will utilize the hydrological variables provided by the flood forecasting system as the model boundary conditions and formulate multiple schemes to simulate the actual application of flood diversion measures. Subsequently, through the powerful analytical capabilities of artificial intelligence technology, the simulation results of each scheme will be deeply mined and compared using big data, providing solid data support and intelligent assistance for scientific decision-making and optimization scheduling.

5. Conclusions

Addressing the issue of optimal strategies for joint flood diversion of FDSM, this study focuses on the SR Polders and the KS Detention of Poyang Lake. A hydraulic model for the SR Polders and a hydrodynamic model for the KS Detention were established to carry out flood simulation. Using the 1998 flood as a typical case, flood diversion simulations of it were conducted under various operational schemes. Furthermore, based on fuzzy optimization theory, the joint flood diversion operational schemes for the SR Polders and the KS Detention were optimized. Lastly, the timing of flood diversion for the FDSM, as well as management and operational issues, were discussed alongside the limitations of this study. The primary conclusions are as follows:
(1)
Altering the operation criteria for FDSM influences both the maximum diversion discharge and the timing of the main diversion period. For the SR Polders, under the current flood control scheme, raising the OWL of SR Polders-I by 1.0 m increases the maximum diversion discharge by 894 m3/s, but the main flood diversion period remains basically unchanged, from 26 July to 29 July. Additionally, raising the OWL of SR Polders-II by 0.37 m delays the main diversion period by one day, shifting it from 27 July to 30 July, but the maximum diversion discharge remains basically unchanged. For the KS Detention, higher flood diversion levels correspond to greater discharge capacities. Specifically, when the flood diversion levels are 20.52 m, 20.19 m, and 18.64 m, the corresponding diversion discharges are 10,193 m3/s, 9411 m3/s, and 6062 m3/s, respectively.
(2)
Establishing scientifically reasonable operation criteria is a crucial aspect of optimal flood control operation for FDSM. A set of operation criteria that not only meet the requirements of flood control safety but also take into account economic and social development is of great significance for maximizing the benefits of flood control and disaster reduction. Building on the prior research on SR Polders conducted by other scholars, this study further analyzed using fuzzy optimization theory and determined that the optimal joint flood diversion operational scheme for the SR Polders and the KS Detention of Poyang Lake is as follows: operating SR Polders-I at a Hukou water level of 21.65 m, operating SR Polders-II at a Hukou water level of 22.05 m, and operating the KS Detention at a Hukou water level of 22.50 m.
(3)
Strengthening the construction of flood control engineering systems and implementing efficient management and operational mechanisms are essential steps. Typical FDSM, such as Polders and FS Detentions, play a crucial role in alleviating the flood control pressure on rivers and lakes and protecting people’s lives and property. Through scientific planning and coordinated arrangement of FDSM to regulate and store floods, supplemented by rigorous monitoring, early warning, and emergency scheduling mechanisms, the overall effectiveness of the flood control system can be significantly enhanced. This ensures rapid response and effective management in the face of flood challenges, minimizing disaster losses to the greatest extent possible.

Author Contributions

Writing—original draft preparation, S.D., T.W. and Y.L.; writing—review and editing, Z.W. and L.W.; supervision, Z.W.; funding acquisition, Z.W. and Y.X. All authors have read and agreed to the published version of the manuscript.

Funding

This research was funded by the National Key R&D Program of China (Grant No. 2023YFC3209005), the Jiangxi Province Key R&D Program Projects (Grant No. 20203BBGL73224), the Major Science and Technology Program of the Ministry of Water Resources of China (Grant No. SKS-2022010), the Science and Technology Project of the Water Resources Department of Jiangxi Province (Grant No. 202124ZDKT02), and the CRSRI Open Research Program (Grant No. CKWV2021865/KY).

Data Availability Statement

All data of the model used in this research can be requested from the corresponding author through the indicated e-mail.

Conflicts of Interest

The authors declare no conflicts of interest.

Abbreviations

The following abbreviations are used in this manuscript:
FDSMFlood diversion and storage measures
SR PoldersSemi-restoration polder areas
SR Polders-ISR Polders with less than 6.67 km2 of crop cultivation
SR Polders-IISR Polders with more than 6.67 km2 of crop cultivation
FS DetentionsFlood storage and detention areas
KS DetentionKangshan flood storage and detention area
OWLOperation water level
WWLWarning water level
WL ReductionReduction in maximum water level at the Xingzi Station
EL DurationDuration of exceeding KS Detention OWL
FD VolumeTotal flood diversion volume
RSDRelative superiority degree
RSDMRelative superiority degree matrix
RMDRelative membership degree
ORMDOptimal relative membership degree
ORMDMOptimal relative membership degree matrix

References

  1. Alfieri, L.; Burek, P.; Feyen, L.; Forzieri, G. Global warming increases the frequency of river floods in Europe. Hydrol. Earth Syst. Sci. 2015, 19, 2247–2260. [Google Scholar] [CrossRef]
  2. Gu, L.; Chen, J.; Yin, J.; Slater, L.J.; Wang, H.; Guo, Q.; Feng, M.; Qin, H.; Zhao, T. Global increases in compound flood-hot extreme hazards under climate warming. Geophys. Res. Lett. 2022, 49, e2022GL097726. [Google Scholar] [CrossRef]
  3. Devitt, L.; Neal, J.; Coxon, G.; Savage, J.; Wagener, T. Flood hazard potential reveals global floodplain settlement patterns. Nat. Commun. 2023, 14, 2801. [Google Scholar] [CrossRef]
  4. Chen, J.; Shi, X.; Gu, L.; Wu, G.; Su, T.; Wang, H.; Kim, J.; Zhang, L.; Xiong, L. Impacts of climate warming on global floods and their implication to current flood defense standards. J. Hydrol. 2023, 618, 129236. [Google Scholar] [CrossRef]
  5. Tang, Z.; Wang, P.; Li, Y.; Sheng, Y.; Wang, B.; Popovych, N.; Hu, T. Contributions of climate change and urbanization to urban flood hazard changes in China’s 293 major cities since 1980. J. Environ. Manag. 2024, 353, 120113. [Google Scholar] [CrossRef]
  6. Luu, C.; Von Meding, J.; Kanjanabootra, S. Assessing flood hazard using flood marks and analytic hierarchy process approach: A case study for the 2013 flood event in Quang Nam, Vietnam. Nat. Hazards 2018, 90, 1031–1050. [Google Scholar] [CrossRef]
  7. Alobid, M.; Chellai, F.; Szűcs, I. Trends and Drivers of Flood Occurrence in Germany: A Time Series Analysis of Temperature, Precipitation, and River Discharge. Water 2024, 16, 2589. [Google Scholar] [CrossRef]
  8. Nanditha, J.S.; Kushwaha, A.P.; Singh, R.; Malik, I.; Solanki, H.; Chuphal, D.S.; Dangar, S.; Mahto, S.S.; Vegad, U.; Mishra, V. The Pakistan flood of August 2022: Causes and implications. Earth’s Future 2023, 11, e2022EF003230. [Google Scholar] [CrossRef]
  9. Li, X.; Zhang, Q.; Xu, C.Y.; Ye, X. The changing patterns of floods in Poyang Lake, China: Characteristics and explanations. Nat. Hazards 2015, 76, 651–666. [Google Scholar] [CrossRef]
  10. Deng, S.; Wu, Q.; Wang, Z.; Wu, L.; Huang, Z.; Zhang, G. Investigating Flood Characteristics and Mitigation Measures in Plain-Type River-Connected Lakes: A Case Study of Poyang Lake. Water 2024, 16, 281. [Google Scholar] [CrossRef]
  11. Yifeng County People’s Government. Available online: http://www.jxyf.gov.cn/yfxrmzf/zwdtb4/202107/7541b0ccc36f4bc6b36ccccbfe51921d.shtml (accessed on 6 February 2025).
  12. Lei, S. Review and reflection on Poyang Lake flood in 2020. Water Resour. Prot. 2021, 37, 7–12. [Google Scholar] [CrossRef]
  13. Min, Q. On the Restoring Lake by Stopping Cultivation to Poyang Lake and Its Impacts on Flood Mitigation. J. Lake Sci. 2004, 215–222. Available online: https://kns.cnki.net/kcms2/article/abstract?v=WStw-Pbchoz-RSVgfgS6D2YYG8ROs8RUnm3gV1y4o_iBPdZ099zZxb0_NF-qDXFCHTQmWTs6NDst8y2mVw3tKBr-DIWkOarEMQepBJ8Z7npQcJ8qAPRGdb0kyv_DLbNF9aMUtzxmRcF1h7tnBqOHtu9TztL14esaQLI3rm5_sQPbEjEmajZRy1BPudklWNpx&uniplatform=NZKPT&language=CHS (accessed on 11 February 2025).
  14. Jiang, L. Flood risk and new land use changes in Poyang Lake after returning farmland to the lake. Yangtze River 2009, 40, 8–10. [Google Scholar]
  15. Ma, Q.; Liu, J.; Lu, C. Analysis of effect of resident moved-out polder in the Poyang Lake Area in 2020 and some thoughts on flood control. Express Water Resour. Hydropower Inf. 2021, 42, 39–42. [Google Scholar] [CrossRef]
  16. Wan, Z.; Lei, S.; Wen, T.; Jia, L.; Niu, J. Simulation and analysis of flood routing in Lianbei Protective Dikes of Poyang Lake under active flood diversion situation. China Flood Drought Manag. 2024, 34, 27–31. Available online: https://link.cnki.net/doi/10.16867/j.issn.1673-9264.2023315 (accessed on 11 February 2025).
  17. Fu, C.; Yang, H. Optimized Scheduling of Semi-restoration polder areas Flood Control in Poyang Lake. Yangtze River 2009, 40, 9–11. [Google Scholar] [CrossRef]
  18. Wen, T.; Lei, S.; Niu, J.; Jia, L.; Yuan, X.; Wang, Z.; Zhang, L.; Xiong, B.; Zhang, Y. Effects of flood diversion and scheme selection of Lake Poyang semi-restoration polder in 2020. J. Lake Sci. 2024, 36, 1888–1902. Available online: https://link.cnki.net/urlid/32.1331.P.20240704.0903.002 (accessed on 11 February 2025).
  19. Jiang, S.; Huang, Z.; Huang, J.; Zhang, Y.; Jiang, X. Flood evolution simulation in flood storage and detention area and evaluation methods for the dike-break losses. J. Water Resour. Water Eng. 2020, 31, 131–139+145. Available online: https://link.cnki.net/urlid/61.1413.TV.20200120.1114.006 (accessed on 11 February 2025).
  20. Chen, Y.; Zhang, T.; Tong, B.; Xu, Y. Construction and application of river-lake-flood detention basin aggregation flood routing model. Yangtze River 2024, 55, 60–65+70. Available online: https://link.cnki.net/doi/10.16232/j.cnki.1001-4179.2024.09.008 (accessed on 11 February 2025).
  21. Zou, J.; Wen, T.; Gu, P.; Li, G.; Lei, S.; Wang, Z.; Liu, X.; Yan, Y. Study application of Joint Flood Diversion of Semi-restoration polder and Detention and retention areas under Super Standard Flood of 2020 in Poyang Lake. Adv. Sci. Technol. Water Resour. 2024, 1–16. Available online: http://kns.cnki.net/kcms/detail/32.1439.TV.20240716.0930.002.html (accessed on 11 February 2025).
  22. Gan, Z.; Liu, Z.; Xu, X.; Zhang, K. Analysis on the evolution characteristics of flood elements in Xingzi station of Poyang Lake. Jiangxi Hydraul. Sci. Technol. 2022, 4, 79–86+92. Available online: https://kns.cnki.net/kcms2/article/abstract?v=JtACmXrF271fXvA5ePHvzDU3mnUvBjCZrnr5GWOtTpBKMGXZuLQ-k9fnNSe3zUaUXegYbUArDK_S9RsvPvlK4fTLy2hDAJRalU4gCJaETHDizWBSvSTmOUHgXKQ14P5xE3Q-zszbF7Fa9bBZB-aPAJhz0U4QvOLJdxy031iG_mavktn1OkqEyJnZTiOYYgnVEXfE6JdnqUI=&uniplatform=NZKPT&language=CHS (accessed on 11 February 2025).
  23. Guo, H.; Hu, Q.; Jiang, T. Annual and seasonal streamflow responses to climate and land-cover changes in the Poyang Lake basin, China. J. Hydrol. 2008, 355, 106–122. [Google Scholar] [CrossRef]
  24. Lei, S.; Zhang, X.; Yuan, X.; Huang, P.; Sun, D. Practice and thinking of semi-restoration polder areas around Poyang Lake region. J. Hydraul. Eng. 2021, 52, 546–555. Available online: https://link.cnki.net/doi/10.13243/j.cnki.slxb.20200862CHS (accessed on 11 February 2025).
  25. Hua, Z. A calculating formula for spillway capacity of drowned wide crest weirs. J. Hohai Univ. 1998, 26, 99–103. Available online: https://kns.cnki.net/kcms2/article/abstract?v=2G5Y6l-6Cy9EiaNKUEq2gvnytbf0dJbtziKo6sTVoae4O0pkV2xFc6ktM9Wju_Svl8QG3cZODocmAvus5LNnpnms5FoPylAssOjeY29oIQOWXi2dAL4w3yEkcL7KHY1ru0GUDH517aZf7XnW95bncsia22TuIFV6-0z_I2tnlh-qx06f-gq0RUtuzL7pQwiC&uniplatform=NZKPT&language=CHS (accessed on 11 February 2025).
  26. Yang, M. Study on Comparison of Chinese and American Hydrology and Hydraulics for Culvert Design Method. Master’s Thesis, Southeast University, Nanjing, China, 2020. Available online: https://link.cnki.net/doi/10.27014/d.cnki.gdnau.2020.001379 (accessed on 11 February 2025).
  27. National Standard Full Text Publication System (NSLTPS). Available online: https://openstd.samr.gov.cn/bzgk/gb/newGbInfo?hcno=9A1A51DA9FAD3B785C239A1FC2C5CAF3 (accessed on 17 September 2024).
  28. Chen, S. Multi-objective Decision Making Theory and Model for Flood control Operation. Strateg. Study CAE 2000, 4, 49–54. Available online: https://kns.cnki.net/kcms2/article/abstract?v=WStw-PbchowShdb1nNkrrYUuCMQQytPO7uyCDmwtD-VJvIagQY7lKm1iY1q4CejEoAYi2d6-GkpSca0ThOj231cRBGPc9lwk0ODdVIa_Jc2LaxoGb1Qxi3wCgx6g4qAUX59gjMZR5Ty2nihs5HgG91qDY-r5tQTFoolkzSX5GG1QyoxJNcmQX0sjAD8L53w2&uniplatform=NZKPT&language=CHS (accessed on 11 February 2025).
  29. Li, G.; Yu, Z.; Chen, J. Study on the relationship between dynamic level-area and level-volume of Poyang Lake. Jiangxi Hydraul. Sci. Technol. 2015, 41, 21–26. [Google Scholar] [CrossRef]
  30. Lesack, L.F.; Melack, J.M. Flooding Hydrology and Mixture Dynamics of Lake Water Derived from Multiple Sources in an Amazon Floodplain Lake. Water Resour. Res. 1995, 31, 329–345. [Google Scholar] [CrossRef]
  31. Kummu, M.; Tes, S.; Yin, S.; Adamson, P.; Jozsa, J.; Koponen, J.; Richey, J.; Sarkkula, J. Water Balance Analysis for the Tonle Sap Lake-Floodplain System. Hydrol. Process. 2014, 28, 1722–1733. [Google Scholar] [CrossRef]
  32. George, S. Streamflow in the Winnipeg River basin, Canada: Trends, extremes and climate linkages. J. Hydrol. 2006, 332, 96–411. [Google Scholar] [CrossRef]
Figure 1. Geographic location of Poyang Lake and relevant hydrological stations [10].
Sustainability 17 01522 g001
Figure 2. The Zenglong SR Polder located in Zenglong Village, Jiangyi Town, Gongqingcheng County, Jiujiang City, Jiangxi Province.
Sustainability 17 01522 g002
Figure 3. Statistics of flood diversion facilities of SR Polders in three cities.
Sustainability 17 01522 g003
Figure 4. The physical model of flood diversion gates of KS Detention [10].
Sustainability 17 01522 g004
Figure 5. The model testing results about the downstream water level and the flood diversion discharge with the 28 gates fully opened, where orange points indicate test results under two notable conditions.
Sustainability 17 01522 g005
Figure 6. The flood diversion calculation process of hydraulic model for SR Polders.
Sustainability 17 01522 g006
Figure 7. The hydrodynamic model of KS Detention [10].
Sustainability 17 01522 g007
Figure 8. The experimental and simulated values of flood diversion discharge under different downstream water levels.
Sustainability 17 01522 g008
Figure 9. The changes in flood diversion discharge of SR Polders in different schemes.
Sustainability 17 01522 g009
Figure 10. The changes in cumulative flood diversion volume of SR Polders in different schemes.
Sustainability 17 01522 g010
Figure 11. The changes in flood diversion discharge of KS Detention in different schemes.
Sustainability 17 01522 g011
Figure 12. The changes in cumulative flood diversion volume of KS Detention in different schemes.
Sustainability 17 01522 g012
Figure 13. The water level of Xingzi Station before the implementation of the SR Polders and KS Detention for different schemes.
Sustainability 17 01522 g013
Table 1. The comparison between the flood diversion survey results and simulation results of SR Polders in the 2020 flood.
NameTypeDate of OperationFlood
Diversion Duration (h)
Cumulative Diversion
Volume
(108 m3)
The Absolute Value of Relative Errors (%)
Gate, WeirBreachesDiversion DurationDiversion Volume
Nanbei Port PolderSurvey results9 July-2161.781.851.12
Simulated results9 July-2201.76
Shuilanzhou PolderSurvey results9 July-820.257.320
Simulated results9 July-760.25
Lianbei PolderSurvey results9 July10 July, 12 July602.923.330.34
Simulated results9 July10 July, 12 July582.91
Liannan PolderSurvey results10 July11 July600.963.331.04
Simulated results10 July11 July580.95
Table 2. Flood diversion operation schemes of SR Polders.
Scheme NameHukou Water Level of Operating SR Polders/m
SR Polders-ISR Polders-II
A20.5021.68
B21.5021.68
C21.6522.05
Table 3. Flood diversion operation schemes of KS Detention.
Scheme NameHukou Water Level of Operating KS
Detention/m
I22.50
II21.68
III20.50
Table 4. Joint flood diversion operation schemes of SR Polders and KS Detention.
Scheme NameHukou Water Level of Operating SR
Polders/m
Hukou Water Level of Operating KS
Detention/m
SR Polders-ISR Polders-II
120.5021.6822.50
220.5021.6821.68
320.5021.6820.50
421.5021.6822.50
521.5021.6821.68
621.5021.6820.50
721.6522.0522.50
821.6522.0521.68
921.6522.0520.50
Table 5. The eigenvalues of quantitative targets for different schemes.
Scheme NameWL Reduction (m)EL Duration (h)FD Volume (104 m³)
11.128285393,367
21.105306375,755
30.963308328,546
41.134282382,888
51.110304375,276
60.971304328,067
71.118270382,825
81.094300375,213
90.956296328,004
Table 6. The final weight of each quantitative target.
Quantitative TargetRMDFinal Weight
WL Reduction10.402
EL Duration0.8180.329
FD Volume0.6670.269
Table 7. The H j and optimal sequence of each scheme.
Scheme Name123456789
H j 2.4592.8824.9852.0822.7994.8261.9242.7974.438
Optimal sequence369258147
Disclaimer/Publisher’s Note: The statements, opinions and data contained in all publications are solely those of the individual author(s) and contributor(s) and not of MDPI and/or the editor(s). MDPI and/or the editor(s) disclaim responsibility for any injury to people or property resulting from any ideas, methods, instructions or products referred to in the content.

