Abstract
The increasing frequency of extreme weather events such as typhoons and heavy rains, driven by climate change, has intensified debris flow risks during Korea’s monsoon season, causing considerable human and economic losses. In South Korea, where mountainous terrain covers 64% of the country, localized downpours exacerbate the risk of debris flows, endangering communities and critical infrastructure. To enhance resilience and ensure sustainable risk management, the Korea Expressway Corporation developed a quantitative debris flow risk assessment system based on sensitivity and vulnerability indicators. An early warning system utilizing rainfall thresholds was subsequently introduced. However, discrepancies between rainfall data from local AWS stations and actual site conditions compromised its predictive accuracy. This study addresses those limitations by integrating the Parameter-elevation Regressions on Independent Slopes Model (PRISM) into the early warning system to enhance prediction accuracy at debris flow occurrence and non-occurrence points. Comparative analysis revealed that the PRISM-enhanced system significantly improved predictive performance. Furthermore, cumulative rainfall data from five highway sites validated the system’s reliability in short-term prediction while offering a sustainable, data-driven framework for long-term debris flow risk management. This approach strengthens adaptive infrastructure strategies, promoting more resilient transportation networks and improving public safety while minimizing environmental impacts.
1. Introduction
The increasing occurrence of extreme weather events, such as heavy rainfall and typhoons, has led to climatic conditions that increase the vulnerability of slope stability. Landslides and debris flows predominantly occur on slopes and have different causes and mechanisms due to various physical and environmental factors. A landslide is the downslope movement of soil or rock along a single failure surface caused by gravitational forces. Triggers for landslides include rainfall, earthquakes, groundwater level rise, and volcanic activity [1,2]. In contrast, debris flows are a mixture of rock, soil, and water moving in a fluid-like manner along a slope, primarily triggered by heavy rainfall or melted snow. Unlike landslides, debris flows involve multi-layered flow mechanisms, high mobility, and rapid movement, often causing widespread damage [3]. As a type of slope failure, debris flows are common in mountainous regions with abundant loose soil during periods of intense rainfall, moving at speeds of 10 to 35 mph, making them challenging to predict and prevent. Key factors influencing debris flows include slope gradient, watershed size, and rainfall intensity, with precipitation being the most critical factor. The distinction between landslides and debris flows also lies in their movement characteristics. Landslides typically involve a confined sliding movement along a failure surface and are more likely to stabilize at a resting position. In contrast, debris flows are continuous and fluid in nature, with higher mobility due to their water content, allowing them to spread rapidly downstream [4].
Debris flows can cause loss of life, destruction of infrastructure, and damage to roads, pipelines, and vehicles [5]. For instance, in 2010, a series of landslides and debris flows in Zhouqu, China, resulted in 1765 fatalities and widespread destruction of roads, homes, and bridges [6]. Similarly, in 2018, heavy rainfall in Montecito, California, triggered debris flows in the steep watershed of the Santa Ynez Mountains, resulting in 23 deaths, 167 injuries, and damage to 408 homes [7]. In South Korea, frequent debris flow events occur due to its mountainous terrain. During the monsoon season, the mountainous regions of Gangwon Province often experience significant damage to roads and agricultural lands. Notably, in 2020, torrential rains in central Korea triggered debris flows on Mount Umyeon in Seoul, burying houses and causing casualties, illustrating the severe threat posed by landslides and debris flows to urban areas [8,9]. Large-scale disasters are often exacerbated in densely populated areas where disaster mitigation measures are inadequate [10]. Effective preventive measures and non-structural mitigation strategies are increasingly recognized as being essential to minimize damage. In Taiwan, the introduction of evacuation plans, warning systems, and community training programs significantly reduced debris flow-related fatalities [11]. Structural measures such as check dams and drainage channels, combined with ecological restoration techniques, have been proposed as crucial components of preventive frameworks [12]. Authorities must allocate resources to recognize the potential impacts of debris flows and implement proactive measures for disaster prevention and response [13].
Slope stability assessments can be broadly categorized into deterministic physical-based methods and probabilistic approaches. Traditional physical-based methods evaluate influencing factors such as groundwater level, pore water pressure, and shear stress using experimental measurements and limit equilibrium analysis, providing accurate stability predictions. However, these methods are difficult to apply to large areas due to high time and cost requirements [14]. Recent research has focused on probabilistic approaches that estimate the probability of slope failure using advanced analytical techniques. These approaches, commonly used for regional-scale stability assessments, employ probabilistic methods, statistical tools, and artificial neural networks [15,16,17,18,19,20,21]. They develop predictive models by analyzing the relationships between various influencing factors and failure frequencies. Geographic Information System (GIS) technology has become an indispensable tool for debris flow research. GIS efficiently integrates terrain and environmental data to provide quantitative assessments of debris flow susceptibility. For example, GIS-based numerical models simulate the movement paths and deposition areas of debris flows in three dimensions, providing accurate hazard predictions [22]. High-resolution digital elevation models combined with GIS techniques facilitate detailed analyses of the relationships between topographic factors and debris flow occurrence [23]. The study by [24] developed a GIS-based framework for real-time debris flow hazard assessment along highway sections. Recent studies have also integrated statistical and artificial intelligence methods, using, for example, support vector machines and random forest models, with GIS to enhance prediction accuracy [25,26].
The Korea Expressway Corporation (KEC) [27] proposed a method to assess debris flow risk by quantitatively analyzing the probability of debris flow occurrence along expressway segments, to mitigate potential damage. Building on this, a study by [24] developed a probabilistic rainfall threshold for debris flow triggering and implemented a real-time debris flow forecasting system using rainfall data from nearby weather stations. In the current real-time debris flow forecasting method, the risk is assessed by dividing the area of interest into highway segments and using data specific to each segment. While local terrain and highway infrastructure data are used to assess localized debris flow risk, rainfall data rely solely on information from the nearest weather station (automatic weather system (AWS) or automated synoptic observing system (ASOS)). Consequently, areas within a certain radius of a given AWS station have identical rainfall inputs and potentially identical hazard assessment results. In regions like South Korea, where approximately 64% of the land is forested, localized rainfall events are common due to the complex topography influenced by mountain ranges. Such discrepancies between actual rainfall in a specific area and measurements from nearby AWS stations highlight the need for topography-sensitive rainfall estimation methods such as Parameter-elevation Regressions on Independent Slopes Model (PRISM), which is widely used in hydrology. This study extends the debris flow risk assessment method proposed by [27] and builds on the GIS-based framework introduced by [24]. By incorporating the PRISM technique to account for topographic effects in rainfall estimation, this research aims to optimize the assessment of rainfall thresholds for debris flow initiation and evaluates the applicability of this improved real-time debris flow prediction method. The results showed that the assessment method using PRSIM was more accurate.
2. Materials and Methods
2.1. Debris Flow Hazard Assessment Methods in South Korea
The Korea Forest Service’s debris flow assessment [28] evaluates landslide risk based on six criteria: protected targets, sources of degradation, boulder distribution ratio (%), upper stream slope angle (°), total stream length (m), and average stream slope (°). The assessment assigns a weighted score to each criterion for the surveyed sites and classifies the landslide hazard into four grades based on a scoring system: Grade 1 (highly probable areas, ≥540 points), Grade 2 (probable areas, 360–540 points), Grade 3 (less probable areas, 120–360 points), and Grade 4 (unlikely areas, ≤120 points). Among the criteria, the “protected targets” parameter prioritizes human life by assigning the highest scores to residential areas and public facilities, while the “sources of degradation” criterion identifies areas prone to landslides. A study by [29] developed a logistic regression model to assess debris flow risk. This model utilized slope, shape, and aspect data from digital elevation maps, rainfall records from AWS, and wildfire history from forestry statistics. Additional datasets including soil depth, soil characteristics, and vegetation coverage, were collected using soil and vegetation maps to construct a comprehensive database. The analysis focused on four key factors: (A) debris flow occurrence probability (calculated as the area within a watershed with an 80% or higher probability of landslides × soil thickness [m3/100]), (B) cumulative rainfall (mm), (C) topsoil lithology (sedimentary and metamorphic rock [gneiss]: 1; igneous rock: 0), and (D) debris flow erosion factors (average stream slope × watershed area [(° × m2)/100]). The developed logistic regression model quantified debris flow risks based on these factors.
The KEC conducted debris flow risk assessments by quantitatively analyzing debris flow occurrence, movement potential, and associated damage through field investigations of mountainous terrain and drainage facilities near operating expressways [30]. Based on rainfall records and geomorphological data from debris flow sites on expressways, KEC proposed a debris flow risk assessment framework. The hazard grade for each expressway section was determined, guiding differentiated mitigation measures. Debris flow hazard scores were derived from disaster and vulnerability indicators. The disaster score represented the probability of debris flow occurrence and movement likelihood, calculated from four geomorphological factors of watersheds derived from digital elevation models processed with ArcGIS tools.
The four geomorphological factors can be divided into two categories. The first category includes factors related to the potential initiation of debris flows, such as the average slope of the watershed and the proportion of areas within the watershed with slopes steeper than 35°. The second category encompasses factors that affect the movement of debris flows, including the average slope of valleys and the ratio of valley lengths with slopes greater than 15°.
Vulnerability scores were assessed based on expressway cross-sections and layouts, taking into account parameters such as the separation distance between the road and slopes, potential depositional heights, and drainage structure capacities. These scores quantified the potential impact of debris deposition on expressways. Logistic regression was used to assess the relative importance of the geomorphological factors and calculate the hazard scores. In the final risk assessment, historical debris flow-inducing rainfall return periods were correlated with the hazard scores to create a hazard grade chart. Hazard grades were then assigned to expressways segments to inform mitigation designs, as shown in Figure 1, Table 1.
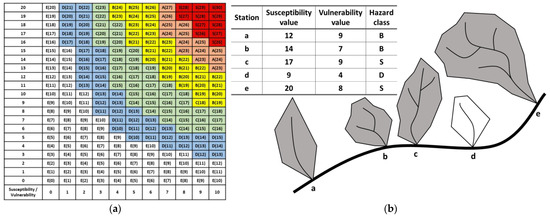
Figure 1.
(a) Debris flow hazard classification based on hazard score and vulnerability score and (b) example of debris flow hazard assessment [27,31].

Table 1.
Disaster score and vulnerability score hazard level by hazard class.
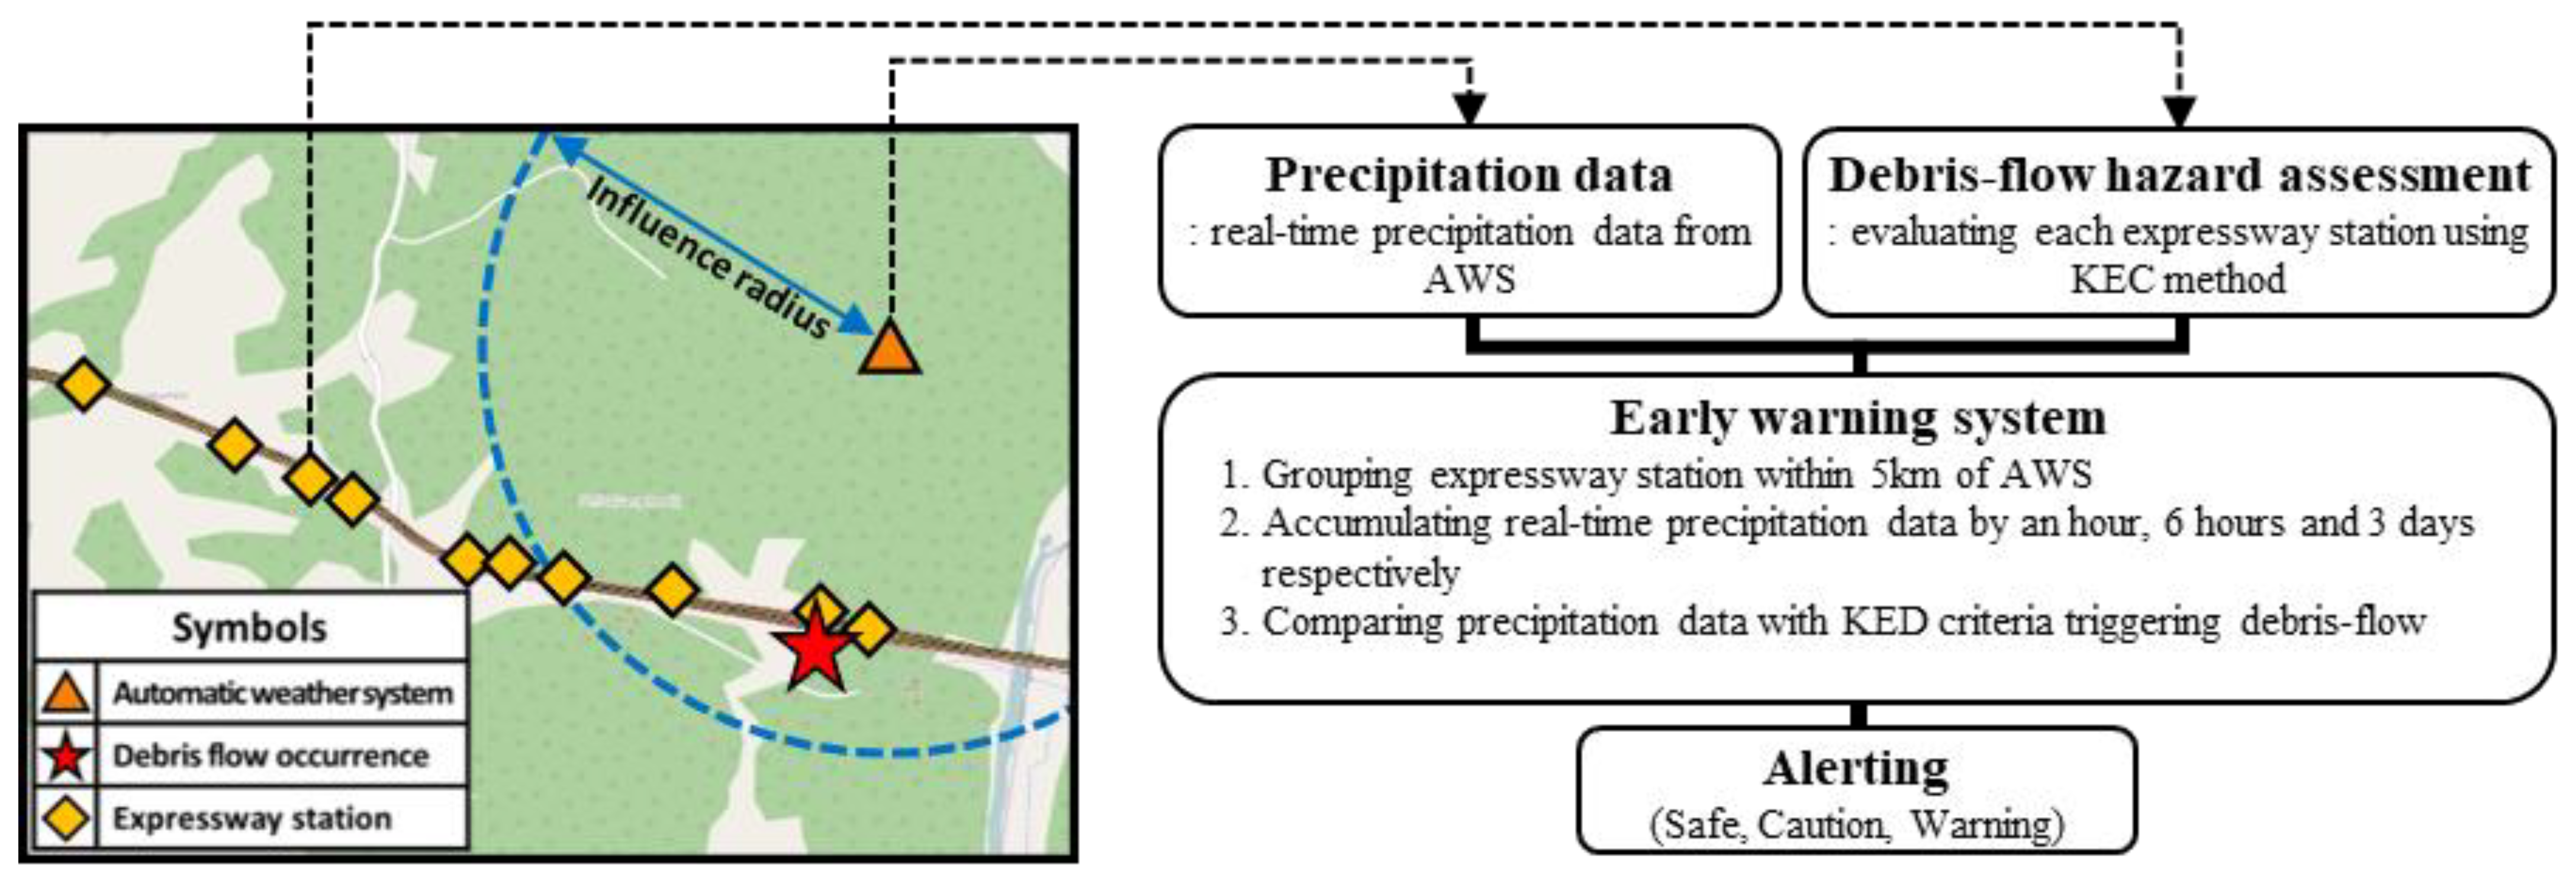
The study by [24] built on the KEC framework to develop a debris flow prediction system by proposing quantitative rainfall thresholds associated with debris flow probabilities, as depicted in Figure 2. Rainfall is a key factor in triggering debris flows, with 1-h, 6-h, and 3-day cumulative rainfall having the strongest correlations with slope failures such as debris flows and landslides [32,33,34]. A single cumulative rainfall threshold was deemed insufficient for reliable debris flow prediction. Instead, the study applied a combination of thresholds based on rainfall return periods as outlined by the KEC for 1-h, 6-h, and 3-day cumulative rainfall to improve forecast accuracy, as depicted in Table 2. Debris flow advisories and warnings were issued when cumulative rainfall thresholds exceeded the following criteria: an exceeding one threshold triggered an advisory, while exceeding two or more thresholds resulted in a warning. The forecasting system integrated ArcGIS-based terrain analysis with real-time rainfall data from nationwide AWS stations. Each expressway section was assigned an AWS and when cumulative rainfall exceeded debris flow thresholds, the system immediately warned of the likelihood of debris flow occurrence.

Figure 2.
Real-time debris flow hazard framework [24,31].
Table 2.
Precipitation criteria of early warning system.
2.2. Real-Time Debris Flow Prediction System Utilizing Parameter-Elevation Relationsips on Independent Slope Model
Spatial climate data are a critical factor in disaster prediction modeling and analysis based on climate information. Specifically, in debris flow disasters, where rainfall plays a significant role, accurate rainfall-based analysis greatly influences the assessment of debris flow occurrence and its associated impacts. Currently, the widely adopted debris flow prediction method [24] utilizes rainfall data from the nearest climate observation station. Consequently, assessment points within the defined area of the observation station are assigned the same hazard level, leading to identical prediction results. However, the actual rainfall at locations far from observation stations often deviates due to topographical influences. Such discrepancies may result in varying predictions when debris flow models are evaluated based on localized topographical factors and real-time rainfall data. Therefore, accurate prediction of rainfall for specific locations is essential for reliable debris flow prediction in areas requiring localized assessments.
This study employs PRISM to estimate localized rainfall and enhance debris flow prediction accuracy. PRISM is an interpolation method that estimates climate data for a given area using topographical features such as elevation, aspect, and distance, along with historical climate records. Based on regression analysis, PRISM utilizes climate data collected via Digital Elevation Map (DEM) and AWS for the study area. During PRISM-based interpolation, four key topographical factors—elevation, distance to observation stations, slope aspect, and distance from the coast—exert the greatest influence [35]. However, in regions such as South Korea, where approximately 64% of the land is covered by forests and complex mountainous topographies dominate, significant spatiotemporal variability in climatic conditions is observed. To address these challenges, this study assesses the applicability of the K-PRISM model [36], a modified version of the PRISM model tailored to the geographic and climatic characteristics of South Korea. The Modified K-PRISM (MK-PRISM) model operates at a higher spatial resolution, utilizing a DEM grid size of 270 × 270 m, compared to the original PRISM grid size of 5 × 5 km, thereby enhancing its accuracy. Furthermore, specific weighting factors employed in PRISM, such as distance to the coastline and vertical atmospheric layers, are excluded in MK-PRISM due to their limited relevance under domestic conditions [37]. Additionally, coastal effects are not considered in this study because the rainfall data analyzed are from locations at least 20 km inland.
For the prediction of debris flows along expressways, the optimal regression model weights were derived using GIS. Elevation, distance, and aspect weights were calculated based on the formulas provided by [35,38,39].
where , , and are the distance, elevation, and topographic facets, respectively, and and are user-specified distance and elevation weighting importance coefficients.
Elevation weights reflect the climate similarity between the target area and AWS stations based on elevation differences. Similarity increases as elevation differences decrease, but beyond a critical threshold, climate correlation is considered negligible [35].
where is the difference in elevation between the station and the target cell, is the elevation weighting exponent, is the minimum elevation difference, and is the maximum elevation difference.
Distance weights are inversely proportional to the square of the distance between the target area and AWS stations, reflecting decreasing influence with increasing distance [39].
where d is the horizontal distance between the station and the target cell, is the distance weighting exponent, and is the minimum influence radius.
Aspect weights account for local climatic characteristics such as wind patterns, precipitation shadows, and other terrain influences. Regions with similar slope aspects have higher climate similarity, while geographic barriers such as mountain ranges reduce the weights [35].
where is the absolute orientation difference between the station and the target grid cell (maximum possible difference is 4 compass points, or 180°), is the number of intervening barriers between the target grid and the stations, and is the facet weighting exponent. In this application, was set to 1.5, where the target grid is located in inland and relatively flat regions.
Currently, the real-time debris flow prediction method [24] evaluates areas based on highway reference points and uses rainfall data from the nearest AWS or ASOS station. However, this approach does not account for topographical rainfall characteristics, leading to uniform rainfall inputs within the range of a given AWS. Consequently, regions with identical rainfall inputs and debris flow hazards will produce identical forecast results. This limitation is particularly critical in South Korea, where the significant forest cover and complex mountainous terrain can cause localized rainfall discrepancies. Such conditions may lead to differences between the actual rainfall at a given location and the rainfall measured at the nearest AWS.
In this study, PRISM was applied to estimate cumulative rainfall along highway reference points and integrate these estimates into the real-time debris flow forecasting system, as depicted in Figure 3. The results demonstrate the enhanced prediction accuracy of debris flow predictions using localized rainfall data derived from PRISM.
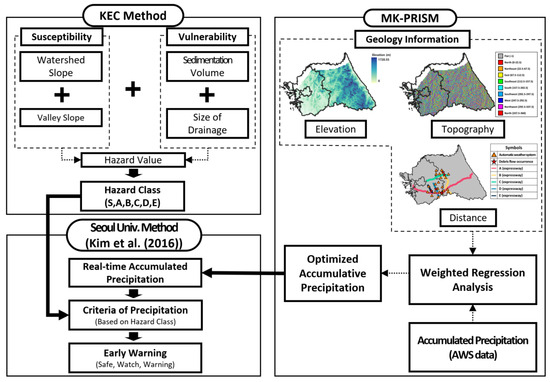
Figure 3.
Real-time debris flow prediction system framework utilizing PRISM (corrected [24]).
3. Results
3.1. Analysis of a Debris Flow Occurrence Site
In South Korea, the central region, spanning approximately 37° to 39° N latitude, features diverse topography. The Taebaek Mountain Range, extending north to south in the east, forms a major geological axis with high altitudes and steep slopes [40]. In contrast, the western part consists of rolling hills and plains shaped by long-term erosion and sedimentation along the coastline [41]. The region also includes volcanic remnants, such as the Hantan River Lava Plateau, where fluvial erosion has carved out distinctive gorges and cliffs [42]. These topographical variations significantly impact rainfall distribution and debris flow patterns.
The occurrence and movement characteristics of debris flows can be classified into four types: large-scale collapse type (caused by large collapses within valleys), post-collapse confluence type (where collapses in upper valley areas mix with deposits, increasing the scale), small-scale collapse aggregation type (formed by the aggregation of small collapses scattered throughout the watershed), and sediment flow type (triggered by large amounts of water causing sediment movement and valley erosion). According to [27], most debris flows occurring along highways in Korea are of the post-collapse confluence type. These flows are triggered by slope failures in steep sections of watersheds, with debris moving downstream and increasing in scale due to additional erosion along the valleys.
Thus, investigation of the proportion of steep slopes (≥35°) in the upper valley initiation zones and analysis of rainfall characteristics are important factors in predicting debris flow occurrence. The scale of debris flows is more closely related to valley morphology, rainfall intensity, and geologic conditions than to watershed size. A comparison of average valley slope and the proportion of valley length with slopes steeper than 15° showed that when valleys have more than 40% of their length with slopes greater than 15°, debris flows can extend into lower reaches. Conversely, in valleys with average slopes less than 10°, sediment deposition halts flow movement [43].
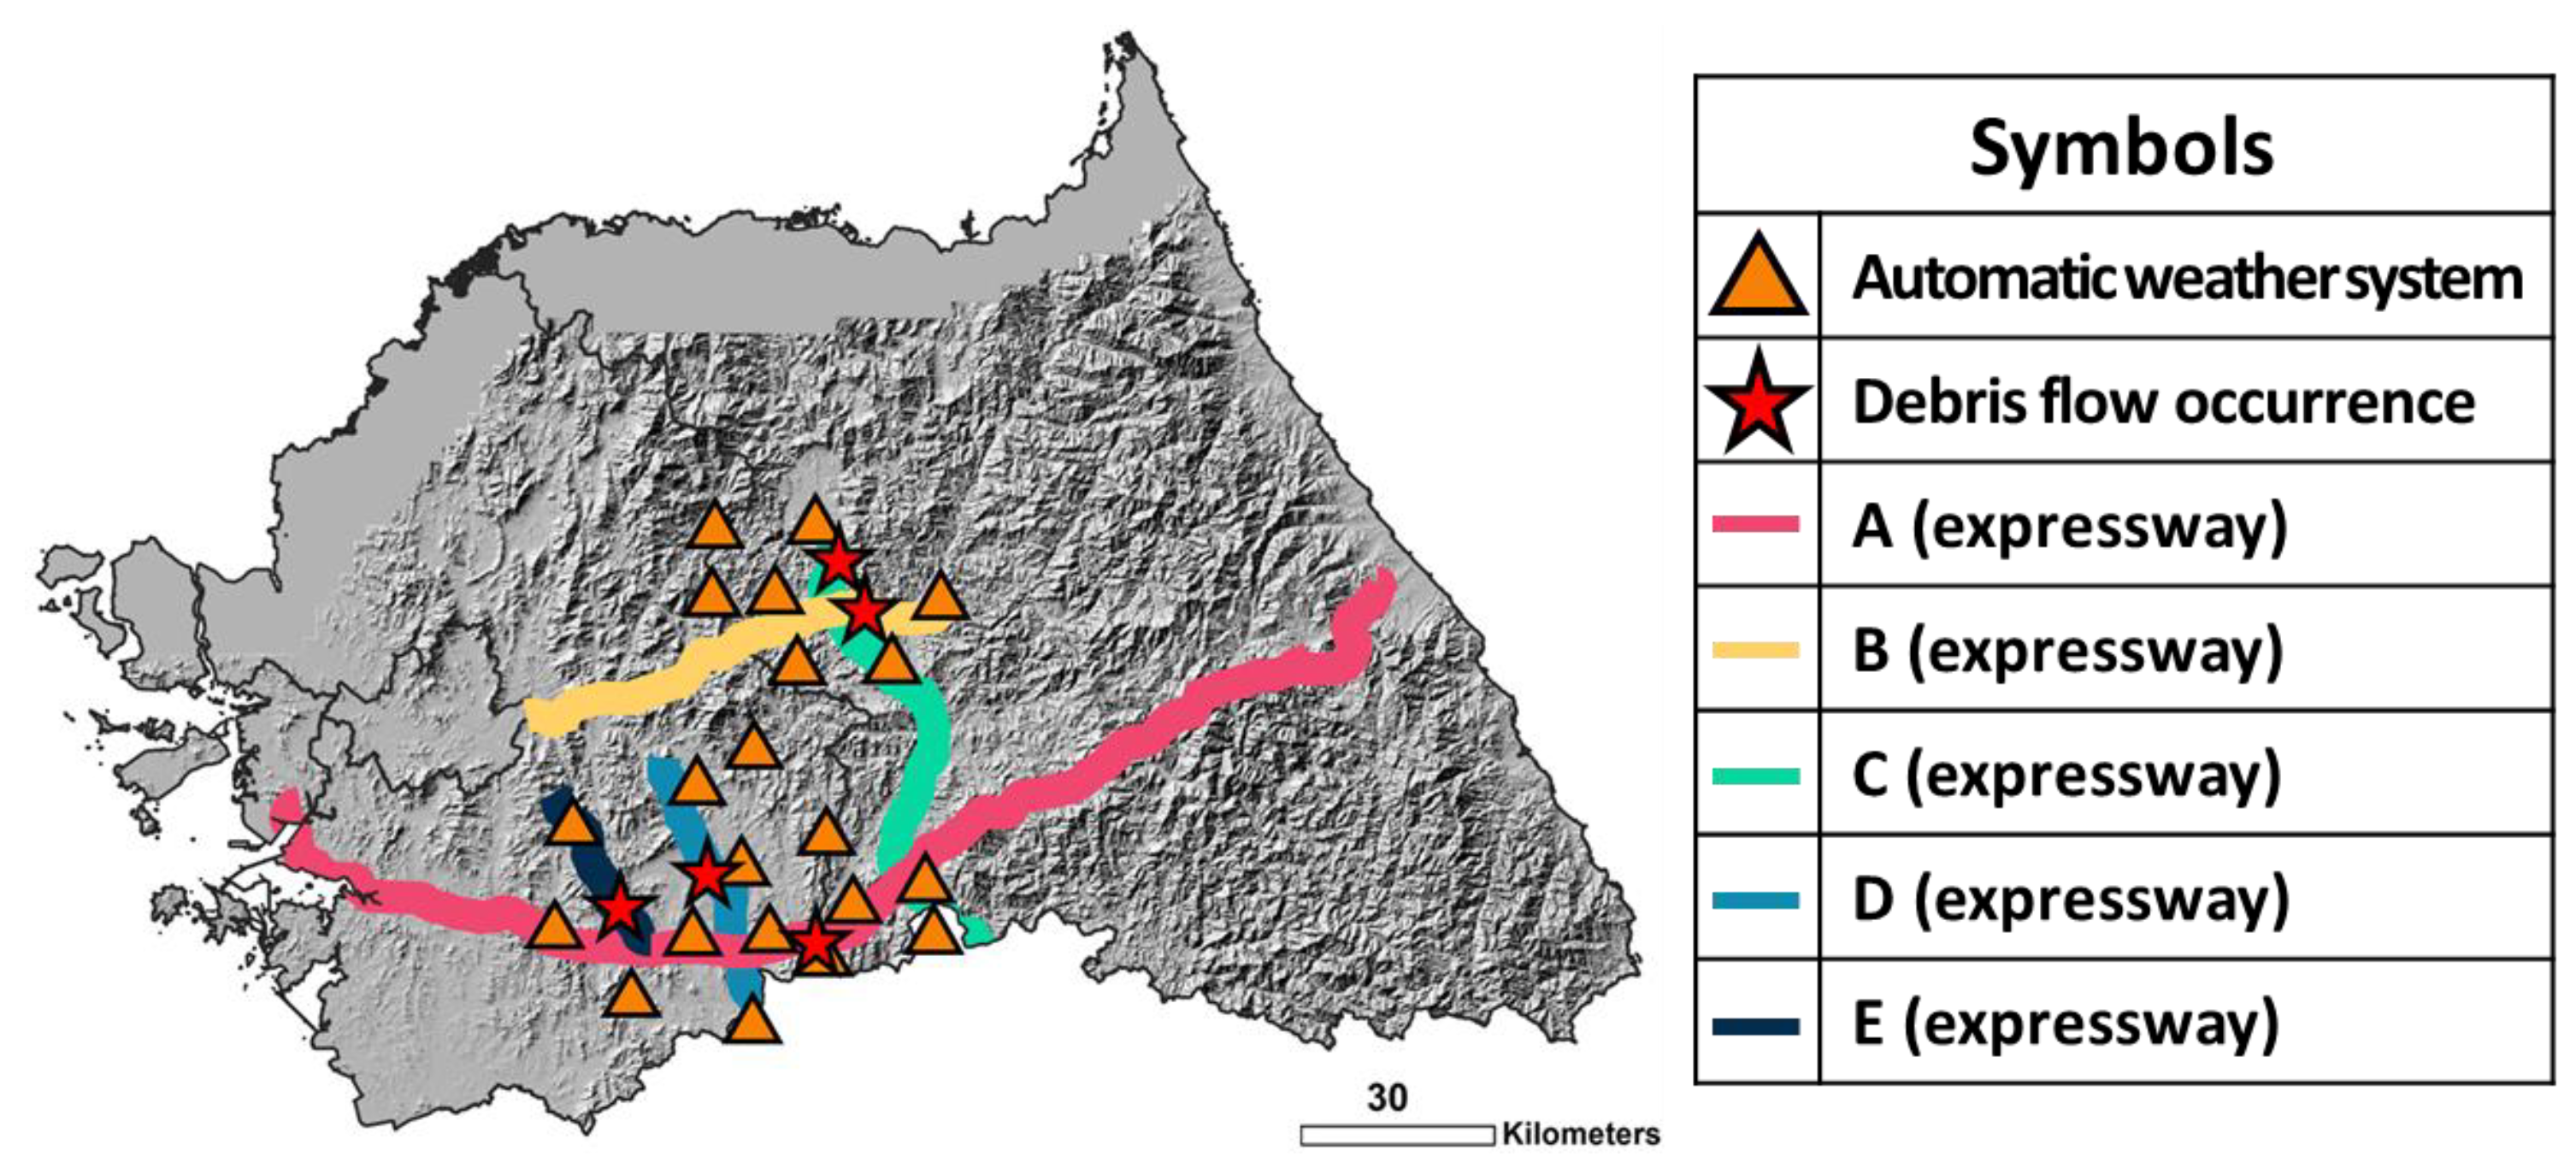
KEC conducted field surveys at five operational highway sites affected by debris flows during the heavy rainfall events of 2013 to inform the design of preventive facilities for both newly constructed and operational expressways (Figure 4). Rainfall data from nearby monitoring stations recorded hourly rainfall intensities ranging from 52 mm to 74 mm during the events. This rainfall caused erosion of soil and debris from slopes, leading to the destruction of expressway infrastructure. Using DEM, aerial imagery, GIS-based watershed analysis, and design plans for operational expressways, a debris flow risk assessment was conducted and hazard levels were categorized as shown in Table 3.

Figure 4.
Geospatial distribution of debris flow occurrence and expressway.
Table 3.
State of debris flow hazard assessment occurrence site.
In this study, the analysis was expanded to examine rainfall characteristics associated with debris flows of varying magnitudes, improving the prediction accuracy of debris flow. For the five debris flow sites, rainfall data from the nearest AWS stations within a 30 km radius of the highway sections were analyzed. The cumulative rainfall for 1 h, 6 h, and 3 days leading up to the debris flow events was calculated. The results, summarized in Table 4, demonstrate significant variability in rainfall across different regions.
Table 4.
AWS precipitation data and early warning results of debris flow occurrence site.
3.2. Performance of Real-Time Debris Flow Prediction Systems
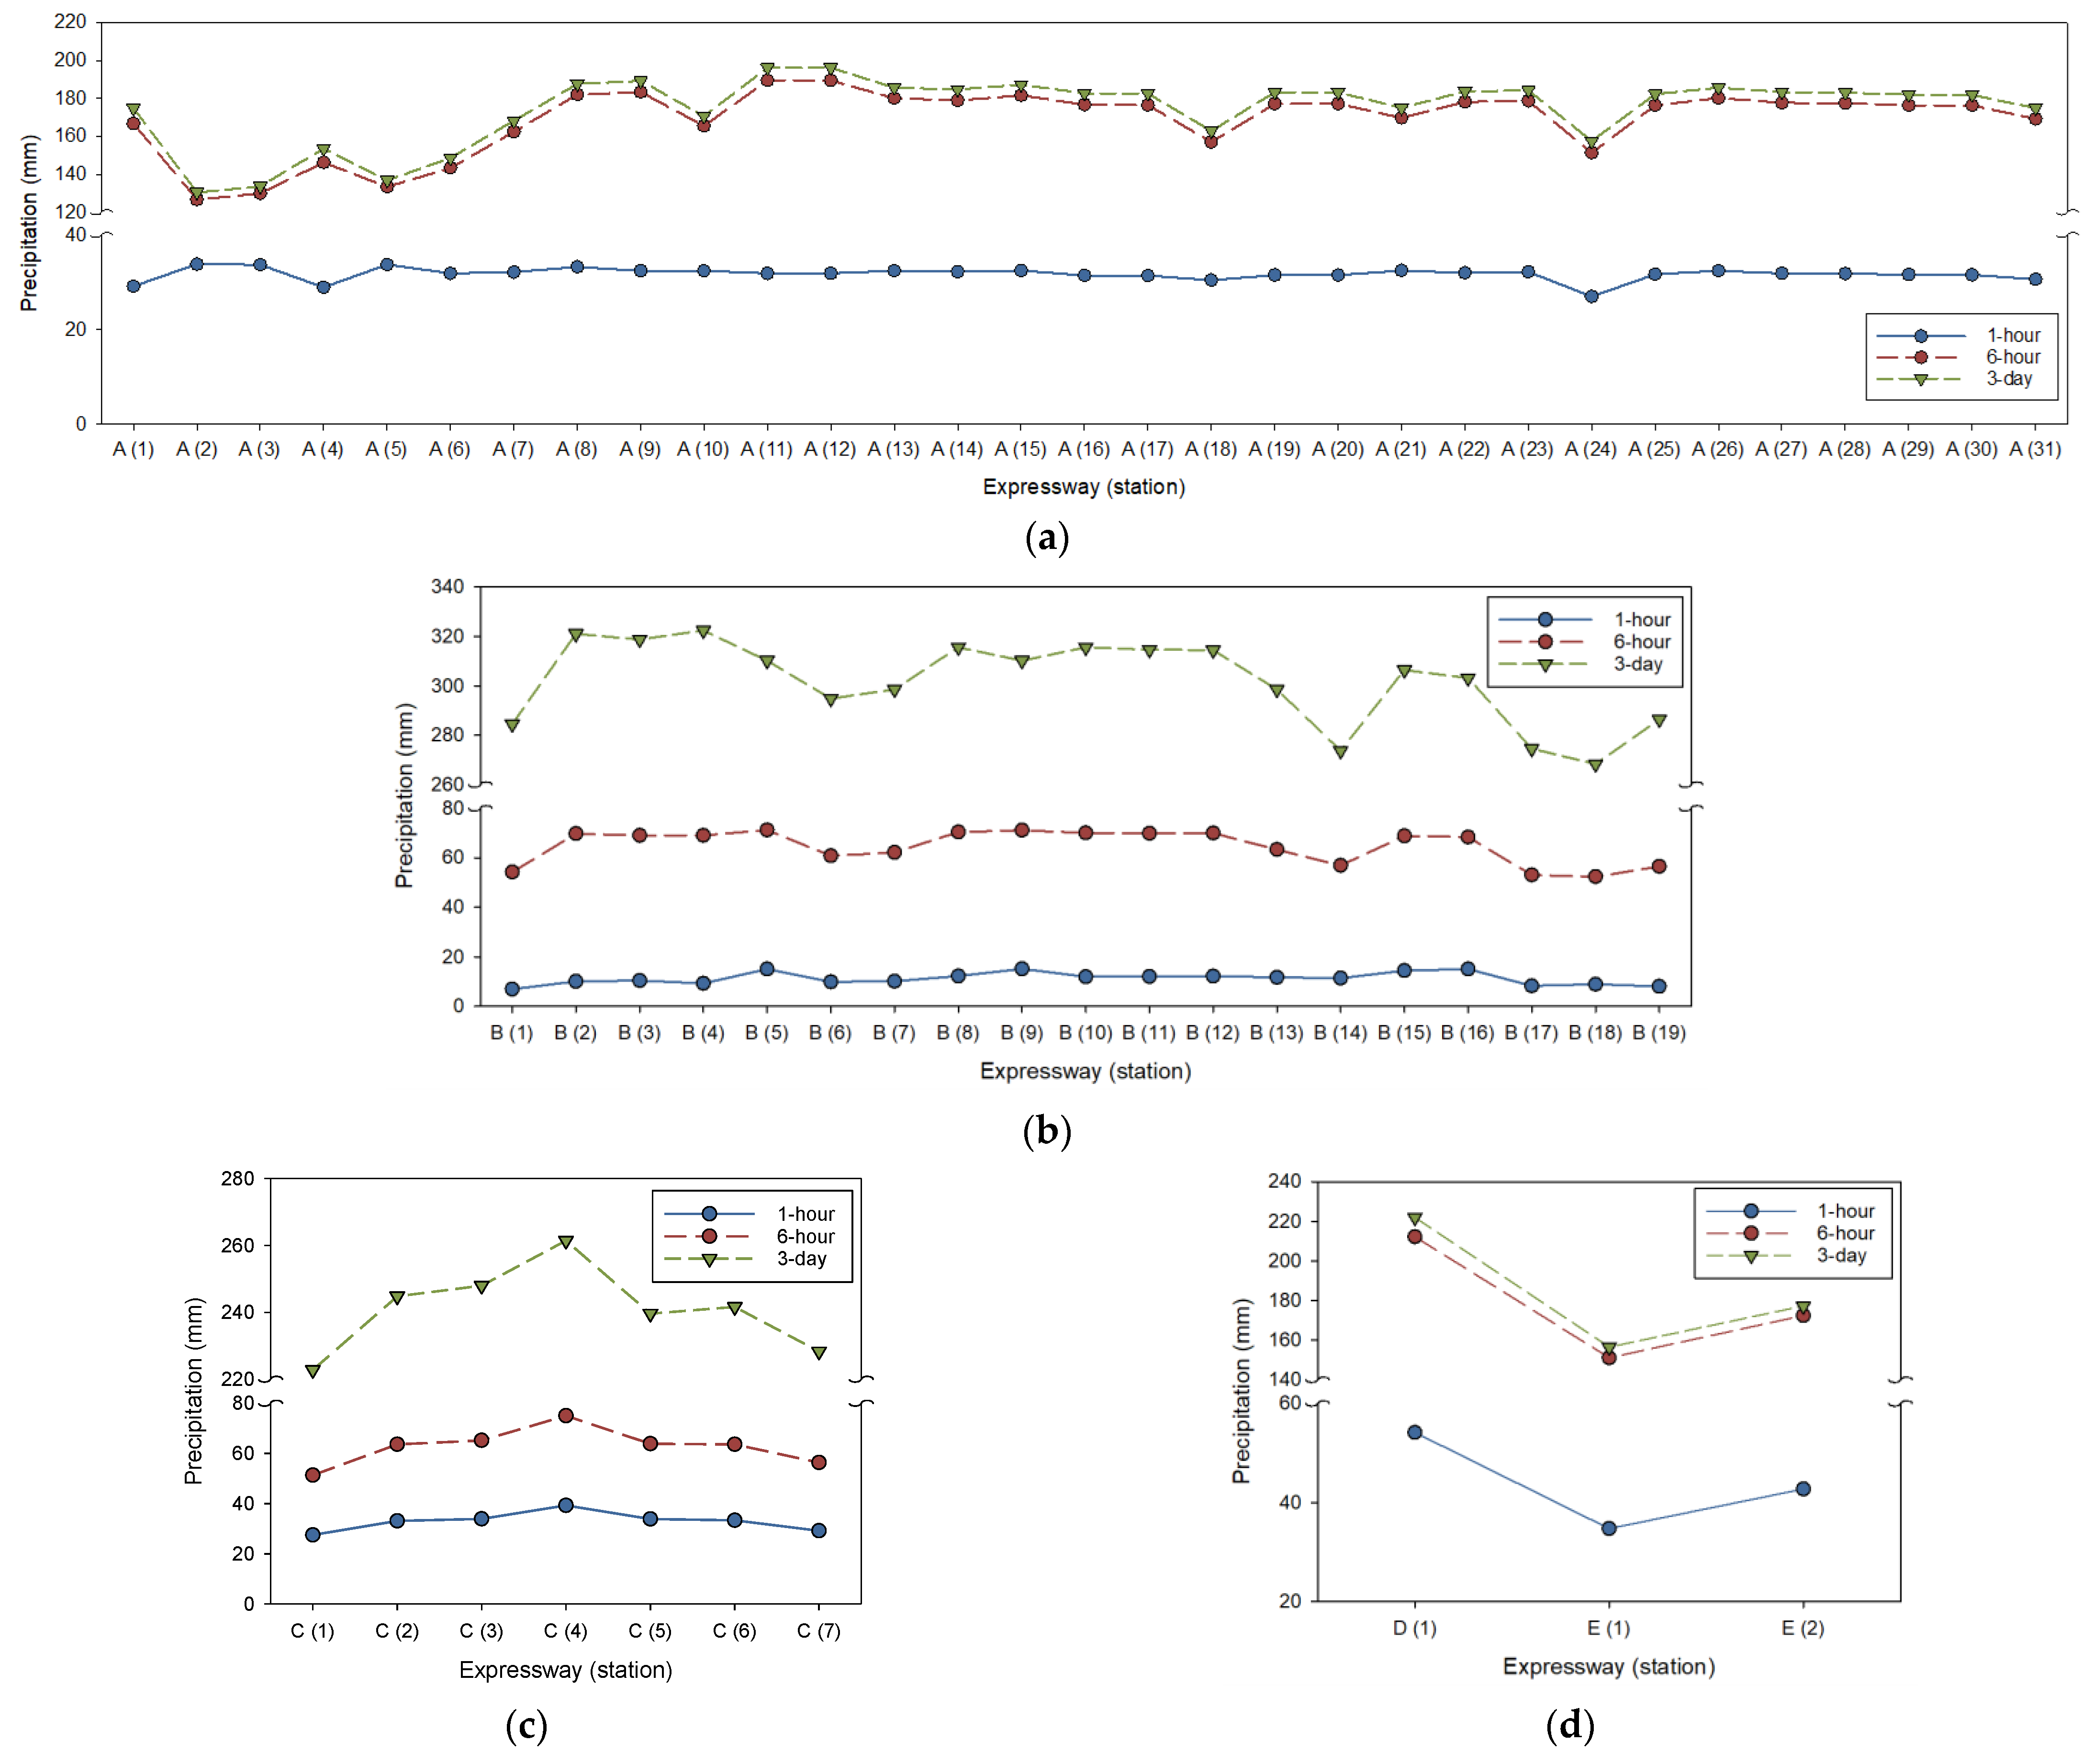
This study analyzed 1-h, 6-h, and 3-day rainfall data using observations from 21 AWS stations under the Korea Meteorological Administration, focusing on expressways in the central region. The PRISM-based debris flow prediction system was applied to multiple stations on five expressways and its performance in predicting the occurrence or non-occurrence of debris flows was evaluated. Figure 5 and Table 5 summarize the comparison of the prediction results. Notably, the 1-h and 6-h cumulative rainfall was highest on expressway D, while the 3-day cumulative rainfall was highest on expressway B.
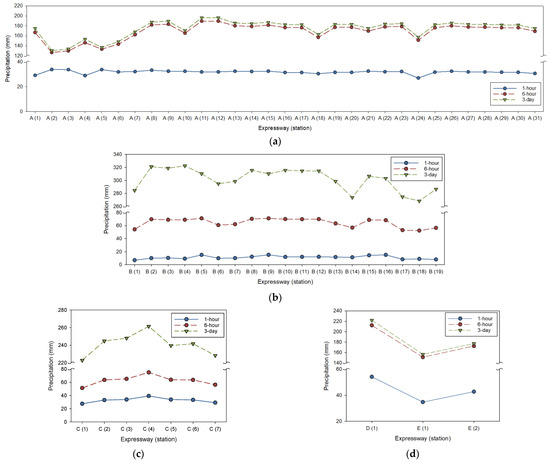
Figure 5.
Accumulative precipitation: (a) A expressway, (b) B expressway, (c) C expressway, and (d) D, E expressway.
Table 5.
Cumulative precipitation statistics for the PRISM model.
As summarized in Table 6, a comparative analysis was conducted to evaluate the differences between the PRISM-based predictions and the conventional method [24] for 60 stations across the five routes. Among them, 27 stations were classified as Safe by both methods, and 17 stations were classified as Watch by both methods. However, discrepancies were observed at 16 stations (approximately 27% of the total). In particular, the conventional method provided more conservative assessments than the PRISM-based approach, especially on Routes A and C. When compared to actual debris flow events, the conventional method was found to be overly cautious.
Table 6.
Comparison of early warning results based on analysis methods by expressway.
The prediction accuracy of the two methods was compared by analyzing the prediction results against actual debris flow records, as summarized in Table 7, based on the following four cases:
Table 7.
Prediction accuracy of real-time debris flow prediction methods.
- -
- Case A: Predicted debris flow occurrence with Watch or Warning at actual occurrence sites
- -
- Case B: Predicted safety at non-occurrence sites
- -
- Case C: Predicted Watch or Warning at non-occurrence sites
- -
- Case D: Predicted safety at occurrence sites
The analysis indicated that both the conventional and PRISM-based methods performed similarly in predicting debris flow occurrence. However, for non-occurrence sites, the conventional method tended to overestimate hazard levels, resulting in more conservative predictions. This overestimation was particularly evident in the generation of false alarms. Application of the PRISM method produced a reduced number of false alarms and improved overall prediction accuracy, highlighting its potential for enhanced debris flow forecasting.
4. Discussion
The results of this study contribute significantly to the safety of the expressway infrastructure by improving the understanding and prediction of debris flows, thereby enabling proactive disaster prevention. This study highlights the importance of integrating topographic and meteorological factors into precipitation analysis to improve debris flow hazard assessments and early warning systems. This section discusses the implications of the findings, limitations of current methodologies, and directions for future research.
4.1. Real-Time Debris Flow Prediction System
Analysis of debris flow-prone areas revealed a strong relationship between valley slope characteristics and debris flow magnitude. Valleys with more than 40% of their total length exceeding a slope of 15° were observed to extend larger debris flows downstream. This finding is consistent with previous studies [27] and emphasizes the need to integrate slope related indicators into hazard assessment models. In addition, steep slopes (≥35°) in initiation zones play a significant role in flow dynamics by emphasizing important topographic features.
Regarding rainfall characteristics, rainfall intensity and duration were confirmed as critical factors influencing debris flow initiation. Comparative analysis of 1-h, 6-h, and 3-day cumulative rainfall thresholds revealed significant variability across regions due to complex interactions between local rainfall patterns and topographic features. Incorporating these temporal rainfall metrics into prediction systems can improve forecasting capabilities, especially in areas with highly variable climatic conditions.
A comparative evaluation of traditional methods and the PRISM-based prediction system demonstrated the superior performance of PRISM in predicting debris flows, particularly under varying topographic conditions. Traditional methods, which rely primarily on data from the nearest weather station, often fail to capture localized rainfall variations in mountainous terrain, resulting in increased false alarms or missed events. In contrast, PRISM, by incorporating topographically sensitive rainfall interpolation, significantly reduces false positives and improves the accuracy of hazard assessments. Specifically, when applied to five debris flow-prone expressway segments, PRISM-enhanced predictions demonstrated a 13% improvement in accuracy over traditional methods. Detailed analysis of model performance under different topographic conditions further demonstrated that PRISM effectively captures orographic precipitation influences, leading to more reliable early warning signals. These results highlight the advantages of PRISM in refining debris flow prediction models, especially in regions with complex topography.
4.2. Limitations and Future Works
Despite meaningful advances in debris flow prediction, several limitations of this study warrant discussion:
- -
- Data limitations: This study was conducted using data from only five expressway segments and a limited number of AWS stations, which may not fully capture the variability of debris flow-triggering rainfall conditions in different regions. Terrain, geology, and climate conditions vary significantly and the results may not be directly generalizable to areas with different mountain ranges, soil types, or vegetation coverage. Future studies should incorporate a more diverse set of monitoring sites and compare results with similar studies to improve the generalizability of conclusions.
- -
- Size of the validation dataset: The PRISM-based system was validated using a relatively small dataset of observed debris flow events. The limited sample size may introduce biases and restrict the comprehensive evaluation of model performance across various complex scenarios. Expanding the validation dataset with cases covering different spatial and temporal conditions, as well as diverse triggering factor combinations, is necessary for a more robust assessment.
- -
- Temporal granularity of rainfall: While this study considered cumulative rainfall over various time scales, it did not address potential delays between rainfall events and debris flow occurrence. Incorporating such temporal dynamics through time series analysis could further improve prediction accuracy.
Based on the findings of this study, several avenues for future research are suggested:
- -
- Expansion of datasets: Future research should include a more extensive dataset that includes debris flow events from a diverse set of climatic, geologic, and topographic conditions to improve model robustness and generalizability. The integration of data from multiple sources, such as satellite precipitation estimates and high-resolution weather radar data, could also enhance the accuracy of rainfall-triggered debris flow predictions.
- -
- Development of dynamic rainfall threshold models: Existing threshold-based methods often assume static triggering conditions. Future research should focus on developing adaptive models that account for antecedent rainfall conditions, soil moisture variability, and evolving thresholds over time to improve the temporal prediction accuracy of early warning systems.
- -
- Advancements in predictive methods: The use of machine learning techniques to analyze complex interactions among topographic, meteorological, and geological variables, as well as time-series analysis (e.g., using long short-term memory or gated recurrent unit models), can identify new patterns and improve predictive performance.
- -
- Real-time system optimization: The implementation of the PRISM-based system in real-time operational environments and its continuous improvement through feedback and performance monitoring will ensure practical applicability and scalability.
- -
- Wireless sensor network (WSN) for deformation monitoring: Advanced sensor-based monitoring technologies, such as WSNs and GNSS, are being used for real-time detection of ground deformations and early warning systems [44,45]. Fiber-optic sensor technology has also proven effective for infrastructure monitoring, including tunnels and bridges [46]. Future research will explore WSN applications for more accurate assessments of debris flow impacts.
5. Conclusions
The increasing frequency, intensity, and variety of precipitation due to recent abnormal climate changes have increased the hazard of landslides and debris flows. These debris flows cause severe damage to infrastructure and significant human casualties, especially during the monsoon season in Korea, which is characterized by torrential and localized heavy rainfall. Most debris flows originate from landslides triggered by increased pore water pressure in the soil. Therefore, the development of effective debris flow prevention and mitigation measures is essential.
Previous studies, such as KEC [27], quantitatively assessed debris flow hazard along expressway segments and [24] developed an early warning system based on cumulative rainfall using the KEC method. However, the conventional approach did not incorporate geological or topographical factors, relying solely on rainfall data from the nearest AWS or ASOS stations. This limitation is particularly critical in South Korea, where 64% of the terrain is mountainous, and rainfall patterns exhibit significant local variability. Consequently, the system may generate inaccurate warnings for locations where debris flows are unlikely to occur.
To address these challenges, this study integrated the PRISM interpolation method into the early warning system. PRISM considers topographic effects on climatic variables and enhances the spatial accuracy of precipitation estimates, particularly in mountainous regions. Comparative analysis showed that the PRISM-based approach improved debris flow prediction accuracy by 13% compared to the conventional method. Further examination revealed that the traditional method tended to underestimate precipitation in high-altitude regions and overestimate precipitation in valleys, resulting in suboptimal predictions. In contrast, PRISM effectively captured these variations, reducing false alarms and improving the reliability of hazard assessments. These results highlight the importance of incorporating PRISM-derived precipitation data into debris flow prediction models and emphasize the need for a revised precipitation threshold that accounts for topographic influences. Future research should focus on validating the proposed approach using a broader dataset of debris flow events, precipitation, and terrain characteristics. Such efforts will contribute to the development of more robust and reliable early warning systems for debris flow-prone regions.
Author Contributions
Conceptualization, B.-H.J. and T.-K.C.; methodology, B.-H.J.; software, T.-K.C.; validation, B.-H.J., T.-K.C. and I.K.; formal analysis, B.-H.J.; investigation, I.K.; resources, B.-H.J.; data curation, T.-K.C.; writing—original draft preparation, B.-H.J.; writing—review and editing, T.-K.C.; visualization, I.K. All authors have read and agreed to the published version of the manuscript.
Funding
This research received no external funding.
Institutional Review Board Statement
Not applicable.
Informed Consent Statement
Not applicable.
Data Availability Statement
The data supporting the findings of this perspective paper are available from the corresponding author upon reasonable request.
Acknowledgments
We especially thank the Korea Expressway Corporation for its leadership and support.
Conflicts of Interest
The authors declare no conflicts of interest.
References
- Varnes, D.J. Slope movement types and processes. In Landslides: Analysis and Control; Schuster, R.L., Krizek, R.J., Eds.; National Academy of Sciences: Washington, DC, USA, 1978; pp. 11–33. [Google Scholar]
- Iverson, R.M.; Reid, M.E.; LaHusen, R.G. Debris-flow mobilization from landslides. Annu. Rev. Earth Planet. Sci. 1997, 25, 85–138. [Google Scholar] [CrossRef]
- Wang, Z.Y.; Lee, J.H.; Melching, C.S. Debris flows and landslides. In River Dynamics and Integrated River Management; Springer: Berlin/Heidelberg, Germany, 2015; pp. 193–264. [Google Scholar] [CrossRef]
- Tang, C.; van Asch, T.W.; Chang, M.; Chen, G.Q.; Zhao, X.H.; Huang, X.C. Catastrophic debris flows on 13 August 2010 in the Qingping area, southwestern China: The combined effects of a strong earthquake and subsequent rainstorms. Geomorphology 2012, 139, 559–576. [Google Scholar] [CrossRef]
- Jakob, M.; Hungr, O. Debris-Flow Hazards and Related Phenomena, 2nd ed.; Springer: Berlin/Heidelberg, Germany, 2005; Volume 739. [Google Scholar] [CrossRef]
- Cui, P.; Zhou, G.G.; Zhu, X.H.; Zhang, J.Q. Scale amplification of natural debris flows caused by cascading landslide dam failures. Geomorphology 2013, 182, 173–189. [Google Scholar] [CrossRef]
- Kean, J.W.; Staley, D.M.; Lancaster, J.T.; Rengers, F.K.; Swanson, B.J.; Coe, J.A.; Lindsay, D.N. Inundation, flow dynamics, and damage in the 9 January 2018 Montecito debris-flow event, California, USA: Opportunities and challenges for post-wildfire risk assessment. Geosphere 2019, 15, 1140–1163. [Google Scholar] [CrossRef]
- Lee, I.J.; Lee, D.H.; Suh, Y.C. GIS-based analysis of the debris flow occurrence possibility using an airborne LiDAR DEM around Pyeongchang-gun, Kangwon-do. J. Korean Assoc. Geogr. Inf. Stud. 2010, 13, 50–66. [Google Scholar] [CrossRef]
- Nam, D.H.; Kim, M.I.; Kang, D.H.; Kim, B.S. Debris flow damage assessment by considering debris flow direction and direction angle of structure in South Korea. Water 2019, 11, 328. [Google Scholar] [CrossRef]
- Dowling, C.A.; Santi, P.M. Debris flows and their toll on human life: A global analysis of debris-flow fatalities from 1950 to 2011. Nat. Hazards 2014, 71, 203–227. [Google Scholar] [CrossRef]
- Chen, J.G.; Chen, X.Q.; Wang, T.; Zou, Y.H.; Zhong, W. Types and causes of debris flow damage to drainage channels in the Wenchuan earthquake area. J. Mt. Sci. 2014, 11, 1406–1419. [Google Scholar] [CrossRef]
- Huang, Y.; Zhang, B. Challenges and perspectives in designing engineering structures against debris-flow disaster. Eur. J. Environ. Civ. Eng. 2022, 26, 4476–4497. [Google Scholar] [CrossRef]
- Santi, P.M.; Hewitt, K.; VanDine, D.F.; Barillas Cruz, E. Debris-flow impact, vulnerability, and response. Nat. Hazards 2011, 56, 371–402. [Google Scholar] [CrossRef]
- Woo, C.; Kwon, H.; Lee, C.; Kim, K. Landslide hazard prediction map based on logistic regression model for applying in the whole country of South Korea. J. Korean Soc. Hazard Mitig. 2014, 14, 117–123. [Google Scholar] [CrossRef]
- Yeon, Y.K. Evaluation and analysis of Gwangwon-do landslide susceptibility using logistic regression. J. Korean Assoc. Geogr. Inf. Stud. 2011, 14, 116–127. [Google Scholar] [CrossRef]
- Lee, S.; Choi, U. Development of GIS-based geological hazard information system and its application for landslide analysis in Korea. Geosci. J. 2003, 7, 243–252. [Google Scholar] [CrossRef]
- Dai, F.C.; Lee, C.F. Landslide characteristics and slope instability modeling using GIS, Lantau Island, Hong Kong. Geomorphology 2002, 42, 213–228. [Google Scholar] [CrossRef]
- Lv, W.; Hu, X.; Li, X.; Zhao, J.; Liu, C.; Li, S.; Zhu, H. Multi-model comprehensive inversion of surface soil moisture from Landsat images based on machine learning algorithms. Sustainability 2024, 16, 3509. [Google Scholar] [CrossRef]
- Bostan, T. Generating a landslide susceptibility map using integrated meta-heuristic optimization and machine learning models. Sustainability 2024, 16, 9396. [Google Scholar] [CrossRef]
- Nieto, N.; Chamorro, A.; Echaveguren, T.; Escauriaza, C. Fragility curves for road embankments exposed to adjacent debris flow. Prog. Phys. Geogr. Earth Environ. 2022, 47, 105–122. [Google Scholar] [CrossRef]
- Nieto, N.; Chamorro, A.; Echaveguren, T.; Sáez, E.; González, A. Development of fragility curves for road embankments exposed to perpendicular debris flows. Geomat. Nat. Hazards Risk 2021, 12, 1560–1583. [Google Scholar] [CrossRef]
- Wu, J.; Chen, G.Q.; Zheng, L.; Zhang, Y.B. GIS-based numerical modelling of debris flow motion across three-dimensional terrain. J. Mt. Sci. 2013, 10, 522–531. [Google Scholar] [CrossRef]
- Chen, C.Y.; Yu, F.C. Morphometric analysis of debris flows and their source areas using GIS. Geomorphology 2011, 129, 387–397. [Google Scholar] [CrossRef]
- Kim, H.S.; Chung, C.K.; Kim, S.R.; Kim, K.S. A GIS-based framework for real-time debris-flow hazard assessment for expressways in Korea. Int. J. Disaster Risk Sci. 2016, 7, 293–311. [Google Scholar] [CrossRef]
- Gu, F.; Chen, J.; Sun, X.; Li, Y.; Zhang, Y.; Wang, Q. Comparison of machine learning and traditional statistical methods in debris flow susceptibility assessment: A case study of Changping district, Beijing. Water 2023, 15, 705. [Google Scholar] [CrossRef]
- Lang, Q.; Liu, P.; Zhang, Y.; Zhang, J.; Huang, J. Risk assessment of debris flow disasters triggered by an outburst of Huokou Lake in Antu County based on an information quantity and random forest approach. Sustainability 2024, 16, 9545. [Google Scholar] [CrossRef]
- Korea Expressway Corporation (KEC)—Research Institute. Debris Flow Countermeasures Along the Expressway Through Risk Assessment; Korea Expressway Corporation Research Report; Korea Expressway Corporation (KEC)—Research Institute: Gimcheon-si, Republic of Korea, 2013. [Google Scholar]
- Korea Forest Service. Guidelines for the Survey of Landslide-Prone Areas and the Identification and Management of Vulnerable Areas; Korea Forest Service: Daejeon, Republic of Korea, 2020.
- Lee, S.U.; Sin, J.H. Development of disaster prevention design technology for mountain roads. Korean Soc. Road Eng. 2013, 15, 49–60. [Google Scholar] [CrossRef]
- Kim, K.S. Characteristics of basin topography and rainfall triggering debris flow. KSCE J. Civ. Environ. Eng. Res. 2008, 28, 263–271. [Google Scholar] [CrossRef]
- Jo, B.H. Optimal Assessment of Rainfall Triggering Debris Flow Using Parameter-Elevation Relationships on Independent Slopes Model. Master’s Thesis, Seoul National University, Seoul, Republic of Korea, February 2017. [Google Scholar] [CrossRef]
- Crosta, G.B.; Frattini, P. Rainfall thresholds for triggering soil slips and debris flow. In Proceedings of the 2nd EGS Plinius Conference on Mediterranean Storms, Siena, Italy, 14–16 October 2000; Volume 1, pp. 463–487. [Google Scholar]
- Wilson, R.C.; Wieczorek, G.F. Rainfall thresholds for the initiation of debris flows at La Honda, California. Environ. Eng. Geosci. 1995, 1, 11–27. [Google Scholar] [CrossRef]
- Ham, D.H.; Hwang, S.H.; Kim, H.J. Review of domestic landslide and debris flow forecast standard using hydrologic data. In Proceedings of the Korean Society of Civil Engineers Conference, Gangwon, Republic of Korea, 23 October 2013. [Google Scholar]
- Daly, C.; Gibson, W.P.; Taylor, G.H.; Johnson, G.L.; Pasteris, P. A knowledge-based approach to the statistical mapping of climate. Clim. Res. 2002, 22, 99–113. [Google Scholar] [CrossRef]
- Hong, K.O.; Suh, M.S.; Rha, D.K.; Chang, D.H.; Kim, C.; Kim, M.K. Estimation of high-resolution gridded temperature using GIS and PRISM. Atmosphere 2007, 17, 255–268. [Google Scholar]
- Shin, S.C.; Kim, M.K.; Suh, M.S.; Rha, D.K.; Jang, D.H.; Kim, C.S.; Lee, W.S.; Kim, Y.H. Estimation of high-resolution gridded precipitation using GIS and PRISM. Atmosphere 2008, 18, 71–81. [Google Scholar]
- Daly, C.; Neilson, R.P.; Phillips, D.L. A statistical-topographic model for mapping climatological precipitation over mountainous terrain. J. Appl. Meteorol. Climatol. 1994, 33, 140–158. [Google Scholar] [CrossRef]
- Daly, C.; Halbleib, M.; Smith, J.I.; Gibson, W.P.; Doggett, M.K.; Taylor, G.H.; Pasteris, P.P. Physiographically sensitive mapping of climatological temperature and precipitation across the conterminous United States. Int. J. Climatol. 2008, 28, 2031–2064. [Google Scholar] [CrossRef]
- Choi, E.B.; Park, J.H.; Sano, M.; Nakatsuka, T.; Seo, J.W. Summer climate information recorded in tree-ring oxygen isotope chronologies from seven locations in the Republic of Korea. Front. For. Glob. Change 2024, 7, 1269346. [Google Scholar] [CrossRef]
- Bae, T.S.; Lee, J.; Kwon, J.H.; Hong, C.K. Update of the precision geoid determination in Korea. Geophys. Prospect. 2012, 60, 555–571. [Google Scholar] [CrossRef]
- Kil, Y.; Ahn, K.S.; Woo, K.S.; Lee, K.C.; Jwa, Y.J.; Jung, W.; Sohn, Y.K. Geoheritage values of the Quaternary Hantangang river volcanic field in the central Korean Peninsula. Geoheritage 2019, 11, 765–782. [Google Scholar] [CrossRef]
- Lee, S.; Kim, K.S.; Lee, K.H.; Jang, H.I.; You, B.O. Public expressway debris flow characteristics. In Proceedings of the 9th Korea-Japan Joint Symposium on Slope Stability, Seoul, Republic of Korea, 16–17 October 2016; pp. 95–102. [Google Scholar]
- Jeong, S.; Ko, J.; Kim, J. The effectiveness of a wireless sensor network system for landslide monitoring. IEEE Access 2019, 8, 8073–8086. [Google Scholar] [CrossRef]
- Hamza, V.; Stopar, B.; Sterle, O.; Pavlovčič-Prešeren, P. A cost-effective GNSS solution for continuous monitoring of landslides. Remote Sens. 2023, 15, 2287. [Google Scholar] [CrossRef]
- Velha, P.; Nannipieri, T.; Signorini, A.; Morosi, M.; Solazzi, M.; Barone, F.; Frisoli, A.; Ricciardi, L.; Eusepi, R.; Icardi, M.; et al. Monitoring large railways infrastructures using hybrid optical fibers sensor systems. IEEE Trans. Intell. Transp. Syst. 2019, 21, 5177–5188. [Google Scholar] [CrossRef]


Disclaimer/Publisher’s Note: The statements, opinions and data contained in all publications are solely those of the individual author(s) and contributor(s) and not of MDPI and/or the editor(s). MDPI and/or the editor(s) disclaim responsibility for any injury to people or property resulting from any ideas, methods, instructions or products referred to in the content. |
© 2025 by the authors. Licensee MDPI, Basel, Switzerland. This article is an open access article distributed under the terms and conditions of the Creative Commons Attribution (CC BY) license (https://creativecommons.org/licenses/by/4.0/).